Embed Size (px)
Citation preview
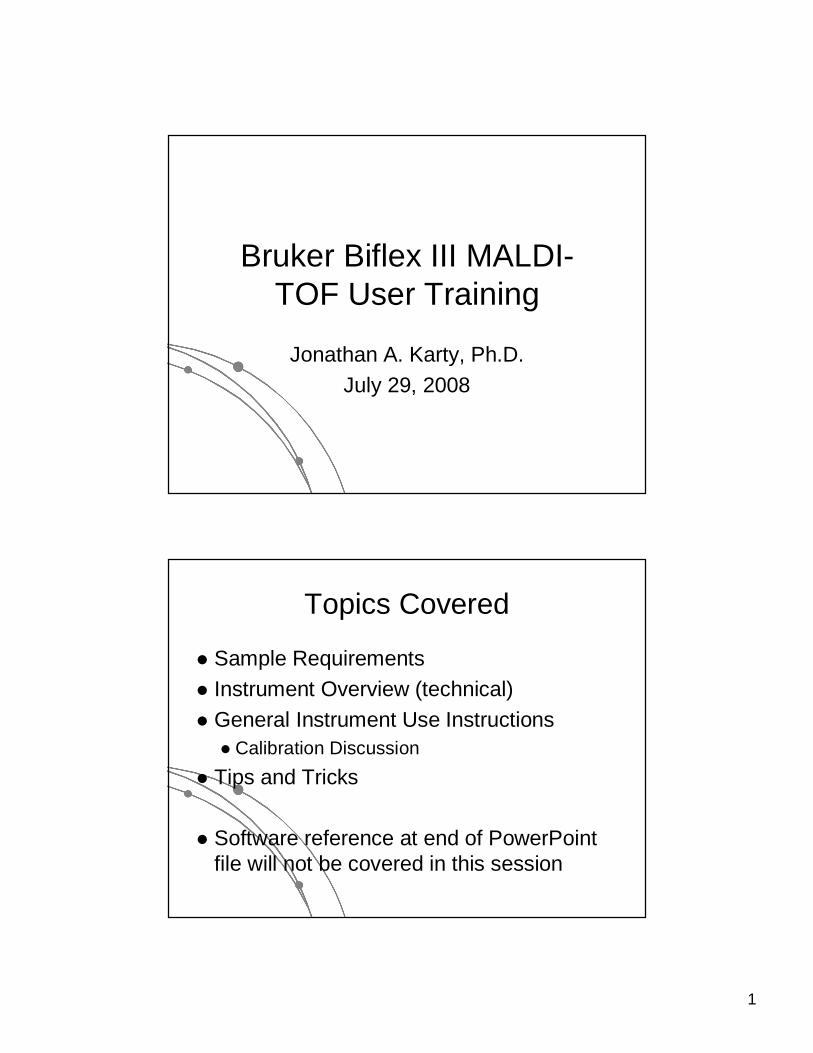
1
Bruker Biflex III MALDI-TOF User Training
Jonathan A. Karty, Ph.D.July 29, 2008
Topics Covered
� Sample Requirements� Instrument Overview (technical)� General Instrument Use Instructions
� Calibration Discussion
� Tips and Tricks
� Software reference at end of PowerPoint file will not be covered in this session
2
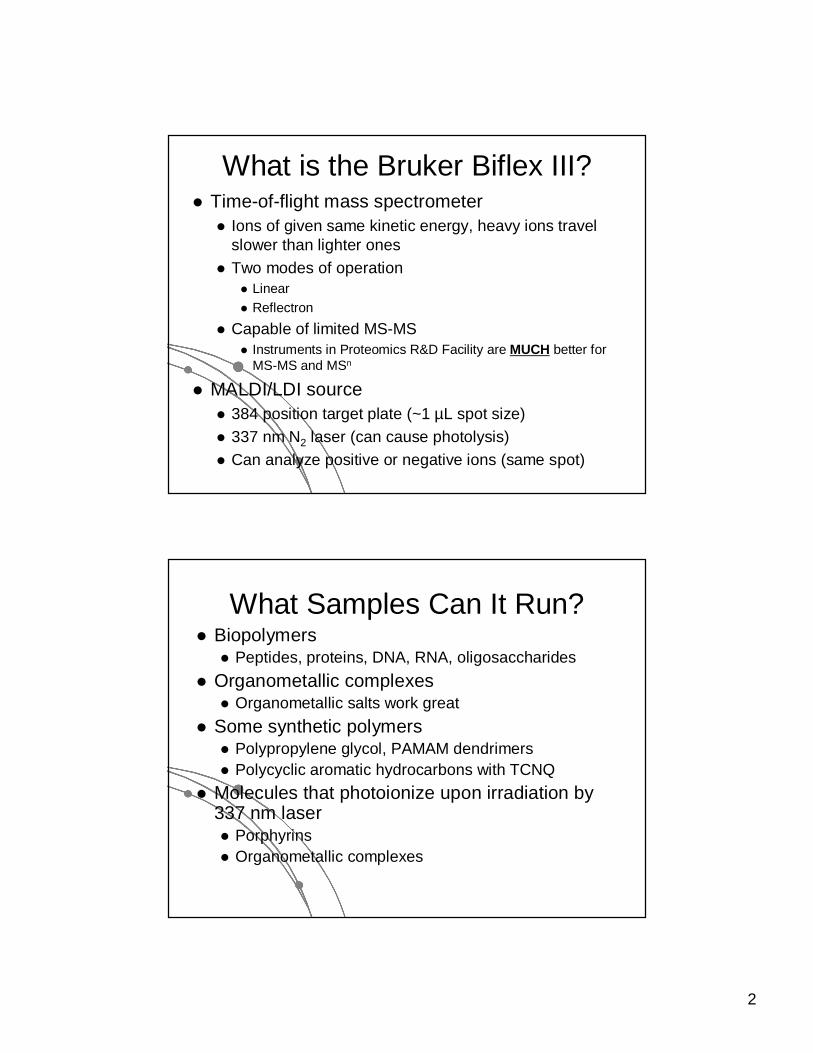
What is the Bruker Biflex III?� Time-of-flight mass spectrometer
� Ions of given same kinetic energy, heavy ions travel slower than lighter ones
� Two modes of operation� Linear� Reflectron
� Capable of limited MS-MS� Instruments in Proteomics R&D Facility are MUCH better for
MS-MS and MSn
� MALDI/LDI source� 384 position target plate (~1 µL spot size)� 337 nm N2 laser (can cause photolysis)� Can analyze positive or negative ions (same spot)
What Samples Can It Run?� Biopolymers
� Peptides, proteins, DNA, RNA, oligosaccharides
� Organometallic complexes� Organometallic salts work great
� Some synthetic polymers� Polypropylene glycol, PAMAM dendrimers� Polycyclic aromatic hydrocarbons with TCNQ
� Molecules that photoionize upon irradiation by 337 nm laser� Porphyrins� Organometallic complexes
3
What Samples Can’t It Run?
� “Dirty” samples� Significant concentration of involatiles
� Glycerol, urea, most buffers, many detergents
� Alkali metal salts can be quite problematic� RNA/DNA analyses require extensive desalting
� Molecules with significant vapor pressures� Instrument is held at ~10-7 torr
� Molecules that do not ionize in source� Lack charge acceptor/donor site
� Cannot photoionize with N2 laser
General Sample Guidelines� Purify analyte if possible
� Analyte should be 5 – 100 µM in concentration� ZipTips can help purify dirty samples (C4 and C18
available in MSF)
� Use only volatile solvents/buffers� MeOH, H2O, acetone, CH3CN, THF, CH2Cl2, C6H6
� TFA, HOAc, formic acid, NH3, etc.� Ionic strength < 20 mM (e.g. 0.1% v/v HOAc)
� Acidic conditions required for proper crystallization of many matrices� Lack of acidic conditions can be overcome in some
cases
� Need at least 2 µL
4
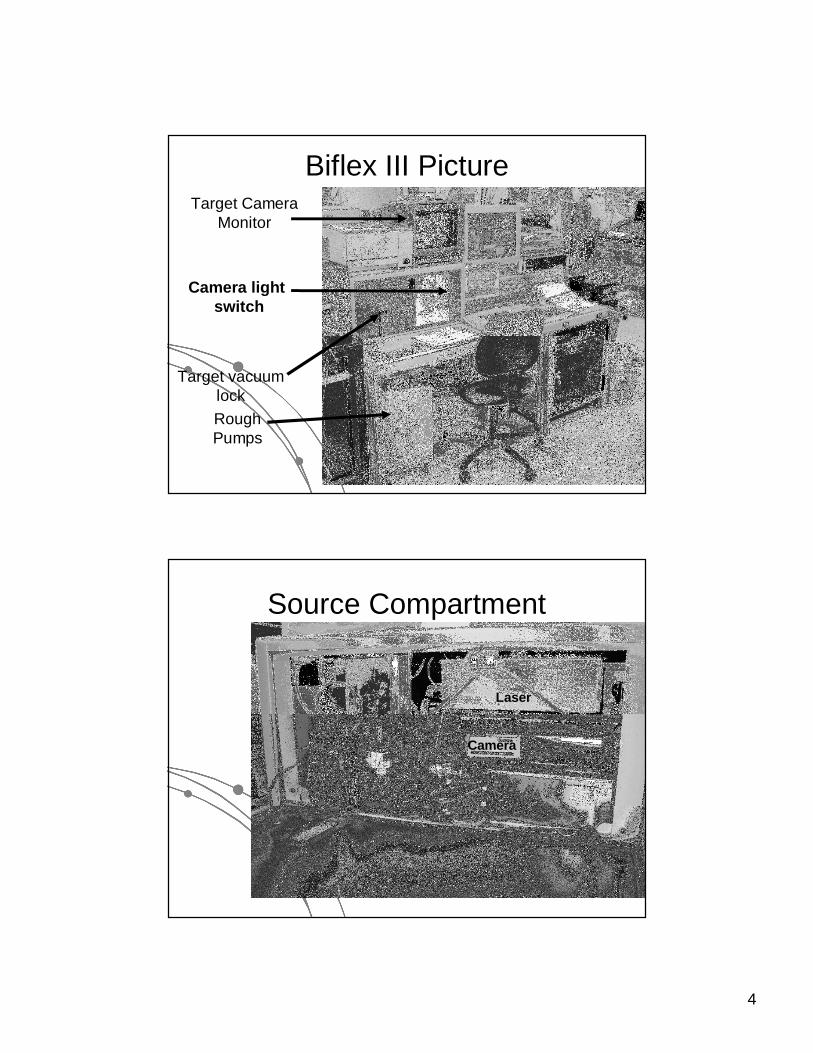
Biflex III Picture
Target vacuum lock
Rough Pumps
Target Camera Monitor
Camera light switch
Source Compartment
Camera
Laser
5
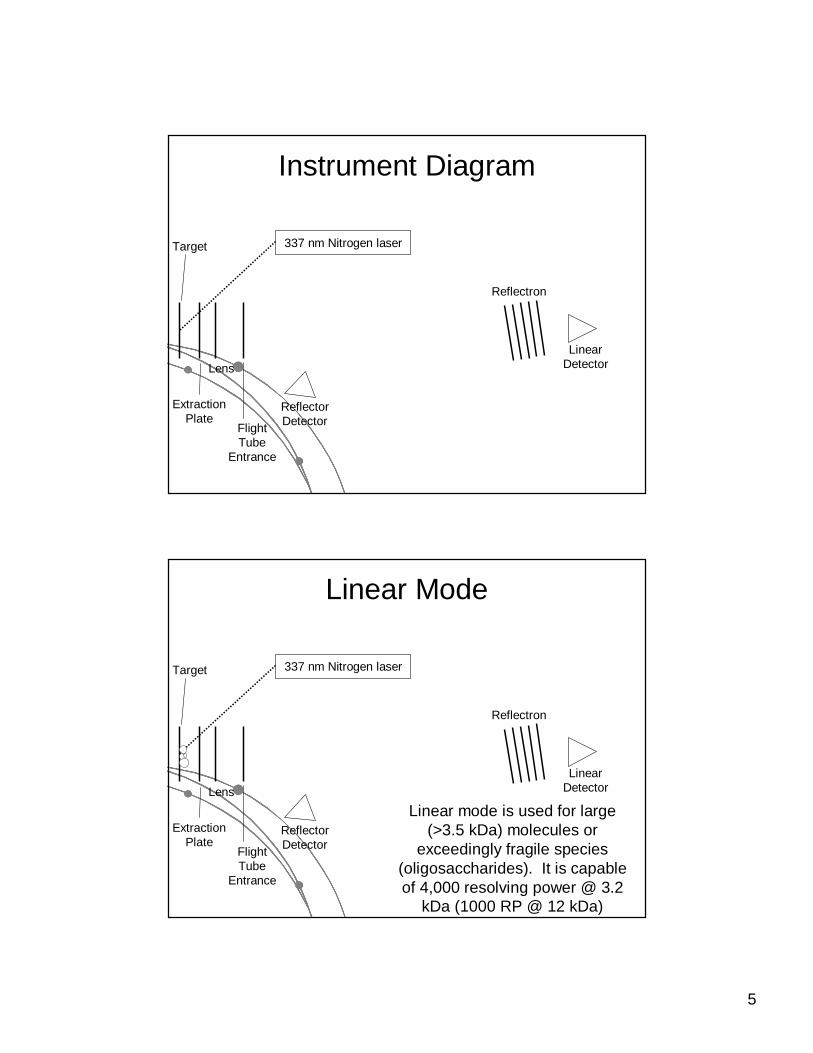
Instrument Diagram
ReflectorDetector
LinearDetectorLens
Target
ExtractionPlate
FlightTube
Entrance
Reflectron
337 nm Nitrogen laser
Linear Mode
ReflectorDetector
LinearDetectorLens
Target
ExtractionPlate
FlightTube
Entrance
Reflectron
337 nm Nitrogen laser
Linear mode is used for large (>3.5 kDa) molecules or
exceedingly fragile species (oligosaccharides). It is capable of 4,000 resolving power @ 3.2
kDa (1000 RP @ 12 kDa)
6
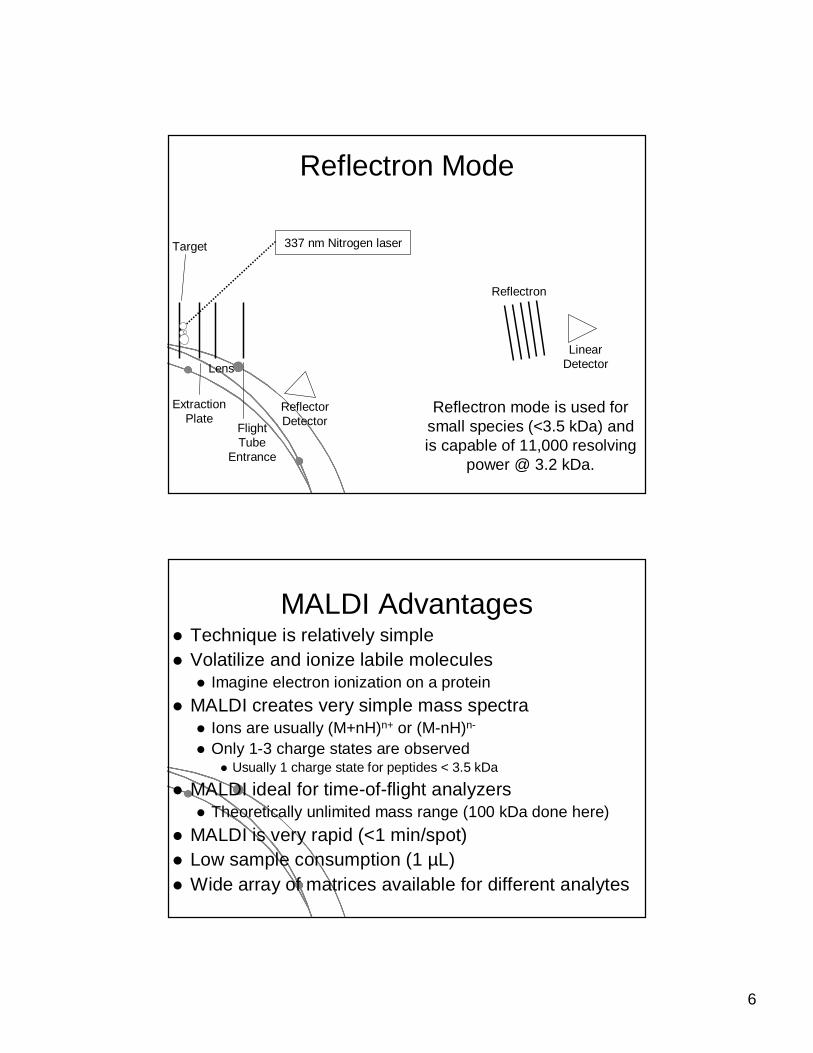
Reflectron Mode
ReflectorDetector
LinearDetectorLens
Target
ExtractionPlate
FlightTube
Entrance
Reflectron
337 nm Nitrogen laser
Reflectron mode is used for small species (<3.5 kDa) and is capable of 11,000 resolving
power @ 3.2 kDa.
MALDI Advantages� Technique is relatively simple� Volatilize and ionize labile molecules
� Imagine electron ionization on a protein
� MALDI creates very simple mass spectra� Ions are usually (M+nH)n+ or (M-nH)n-
� Only 1-3 charge states are observed� Usually 1 charge state for peptides < 3.5 kDa
� MALDI ideal for time-of-flight analyzers� Theoretically unlimited mass range (100 kDa done here)
� MALDI is very rapid (<1 min/spot)� Low sample consumption (1 µL)� Wide array of matrices available for different analytes
7
Some Common MALDI Matrices
CHCH
C
CHCH
C
CH
CC
C N
O
OH
OH
CCH
C
CHCH
C
CH
CH
C O
OH
OH
OCH3C
CH
C
CHC
C
CH
CH
C O
OH
OH
OCH3
O
CH3
C
CHCH
C
CCH
OH
OH C
O
OH
CH
CHCH
C
CN
OH
C
O
OH C NC
C C NN
N
a-cyano-4-hydroxycinnamic acid = CCAMolecular Formula =C10H7NO3 ferulic acid = FA
Molecular Formula =C10H10O4
sinapinic acid = SAMolecular Formula =C11H12O5
2,5 dihydroxybenozoic acid = DHBMolecular Formula =C7H6O4
3-hydroxypicolinic acid = HPAMolecular Formula =C6H5NO3
tetracyanoquinodimethane = TCNQMolecular Formula =C12H4N4
CCA Matrix
� Good matrix for compounds <10 kDa� Makes relatively homogenous flat spots
� Mix 10 g/L in 45% CH3CN, 5% (CH3)2CO, 0.1% TFA in H2O (instructions on balance)
� Combine 1 part analyte with 5 parts matrix� Ratio can be adjusted depending on sample
� Deposit 1 µL on target and let air dry
8
FA and SA Matrices� Matrices for compounds >10 kDA
� Spots are not homogenous or flat� Crystallization often must be assisted (tap spot)
� Waters premix SA (directions on balance) � spots are made by mixing 5:1 matrix:analyte� Deposit 1 µL on target (no tapping required)
� Mix 0.15 M matrix in EtOH (alternate method)� 32.4 g/L for FA, 33.6 g/L for SA� Mix 7 parts analyte + 3 parts matrix; put 1 µL onto target� Wait 30 sec� Tap spot with pipette tip until tiny crystals form� Stir crystals around so entire spot is covered with crystals
� SA and FA spots require more laser power than CCA
HPA Matrix
� Used for oligonucleotides� 7 mg HPA in 50 µL SCX:NH4+ resin
suspension + 50 µL acetonitrile� SCX resin desalts matrix and sample
� Deposit 1 µL resin suspension onto target� Let resin dry
� Add 1 µL each of analyte and matrix solution to dried resin spot
� Dry sample using heat gun
9
DHB Matrix for Saccharides
� Mix up saturated DHB in ethanol� Mix 1:1 or 1:4 matrix:analyte� Deposit 1 uL of mixture onto target� Tap spot for good crystallization (see
FA/SA page)� DHB spots require much more light
than CCA
TCNQ matrix for PAHs
� Sample prepared without solvent
� Combine 50-500 parts TCNQ to 1 part sample
� Place mixture and 3 steel BBs into a PCR tube
� Cap tube and tape to vortexer
� Vortex for at least 5 minutes
� Apply small bit of powder to target with the back of a wood Q-tip
� TCNQ requires more light than CCA� Ions made by charge exchange, not protonation (M+.)
10
MALDI Laser� Shoe-box sized nitrogen laser (337 nm)� Intensity is modulated by a neutral density filter
wheel (attenuator)� User controls the attenuation
� Larger attenuation, less light
� Suggested attenuation values� CCA matrix 92-97 (new laser 11/07)� FA/SA 75-80� DHB/HPA 65-70� TCNQ 80-85� LDI (depends on analyte)� These values decrease as laser ages
Ion Detection System� Dual microchannel plate detectors
� Lin is the linear mode detector voltage
� Ref is the reflectron mode detector voltage
� Only 1 detector is used at a time
� Currently, 1.75 kV or so on each detector
� If sensitivity is poor, try increasing the detector voltage by 0.05 or 0.1 kV� Noise will increase with voltage
� Do not exceed 2 kV on either detector
11
Air Sensitive Work
� Target lock can be flooded with Ar or N2
� A glove bag can be affixed to the target lock
� This is only done by MSF personnel during normal business hours
� Please give us 1-2 days notice
Changing Ion Polarity� If a molecule has no basic sites, but does
contain acidic sites, negative ion MALDI may be used� insulin A chain or sulfated peptides
� Positive and negative ions exhibit similar behavior in MALDI-TOF
� Same MALDI spot can make either positive or negative ions
� Negative ion analyses require changing the polarity of all ion optics elements in the system
12
Changing Ion Polarity 2
� A few negative ion parameter files exist� Turn off the high voltage and wait 1 – 3
minutes (safety) � Load a negative ion parameter file� Remember all ions will be M-H, not M+H
� Calibrants will be 2.015 amu lighter
� Use IsoPro or other software to calculate negative ion masses
Mass Axis Calibration� TOF α (m/z)½ is not practical� m/z = A*(TOF2) + B*(TOF) + C� Constants are determined by recording mass
spectrum of known compounds� A variety of calibration mixtures are available
� Instrument can be externally calibrated for quick experiments
� Internal calibration for better mass accuracy can be tricky to perform
13
Calibration Part 2� The Biflex III is prone to calibration drift
� Up to 0.4 amu between successive spectra in reflectron mode
� Up to 5 amu between successive spectra in linear mode
� Instrument should be started at the beginning of each set of experiments (external calibration)
� Calibrant masses need to as precisely defined as possible (3-4 decimal places preferred)
� Calibration can be performed in XAcq and XMASS
Calibration Mixtures� 4700 mix
� Peptide mixture with masses from 379-3659
� Mix F� Protein mixture with masses from 2466-8566
� Dextran D10� Oligosaccharide mixture with masses from 600-2500
� Trypsinogen/Myoglobin� Protein mixture with masses from 8,476 to 23,981
� Other compounds and mixtures are available, just ask Jon and Angie
14
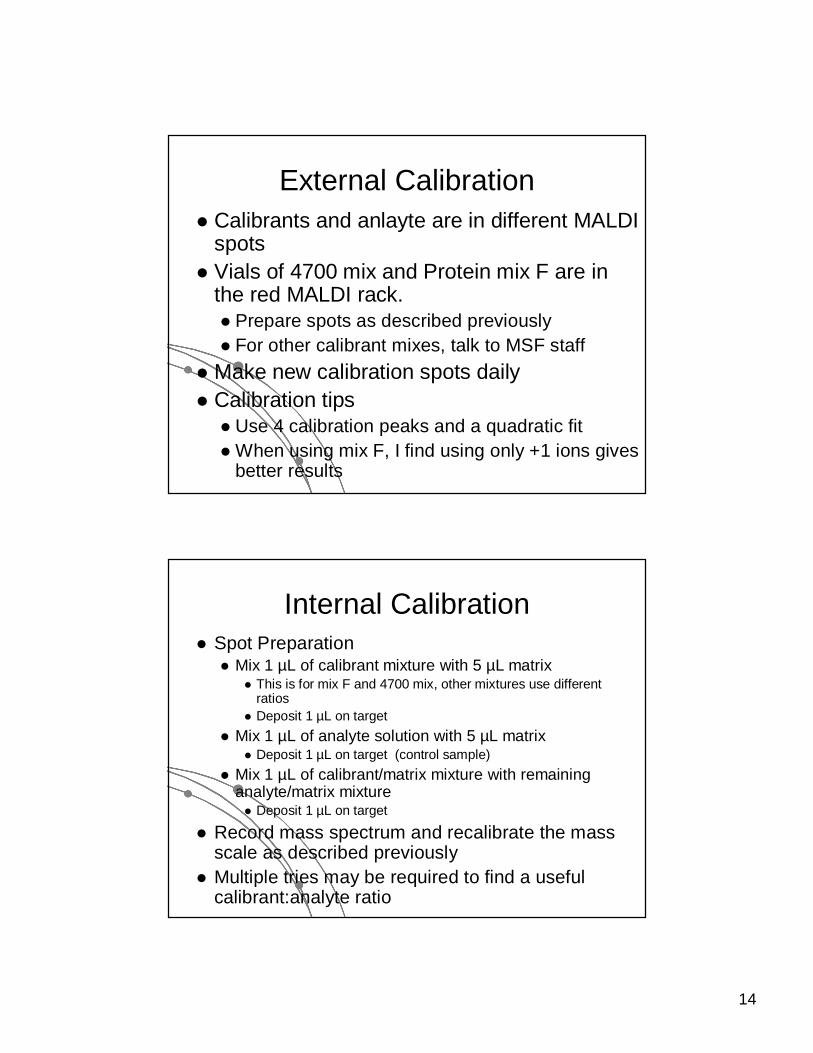
External Calibration� Calibrants and anlayte are in different MALDI
spots� Vials of 4700 mix and Protein mix F are in
the red MALDI rack.� Prepare spots as described previously� For other calibrant mixes, talk to MSF staff
� Make new calibration spots daily� Calibration tips
� Use 4 calibration peaks and a quadratic fit� When using mix F, I find using only +1 ions gives
better results
Internal Calibration� Spot Preparation
� Mix 1 µL of calibrant mixture with 5 µL matrix� This is for mix F and 4700 mix, other mixtures use different
ratios� Deposit 1 µL on target
� Mix 1 µL of analyte solution with 5 µL matrix� Deposit 1 µL on target (control sample)
� Mix 1 µL of calibrant/matrix mixture with remaining analyte/matrix mixture� Deposit 1 µL on target
� Record mass spectrum and recalibrate the mass scale as described previously
� Multiple tries may be required to find a useful calibrant:analyte ratio
15
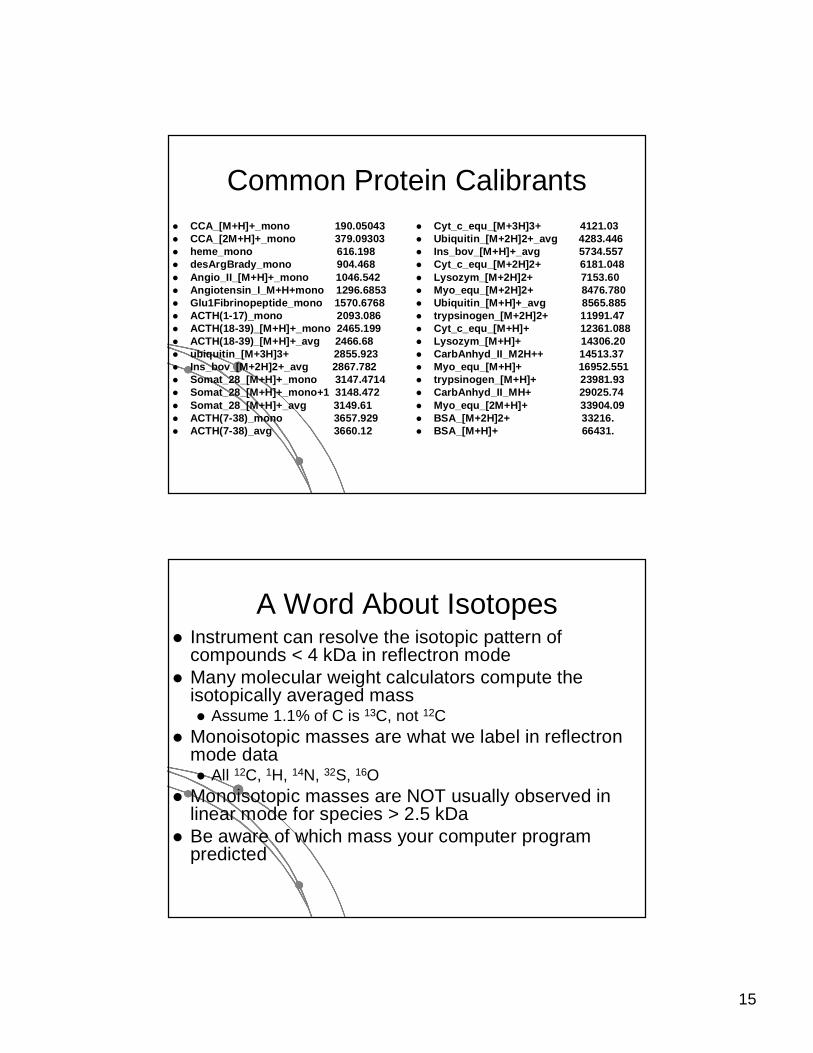
Common Protein Calibrants� CCA_[M+H]+_mono 190.05043� CCA_[2M+H]+_mono 379.09303� heme_mono 616.198� desArgBrady_mono 904.468� Angio_II_[M+H]+_mono 1046.542� Angiotensin_I_M+H+mono 1296.6853� Glu1Fibrinopeptide_mono 1570.6768� ACTH(1-17)_mono 2093.086� ACTH(18-39)_[M+H]+_mono 2465.199� ACTH(18-39)_[M+H]+_avg 2466.68� ubiquitin_[M+3H]3+ 2855.923� Ins_bov_[M+2H]2+_avg 2867.782� Somat_28_[M+H]+_mono 3147.4714� Somat_28_[M+H]+_mono+1 3148.472� Somat_28_[M+H]+_avg 3149.61� ACTH(7-38)_mono 3657.929� ACTH(7-38)_avg 3660.12
� Cyt_c_equ_[M+3H]3+ 4121.03� Ubiquitin_[M+2H]2+_avg 4283.446� Ins_bov_[M+H]+_avg 5734.557� Cyt_c_equ_[M+2H]2+ 6181.048� Lysozym_[M+2H]2+ 7153.60� Myo_equ_[M+2H]2+ 8476.780� Ubiquitin_[M+H]+_avg 8565.885� trypsinogen_[M+2H]2+ 11991.47� Cyt_c_equ_[M+H]+ 12361.088� Lysozym_[M+H]+ 14306.20� CarbAnhyd_II_M2H++ 14513.37� Myo_equ_[M+H]+ 16952.551� trypsinogen_[M+H]+ 23981.93� CarbAnhyd_II_MH+ 29025.74� Myo_equ_[2M+H]+ 33904.09� BSA_[M+2H]2+ 33216.� BSA_[M+H]+ 66431.
A Word About Isotopes� Instrument can resolve the isotopic pattern of
compounds < 4 kDa in reflectron mode� Many molecular weight calculators compute the
isotopically averaged mass� Assume 1.1% of C is 13C, not 12C
� Monoisotopic masses are what we label in reflectron mode data� All 12C, 1H, 14N, 32S, 16O
� Monoisotopic masses are NOT usually observed in linear mode for species > 2.5 kDa
� Be aware of which mass your computer program predicted
16
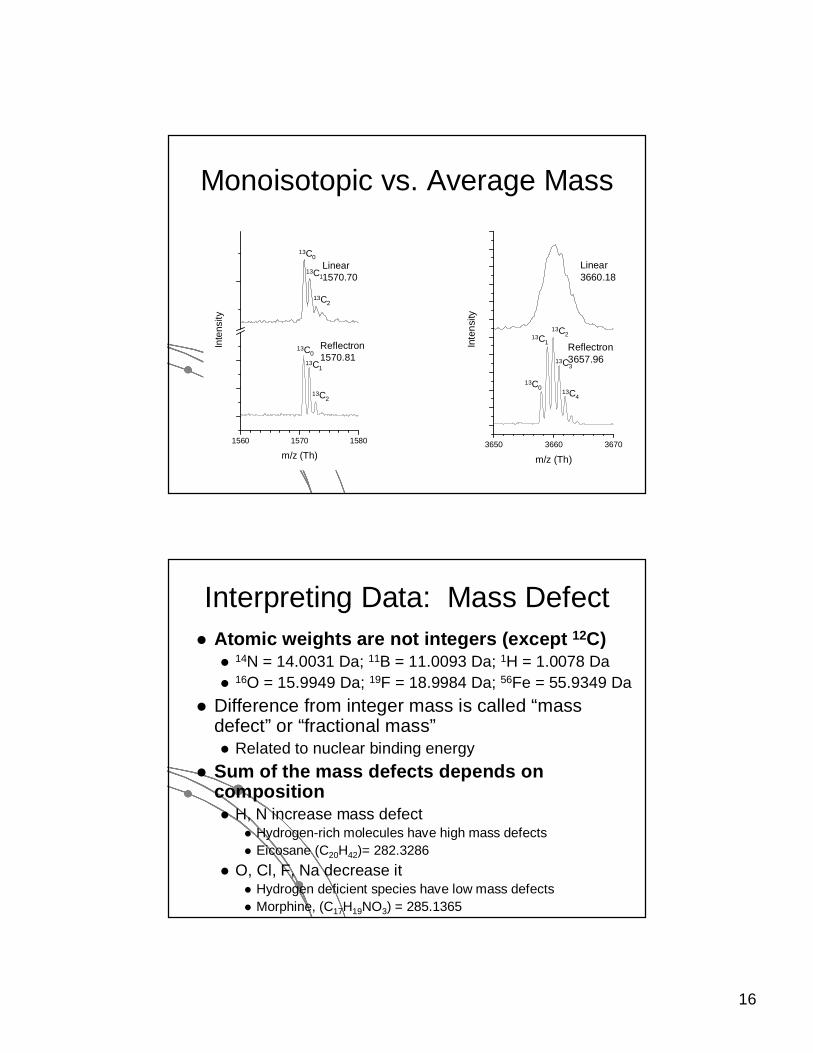
Monoisotopic vs. Average Mass
3650 3660 3670
Inte
nsi
tym/z (Th)
Linear3660.18
Reflectron3657.96
1560 1570 1580
Inte
nsity
m/z (Th)
Linear1570.70
Reflectron1570.81
13C0
13C1
13C2
13C3
13C4
13C0
13C1
13C2
13C0
13C1
13C2
Interpreting Data: Mass Defect� Atomic weights are not integers (except 12C)
�14N = 14.0031 Da; 11B = 11.0093 Da; 1H = 1.0078 Da
�16O = 15.9949 Da; 19F = 18.9984 Da; 56Fe = 55.9349 Da
� Difference from integer mass is called “mass defect” or “fractional mass”� Related to nuclear binding energy
� Sum of the mass defects depends on composition� H, N increase mass defect
� Hydrogen-rich molecules have high mass defects � Eicosane (C20H42)= 282.3286
� O, Cl, F, Na decrease it� Hydrogen deficient species have low mass defects� Morphine, (C17H19NO3) = 285.1365
17
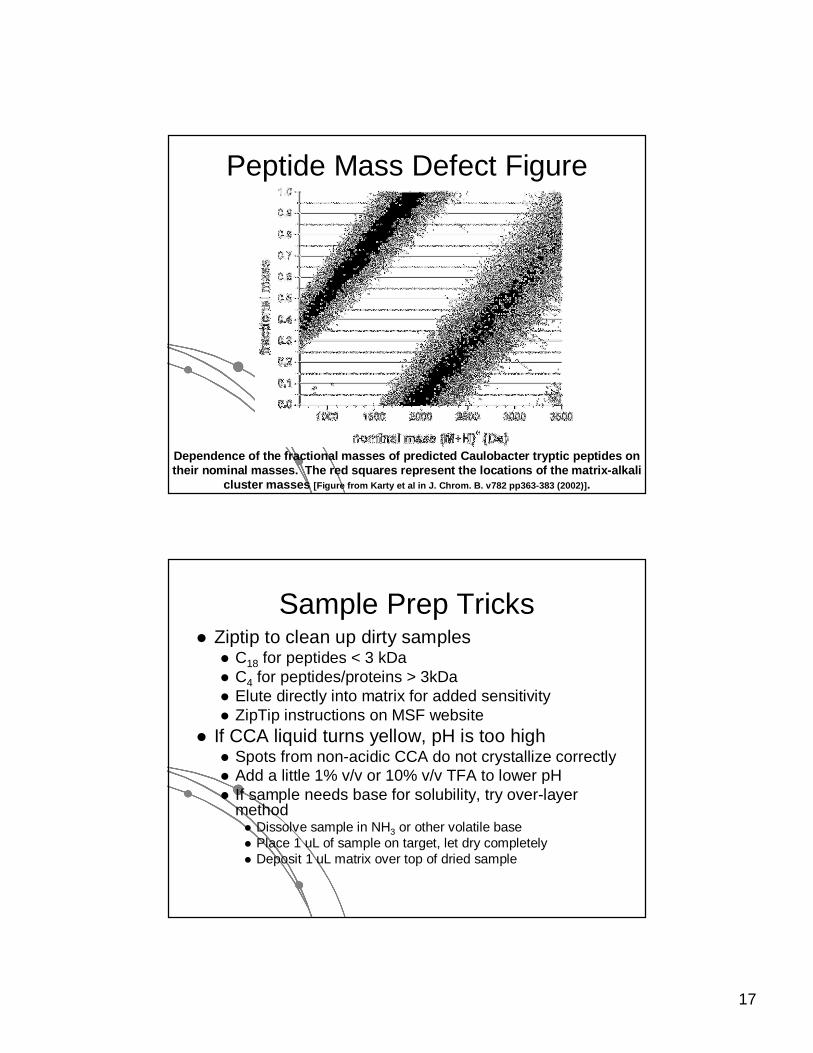
Peptide Mass Defect Figure
Dependence of the fractional masses of predicted Caulobacter tryptic peptides on their nominal masses. The red squares represent the locations of the matrix-alkali
cluster masses [Figure from Karty et al in J. Chrom. B. v782 pp363-383 (2002)].
Sample Prep Tricks� Ziptip to clean up dirty samples
� C18 for peptides < 3 kDa� C4 for peptides/proteins > 3kDa� Elute directly into matrix for added sensitivity� ZipTip instructions on MSF website
� If CCA liquid turns yellow, pH is too high� Spots from non-acidic CCA do not crystallize correctly� Add a little 1% v/v or 10% v/v TFA to lower pH� If sample needs base for solubility, try over-layer
method� Dissolve sample in NH3 or other volatile base� Place 1 uL of sample on target, let dry completely� Deposit 1 uL matrix over top of dried sample
18
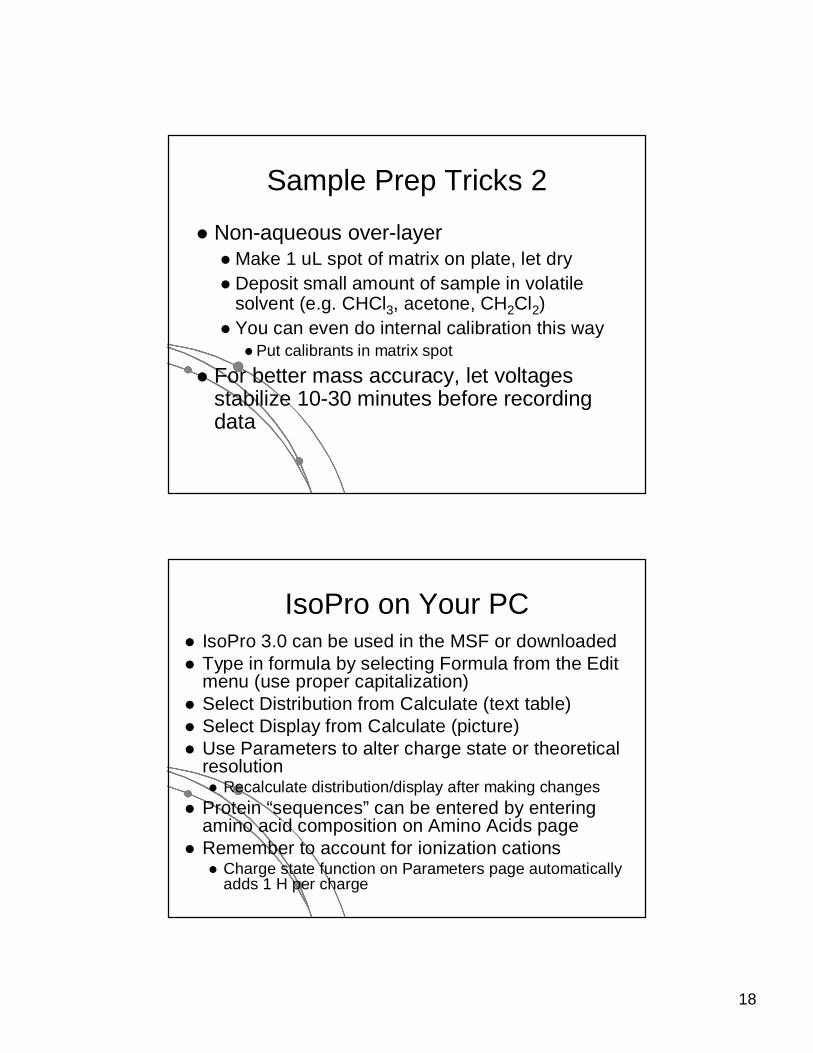
Sample Prep Tricks 2
� Non-aqueous over-layer� Make 1 uL spot of matrix on plate, let dry� Deposit small amount of sample in volatile
solvent (e.g. CHCl3, acetone, CH2Cl2)� You can even do internal calibration this way
� Put calibrants in matrix spot
� For better mass accuracy, let voltages stabilize 10-30 minutes before recording data
IsoPro on Your PC� IsoPro 3.0 can be used in the MSF or downloaded� Type in formula by selecting Formula from the Edit
menu (use proper capitalization)� Select Distribution from Calculate (text table)� Select Display from Calculate (picture)� Use Parameters to alter charge state or theoretical
resolution� Recalculate distribution/display after making changes
� Protein “sequences” can be entered by entering amino acid composition on Amino Acids page
� Remember to account for ionization cations� Charge state function on Parameters page automatically
adds 1 H per charge
19
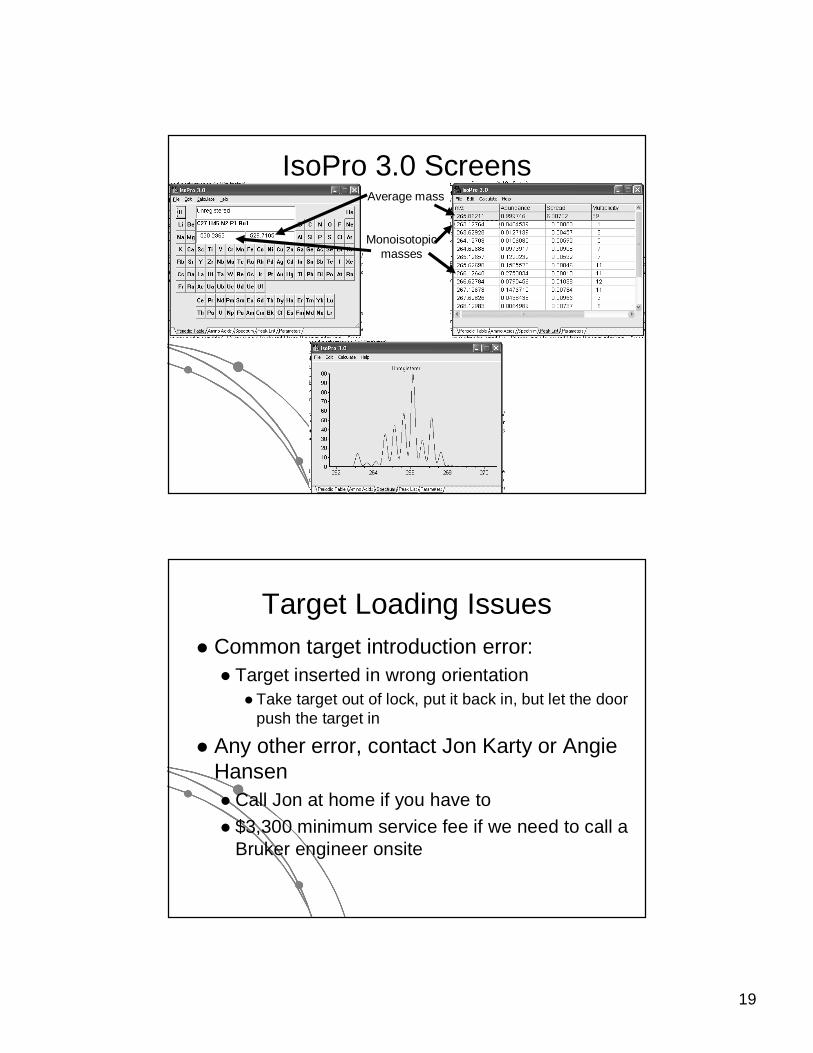
IsoPro 3.0 ScreensAverage mass
Monoisotopicmasses
Target Loading Issues� Common target introduction error:
� Target inserted in wrong orientation� Take target out of lock, put it back in, but let the door
push the target in
� Any other error, contact Jon Karty or Angie Hansen� Call Jon at home if you have to
� $3,300 minimum service fee if we need to call a Bruker engineer onsite
20
Biflex III Software Package� XAcq 4.0: acquisition of data files
� All instrument functions are controlled by XAcq� Calibration and smoothing can be performed here
� XMass 5.1: process saved data� Smooth and recalibrate raw data� Label peaks and print data� Compare different spectra in the same window
� Both programs run on UNIX workstation� ASCII formatted data can be exported and
retrieved by SFTP
Hands-on Training
� Groups of no more than three� One hour or so to complete� No charge for first session� After training, students must demonstrate
competency by running their own samples prior to being granted after-hours access