Embed Size (px)
Citation preview
- 1 -
ABSTRACT. The aim of this thesis is to assess the ultimate resistance of steel semi-elliptical hollow sections (SEHS) subjected to pure compression. The tube sections available in the market have a common characteristic, i.e., they all have walls with similar shapes: (i) the RHS sections (“rectangular HS”) and SHS (“square HS”) all have flat walls and (ii) the CHS sections (“circular HS”) and EHS (“elliptical HS”) all have curved walls. For the first time, the SEHS section simultaneously presents a flat and a curved wall. The aim of this work is to ascertain the stability of flat and curved elements, both elastic and pre-buckling and in elastic-plastic and post-buckling. Different columns with SEHS section currently available on the market are used and numerical analysis is carried out using the Finite Strip Method (FFM) and the finite element method (FEM). In the first case (FFM), software CUFSM is used and buckling curves, critical buckling modes and respective critical loads are obtained for the various SEHS sections. In the second case (FEM), the finite element package ABAQUS is used, nonlinear buckling analysis is carried out on columns of different lengths and cross sections, and they are assessed for their post-buckling behaviour, collapse mechanisms and the different parameters that influence them. Based on the results obtained by numerical methods, the suitability of Eurocode 3 rules is studied. Finally, some preliminary recommendations regarding SEHS column design are described. 1.INTRODUCTION Featuring a semi-elliptical shape SEHS sections
(“Semi-elliptical hollow section” – Figure 1) show
two types of laminar elements with “antagonistic”
characteristics (i.e. plate and elliptical shell), making
it impossible to anticipate its rigorous buckling
behaviour. The “plate” elements are present stable in
the post-buckling range, that is, they support loads
well above their bifurcational critical load and are
further characterized by their reduced sensitivity to
initial geometrical imperfections.
Study of the “shell” type elements, particularly
elliptical shells, has intensified in the last decade
with the emergence in the market of elliptical hollow
section (EHS). Their behaviour is dependent on the
relationship between their major and minor axes
(a/b). When a/b tends to infinity the elliptical shells
exhibit a similar behaviour to “plates.” However, for
a/b near unity, the elliptical shell tends to present a
similar behaviour to circular shells.
Circular shells, are not stable at post-buckling regime
and are characterized by a high sensitivity to
geometrical imperfections.
The SEHS sections are emerging on the market. With
one flat side, making it easy to establish connections
with elements of different cross sections or other
structural materials. In addition to the typical
characteristics of the tubular sections, they have
excellent structural characteristics when they are
simultaneously subject to bending moments about
the major and minor inertia axes, since they have a
similar bending modulus according to the two main
central axes of inertia. When subjected to
compression, like any other tubular column, they
constitute an interesting solution. However, the
technical and scientific community has not devoted
much attention to this new structural form. The lack
Buckling behavior and ultimate strength of semi-elliptical hollow sections under compression
Tiago Pires
Dissertation in Civil Engineering, Master Degree.
Department of Civil Engineering and Architecture, Instituto Superior Técnico, Technical University of Lisbon
- 2 -
of detailed research and design methods of the SEHS
sections has led to structural engineers having to
develop time-consuming finite element models, or
often designing these sections conservatively.
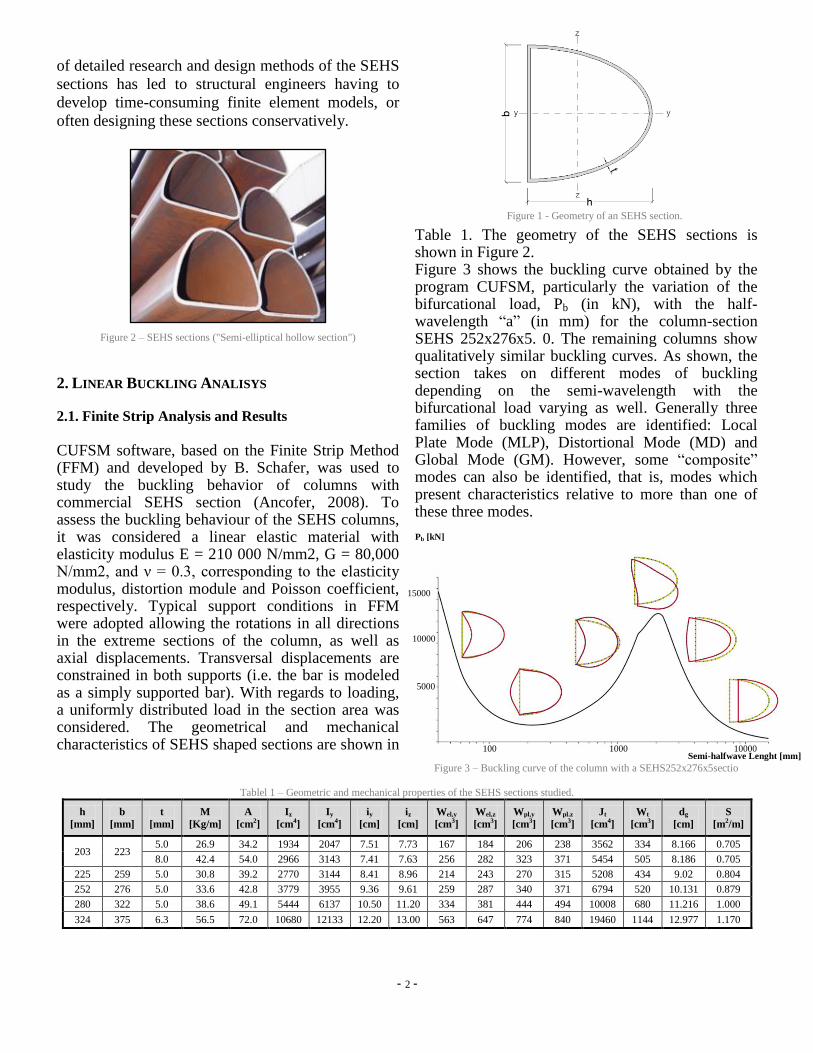
Figure 2 – SEHS sections ("Semi-elliptical hollow section")
2. LINEAR BUCKLING ANALISYS 2.1. Finite Strip Analysis and Results
CUFSM software, based on the Finite Strip Method (FFM) and developed by B. Schafer, was used to study the buckling behavior of columns with commercial SEHS section (Ancofer, 2008). To assess the buckling behaviour of the SEHS columns, it was considered a linear elastic material with elasticity modulus E = 210 000 N/mm2, G = 80,000 N/mm2, and ν = 0.3, corresponding to the elasticity modulus, distortion module and Poisson coefficient, respectively. Typical support conditions in FFM were adopted allowing the rotations in all directions in the extreme sections of the column, as well as axial displacements. Transversal displacements are constrained in both supports (i.e. the bar is modeled as a simply supported bar). With regards to loading, a uniformly distributed load in the section area was considered. The geometrical and mechanical characteristics of SEHS shaped sections are shown in
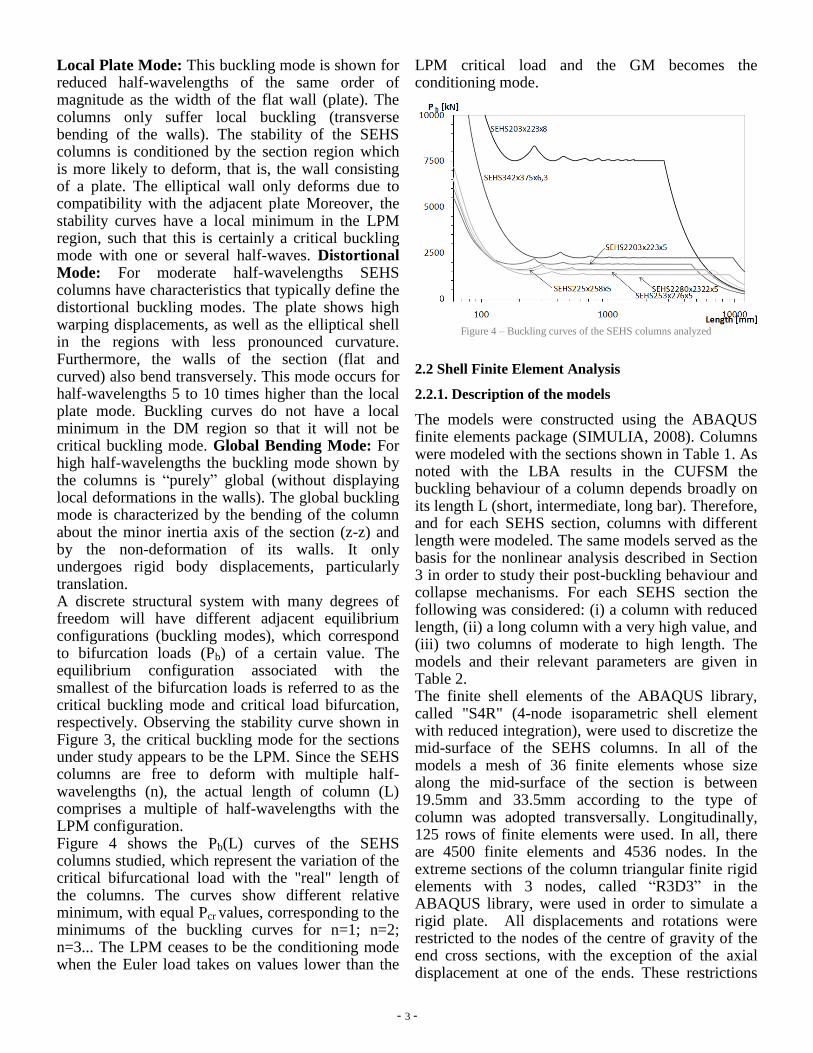
Table 1. The geometry of the SEHS sections is shown in Figure 2. Figure 3 shows the buckling curve obtained by the program CUFSM, particularly the variation of the bifurcational load, Pb (in kN), with the half-wavelength “a” (in mm) for the column-section SEHS 252x276x5. 0. The remaining columns show qualitatively similar buckling curves. As shown, the section takes on different modes of buckling depending on the semi-wavelength with the bifurcational load varying as well. Generally three families of buckling modes are identified: Local Plate Mode (MLP), Distortional Mode (MD) and Global Mode (GM). However, some “composite” modes can also be identified, that is, modes which present characteristics relative to more than one of these three modes.
Figure 3 – Buckling curve of the column with a SEHS252x276x5sectio
Tablel 1 – Geometric and mechanical properties of the SEHS sections studied.
h
[mm]
b
[mm]
t
[mm]
M
[Kg/m]
A
[cm2]
Iz
[cm4]
Iy
[cm4]
iy
[cm]
iz
[cm]
Wel,y
[cm3]
Wel,z
[cm3]
Wpl,y
[cm3]
Wpl.z
[cm3]
Jt
[cm4]
Wt
[cm3]
dg
[cm]
S
[m2/m]
203 223 5.0 26.9 34.2 1934 2047 7.51 7.73 167 184 206 238 3562 334 8.166 0.705
8.0 42.4 54.0 2966 3143 7.41 7.63 256 282 323 371 5454 505 8.186 0.705
225 259 5.0 30.8 39.2 2770 3144 8.41 8.96 214 243 270 315 5208 434 9.02 0.804
252 276 5.0 33.6 42.8 3779 3955 9.36 9.61 259 287 340 371 6794 520 10.131 0.879
280 322 5.0 38.6 49.1 5444 6137 10.50 11.20 334 381 444 494 10008 680 11.216 1.000
324 375 6.3 56.5 72.0 10680 12133 12.20 13.00 563 647 774 840 19460 1144 12.977 1.170
Semi-halfwave Lenght [mm] 100 1000 10000
5000
10000
15000
Figure 1 - Geometry of an SEHS section.
Pb [kN]
- 3 -
Local Plate Mode: This buckling mode is shown for reduced half-wavelengths of the same order of magnitude as the width of the flat wall (plate). The columns only suffer local buckling (transverse bending of the walls). The stability of the SEHS columns is conditioned by the section region which is more likely to deform, that is, the wall consisting of a plate. The elliptical wall only deforms due to compatibility with the adjacent plate Moreover, the stability curves have a local minimum in the LPM region, such that this is certainly a critical buckling mode with one or several half-waves. Distortional Mode: For moderate half-wavelengths SEHS columns have characteristics that typically define the distortional buckling modes. The plate shows high warping displacements, as well as the elliptical shell in the regions with less pronounced curvature. Furthermore, the walls of the section (flat and curved) also bend transversely. This mode occurs for half-wavelengths 5 to 10 times higher than the local plate mode. Buckling curves do not have a local minimum in the DM region so that it will not be critical buckling mode. Global Bending Mode: For high half-wavelengths the buckling mode shown by the columns is “purely” global (without displaying local deformations in the walls). The global buckling mode is characterized by the bending of the column about the minor inertia axis of the section (z-z) and by the non-deformation of its walls. It only undergoes rigid body displacements, particularly translation. A discrete structural system with many degrees of freedom will have different adjacent equilibrium configurations (buckling modes), which correspond to bifurcation loads (Pb) of a certain value. The equilibrium configuration associated with the smallest of the bifurcation loads is referred to as the critical buckling mode and critical load bifurcation, respectively. Observing the stability curve shown in Figure 3, the critical buckling mode for the sections under study appears to be the LPM. Since the SEHS columns are free to deform with multiple half-wavelengths (n), the actual length of column (L) comprises a multiple of half-wavelengths with the LPM configuration. Figure 4 shows the Pb(L) curves of the SEHS columns studied, which represent the variation of the critical bifurcational load with the "real" length of the columns. The curves show different relative minimum, with equal Pcr values, corresponding to the minimums of the buckling curves for n=1; n=2; n=3... The LPM ceases to be the conditioning mode when the Euler load takes on values lower than the
LPM critical load and the GM becomes the conditioning mode.
Figure 4 – Buckling curves of the SEHS columns analyzed
2.2 Shell Finite Element Analysis
2.2.1. Description of the models
The models were constructed using the ABAQUS finite elements package (SIMULIA, 2008). Columns were modeled with the sections shown in Table 1. As noted with the LBA results in the CUFSM the buckling behaviour of a column depends broadly on its length L (short, intermediate, long bar). Therefore, and for each SEHS section, columns with different length were modeled. The same models served as the basis for the nonlinear analysis described in Section 3 in order to study their post-buckling behaviour and collapse mechanisms. For each SEHS section the following was considered: (i) a column with reduced length, (ii) a long column with a very high value, and (iii) two columns of moderate to high length. The models and their relevant parameters are given in Table 2. The finite shell elements of the ABAQUS library, called "S4R" (4-node isoparametric shell element with reduced integration), were used to discretize the mid-surface of the SEHS columns. In all of the models a mesh of 36 finite elements whose size along the mid-surface of the section is between 19.5mm and 33.5mm according to the type of column was adopted transversally. Longitudinally, 125 rows of finite elements were used. In all, there are 4500 finite elements and 4536 nodes. In the extreme sections of the column triangular finite rigid elements with 3 nodes, called “R3D3” in the ABAQUS library, were used in order to simulate a rigid plate. All displacements and rotations were restricted to the nodes of the centre of gravity of the end cross sections, with the exception of the axial displacement at one of the ends. These restrictions
- 4 -
lead to totally warping restraint and deformation of the support sections in their plane. In order to carry out the Linear Buckling Analysis (LBA) of the different columns, it was considered a linear elastic material with Young's modulus E = 210.000 MPa, Poisson coefficient ν = 0.3. To perform the NLA it was considered an elasto-plastic bi-linear material with a yield stress of 355 and 750MPa. A concentrated load with 1kN of intensity was applied to the centroid node of the axially free end section.
Table 2 - Geometry, geometric imperfection and adopted yield stress.
Type of section L [mm] e0 [mm] fyk [MPa]
203x223x8.0 1500 +1.0 355
2500 +1.0 355 3500 +1.0 355
7000 +1.0 355 7000 +7.0 355
2500 +1.0 750
203x223x5.0 1500 +1.0 355 2500 +1.0 355
5000 +1.0 355 10000 +1.0 355
10000 +10.0 355 2500 +1.0 750
225x259x5.0 1500 +1.0 355 2500 +1.0 355
6000 +1.0 355 12000 +1.0 355
12000 +12.0 355 2500 +1.0 750
252x276x5.0 1500 +1.0 355
2500 +1.0 355 7500 +1.0 355
15000 +1.0 355
15000 +15.0 355 2500 +1.0 750
280x322x5.0 1500 +1.0 355
2500 +1.0 355 10000 +1.0 355
20000 +1.0 355 20000 +20.0 355
2500 +1.0 750
324x375x6.3 1500 +1.0 355
2500 +1.0 355 10000 +1.0 355
20000 +1.0 355 20000 +20.0 355
2500 +1.0 750
The post-buckling trajectory in a perfect structure is not easy to obtain due to the discontinuity in rigidity at the bifurcation point between the fundamental and the post-buckling trajectory. Initial geometric imperfections were introduced into the columns in order to eliminate that discontinuity. Due to the lack of information regarding the initial imperfections of the SEHS section, have been adopted initial imperfections with the shape of the critical buckling mode. The amplitude value of the adopted eccentricity for each model is shown in Table 2.
Two types of analysis are carried out: (i) linear buckling analysis (LBA) and (ii) non-linear analysis (NLA). The LBA has two objectives: (i) to obtain the critical load and critical mode, (ii) based on these, to adopt a geometrically imperfect configuration of the columns to perform the NLA. 2.2.2. Analysis of the SEHS252x276x5 Column
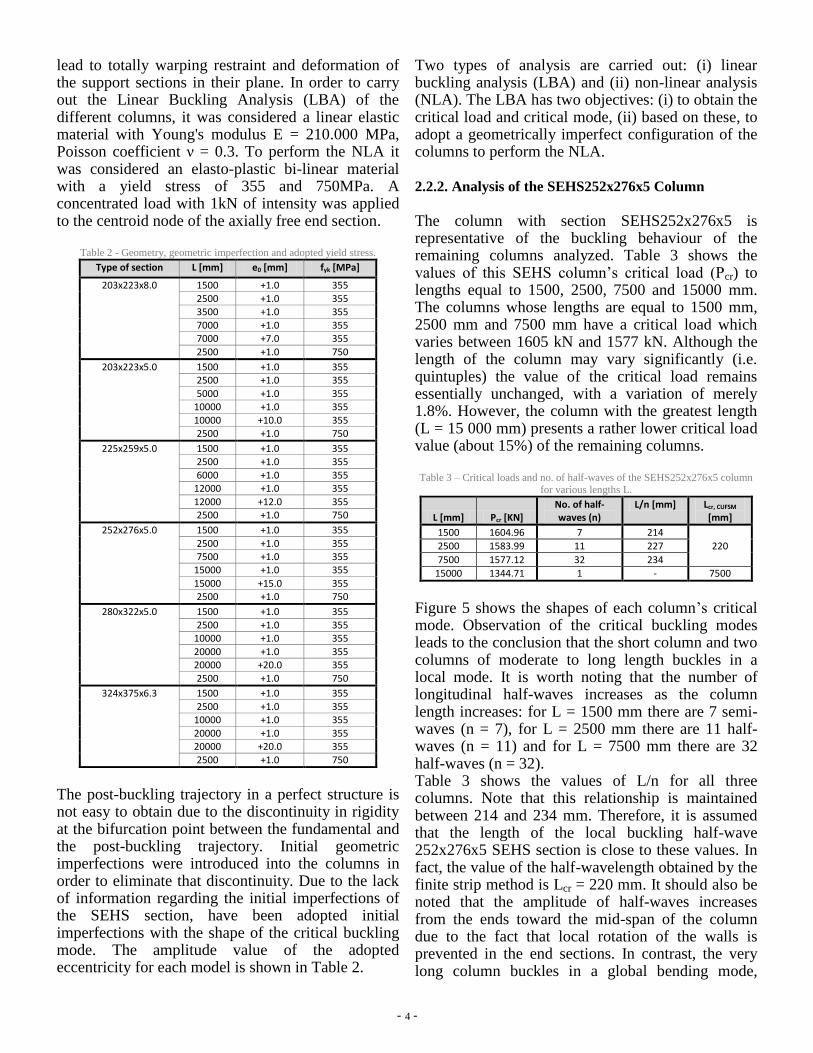
The column with section SEHS252x276x5 is representative of the buckling behaviour of the remaining columns analyzed. Table 3 shows the values of this SEHS column’s critical load (Pcr) to lengths equal to 1500, 2500, 7500 and 15000 mm. The columns whose lengths are equal to 1500 mm, 2500 mm and 7500 mm have a critical load which varies between 1605 kN and 1577 kN. Although the length of the column may vary significantly (i.e. quintuples) the value of the critical load remains essentially unchanged, with a variation of merely 1.8%. However, the column with the greatest length (L = 15 000 mm) presents a rather lower critical load value (about 15%) of the remaining columns.
Table 3 – Critical loads and no. of half-waves of the SEHS252x276x5 column
for various lengths L.
L [mm] Pcr [KN] No. of half-waves (n)
L/n [mm] Lcr, CUFSM [mm]
1500 1604.96 7 214
220 2500 1583.99 11 227
7500 1577.12 32 234
15000 1344.71 1 - 7500
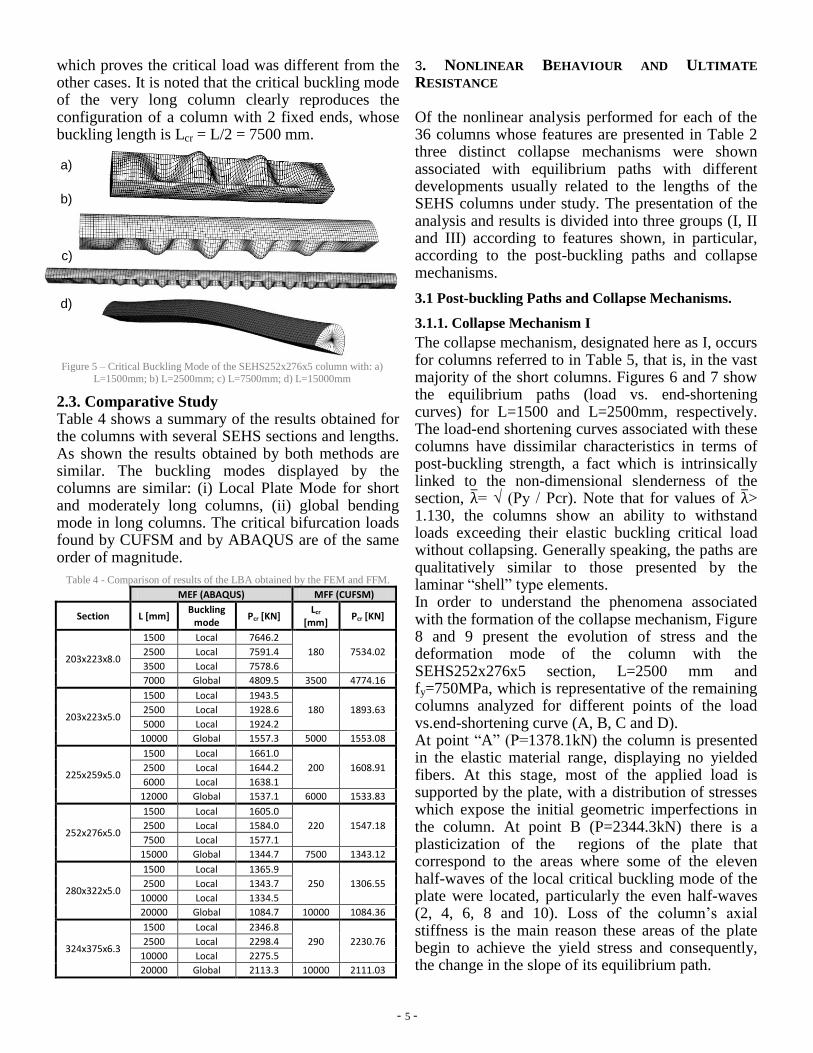
Figure 5 shows the shapes of each column’s critical mode. Observation of the critical buckling modes leads to the conclusion that the short column and two columns of moderate to long length buckles in a local mode. It is worth noting that the number of longitudinal half-waves increases as the column length increases: for L = 1500 mm there are 7 semi-waves (n = 7), for L = 2500 mm there are 11 half-waves (n = 11) and for L = 7500 mm there are 32 half-waves (n = 32). Table 3 shows the values of L/n for all three columns. Note that this relationship is maintained between 214 and 234 mm. Therefore, it is assumed that the length of the local buckling half-wave 252x276x5 SEHS section is close to these values. In fact, the value of the half-wavelength obtained by the finite strip method is Lcr = 220 mm. It should also be noted that the amplitude of half-waves increases from the ends toward the mid-span of the column due to the fact that local rotation of the walls is prevented in the end sections. In contrast, the very long column buckles in a global bending mode,
- 5 -
which proves the critical load was different from the other cases. It is noted that the critical buckling mode of the very long column clearly reproduces the configuration of a column with 2 fixed ends, whose buckling length is Lcr = L/2 = 7500 mm.
2.3. Comparative Study Table 4 shows a summary of the results obtained for the columns with several SEHS sections and lengths. As shown the results obtained by both methods are similar. The buckling modes displayed by the columns are similar: (i) Local Plate Mode for short and moderately long columns, (ii) global bending mode in long columns. The critical bifurcation loads found by CUFSM and by ABAQUS are of the same order of magnitude.
Table 4 - Comparison of results of the LBA obtained by the FEM and FFM.
MEF (ABAQUS) MFF (CUFSM)
Section L [mm] Buckling
mode Pcr [KN]
Lcr [mm]
Pcr [KN]
203x223x8.0
1500 Local 7646.2
180 7534.02 2500 Local 7591.4
3500 Local 7578.6
7000 Global 4809.5 3500 4774.16
203x223x5.0
1500 Local 1943.5
180 1893.63 2500 Local 1928.6
5000 Local 1924.2
10000 Global 1557.3 5000 1553.08
225x259x5.0
1500 Local 1661.0
200 1608.91 2500 Local 1644.2
6000 Local 1638.1
12000 Global 1537.1 6000 1533.83
252x276x5.0
1500 Local 1605.0
220 1547.18 2500 Local 1584.0
7500 Local 1577.1
15000 Global 1344.7 7500 1343.12
280x322x5.0
1500 Local 1365.9
250 1306.55 2500 Local 1343.7
10000 Local 1334.5
20000 Global 1084.7 10000 1084.36
324x375x6.3
1500 Local 2346.8
290 2230.76 2500 Local 2298.4
10000 Local 2275.5
20000 Global 2113.3 10000 2111.03
3. NONLINEAR BEHAVIOUR AND ULTIMATE
RESISTANCE Of the nonlinear analysis performed for each of the 36 columns whose features are presented in Table 2 three distinct collapse mechanisms were shown associated with equilibrium paths with different developments usually related to the lengths of the SEHS columns under study. The presentation of the analysis and results is divided into three groups (I, II and III) according to features shown, in particular, according to the post-buckling paths and collapse mechanisms.
3.1 Post-buckling Paths and Collapse Mechanisms.
3.1.1. Collapse Mechanism I
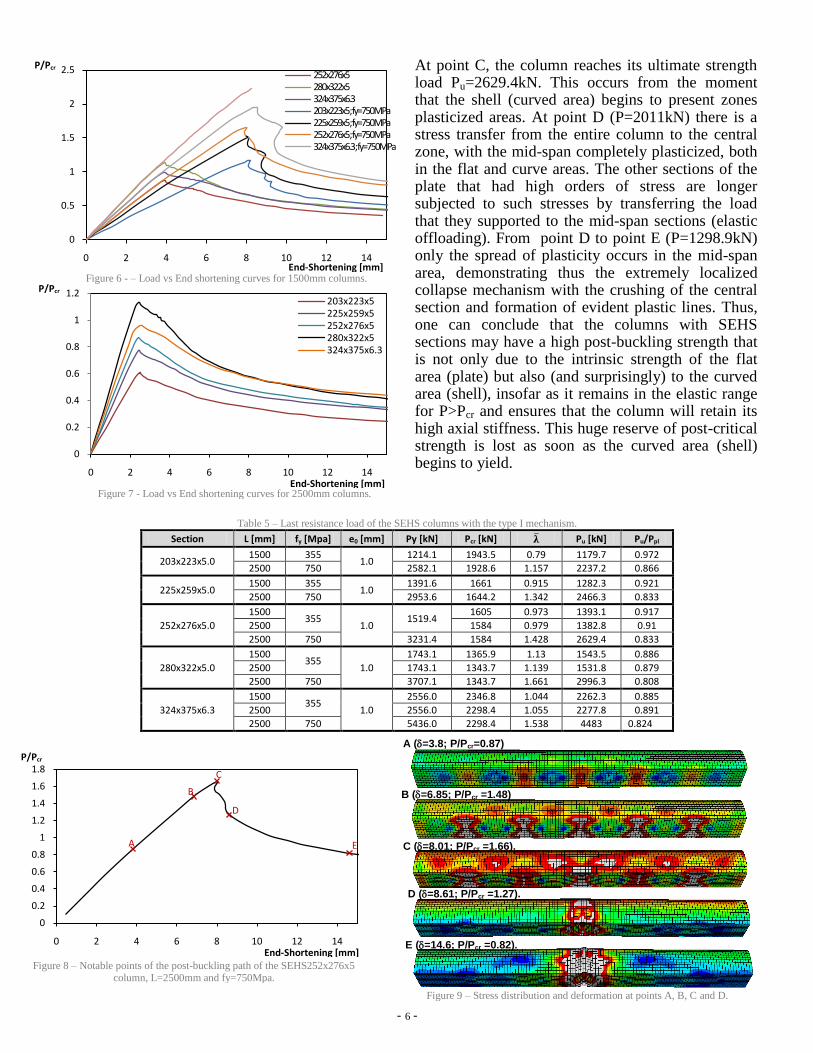
The collapse mechanism, designated here as I, occurs for columns referred to in Table 5, that is, in the vast majority of the short columns. Figures 6 and 7 show the equilibrium paths (load vs. end-shortening curves) for L=1500 and L=2500mm, respectively. The load-end shortening curves associated with these columns have dissimilar characteristics in terms of post-buckling strength, a fact which is intrinsically linked to the non-dimensional slenderness of the section, = √ (Py / Pcr). Note that for values of > 1.130, the columns show an ability to withstand loads exceeding their elastic buckling critical load without collapsing. Generally speaking, the paths are qualitatively similar to those presented by the laminar “shell” type elements. In order to understand the phenomena associated with the formation of the collapse mechanism, Figure 8 and 9 present the evolution of stress and the deformation mode of the column with the SEHS252x276x5 section, L=2500 mm and fy=750MPa, which is representative of the remaining columns analyzed for different points of the load vs.end-shortening curve (A, B, C and D). At point “A” (P=1378.1kN) the column is presented in the elastic material range, displaying no yielded fibers. At this stage, most of the applied load is supported by the plate, with a distribution of stresses which expose the initial geometric imperfections in the column. At point B (P=2344.3kN) there is a plasticization of the regions of the plate that correspond to the areas where some of the eleven half-waves of the local critical buckling mode of the plate were located, particularly the even half-waves (2, 4, 6, 8 and 10). Loss of the column’s axial stiffness is the main reason these areas of the plate begin to achieve the yield stress and consequently, the change in the slope of its equilibrium path.
Figure 5 – Critical Buckling Mode of the SEHS252x276x5 column with: a)
L=1500mm; b) L=2500mm; c) L=7500mm; d) L=15000mm
a)
b)
c)
d)
- 6 -
A
B
C
D
E
0
0.2
0.4
0.6
0.8
1
1.2
1.4
1.6
1.8
0 2 4 6 8 10 12 14
At point C, the column reaches its ultimate strength load Pu=2629.4kN. This occurs from the moment that the shell (curved area) begins to present zones plasticized areas. At point D (P=2011kN) there is a stress transfer from the entire column to the central zone, with the mid-span completely plasticized, both in the flat and curve areas. The other sections of the plate that had high orders of stress are longer subjected to such stresses by transferring the load that they supported to the mid-span sections (elastic offloading). From point D to point E (P=1298.9kN) only the spread of plasticity occurs in the mid-span area, demonstrating thus the extremely localized collapse mechanism with the crushing of the central section and formation of evident plastic lines. Thus, one can conclude that the columns with SEHS sections may have a high post-buckling strength that is not only due to the intrinsic strength of the flat area (plate) but also (and surprisingly) to the curved area (shell), insofar as it remains in the elastic range for P>Pcr and ensures that the column will retain its high axial stiffness. This huge reserve of post-critical strength is lost as soon as the curved area (shell) begins to yield.
Table 5 – Last resistance load of the SEHS columns with the type I mechanism.
Section L [mm] fy [Mpa] e0 [mm] Py [kN] Pcr [kN] Pu [kN] Pu/Ppl
203x223x5.0 1500 355
1.0 1214.1 1943.5 0.79 1179.7 0.972
2500 750 2582.1 1928.6 1.157 2237.2 0.866
225x259x5.0 1500 355
1.0 1391.6 1661 0.915 1282.3 0.921
2500 750 2953.6 1644.2 1.342 2466.3 0.833
252x276x5.0
1500 355
1.0 1519.4
1605 0.973 1393.1 0.917
2500 1584 0.979 1382.8 0.91
2500 750 3231.4 1584 1.428 2629.4 0.833
280x322x5.0
1500 355
1.0
1743.1 1365.9 1.13 1543.5 0.886
2500 1743.1 1343.7 1.139 1531.8 0.879
2500 750 3707.1 1343.7 1.661 2996.3 0.808
324x375x6.3
1500 355
1.0
2556.0 2346.8 1.044 2262.3 0.885
2500 2556.0 2298.4 1.055 2277.8 0.891
2500 750 5436.0 2298.4 1.538 4483 0.824
0
0.5
1
1.5
2
2.5
0 2 4 6 8 10 12 14
252x276x5280x322x5324x375x6.3203x223x5 ; fy=750MPa225x259x5 ; fy=750MPa252x276x5 ; fy=750MPa324x375x6.3 ; fy=750MPa
Figure 6 - – Load vs End shortening curves for 1500mm columns.
Figure 8 – Notable points of the post-buckling path of the SEHS252x276x5 column, L=2500mm and fy=750Mpa.
Figure 9 – Stress distribution and deformation at points A, B, C and D.
A (=3.8; P/Pcr=0.87)
B (=6.85; P/Pcr =1.48)
C (=8.01; P/Pcr =1.66).
D (=8.61; P/Pcr =1.27).
E (=14.6; P/Pcr =0.82).
0
0.2
0.4
0.6
0.8
1
1.2
0 2 4 6 8 10 12 14
203x223x5225x259x5252x276x5280x322x5324x375x6.3
Figure 7 - Load vs End shortening curves for 2500mm columns.
P/Pcr
P/Pcr
End-Shortening [mm]
End-Shortening [mm]
End-Shortening [mm]
P/Pcr
- 7 -
3.1.2 Collapse Mechanism II
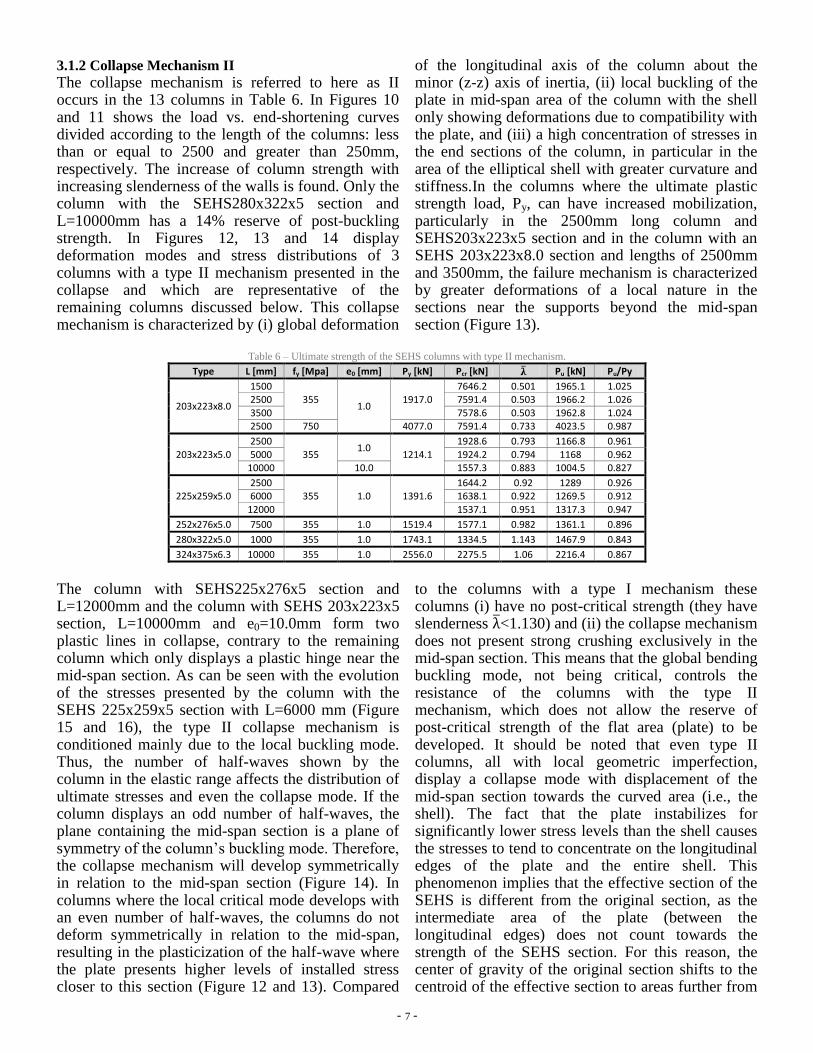
The collapse mechanism is referred to here as II occurs in the 13 columns in Table 6. In Figures 10 and 11 shows the load vs. end-shortening curves divided according to the length of the columns: less than or equal to 2500 and greater than 250mm, respectively. The increase of column strength with increasing slenderness of the walls is found. Only the column with the SEHS280x322x5 section and L=10000mm has a 14% reserve of post-buckling strength. In Figures 12, 13 and 14 display deformation modes and stress distributions of 3 columns with a type II mechanism presented in the collapse and which are representative of the remaining columns discussed below. This collapse mechanism is characterized by (i) global deformation
of the longitudinal axis of the column about the minor (z-z) axis of inertia, (ii) local buckling of the plate in mid-span area of the column with the shell only showing deformations due to compatibility with the plate, and (iii) a high concentration of stresses in the end sections of the column, in particular in the area of the elliptical shell with greater curvature and stiffness.In the columns where the ultimate plastic strength load, Py, can have increased mobilization, particularly in the 2500mm long column and SEHS203x223x5 section and in the column with an SEHS 203x223x8.0 section and lengths of 2500mm and 3500mm, the failure mechanism is characterized by greater deformations of a local nature in the sections near the supports beyond the mid-span section (Figure 13).
Table 6 – Ultimate strength of the SEHS columns with type II mechanism.
Type L [mm] fy [Mpa] e0 [mm] Py [kN] Pcr [kN] Pu [kN] Pu/Py
203x223x8.0
1500 355
1.0 1917.0
7646.2 0.501 1965.1 1.025 2500 7591.4 0.503 1966.2 1.026
3500 7578.6 0.503 1962.8 1.024 2500 750 4077.0 7591.4 0.733 4023.5 0.987
203x223x5.0
2500
355 1.0
1214.1
1928.6 0.793 1166.8 0.961
5000 1924.2 0.794 1168 0.962 10000 10.0 1557.3 0.883 1004.5 0.827
225x259x5.0 2500
355 1.0 1391.6 1644.2 0.92 1289 0.926
6000 1638.1 0.922 1269.5 0.912
12000 1537.1 0.951 1317.3 0.947
252x276x5.0 7500 355 1.0 1519.4 1577.1 0.982 1361.1 0.896
280x322x5.0 1000 355 1.0 1743.1 1334.5 1.143 1467.9 0.843
324x375x6.3 10000 355 1.0 2556.0 2275.5 1.06 2216.4 0.867
The column with SEHS225x276x5 section and L=12000mm and the column with SEHS 203x223x5 section, L=10000mm and e0=10.0mm form two plastic lines in collapse, contrary to the remaining column which only displays a plastic hinge near the mid-span section. As can be seen with the evolution of the stresses presented by the column with the SEHS 225x259x5 section with L=6000 mm (Figure 15 and 16), the type II collapse mechanism is conditioned mainly due to the local buckling mode. Thus, the number of half-waves shown by the column in the elastic range affects the distribution of ultimate stresses and even the collapse mode. If the column displays an odd number of half-waves, the plane containing the mid-span section is a plane of symmetry of the column’s buckling mode. Therefore, the collapse mechanism will develop symmetrically in relation to the mid-span section (Figure 14). In columns where the local critical mode develops with an even number of half-waves, the columns do not deform symmetrically in relation to the mid-span, resulting in the plasticization of the half-wave where the plate presents higher levels of installed stress closer to this section (Figure 12 and 13). Compared
to the columns with a type I mechanism these columns (i) have no post-critical strength (they have slenderness <1.130) and (ii) the collapse mechanism does not present strong crushing exclusively in the mid-span section. This means that the global bending buckling mode, not being critical, controls the resistance of the columns with the type II mechanism, which does not allow the reserve of post-critical strength of the flat area (plate) to be developed. It should be noted that even type II columns, all with local geometric imperfection, display a collapse mode with displacement of the mid-span section towards the curved area (i.e., the shell). The fact that the plate instabilizes for significantly lower stress levels than the shell causes the stresses to tend to concentrate on the longitudinal edges of the plate and the entire shell. This phenomenon implies that the effective section of the SEHS is different from the original section, as the intermediate area of the plate (between the longitudinal edges) does not count towards the strength of the SEHS section. For this reason, the center of gravity of the original section shifts to the centroid of the effective section to areas further from
- 8 -
0
0.1
0.2
0.3
0.4
0.5
0.6
0.7
0.8
0.9
0 2 4 6 8 10
203x223x5203x223x8225x259x5203x233x8; fy=750MPA203x233x8; L=1500
0
0.2
0.4
0.6
0.8
1
1.2
0 5 10 15 20
203x223x5 L=5000203x223x8 L=3500225x259x5 L=6000252x276x5 L=7500280x322x5 L=10000324.375x6.3 L=10000225x276x5;L=12000203x223x5;e0=10.0
A
B
C
D
0
0.1
0.2
0.3
0.4
0.5
0.6
0.7
0.8
0.9
0 2 4 6 8 10 12 14
the plate and closer to the shell, resulting in an additional moment which tends to “attenuate” the compressive stresses in the curved area at mid-span and aggravate the compressive stresses in the flat
area at mid-span. This moment implies that the section moves “towards the shell” in the mid-span area, as can be seen in Figure 16.
\
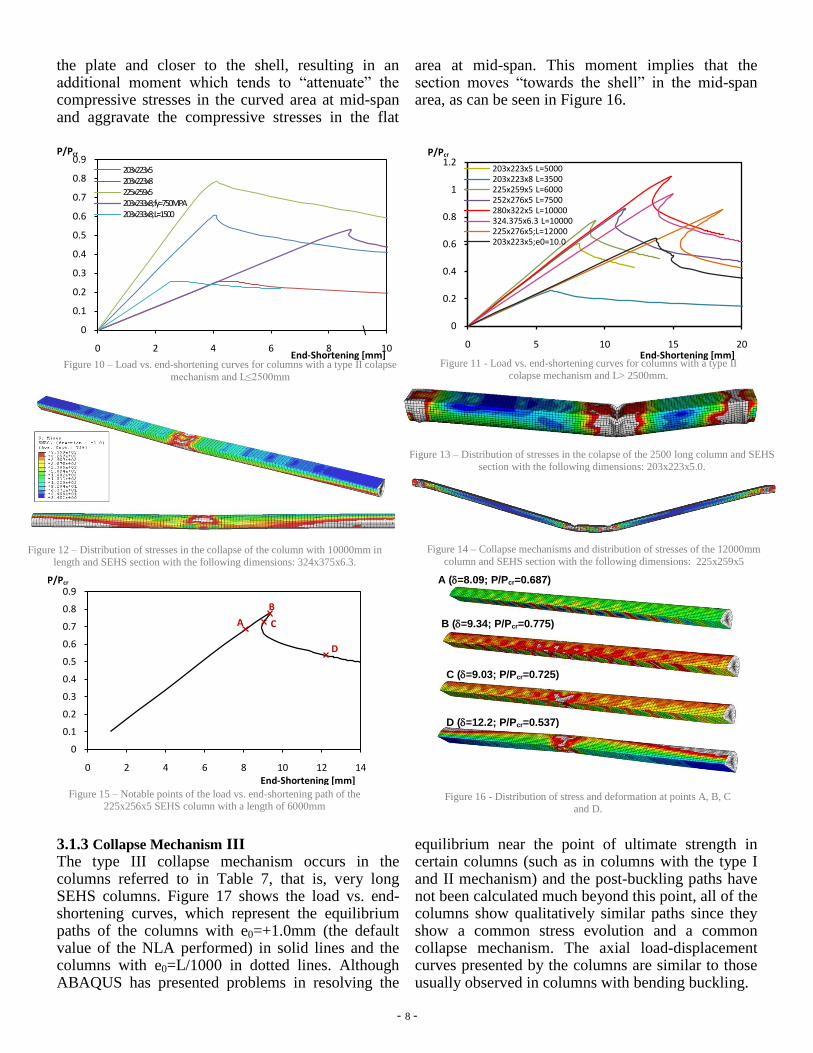
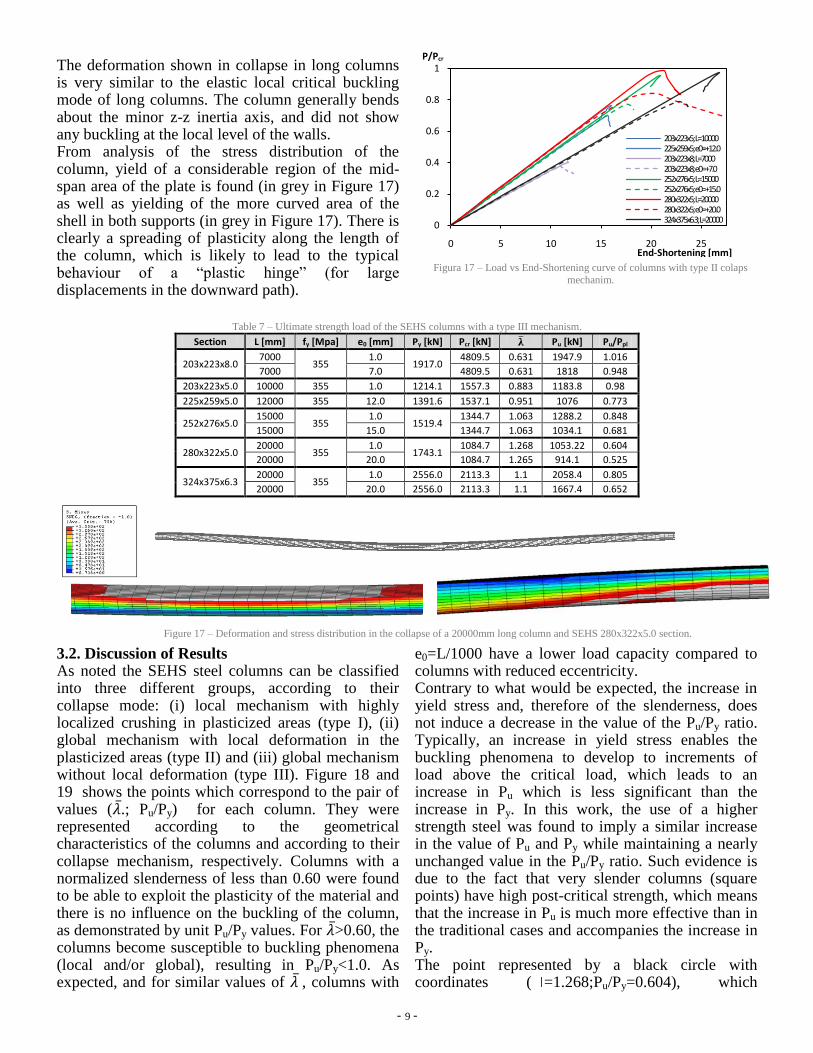
3.1.3 Collapse Mechanism III The type III collapse mechanism occurs in the columns referred to in Table 7, that is, very long SEHS columns. Figure 17 shows the load vs. end-shortening curves, which represent the equilibrium paths of the columns with e0=+1.0mm (the default value of the NLA performed) in solid lines and the columns with e0=L/1000 in dotted lines. Although ABAQUS has presented problems in resolving the
equilibrium near the point of ultimate strength in certain columns (such as in columns with the type I and II mechanism) and the post-buckling paths have not been calculated much beyond this point, all of the columns show qualitatively similar paths since they show a common stress evolution and a common collapse mechanism. The axial load-displacement curves presented by the columns are similar to those usually observed in columns with bending buckling.
Figure 10 – Load vs. end-shortening curves for columns with a type II colapse
mechanism and L≤2500mm Figure 11 - Load vs. end-shortening curves for columns with a type II
colapse mechanism and L> 2500mm.
Figure 12 – Distribution of stresses in the collapse of the column with 10000mm in
length and SEHS section with the following dimensions: 324x375x6.3.
Figure 13 – Distribution of stresses in the colapse of the 2500 long column and SEHS
section with the following dimensions: 203x223x5.0.
Figure 14 – Collapse mechanisms and distribution of stresses of the 12000mm
column and SEHS section with the following dimensions: 225x259x5
Figure 16 - Distribution of stress and deformation at points A, B, C
and D. Figure 15 – Notable points of the load vs. end-shortening path of the
225x256x5 SEHS column with a length of 6000mm
A (=8.09; P/Pcr=0.687)
B (=9.34; P/Pcr=0.775)
C (=9.03; P/Pcr=0.725)
D (=12.2; P/Pcr=0.537)
End-Shortening [mm] End-Shortening [mm]
P/Pcr P/Pcr
End-Shortening [mm]
P/Pcr
- 9 -
The deformation shown in collapse in long columns is very similar to the elastic local critical buckling mode of long columns. The column generally bends about the minor z-z inertia axis, and did not show any buckling at the local level of the walls. From analysis of the stress distribution of the column, yield of a considerable region of the mid-span area of the plate is found (in grey in Figure 17) as well as yielding of the more curved area of the shell in both supports (in grey in Figure 17). There is clearly a spreading of plasticity along the length of the column, which is likely to lead to the typical behaviour of a “plastic hinge” (for large displacements in the downward path).
Table 7 – Ultimate strength load of the SEHS columns with a type III mechanism.
Section L [mm] fy [Mpa] e0 [mm] Py [kN] Pcr [kN] Pu [kN] Pu/Ppl
203x223x8.0 7000
355 1.0
1917.0 4809.5 0.631 1947.9 1.016
7000 7.0 4809.5 0.631 1818 0.948
203x223x5.0 10000 355 1.0 1214.1 1557.3 0.883 1183.8 0.98
225x259x5.0 12000 355 12.0 1391.6 1537.1 0.951 1076 0.773
252x276x5.0 15000
355 1.0
1519.4 1344.7 1.063 1288.2 0.848
15000 15.0 1344.7 1.063 1034.1 0.681
280x322x5.0 20000
355 1.0
1743.1 1084.7 1.268 1053.22 0.604
20000 20.0 1084.7 1.265 914.1 0.525
324x375x6.3 20000
355 1.0 2556.0 2113.3 1.1 2058.4 0.805
20000 20.0 2556.0 2113.3 1.1 1667.4 0.652
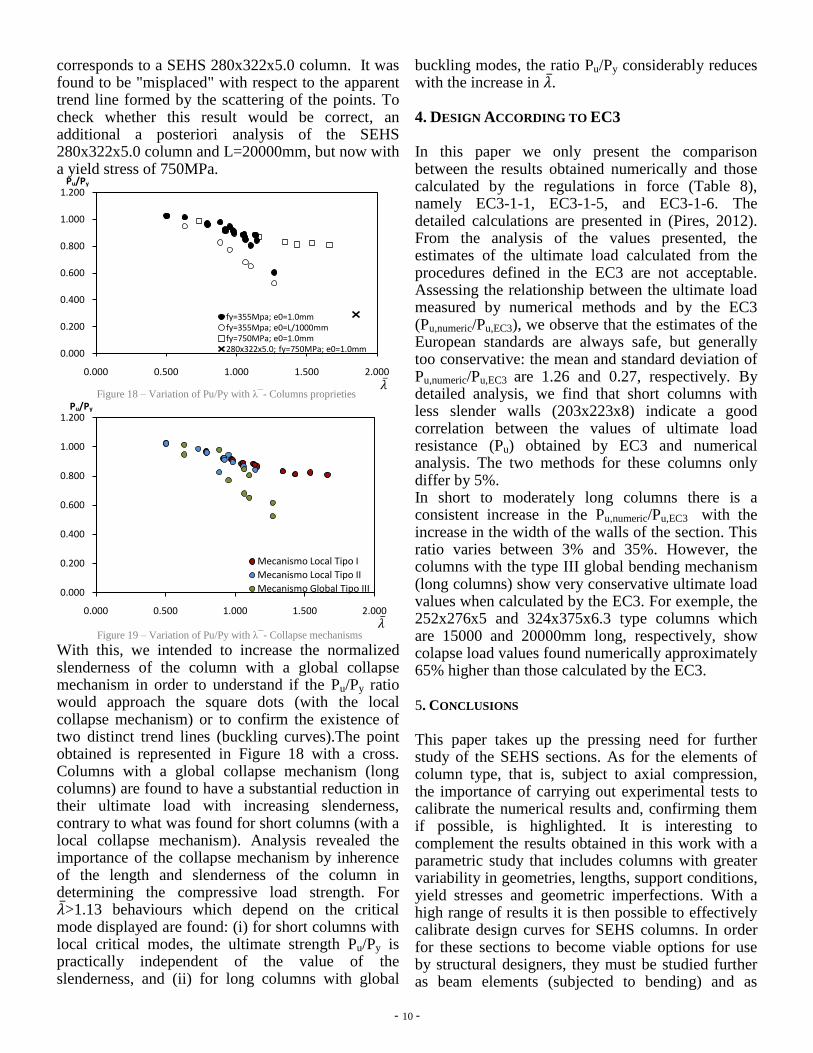
3.2. Discussion of Results As noted the SEHS steel columns can be classified into three different groups, according to their collapse mode: (i) local mechanism with highly localized crushing in plasticized areas (type I), (ii) global mechanism with local deformation in the plasticized areas (type II) and (iii) global mechanism without local deformation (type III). Figure 18 and 19 shows the points which correspond to the pair of values ( .; Pu/Py) for each column. They were represented according to the geometrical characteristics of the columns and according to their collapse mechanism, respectively. Columns with a normalized slenderness of less than 0.60 were found to be able to exploit the plasticity of the material and there is no influence on the buckling of the column, as demonstrated by unit Pu/Py values. For >0.60, the columns become susceptible to buckling phenomena (local and/or global), resulting in Pu/Py<1.0. As expected, and for similar values of , columns with
e0=L/1000 have a lower load capacity compared to columns with reduced eccentricity. Contrary to what would be expected, the increase in yield stress and, therefore of the slenderness, does not induce a decrease in the value of the Pu/Py ratio. Typically, an increase in yield stress enables the buckling phenomena to develop to increments of load above the critical load, which leads to an increase in Pu which is less significant than the increase in Py. In this work, the use of a higher strength steel was found to imply a similar increase in the value of Pu and Py while maintaining a nearly unchanged value in the Pu/Py ratio. Such evidence is due to the fact that very slender columns (square points) have high post-critical strength, which means that the increase in Pu is much more effective than in the traditional cases and accompanies the increase in Py. The point represented by a black circle with coordinates ( =1.268;Pu/Py=0.604), which
Figure 17 – Deformation and stress distribution in the collapse of a 20000mm long column and SEHS 280x322x5.0 section.
0
0.2
0.4
0.6
0.8
1
0 5 10 15 20 25
203x223x5; L=10000225x259x5; e0=+12.0203x223x8; L=7000203x223x8; e0=+7.0252x276x5; L=15000252x276x5; e0=+15.0280x322x5; L=20000280x322x5; e0=+20.0324x375x6.3; L=20000
Figura 17 – Load vs End-Shortening curve of columns with type II colaps
mechanim.
P/Pcr
End-Shortening [mm]
- 10 -
corresponds to a SEHS 280x322x5.0 column. It was found to be "misplaced" with respect to the apparent trend line formed by the scattering of the points. To check whether this result would be correct, an additional a posteriori analysis of the SEHS 280x322x5.0 column and L=20000mm, but now with a yield stress of 750MPa.
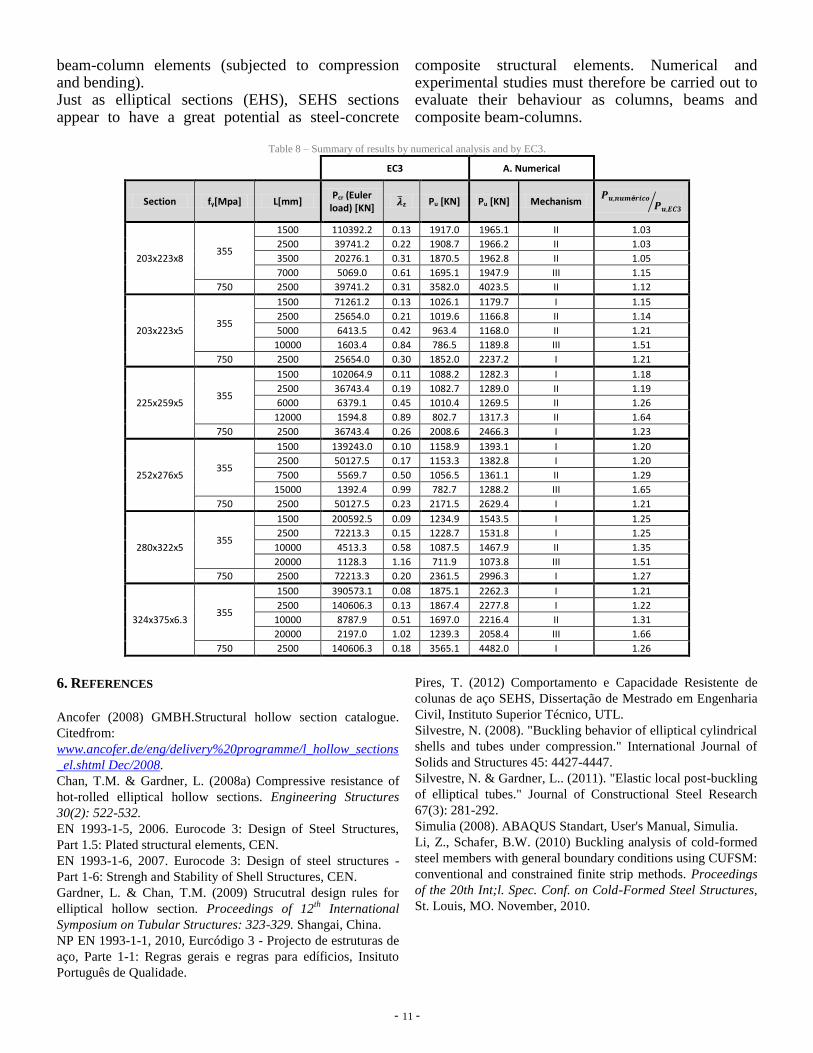
With this, we intended to increase the normalized slenderness of the column with a global collapse mechanism in order to understand if the Pu/Py ratio would approach the square dots (with the local collapse mechanism) or to confirm the existence of two distinct trend lines (buckling curves).The point obtained is represented in Figure 18 with a cross. Columns with a global collapse mechanism (long columns) are found to have a substantial reduction in their ultimate load with increasing slenderness, contrary to what was found for short columns (with a local collapse mechanism). Analysis revealed the importance of the collapse mechanism by inherence of the length and slenderness of the column in determining the compressive load strength. For >1.13 behaviours which depend on the critical mode displayed are found: (i) for short columns with local critical modes, the ultimate strength Pu/Py is practically independent of the value of the slenderness, and (ii) for long columns with global
buckling modes, the ratio Pu/Py considerably reduces with the increase in . 4. DESIGN ACCORDING TO EC3 In this paper we only present the comparison between the results obtained numerically and those calculated by the regulations in force (Table 8), namely EC3-1-1, EC3-1-5, and EC3-1-6. The detailed calculations are presented in (Pires, 2012). From the analysis of the values presented, the estimates of the ultimate load calculated from the procedures defined in the EC3 are not acceptable. Assessing the relationship between the ultimate load measured by numerical methods and by the EC3 (Pu,numeric/Pu,EC3), we observe that the estimates of the European standards are always safe, but generally too conservative: the mean and standard deviation of Pu,numeric/Pu,EC3 are 1.26 and 0.27, respectively. By detailed analysis, we find that short columns with less slender walls (203x223x8) indicate a good correlation between the values of ultimate load resistance (Pu) obtained by EC3 and numerical analysis. The two methods for these columns only differ by 5%. In short to moderately long columns there is a consistent increase in the Pu,numeric/Pu,EC3 with the increase in the width of the walls of the section. This ratio varies between 3% and 35%. However, the columns with the type III global bending mechanism (long columns) show very conservative ultimate load values when calculated by the EC3. For exemple, the 252x276x5 and 324x375x6.3 type columns which are 15000 and 20000mm long, respectively, show colapse load values found numerically approximately 65% higher than those calculated by the EC3.
5. CONCLUSIONS
This paper takes up the pressing need for further study of the SEHS sections. As for the elements of column type, that is, subject to axial compression, the importance of carrying out experimental tests to calibrate the numerical results and, confirming them if possible, is highlighted. It is interesting to complement the results obtained in this work with a parametric study that includes columns with greater variability in geometries, lengths, support conditions, yield stresses and geometric imperfections. With a high range of results it is then possible to effectively calibrate design curves for SEHS columns. In order for these sections to become viable options for use by structural designers, they must be studied further as beam elements (subjected to bending) and as
Figure 18 – Variation of Pu/Py with λ - Columns proprieties
0.000
0.200
0.400
0.600
0.800
1.000
1.200
0.000 0.500 1.000 1.500 2.000
fy=355Mpa; e0=1.0mmfy=355Mpa; e0=L/1000mmfy=750MPa; e0=1.0mm280x322x5.0; fy=750MPa; e0=1.0mm
Pu/Py
0.000
0.200
0.400
0.600
0.800
1.000
1.200
0.000 0.500 1.000 1.500 2.000
Mecanismo Local Tipo I
Mecanismo Local Tipo II
Mecanismo Global Tipo III
Figure 19 – Variation of Pu/Py with λ - Collapse mechanisms
Pu/Py
Pu/Py
- 11 -
beam-column elements (subjected to compression and bending). Just as elliptical sections (EHS), SEHS sections appear to have a great potential as steel-concrete
composite structural elements. Numerical and experimental studies must therefore be carried out to evaluate their behaviour as columns, beams and composite beam-columns.
Table 8 – Summary of results by numerical analysis and by EC3.
EC3 A. Numerical
Section fy[Mpa] L[mm] Pcr (Euler
load) [KN] z Pu [KN] Pu [KN] Mechanism
203x223x8 355
1500 110392.2 0.13 1917.0 1965.1 II 1.03
2500 39741.2 0.22 1908.7 1966.2 II 1.03
3500 20276.1 0.31 1870.5 1962.8 II 1.05
7000 5069.0 0.61 1695.1 1947.9 III 1.15
750 2500 39741.2 0.31 3582.0 4023.5 II 1.12
203x223x5 355
1500 71261.2 0.13 1026.1 1179.7 I 1.15
2500 25654.0 0.21 1019.6 1166.8 II 1.14
5000 6413.5 0.42 963.4 1168.0 II 1.21
10000 1603.4 0.84 786.5 1189.8 III 1.51
750 2500 25654.0 0.30 1852.0 2237.2 I 1.21
225x259x5 355
1500 102064.9 0.11 1088.2 1282.3 I 1.18
2500 36743.4 0.19 1082.7 1289.0 II 1.19
6000 6379.1 0.45 1010.4 1269.5 II 1.26
12000 1594.8 0.89 802.7 1317.3 II 1.64
750 2500 36743.4 0.26 2008.6 2466.3 I 1.23
252x276x5 355
1500 139243.0 0.10 1158.9 1393.1 I 1.20
2500 50127.5 0.17 1153.3 1382.8 I 1.20
7500 5569.7 0.50 1056.5 1361.1 II 1.29
15000 1392.4 0.99 782.7 1288.2 III 1.65
750 2500 50127.5 0.23 2171.5 2629.4 I 1.21
280x322x5 355
1500 200592.5 0.09 1234.9 1543.5 I 1.25
2500 72213.3 0.15 1228.7 1531.8 I 1.25
10000 4513.3 0.58 1087.5 1467.9 II 1.35
20000 1128.3 1.16 711.9 1073.8 III 1.51
750 2500 72213.3 0.20 2361.5 2996.3 I 1.27
324x375x6.3 355
1500 390573.1 0.08 1875.1 2262.3 I 1.21
2500 140606.3 0.13 1867.4 2277.8 I 1.22
10000 8787.9 0.51 1697.0 2216.4 II 1.31
20000 2197.0 1.02 1239.3 2058.4 III 1.66
750 2500 140606.3 0.18 3565.1 4482.0 I 1.26
6. REFERENCES
Ancofer (2008) GMBH.Structural hollow section catalogue.
Citedfrom:
www.ancofer.de/eng/delivery%20programme/l_hollow_sections
_el.shtml Dec/2008.
Chan, T.M. & Gardner, L. (2008a) Compressive resistance of
hot-rolled elliptical hollow sections. Engineering Structures
30(2): 522-532.
EN 1993-1-5, 2006. Eurocode 3: Design of Steel Structures,
Part 1.5: Plated structural elements, CEN.
EN 1993-1-6, 2007. Eurocode 3: Design of steel structures -
Part 1-6: Strengh and Stability of Shell Structures, CEN.
Gardner, L. & Chan, T.M. (2009) Strucutral design rules for
elliptical hollow section. Proceedings of 12th
International
Symposium on Tubular Structures: 323-329. Shangai, China.
NP EN 1993-1-1, 2010, Eurcódigo 3 - Projecto de estruturas de
aço, Parte 1-1: Regras gerais e regras para edíficios, Insituto
Português de Qualidade.
Pires, T. (2012) Comportamento e Capacidade Resistente de
colunas de aço SEHS, Dissertação de Mestrado em Engenharia
Civil, Instituto Superior Técnico, UTL.
Silvestre, N. (2008). "Buckling behavior of elliptical cylindrical
shells and tubes under compression." International Journal of
Solids and Structures 45: 4427-4447.
Silvestre, N. & Gardner, L.. (2011). "Elastic local post-buckling
of elliptical tubes." Journal of Constructional Steel Research
67(3): 281-292.
Simulia (2008). ABAQUS Standart, User's Manual, Simulia.
Li, Z., Schafer, B.W. (2010) Buckling analysis of cold-formed
steel members with general boundary conditions using CUFSM:
conventional and constrained finite strip methods. Proceedings
of the 20th Int;l. Spec. Conf. on Cold-Formed Steel Structures,
St. Louis, MO. November, 2010.

- 12 -
![Time-Dependent J-Integral Solution for Semi-elliptical ... · in tension, by studying the J integral (in sense of G(t)) evolution with time. The ... [Abaqus (2009] code for semi-elliptical](https://img.pdfslide.net/doc/110x75/5abefed37f8b9ad8278ddc3e/time-dependent-j-integral-solution-for-semi-elliptical-tension-by-studying.jpg)


![[XLS] · Web view91" X 58" ELLIPTICAL PIPE 02582 91" X 58" ELLIPTICAL CONC. PIPE 02630 98" X 63" ELLIPTICAL PIPE 02632 98" X 63" ELLIPTICAL CONC. PIPE 02680 106" X 68" ELLIPTICAL](https://img.pdfslide.net/doc/110x75/5ae3d8767f8b9a5d648e7b83/xls-view91-x-58-elliptical-pipe-02582-91-x-58-elliptical-conc-pipe-02630-98-x.jpg)


![Semi-elliptical dump body - Work Trucks and Trailers - …drakeequipment.com/.../uploads/2014/05/KH6833-Dumpbody.docx · Web viewSemi-elliptical dump body [ ConstruCtion ] K&H Manufacturing](https://img.pdfslide.net/doc/110x75/5ad197d57f8b9abd6c8bd942/semi-elliptical-dump-body-work-trucks-and-trailers-viewsemi-elliptical-dump.jpg)