Embed Size (px)
Citation preview
£45.00
Return to an order of the House of Commons dated 24 March 2010
Copy of Economic and Fiscal Strategy Report and Financial Statement and
Budget Report – March 2010 as laid before the House of Commons by the
Chancellor of the Exchequer when opening the Budget.
Stephen Timms
Her Majesty’s Treasury
24 March 2010
Ordered by the House of Commons to be printed 24 March 2010
HC 451
Budget 2010Securing the recovery
Economic and Fiscal Strategy Report and Financial Statement and Budget Report
March 2010
LONDON: The Stationery Office
© Crown Copyright 2010
The text in this document (excluding the Royal Arms and other departmental or agency logos) may be reproduced free of charge in any format or medium providing it is reproduced accurately and not used in a misleading context. The material must be acknowledged as Crown copyright and the title of the document specified.
Where we have identified any third party copyright material you will need to obtain permission from the copyright holders concerned.
For any other use of this material please contact the Office of Public Sector Information, Information Policy Team, Kew, Richmond, Surrey TW9 4DU or e-mail: [email protected].
ISBN: 9780102964639
Printed in the UK by The Stationery Office Limitedon behalf of the Controller of Her Majesty’s Stationery Office
ID 2354757 2085 03/10
Printed on paper containing 75% recycled fibre content minimum.
The Economic and Fiscal Strategy Report and the Financial Statement and Budget Report contain the Government’s assessment of the medium-term economic and budgetary position. They set out the Government’s tax and spending plans, including those for public investment, in the context of its overall approach to social, economic and environmental objectives. After approval for the purposes of Section 5 the European Communities (Amendment) Act 1993, these reports wil form the basis of submissions to the European Commission under Article 99 (ex Article 103) and Article 104 (ex Article 104c) of the Treaty establishing the European Community.
HM Treasury contacts
This document can be found in full on our website at: www.hm-treasury.gov.uk/budget2010.htm
If you require this information in another language, format or have general enquiries about HM Treasury and its work, contact:
Correspondence and Enquiry Unit HM Treasury 1 Horse Guards Road London
SW1A 2HQ
Tel: 020 7270 4558 Fax: 020 7270 4861
E-mail: [email protected]
C o n t e n t s
Page
Economic and Fiscal Strategy Report
Chapter 1 Overview 1
Chapter 2 Maintaining macroeconomic stability 13
Chapter 3 Reforming financial services 35
Chapter 4 Supporting business and growth 49
Chapter 5 Achieving fairness and providing opportunity 63
Chapter 6 Protecting public services 85
Chapter 7 Securing low-carbon growth 105
Financial Statement and Budget Report
Chapter A Budget policy decisions 119
Chapter B The economy 145
Chapter C The public finances 181
List of abbreviations 223
List of tables 226
List of charts 227

Economic and FiscalStrategy Report

1Budget 2010
1 O v e r v i e w
The Government’s economic objective is to build a strong economy and fair society, where there is opportunity and security for all. Budget 2010, Securing the recovery, presents updated assessments and forecasts of the economy and public finances. It reports on how the Government will be delivering support to business and households to build strong, sustainable, growth whilst protecting the frontline services that people rely on. The Government is acting to ensure sound public finances to provide a stable platform for growth and maintain macroeconomic stability.
Budget 2010 is fiscally neutral and confirms the Government’s plans to more than halve the deficit over four years, maintaining a credible path of fiscal consolidation. On public spending, Budget 2010 identifies the £11 billion of cross-cutting savings announced under Smarter Government department-by-department and provides further details on how the Government will deliver £5 billion of savings from targeting and prioritising spending. On tax, the Government intends to make further progress in Finance Bill 2010 passing into legislation its tax consolidation plans, and Budget 2010 announces the continuation of above inflation increases in fuel, alcohol and tobacco duties to 2014-15.
Budget 2010 also confirms that overall spending will continue to rise in 2010-11 to help support the economy through the recovery. But, as announced at the 2009 Pre-Budget Report, public sector current expenditure will grow at the slower rate of 0.8 per cent a year on average from 2011-12 to 2014-15, and public sector net investment will fall to 1¼ per cent of GDP by 2013-14 and remain at that level in 2014-15.
Budget 2010 announces measures to promote sustainable growth including:
support for small and growing businesses, through new lending commitments •with RBS and Lloyds Banking Group, continuing Time to Pay arrangements, a temporary increase in the level of small business rate relief for half a million businesses, a doubling the Annual Investment Allowance and Entrepreneurs’ Relief, the launch of UK Finance for Growth, and the creation of a small business credit adjudicator.
investment in skills and innovation, including to fund the teaching costs of 20,000 •extra undergraduate Higher Education places in September 2010;
investment in infrastructure, including additional funding for transport and local •roads and creating a Green Investment Bank; and
support for employment through extending Young Person’s Guarantee after to •March 2012.
Budget 2010 also provides targeted support for households and individuals, including: increased support through tax credits for families with children aged one and two, continuing to provide an additional payment for pensioner households alongside the Winter Fuel Payment, and a two-year stamp duty relief for first time buyers for property purchases up to £250,000 from alongside an additional 5 per cent rate of stamp duty for residential property purchase over £1 million from 2011-12. Budget 2010 also announces the Inheritance Tax threshold will be frozen to 2014-15.
The Government’s objective is to build a strong economy and a fair society, where 1.1 there is opportunity and security for all.
1.2 The global economy is in the early stages of recovery after the most severe and synchronised contraction in 60 years. Under the leadership of the United Kingdom, the G20 has taken unprecedented action to boost global prospects in the short-term. However, the recovery remains modest, with differences of pace between emerging and advanced economies
World recovery and global prospects
1 O v e r v i e w eFSr
2 Budget 2010
The Budget forecast for growth in the world economy remain unchanged from the 1.3 2009 Pre-Budget Report. The world economy is estimated to have contracted by 1 percent in 2009, the largest calendar year decline since the Great Depression and is set to grow by 3 ¼ per cent in 2010 before rising to growth of 4 ¼ percent in 2011 and 2012. Much of this growth will be generated by emerging markets with the G7 economies set to experience a more modest rebound, growing by1 ¾ per cent in 2010, 3 per cent in 2011 and 3 ¼ per cent in 2012.
The UK economy stabilised in the second half of 2009, following a substantial fall in output in the wake of the global financial crisis. In line with the Budget 2009 and the 2009 Pre-Budget Report forecasts, the UK economy returned to growth at the end of 2009. GDP is currently estimated to have risen by 0.3 per cent in the final quarter of the year. Reflecting this, and recent developments, the GDP forecast for 2010 is 1 to 1½ per cent. GDP is then forecast to grow by between 3 and 3½ per cent in 2011, before rising to 3¼ to 3¾ per cent in 2012.
1.4 This Budget sets out the action the Government is taking to promote long-term sustainable growth. The Budget describes the next steps that the Government is taking to make further progress in:
Maintaining macroeconomic stability• , through securing the economic recovery and building a strong economy for the future, while ensuring sound public finances;
Reforming financial services• , through ensuring a strong and thriving financial sector that is sustainable with market participants and regulators supporting long-term economic growth;
Supporting business and growth• , by measures to support start-ups and small and medium sized enterprises (SMEs), to position the UK as a leading centre for research and innovation, and to ensure that the UK is equipped with the infrastructure it needs to be successful in a low-carbon economy;
Achieving fairness and providing opportunity• , through additional measures to help households through the early stages of the economic recovery and setting policy to create the right economic environment for households to promote stability and growth in the medium-term;
Protecting public services• , through setting out further details on the Government’s plans to protect its public service priorities whilst meeting the commitment to halve public sector net borrowing over the next four years; and
Securing low-carbon growth• , enabling the investment needed for the transition to a low-carbon and resource efficient economy and driving the transition to a low-carbon and resource- efficient economy.
MAINTA IN ING MACROECONOMIC STAB IL ITY
Chapter 2 sets out prospects for the UK economy and public finances, further details 1.5 of which are set out in Chapters B and C of the Financial Statement and Budget Report (FSBR)
Prospects for the UK economy
Budget 2010
eFSr O v e r v i e w 1
3Budget 2010
1.6 In response to the global economic downturn, the Government took comprehensive action to support the economy, and this as been successful in mitigating the impact of the downturn on businesses and individuals. However, significant uncertainty remains. Macroeconomic policy will continue to support the economy throughout this year; monetary policy is expected to continue to provide an ongoing and powerful stimulus.
Setting a credible fiscal consolidation plan to ensure sustainable public finances is a 1.7 key part of the Government’s macroeconomic strategy and is essential for economic stability and the long-term health of the economy. Sound public finances provide the conditions for growth, helping to maintain low long-term interest rates and giving businesses the confidence to plan and invest for the future. The Government’s consolidation path in has been embedded in legislation through the Fiscal Responsibility Act.
1.8 The Government’s fiscal policy objectives are:
over the medium-term, to ensure sound public finances and that spending •and taxation impact fairly within and between generations; and
over the short-term, to support monetary policy and, in particular, to allow •the automatic stabilisers to help smooth the path of the economy.
The financial crisis and global downturn have had a profound and persistent impact 1.9 on the public finances, resulting in a significant increase in Government borrowing and debt. Responding to these developments, in line with its fiscal objectives, the Government’s fiscal strategy has been to:
base policy decisions on a realistic fiscal forecast, based on a range of •assumptions, some of which are designed to provide caution to allow for uncertainty;
set out a credible plan for delivering a sustained consolidation over the •medium term to ensure sound public finances and create space in the short term for continued fiscal support;
ensure that the fiscal policy framework is set to deliver the Government’s •fiscal policy objectives given the outlook for the public finances and the economy; and
minimise the long-term cost of debt issuance subject to risk and reduce •refinancing risk, all else equal, by issuing a larger proportion of long-maturity and index-linked gilts.
1.10 In recent months tax receipts have been higher than expected. As a result, public sector net borrowing in 2009-10 is now projected to be £11 billion lower than forecast in the 2009 Pre- Budget Report.
Budget 2010 provides further temporary and targeted support for growth in 2010-11, 1.11 balanced by measures that raise revenue in later years. As a result, Budget 2010 sets out a lower path for borrowing and debt in each year of the forecast period relative to Budget 2009.
1.12 Budget 2010 provides updated projections for the public finances, consistent with the Code for fiscal stability. The Budget 2010 projections show that:
Public sector net borrowing (PSNB) is forecast to peak at 11.8 per cent of GDP •in 2009-10. PSNB is then projected to fall in every year of the forecast period to reach 5.2 per cent of GPD in 2013-14 and 4.0 per cent in 2014-15; and
Securing the recovery
The Government’s fiscal strategy
Budget developments
The public finances
1 O v e r v i e w eFSr
4 Budget 2010
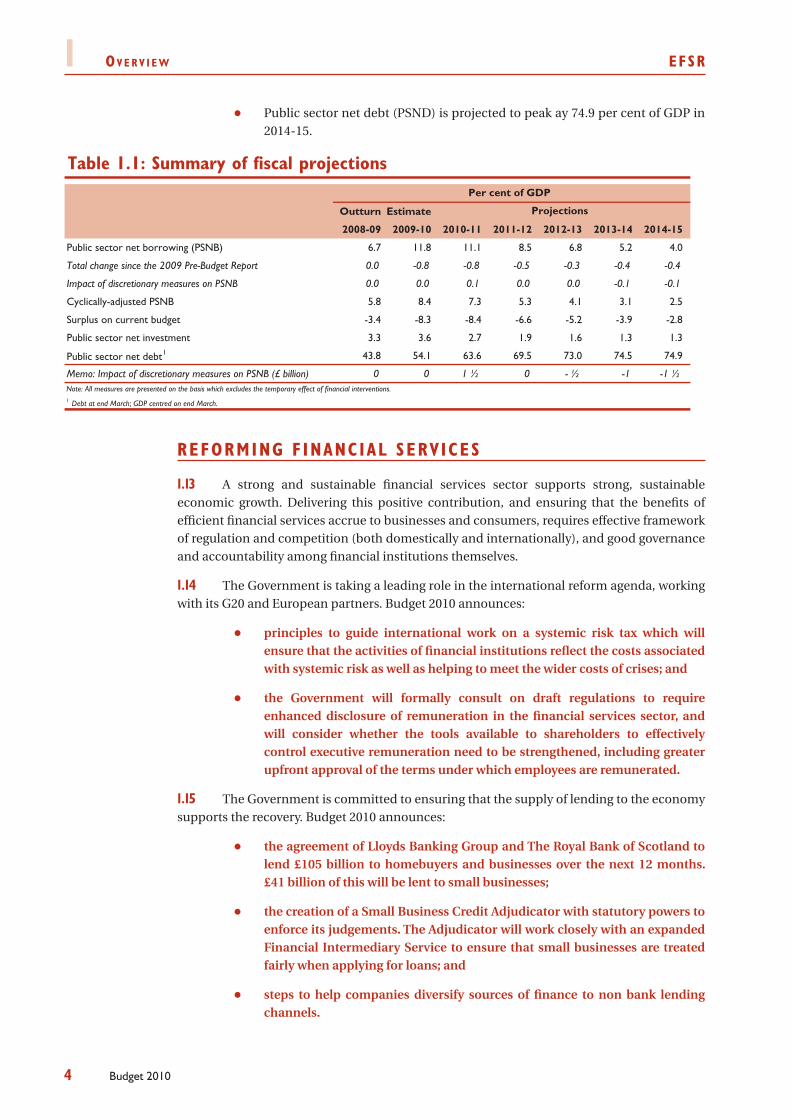
Public sector net debt (PSND) is projected to peak ay 74.9 per cent of GDP in •2014-15.
Table 1.1: Summary of fiscal projections
Outturn Estimate
2008-09 2009-10 2010-11 2011-12 2012-13 2013-14 2014-15
Public sector net borrowing (PSNB) 6.7 11.8 11.1 8.5 6.8 5.2 4.0
Total change since the 2009 Pre-Budget Report 0.0 -0.8 -0.8 -0.5 -0.3 -0.4 -0.4
Impact of discretionary measures on PSNB 0.0 0.0 0.1 0.0 0.0 -0.1 -0.1
Cyclically-adjusted PSNB 5.8 8.4 7.3 5.3 4.1 3.1 2.5
Surplus on current budget -3.4 -8.3 -8.4 -6.6 -5.2 -3.9 -2.8
Public sector net investment 3.3 3.6 2.7 1.9 1.6 1.3 1.3
Public sector net debt1 43.8 54.1 63.6 69.5 73.0 74.5 74.9
Memo: Impact of discretionary measures on PSNB (£ billion) 0 0 1 ½ 0 - ½ -1 -1 ½
1 Debt at end March; GDP centred on end March.
Per cent of GDP
Projections
Note: All measures are presented on the basis which excludes the temporary effect of financial interventions.
REFORMING F INANC IAL SERV ICES
A strong and sustainable financial services sector supports strong, sustainable 1.13 economic growth. Delivering this positive contribution, and ensuring that the benefits of efficient financial services accrue to businesses and consumers, requires effective framework of regulation and competition (both domestically and internationally), and good governance and accountability among financial institutions themselves.
The Government is taking a leading role in the international reform agenda, working 1.14 with its G20 and European partners. Budget 2010 announces:
principles to guide international work on a systemic risk tax which will •ensure that the activities of financial institutions reflect the costs associated with systemic risk as well as helping to meet the wider costs of crises; and
the Government will formally consult on draft regulations to require •enhanced disclosure of remuneration in the financial services sector, and will consider whether the tools available to shareholders to effectively control executive remuneration need to be strengthened, including greater upfront approval of the terms under which employees are remunerated.
The Government is committed to ensuring that the supply of lending to the economy 1.15 supports the recovery. Budget 2010 announces:
the agreement of Lloyds Banking Group and The Royal Bank of Scotland to •lend £105 billion to homebuyers and businesses over the next 12 months. £41 billion of this will be lent to small businesses;
the creation of a Small Business Credit Adjudicator with statutory powers to •enforce its judgements. The Adjudicator will work closely with an expanded Financial Intermediary Service to ensure that small businesses are treated fairly when applying for loans; and
steps to help companies diversify sources of finance to non bank lending •channels.

eFSr O v e r v i e w 1
5Budget 2010
The Government is committed to promoting competition in the financial services 1.16 sector in order to drive efficiency and choice for consumers. Through the divestments from Lloyds Banking Group and The Royal Bank of Scotland, and the return of the Northern Rock bank business to the private sector, competition in the marketplace will increase substantially.
Effective competition is also promoted by informed consumers, and the Government 1.17 is committed to ensuring that consumers have access to appropriate financial services and are properly equipped to exercise a choice. Budget 2010 announces that the Government will:
introduce a new right to open a basic bank account;•
increase the contribution made by the banks to the community lending •sector; and
ask the Retail Financial Services Forum to consider to what extent financial •services firms’ staff targets and incentives lead to poor outcomes for consumers and employees and how they can be reformed.
SUPPORT ING BUS INESS AND GROWTH
The Government took decisive action to support the economy during the financial 1.18 crisis and its aftermath. As the UK emerges from recession, it remains vital to maintain some targeted assistance to support the recovery through 2010. This Budget announces action to promote sustainable economic growth over the decade ahead, by providing a stable platform for growth and through targeted government action to unlock private sector investment. These measures will support start-ups and small and medium-sized enterprises (SMEs), position the UK as a leading centre for research and innovation, and ensure that the UK is equipped with skills for growth and the infrastructure it needs to be successful in a low-carbon economy. The Government is:
continuing to offer Time to Pay arrangements, which will help viable •businesses spread their tax payments as part of a package of measures that continue to support business through recovery;
support start-ups, SMEs and growing businesses by providing a temporary •increase in the level of small business rate relief; launching UK Finance and Growth to oversee more than £4 billion of the Government’s SME finance products including the Growth Capital Fund; doubling the Annual Investment Allowance to £100,000 and the Entrepreneurs’ Relief lifetime limit to £2 million;
launching a University Enterprise Capital Fund to exploit the commercial •potential of the UK’s world-class research base; and, subject to state aid clearance, introducing a tax relief for the UK’s video games industry;
providing a £270 million Modernisation Fund to drive efficiencies in Higher •Education and fund the teaching costs of 20,000 extra undergraduate places in key courses in September 2010; and
meeting the UK’s infrastructure and energy challenges by: publishing a •Strategy for national infrastructure, including an intention to create a Green Investment Bank; acting on the findings of the Energy Market Assessment; creating a £120 million grant for Accelerated Development Zones; providing
1 O v e r v i e w eFSr
6 Budget 2010
a £100 million fund to repair local roads following recent cold weather; and investing £250 million in the road network to improve capacity.
ACHIEV ING FA IRNESS AND PROV ID ING OPPORTUNITY
The Government has taken swift and wide-ranging steps to support the UK economy 1.19 in response to the global downturn, which helped to ensure that growth returned at the end of 2009. Unemployment has risen far less than many external forecasters expected at the beginning of the downturn, and 47,000 fewer people are claiming Jobseeker’s Allowance now than in October 2009. As the UK emerges from the downturn, the Government will continue to work to foster recovery by providing targeted support to those who need it most. In particular, the Government announces the following measures to help households through the recovery:
extending the Young Person’s Guarantee after March 2011 to ensure that •young people adversely affected by the recession continue to be guaranteed a Future Jobs Fund job, training or work experience if they cannot find work within six months;
increased support through tax credits for families with children aged one •and two;
continuing to provide an additional payment alongside the Winter Fuel •Payment in 2010-11, worth £100 to households with someone aged over 80, or £50 if someone is over the female State Pension Age;
extending the temporary freeze in the Standard Interest Rate applied to the •Support for Mortgage Interest scheme until December 2010; and
a two-year stamp duty land tax relief for first-time buyers, for residential •property purchasers up to £250,000.
Alongside the substantial support provided, the Government is setting policy to 1.20 create the right economic environment to promote stability and growth in the medium term. Key actions include:
a comprehensive strategy to promote savings, including the launch of the •Saving Gateway in July 2010 and the indexation of ISA limits over the next Parliament; and
publishing • Ending Child Poverty; Mapping the Route to 2020 alongside Budget 2010, setting out ways that child poverty could be reduced in line with the 2020 target.
The Government is also ensuring that it lives within its means in a way that is fair 1.21 and responsible. On the back of previously announced fiscal consolidation measures, Budget 2010 announces:
the introduction of an additional 5 per cent of stamp duty land tax for •residential property over £1 million from 2011-12;
an extension of the freeze in the inheritance tax allowance of £325,000 until •2014-15; and
details of the operation of the restriction of pensions tax relief for those on •high incomes.
eFSr O v e r v i e w 1
7Budget 2010
Tobacco duty rates will increase by 1 per cent above inflation from today and by 1.22 2 per cent above inflation for the next four years. Cider duty rates will increase by 10 per cent above inflation. Other alcohol duty rates will increase by 2 per cent above inflation as announced at Budget 2008. In addition, all alcohol duty rates will increase by 2 per cent above inflation for two further years, until 2014-15.
PROTECT ING PUBL IC SERV ICES
The Government’s short-term priority, as Britain emerges from recession, is to 1.23 foster economic recovery whilst continuing to provide targeted support to those families and businesses that need it most. Budget 2010 announces new measures to stimulate economic growth, including a £270 million university Modernisation Fund to finance 20,000 additional student places and £450 million to extend to March 2012 the guarantee of a job, training or work placement for every 18 to 24 year old who has been claiming Job Seeker’s Allowance for six months. Budget 2010 also announces that pensioner households will receive an extra payment alongside the Winter Fuel Payment later this year.
For the medium term, Budget 2010 sets out further details on the Government’s 1.24 plans to protect key public service priorities whilst meeting its commitment to halve public sector net borrowing over the next four years. Planned levels of overall spending in 2010-11 will continue to rise, supporting the economy through recovery, but from 2011-12 spending growth will be slower. Public sector current expenditure will grow at an average of 0.8 per cent a year from 2011-12 to 2014-15 and public sector net investment will fall to 1¼ per cent of GDP by 2013-14.
Budget 2010 confirms that spending on frontline schools and NHS, 16 to 19 1.25 education and Sure Start will be protected in the years to 2012-13, with sufficient funding provided to maintain police officer numbers. At the same time, Budget 2010 announces further details of the tough choices the Government is making elsewhere, including:
action to control public sector pay, including confirming a one per cent cap •on basic pay uplifts for 2011-12 and 2012-13, saving £3.4 billion a year, and a new Code of Practice on senior pay-setting, with greater use of independent Remuneration Committees and escalation of decisions to ministers, or audit and regulatory bodies, where there is a proposal to pay above agreed norms;
£11 billion of operational efficiencies and other cross-cutting savings, to •streamline the centre of government;
further detail on £5 billion of savings from targeting and prioritising •spending, as announced at the 2009 Pre-Budget Report;
reforms to the welfare system to increase fairness and improve work •incentives, further reducing social security spending over the next five years on top of the existing forecast saving of £1.2 billion;
rationalising regional structures and removing burdens on local •government, including giving local authorities new discretion over £1.3 billion of funding that is currently ring-fenced; and
plans to manage assets and property more effectively by creating new •strategic property vehicles by April 2011, to help realise savings of £5 billion a year in property running costs and £20 billion savings in assets disposal by 2020. The Government will also relocate 15,000 civil service jobs out of central London within five years.
1 O v e r v i e w eFSr
8 Budget 2010
SECURING LOW CARBON GROWTH
The Government is building a platform for strong, long-term, sustainable growth. 1.26 Support for the low-carbon economy is central to this as it will provide new opportunities in key growth industries of the future. In the past year, the Government has announced £1.8 billion of extra support for low-carbon sectors. This will enable £15 billion of additional low-carbon investment, providing new opportunities for business growth, boosting innovation and creating new high skilled jobs.
The Government has an important role to play in enabling the investment needed 1.27 for the transition to a low-carbon economy – particularly in the energy sector, where the scale of investment challenge is unprecedented. To support the financing of low-carbon investment and new low-carbon jobs, Budget 2010 announces:
a commitment to reform the energy market to provide clean, secure and •affordable energy in the long term. The Government will bring forward proposals this autumn, with a White Paper by spring 2011; and in the shorter term, a summer consultation on mechanisms to provide greater certainty for low-carbon investment;
to address emerging equity finance gaps, the Government intends to •create a Green Investment Bank, with a mandate to invest low-carbon infrastructure. The Government will start by investing up to £1 billion from the sale of infrastructure-related assets and will seek to match this with at least £1 billion of private sector investment;
the launch of UK Finance and Growth to streamline the Government’s SME •finance support – including to help businesses seeking to commercialise low-carbon technologies;
up to £60 million for the development of port sites to support offshore wind •turbine manufacturers looking to locate new facilities in the UK and secure low-carbon manufacturing jobs;
a commitment to reduce government departments’ carbon emissions •by at least 30 per cent by 2020, and enabling energy efficiency finance to help millions of homes save money energy by developing Pay As You Save arrangements; and
a halving in company car tax for ultra-low carbon cars for five years from •April 2010, to contribute to making the UK one of the best places in the world to design and build low-carbon vehicles.
To drive transition to a low-carbon and resource-efficient economy, while also 1.28 contributing to the Government’s plans for fiscal consolidation, Budget 2010 announces:
that, to ease pressure on business and household incomes at a time when •other prices are rising, the main fuel duty increase for 2010 will be staged, with an increase of one penny per litre on 1 April and one penny per litre on 1 October 2010, then 0.76 pence per litre on 1 January 2011. Fuel duty will also rise by one penny per litre in real terms on 1 April each year from 2011 to 2014; and
an £8 per tonne increase in the standard rate of landfill tax on 1 April 2014, •to encourage alternatives to landfill.
eFSr O v e r v i e w 1
9Budget 2010
BUDGET MEA SURES AND THE IMPACT ON HOUSEHOLDS
The Government remains committed to supporting households who need it most 1.29 whilst consolidating the public finances.
In 2010-11, above indexation increases in tax credits, Child Benefit and disability 1.30 benefits will provide additional support to low earners, families with children and disabled families, and pensioners will benefit by a 2.5 per cent increase in the basic state pension.
Above indexation increases in tax credits and child benefit will mean that in 2010-11 1.31
A single earner family on half-median earnings (£13,000) with no children •will be better off by £70 a year1;
A single earner family on median earnings (£26,000) with 2 children will be •better off by £230 a year;
A lone parent on half-median earnings with 2 children will be better off by •£230 a year.
Since 1997, on average households net income has increased by an estimated £1,450 1.32 in 2010-11, compared with the 1997-98 tax and benefit system indexed to 2010-11 prices.
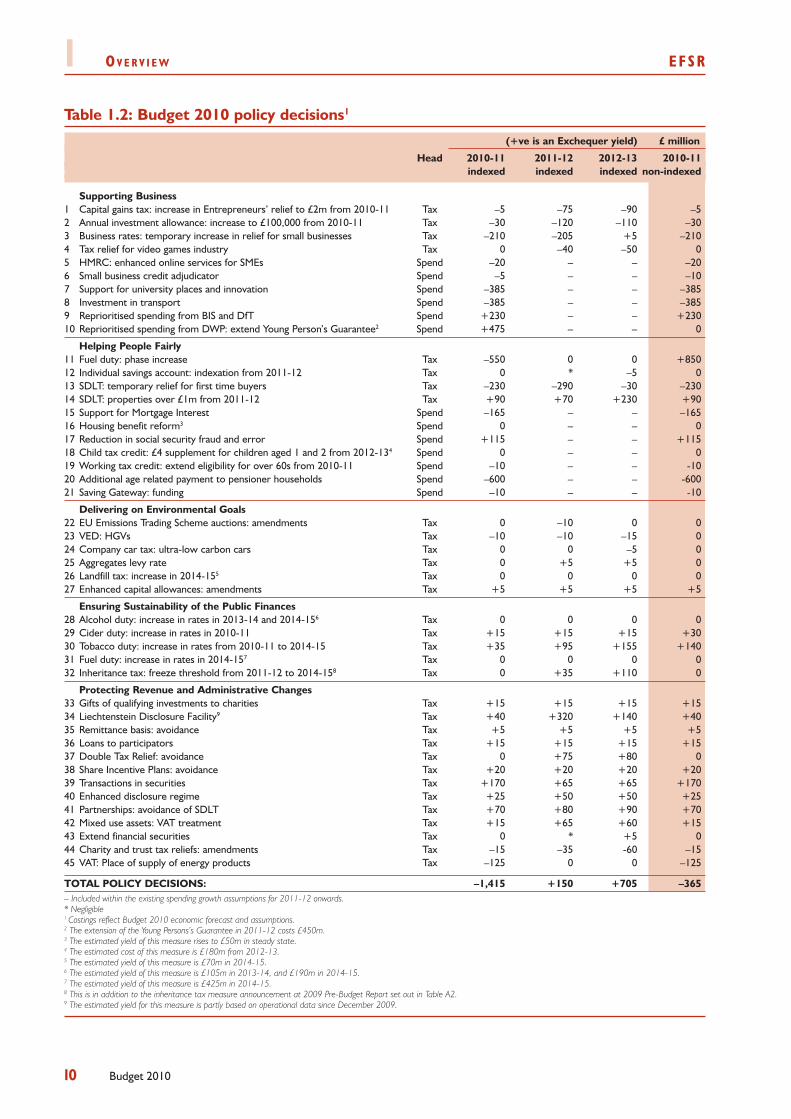
Consistent with the requirements of the 1.33 Code for fiscal stability, the updated public finance projections in Budget 2010 take into account the fiscal effects of all firm decisions announced in the Budget. The fiscal impact of Budget policy decisions is set out in Table 1.2.
1 HM Treasury assumptions.
1 O v e r v i e w eFSr
10 Budget 2010
Table 1.2: Budget 2010 policy decisions1
(+ve is an Exchequer yield) £ million
Head 2010-11 2011-12 2012-13 2010-11 indexed indexed indexed non-indexed
Supporting Business1 Capital gains tax: increase in Entrepreneurs’ relief to £2m from 2010-11 Tax –5 –75 –90 –52 Annual investment allowance: increase to £100,000 from 2010-11 Tax –30 –120 –110 –303 Business rates: temporary increase in relief for small businesses Tax –210 –205 +5 –2104 Tax relief for video games industry Tax 0 –40 –50 05 HMRC: enhanced online services for SMEs Spend –20 – – –206 Small business credit adjudicator Spend –5 – – –107 Support for university places and innovation Spend –385 – – –3858 Investment in transport Spend –385 – – –3859 Reprioritised spending from BIS and DfT Spend +230 – – +23010 Reprioritised spending from DWP: extend Young Person’s Guarantee2 Spend +475 – – 0
Helping People Fairly11 Fuel duty: phase increase Tax –550 0 0 +85012 Individual savings account: indexation from 2011-12 Tax 0 * –5 013 SDLT: temporary relief for first time buyers Tax –230 –290 –30 –23014 SDLT: properties over £1m from 2011-12 Tax +90 +70 +230 +9015 Support for Mortgage Interest Spend –165 – – –16516 Housing benefit reform3 Spend 0 – – 017 Reduction in social security fraud and error Spend +115 – – +11518 Child tax credit: £4 supplement for children aged 1 and 2 from 2012-134 Spend 0 – – 019 Working tax credit: extend eligibility for over 60s from 2010-11 Spend –10 – – -1020 Additional age related payment to pensioner households Spend –600 – – -60021 Saving Gateway: funding Spend –10 – – -10
Delivering on Environmental Goals22 EU Emissions Trading Scheme auctions: amendments Tax 0 –10 0 023 VED: HGVs Tax –10 –10 –15 024 Company car tax: ultra-low carbon cars Tax 0 0 –5 025 Aggregates levy rate Tax 0 +5 +5 026 Landfill tax: increase in 2014-155 Tax 0 0 0 027 Enhanced capital allowances: amendments Tax +5 +5 +5 +5
Ensuring Sustainability of the Public Finances28 Alcohol duty: increase in rates in 2013-14 and 2014-156 Tax 0 0 0 029 Cider duty: increase in rates in 2010-11 Tax +15 +15 +15 +3030 Tobacco duty: increase in rates from 2010-11 to 2014-15 Tax +35 +95 +155 +14031 Fuel duty: increase in rates in 2014-157 Tax 0 0 0 032 Inheritance tax: freeze threshold from 2011-12 to 2014-158 Tax 0 +35 +110 0
Protecting Revenue and Administrative Changes33 Gifts of qualifying investments to charities Tax +15 +15 +15 +1534 Liechtenstein Disclosure Facility9 Tax +40 +320 +140 +4035 Remittance basis: avoidance Tax +5 +5 +5 +536 Loans to participators Tax +15 +15 +15 +1537 Double Tax Relief: avoidance Tax 0 +75 +80 038 Share Incentive Plans: avoidance Tax +20 +20 +20 +2039 Transactions in securities Tax +170 +65 +65 +17040 Enhanced disclosure regime Tax +25 +50 +50 +2541 Partnerships: avoidance of SDLT Tax +70 +80 +90 +7042 Mixed use assets: VAT treatment Tax +15 +65 +60 +1543 Extend financial securities Tax 0 * +5 044 Charity and trust tax reliefs: amendments Tax –15 –35 -60 –1545 VAT: Place of supply of energy products Tax –125 0 0 –125
TOTAL POLICY DECISIONS: –1,415 +150 +705 –365– Included within the existing spending growth assumptions for 2011-12 onwards.* Negligible1 Costings reflect Budget 2010 economic forecast and assumptions.2 The extension of the Young Persons’s Guarantee in 2011-12 costs £450m.3 The estimated yield of this measure rises to £50m in steady state.4 The estimated cost of this measure is £180m from 2012-13.5 The estimated yield of this measure is £70m in 2014-15.6 The estimated yield of this measure is £105m in 2013-14, and £190m in 2014-15.7 The estimated yield of this measure is £425m in 2014-15.8 This is in addition to the inheritance tax measure announcement at 2009 Pre-Budget Report set out in Table A2.9 The estimated yield for this measure is partly based on operational data since December 2009.
eFSr O v e r v i e w 1
11Budget 2010
GOVERNMENT SPENDING AND REVENUE
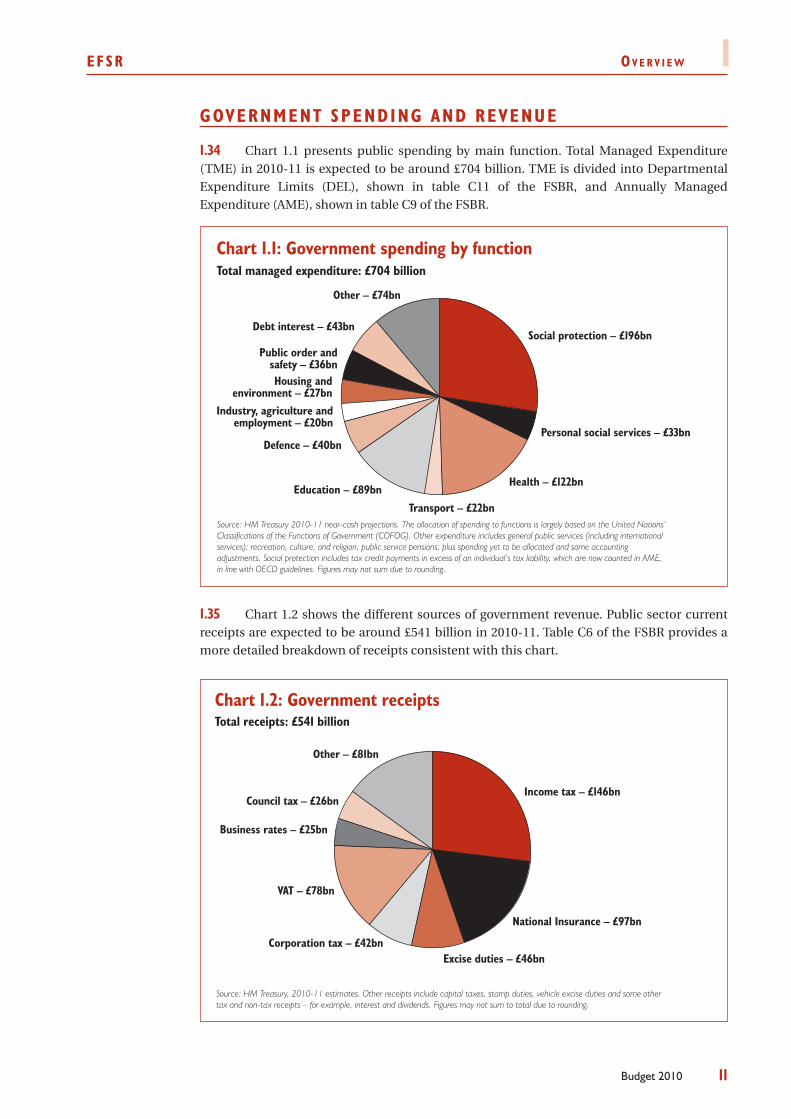
Chart 1.1 presents public spending by main function. Total Managed Expenditure 1.34 (TME) in 2010-11 is expected to be around £704 billion. TME is divided into Departmental Expenditure Limits (DEL), shown in table C11 of the FSBR, and Annually Managed Expenditure (AME), shown in table C9 of the FSBR.
Chart 1.1: Government spending by function
Other – £74bn
Debt interest – £43bn
Public order and safety – £36bn
Housing andenvironment – £27bn
Industry, agriculture and employment – £20bn
Defence – £40bn
Education – £89bn
Transport – £22bn
Health – £122bn
Personal social services – £33bn
Social protection – £196bn
Total managed expenditure: £704 billion
Source: HM Treasury 2010-11 near-cash projections. The allocation of spending to functions is largely based on the United Nations’ Classifications of the Functions of Government (COFOG). Other expenditure includes general public services (including international services); recreation, culture, and religion; public service pensions; plus spending yet to be allocated and some accounting adjustments. Social protection includes tax credit payments in excess of an individual’s tax liability, which are now counted in AME, in line with OECD guidelines. Figures may not sum due to rounding.
Chart 1.2 shows the different sources of government revenue. Public sector current 1.35 receipts are expected to be around £541 billion in 2010-11. Table C6 of the FSBR provides a more detailed breakdown of receipts consistent with this chart.
Chart 1.2: Government receiptsTotal receipts: £541 billion
Source: HM Treasury, 2010-11 estimates. Other receipts include capital taxes, stamp duties, vehicle excise duties and some other tax and non-tax receipts – for example, interest and dividends. Figures may not sum to total due to rounding.
Other – £81bn
Council tax – £26bn
Business rates – £25bn
VAT – £78bn
Corporation tax – £42bnExcise duties – £46bn
National Insurance – £97bn
Income tax – £146bn

12 Budget 2010
13Budget 2010
2 M a i n ta i n i n g M a c r o e c o n o M i c s ta b i l i t y
The global economy is in the early stages of recovery following the most severe and synchronised downturn since the Great Depression in the 1930s. The UK economy stabilised in the second half of 2009, aided by the significant macroeconomic policy stimulus and government intervention in the financial system. In line with the judgement made in Budget 2009 and the 2009 Pre-Budget Report (PBR), UK output returned to modest growth in the final quarter of 2009. The Government’s forecast for GDP growth remains largely unchanged from the 2009 Pre-Budget Report with slightly lower growth in 2011 reflecting weaker growth in UK export markets. While extreme downside risks to the economy have receded over the year, the Budget 2010 economic forecast remains subject to significant uncertainty and risks. Macroeconomic policy will continue to support the economy throughout this year; monetary policy, in particular, is expected to continue to provide an ongoing and powerful stimulus.
In recent months, tax receipts have been higher than expected in Budget 2009 and the 2009 Pre-Budget Report. As a result, public sector net borrowing in 2009-10 is now projected to be £11 billion lower than forecast in the Pre-Budget Report. That contributes to a fall in the net financing requirement in 2009-10 and 2010-11, which means that the remit for gilt sales in 2010-11 is £25.7 billion lower than projected in the Pre-Budget Report.
The policies announced in Budget 2010 are fiscally neutral, providing further support for growth in 2010-11, balanced by measures that raise revenue in later years. Discretionary policy delivers a £1.4 billion loosening in 2010-11, more than offset by tightening in later years, building to a £1.6 billion tightening in 2014-15. Forecast and policy changes in Budget 2010 result in a lower path for borrowing and debt in each year of the forecast period relative to Budget 2009. The Budget forecast shows:
PSNB declining to 5.2 per cent of GDP in 2013-14 and 4.0 per cent in 2014-15;•cyclically-adjusted or ‘structural’ net borrowing falling from 8.4 per cent of GDP in 2009-10 •to 2.5 per cent in 2014-15, a reduction of more than two-thirds over the forecast horizon; and
net debt projected at 74.5 per cent of GDP in 2013-14, £100 billion lower than the Budget •2009 forecast, and peaking in 2014-15 at 74.9 per cent of GDP.
The Fiscal Responsibility Act (FRA) has passed into law, setting a ceiling for public sector net borrowing in 2013-14 and a requirement for debt to be falling in 2015-16. Budget 2010 provides a margin of flexibility against these requirements should future revenues turn out to be lower than expected. If the economy performs better than expected, the Government will be able to reduce the structural deficit more quickly than the path shown in this Budget.
Budget 2010 makes further progress in setting out the detail of the Government’s fiscal consolidation plans, including further details of how the Government will deliver lower growth in public spending. Following the passage of Finance Bill 2010 the Government intends that around half of the tax measures that have been announced as part of the consolidation plan will have been passed into legislation.
ECONOMIC DEVELOPMENTS AND PROSPECTS
2.1 After successive shocks from commodity markets and the global financial system, G20 policy action and unprecedented co-ordination has helped to stabilise financial markets and demand, boosting short-term global prospects. However, the nascent recovery remains fragile and there is a marked difference in the pace of recovery between advanced and emerging economies.
World recovery
2 M a i n ta i n i n g M a c r o e c o n o M i c s ta b i l i t y eFsr
14 Budget 2010
The return to growth has been largely driven by two common factors in most countries 2.2 outside Asia: stimulus measures and a turn in the inventory cycle. While financial sector interventions have helped to improve conditions in financial markets, expansionary monetary and fiscal policies have helped to stabilise demand and firms have been able to reduce stocks at a slower pace, helping to boost growth. This impetus from inventories may be uneven but is likely to continue well into 2010, as will the effects of fiscal and monetary stimulus.
The capacity of private demand to drive growth will be key in determining the 2.3 prospects for the global economy and recent data show tentative signs of a recovery. The global manufacturing purchasing managers survey compiled by JP Morgan reached a five and a half year high in early 2010 and world trade in goods has risen sharply. According to the CPB Netherlands Bureau for Economic Analysis, world trade rose by 6 per cent in the fourth quarter of 2009, the fastest quarterly growth since records began in 1991. Improvements in the global economy have also been reflected in global financial markets, with the gains made during 2009 being consolidated since the 2009 Pre-Budget Report. In particular, world stock prices remain over 60 per cent above their February 2009 level, helping to reinforce confidence.
Maintaining confidence and reducing uncertainty will be essential to the continued 2.4 recovery in private sector demand. Recent events have shown how quickly risk appetite can be reversed and how fragile financial market sentiment in the recovery can be.
2.5 The Budget forecast for growth in the world economy remains largely unchanged from the 2009 Pre-Budget Report, although growth in the euro area and UK export markets is somewhat weaker. The world economy is estimated to have contracted by 1 per cent in 2009, the largest annual fall in the post-war era. This is broadly in line with the forecast at Budget 2009. The world economy is forecast to grow by 3¼ per cent in 2010, before rising to 4¼ per cent in 2011 and 2012. Almost 80 per cent of global growth in 2010 is likely to be generated by emerging economies with the G7 economies set to experience a more modest rebound, growing by 1¾ per cent in 2010, 3 per cent in 2011 and 3¼ per cent in 2012. Consistent with below trend growth in 2010 and downward pressure on prices from large negative output gaps, G7 inflation is forecast to remain subdued.
2.6 In response to the downturn in the UK, the Government has:
undertaken major interventions to restore and maintain the stability of the •banking system and ensure the ongoing supply of credit to the economy. This action has been crucial in averting the more severe downside risks to the economy and supporting recovery;
authorised the Bank of England to provide monetary support to the economy •through a £200 billion programme of asset purchases;
implemented a fiscal stimulus of 1 per cent of GDP in 2009-10 and allowed •the automatic stabilisers to operate in full, contributing to total fiscal support of almost 5 per cent of GDP in that year; and
provided targeted support for businesses and individuals, including through •support for jobs, homeowners and businesses facing cash-flow problems.
The authorities’ actions have been successful in helping to limit the severity of 2.7 the downturn and its impact on businesses and individuals. The UK economy returned to growth in the fourth quarter of 2009 and evidence suggests that:
while the unemployment rate has risen to 7.8 per cent, this compares with •almost 10 per cent in the US and euro area and is also lower than at the same
Global prospects
Government action to stabilise
the UK economy
eFsr M a i n ta i n i n g M a c r o e c o n o M i c s ta b i l i t y 2
15Budget 2010
stage following the 1990s recession in the UK. The claimant count reached 1.6 million at the end of 2009, almost half a million lower than the average of independent forecasters expected at the time of Budget 2009; 1
repossessions are below forecast levels: the Council of Mortgage Lenders •(CML) revised down its forecast for repossessions in 2009 from an initial 75,000. The final number of repossessions in the year was 46,000 according to the CML. The rate of repossessions has been around half that of the 1990s recession; and
the annual rate of company liquidations remains well below its peak in the •1990s recession, at 0.9 per cent in the fourth quarter of 2009, compared with a peak of 2.6 per cent in the 1990s recession.
2.8 During the early stages of the recovery, the significant macroeconomic stimulus in place will continue to support the UK economy. Bank Rate is at a historically low level and, together with the feed-through to the economy of the Bank’s programme of asset purchases, it is expected to continue to provide an ongoing and powerful stimulus throughout this year. Government borrowing of 11.1 per cent of GDP will also continue to support the level of economic activity in 2010-11.
2.9 Recent events have demonstrated the close ties between the financial sector and the economy, as well as the interconnected nature of global financial markets. As set out in Chapter 3, Government action to reform financial services is now focused on enhancing the stability and resilience of financial markets for the long term and ensuring that the economy, and businesses within it, have access to finance for future growth. An update on international work on macro-prudential regulation is provided in Box 2.1.
Setting a credible fiscal consolidation plan to ensure sustainable public finances is a 2.10 key part of the Government’s macroeconomic strategy and is essential for economic stability and the long-term health of the economy. Sound public finances provide the conditions for growth, helping to maintain low long-term interest rates and giving businesses the confidence to plan and invest for the future. The Government’s consolidation path has been embedded in legislation through the Fiscal Responsibility Act. A detailed update on the Government’s fiscal strategy is provided later in this chapter.
2.11 The UK economy stabilised in the second half of 2009, following a substantial fall in output in the wake of the global financial crisis. The cumulative decline in output over the recession is estimated at around 6 per cent. This is similar to the loss in output seen in the 1980s recession, but greater than the fall in output in the early 1990s. Through 2009, the pace of decline eased as the substantial policy stimulus fed through into the economy and global and domestic confidence picked up. In line with the Budget 2009 and 2009 Pre-Budget Report forecasts, the UK economy returned to growth in the final quarter of 2009. The Office for National Statistics (ONS) estimate GDP to have risen by 0.3 per cent in the fourth quarter, as government consumption continued to support the economy and household consumption rose. Nominal GDP rose by 1.9 per cent in the second half of 2009, although in the fourth quarter it remained 3 per cent below its pre-recession peak in the second quarter of 2008. Nominal GDP did not fall in the 1980s and 1990s recessions.
Although bad weather has complicated the assessment, a range of measures suggests 2.12 output continued to recover at the start of 2010. Consumer and business confidence measures have improved and labour market indicators have started to stabilise at a relatively
1 Forecast for the UK economy: a comparison of independent forecasts, HM Treasury, April 2009.
Support for recovery
Ensuring economic
stability
Recent economic developments in
the UK
2 M a i n ta i n i n g M a c r o e c o n o M i c s ta b i l i t y eFsr
16 Budget 2010
early stage in the recovery. The latest estimate from the National Institute of Economic and Social Research suggests that output rose by 0.3 per cent over the three months to February.2
Consumer price inflation has increased from its trough of 1.1 per cent in September 2.13 2009, as expected in the 2009 Pre-Budget Report forecast. CPI inflation reached 3.5 per cent in January 2010, reflecting higher fuel prices and the change in the VAT rate, but it fell back to 3.0 per cent in February.
Box 2.1: Macro-prudential regulation
Financial markets have shown they are prone to ‘pro-cyclicality’ – periods of overly accommodative lending conditions in good times, and overly restrictive conditions in downturns. This can amplify the economic cycle, making the expansion phase stronger and the following downturn more severe.
Given the global nature of financial markets, and the ease with which banks and financial institutions can transfer internal resources, any country acting alone is unlikely to be very effective. It is essential, therefore, that governments work together to deepen their understanding of domestic and global financial markets and to develop policy tools to mitigate risks from pro-cyclical behaviour. The Basel Committee on Banking Supervision (Basel) and the European Commission are taking this work forward, and both have published papers addressing macro-prudential regulation since the autumn.a
Both the Basel and the European Commission papers discuss a similar range of potential counter-cyclical measures. These include measures to:
ensure banks make forward-looking provisions, so that they put aside money for potential •future losses on loans even in the good times;
ensure banks build counter-cyclical capital buffers, so that during the upswing of the •economic cycle they are required to raise their capital ratios, providing a buffer which can be used to absorb losses during the downturn; and
reduce the cyclicality of banks’ minimum capital requirements by adjusting regulatory capital •risk weights. This is because the minimum capital requirement currently has the potential to be pro-cyclical, allowing banks to run down the level of capital they hold during the upswing and requiring them to increase their capital during the downturn.
These are all regulatory tools that were identified in Reforming financial markets,b and the Government welcomes their discussion in international fora. In addition, at the European level member states have agreed to establish a European Systemic Risk Board, which will monitor systemic risks to financial stability. At a global level, the International Monetary Fund and the Financial Stability Board are taking forward work to identify and rectify gaps in data collection in order to improve monitoring of developments in the financial system as a whole.
The Government is working closely with the Bank of England and the Financial Services Authority to take this work forward in Basel and in Europe. The European Commission is expected to publish proposals in July this year; Basel proposals are likely to continue to be developed throughout 2010. The Council for Financial Stability will play an important role in coordinating the work of the regulatory authorities in responding to the challenges of managing systemic risk, both in the UK and internationally.
a Strengthening the resilience of the banking sector, Basel Committee on Banking Supervision consultative document, December 2009; and Possible further changes to the capital requirements directive, European Commission staff working paper, February 2010.b Reforming Financial Markets, HM Treasury, July 2009.
2 NIESR monthly estimate of GDP, National Institute of Economic and Social Research, 10 March 2010.
2.1
2.2
eFsr M a i n ta i n i n g M a c r o e c o n o M i c s ta b i l i t y 2
17Budget 2010
2.14 The Budget 2010 economic forecast is underpinned by the following assumptions, that:
the G20 continues to deliver on policy commitments, which are effective and •support a robust recovery in the world economy. UK export market growth is notably weaker than world trade growth reflecting the relatively slower recovery in the UK’s largest trading partner, the euro area;
fiscal policy supports the level of economic activity through 2010, before •tightening from 2011 onwards to ensure sound public finances and to facilitate the rebalancing of private and public sector contributions to demand;
through the course of 2010, the price of credit continues to return closer to •historical norms, adjusted for a general re-pricing of risk, and that credit availability continues to improve;
the positive impact of the monetary policy stimulus will continue to support •demand in the economy throughout the forecast horizon, with market expectations suggesting Bank Rate will remain historically low; and
the shape of the recovery in the UK economy reflects an orderly adjustment •in sectoral financial balances, and a rebalancing between domestic and external demand supported by sterling’s depreciation.
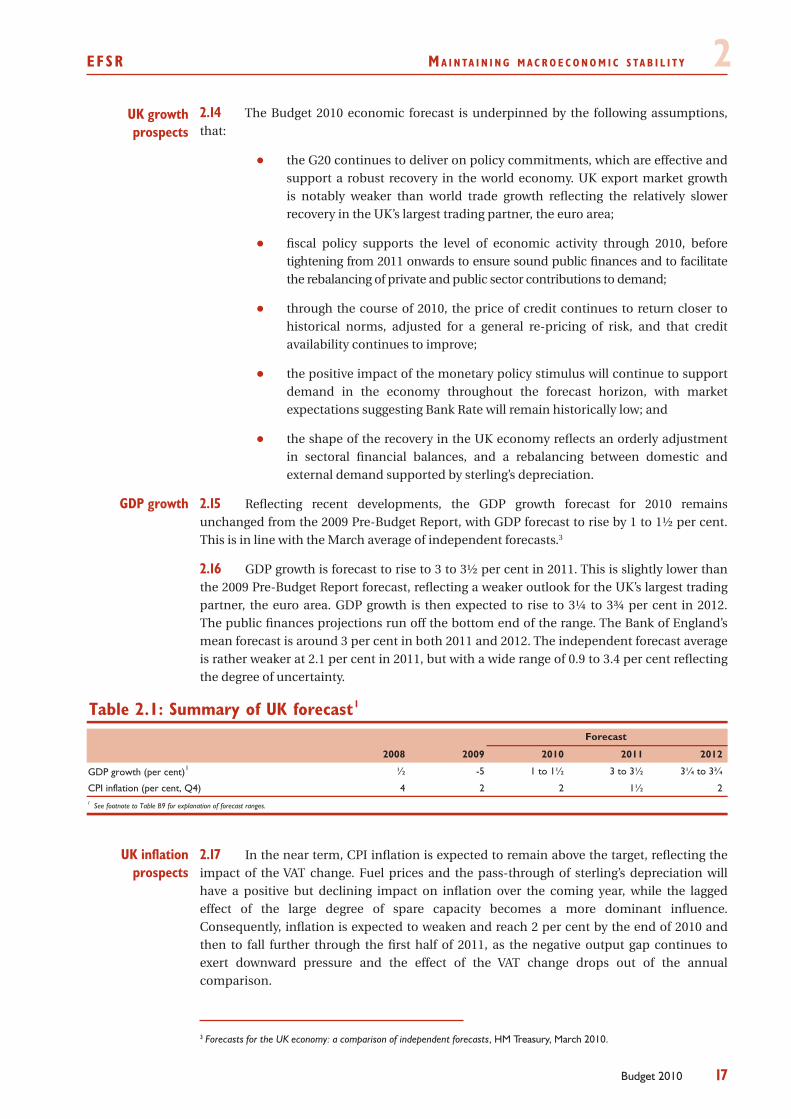
2.15 Reflecting recent developments, the GDP growth forecast for 2010 remains unchanged from the 2009 Pre-Budget Report, with GDP forecast to rise by 1 to 1½ per cent. This is in line with the March average of independent forecasts.3
GDP growth is forecast to rise to 3 to 3½ per cent in 2011. This is slightly lower than 2.16 the 2009 Pre-Budget Report forecast, reflecting a weaker outlook for the UK’s largest trading partner, the euro area. GDP growth is then expected to rise to 3¼ to 3¾ per cent in 2012. The public finances projections run off the bottom end of the range. The Bank of England’s mean forecast is around 3 per cent in both 2011 and 2012. The independent forecast average is rather weaker at 2.1 per cent in 2011, but with a wide range of 0.9 to 3.4 per cent reflecting the degree of uncertainty.
2008 2009 2010 2011 2012
GDP growth (per cent)1 ½ -5 1 to 1½ 3 to 3½ 3¼ to 3¾
CPI inflation (per cent, Q4) 4 2 2 1½ 21 See footnote to Table B9 for explanation of forecast ranges.
Forecast
Table 2.1: Summary of UK forecast1
2.17 In the near term, CPI inflation is expected to remain above the target, reflecting the impact of the VAT change. Fuel prices and the pass-through of sterling’s depreciation will have a positive but declining impact on inflation over the coming year, while the lagged effect of the large degree of spare capacity becomes a more dominant influence. Consequently, inflation is expected to weaken and reach 2 per cent by the end of 2010 and then to fall further through the first half of 2011, as the negative output gap continues to exert downward pressure and the effect of the VAT change drops out of the annual comparison.
3 Forecasts for the UK economy: a comparison of independent forecasts, HM Treasury, March 2010.
UK growth prospects
GDP growth
UK inflation prospects
2 M a i n ta i n i n g M a c r o e c o n o M i c s ta b i l i t y eFsr
18 Budget 2010
CPI inflation is expected to rise back to target by the end of 2012, as the economy 2.18 continues to grow at above trend rates, consistent with the mean forecast in the Bank of England’s February Inflation Report. Although a degree of spare capacity is expected to remain throughout the forecast, the resulting downward pressure on inflation is expected to be offset by the effect of the monetary policy framework anchoring inflation expectations close to the inflation target.
2.19 The economic forecast remains subject to significant uncertainty across a broad range of factors, including: the resolution of the global financial crisis and its impact on confidence and activity; and the implementation and effectiveness of the unprecedented global policy response to the economic downturn.
A key uncertainty over near-term prospects in the UK and globally relates to the 2.20 strength and sustainability of private sector demand. There is also uncertainty surrounding the impact of the global financial shock on the supply side of the economy and its compounding effect on the path of inflation.
The degree to which households try to increase saving further to rebuild their 2.21 finances, and the speed with which any further adjustment takes place, will also affect the strength of the recovery. Recent increases in financial asset prices, improved confidence and the stabilisation in the labour market should help to temper this. Business investment fell sharply last year, but the healthy aggregate financial position of the corporate sector has been sustained through the recession and should help support investment through the recovery. There are also upside and downside risks to the forecast related to the availability of credit and restoration of business and consumer confidence. These risks and their implications for the forecast are discussed in more detail in Chapter B.
MONETARY POL ICY ACT ION
2.22 Price stability is a precondition for high and stable levels of growth and employment. Monetary policy remains the key tool for the management of demand in the economy and therefore inflation. The monetary policy framework is based on four key principles:
clear and precise objectives. The primary objective of monetary policy is to •deliver price stability. The adoption of a single, symmetrical inflation target ensures that outcomes below target are treated as seriously as those above, so that monetary policy also supports the Government’s objective of high and stable levels of growth and employment;
full operational independence for the Monetary Policy Committee (MPC). •The Government reaffirms in Budget 2010 the target of 2 per cent for the 12-month increase in the Consumer Prices Index (CPI), which applies at all times;
openness, transparency, and accountability. These are enhanced through •publication of MPC members’ voting records, minutes of MPC meetings and quarterly Inflation Reports; and
credibility and flexibility to allow the MPC to decide how to react to events, •within the constraints of the inflation target and the open letter system. If inflation deviates by more than one percentage point above or below target, the Governor of the Bank of England must explain in an open letter to the Chancellor the reasons for the deviation, the action the MPC proposes to take, the expected duration of the deviation and how the proposed action meets the remit of the MPC.
Risks and uncertainty
The monetary policy framework
eFsr M a i n ta i n i n g M a c r o e c o n o M i c s ta b i l i t y 2
19Budget 2010
On 19 January 2009, the Government established the Asset Purchase Facility (APF) to 2.23 help increase the availability of corporate credit and to provide a framework for the MPC to use asset purchases for monetary policy purposes. With Bank Rate at historically low levels, the Chancellor authorised the use of the APF for monetary policy purposes on 3 March 2009. The objectives of the monetary policy framework have not changed with the use of this additional monetary policy instrument.
2.24 Monetary policy has been an important element of the overall support provided to the economy. The MPC has maintained Bank Rate at 0.5 per cent since March 2009, and undertaken a programme of asset purchases financed by the issuance of central bank reserves totalling £200 billion. The MPC has said that it will continue to monitor the appropriate scale of the asset purchase programme and further purchases would be made should the outlook warrant them.4
The stock of past purchases, together with the low level of Bank Rate, will continue 2.25 to impart a substantial monetary stimulus to the economy for some time to come. Although there remains uncertainty about the speed and strength with which the effects of the asset purchase programme are feeding through to the economy, developments in corporate debt markets and financial markets are consistent with its expected effects. For example, the APF would be expected to support higher asset prices, as investors use their increased money holdings to purchase other assets. Equity prices have risen by over 50 per cent since March 2009 while corporate bond yields have fallen significantly since early 2009, reflecting increased bond prices. Net corporate bond issuance in 2009 was 68 per cent higher than in 2008 and 26 per cent higher than in 2007. Asset purchases are also likely to have supported broad money growth, which has been stronger than might have been expected given the slowdown in nominal GDP growth.5
The Governor of the Bank of England wrote an open letter to the Chancellor on 15 2.26 February as CPI inflation rose to 3.5 per cent in January. The rise in inflation was largely the result of short-run factors, and it was expected to be temporary as the Chancellor acknowledged in his reply to the Governor.6 The MPC’s remit allows it to look through short-term movements in inflation.
2.27 Following the MPC’s decision to maintain the stock of asset purchases financed by the issuance of central bank reserves at £200 billion on 4 February, the Chancellor wrote to the Chairman of the Treasury Select Committee to confirm that the APF would continue to offer facilities for commercial paper, corporate bonds, and secured commercial paper.7 Purchases of these assets are now being financed by the issuance of Treasury bills, as set out in the Chancellor’s letter to the Governor of 29 January 2009. The Government confirms in Budget 2010 that the Asset Purchase Facility will remain in place in financial year 2010-11.
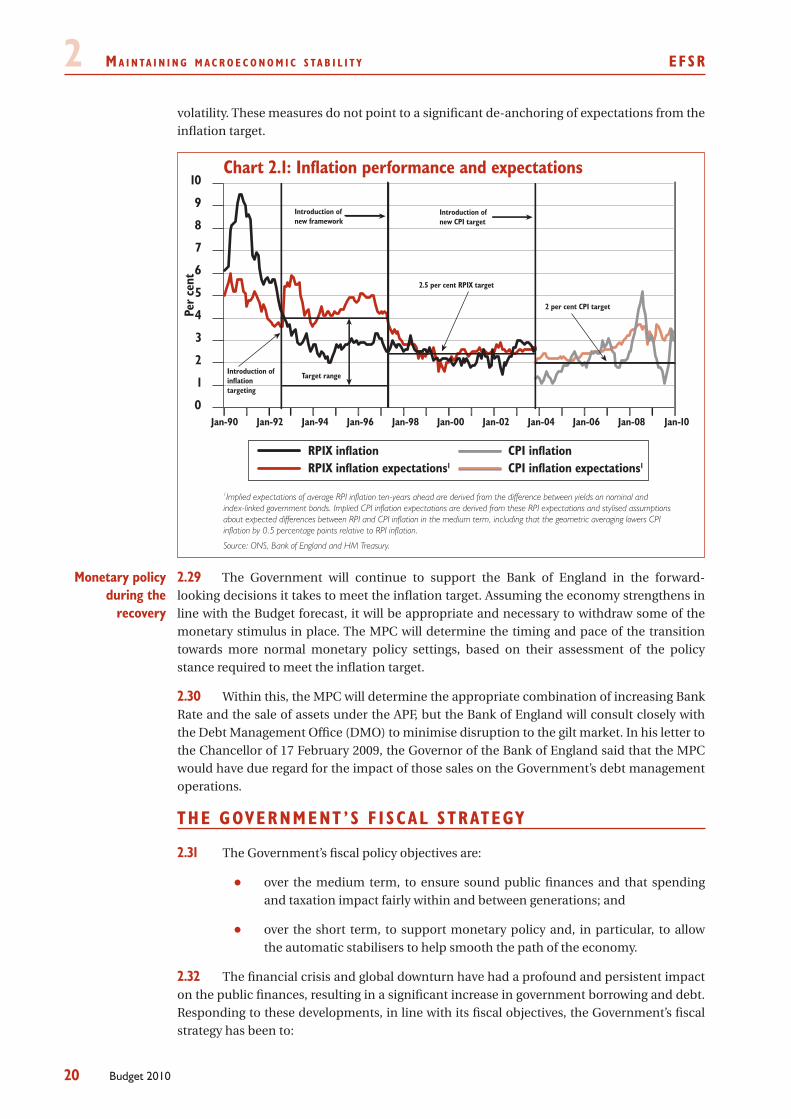
2.28 Inflation expectations for the medium to long term remain anchored to the CPI target, demonstrating the credibility that the monetary policy framework has built up since 1997. Both market and survey expectations of inflation have moved within a much smaller range than CPI inflation over the past year. For example, the YouGov/Citigroup measure of household expectations for five- to ten-years ahead has moved within a range of 0.4 percentage points while inflation has ranged 2.4 percentage points. Measures of inflation expectations derived from financial markets, as shown in Chart 2.1, can be affected by other market developments, including changes in market estimates of the wedge between RPI and CPI inflation, and have been more difficult to interpret given recent financial market
4 MPC News Release, 4 February 2010, available at www.bankofengland.co.uk.5 Interpreting monetary policy, D.Miles, February 2010.6 All open letters are available at www.hm-treasury.gov.uk.7 Available at www.hm-treasury.gov.uk.
Action taken by the MPC
The Asset Purchase Facility
Inflation expectations
2 M a i n ta i n i n g M a c r o e c o n o M i c s ta b i l i t y eFsr
20 Budget 2010
volatility. These measures do not point to a significant de-anchoring of expectations from the inflation target.
1Implied expectations of average RPI inflation ten-years ahead are derived from the difference between yields on nominal and index-linked government bonds. Implied CPI inflation expectations are derived from these RPI expectations and stylised assumptions about expected differences between RPI and CPI inflation in the medium term, including that the geometric averaging lowers CPI inflation by 0.5 percentage points relative to RPI inflation.
Source: ONS, Bank of England and HM Treasury.
Chart 2.1: Inflation performance and expectations
0
1
2
3
4
5
6
7
8
9
10
Jan-90 Jan-92 Jan-94 Jan-96 Jan-98 Jan-00 Jan-02 Jan-04 Jan-06 Jan-08 Jan-10
Per
cent
RPIX inflationRPIX inflation expectations1
CPI inflationCPI inflation expectations1
Introduction ofnew framework
Introduction ofnew CPI target
Introduction ofinflation targeting
2.5 per cent RPIX target
2 per cent CPI target
Target range
2.29 The Government will continue to support the Bank of England in the forward-looking decisions it takes to meet the inflation target. Assuming the economy strengthens in line with the Budget forecast, it will be appropriate and necessary to withdraw some of the monetary stimulus in place. The MPC will determine the timing and pace of the transition towards more normal monetary policy settings, based on their assessment of the policy stance required to meet the inflation target.
Within this, the MPC will determine the appropriate combination of increasing Bank 2.30 Rate and the sale of assets under the APF, but the Bank of England will consult closely with the Debt Management Office (DMO) to minimise disruption to the gilt market. In his letter to the Chancellor of 17 February 2009, the Governor of the Bank of England said that the MPC would have due regard for the impact of those sales on the Government’s debt management operations.
THE GOVERNMENT ’S F I SCAL STRATEGY
The Government’s fiscal policy objectives are:2.31
over the medium term, to ensure sound public finances and that spending •and taxation impact fairly within and between generations; and
over the short term, to support monetary policy and, in particular, to allow •the automatic stabilisers to help smooth the path of the economy.
The financial crisis and global downturn have had a profound and persistent impact 2.32 on the public finances, resulting in a significant increase in government borrowing and debt. Responding to these developments, in line with its fiscal objectives, the Government’s fiscal strategy has been to:
Monetary policy during the
recovery
eFsr M a i n ta i n i n g M a c r o e c o n o M i c s ta b i l i t y 2
21Budget 2010
base policy decisions on a realistic fiscal forecast, based on a range of •assumptions, some of which are designed to provide caution to allow for uncertainty;
set out a credible plan for delivering a sustained consolidation over the •medium term, to ensure sound public finances and create space in the short term for continued fiscal support;
ensure that the fiscal policy framework is set to deliver the Government’s •fiscal policy objectives given the outlook for the public finances and the economy; and
minimise the long-term cost of debt issuance, subject to risk, and reduce •refinancing risk, all else equal, by issuing a larger proportion of long-maturity and index-linked gilts.
The Government judges that this strategy remains appropriate in light of 2.33 developments since the 2009 Pre-Budget Report and continuing uncertainty. Budget 2010:
estimates that public sector net borrowing in 2009-10 is £11 billion lower than •forecast in the 2009 Pre-Budget Report. Net borrowing is also forecast to be lower in the later years of the forecast period;
is fiscally neutral over the forecast period and provides further detail on how •the Government’s consolidation plans will be delivered;
confirms that the Fiscal Responsibility Act has passed into law, requiring •a year-on-year reduction in borrowing to 2015-16, so that public sector net borrowing is more than halved over the four years to 2013-14, and debt is falling in 2015-16; and
projects a significant fall in the net financing requirement and required gilt •sales in 2010-11 relative to the 2009 Pre-Budget Report forecast. The Budget sets out the Government’s debt management strategy for 2010-11.
The f i s ca l ou t l ook2.34 The global financial crisis has resulted in a significant increase in borrowing relative to pre-crisis levels, which can be broken down into two categories:
temporary and cyclical borrowing: • the recession has caused a temporary increase in borrowing due to lower tax receipts and higher government spending, as the Government allows the automatic stabilisers to operate to support the economy. The temporary, discretionary measures that the Government has implemented to provide fiscal support to the economy also have a short-term impact on borrowing; and
cyclically-adjusted or ‘structural’ impacts: • the financial crisis has also had a more persistent impact on the public finances, due to its downward impact on the trend level of output in the economy, which is assumed to be just over 5 per cent, a permanent loss of tax receipts from the financial and housing sectors and the projected rebalancing of economic activity, which will result in less tax-rich growth in the recovery. The fiscal consolidation that the Government has planned over the medium term is necessary to address these persistent effects.
Impact of the downturn on the
public finances
2 M a i n ta i n i n g M a c r o e c o n o M i c s ta b i l i t y eFsr
22 Budget 2010
Budget 2009 and the 2009 Pre-Budget Report set out a realistic forecast of the fiscal 2.35 position, including cautious assumptions for the level of unrealised losses on financial sector interventions, oil and equity prices, the VAT gap and claimant count unemployment. In the July 2009 Article IV Assessment of the UK, the International Monetary Fund stated that “the 2009 Budget acknowledged transparently the scale of deterioration of the fiscal position. Of particular note, it comes to the conservative judgment that the structural component of the deficit is… about four-fifths of the total deficit in 2009-10”. 8
2.36 Public sector net borrowing in 2009-10 is now estimated to be £11 billion lower than forecast in the 2009 Pre-Budget Report. Tax receipts since November are now expected to be £9½ billion higher than previously forecast. Receipts were higher than expected across a number of major tax bases, in particular:
self-assessed income tax paid in January relates to economic activity in 2008-•09 at the worst point of the downturn. Receipts from self-assessment fell by 3.2 per cent compared with last year but were higher than the forecast made in the 2009 Pre-Budget Report;
VAT receipts have been stronger than expected, possibly because businesses •have repaid more VAT debt than expected, and possibly due to stronger consumer spending ahead of the planned reversal of the temporary VAT rate cut and the end of the Government’s vehicle scrappage scheme; and
a more rapid stabilisation in profits, in particular from the financial sector, •has boosted Corporation Tax and PAYE from bonuses.
As a result, cyclically-adjusted net borrowing is estimated to be 8.4 per cent of GDP in 2.37 2009-10, lower than the 9.0 per cent of GDP projection made in the 2009 Pre-Budget Report and the 9.8 per cent of GDP forecast in Budget 2009. Budget 2010 continues to estimate that a significant proportion – over 70 per cent – of overall borrowing in 2009-10 is cyclically-adjusted or ‘structural’, meaning that either discretionary policy tightening or a change in the structure of the economy that results in higher effective tax rates (ie. increases the amount of tax raised for a given level of economic activity) is required to eliminate it.
8 United Kingdom: 2009 Article IV Consultation, International Monetary Fund, July 2009.
Recent developments
eFsr M a i n ta i n i n g M a c r o e c o n o M i c s ta b i l i t y 2
23Budget 2010
Source: HM Treasury.
Chart 2.2: Change in projection of cyclically-adjusted net borrowing since Budget 2009
0
1
2
3
4
5
6
7
8
9
10Per cent of GDP
Cycl
ical
ly-a
djus
ted
publ
ic s
ecto
r ne
t bor
row
ing
Budget 2009 projections
Budget 2010 projections
2009 Pre-Budget Report projections
2008-09 2009-10 2010-11 2011-12 2012-13 2013-14 2014-15
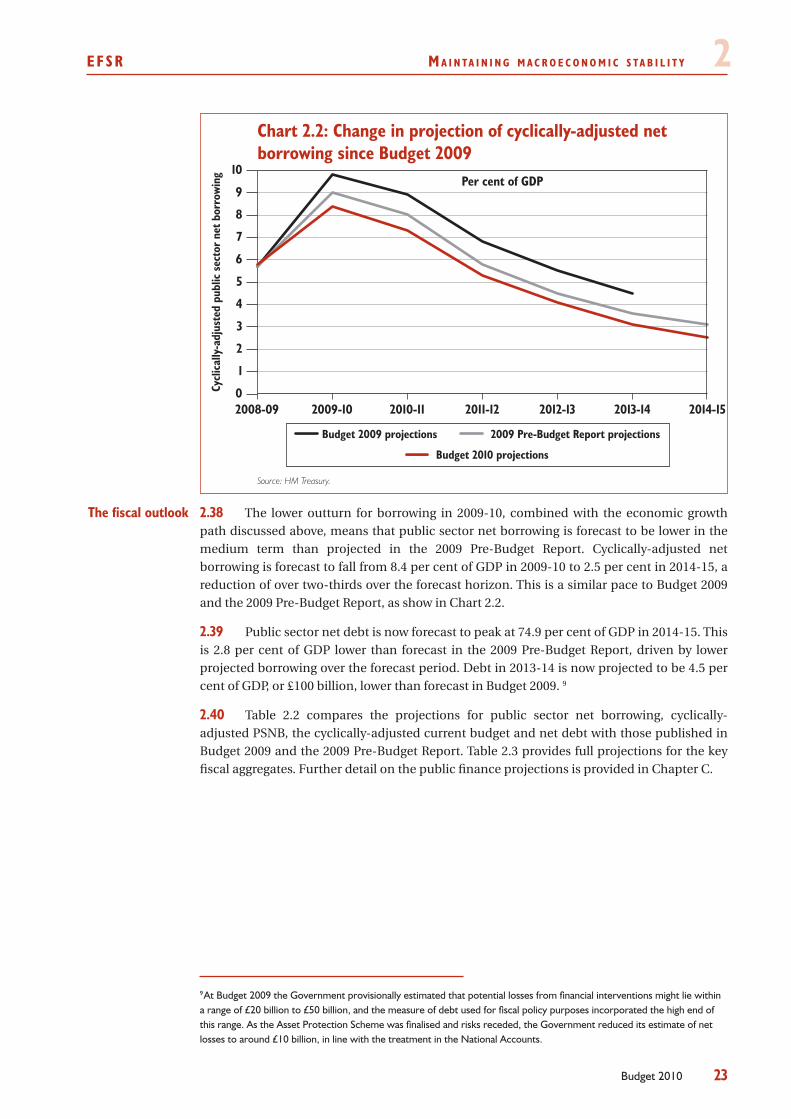
2.38 The lower outturn for borrowing in 2009-10, combined with the economic growth path discussed above, means that public sector net borrowing is forecast to be lower in the medium term than projected in the 2009 Pre-Budget Report. Cyclically-adjusted net borrowing is forecast to fall from 8.4 per cent of GDP in 2009-10 to 2.5 per cent in 2014-15, a reduction of over two-thirds over the forecast horizon. This is a similar pace to Budget 2009 and the 2009 Pre-Budget Report, as show in Chart 2.2.
Public sector net debt is now forecast to peak at 74.9 per cent of GDP in 2014-15. This 2.39 is 2.8 per cent of GDP lower than forecast in the 2009 Pre-Budget Report, driven by lower projected borrowing over the forecast period. Debt in 2013-14 is now projected to be 4.5 per cent of GDP, or £100 billion, lower than forecast in Budget 2009. 9
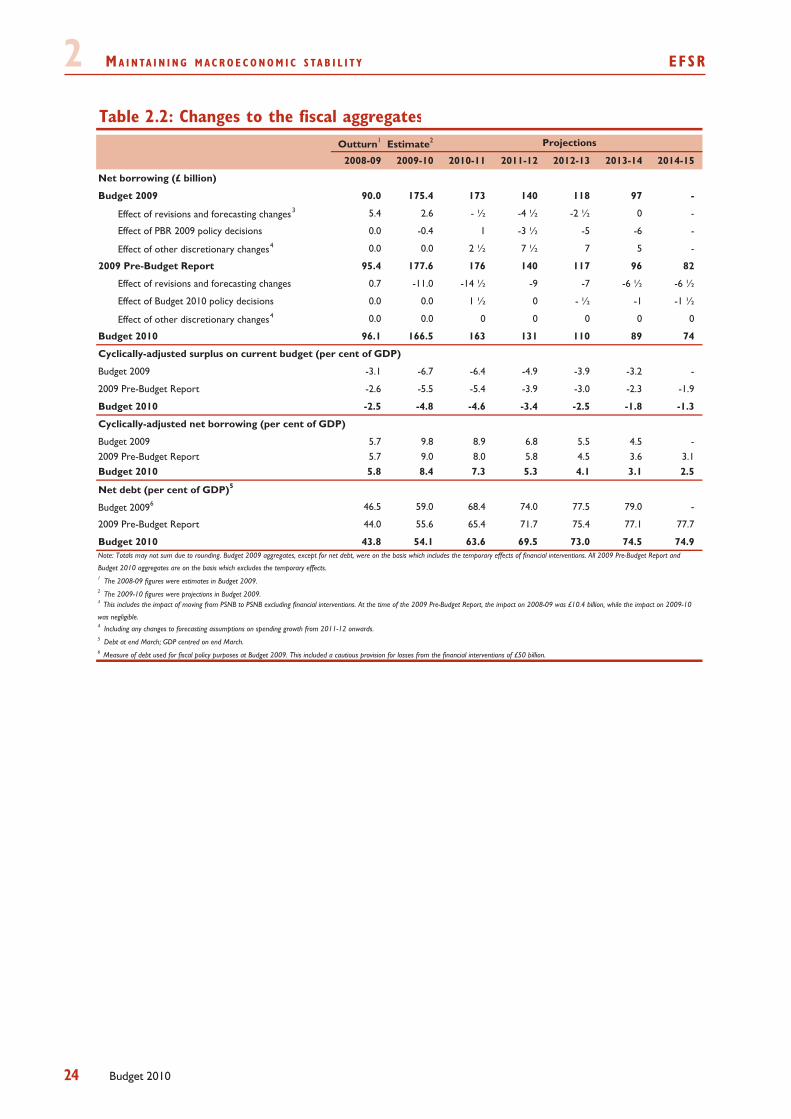
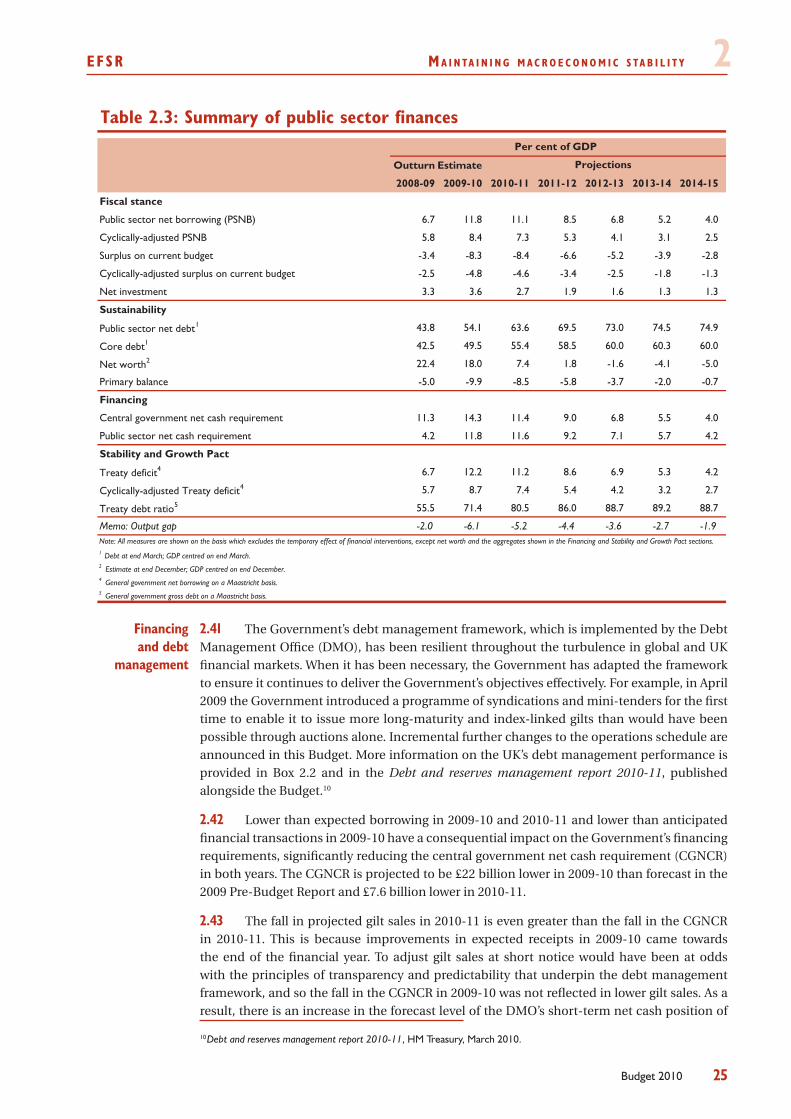
Table 2.2 compares the projections for public sector net borrowing, cyclically-2.40 adjusted PSNB, the cyclically-adjusted current budget and net debt with those published in Budget 2009 and the 2009 Pre-Budget Report. Table 2.3 provides full projections for the key fiscal aggregates. Further detail on the public finance projections is provided in Chapter C.
9 At Budget 2009 the Government provisionally estimated that potential losses from financial interventions might lie within a range of £20 billion to £50 billion, and the measure of debt used for fiscal policy purposes incorporated the high end of this range. As the Asset Protection Scheme was finalised and risks receded, the Government reduced its estimate of net losses to around £10 billion, in line with the treatment in the National Accounts.
The fiscal outlook
2 M a i n ta i n i n g M a c r o e c o n o M i c s ta b i l i t y eFsr
24 Budget 2010
Outturn1 Estimate2
2008-09 2009-10 2010-11 2011-12 2012-13 2013-14 2014-15
Net borrowing (£ billion)
Budget 2009 90.0 175.4 173 140 118 97 -
Effect of revisions and forecasting changes3 5.4 2.6 - ½ -4 ½ -2 ½ 0 -
Effect of PBR 2009 policy decisions 0.0 -0.4 1 -3 ½ -5 -6 -
Effect of other discretionary changes4 0.0 0.0 2 ½ 7 ½ 7 5 -
2009 Pre-Budget Report 95.4 177.6 176 140 117 96 82
Effect of revisions and forecasting changes 0.7 -11.0 -14 ½ -9 -7 -6 ½ -6 ½
Effect of Budget 2010 policy decisions 0.0 0.0 1 ½ 0 - ½ -1 -1 ½
Effect of other discretionary changes4 0.0 0.0 0 0 0 0 0
Budget 2010 96.1 166.5 163 131 110 89 74
Cyclically-adjusted surplus on current budget (per cent of GDP)
Budget 2009 -3.1 -6.7 -6.4 -4.9 -3.9 -3.2 -
2009 Pre-Budget Report -2.6 -5.5 -5.4 -3.9 -3.0 -2.3 -1.9
Budget 2010 -2.5 -4.8 -4.6 -3.4 -2.5 -1.8 -1.3
Cyclically-adjusted net borrowing (per cent of GDP)
Budget 2009 5.7 9.8 8.9 6.8 5.5 4.5 -2009 Pre-Budget Report 5.7 9.0 8.0 5.8 4.5 3.6 3.1Budget 2010 5.8 8.4 7.3 5.3 4.1 3.1 2.5
Net debt (per cent of GDP)5
Budget 20096 46.5 59.0 68.4 74.0 77.5 79.0 -
2009 Pre-Budget Report 44.0 55.6 65.4 71.7 75.4 77.1 77.7
Budget 2010 43.8 54.1 63.6 69.5 73.0 74.5 74.9
1 The 2008-09 figures were estimates in Budget 2009.2 The 2009-10 figures were projections in Budget 2009.
4 Including any changes to forecasting assumptions on spending growth from 2011-12 onwards.5 Debt at end March; GDP centred on end March.6 Measure of debt used for fiscal policy purposes at Budget 2009. This included a cautious provision for losses from the financial interventions of £50 billion.
Projections
Table 2.2: Changes to the fiscal aggregates
Note: Totals may not sum due to rounding. Budget 2009 aggregates, except for net debt, were on the basis which includes the temporary effects of financial interventions. All 2009 Pre-Budget Report and
Budget 2010 aggregates are on the basis which excludes the temporary effects.
3 This includes the impact of moving from PSNB to PSNB excluding financial interventions. At the time of the 2009 Pre-Budget Report, the impact on 2008-09 was £10.4 billion, while the impact on 2009-10
was negligible.
eFsr M a i n ta i n i n g M a c r o e c o n o M i c s ta b i l i t y 2
25Budget 2010
Table 2.3: Summary of public sector finances
Outturn Estimate
2008-09 2009-10 2010-11 2011-12 2012-13 2013-14 2014-15
Fiscal stance
Public sector net borrowing (PSNB) 6.7 11.8 11.1 8.5 6.8 5.2 4.0
Cyclically-adjusted PSNB 5.8 8.4 7.3 5.3 4.1 3.1 2.5
Surplus on current budget -3.4 -8.3 -8.4 -6.6 -5.2 -3.9 -2.8
Cyclically-adjusted surplus on current budget -2.5 -4.8 -4.6 -3.4 -2.5 -1.8 -1.3
Net investment 3.3 3.6 2.7 1.9 1.6 1.3 1.3
Sustainability
Public sector net debt1 43.8 54.1 63.6 69.5 73.0 74.5 74.9
Core debt1 42.5 49.5 55.4 58.5 60.0 60.3 60.0
Net worth2 22.4 18.0 7.4 1.8 -1.6 -4.1 -5.0
Primary balance -5.0 -9.9 -8.5 -5.8 -3.7 -2.0 -0.7
Financing
Central government net cash requirement 11.3 14.3 11.4 9.0 6.8 5.5 4.0
Public sector net cash requirement 4.2 11.8 11.6 9.2 7.1 5.7 4.2
Stability and Growth Pact
Treaty deficit4 6.7 12.2 11.2 8.6 6.9 5.3 4.2
Cyclically-adjusted Treaty deficit4 5.7 8.7 7.4 5.4 4.2 3.2 2.7
Treaty debt ratio5 55.5 71.4 80.5 86.0 88.7 89.2 88.7
Memo: Output gap -2.0 -6.1 -5.2 -4.4 -3.6 -2.7 -1.9
1 Debt at end March; GDP centred on end March.2 Estimate at end December; GDP centred on end December.4 General government net borrowing on a Maastricht basis. 5 General government gross debt on a Maastricht basis.
Per cent of GDP
Projections
Note: All measures are shown on the basis which excludes the temporary effect of financial interventions, except net worth and the aggregates shown in the Financing and Stability and Growth Pact sections.
2.41 The Government’s debt management framework, which is implemented by the Debt Management Office (DMO), has been resilient throughout the turbulence in global and UK financial markets. When it has been necessary, the Government has adapted the framework to ensure it continues to deliver the Government’s objectives effectively. For example, in April 2009 the Government introduced a programme of syndications and mini-tenders for the first time to enable it to issue more long-maturity and index-linked gilts than would have been possible through auctions alone. Incremental further changes to the operations schedule are announced in this Budget. More information on the UK’s debt management performance is provided in Box 2.2 and in the Debt and reserves management report 2010-11, published alongside the Budget.10
Lower than expected borrowing in 2009-10 and 2010-11 and lower than anticipated 2.42 financial transactions in 2009-10 have a consequential impact on the Government’s financing requirements, significantly reducing the central government net cash requirement (CGNCR) in both years. The CGNCR is projected to be £22 billion lower in 2009-10 than forecast in the 2009 Pre-Budget Report and £7.6 billion lower in 2010-11.
The fall in projected gilt sales in 2010-11 is even greater than the fall in the CGNCR 2.43 in 2010-11. This is because improvements in expected receipts in 2009-10 came towards the end of the financial year. To adjust gilt sales at short notice would have been at odds with the principles of transparency and predictability that underpin the debt management framework, and so the fall in the CGNCR in 2009-10 was not reflected in lower gilt sales. As a result, there is an increase in the forecast level of the DMO’s short-term net cash position of
10 Debt and reserves management report 2010-11, HM Treasury, March 2010.
Financing and debt
management
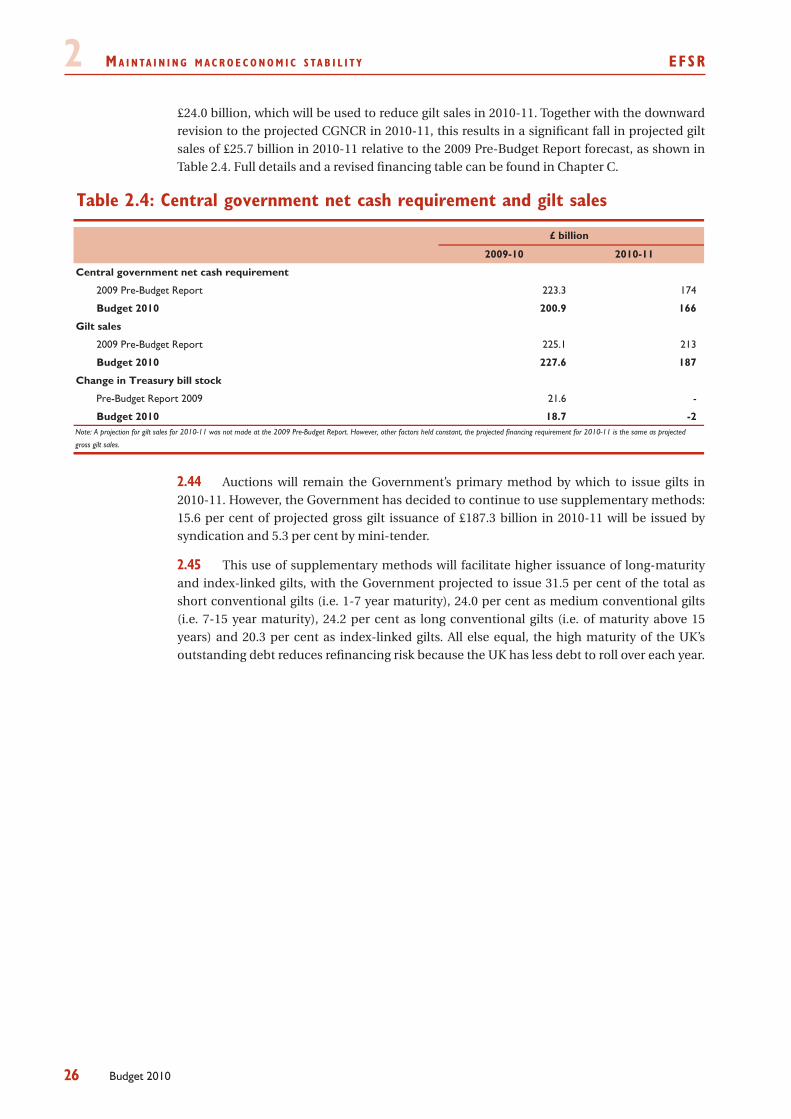
2 M a i n ta i n i n g M a c r o e c o n o M i c s ta b i l i t y eFsr
26 Budget 2010
£24.0 billion, which will be used to reduce gilt sales in 2010-11. Together with the downward revision to the projected CGNCR in 2010-11, this results in a significant fall in projected gilt sales of £25.7 billion in 2010-11 relative to the 2009 Pre-Budget Report forecast, as shown in Table 2.4. Full details and a revised financing table can be found in Chapter C.
Table 2.4: Central government net cash requirement and gilt sales
2009-10 2010-11
Central government net cash requirement
2009 Pre-Budget Report 223.3 174
Budget 2010 200.9 166
Gilt sales
2009 Pre-Budget Report 225.1 213
Budget 2010 227.6 187
Change in Treasury bill stock
Pre-Budget Report 2009 21.6 -
Budget 2010 18.7 -2Note: A projection for gilt sales for 2010-11 was not made at the 2009 Pre-Budget Report. However, other factors held constant, the projected financing requirement for 2010-11 is the same as projected
gross gilt sales.
£ billion
Auctions will remain the Government’s primary method by which to issue gilts in 2.44 2010-11. However, the Government has decided to continue to use supplementary methods: 15.6 per cent of projected gross gilt issuance of £187.3 billion in 2010-11 will be issued by syndication and 5.3 per cent by mini-tender.
This use of supplementary methods will facilitate higher issuance of long-maturity 2.45 and index-linked gilts, with the Government projected to issue 31.5 per cent of the total as short conventional gilts (i.e. 1-7 year maturity), 24.0 per cent as medium conventional gilts (i.e. 7-15 year maturity), 24.2 per cent as long conventional gilts (i.e. of maturity above 15 years) and 20.3 per cent as index-linked gilts. All else equal, the high maturity of the UK’s outstanding debt reduces refinancing risk because the UK has less debt to roll over each year.
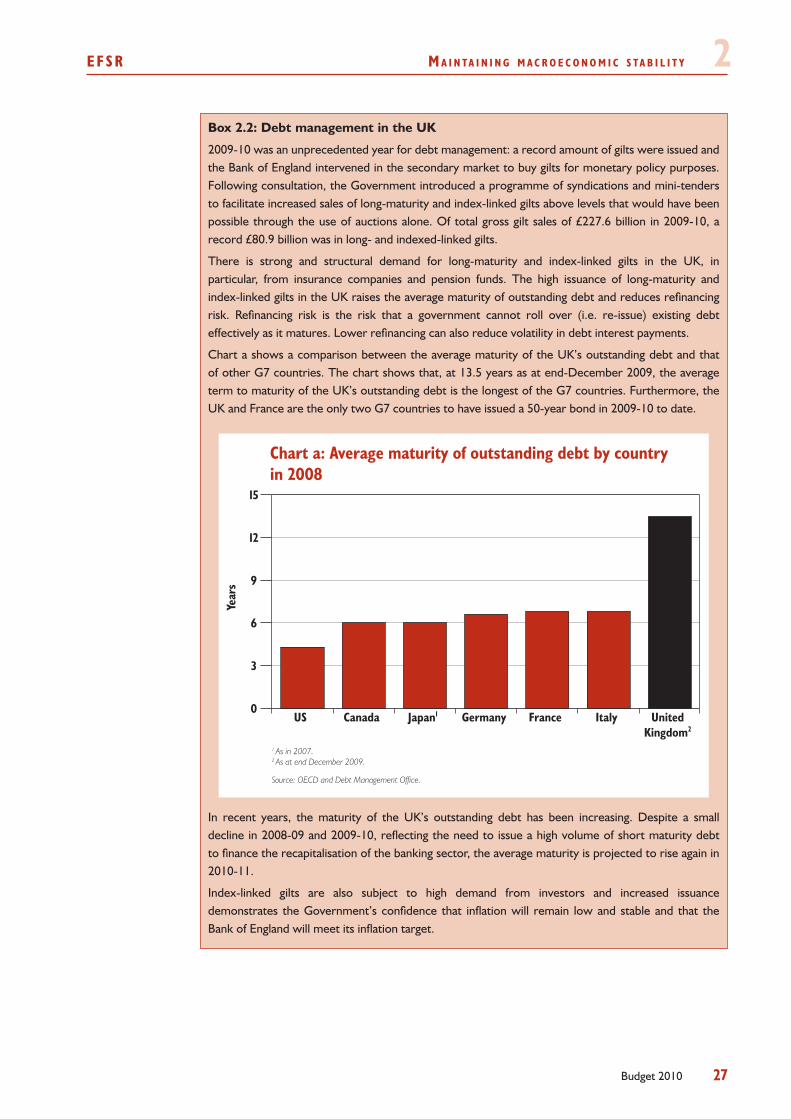
eFsr M a i n ta i n i n g M a c r o e c o n o M i c s ta b i l i t y 2
27Budget 2010
Box 2.2: Debt management in the UK
2009-10 was an unprecedented year for debt management: a record amount of gilts were issued and the Bank of England intervened in the secondary market to buy gilts for monetary policy purposes. Following consultation, the Government introduced a programme of syndications and mini-tenders to facilitate increased sales of long-maturity and index-linked gilts above levels that would have been possible through the use of auctions alone. Of total gross gilt sales of £227.6 billion in 2009-10, a record £80.9 billion was in long- and indexed-linked gilts.
There is strong and structural demand for long-maturity and index-linked gilts in the UK, in particular, from insurance companies and pension funds. The high issuance of long-maturity and index-linked gilts in the UK raises the average maturity of outstanding debt and reduces refinancing risk. Refinancing risk is the risk that a government cannot roll over (i.e. re-issue) existing debt effectively as it matures. Lower refinancing can also reduce volatility in debt interest payments.
Chart a shows a comparison between the average maturity of the UK’s outstanding debt and that of other G7 countries. The chart shows that, at 13.5 years as at end-December 2009, the average term to maturity of the UK’s outstanding debt is the longest of the G7 countries. Furthermore, the UK and France are the only two G7 countries to have issued a 50-year bond in 2009-10 to date.
Source: OECD and Debt Management Office.
1 As in 2007.2 As at end December 2009.
Chart a: Average maturity of outstanding debt by countryin 2008
0
3
6
9
12
15
UnitedKingdom2
ItalyFranceGermanyJapan1CanadaUS
Year
s
In recent years, the maturity of the UK’s outstanding debt has been increasing. Despite a small decline in 2008-09 and 2009-10, reflecting the need to issue a high volume of short maturity debt to finance the recapitalisation of the banking sector, the average maturity is projected to rise again in 2010-11.
Index-linked gilts are also subject to high demand from investors and increased issuance demonstrates the Government’s confidence that inflation will remain low and stable and that the Bank of England will meet its inflation target.
2 M a i n ta i n i n g M a c r o e c o n o M i c s ta b i l i t y eFsr
28 Budget 2010
2.46 While there are signs that the economy and financial markets are stabilising, both the economy forecast and the public finance projections remain subject to a significant degree of uncertainty. In particular, while risks surrounding the short-term projections for the public finances are receding, a significant degree of uncertainty regarding the medium-term projections remains. This is demonstrated by the range of independent forecasts for PSNB in 2011-12, which vary in magnitude by 5.8 per cent of GDP.11
Recognising these uncertainties, the fiscal projections reflect a realistic view of the 2.47 position of the public finances by incorporating some cautious assumptions, including:
a downward adjustment to the economy’s trend level of output in light of the •global financial shock of just over 5 per cent;
that financial sector profits as a share of GDP only return to their 20-year •average by 2014-15; and
the NAO-audited assumptions, in particular on the VAT gap, claimant count •unemployment and the trend rate of economic growth, which is assumed to be ¼ per cent below the centre of the forecast range. Further information on the NAO-audited assumptions is provided in Chapter C.
There is particular uncertainty regarding the structural position of the public 2.48 finances at the current juncture. Estimates of cyclically-adjusted borrowing are subject to the following uncertainties:
there are significant uncertainties around the cyclical position of the •economy, as discussed further in Chapter B. These uncertainties are important, since the judgement reached around the impact of the global economic shocks on trend growth is key to estimating the persistent impact of the shocks on the public finances. For example, if there were less spare capacity than the Government estimates then the structural proportion of a given deficit would be greater. If there were more spare capacity, the structural proportion would be less; and
since the co-efficients used in the Treasury’s cyclical-adjustment methodology •are calculated using data over full economic cycles, they may not fully pick up any disproportionate impacts on receipts and spending arising during recessions.
F i s ca l po l i c y : suppor t ing r e cover y wh i l e ensur ing sus ta inab i l i t y2.49 The Budget 2010 fiscal judgement balances the need to support the economy through the early stages of recovery and the need to deliver sustainable public finances over the medium term through a sustained period of fiscal consolidation. Budget 2010 provides further temporary and targeted support for growth in 2010-11, balanced by measures that raise revenue in later years. Discretionary policy delivers a £1.4 billion loosening in 2010-11 more than offset by tightening in later years, building to a £1.6 billion tightening in 2014-15.
Budget 2010 announcements include:2.50
measures to support enterprise, growth and households in 2010-11, including •a temporary increase in the level of small business rate relief, funding for an
11 Forecasts for the UK economy: a comparison of independent forecasts, HM Treasury, February 2010.
Risks and uncertainty
Budget decisions
eFsr M a i n ta i n i n g M a c r o e c o n o M i c s ta b i l i t y 2
29Budget 2010
additional 20,000 higher education places next year, an additional payment alongside the Winter Fuel Payment, and staging this year’s fuel duty increase; and
tax measures, which more than offset the targeted and temporary support in •the early part of the forecast period, including continuing real terms increases in fuel, alcohol and tobacco duties to 2014-15, and an additional 5 per cent rate of stamp duty land tax for properties over £1 million from 2011-12.
Together, this fiscally neutral policy package and the underlying improvement in 2.51 the position of the public finances result in a lower path for borrowing, cyclically-adjusted borrowing and net debt in each year of the forecast period, relative to Budget 2009 and the 2009 Pre-Budget Report. The Budget fiscal forecast shows:
PSNB declining to 5.2 per cent of GDP in 2013-14 and 4.0 per cent in 2014-15; •
cyclically-adjusted or ‘structural’ net borrowing falling from 8.4 per cent of •GDP in 2009-10 to 2.5 per cent in 2014-15, a reduction of more than two-thirds over the forecast horizon; and
net debt projected at 74.5 per cent of GDP in 2013-14, £100 billion lower than •the Budget 2009 forecast, and peaking at 74.9 per cent of GDP in 2014-15.
Budget 2010 forecasts borrowing in 2013-14 to be slightly below the ceiling set under 2.52 the Fiscal Responsibility Act of 5.5 per cent of GDP, providing a margin of flexibility should future revenues turn out to be lower than expected. If the economy performs better than expected, the Government will be able to reduce the structural deficit more quickly than the path shown in this Budget.
2.53 The Government judges that, in the face of economic uncertainty, it is important to continue to allow fiscal policy to support the economy in 2010-11, and that the medium-term consolidation plan provides space for targeted and temporary support measures in the short term. Continued fiscal support will be provided next year primarily through:
planned increases in government spending, with Total Managed Expenditure •rising by over £11 billion in real terms in 2010-11;
the automatic stabilisers, which will continue to provide fiscal support worth •almost 4 per cent of GDP in 2010-11; and
the Government’s decision at Budget 2009 to increase those benefits and tax •credits normally linked to RPI by 1.5 per cent in April 2010, and to increase the basic state pension by 2.5 per cent, despite a period of negative RPI inflation in 2009, providing an effective real terms increase to transfer payments of around £4 billion.
The Government judges that the focus of fiscal policy should shift towards 2.54 consolidation in 2011-12, when the economy should be able to support this tightening because:
GDP growth is forecast to pick up to an above trend rate of 3 to 3½ per cent •in 2011;
as financial market conditions improve and the monetary policy transmission •mechanism becomes more effective, the low Bank Rate expected by the market will provide an ongoing and powerful stimulus to spending by
Timing of consolidation
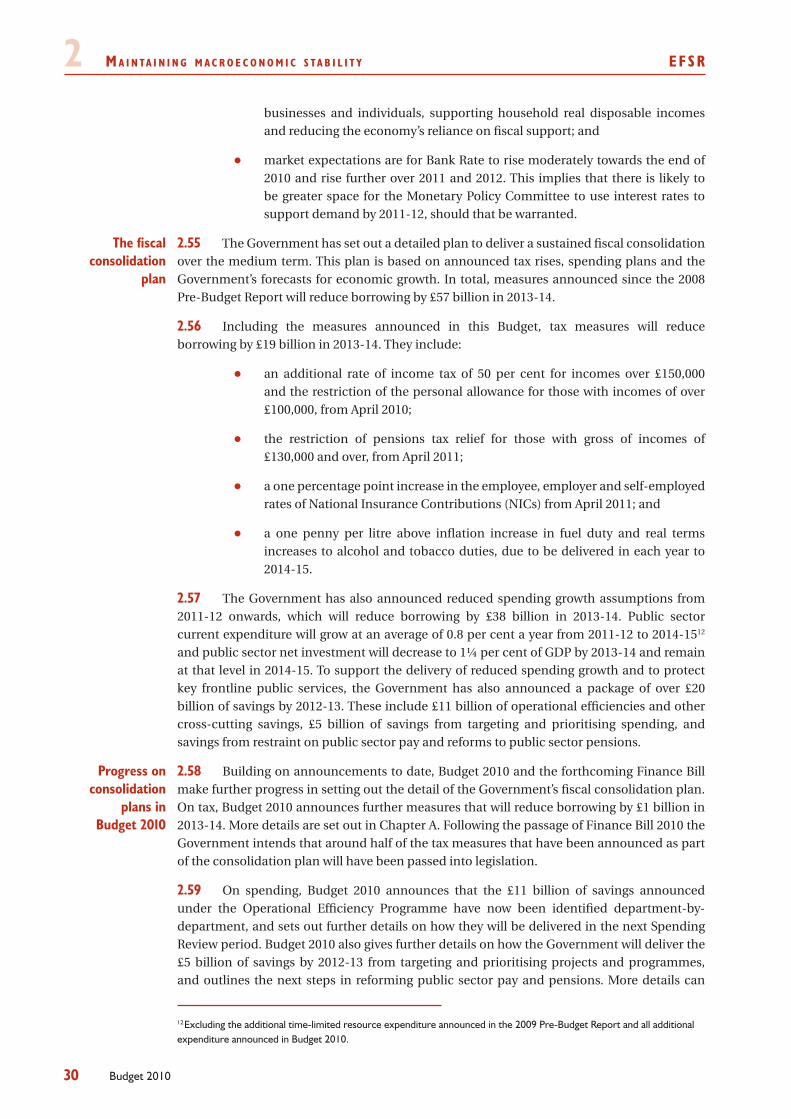
2 M a i n ta i n i n g M a c r o e c o n o M i c s ta b i l i t y eFsr
30 Budget 2010
businesses and individuals, supporting household real disposable incomes and reducing the economy’s reliance on fiscal support; and
market expectations are for Bank Rate to rise moderately towards the end of •2010 and rise further over 2011 and 2012. This implies that there is likely to be greater space for the Monetary Policy Committee to use interest rates to support demand by 2011-12, should that be warranted.
2.55 The Government has set out a detailed plan to deliver a sustained fiscal consolidation over the medium term. This plan is based on announced tax rises, spending plans and the Government’s forecasts for economic growth. In total, measures announced since the 2008 Pre-Budget Report will reduce borrowing by £57 billion in 2013-14.
Including the measures announced in this Budget, tax measures will reduce 2.56 borrowing by £19 billion in 2013-14. They include:
an additional rate of income tax of 50 per cent for incomes over £150,000 •and the restriction of the personal allowance for those with incomes of over £100,000, from April 2010;
the restriction of pensions tax relief for those with gross of incomes of •£130,000 and over, from April 2011;
a one percentage point increase in the employee, employer and self-employed •rates of National Insurance Contributions (NICs) from April 2011; and
a one penny per litre above inflation increase in fuel duty and real terms •increases to alcohol and tobacco duties, due to be delivered in each year to 2014-15.
The Government has also announced reduced spending growth assumptions from 2.57 2011-12 onwards, which will reduce borrowing by £38 billion in 2013-14. Public sector current expenditure will grow at an average of 0.8 per cent a year from 2011-12 to 2014-1512 and public sector net investment will decrease to 1¼ per cent of GDP by 2013-14 and remain at that level in 2014-15. To support the delivery of reduced spending growth and to protect key frontline public services, the Government has also announced a package of over £20 billion of savings by 2012-13. These include £11 billion of operational efficiencies and other cross-cutting savings, £5 billion of savings from targeting and prioritising spending, and savings from restraint on public sector pay and reforms to public sector pensions.
2.58 Building on announcements to date, Budget 2010 and the forthcoming Finance Bill make further progress in setting out the detail of the Government’s fiscal consolidation plan. On tax, Budget 2010 announces further measures that will reduce borrowing by £1 billion in 2013-14. More details are set out in Chapter A. Following the passage of Finance Bill 2010 the Government intends that around half of the tax measures that have been announced as part of the consolidation plan will have been passed into legislation.
On spending, Budget 2010 announces that the £11 billion of savings announced 2.59 under the Operational Efficiency Programme have now been identified department-by-department, and sets out further details on how they will be delivered in the next Spending Review period. Budget 2010 also gives further details on how the Government will deliver the £5 billion of savings by 2012-13 from targeting and prioritising projects and programmes, and outlines the next steps in reforming public sector pay and pensions. More details can
12 Excluding the additional time-limited resource expenditure announced in the 2009 Pre-Budget Report and all additional expenditure announced in Budget 2010.
The fiscal consolidation
plan
Progress on consolidation
plans in Budget 2010
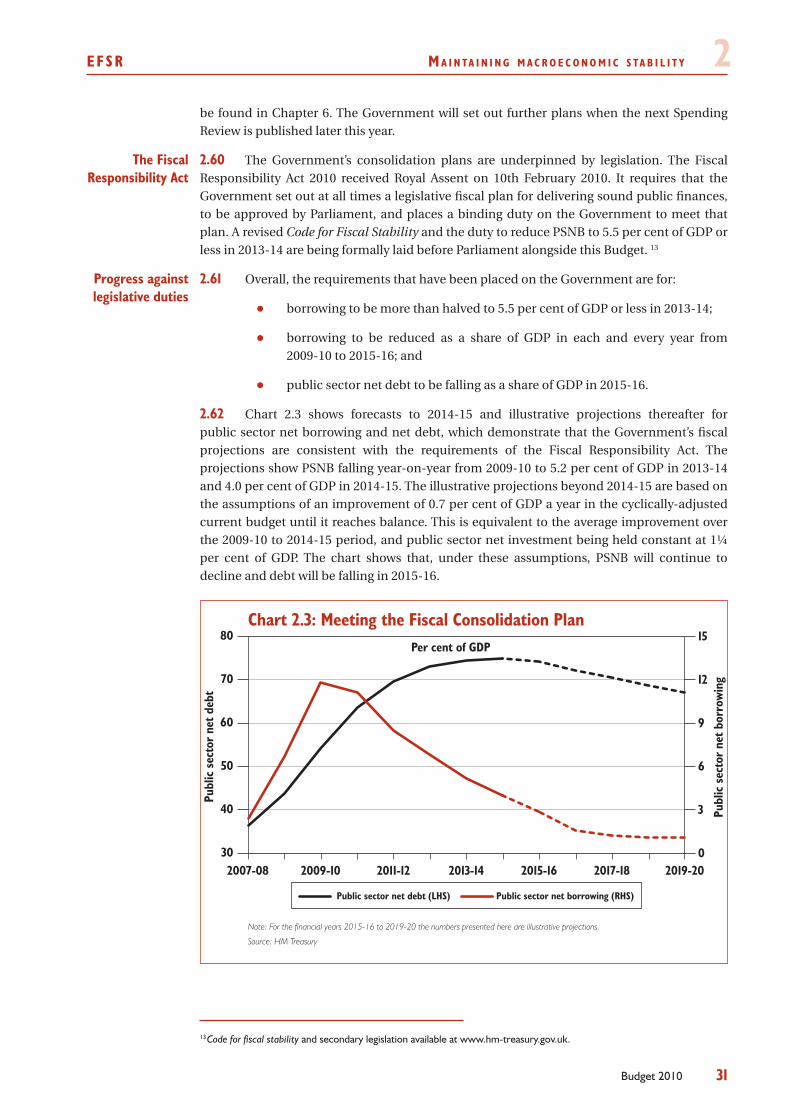
eFsr M a i n ta i n i n g M a c r o e c o n o M i c s ta b i l i t y 2
31Budget 2010
be found in Chapter 6. The Government will set out further plans when the next Spending Review is published later this year.
2.60 The Government’s consolidation plans are underpinned by legislation. The Fiscal Responsibility Act 2010 received Royal Assent on 10th February 2010. It requires that the Government set out at all times a legislative fiscal plan for delivering sound public finances, to be approved by Parliament, and places a binding duty on the Government to meet that plan. A revised Code for Fiscal Stability and the duty to reduce PSNB to 5.5 per cent of GDP or less in 2013-14 are being formally laid before Parliament alongside this Budget. 13
2.61 Overall, the requirements that have been placed on the Government are for:
borrowing to be more than halved to 5.5 per cent of GDP or less in 2013-14;•
borrowing to be reduced as a share of GDP in each and every year from •2009-10 to 2015-16; and
public sector net debt to be falling as a share of GDP in 2015-16.•
Chart 2.3 shows forecasts to 2014-15 and illustrative projections thereafter for 2.62 public sector net borrowing and net debt, which demonstrate that the Government’s fiscal projections are consistent with the requirements of the Fiscal Responsibility Act. The projections show PSNB falling year-on-year from 2009-10 to 5.2 per cent of GDP in 2013-14 and 4.0 per cent of GDP in 2014-15. The illustrative projections beyond 2014-15 are based on the assumptions of an improvement of 0.7 per cent of GDP a year in the cyclically-adjusted current budget until it reaches balance. This is equivalent to the average improvement over the 2009-10 to 2014-15 period, and public sector net investment being held constant at 1¼ per cent of GDP. The chart shows that, under these assumptions, PSNB will continue to decline and debt will be falling in 2015-16.
Note: For the financial years 2015-16 to 2019-20 the numbers presented here are illustrative projections.
Source: HM Treasury
Chart 2.3: Meeting the Fiscal Consolidation Plan
30
40
50
60
70
80Per cent of GDP
Publ
ic s
ecto
r ne
t deb
t
Public sector net debt (LHS) Public sector net borrowing (RHS)
2007-08 2009-10 2011-12 2013-14 2015-16 2017-18 2019-200
3
6
9
12
15
Publ
ic s
ecto
r ne
t bor
row
ing
13 Code for fiscal stability and secondary legislation available at www.hm-treasury.gov.uk.
The Fiscal Responsibility Act
Progress against legislative duties
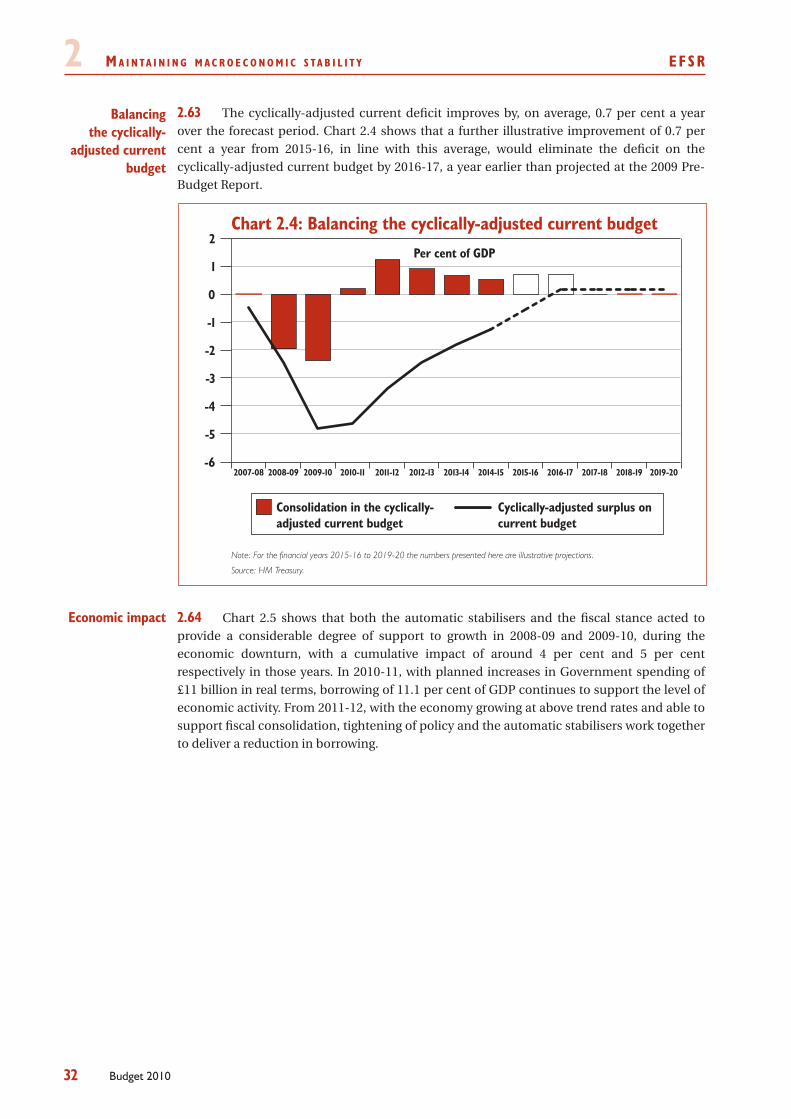
2 M a i n ta i n i n g M a c r o e c o n o M i c s ta b i l i t y eFsr
32 Budget 2010
2.63 The cyclically-adjusted current deficit improves by, on average, 0.7 per cent a year over the forecast period. Chart 2.4 shows that a further illustrative improvement of 0.7 per cent a year from 2015-16, in line with this average, would eliminate the deficit on the cyclically-adjusted current budget by 2016-17, a year earlier than projected at the 2009 Pre-Budget Report.
Note: For the financial years 2015-16 to 2019-20 the numbers presented here are illustrative projections.
Source: HM Treasury.
Chart 2.4: Balancing the cyclically-adjusted current budget
-6
-5
-4
-3
-2
-1
0
1
2
2019-202018-192017-182016-172015-162014-152013-142012-132011-122010-112009-102008-092007-08
Per cent of GDP
Consolidation in the cyclically-adjusted current budget
Cyclically-adjusted surplus on current budget
2.64 Chart 2.5 shows that both the automatic stabilisers and the fiscal stance acted to provide a considerable degree of support to growth in 2008-09 and 2009-10, during the economic downturn, with a cumulative impact of around 4 per cent and 5 per cent respectively in those years. In 2010-11, with planned increases in Government spending of £11 billion in real terms, borrowing of 11.1 per cent of GDP continues to support the level of economic activity. From 2011-12, with the economy growing at above trend rates and able to support fiscal consolidation, tightening of policy and the automatic stabilisers work together to deliver a reduction in borrowing.
Balancing the cyclically-
adjusted current budget
Economic impact
eFsr M a i n ta i n i n g M a c r o e c o n o M i c s ta b i l i t y 2
33Budget 2010
Note: The fiscal stance equals the annual change in the cyclically-adjusted PSNB. The effect of the automatic stabilisers equals the change in the cyclical component of PSNB, i.e. the change in the difference between PSNB and the cyclically-adjusted PSNB.
Source: HM Treasury.
Chart 2.5: Fiscal policy supporting economic stability
-7-6-5-4-3-2-1012345
2014-152013-142012-132011-122010-112009-102008-09
Per cent of GDP
Effect of automatic stabilisers Fiscal stance Output gap
2.65 The UK is subject to the Stability and Growth Pact (SGP) as part of its membership of the European Union (EU). Treaty obligations require the UK to endeavour to avoid excessive deficits, defined as 3 per cent of GDP on the Treaty deficit measure. The UK is not subject to sanctions or corrective measures if it does not comply.
Twenty-one EU member states are currently subject to the Excessive Deficit 2.66 Procedure of the SGP. EU leaders have agreed that the flexibility provided for in the SGP should be used, and that fiscal consolidation should be undertaken in line with economic recovery. The EU’s Economic and Financial Affairs Council has recommended that the UK bring its Treaty deficit below the 3 per cent reference value by 2014-15.
As explained earlier in this chapter, the Government has taken a judgement on the 2.67 appropriate pace of fiscal consolidation, consistent with its fiscal policy objectives. The annual pace of consolidation for the UK set out in Budget 2010 is the fastest in the G7 on IMF forecasts for the period up to 2014.14 As shown in Table 2.3, the Treaty deficit is projected to be 4.2 per cent of GDP in 2014-15.
2.68 The 2009 Long-term public finance report15 provided a comprehensive assessment of the long-term trends and associated challenges facing the UK, and set out their potential implications for the public finances under a range of different scenarios. The report provided projections for those areas of spending that may be particularly affected by long-term challenges, such as education, pensions and health. Budget 2010 sets out illustrative projections for net debt, public sector net borrowing and the cyclically-adjusted current balance to 2019-20, consistent with the requirements of the Code for fiscal stability.
14 For the countries in the G7, other than the UK, the projected annual average fall in borrowing is as forecast by the IMF on a calendar year basis between 2010 and 2014. For Japan and the US, where borrowing is forecast to peak in 2009, the pace of consolidation is taken over 2009 to 2014. The UK pace is based on the Budget 2010 financial-year projection of PSNB from 2009-10 to 2013-14.15 2009 Long-term public finance report, HM Treasury, December 2009.
Stability and Growth Pact
Long-term fiscal issues

34 Budget 2010
35Budget 2010
3 R e f o R m i n g f i n a n c i a l s e R v i c e s
A strong and sustainable financial services sector supports strong, sustainable economic growth. Delivering this positive contribution, and ensuring that the benefits of efficient financial services accrue to businesses and consumers, requires an effective framework of regulation and competition (both domestically and internationally), and good governance and accountability among financial institutions themselves.
The Government is taking a leading role in the international reform agenda, working with its G20 and European partners. Budget 2010 announces:
principles to guide international work on a systemic risk tax which will ensure that •the activities of financial institutions reflect the costs associated with systemic risk as well as helping to meet the wider costs of crises; and
the Government will formally consult on draft regulations to require enhanced •disclosure of remuneration in the financial services sector, and will consider whether the tools available to shareholders to effectively control executive remuneration need to be strengthened, including greater upfront approval of the terms under which employees are remunerated.
The Government is committed to ensuring that the supply of lending to the economy supports the recovery. Budget 2010 announces:
the agreement of Lloyds Banking Group and The Royal Bank of Scotland to lend •£105 billion to homebuyers and businesses over the next 12 months. £41 billion of this will be lent to small businesses;
the creation of a new Small Business Credit Adjudicator with statutory powers •to enforce its judgements. The Adjudicator will work closely with an expanded Financial Intermediary Service to ensure that small businesses are treated fairly when applying for loans; and
steps to help companies diversify sources of finance to non bank lending channels. •The Government is committed to promoting competition in the financial services sector in order to drive efficiency and choice for consumers. Through the divestments from Lloyds Banking Group and The Royal Bank of Scotland, and the return of the Northern Rock bank business to the private sector, competition and diversity in the marketplace will increase substantially.
Effective competition is also promoted by informed consumers, and the Government is committed to ensuring that consumers have access to appropriate financial services and are properly equipped to exercise a choice. Budget 2010 announces that the Government will:
introduce a new right to open a basic bank account;•increase the contribution made by the banks to the community lending sector; •and
ask the Retail Financial Services Forum to consider to what extent financial •services firms’ staff targets and incentives lead to poor outcomes for consumers and employees and how they can be reformed.
The UK economy has returned, after the most severe financial crisis in 60 years, to 3.1 modest growth. Rather than let the banking system collapse, the Government took decisive action to recapitalise a number of systemically significant banks; protect depositors in the banking system; guarantee selected assets held by banks; protect jobs by making changes to the tax system to support small businesses; and ensure a flow of credit to creditworthy businesses. The scale and range of these measures reflected the importance of the financial sector to economic growth.
3 R e f o R m i n g f i n a n c i a l s e R v i c e s efsR
36 Budget 2010
The global nature of the crisis required a global response. The UK Government 3.2 led the way, during its Presidency of the G20, in worldwide efforts to stabilise the financial system, and is now leading and shaping the reform of international regulation in order to maintain stability and support economic recovery.
The Government is announcing a series of measures that, within a framework of 3.3 international cooperation and reform, ensure that the UK remains financially stable and that lending in the economy meets demand. The long-term competitiveness of the UK financial services industry also remains a key objective. The costs associated with the rescue of the global financial system in 2008 have prompted an international debate on the balance of risk and reward between the financial sector and society. This chapter sets out principles for a systemic risk tax coordinated internationally to avoid jeopardizing the UK’s competitiveness, and designed to mitigate moral hazard and take account of the cumulative impact of recent reforms on financial sector firms.
LEADING AND SHAP ING INTERNAT IONAL REFORM
The global financial crisis has demonstrated the need for an overhaul of the 3.4 international regulatory architecture. International cooperation is central to strengthening the financial system for the future, and the Government is working closely with international partners to address potential systemic risk, protect the taxpayer and enable the financial sector to play its part as a key driver of economic prosperity.
3.5 The UK was at the forefront of efforts to promote international financial regulatory reform during its Presidency of the G20. The Government will continue to work closely with EU and international partners to implement the G20 commitments in a robust and internationally consistent manner that minimises the scope for regulatory arbitrage and strengthens the global financial system for the future. The challenge in 2010 is to maintain momentum behind the implementation of the G20 agreements, and ensure that domestic and international efforts are well coordinated.
3.6 At their meeting in Pittsburgh in September 2009, G20 leaders agreed a package of major reforms of international rules on capital, leverage and liquidity, while emphasising the importance of ensuring that the transition to strengthened regulatory standards should not impede the pace of recovery. The Basel Committee is currently consulting on a set of detailed reform proposals and aims to agree a final package by the end of the year, with a phased implementation thereafter. The Government believes that it is important that G20 leaders are given the opportunity to assess the final Basel proposals at their summit in November.
3.7 The rescue of the global financial system in 2008 required substantial support from taxpayers, and has prompted a debate on how the balance of risk and reward between the financial sector and society should be adjusted.
The UK is leading an internationally coordinated approach to this issue, with the 3.8 Prime Minister putting it firmly on the global agenda in a speech to the G20 in November 2009. A range of policy options has been put forward for discussion, including contingent capital, systemic levies and transaction taxes. These all deserve careful consideration in terms of their economic impact and ability to be delivered on a global scale. The IMF, at the request of the G20, is reporting on possible ways to ensure that the financial sector makes a fair and substantial contribution to the wider costs associated with government interventions to repair the banking sector. The Government looks forward to receiving this report later this year.
G20
Basel
Protecting taxpayers from
the cost of future financial crises
efsR R e f o R m i n g f i n a n c i a l s e R v i c e s 3
37Budget 2010
In parallel, the Government is continuing discussions with international partners. 3.9 HM Treasury published Risk, Reward and Responsibility: the financial sector and society1 in December 2009, and held a seminar in January 2010 that brought together the Bank of England, the FSA and international policymakers.
One approach on which the Government believes progress could be made soon is an 3.10 internationally coordinated systemic risk tax. Box 3.1 outlines how this work could be taken forward. The UK will continue to work closely with the G20 and IMF on the development of this and other proposals, and will seek agreement on a process to coordinate further work internationally.
Box 3.1: Principles to guide international work on a systemic risk tax
As the financial crisis has shown, the failure or distress of large and interconnected financial institutions can pose significant risks to financial stability. The Government is developing a package of regulatory measures to reduce these risks and the impact of systemic crises. A systemic risk tax could be an important means of both ensuring that financial institutions take into account the cost of the systemic risk of their activities, and of meeting the wider costs of crises.
There are several key principles that the Government believes should guide further international work on systemic risk taxes:
first and foremost, a systemic risk tax should be • coordinated internationally to minimise competitive distortions, and issues of double-taxation and arbitrage risk will need to be resolved;
a systemic risk tax should • complement but not substitute for existing G20 regulatory initiatives aimed at addressing systemic risk. The work of the Financial Stability Board (FSB) on both reducing the probability and impact of an individual firm’s failure, and on streamlining the process of dealing with failures if they nevertheless occur, remains of vital importance;
while internationally coordinated, the proceeds of such a tax should be for • national governments to use. A systemic risk tax should not be seen as an insurance policy to benefit individual institutions, shareholders or creditors. To minimise moral hazard the proceeds of such a tax should go into general taxation rather than a stand-alone fund;
calibration and implementation must take account of the wider regulatory reform •programme and the cumulative impact of all reforms to strengthen financial stability, as well as the timing and strength of the economic recovery to ensure that the impact of any tax is proportionate and measured;
the tax base should be • as simple as possible, to minimise arbitrage and help international replicability, while taking account of the characteristics of a firm’s business that give rise to systemic risk. In particular it should take into consideration size, interconnectedness, and substitutability, while accepting that a precisely calibrated measure might not be achievable; and
a systematic risk tax should cover • all financial institutions that might contribute significantly to systematic risk, to address level-playing field concerns and minimise arbitrage.
1 Risk, Reward and Responsibility: the financial sector and society, December 2009 is availably at www.hm-treasury.gov.uk
3 R e f o R m i n g f i n a n c i a l s e R v i c e s efsR
38 Budget 2010
3.11 The Government believes it is crucial to explore additional measures with respect to those financial institutions that pose the greatest systemic risk to financial stability. Various proposals have been put forward, including requiring systemically important financial institutions to hold more capital and to limit certain risky activities or investments. The UK supports the work of the FSB, working together with standard setting bodies, to propose measures to address the risks posed by systemically important financial institutions, by October and ahead of the G20 November Summit.
3.12 Recovery and resolution plans (RRPs, also known as ‘living wills’) are an important tool in mitigating the systemic risk that some firms pose to the system and in promoting long-term financial stability.
The Government believes that it is essential to ensure alignment with international 3.13 work on RRPs in order to avoid regulatory arbitrage and potentially detrimental effects on UK competitiveness and the wider economy. The G20 have agreed that major financial institutions with cross-border crisis management groups should develop internationally consistent RRPs by the end of 2010, and the Government continues to work with the FSB and international partners in developing these.
3.14 The Government is taking forward appropriate measures to improve the UK’s insolvency regime for investment banks, to reduce the impact on the financial system of investment bank failures, and to provide better protection for client monies held in investment banks. As part of ongoing consultation, the Government will bring forward detailed proposals – including draft secondary legislation for a new insolvency regime – in the summer.
The global financial crisis also exposed the absence of an effective EU crisis 3.15 management framework for cross-border banks. Work is underway to improve Europe’s crisis management capacity, and the European Commission has consulted on potential policy responses. The UK has stressed the importance of a common EU framework for resolution, consisting of a series of agreed objectives and a common minimum set of national resolution tools capable of delivering outcomes comparable with those achieved by the UK Special Resolution Regime.
3.16 The Council of the European Union agreed legislative proposals in December 2009 to establish a European Systemic Risk Board and three new European Supervisory Authorities strengthening the EU’s regulatory and supervisory architecture in light of the financial crisis. The Government looks forward to the swift agreement of the proposals with the European Parliament.
3.17 The Solvency II Directive aims to develop an EU-wide system of prudential regulation for insurers and reinsurers. It will introduce a stronger and more sophisticated risk-sensitive approach to capital adequacy and supervision than current Solvency I requirements, reducing the likelihood of an insurer failing, and enhancing policyholder protection.
These proposals will necessitate changes to the UK tax rules. Following initial 3.18 discussions with the industry, the Government launched a consultation2 on 10 March to capture views from the industry and others on some key aspects of the future framework, and looks forward to those responses. More broadly, the Government continues to provide support for the UK insurance sector by working to ensure that its interests and concerns, including those relating to the impact on annuities, are heard.
2 Solvency 11 and the Taxation of Insurance Companies is available at www.hm-treasury.gov.uk
Systemically important
financial institutions
Recovery and resolution plans
Investment bank
insolvency
European regulation and
supervision
Solvency II
efsR R e f o R m i n g f i n a n c i a l s e R v i c e s 3
39Budget 2010
3.19 The Government has played a strong international role in agreeing new and robust processes for tackling non-cooperative jurisdictions. This month, the Global Forum for Transparency and Exchange of Information for Tax Purposes began a programme of rigorous peer reviews to ensure that its members have fully implemented the international standards on tax information exchange. In February, the Financial Action Task Force issued a public list3 of jurisdictions with deficiencies in their approach to combating money laundering and the financing of terrorism. The Government has issued advice to UK companies, with guidance on steps to take when conducting business with countries on the list. The FSB also launched its evaluation process this month to promote global adherence to information exchange and supervisory cooperation standards, and has developed possible positive and tougher countermeasures to address weaknesses in compliance or cooperation by jurisdictions.
3.20 Following the independent review of British Offshore Financial Centres by Michael Foot last year, the Government looks forward to updated action plans from the UK’s Overseas Territories. These should demonstrate a public commitment to making good progress against global standards on tax transparency, financial regulation and financial crime, and set out plans for more sustainable revenues over the long term.
Re forming bank ing remunera t i on and governanceGood corporate governance and market discipline are central to well-functioning 3.21
financial markets, and the UK is taking a leading role in the reform of banking remuneration and governance practices.
3.22 Effective, consistent and transparent implementation of the FSB’s remuneration principles and implementation standards during 2010 is essential if global remuneration policies are to be aligned with sound risk management, and regulatory arbitrage avoided. The FSA Code on Remuneration Practices,4 consistent with FSB requirements, came into force at the beginning of this year, and will be reviewed during the year. The FSB will shortly publish a peer review of progress towards implementation by G20 countries.
3.23 The Government has made clear to the banking sector that it needs to develop sustainable long-term remuneration policies. Consistent with this, the Government announced at 2009 Pre-Budget Report that a bank payroll tax would apply to banks awarding discretionary bonuses from 9 December 2009 to 5 April 2010.
There is evidence that bonuses have been reduced to some extent because of this tax. 3.24 It is only fair that those who still choose to award substantial payments should contribute more to the fiscal consolidation of the economy. This is a one-off tax designed to reinforce progress towards the longer-term regulatory changes being implemented following The Walker Review of Corporate Governance in UK banks and other financial industry entities5 and the measures set out in the Financial Services Bill.
3.25 Sir David Walker was commissioned by the Government in 2009 to review governance practices in the financial services sector. The Government, in collaboration with other bodies with a governance remit, will implement Sir David’s recommendations throughout 2010. Consequently, the FSA is consulting on changes to its ‘significant influence controlled functions’ regime. The Financial Reporting Council (FRC) is consulting on revisions to the Corporate Governance Code,6 and separately on the adoption and coverage of a Stewardship
3 The list is available at www.fatf-gafi.org4 The FSA code is available at www.fsa.gov.uk5 The Walker Review of Corporate Governance in UK banks and other financial industry entities: Final recommendations, July 2009, is available at www.hm-treasury.gov.uk6 The FRC Corporate Governance Code is available at www.frc.org.uk
Tackling non- cooperative
jurisdictions
Foot Review
FSB Peer Review Report
Bank payroll tax
Response to the Walker Review
3 R e f o R m i n g f i n a n c i a l s e R v i c e s efsR
40 Budget 2010
Code for investors. As part of the development of the Stewardship Code on which the FRC is currently consulting, the Government will also consider whether the existing institutional investor voting disclosure regime should become mandatory as provided for in section 1277 of the Companies Act 2006.
On 10 March 2010 the Government published draft Regulations to require enhanced 3.26 disclosure of remuneration in the financial services sector. After the Financal Services Bill gains Royal Assent, the Government will formally consult on those Regulations. As part of that process, and given the key role that owners should play in managing remuneration contracts, the Government will consult on whether further practical measures can be identified to facilitate the consent, by owners, of executive remuneration in the financial services sector.
F inanc i a l s e r v i c e s t axa t i on 3.27 The UK’s asset management industry remains a key priority for the Government, reflecting both its direct contribution to the economy and the broader economic role it plays in providing those with capital to invest with profitable investment opportunities. In recognition of the importance of this sector, the Government will continue to insist that the EU Alternative Investment Fund Managers Directive be made proportionate and workable, and provide a level playing field for fund managers.
Dialogue over recent years between the Government and the asset management 3.28 industry has resulted in various tax reforms with the aim of enhancing the UK’s competitiveness in this area. The Government remains open to further discussion on the relative impact of different drivers on the location of asset management activity, and further possible reforms including on stamp duty reserve tax schedule 19. Any such reforms should be affordable and result in tangible benefits for the UK economy.
The Government will:3.29
work with industry to ensure that stamp duty reserve tax schedule 19 only •applies to investments in underlying funds where those underlying funds are themselves primarily invested in UK equities;
launch a working group to consult on whether establishing a tax‑transparent •contractual fund vehicle would be beneficial for the UK;
work with industry to address issues for Authorised Investment Funds (AIFs) •investing more than 20 per cent in both reporting and non‑reporting funds under the Funds Investing in Non‑Reporting Offshore Funds (FINROFs) regime; and
launch a review of the tax rules relating to Investment Trust Companies •in s842 of ICTA 1988, with a view to modernising the rules. A consultation document will be issued in summer 2010.
3.30 The Government remains committed to promoting the UK as a centre for Islamic finance. Work with the industry over recent years has led to a number of tax changes aimed at facilitating growth in this area. The Government intends to provide clarification of how the capital allowances regime will interact with these changes.
Asset management
Islamic finance
efsR R e f o R m i n g f i n a n c i a l s e R v i c e s 3
41Budget 2010
Re forming f i nanc i a l i n s t r uments 3.31 In early 2010, HM Treasury, the Bank of England and the FSA launched an extensive
series of discussions with relevant market participants on mortgage-backed securities. This is part of a wider work programme, announced at the 2009 Pre-Budget Report and reporting to the Council for Financial Stability, to develop a shared evidence base that the authorities will use to formulate and evaluate potential reforms.
The authorities are engaged with the many international initiatives focusing on 3.32 securitisation markets, recognising that securitisation markets are an important source of funding. The authorities will continue to work together to shape domestic and international regulatory outcomes to encourage the development of more robust securitisation and covered bond markets.
PROMOTING LENDING TO THE ECONOMY
A fair and competitive credit market is a key component of a successful economy. 3.33 In order to support lending in the UK economy during the downturn, the Government took a number of actions, including securing legally binding lending commitments from Lloyds Banking Group (LBG) and The Royal Bank of Scotland (RBS). Chapter 4 sets out the wider steps that the Government has taken, and will continue to take, to improve access to finance for businesses.
Lend ing commi tments3.34 In signing up to the lending commitments, LBG committed to lend an additional £14 billion on commercial terms over the 12 months from March 2009. RBS committed to lend an additional £25 billion on commercial terms during the same period.
In setting up the lending commitments, the Government was clear that its 3.35 assessment of delivery against the commitments would be subject to market demand and economic conditions. It is important that all lenders take appropriate account of risk and creditworthiness in their lending decisions, ensuring a sustainable supply of credit that drives economic growth.
Both LBG and RBS have exceeded their lending commitments for mortgage lending.3.36 7 During the 12 months to February 2010, LBG exceeded their lending commitment by £1.4 billion. During the same period, RBS also exceeded their lending commitment by £2.7 billion.
The fact that the lending commitments were exceeded for mortgage lending reflects 3.37 the levels of demand for new mortgages, more competitive pricing from LBG and RBS in the higher loan to value market and the banks’ development of innovative products.
Business lending across the economy has been more subdued than mortgage 3.38 lending. This reflects a number of factors, including a reappraisal of risk by lenders, investors and borrowers; uncertainty about the prospects for the economy reducing the demand for finance; financial institutions restructuring to deliver higher capital levels and more conservative loan exposures; larger businesses turning to reviving corporate bond and equity markets as an alternative source of external finance, raising £41 billion in net funds from January to December 2009;8 and businesses restructuring and paying off debt during the recession (described in greater detail in Box B6 ‘Funding for corporates’ in Chapter B).
7 The Royal Bank of Scotland annual results are available at www.rbs.com and the Lloyds Banking Group annual results are available at www. lloydsbankinggroup.com8 Source: Bank of England
Mortgage- backed
securities
Year one performance
3 R e f o R m i n g f i n a n c i a l s e R v i c e s efsR
42 Budget 2010
Repayments of business loans have, in 2009, been £19 billion greater than the total level of new lending.9 There is evidence that large businesses have, in particular, been using money they raised from capital markets to repay bank lending.10
LBG and RBS have, in this context, fallen short of the net lending levels set out in 3.39 the lending commitments. Between them, they delivered £79 billion in gross lending to businesses and both banks increased their market share of business lending (LBG lent £38 billion across their business customers in the period from March 2009; RBS lent £41 billion in gross lending facilities to businesses during the same period). At the same time, however, the banks together received repayments of £92 billion. For LBG, the active capital markets and high levels of repayments mean that their net lending to businesses in the year from March 2009 was £5.7 billion. For RBS, capital markets and revived high repayments of borrowing by businesses mean that net lending in particular was negative; RBS lending fell by £6.2 billion across all business sectors.
The banks have also taken steps to help business customers to understand the way 3.40 that loans are priced and to set out a clearer set of standards that businesses can expect from their banks. In December 2009, LBG and RBS both launched Customer Charters for small and medium sized enterprises (SMEs). The Charters,11 which cover 98 per cent of the SME customer base, commit LBG and RBS to cap arrangement fees on overdrafts and loans at 1.5 per cent of the overall facility and not to increase margins on existing loans without a material increase in risk.
3.41 While conditions have made it hard for LBG and RBS to meet their net lending targets, the Government continues to believe it is essential that UK banks, including those in which it has a stake, are lending appropriately to businesses and households. Budget 2009 announced that the lending commitments would last for a two-year period and that they would be reviewed at the one-year point in order to ensure that these commitments reflected the economic circumstances at that point in time.
The Government today announces that 3.42 LBG and RBS have agreed legally binding lending commitments for the twelve‑month period from March 2010. Lending provided under these commitments will remain on commercial terms and subject to market demand. Over this period, LBG have agreed to a lending commitment of £47 billion; £3 billion in additional mortgage lending and £44 billion in total gross lending to businesses. RBS have agreed a lending commitment of £58 billion; £8 billion12 in additional mortgage lending and £50 billion in total gross lending to businesses. The Government will report to Parliament on the delivery of the year two commitments at the end of the period. If the Government’s judgement is that either bank has failed to meet its lending commitments for year two, or has seriously breached the behaviours set out under their SME Customer Charters, the Government will inform UK Financial Investments Ltd (UKFI), which will work with the remuneration committees of the relevant banks to determine the appropriate consequences of the breach of the year two commitments or the Customer Charters for the relevant executives.
Suppor t ing l end ing to bus ines ses3.43 To help SMEs that need access to credit, the Government has today announced the creation of a new statutory Small Business Credit Adjudicator. The Adjudicator will work
9 Source: Bank of England10 Source: Bank of England11 The Royal Bank of Scotland SME Customer Charter is available at www.rbs.com and the Lloyds Banking Group SME Customer Charter is available at www.lloydsbankinggroup.com12 An £8 billion lending commitment in year two reflects an adjustment within the two year lending commitment framework (the mortgage lending commitments for RBS for year one was increased from £9 billion to £10 billion).
Year 2 lending commitments
Small Business Credit
Adjudicator
efsR R e f o R m i n g f i n a n c i a l s e R v i c e s 3
43Budget 2010
closely with a newly enhanced Business Link Financial Intermediary Service,13 in order to ensure that SMEs are treated fairly when applying to their bank for finance. The Adjudicator will have statutory powers as soon as possible to ensure that the judgements its makes are enforceable.
3.44 After the 2009 Pre-Budget Report, the Government launched a discussion paper on developing non-bank lending channels for large and upper mid-sized businesses.14 Respondents noted evidence that companies were interested in diversifying their sources of finance away from a dependence on a single lender and seeking a longer-term maturity for some of their finance. This could help reduce their refinancing risk and help improve macroeconomic resilience in the longer term.
Borrowing from banks has, for most companies, typically been less costly than 3.45 borrowing from non-bank channels. The future development of non-bank channels is however, likely to be driven primarily by the recent shift in the relative prices of these two channels. There are, however, areas where the Government can play a role in encouraging market-led solutions and a wide range of stakeholders have voiced support for this. Evidence and feedback from the discussion process has brought to light a number of areas of interest, as described below.
3.46 There is evidence that companies are often unaware of the full range of financing channels and how best to access them. The Department for Business, Innovation and Skills (BIS) will lead work across government to increase awareness of the diverse sources of finance available, working with companies, Business Link, the Association of Corporate Treasurers (ACT), and the industry.
3.47 In line with its objective of improving financial market efficiency, the Government will seek to support the work of the industry, including the ACT, the International Capital Market Association (ICMA) and the Association of British Insurers (ABI), to improve bond market access for more issuers including by encouraging better adaptation and standardisation of bond documentation, and encouraging better market information flows.
3.48 The market for private placements in the UK is small, although UK issuers and investors have been active participants in the large US market. As a complement to this existing market, the Government is interested in encouraging potential UK issuers and investors to work together to evaluate the feasibility of a sterling-denominated private placement market and seeks to encourage the market-led development of a broader, more sustainable and wide-ranging issuer and investor base. The Government will seek to work with parties, including M&G, Standard Life Investments, Aviva Investors and others, to help with the development of a sterling private placement market, and with price and risk benchmarking to improve transparency and liquidity so that it can become a more established asset class.
Other issues raised in the discussions included loan pricing transparency, where 3.49 feedback indicated a range of views around the impact on upper mid-sized companies and potential investors; bond trading platforms, where recent development of a platform by the London Stock Exchange is encouraging and some respondents supported further developments such as a trading platform for mid-sized company bonds; and non-bank involvement in the loan markets, where feedback suggested some investor appetite. The Government will continue to engage in these areas on ways to reduce further barriers to non-
13 The Financial Intermediary Service is part of Business Link and offers advice and guidance to SMEs who are having problems accessing finance.14 Discussion paper on developing non-bank lending is available at www.hm-treasury.gov.uk
Non-bank lending
channels
Corporate awareness of
lending channels
Corporate bond market
Private placement
market
3 R e f o R m i n g f i n a n c i a l s e R v i c e s efsR
44 Budget 2010
bank lending channels. HM Treasury will continue to be advised in this work by the Bank of England and the FSA, working with BIS.
Promot ing compet i t i on i n the bank ing sec torEffective competition is central to driving efficiency and ensuring that the financial 3.50
services sector delivers choice for consumers and businesses.
3.51 The Government has a strong framework for competition policy. The Office of Fair Trading (OFT), the Competition Commission and the FSA cooperate closely in this area as and when required.
The Government notes the progress made by the OFT and the banks in addressing 3.52 concerns about unauthorised overdraft charges. New entrants to the market, including well-known brands, are expected to stimulate further competition in products, services and charging structures. Nevertheless, the Government continues to monitor developments and will take action if a voluntary approach does not deliver the changes required.
The Government welcomes the announcement by the OFT of a short review of 3.53 barriers to entry in retail banking. This work will consider whether there are any obstacles to entrants providing a competitive stimulus, focusing on personal current accounts but considering banking for SMEs and other issues as appropriate.
The Government welcomes the FSA’s intention to deliver further improvements to 3.54 the bank licensing process, for example, improved guidance on initial applications and more structured communication on the status of applications. This builds on advances already made, particularly in the pre-application process, and will help to ensure new entrants continue to drive a vibrant and competitive marketplace.
More broadly, the Government remains committed to encouraging competition 3.55 between existing banks and building societies, and between incumbents and new banking entrants or other challengers. Through the divestments from LBG and RBS, and the exit of the Northern Rock bank business from the public sector, competition and diversity in the marketplace will increase substantially.
3.56 The Government is a strong supporter of the EU state aid framework. In this context, the divestments by LBG and RBS will have significant benefits for competition. Taken together over 900 UK branches will be available for purchase, representing a significant ready-made branch footprint for potential purchasers.
The agreed divestments from RBS represent a unique opportunity for the purchaser 3.57 to grow in the UK business banking market. RBS is divesting 318 retail branches along with further SME and corporate banking infrastructure. The divestment includes a book of over 200,000 SME customers.
The agreed divestments from LBG are focused on the retail sector. LBG will divest 3.58 around 600 branches, representing around 4.6 per cent of the personal current account market and 19 per cent of the Group’s mortgage book.
As agreed with the European Commission, the divested assets may only be acquired 3.59 by a new entrant or small challenger in the SME banking (RBS) and personal current account (LBG) markets.
3.60 Northern Rock was successfully restructured in January 2010. The business was split between two companies with the mortgage back book managed separately to the rest of the business. The restructuring resulted in the creation of a new and healthy mortgage bank with
Framework for competition in
financial services
Divestments
Northern Rock
efsR R e f o R m i n g f i n a n c i a l s e R v i c e s 3
45Budget 2010
a continued high street presence. The remainder of the business continues in the form of Northern Rock (Asset Management) plc (NRAM).
The success of the restructuring meant that, following a review in consultation 3.61 with the FSA, the Government decided that HM Treasury’s temporary guarantees for retail deposits in Northern Rock were no longer required. It was therefore announced on 24 February that these guarantees would be lifted from 24 May 2010. Every Northern Rock customer will continue to have the first £50,000 of their deposit guaranteed by the Financial Services Compensation Scheme (FSCS), as is the case for retail depositors of all banks authorised in the UK. This marks the next step in Northern Rock’s return to independent, commercial status.
UKFI will, on behalf of the Government, look to return Northern Rock plc from the 3.62 public sector into the private sector in due course. In so doing UKFI will have regard to its overarching objective to protect and enhance value for the taxpayer, while at the same time promoting competition in the banking market and preserving financial stability. For the eventual purchaser, Northern Rock will present a springboard for growth from an existing branch network, mortgage platform and retail deposit book.
3.63 The Government today announces its intention to integrate two of its wholly owned companies, NRAM and Bradford & Bingley plc, under a single holding company. The integrated business will be committed to providing excellent customer service, leading arrears management and efficient operations. Both companies will remain as separate legal entities under the new holding company, each with its own balance sheet liabilities and government support arrangements. The Government believes this is the optimal solution to maximise value for the taxpayer and to create a solid platform for the orderly management of both companies’ mortgage books.
3.64 In 2009, the Government convened an experts group to address the strategic issues affecting the building society sector, including access to capital. The Government intends to publish a discussion paper on building society capital shortly.
The Government proposed in the 2009 Pre-Budget Report the introduction of 3.65 a specific governance code for building societies and other financial mutuals. It also announced that it would consider the introduction of a regular independent review of financial mutuals’ adherence to the code. HM Treasury has commissioned a working group to take this work forward and to make recommendations to Ministers. The objectives are to ensure that an appropriate code is there for those that need it; the Walker recommendations are appropriately reflected in guidance for mutuals; there is independent input into this process; the governance and ownership characteristics of the mutual model are fully reflected in governance guidance; and the guidance provides a useful resource in promoting good governance among financial mutuals. The Government will update on the group’s work in the Pre-Budget Report.
3.66 The Government intends to consult widely on whether the exemption currently available to industrial and provident societies which provide a financial service (insofar as they accept deposits in the form of withdrawable share capital) should be removed. This would mean that members of failed industrial and provident societies would qualify under the FSCS and would have access to the Financial Ombudsman Service. The Government also intends to seek views on raising the current share capital limit for industrial and provident societies from £20,000 to £35,000, enabling societies to raise more capital from members to further their objectives. It will also consult on proposals to facilitate the use of electronic communications by mutual societies.
Northern Rock Asset
Management and Bradford
and Bingley management
Building societies and other
financial mutuals
Industrial and provident
societies
3 R e f o R m i n g f i n a n c i a l s e R v i c e s efsR
46 Budget 2010
3.67 The Government is determined to secure greater transparency in the coverage of retail banking services. It is exploring with the FSA the best way to ensure that the banks provide public information about the geographical distribution of banking services to personal and small business customers. This transparency requirement would highlight differences in coverage and therefore the people most at risk of financial exclusion.
SUPPORT ING CONSUMERS
Improv ing a c ces s to f i nanc i a l s e r v i c e s3.68 Financial exclusion affects some of the most vulnerable members of society. The Government believes that everyone should be able to access appropriate financial services in order to participate fully in modern day society and the economy.
The Government is committed to ‘mainstreaming’ financial inclusion into 3.69 departmental budgets and strategic objectives from March 2011. Full details will be set out following the next Spending Review.
In October 2009 the Government announced that it had met its shared goal with 3.70 the banks to reduce the number of adults without access to a current account by half.15 The Government believes that it is possible to make further reductions in the number of adults without access to banking services, potentially by up to half over the next five years, and that one step towards achieving this would be to introduce a new right to open a basic bank account. The Government intends to introduce a new ‘universal service obligation’, giving people the right to a basic bank account under certain conditions and will consult on the details.
A renewed strategy for financial inclusion will require support from a wider group 3.71 of organisations. Local authorities, social landlords, advice agencies and community lenders all have a strong interest in improving financial inclusion and can play a valuable role in delivery. Since the end of 2008, the Financial Inclusion Champions have created financial inclusion partnerships engaging over 2,180 local organisations. The Champions have built financial inclusion into 45 local area agreements, supported or started over 200 new financial service projects, and trained 5,500 front line staff in tackling financial exclusion.
The Government also believes that the Post Office has a key role to play in bringing 3.72 financial services into the heart of our communities. It will shortly set out a response to the recent Post Office Banking Consultation.
3.73 The Financial Inclusion Growth Fund has enabled credit unions and community development finance associations to make over 240,000 affordable loans, totalling £104 million, to poorer households since 2006.16 A full evaluation of the Growth Fund initiative will report this year, providing new evidence on delivering affordable credit sustainably to excluded households.
The Government will continue to work to improve the supply of affordable credit 3.74 for low-income households, including by supporting third sector lenders. It will consult on options to make sure banks make an appropriate contribution to community lenders, through regulatory action or a new community levy to be funded by retail banks.
The Social Investment Wholesale Bank will also have a key role to play in supporting 3.75 further growth in community lending.
15 Official Government Statistics are available at: www.hm-treasury.gov.uk/financial_inclusion_bankaccounts.htm in a statistical briefing16 Government management information
Disclosure of banking coverage
Financial inclusion
Affordable credit
efsR R e f o R m i n g f i n a n c i a l s e R v i c e s 3
47Budget 2010
The Government wants to see projects that can provide access to affordable credit 3.76 on a national scale, and notes with interest the recent proposals from the National Housing Federation to develop and deliver a £3 million regional, not-for-profit financial services provider.
3.77 Since 2008 the ABI has led work to improve access to contents insurance among financially excluded tenants. Its website now provides information about the benefits to landlords of promoting contents insurance to their tenants, and it has started to engage with those social landlords with more than 1000 housing units who do not already help their tenants to access affordable insurance. It has also held workshops with social housing officers. The ABI will continue to work to improve access to insurance by developing guidance for insurers on how to treat customers with criminal convictions.
3.78 The Government will continue to support poorer households in building savings. The ‘Save Xmas Campaign’, delivered by the Office of Fair Trading, reached an estimated 80,000 people in 2008/09.17
Empower ing consumers3.79 The Government wants to ensure that every adult in the UK can access practical, impartial information and advice about money. This will help consumers to approach financial decisions confidently and knowledgably and to manage their financial affairs better. The Government and FSA have successfully piloted Money Guidance service ‘Moneymadeclear’ in the North West and North East of England. The service has helped more than half a million people since April 2009 on a wide range of money issues.18
On 11 March, the Chancellor announced the rollout of the Money Guidance 3.80 service across the rest of the UK. This is now available online and over the phone and will be supported by a national marketing campaign, beginning later this spring. Face-to-face sessions will continue to be available in the North West and North East and a phased rollout of face-to-face services across the rest of the UK will begin shortly, targeting vulnerable areas.
The Government and the FSA have committed £20m in 2010-11 to fund the rollout 3.81 of the service, enabling it to help one million people to manage their money better in the coming year. The FSA will establish a new independent consumer financial education body to lead the national implementation of the Money Guidance service.
3.82 The Government wants to ensure that consumers can access products that are simple and easy to understand. It consulted on high-level proposals in Reforming Financial Markets in July 2009 and asked the Retail Financial Services Forum (RFSF) to develop policy options, bringing together industry and consumer groups’ expertise to advance practical solutions that work well for consumers. The Government welcomes the publication this week of a discussion paper by the RFSF, setting out emerging conclusions on simple, transparent products. The Government looks forward to the RFSF’s recommendations in the autumn, and informed by these, will consult in further detail on a new approach to simple and transparent products by the end of this year.
3.83 The Government believes that every child should learn personal finance skills in school so that they have the confidence and motivation to deal with the financial choices and challenges of adult life. Financial capability has been taught as part of the non-statutory framework for Personal, Social, Health and Economic education (PSHE) in the school curriculum in England since 2008. From this year, financial skills will also be assessed as part
17 Ipsos Mori, Evaluation of the Save Xmas Campaign Year 2, available at www.oft.gov.uk/news/campaigns/savexmas18 Management information collected by the FSA. First announced on 11 March in press notice: www.hm-treasury.gov.uk/press_23_10.htm
Insurance
Savings
Money Guidance
Simple, transparent
products
Financial education in
schools
3 R e f o R m i n g f i n a n c i a l s e R v i c e s efsR
48 Budget 2010
of GCSE maths. Financial capability, as a component of PSHE, will be a statutory subject in the curriculum in England from 2011.
3.84 The Government has been asked by some members of industry to look at the removal of the requirement for paper share certificates and share transfer forms in order to transfer shares. The Government will establish a working party to clarify the benefits of this proposal for shareholders and others who will be affected. This working party will report to the Financial Services Secretary to the Treasury.
Pro tec t ing consumers3.85 The Government is taking action to strengthen mortgage regulation, following consultation earlier this year.19 The Government intends to transfer the regulation of second‑charge mortgage lending to the FSA, including the regulation of existing second charge loans. This will create a single regulator for residential mortgage lending, ensuring consistent standards of consumer protection across all mortgages and simplifying the regulatory environment for lenders. The Government is also continuing to explore how best to protect consumers in the buy‑to‑let market and those whose mortgages are sold on to unregulated firms.
3.86 During 2010 the Home Finance Forum, which meets monthly, has continued to encourage high standards of industry best practice in UK mortgage markets and to promote awareness of industry and Government initiatives. It has helped to agree a new approach to monitoring voluntary repossessions with the Council of Mortgage Lenders (CML), and changes to the Civil Procedure Rules (to be implemented from April 2010) to help address concerns over interactions between first and second charge lenders. Budget 2010 announces that HMRC will open discussions with mortgage lenders on the formal introduction of an income verification service for mortgage lenders to provide them with greater certainty about those to whom they lend.
3.87 The Government is exploring ways in which Northern Irish credit unions can be brought within FSA regulation at the earliest opportunity, and intends to consult widely later this year on reform of industrial and provident societies in both Great Britain and Northern Ireland.
3.88 Both the insurance industry and the UK’s prudential regulatory regime for insurers have stood up well during the global financial crisis. The Government in the light of its review of other insolvency regimes, is seeking to refine the administration regime for insurers to ensure continuity of payments and protection for policyholders, should an insurer go into administration. The proposed changes also include legislation that introduces regulation making powers. These powers will ensure that if the FSCS takes action to protect policyholders in life assurance contracts, there will be broadly the same tax treatment in place as if the FSCS had not intervened.
The Government will therefore launch a consultation on proposals to strengthen 3.89 the administration regime for insurers, ensuring consistent treatment for policyholders of insurance contracts under the insolvency and administration regime.
3.90 Building on the RFSF’s remit to make financial services work better for consumers, the Government will ask it to consider to what extent financial services firms’ staff targets and incentives lead to poor outcomes for consumers and employees and how they can be reformed. The RFSF will set up a working group, which will engage with banks, mutuals, consumer groups, employees and trades unions and report to the Chancellor in time for the Pre‑Budget Report.
19 A summary of responses to the consultation which sets out next steps on these proposals will shortly be available at www.hm-treasury.gov.uk/consult_mortgage_regulation.htm
Paper share certificates
Mortgage regulation
Home Finance Forum
Northern Irish credit unions
Administration regime for
insurers
Changing bank staff incentives
to deliver better consumer outcomes
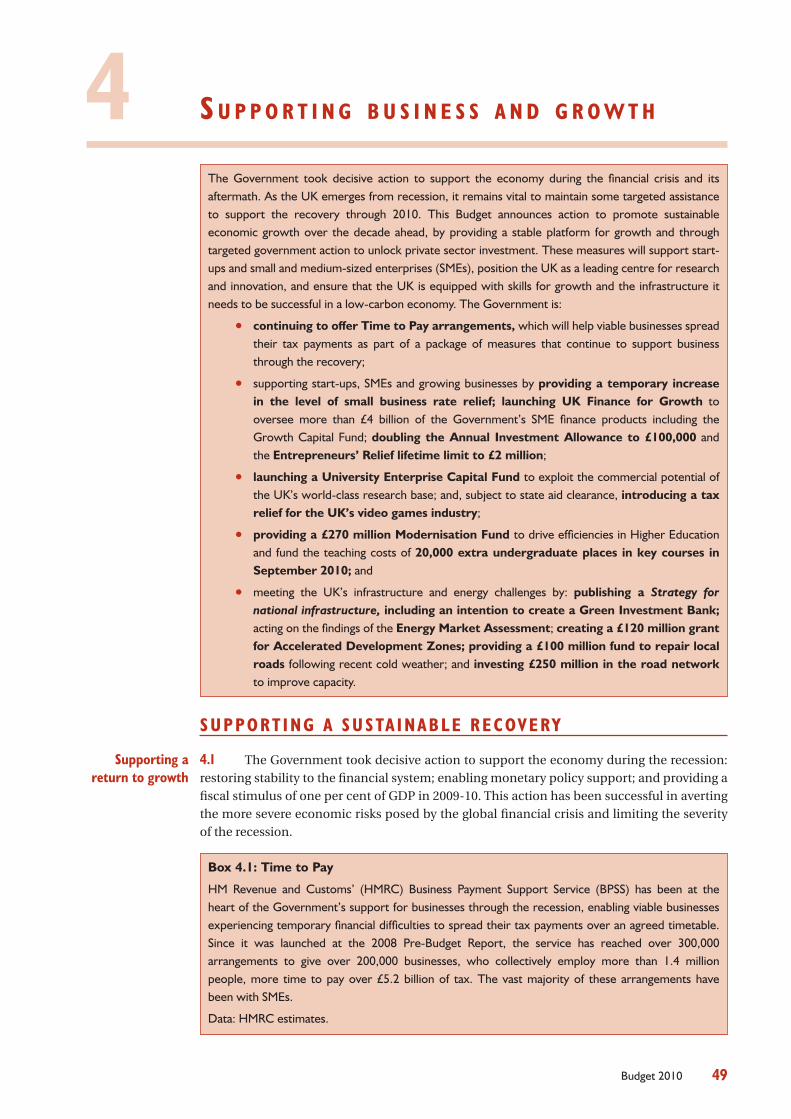
49Budget 2010
4 S u p p o r t i n g b u S i n e S S a n d g r o w t h
The Government took decisive action to support the economy during the financial crisis and its aftermath. As the UK emerges from recession, it remains vital to maintain some targeted assistance to support the recovery through 2010. This Budget announces action to promote sustainable economic growth over the decade ahead, by providing a stable platform for growth and through targeted government action to unlock private sector investment. These measures will support start-ups and small and medium-sized enterprises (SMEs), position the UK as a leading centre for research and innovation, and ensure that the UK is equipped with skills for growth and the infrastructure it needs to be successful in a low-carbon economy. The Government is:
continuing to offer Time to Pay arrangements, • which will help viable businesses spread their tax payments as part of a package of measures that continue to support business through the recovery;
supporting start-ups, SMEs and growing businesses by • providing a temporary increase in the level of small business rate relief; launching UK Finance for Growth to oversee more than £4 billion of the Government’s SME finance products including the Growth Capital Fund; doubling the Annual Investment Allowance to £100,000 and the Entrepreneurs’ Relief lifetime limit to £2 million;
launching a University Enterprise Capital Fund • to exploit the commercial potential of the UK’s world-class research base; and, subject to state aid clearance, introducing a tax relief for the UK’s video games industry;
providing a £270 million Modernisation Fund • to drive efficiencies in Higher Education and fund the teaching costs of 20,000 extra undergraduate places in key courses in September 2010; and
meeting the UK’s infrastructure and energy challenges by: • publishing a Strategy for national infrastructure, including an intention to create a Green Investment Bank; acting on the findings of the Energy Market Assessment; creating a £120 million grant for Accelerated Development Zones; providing a £100 million fund to repair local roads following recent cold weather; and investing £250 million in the road network to improve capacity.
SUPPORT ING A SUSTA INABLE RECOVERY
4.1 The Government took decisive action to support the economy during the recession: restoring stability to the financial system; enabling monetary policy support; and providing a fiscal stimulus of one per cent of GDP in 2009-10. This action has been successful in averting the more severe economic risks posed by the global financial crisis and limiting the severity of the recession.
Box 4.1: Time to Pay
HM Revenue and Customs’ (HMRC) Business Payment Support Service (BPSS) has been at the heart of the Government’s support for businesses through the recession, enabling viable businesses experiencing temporary financial difficulties to spread their tax payments over an agreed timetable. Since it was launched at the 2008 Pre-Budget Report, the service has reached over 300,000 arrangements to give over 200,000 businesses, who collectively employ more than 1.4 million people, more time to pay over £5.2 billion of tax. The vast majority of these arrangements have been with SMEs.
Data: HMRC estimates.
Supporting a return to growth
4 S u p p o r t i n g b u S i n e S S a n d g r o w t h eFSr
50 Budget 2010
4.2 As the economy recovers, the Government recognises that some viable businesses will still struggle to pay their tax bills. For these businesses it is important that the support received through Time to Pay remains in place (see Box 4.1), so HMRC will continue to offer Time to Pay, as part of its support for all viable businesses having difficulty in meeting their tax obligations. In addition, to ensure that all requests continue to be assessed on a consistent basis, businesses that need to use the service more than once will be directed to a specialist team.
4.3 Alongside Time to Pay and the bank lending commitments agreed for 2010-11 and set out in Chapter 3, a number of measures were extended in the 2009 Pre-Budget Report to support business through the recovery:
Enterprise Finance Guarantee (EFG): • the EFG is a loan guarantee scheme which has provided around £900 million of support to almost 9,000 SMEs since its introduction in January 2009. The EFG will continue for 12 months from April 2010 as announced in the 2009 Pre-Budget Report.
Small companies’ rate of corporation tax: • to provide further support for small companies during the recovery, the 2009 Pre-Budget Report announced that the small companies’ rate of corporation tax will remain at 21 per cent for 2010-11, helping around 850,000 businesses.1
Empty Property Relief (EPR): • as announced at 2009 Pre-Budget Report, the temporary increase in the threshold for EPR will be extended to £18,000 for a further year, continuing the exemption from business rates for an estimated 70 per cent of empty properties in 2010-11.
In addition, the 4.4 Automotive Assistance Programme is supporting the automotive industry through the recovery. A £270 million loan guarantee offered to General Motors Europe will support its European restructuring and enhance job security by improving its viability. In addition, the Government has offered Ford a £378 million guarantee, to back a proposed loan from the European Investment Bank (EIB), which will help support its £1.55 billion UK investment programme to develop environmentally-friendly engines and vehicle technologies.
While these measures continue to support business through the recovery, it is now 4.5 right to end some of the exceptional, time-limited measures that successfully helped industry during the recession. By 16 March 2010, the Department for Business, Innovation and Skills (BIS) had received over 388,000 orders for new vehicles under the scrappage scheme. This scheme is due to close either by the end of March or earlier if the limit of 400,000 sales has been reached.2
PROV ID ING A STABLE PL ATFORM FOR GROWTH
4.6 Macroeconomic stability will provide the foundation for future growth and investment in the UK. The Government has set out plans to more than halve public sector net borrowing by 2013-14, and these have been enshrined in law through the Fiscal Responsibility Act.
4.7 A stable environment for growth also includes ensuring that the business tax system is stable and competitive. The UK has the lowest corporation tax rate in the G7, and as part of its strategy to improve certainty for business, on 25 March 2010, the Government will
1 HMRC estimate.2 Data provided by the Department of Business, Innovation and Skills (BIS): http://www.berr.gov.uk/whatwedo/sectors/automotive/scrappage/page51068.html
Time to Pay – support for the
recovery
Continued support for the
recovery
Fiscal consolidation
Tax framework for business
eFSr S u p p o r t i n g b u S i n e S S a n d g r o w t h 4
51Budget 2010
publish a Tax Framework for Business, which sets out six principles it will consider when reviewing, revising and developing business tax policy. These principles were developed in conjunction with the business members of the Business-Government Forum on Tax and Globalisation and were published for consultation ahead of this Budget.
4.8 International trade is worth in the region of $14 trillion and UK trade performance will be a key driver of growth and stability. During this period of continued global uncertainty, the Government will continue to work with international partners to combat protectionism and to drive forward a global trade agreement that will keep markets open and further strengthen the multilateral trading system. The Government will work for further commitments to market opening at the forthcoming G20 summit in June and push for liberalisation in green goods to demonstrate best practice in breaking down trade barriers. As part of this agenda, the UK is working through the European Union (EU) to deliver a long-term strategy for growth and jobs – see Box 4.2.
Box 4.2: EU growth strategy
Europe is crucial to the UK’s economic prospects: it is the world’s largest single market, and around 50 per cent of the UK’s international trade is with the EU. That is why the Government has called for an EU Compact for Jobs and Growth to promote strong, sustainable and balanced growth through, for example: scaling up existing EU venture capital funds; assessing whether EU better regulation programmes are delivering; and reform of the EU budget to increase the proportion spent on research and innovation, climate change, and poverty reduction. The Government is committed to a stronger and deeper Single Market, prioritising the digital economy, the “green” Single Market for low-carbon goods and services, and the implementation of the Services Directive to ensure its full potential economic benefits. On 3 March 2010, the European Commission published its proposals for a Europe 2020 strategy to promote smart, sustainable and inclusive growth in Europe over the next 10 years. EU Heads will discuss the proposals in the coming months.
Reference: Europe 2020 - A strategy for smart, sustainable and inclusive growth, European Commission, March 2010.
BUILD ING AN ENTERPR ISE ECONOMY
F inance f o r g row ing bus ines ses4.9 SMEs make up the large majority of UK businesses and will need reliable access to bank lending to make the most of recovering demand. Chapter 3 sets out the action which the Government has taken to improve bank lending conditions and increase competition in the banking sector, including measures to promote lending to SMEs. As part of this, as announced in Chapter 3, the Government will create a new statutory Small Business Credit Adjudicator to ensure that viable SMEs have access to the finance they need. This will work closely with an expanded Financial Intermediary Service in order to ensure that small businesses are treated fairly when applying for a loan.
4.10 The Government has also put forward proposals to mobilise the EU's key financial institutions – the European Investment Bank (EIB) and the European Investment Fund (EIF) - to stimulate the provision of venture capital and loans for SMEs. As a result:
the European Commission has agreed to coordinate an initiative with the •EIF and EIB to raise additional capital for funding innovative and growing businesses. The Government is calling for €3 billion to be raised; and
International trade
Access to bank lending
EIB and EIF lending to SMEs
4 S u p p o r t i n g b u S i n e S S a n d g r o w t h eFSr
52 Budget 2010
the EIB has developed risk-sharing products that will help banks to accept •greater levels of risk when lending to early-stage small businesses. The Government will now work with the EIB on a plan to ensure these products are quickly used by SME lenders in the UK.
The Government continues to work with UK banks and the EIB to ensure small 4.11 businesses can access up to £4 billion of EIB funds by the end of 2011. Participating UK banks have so far secured £1.39 billion from the EIB and made nearly £800 million available to SMEs nationwide.
4.12 This Budget announces the launch of UK Finance for Growth (UKFG), which will be responsible for overseeing the Government's stock of over £4 billion of SME finance products, including the Growth Capital Fund (see below). UKFG will streamline and simplify the Government's finance support for business, and provide a strong channel for private sector investment into SME-focused funds. It will work in partnership with the Department for Business, Innovation and Skills (BIS), the Department of Energy and Climate Change (DECC) and Regional Development Agencies to co-ordinate public equity SME finance schemes, including the UK Innovation Investment Fund and its low-carbon focused fund-of-funds, and Carbon Trust venture capital activities. This will ensure that government-backed funds form a single, coherent portfolio and that there is a consistent government package of support for viable businesses, wherever they are in the country and whatever stage they are at on their growth path.
4.13 Working in partnership with retail banks, the Government has raised £200 million of cornerstone investment for the Growth Capital Fund that was announced at the 2009 Pre-Budget Report. The fund will act as a new channel for attracting private sector investment into UK SMEs who need £2-10 million of financing to support their growth and who struggle to access the finance they need. Alongside the Government, Lloyds Banking Group, the Royal Bank of Scotland (RBS), Santander, and Clydesdale/National Australia Bank have all committed to investing in the Fund. This initial cornerstone investment will enable the fund to raise additional investment from financial institutions so as to achieve the ambition to raise £500 million.
4.14 The temporary 40 per cent first year capital allowance has supported business investment during the recession. This will end as planned in April 2010. Businesses continue to benefit from the Annual Investment Allowance (AIA), which allows the first £50,000 of capital expenditure in a given year to be fully offset against taxable profits. In order to provide further cashflow support and an incentive to increase business investment, the Government will increase the threshold of the AIA to £100,000 for expenditure incurred from April 2010. Capital expenditure above this threshold will continue to be eligible for standard capital allowances against taxable profits. The Government will introduce a targeted anti-avoidance rule from 24 March 2010 to ensure this measure is focused on support for genuine business investment.
4.15 Entrepreneurs’ Relief supports business owners and those investing in businesses with growth potential by providing an effective 10 per cent Capital Gains Tax rate on qualifying disposals. This Budget announces an extension of Entrepreneurs’ Relief from the first £1 million to the first £2 million of gains made over a lifetime. This change will take effect from 6 April 2010.
4.16 The Enterprise Investment Scheme and Venture Capital Trusts are a vital component of the Government’s strategy to support investment in small companies, with over 17,000 companies benefiting from over £10.5 billion of investment raised through the schemes since their inception.3 The Government confirms the changes required as a condition for
3 HMRC estimates.
UK Finance for Growth
Growth Capital Fund
Increase to Annual
Investment Allowance
Extending Entrepreneurs’
Relief
Tax-advantaged venture capital
schemes
eFSr S u p p o r t i n g b u S i n e S S a n d g r o w t h 4
53Budget 2010
state aid approval and announces that, following consultation, the European small enterprise definition will not be introduced. In addition, in light of new evidence from the Rowlands Review of the structural gap facing SMEs looking for finance, the Government believes there may be a case for reviewing the investment criteria for these schemes.4 The Government will work with industry to examine the evidence base for modifications to the schemes, including increasing: the employee limit to either 100 or 250 employees; the gross assets limit to £15 million before the investment, and £16 million after; and the annual investment limit to £5 million for qualifying companies.
4.17 The development of non-bank lending channels for larger mid-sized businesses will allow more firms to reduce their reliance on bank finance and improve the resilience of the economy. The Government welcomes the responses submitted on HM Treasury’s Discussion paper on non-bank lending.5 As Chapter 3 sets out, the evidence and feedback from the discussion paper process has highlighted a number of areas where Government could play a role in supporting market-led solutions.
4.18 In order to provide greater flexibility for UK Real Estate Investment Trusts (UK-REITs) to invest in the future, the Government intends to legislate, as soon as possible in the next Parliament, an amendment to allow UK-REITs to issue optional stock dividends as an alternative to cash as part of their property income distribution requirement.
Improved suppor t f o r SMEs4.19 To provide help with the fixed costs of starting and running a small business, the Government will fund a temporary increase in the level of small business rate relief, so that eligible small businesses occupying properties with rateable values up to £6,000 will pay no business rates for one year from October. In addition, small businesses benefiting from the rate relief taper (rateable values up to £12,000) will receive significant reductions. It is estimated that over half a million businesses across England will benefit, many by well over £1,000. Around three quarters of all small business units, two thirds of smaller shops and over half of offices and smaller industrial premises will qualify if occupied by an eligible business.6
4.20 Time to Pay has demonstrated the value of HMRC engaging with businesses early and offering a single point of contact (see Box 4.1). To build on the UK's reputation as a world-class environment for business, HMRC will further reduce the burdens of starting a business and personalise the online support it provides by the end of 2011. It will:
personalise • businesslink.gov.uk for those starting up in business and enhance online services for all SMEs, providing better access to relevant tax guidance and flexible tax payment plans to help businesses manage their cash flow;
help start-ups and new employers by introducing a single interactive form •to enable businesses to register for multiple taxes online and to authorise tax agents; and
provide an online facility that reduces the need for businesses, or their •agents, to provide the same information to HMRC multiple times and allows them a single online view of current tax liabilities or repayments due.
4 Rowlands Growth Capital Review, BIS, November 2009.5 Discussion paper on non-bank lending, HM Treasury, January 2010.6 HMRC estimates.
Non-bank lending
Real Estate Investment
Trusts
Small business rate relief
Enhanced online services for SMEs
4 S u p p o r t i n g b u S i n e S S a n d g r o w t h eFSr
54 Budget 2010
4.21 The Government provides a range of business support services, working with key delivery partners such as Regional Development Agencies, local authorities, the Technology Strategy Board and UK Trade and Investment (UKTI). This Budget announces that the Business Support Simplification Programme has succeeded in its target of simplifying the landscape of business support products, from over 3,000 in 2006 to fewer than 100 today. The Government will continue to take action to provide a streamlined service for business, focusing support on what matters most for the future growth of the economy.
4.22 UKTI and the Export Credits Guarantee Department (ECGD) have both stepped up their support for exporters. UKTI helped 22,800 businesses last year, 20 per cent more than the previous year,7 and ECGD estimate that the value of exports that they will have supported this financial year will be about 40 per cent higher than in 2008-09. In order to provide a better coordinated and more efficient service to UK exporters, the Government will co-locate ECGD and UKTI in the same headquarters building. This will provide a one-stop-shop for exporting businesses and deliver better value for money. In addition, following a public consultation on its business principles and ancillary policies, ECGD has published an Interim Government Response announcing changes to its procedures that will help it to provide a more streamlined service to UK exporters.8
Procurement and SMEs4.23 Based on current spending levels, if the whole public sector increased the amount of procurement that went to SMEs by 15 per cent throughout the supply chain, this would mean up to an extra £15 billion of business for SMEs. The Government will deliver this change in central departments by agreeing departmental targets to increase the proportion of central government procurement spend that goes to SMEs by 15 per cent throughout the supply chain. This summer, the Government will publish for the first time the level of spend that goes to SMEs, which will be used as a baseline for these targets.
The increase in central government spend going to SMEs will be achieved by 4.24 agreeing targets with departments and continuing to deliver on the Glover Committee's recommendations:
requiring departments to publish contracting and sub-contracting •opportunities through a single portal that suppliers will be able to access free of charge from December 2010 (an SME has been awarded the sub-contract for the portal, which will be hosted on businesslink.gov.uk);
challenging departments to make more use of SMEs, • including flagging contract opportunities as SME-friendly and increasing training to institutionalise SME-friendly procurement practices;
providing direct support to SMEs • through the free-to-use training package, Winning the Contract; and
working with main contractors to open up supply chains to SMEs.•
To build further on recent prompt payment success, 4.25 all central government departments will now aim to pay 80 per cent of all undisputed invoices within five days and will explore the option of moving to immediate payment, in time, through electronic invoicing for all suppliers. The Government will also encourage all NHS Trusts and local authorities to publish their prompt payment performance data on data.gov.uk. In addition,
7 BIS Autumn Performance Report 2009, BIS, December 2009.8 Interim Government Response to the public consultation on proposed revisions to ECGD’s business principles and ancillary policies, ECGD, March 2010.
Business Support Simplification
Programme
Support for exporters
Procurement
eFSr S u p p o r t i n g b u S i n e S S a n d g r o w t h 4
55Budget 2010
to ensure the benefits of procurement and payment improvements are shared with small businesses, all central government departments will be required to include a clause in their contracts with suppliers to ensure that suppliers pay their subcontractors within 30 days.
4.26 Following the Government's publication of a Policy through Procurement Action Plan on driving growth through public procurement,9 the Government is launching a consultation on a charter enlisting industry’s support for its priority policies. Suppliers will be encouraged to engage voluntarily with the commitments, creating a collaborative approach which will contribute towards growth in the economy.
4.27 To further support the agenda set out in Building Britain's Future: New Industry, New Jobs,10 the Government is launching a set of 10 key Procurement for Growth principles, calling for effective industry engagement before procurement, to better enable suppliers to meet government's forward demands. Procurers’ take-up of the principles will help level the playing field to enable UK companies to bid successfully where they are able to offer value for money.
Re forming regu la t i on4.28 Regulation is a key tool for delivering policy objectives, but it brings with it significant costs for businesses. To reduce the burden of administration and to enable firms to focus their efforts on taking advantage of the opportunities that arise as the global economy returns to growth, this Budget announces measures to strengthen the UK and EU frameworks for new regulation and to simplify the stock of existing law. These will ensure that regulation is only used where it is the most appropriate policy lever, and after all non-regulatory approaches have been fully explored.
4.29 To ensure that the costs of regulation to business are always fully taken into account in the design of new regulation, the Government will:
set out from the next Parliament a Draft Forward Programme of the •measures affecting business that it intends to consult on over the following 12 months. The Government will consult both on this Draft Programme and on ideas for offsetting simplifications in the areas covered by new proposals;
consult on strengthening the Consultation Code to require departments •to set out the implications of non-intervention and, wherever possible, to present a non-regulatory alternative alongside any regulatory options. To support this, the Better Regulation Executive will develop a toolkit to help departments better identify alternatives to regulation;
consider whether there is a case for a benefit-cost ratio threshold • for new regulation and whether it is feasible to conduct affordability analysis; and
press for the European Commission to consult on individual Impact •Assessments before making policy decisions, and to assess the overall costs and benefits of new measures in the pipeline. The Government will work to ensure that the EU updates its Impact Assessments where proposals are significantly changed during the legislative process.
4.30 To make further progress on reducing the burdens of existing regulation, the Government will develop a public assessment framework for departments' performance on better regulation, and work with those agencies and public bodies that are directly
9 Policy Through Procurement Action Plan, Office of Government Commerce, January 2010.10 Building Britain’s Future: New Industry, New Jobs, HM Government, April 2009.
Suppliers’ Charter
Procurement for Growth principles
Better regulation
Improving the framework for new regulation
Simplifying existing
regulation
4 S u p p o r t i n g b u S i n e S S a n d g r o w t h eFSr
56 Budget 2010
responsible for enforcing regulation to identify regulations that could be simplified. The 2009 Pre-Budget Report set out the Government's plan to save £6.5 billion in regulatory costs over 2010-15. To support delivery, the Government has set the following indicative ranges from each theme: Employment and Skills £1-1.5 billion; Business Law £500-750 million; Consumer Issues £500-750 million; Built Environment £1-1.25 billion; Transport £500-750 million; Natural Environment £400-750 million; Workplace Health and Safety £250-500 million; Health and Social Welfare £250-500 million; and a further £500-750 million from other regulations that do not fall under any of the major themes. These ranges will be reviewed as the programme develops, with each theme publishing its first Delivery Plan in autumn 2010.
THE UK A S A CENTRE FOR RESEARCH AND INNOVAT ION
The future success of UK companies in winning business in global markets will 4.31 depend on their ability to innovate and to take advantage of the UK's world-class research base. Following this Budget, an update on Building Britain's Future: New Industry, New Jobs one year on will outline progress on the Government's strategy to support the development of key sectors of the economy. This Budget also announces measures to support universities and encourage innovation, to facilitate the commercialisation of research and intellectual property, and to improve skills in the key jobs and industries that will drive the UK's future growth.
Encourag ing i nves tment and co l l abora t i on 4.32 The Government is committed to ensuring the UK remains an attractive location to invest in and exploit innovation. Building on a range of policies already in place to support the UK's innovative industries, the 2009 Pre-Budget Report announced the introduction of a Patent Box, applying a 10 per cent corporation tax rate to income from patents from April 2013. The Government will work with business to design a practical and competitive regime for patents to support the UK's strengths in innovative industries. This will include looking at how to identify and value embedded patent income and how to give relief to acquired patents. In addition to patents granted after legislation is passed in 2011, the consultation will also consider how to include patents not yet commercialised at that point, and how the regime will apply to equivalent overseas patents held by UK companies. The Government will consult with business during summer 2010 on this basis.
4.33 The creative industries, including the video games industry, make a valuable economic and cultural contribution to the UK. The Government announces that, following consultation on design, it will introduce a tax relief for the UK's video games industry, subject to state aid approval from the European Commission.
4.34 The UK is a world leader in research, but the Hauser review, which will be published on 25 March 2010, has identified a strategic gap in commercialising this knowledge. It recommends that the Government should capitalise on the UK's research strengths by providing focused investment in a new model for Technology and Innovation Centres. These centres aim to research, prove and develop technologies where the UK has world-leading expertise and which provide the greatest opportunity for future growth. The Government will take forward this recommendation and develop a strategy by the 2010 Pre-Budget Report that identifies key strategic technologies and outlines a 10 year vision for the UK.
4.35 UK universities are among the best in the world. To further exploit their commercial potential, the Government will invest up to £25 million in a University Enterprise Capital Fund, through UK Finance for Growth, which will provide crucial early stage funding for the commercialisation of some of the most promising university innovations. This will draw in private funding of at least £10 million, giving universities more opportunities to develop and demonstrate their innovative techniques and processes.
Patent Box
Creative industries
Hauser review
University Enterprise
Capital Funds
eFSr S u p p o r t i n g b u S i n e S S a n d g r o w t h 4
57Budget 2010
4.36 In addition, the Government is facilitating discussions between a group of universities to explore options for a collaborative vehicle to commercialise Intellectual Property from their research, and to help access finance from private sector investors. These measures will harness the excellence of the UK's research base to build profitable and innovative businesses that will drive future economic prosperity.
4.37 The Government plans to consult on a new gateway for the export of NHS intellectual property and services. By taking commercial advantage of cutting edge medical and managerial innovations, leading UK institutions, including the five academic health science centres, will be able to raise new funds to invest in frontline patient care.
4.38 To ensure that the UK remains at the forefront of developments in the internet and fully exploits its economic potential, the Government confirms £30 million of funding for the Institute of Web Science, a joint venture between Southampton and Oxford Universities.
Deve lop ing sk i l l s f o r g rowthGrowing firms and innovative industries require a world-class skills base. The 4.39
Government set out its strategies to achieve this and to build on the excellence of the UK Higher Education sector in the Skills for Growth11 White Paper and Higher Ambitions,12 both published in November 2009. As part of this agenda, an independent review of Higher Education funding and student finance, led by Lord Browne, will report back later in 2010.
4.40 The UK Commission for Employment and Skills (UKCES) published the first national Skills Audit on the 17th March 2010, providing a high-level assessment of current and future skill needs. The Government welcomed the report and has set out actions to follow up its findings, including through a new Joint Investment Programme to support skills in high priority sectors.
4.41 Higher Education is a key priority for growth. This Budget announces a £270 million Modernisation Fund, which will be made available to universities in 2010-11 to enable them to identify and deliver efficiencies over the next four years, and fund extra undergraduate places. To ensure that growth sectors of the future have access to a talent pool with the right skills, and in the light of unprecedented demand for university places this year, the Government is funding universities to recruit 20,000 extra undergraduates on courses starting in 2010-11 which support the strategy set out in Building Britain's Future: New Industry, New Jobs.
4.42 The Modernisation Fund will include £20 million for a Shared Services Pilot Scheme to support a number of pilots between universities in 2010-11. To ensure efficiencies are also realised in Further Education, the Government has also allocated £15 millon for Shared Service pilots between Further Education institutions.
4.43 In support of its strategy to maintain world-class Higher Education, the Government welcomes the approval of £350 million from the European Investment Bank (EIB) to finance Higher Education construction and improvement works, including science parks and incubators, through Barclays Bank.
4.44 The next generation of entrepreneurs will drive the future growth of the UK. This Budget provides updates on wide-ranging improvements to enterprise education:
11 Skills for Growth, BIS, November 2009.12 Higher Ambitions, BIS, November 2009.
IP Pooling
NHS intellectual property
Institute of Web Science
UKCES Skills Audit
Higher Education Modernisation
Fund
Shared Service pilots
EIB finance for Higher Education
Enterprise Education

4 S u p p o r t i n g b u S i n e S S a n d g r o w t h eFSr
58 Budget 2010
£15 million to extend enterprise education into primary schools and Further •Education colleges, on top of the £55 million already dedicated to enterprise education in secondary schools;
a £2 million expansion of the National Council for Graduate •Entrepreneurship's Flying Start programmes to support current university students and recent graduates to set up their own businesses. In 2010-11, these programmes will be made available in all English universities; and
working with the Prince’s Trust, • the Government will increase the support available to young people interested in starting their own businesses by developing a new ‘Be Enterprising’ toolkit to be available online, free of charge. Alongside this Budget, UK banks have also issued a statement confirming their support for young people with good business plans.
MEET ING THE UK’S INFRA STRUCTURE AND ENERGY CHALLENGES
Inves tment i n i n f ra s t r uc ture4.45 In the 2009 Pre-Budget Report, the Government established Infrastructure UK to act as a focal point for the UK's infrastructure strategy and its long-term development and delivery. Alongside this Budget, Infrastructure UK publishes a Strategy for national infrastructure.13 This provides an overview of the current state of the UK's infrastructure, identifies overarching challenges and opportunities, and outlines areas for action. Box 4.3 sets out the key announcements that Infrastructure UK will take forward to meet the challenges that this work has identified.
Box 4.3: Announcements in the Strategy for national infrastructure
Infrastructure UK will:
be responsible for managing the establishment of the Green Investment Bank, to be funded •from asset sale receipts and private sector investment, and will publish a consultation on its establishment in summer 2010;
work with key stakeholders within government and the private sector to identify where •changes in policies and regulation are required to encourage investment in infrastructure in the UK;
develop a National Infrastructure Framework, alongside the process for the next Spending •Review, so that effective decisions on prioritisation and timing can be made with a long-term, cross-sectoral view of infrastructure needs;
work with government bodies and the private sector to identify the interdependencies •that impact on infrastructure investment needs, and publish an action plan setting out the response to them by spring 2011;
commission an investigation into the cost of civil engineering works for major infrastructure •projects in the UK and publish the conclusions and recommendations by the end of 2010; and
work with departments to develop and publish an Infrastructure Technology Strategy that •coordinates future investment in research, development and innovation for infrastructure in line with the priorities set out in the National Investment Framework.
Further details are provided in the Strategy for national infrastructure, which is published alongside this Budget.
13 Strategy for national infrastructure, HM Treasury and Infrastructure UK, April 2010.
Infrastructure UK
eFSr S u p p o r t i n g b u S i n e S S a n d g r o w t h 4
59Budget 2010
4.46 Infrastructure UK and other stakeholders have identified that there is a significant risk of a gap emerging in the provision of equity capital to large complex infrastructure projects within the next few years. To bridge this gap, the Government intends to establish a Green Investment Bank, operating on a commercial basis and involving both public and private sector capital. The Government will start by investing up to £1 billion from the sale of mature, government owned infrastructure-related assets and will seek to match this with at least £1 billion of private sector investment. The Green Investment Bank’s mandate will be to invest in the low-carbon sector where the equity gap is expected to be most critical. Further details are provided in Chapter 7.
4.47 To ensure that Private Finance Initiative (PFI) projects continued as planned through the downturn, the Infrastructure Financing Unit was established in March 2009 to lend to PFI projects that are unable to raise sufficient debt finance on acceptable terms, to reach financial close on a timely basis. Thirty-five PFI projects, involving £4.6 billion of finance, have reached financial close in 2009-10, compared to 18 projects involving approximately £1 billion in 2008-09.
4.48 The Government welcomed the High Speed 2 Limited report, which set out detailed route proposals for a new high-speed line between London and the West Midlands.14 The Secretary of State for Transport has published a formal response to the report and will proceed later in the year with public consultation on the proposed route from London to Birmingham.
4.49 The Government continues to support the local transport needed to maintain growth, improve access to jobs and to help regenerate the UK's cities and regions. This includes recent funding commitments to support projects worth over £900 million, and the Government has given initial approval for further schemes worth over £550 million.
4.50 This Budget announces an additional £100 million to fund repairs for local roads damaged by the recent cold weather. The Government also announces an additional £285 million investment to enable further progress on the Managed Motorways programme and other major road projects, part funded by reductions in the Department for Transport's marketing and communications budgets and other low value spend.
4.51 The 2009 Pre-Budget Report provided an update on action following from the Digital Britain White Paper,15 a comprehensive strategic analysis of the UK's digital economy published in June 2009. Box 4.4 sets out further progress.
14 High Speed Rail: London to the West Midlands and Beyond, High Speed 2 Limited, March 2010.15 Digital Britain, BIS and Department for Culture, Media and Sport, June 2009.
Green Investment Bank
Private Finance Initiative
High Speed 2
Local authority transport
Local and national roads
Progress on Digital Britain
4 S u p p o r t i n g b u S i n e S S a n d g r o w t h eFSr
60 Budget 2010
Box 4.4: Progress on Digital Britain
The Digital Britain White Paper committed to providing a Universal Service Commitment (USC) in broadband by the end of 2012. It also announced a new Landline Duty, which will be implemented on 1 October 2010 and will raise funds to help the roll-out of Next Generation Access (NGA) super-fast broadband to 90 per cent of the country by 2017. Since the 2009 Pre-Budget Report, the Government has:
consulted on the draft legislation and impacts of the new Landline Duty and is publishing a •response alongside this Budget;
announced the creation of ‘Broadband Delivery UK’, which will implement the USC and •NGA projects. The body, which will report to BIS, is currently working with the industry to develop an effective model to maximize the benefits of public funding;
consulted on relaxing restrictions on deployment of new overhead telecommunication •lines, which will reduce the costs of rollout of broadband in rural areas. BIS will publish a full response to its consultation shortly and will consult again on the detailed amendments to the Electronic Communications Code; and
laid before Parliament a direction to Ofcom which aims to unblock the release of valuable •radio spectrum for use in wireless communications and to facilitate the early deployment of next generation mobile networks.
Secur ing the UK’ s f u ture energy supp l y4.52 At the 2009 Pre-Budget Report, the Government launched an assessment of whether current market arrangements will deliver the levels of investment needed to make the transition to a low-carbon economy and deliver a fair deal for consumers. As Chapter 7 explains, the Government is launching a second phase of work to build on the interim findings published alongside this Budget.
4.53 Maximising the economic production of the UK's oil and gas reserves is vital to ensuring access to secure and affordable energy supplies, to support the UK's transition to a low-carbon economy. As a result of discussions with industry, the Government has introduced an extension of the field allowance to support the development of remote deep water gas fields as found in the West of Shetland area, which may contain up to 20 per cent of the UK’s remaining reserves.
The Government 4.54 announces a technical change to enable ring fence reinvestment relief to be available, as originally intended, when a group company makes the reinvestment.
S IMPL IFY ING AND MODERNIS ING TAX
4.55 The Government aims to reduce the administrative burden of tax on business. Since 2006, the Government has implemented or committed to new measures that will deliver savings to business of £564 million a year. Alongside this Budget, HMRC is publishing an update on progress against its administrative burden reduction targets along with details of measures it is taking to help business.16
This Budget also announces further measures to simplify tax burdens on business 4.56 through the Government's three tax simplification reviews:
16 Delivering a new relationship with business: reducing burdens and helping businesses get it right, HMRC, March 2010.
Energy Market Assessment
UK oil and gas fiscal regime
Tax simplification
eFSr S u p p o r t i n g b u S i n e S S a n d g r o w t h 4
61Budget 2010
VAT rules and administration: • the Government has announced further simplification of the VAT partial exemption rules and the option to tax rules for otherwise exempt supplies of land and buildings.
anti-avoidance legislation: • following consultation, the Government announces a simplification of the legislation on transactions in securities that also better targets transactions involving avoidance.
corporation tax rules for related companies: • the Government will discuss responses to the recent consultation with stakeholders and introduce a further simplification of the associated company rules as they apply to the small companies' rate in Finance Bill 2011. The Government is also consulting on detailed proposals for simplifying capital gains legislation for groups of companies.
4.57 From 1 April 2010, the Government will increase the VAT registration threshold in line with inflation from £68,000 to £70,000, keeping more small businesses from having to join the VAT system.
4.58 VAT invoices are the single most burdensome VAT information obligation for UK businesses, contributing £473 million to business costs.17 To enable the use of electronic invoicing to relieve this burden, the EU has recently agreed, with strong support from the UK, that if businesses choose electronic invoicing VAT authorities can no longer dictate the technology that should be applied.
4.59 The Government intends to amend those aspects of corporation tax group relief rules that cover Consortium Relief, to allow EU and EEA-resident companies engaged in UK consortia to pass on relief for the losses of those consortia to their UK-resident subsidiaries. At the same time, it plans to strengthen rules designed to ensure that access to Consortium Relief is given only in proper proportion to the member company's involvement in the consortium.
4.60 As announced on 24 February 2010, the Government will legislate to end uncertainty over the tax treatment of some types of distributions made to UK companies as part of commercial transactions. Distributions will not be excluded from the distribution exemption regime solely because they are of a capital nature. The change will have retrospective effect for the benefit of companies in relation to distributions already paid, but they will also be able to elect for the legislation not to apply retrospectively.
4.61 The Government remains committed to reforming the UK tax treatment of Controlled Foreign Companies (CFCs), to enhance the competitiveness of the UK while providing adequate protection of the UK tax base. A discussion document was published in January 2010, which set out proposals for modernising the current rules.18 The Government aims to publish more detailed proposals and draft legislation for consultation later in 2010, and to legislate in Finance Bill 2011.
4.62 The Government is bringing forward a review of foreign branch taxation to be conducted alongside the reform of the CFC rules, with any legislative changes also intended for Finance Bill 2011.
17 Administrative Burdens - HMRC Measurement Project, KPMG, March 2006.18 Proposals for controlled foreign companies reform: discussion paper, HM Treasury, January 2010.
VAT registration threshold
VAT electronic invoicing
Consortium Relief
Capital distributions
Controlled Foreign
Companies
Taxation of foreign branches
4 S u p p o r t i n g b u S i n e S S a n d g r o w t h eFSr
62 Budget 2010
SUPPORT ING INCLUS IVE ECONOMIC GROWTH
Over the last decade, the Government has put in place policies designed to ensure 4.63 that all parts of the UK benefit from economic growth. But it is important that policy takes account of the different characteristics and prospects of different places. The Government's regeneration interventions will be focused on tackling worklessness, investing strategically for the regeneration of places that offer realistic opportunities for transforming their economic performance, and on connecting people to economic opportunities in places with lower prospects. To this end, this Budget announces further measures to strengthen the ability of local government and government bodies in the regions and city-regions to support inclusive economic growth.
4.64 To better align investment in growth at the regional level, this Budget announces an enhanced role for Regional Ministers to promote growth and inclusion and champion public service reform. To support this new role, the Regional Funding Allocation process will be aligned with the Spending Review cycle, and Regional Ministers will recommend flexing funding to meet regional priorities as they emerge. A regional growth fund will be established by the Regional Development Agences (RDAs) within their capital budgets for 2011-12, to promote high-value investment in support of regional and national growth and industrial policy. To simplify the regional tier, the Government will also act to co-locate the RDAs, Homes and Communities Agency and Government Offices, saving £255 million from 2012-13.
4.65 Strong city-regions will be given more autonomy under new regional arrangements. The 2009 Pre-Budget Report announced city-region agreements with Manchester and Leeds. Greater Manchester is consulting on proposals to put city-region governance on a statutory footing, to oversee delegations and devolved powers agreed with the Government, including on skills, transport and housing. Leeds city-region is making progress towards similar powers as well as trialling new approaches to asset and capital management. This Budget announces that Birmingham city-region has been granted powers to set the adult skills strategy across its area.
4.66 The Government will support investment in infrastructure in our cities and other centres of growth through an Accelerated Development Zone (ADZ) pilot programme. The pilot schemes will be introduced in locations across England in 2011-12. Combined authorities, as they are agreed, and selected local authorities, will receive capital grant funding to a total of £120 million to help support projects that deliver key infrastructure and commercial development to unlock growth. The Government will assess the impact of the investment on business rates growth within the defined ADZ area to further understand the case for introducing Tax Increment Financing.
4.67 The above reforms will enable local and regional government bodies to tackle more effectively the challenge of ensuring that everyone benefits from growth. They will play their part in a wider programme of measures included in this Budget and the Total Place report,19 for example action to:
support the unemployed to find work quickly and gain the skills needed for a •job;
connect people to jobs• by investing in local transport;
use government procurement to promote enterprise; and•reform the public sector.•
19 Total Place: a whole-area approach to public services, HM Treasury and Department for Communities and Local Government, March 2010.
Reforming the regional tier
Empowering city-regions
Accelerated Development
Zones
Supporting inclusive growth
63Budget 2010
5 A c h i e v i n g f A i r n e s s A n d p r o v i d i n g o p p o r t u n i t y
The Government has taken swift and wide-ranging steps to support the UK economy in response to the global downturn, which helped to ensure that growth returned at the end of 2009. Unemployment has risen far less than many external forecasters expected at the beginning of the downturn, and 47,000 fewer people are claiming Jobseeker’s Allowance now than in October 2009. As the UK emerges from the downturn, the Government will continue to work to foster recovery by providing targeted support to those who need it most. In particular, the Government announces the following measures to help households through the recovery:
extending the Young Person’s Guarantee after March 2011• to ensure that young people adversely affected by the recession continue to be guaranteed a Future Jobs Fund job, training or work experience if they cannot find work within six months;
increased support through tax credits for families with children aged one and two;•
continuing to provide an additional payment alongside the Winter Fuel Payment •in 2010-11, worth £100 to households with someone aged over 80, or £50 if someone is over the female State Pension Age;
extending the temporary freeze in the Standard Interest Rate applied to the •Support for Mortgage Interest scheme until December 2010; and
a two-year stamp duty land tax relief for first-time buyers, for residential property •purchases up to £250,000.
Alongside the substantial support provided, the Government is setting policy to create the right economic environment to promote stability and growth in the medium term. Key actions include:
a comprehensive strategy to promote savings, including • the launch of the Saving Gateway in July 2010 and the indexation of ISA limits over the next Parliament; and
publishing• Ending Child Poverty: Mapping the Route to 2020 alongside Budget 2010, setting out ways that child poverty could be reduced in line with the 2020 target.
The Government is also ensuring that it lives within its means in a way that is fair and responsible. On the back of previously announced fiscal consolidation measures, Budget 2010 announces:
the introduction of an additional 5 per cent rate of stamp duty land tax for •residential property over £1 million from 2011-12;
an extension of the freeze in the inheritance tax allowance of £325,000 until •2014-15;
details of the operation of the restriction of pensions tax relief for those on high •incomes.
Tobacco duty rates will increase by 1 per cent above inflation from today and by 2 per cent above inflation for the next four years. Cider duty rates will increase by 10 per cent above inflation. Other alcohol duty rates will increase by 2 per cent above inflation as announced at Budget 2008. In addition, all alcohol duty rates will increase by 2 per cent above inflation for two further years, until 2014-15.
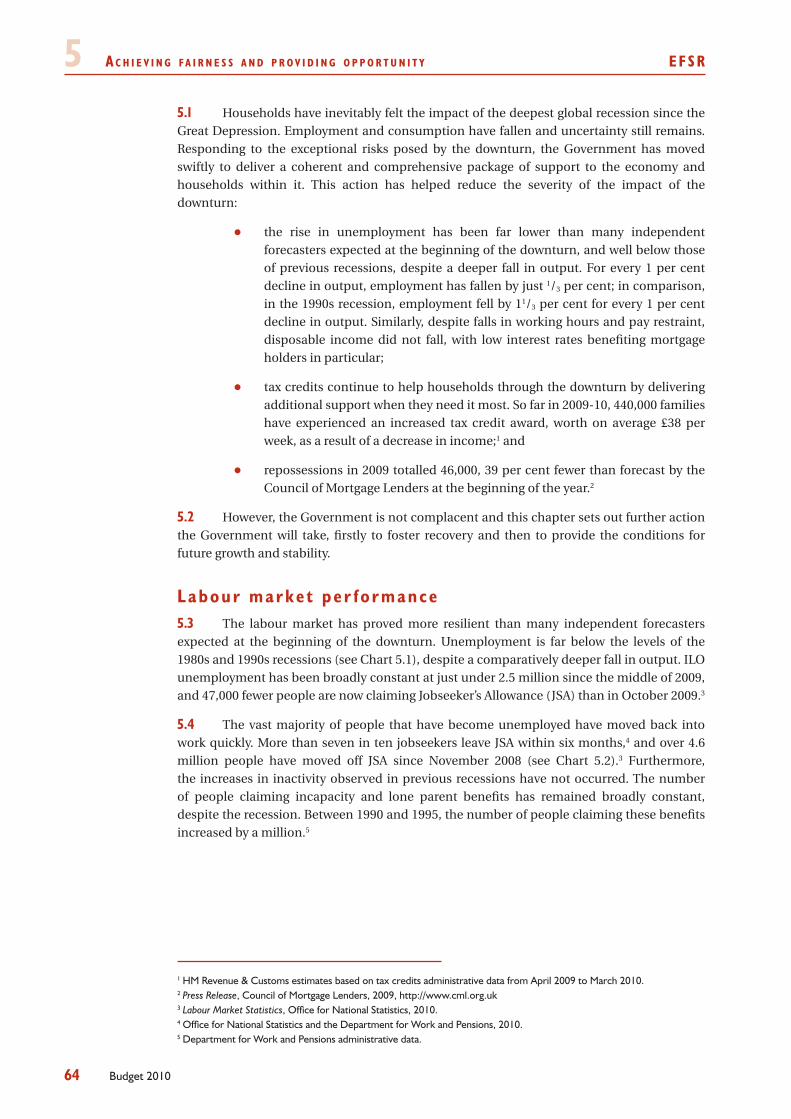
5 A c h i e v i n g f A i r n e s s A n d p r o v i d i n g o p p o r t u n i t y efsr
64 Budget 2010
5.1 Households have inevitably felt the impact of the deepest global recession since the Great Depression. Employment and consumption have fallen and uncertainty still remains. Responding to the exceptional risks posed by the downturn, the Government has moved swiftly to deliver a coherent and comprehensive package of support to the economy and households within it. This action has helped reduce the severity of the impact of the downturn:
the rise in unemployment has been far lower than many independent •forecasters expected at the beginning of the downturn, and well below those of previous recessions, despite a deeper fall in output. For every 1 per cent decline in output, employment has fallen by just 1/3 per cent; in comparison, in the 1990s recession, employment fell by 11/3 per cent for every 1 per cent decline in output. Similarly, despite falls in working hours and pay restraint, disposable income did not fall, with low interest rates benefiting mortgage holders in particular;
tax credits continue to help households through the downturn by delivering •additional support when they need it most. So far in 2009-10, 440,000 families have experienced an increased tax credit award, worth on average £38 per week, as a result of a decrease in income;1 and
repossessions in 2009 totalled 46,000, 39 per cent fewer than forecast by the •Council of Mortgage Lenders at the beginning of the year.2
However, the Government is not complacent and this chapter sets out further action 5.2 the Government will take, firstly to foster recovery and then to provide the conditions for future growth and stability.
Labour marke t per fo rmanceThe labour market has proved more resilient than many independent forecasters 5.3
expected at the beginning of the downturn. Unemployment is far below the levels of the 1980s and 1990s recessions (see Chart 5.1), despite a comparatively deeper fall in output. ILO unemployment has been broadly constant at just under 2.5 million since the middle of 2009, and 47,000 fewer people are now claiming Jobseeker’s Allowance (JSA) than in October 2009.3
The vast majority of people that have become unemployed have moved back into 5.4 work quickly. More than seven in ten jobseekers leave JSA within six months,4 and over 4.6 million people have moved off JSA since November 2008 (see Chart 5.2).3 Furthermore, the increases in inactivity observed in previous recessions have not occurred. The number of people claiming incapacity and lone parent benefits has remained broadly constant, despite the recession. Between 1990 and 1995, the number of people claiming these benefits increased by a million.5
1 HM Revenue & Customs estimates based on tax credits administrative data from April 2009 to March 2010.2 Press Release, Council of Mortgage Lenders, 2009, http://www.cml.org.uk3 Labour Market Statistics, Office for National Statistics, 2010.4 Office for National Statistics and the Department for Work and Pensions, 2010.5 Department for Work and Pensions administrative data.
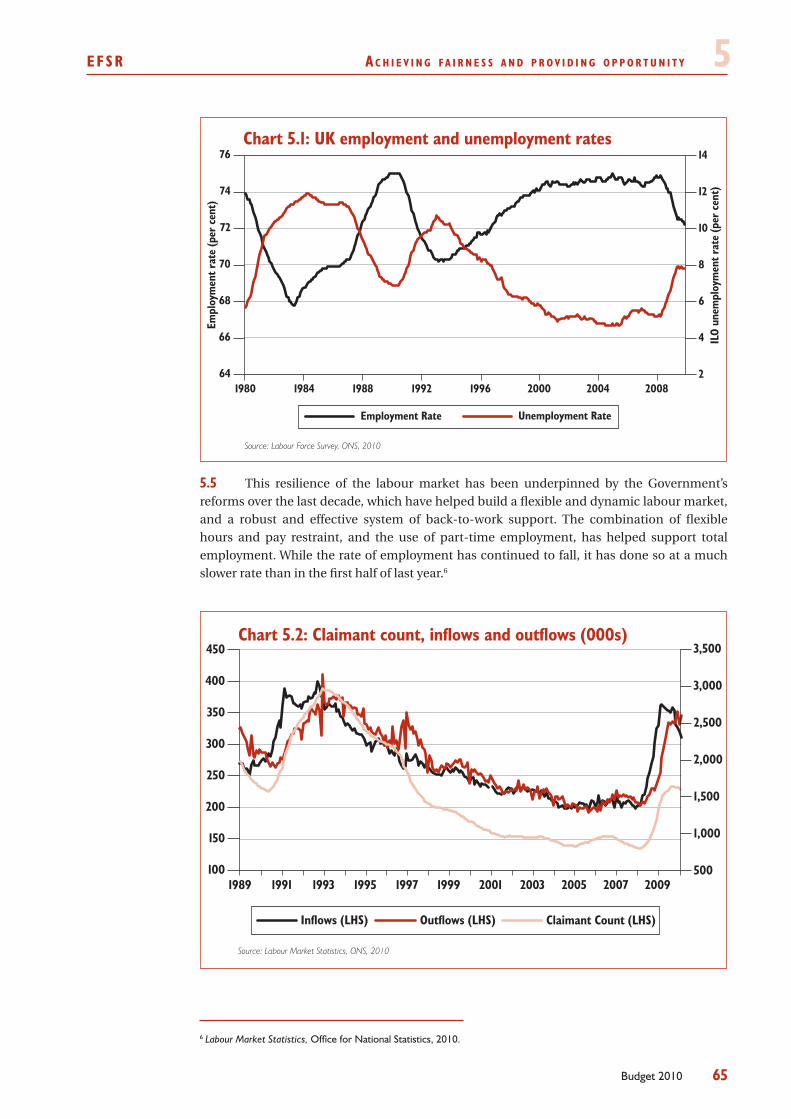
efsr A c h i e v i n g f A i r n e s s A n d p r o v i d i n g o p p o r t u n i t y 5
65Budget 2010
Chart 5.1: UK employment and unemployment rates
64
66
68
70
72
74
76
200820042000199619921988198419802
4
6
8
10
12
14
Empl
oym
ent r
ate
(per
cen
t)
ILO
unem
ploy
men
t rat
e (p
er c
ent)
Employment Rate Unemployment Rate
Source: Labour Force Survey, ONS, 2010
This resilience of the labour market has been underpinned by the Government’s 5.5 reforms over the last decade, which have helped build a flexible and dynamic labour market, and a robust and effective system of back-to-work support. The combination of flexible hours and pay restraint, and the use of part-time employment, has helped support total employment. While the rate of employment has continued to fall, it has done so at a much slower rate than in the first half of last year.6
Source: Labour Market Statistics, ONS, 2010
Chart 5.2: Claimant count, inflows and outflows (000s)
100
150
200
250
300
350
400
450
Inflows (LHS) Outflows (LHS)
20092007200520032001199919971995199319911989500
1,000
1,500
2,000
2,500
3,000
3,500
Claimant Count (LHS)
6 Labour Market Statistics, Office for National Statistics, 2010.
5 A c h i e v i n g f A i r n e s s A n d p r o v i d i n g o p p o r t u n i t y efsr
66 Budget 2010
Prov id ing suppor t and emp loyment oppor tun i t i e s To strengthen the labour market response to the recession, the Government 5.6
took immediate and decisive action by putting in place additional employment support. This support is helping those who become unemployed to move back into work quickly, preventing short-term unemployment turning into long-term detachment from the labour market (see Box 5.1).
Box 5.1: Government employment support through the downturn
The Young Person’s Guarantee is providing a job, work experience or training place for any •young jobseeker unemployed for six months or more, ensuring short term unemployment does not become long term inactivity. From April, participation will be mandatory from 10 months of unemployment.
The Young Person’s Guarantee includes the Future Jobs Fund. This is providing up to •120,000 paid jobs for young people and a further 50,000 jobs for those aged 25 and over in areas hardest hit by the downturn.
As a result of £3 billion set aside at the 2008 Pre-Budget Report and Budget 2009, 15,000 •extra frontline staff in Jobcentre Plus are maintaining high-quality, personalised support to help those that become unemployed move into work quickly, as well as continued, intensive support for those most at risk of long-term unemployment.a
Nearly 40,000 jobseekers have taken up additional support available from six months •unemployment, to help them move into work.b This includes up to £1,000 for employers that recruit and train those in receipt of JSA for six months or more, as well as additional training places and financial support for those wanting to set up their own business.
Employees in over 4,000 firms have used the Rapid Response Service since its expansion in •November 2008. This service is providing on-site support for both small- and large-scale redundancies, to help employees find a new job even before they become unemployed.a
Jobcentre Plus is working closely with over 70,000 large and small employers through Local •Employment Partnerships, which to date have helped over 565,000 jobseekers into work,a across a range of sectors such as manufacturing, care, transport, retail and banking.
Through the Backing Young Britain campaign, over 1,000 organisations have committed to •provide work experience, internships, apprenticeships and mentoring support to young people out of work.a
Through the September Guarantee, all 16 and 17 year olds are guaranteed a place in •education or training. The 2009 Pre-Budget Report provided an additional £200 million in 2010-11 to ensure that this Guarantee would be met in full. The Government has also provided every 16 and 17 year old who was not in education, employment or training in January 2010 with an offer of an Entry to Employment place and Education Maintenance Allowance to go with this.
a Department for Work and Pensions administrative data. b Six Month Offer Official Statistics, Office of National Statistics, January 2010. Figures are for Great Britain and up to October 2009.
The Government announced in the 2009 Pre-Budget Report that it would re-invest 5.7 resources from lower-than-forecast unemployment to provide further support to key groups hit by the recession. This included bringing forward the Young Person’s Guarantee of a job, work experience or training to six months of unemployment.
efsr A c h i e v i n g f A i r n e s s A n d p r o v i d i n g o p p o r t u n i t y 5
67Budget 2010
5.8 Building on the success of the Young Person’s Guarantee, it is essential that the Government continues to provide support as the labour market recovers. The Government therefore announces that it will extend the Young Person’s Guarantee after March 2011, to ensure young people continue to be guaranteed a job, training or work experience placement if they cannot find work within six months. Participation will be mandatory for those young people who are unemployed for 10 months, preventing long-term detachment from the labour market.
5.9 The Government’s response to the recession builds on its commitment to welfare reform, so that no one who is capable of work is written off for a life on inactive benefits. Under the new Employment and Support Allowance, medical experts assess what work an individual can do rather than what they cannot do. Already, more people are accessing support to help them move into work. As this programme is extended to existing Incapacity Benefit claimants, based on the success of the programme to date, even more people are expected to move into work, further reducing the benefits bill by an estimated £300 million over the next five years.
From April 2011, people moving into work from the Employment and Support 5.10 Allowance with a limited capability for work will be automatically eligible for the disability element in the Working Tax Credit (WTC). The Government will also consider whether to review the criteria used in the “disadvantage test” of the WTC in the longer term in order to improve reassurance of gains to work.
SuPPort ing houSehoLdS to SuSta in the recovery
Support for households has a key part to play in sustaining the recovery. Indeed, 5.11 Government fiscal support, delivered through automatic stabilisers such as benefits and tax credits, worth almost 4 per cent of GDP in 2010-11, has helped stabilise the economy and limit the impact of the recession on families. Alongside this, Government intervention since the 2008 Pre-Budget Report has provided additional support expected to leave the vast majority of households better off in 2010-11,7 with targeted support for those who need it most.
Alongside financial support, the Government is taking forward wider interventions 5.12 to help households contribute to the recovery and reap its benefits. Budget 2010 therefore announces further steps to enhance work incentives and promote entry into the labour market, and measures to help people get on to, and stay on, the housing ladder.
Promot ing work and suppor t ing work ing f am i l i e s Work is the best route out of poverty and is central to providing stability and financial 5.13
security for households. The Government is committed to making work pay, and has worked to ensure that, for those in full-time work, it will leave them in a better financial position than out of work support.
5.14 The Government is considering responses to the recent Housing Benefit consultation and the emerging findings from the low-income working households research before setting out reforms to improve fairness, address affordability, and strengthen work incentives. Meanwhile, the Government recognises concerns that the current approach to calculating Local Housing Allowance rates has resulted in very high payments to a small number of tenants in the most expensive areas. As a prelude to further reform, Budget 2010 therefore announces that, from October 2011, the highest rents across the country, including the
7 Estimates calculated using HM Treasury’s tax and benefit microsimulation model.
employment support
Welfare reform
housing Benefit reform
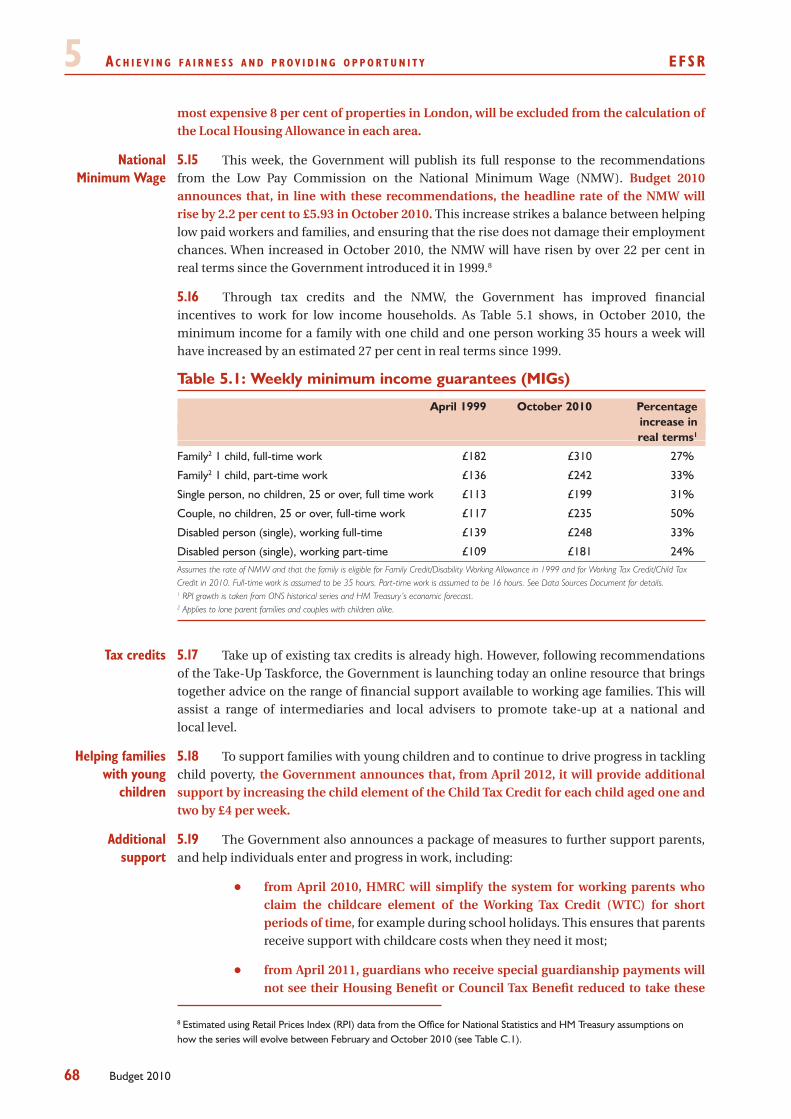
5 A c h i e v i n g f A i r n e s s A n d p r o v i d i n g o p p o r t u n i t y efsr
68 Budget 2010
most expensive 8 per cent of properties in London, will be excluded from the calculation of the Local Housing Allowance in each area.
5.15 This week, the Government will publish its full response to the recommendations from the Low Pay Commission on the National Minimum Wage (NMW). Budget 2010 announces that, in line with these recommendations, the headline rate of the NMW will rise by 2.2 per cent to £5.93 in October 2010. This increase strikes a balance between helping low paid workers and families, and ensuring that the rise does not damage their employment chances. When increased in October 2010, the NMW will have risen by over 22 per cent in real terms since the Government introduced it in 1999.8
Through tax credits and the NMW, the Government has improved financial 5.16 incentives to work for low income households. As Table 5.1 shows, in October 2010, the minimum income for a family with one child and one person working 35 hours a week will have increased by an estimated 27 per cent in real terms since 1999.
Table 5.1: Weekly minimum income guarantees (MIGs)
April 1999 October 2010 Percentage increase in real terms1
Family2 1 child, full-time work £182 £310 27%
Family2 1 child, part-time work £136 £242 33%
Single person, no children, 25 or over, full time work £113 £199 31%
Couple, no children, 25 or over, full-time work £117 £235 50%
Disabled person (single), working full-time £139 £248 33%
Disabled person (single), working part-time £109 £181 24%Assumes the rate of NMW and that the family is eligible for Family Credit/Disability Working Allowance in 1999 and for Working Tax Credit/Child Tax Credit in 2010. Full-time work is assumed to be 35 hours. Part-time work is assumed to be 16 hours. See Data Sources Document for details.1 RPI growth is taken from ONS historical series and HM Treasury’s economic forecast. 2 Applies to lone parent families and couples with children alike.
5.17 Take up of existing tax credits is already high. However, following recommendations of the Take-Up Taskforce, the Government is launching today an online resource that brings together advice on the range of financial support available to working age families. This will assist a range of intermediaries and local advisers to promote take-up at a national and local level.
5.18 To support families with young children and to continue to drive progress in tackling child poverty, the Government announces that, from April 2012, it will provide additional support by increasing the child element of the Child Tax Credit for each child aged one and two by £4 per week.
5.19 The Government also announces a package of measures to further support parents, and help individuals enter and progress in work, including:
from April 2010, HMRC will simplify the system for working parents who •claim the childcare element of the Working Tax Credit (WTC) for short periods of time, for example during school holidays. This ensures that parents receive support with childcare costs when they need it most;
from April 2011, guardians who receive special guardianship payments will •not see their Housing Benefit or Council Tax Benefit reduced to take these
8 Estimated using Retail Prices Index (RPI) data from the Office for National Statistics and HM Treasury assumptions on how the series will evolve between February and October 2010 (see Table C.1).
national Minimum Wage
tax credits
helping families with young
children
additional support
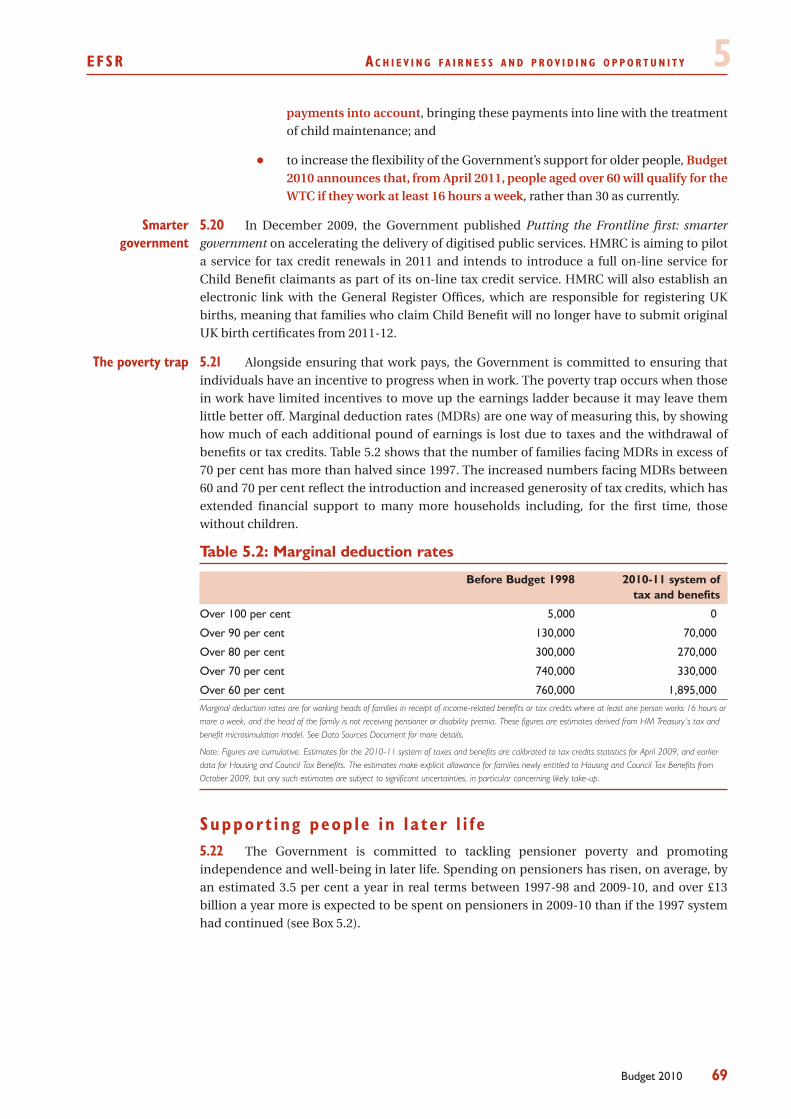
efsr A c h i e v i n g f A i r n e s s A n d p r o v i d i n g o p p o r t u n i t y 5
69Budget 2010
payments into account, bringing these payments into line with the treatment of child maintenance; and
to increase the flexibility of the Government’s support for older people, • Budget 2010 announces that, from April 2011, people aged over 60 will qualify for the WTC if they work at least 16 hours a week, rather than 30 as currently.
5.20 In December 2009, the Government published Putting the Frontline first: smarter government on accelerating the delivery of digitised public services. HMRC is aiming to pilot a service for tax credit renewals in 2011 and intends to introduce a full on-line service for Child Benefit claimants as part of its on-line tax credit service. HMRC will also establish an electronic link with the General Register Offices, which are responsible for registering UK births, meaning that families who claim Child Benefit will no longer have to submit original UK birth certificates from 2011-12.
5.21 Alongside ensuring that work pays, the Government is committed to ensuring that individuals have an incentive to progress when in work. The poverty trap occurs when those in work have limited incentives to move up the earnings ladder because it may leave them little better off. Marginal deduction rates (MDRs) are one way of measuring this, by showing how much of each additional pound of earnings is lost due to taxes and the withdrawal of benefits or tax credits. Table 5.2 shows that the number of families facing MDRs in excess of 70 per cent has more than halved since 1997. The increased numbers facing MDRs between 60 and 70 per cent reflect the introduction and increased generosity of tax credits, which has extended financial support to many more households including, for the first time, those without children.
Table 5.2: Marginal deduction rates
Before Budget 1998 2010-11 system of tax and benefits
Over 100 per cent 5,000 0
Over 90 per cent 130,000 70,000
Over 80 per cent 300,000 270,000
Over 70 per cent 740,000 330,000
Over 60 per cent 760,000 1,895,000Marginal deduction rates are for working heads of families in receipt of income-related benefits or tax credits where at least one person works 16 hours or more a week, and the head of the family is not receiving pensioner or disability premia. These figures are estimates derived from HM Treasury’s tax and benefit microsimulation model. See Data Sources Document for more details.
Note: Figures are cumulative. Estimates for the 2010-11 system of taxes and benefits are calibrated to tax credits statistics for April 2009, and earlier data for Housing and Council Tax Benefits. The estimates make explicit allowance for families newly entitled to Housing and Council Tax Benefits from October 2009, but any such estimates are subject to significant uncertainties, in particular concerning likely take-up.
Suppor t ing peop l e i n l a t e r l i f eThe Government is committed to tackling pensioner poverty and promoting 5.22
independence and well-being in later life. Spending on pensioners has risen, on average, by an estimated 3.5 per cent a year in real terms between 1997-98 and 2009-10, and over £13 billion a year more is expected to be spent on pensioners in 2009-10 than if the 1997 system had continued (see Box 5.2).
Smarter government
the poverty trap
5 A c h i e v i n g f A i r n e s s A n d p r o v i d i n g o p p o r t u n i t y efsr
70 Budget 2010
5.23 Older households are more vulnerable to the effects of the cold. Winter Fuel Payments, worth £300 to households with someone over 80 or £200 if someone is over the female State Pension Age, help with energy bills. Last winter, pensioner households received an additional payment alongside their Winter Fuel Payment, worth £100 to households with someone over 80 or £50 if someone is over the female State Pension Age. Budget 2010 announces this additional payment will be repeated in 2010-11. Low-income, vulnerable households also benefit from Cold Weather Payments and efficiency measures, such as Warm Front, permanently reduce pensioners’ energy bills.
Box 5.2 Supporting people in later life
Since 1997, the income of the poorest fifth of pensioners has increased as fast as that of the richesta and 900,000b pensioners have been lifted out of relative poverty. A pensioner is now no more likely to be in poverty than someone from the population as a whole.b
The basic State Pension is the foundation of the pensions system, on which private pension savings decisions can be based. The Government has committed to increase the basic State Pension by the higher of 2.5 per cent or the Retail Prices Index and has legislated to restore the link with earnings. The Government’s aim is to do this in 2012 subject to affordability and the fiscal position. A full basic State Pension will be £97.65 a week in 2010-11, or £156.15 for couples, an increase in real terms of 12 per cent since 1997.a Changes in 2002 made the additional earnings-related State Pension more generous to those on low incomes and expanded its coverage, and are expected to result in one million more people accruing State Second Pension from 2010. There is free access to certain services for all pensioners and everyone over the female State Pension Age benefits from free prescriptions, eye tests and off-peak bus travel. Television licences are free for the over 75s.
Additional resources are targeted at those with greatest need. Pension Credit, introduced in 2003 and received by 2.7 million households,c tackles pensioner poverty without undermining savings incentives. No single pensioner need live on under £132.60 a week in 2010-11, compared with around £69 in 1997, and no couple on under £202.40. The Government has legislated to increase these rates by average earnings while ensuring that means-tested provision stays focused on those with low savings. The Government continues to take steps to increase Pension Credit take up by running targeted campaigns and contacting those potentially eligible to receive it. A streamlined process now allows new Pension Credit claimants to claim Housing and Council Tax Benefit simultaneously.
Only 40 per cent of pensioners pay income tax. Age-related allowances mean no one aged between 65 and 74 pays tax on income below £9,490, or £9,640 if aged over 75. By April 2011, no pensioner aged over 75 will pay any tax on income below £10,000 a year.
a Pensioner Income Series, Department for Work and Pensions, 2007-08, and Data Sources Document.b Households Below Average Income, Department for Work and Pensions, 2007-08.c http://research.dwp.gov.uk/
5.24 Currently employers have the legal right to require individuals to retire at 65. The Government’s Ageing Strategy, Building a Society for All Ages, published in summer 2009, announced that the Government’s planned review of this legislation would be brought forward. Following the evidence submitted to this review, the Government intends shortly to launch a formal consultation on reforms to the Default Retirement Age, including considering options for: removing it; increasing it; and reforming the legislative framework to strengthen the position of the employee. No changes will be made before April 2011.
help with fuel bills
extending working lives
efsr A c h i e v i n g f A i r n e s s A n d p r o v i d i n g o p p o r t u n i t y 5
71Budget 2010
he lp ing f i r s t t ime buyer s and homeowners i n d i f f i cu l t y5.25 As part of its decisive action to help the UK economy through the global downturn, the Government has taken a number of steps to support homeowners. This has had a real impact in helping people stay in their homes, with repossessions 39 per cent lower than the Council of Mortgage Lenders’ forecast at the beginning of 2009.9 In addition, the number of households accepted as homeless by local authorities is continuing to fall and is down by 72 per cent since 2003.10 However, the housing market recovery is not yet locked in and the risk of repossession continues to be a challenge. The temporary freeze in the Standard Interest Rate used to calculate Support for Mortgage Interest payments has helped homeowners who have experienced a fall in income to remain in their homes. Budget 2010 announces that the Standard Interest Rate will be maintained at 6.08 per cent for a further six months until December 2010, benefiting around 220,000 homeowners. In addition, targeted help via the Mortgage Rescue Scheme and Homeowner Mortgage Support will continue into 2011.
5.26 The Government is committed to ensuring everyone has access to a decent home at a price they can afford. It has helped homebuyers through policies such as the stamp duty land tax holiday and funding of shared equity schemes such as HomeBuy Direct. Property transactions were up by over 50 per cent in the second half of 2009 compared to the first half.11
5.27 However, despite signs of a housing market recovery, affordability remains a real issue for first-time buyers. Budget 2010 therefore announces a two-year stamp duty land tax relief for first-time buyers for residential property purchases up to £250,000 to help reduce the upfront transaction cost faced by this group. In order to offset the cost of this relief and to sustain the public finances in the longer term, Budget 2010 also announces the introduction of an additional 5 per cent rate of stamp duty land tax for residential property over £1 million from 2011-12.
Securing groWth and StaB iL ity
As the economy emerges from the downturn, the Government has an important 5.28 role to play in setting policy to create the right economic environment to promote stability and growth. This will be essential to ensuring a prosperous future for the UK, which in turn will help enable the Government to achieve its commitment to eradicate child poverty by 2020 and foster growing and dynamic housing and third sectors. Setting a credible path for fiscal consolidation to ensure sound public finances is essential for economic stability. As set out in Chapter 2, the Government has set out plans to more than halve borrowing over four years. The Government’s strategy to promote savings across the life cycle, and to enhance the fairness and efficiency of the tax and pensions systems will also continue to support economic growth in the long term.
a f a i r and re spons ib l e s t ra tegy f o r f i s ca l conso l i da t i onSince the 2008 Pre-Budget Report, the Government has set out fair and responsible 5.29
plans for fiscal consolidation, with those with the highest incomes making the greatest contribution. Estimates indicate that around 60 per cent of the impact of fiscal consolidation announced since the 2008 Pre-Budget Report will be borne by the top 5 per cent of earners when fully implemented in 2012-13.12
9 Press Release, Council of Mortgage Lenders, 2009, http://www.cml.org.uk10 Statutory Homelessness: October to December 2009 England, CLG, 2009, http://www.communities.gov.uk11 Monthly Property Transactions in the United Kingdom, HMRC, 2009, http://www.hmrc.gov.uk 12 HM Treasury estimate.
real help for homeowners
helping homebuyers
Stamp duty land tax
5 A c h i e v i n g f A i r n e s s A n d p r o v i d i n g o p p o r t u n i t y efsr
72 Budget 2010
Budget 2010 confirms:5.30
a 1 per cent increase in national insurance contributions (NICs) rates from •April 2011, alongside adjustments to the NICs primary threshold to protect those on low incomes;
a 50 per cent additional rate of tax on those with incomes above £150,000 and •the gradual withdrawal of the personal allowance from those with incomes above £100,000 from April 2010;
freezing the point at which individuals start to pay the higher rate of tax in •2012-13;
restricting pensions tax relief from April 2011 for individuals with gross •incomes of £150,000 and over (where gross income incorporates all pension contributions, including benefits provided by an employer). This restriction is subject to an income floor, so that individuals with pre-tax incomes (excluding employer pension contributions) of less than £130,000 will be unaffected; and
a freeze in the inheritance tax (IHT) allowance of £325,000 in 2010-11.•
In addition, 5.31 Budget 2010 announces that the freeze in the IHT allowance will be extended until 2014-15.
Promot ing sav ings a c ross the l i f e c y c l eSound household finances also contribute to a stable economy. Having a stock of 5.32
savings provides individuals with stability and financial security throughout their lives. As set out in Box 5.3, the Government’s savings strategy has focused on developing well-targeted incentives for saving across the life cycle; and ensuring individuals have access to appropriate savings opportunities and the capability to make financial decisions.
efsr A c h i e v i n g f A i r n e s s A n d p r o v i d i n g o p p o r t u n i t y 5
73Budget 2010
Box 5.3 Encouraging people to save
The Government seeks to support saving and asset ownership for all across the life cycle: from childhood, through working life and into retirement.
To encourage saving for children, the Government introduced the Child Trust Fund (CTF) in •2005. Almost five million childrena have a CTF account with around £2 billion held.b Through the CTF, the Government provides support to all children through a £250 contribution at birth and age seven. It provides further support to those who need it most through additional Government contributions to children in low-income families, looked-after children, and from April 2010, disabled children. At maturity, 18 year olds will be able to roll over their funds into an Individual Savings Account (ISA).
The Government introduced ISAs in 1999 to offer adults across the income scale a simple, •flexible and accessible tax-advantaged opportunity to save. These have proved extremely successful: over 19 million adults hold almost £275 billion in ISAs.a
To provide additional support to save to working age adults on the lowest incomes, the •Government is introducing the Saving Gateway in 2010. The Saving Gateway will offer an estimated eight millionc people the opportunity to receive 50 pence from the Government for each £1 they save. The pilots have shown that “matching” is a simple and transparent incentive to save.
As people move through the life cycle, they are also encouraged to save towards retirement •through the provision of generous tax relief on pension contributions. The cost of pensions tax relief, net of income tax collected on pensions in payment, is estimated to be worth £18.9 billion in 2008-09.a Reforms to private pensions, including automatic enrolment into qualifying schemes and the introduction of the National Employment Savings Trust (NEST) scheme will ensure more people have the opportunity to save for their retirement in a pension, and take advantage of available tax relief.
a http://www.hmrc.gov.ukb HM Revenue & Customs administrative data.c HM Revenue & Customs estimate based on published Department for Work and Pensions and HM Revenue & Customs statistics.
5.33 From October 2009, ISA limits for people aged 50 and over were increased to £10,200, up to £5,100 of which can be held in cash; this additional scope for tax-advantaged saving has been widely taken up by older savers. From April 2010, all savers will be able to benefit from these higher ISA limits, including those who are saving towards their first home. Budget 2010 announces that, from April 2011 and over the course of the next Parliament, ISA limits will be indexed annually in line with the Retail Prices Index (RPI).
ISAs are a simple, flexible and accessible tax-advantaged savings vehicle. The 5.34 Government remains committed to these objectives, and also to supporting small and growing businesses. In this context, it intends to consult on allowing Alternative Investment Market (AIM) shares to be eligible as a tax-advantaged investment for retail savers.
5.35 Budget 2010 also announces that the first Saving Gateway accounts will be available in July 2010, and that Lloyds Banking Group, the Post Office and Royal Bank of Scotland Group intend to offer Saving Gateway accounts in 2010. The Government also expects that a significant number of credit unions will offer the accounts, and is continuing to discuss the Saving Gateway with other potential providers.
5.36 The key feature of the Saving Gateway is “matching”: the Government offering a contribution for each £1 saved. The pilots have shown that this provides a simple, transparent
iSa limits
Saving gateway
Matched saving
5 A c h i e v i n g f A i r n e s s A n d p r o v i d i n g o p p o r t u n i t y efsr
74 Budget 2010
and easily understood incentive to save. Building on this, and recognising the need for a wider section of society to develop a savings habit earlier in life, Budget 2010 announces that the Government will explore options for widening access to matched savings accounts, with the intention of introducing additional support by the end of the next Parliament.
The Government will consider the implications for potential account providers, 5.37 including exploring ways of ensuring that demand is manageable, and the administrative impacts minimised. An account targeted at basic-rate taxpayers aged 18-30 that provided half the government matching available in the Saving Gateway would cost around £30 million per annum in steady state. Final implementation, including eligibility criteria and match rates, would be subject to affordability, and to taking into account lessons from the Saving Gateway pilots and the rollout of the Saving Gateway nationally.
5.38 The Government wants to ensure that consumers have the support, information and confidence to make good financial decisions (as set out in more detail in Chapter 3). To this end, the Government has launched a national rollout of the Money Guidance service, is establishing a new independent consumer financial education body and making financial capability a statutory component of the curriculum in England. Chapter 3 also sets out the Government’s next steps on improving financial inclusion.
ach i ev ing a f a i r and e f f i c i en t pens ions s y s tem5.39 The Government is committed to helping people meet their income aspirations in retirement, while recognising the challenges of an ageing population. The implementation of a package of state and private pension reforms, including the introduction both of employer duties to auto-enrol employees into a qualifying pension scheme and the National Employment Savings Trust (NEST) scheme, is underway.
The Government is making the State Pension fairer and more widely available. For 5.40 those reaching State Pension Age from 6 April 2010, 30 years will be needed to qualify for a full basic State Pension instead of 44 years for men and 39 years for women. Changes to National Insurance credits mean carers will have improved opportunities to build their State Pension entitlement. As a result, around 75 per cent of women reaching State Pension Age in 2010 will be entitled to a full basic State Pension, compared with around 50 per cent without reform. Ninety per cent of men and women reaching State Pension Age are expected to obtain this entitlement by 2025.13 The female State Pension Age will gradually increase to 65 from April 2010 to April 2020. To reflect increased longevity and to ensure that the State Pension reforms are affordable, the State Pension Age will gradually rise from 65 in 2024 to 68 in 2046.
5.41 At the 2009 Pre-Budget Report the Government announced that, from April 2011, tax relief on pension contributions will be restricted for individuals on gross incomes of £150,000 and over (where gross income incorporates all pension contributions, including benefits provided by an employer), subject to an income floor of £130,000 (excluding employer pension contributions). Following a formal consultation, Budget 2010 confirms decisions on how the restriction of relief will be applied and delivered, and that deemed contributions to defined benefit pension schemes will be valued using the age-related factors method. Further details are set out in the document Implementing the restriction of pensions tax relief: A summary of consultation responses, published alongside Budget 2010. The Government intends to bring forward legislation on the core elements of the restriction in Finance Bill 2010, including provisions for tackling avoidance. The Government will continue to monitor areas of abuse and will act to develop further, targeted anti-avoidance provisions as necessary.
13 Department for Work and Pensions estimate.
helping people manage their
finances
Pensions reform
Pensions tax relief
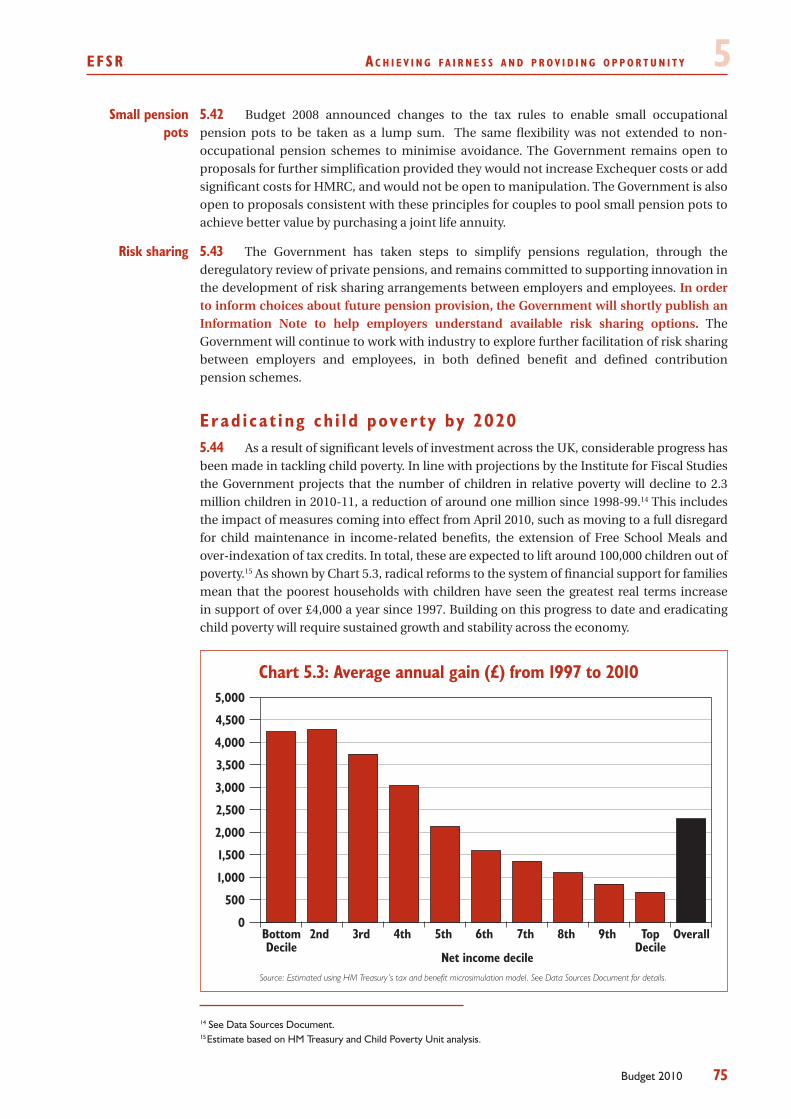
efsr A c h i e v i n g f A i r n e s s A n d p r o v i d i n g o p p o r t u n i t y 5
75Budget 2010
5.42 Budget 2008 announced changes to the tax rules to enable small occupational pension pots to be taken as a lump sum. The same flexibility was not extended to non-occupational pension schemes to minimise avoidance. The Government remains open to proposals for further simplification provided they would not increase Exchequer costs or add significant costs for HMRC, and would not be open to manipulation. The Government is also open to proposals consistent with these principles for couples to pool small pension pots to achieve better value by purchasing a joint life annuity.
5.43 The Government has taken steps to simplify pensions regulation, through the deregulatory review of private pensions, and remains committed to supporting innovation in the development of risk sharing arrangements between employers and employees. In order to inform choices about future pension provision, the Government will shortly publish an Information Note to help employers understand available risk sharing options. The Government will continue to work with industry to explore further facilitation of risk sharing between employers and employees, in both defined benefit and defined contribution pension schemes.
erad i ca t ing ch i l d pover t y by 2020As a result of significant levels of investment across the UK, considerable progress has 5.44
been made in tackling child poverty. In line with projections by the Institute for Fiscal Studies the Government projects that the number of children in relative poverty will decline to 2.3 million children in 2010-11, a reduction of around one million since 1998-99.14 This includes the impact of measures coming into effect from April 2010, such as moving to a full disregard for child maintenance in income-related benefits, the extension of Free School Meals and over-indexation of tax credits. In total, these are expected to lift around 100,000 children out of poverty.15 As shown by Chart 5.3, radical reforms to the system of financial support for families mean that the poorest households with children have seen the greatest real terms increase in support of over £4,000 a year since 1997. Building on this progress to date and eradicating child poverty will require sustained growth and stability across the economy.
Source: Estimated using HM Treasury’s tax and benefit microsimulation model. See Data Sources Document for details.
Chart 5.3: Average annual gain (£) from 1997 to 2010
0
500
1,000
1,500
2,000
2,500
3,000
3,500
4,000
4,500
5,000
OverallTopDecile
9th8th7th6th5th4th3rd2ndBottomDecile
Net income decile
14 See Data Sources Document.15 Estimate based on HM Treasury and Child Poverty Unit analysis.
Small pension pots
risk sharing
5 A c h i e v i n g f A i r n e s s A n d p r o v i d i n g o p p o r t u n i t y efsr
76 Budget 2010
5.45 The Government is committed to tackling child poverty. That is why the Government is taking forward the Child Poverty Bill that enshrines in legislation its historic pledge to eradicate child poverty in a generation. The Bill provides a clear definition of success as well as a transparent accountability framework. It also creates duties for local authorities to work together with delivery partners to tackle child poverty and set out the contribution they can make in their local areas.
5.46 Ending Child Poverty: Mapping the Route to 2020, published today, sets out the Government’s strategic direction to inform the first national strategy to be published within 12 months of Royal Assent of the Child Poverty Bill. In particular, the document sets out ways in which child poverty could be reduced in line with the targets and the potential impact achieving various outcomes could have on relative poverty. The modelling shows that increases in parental employment and reductions in in-work poverty have the potential to significantly reduce child poverty by 2020 and that sustainable eradication will depend on this being complemented by improvements in life chances through support for all families and early intervention.
5.47 Paid employment is the single most important factor in reducing the risk of poverty. Children in families with at least one parent in work are much less likely to live in poverty than children in workless families. While work is the best route out of poverty it is not a guarantee: the risk of experiencing in-work poverty falls dramatically when potential second earners move into the labour market. Supporting additional earners to move into work is a vital part of the strategy to eradicate child poverty. The Government will therefore consider options to improve the work incentives and support for second earners moving into and progressing in the labour market, including initiatives such as the School Gates Employment Support Initiative and other outreach work which is providing help for parents to go back to work as their children get older.
Suppor t ing a g row ing hous ing sec tor5.48 The Government has provided significant support to the house building and construction industries through the economic downturn to maintain economic activity, jobs and capacity and help stimulate wider economic recovery. In total, the Government has now committed £7.5 billion over two years to deliver up to 112,000 affordable homes, and around 15,000 private sector new homes.16 The Government’s investment in affordable housing has been key to sustaining delivery of much-needed homes during the downturn and recovery. As set out in Building Britain’s Future,17 more affordable homes are being built this year and next than before the recession. The Local Authority New Build programme of over 4,000 new council houses is the largest council house building programme in nearly two decades. Following Budget 2010, the Government will consult on detailed plans to replace the council housing finance system with a self-financing system.
5.49 As the economy recovers, the Government is taking action to promote a strong long term recovery in the house building industry and to help maintain affordability by addressing the long term housing supply challenge. The Government has undertaken a study into the drivers of housing growth and the key challenges facing the industry and identified these as: supply of viable land, the regulatory cost on the industry and the skills and innovation within the industry. The Government will work jointly with industry through a ministerially sponsored action group to address these challenges and develop proposals for action. Similarly, the recent Government consultation, Investment in the UK private rented sector,18
16 Growth funds. CLG, 2009, http://www.communities.gov.uk17 Building’s Britain’s Future, HMG, 2009, http://www.hmg.gov.uk18 Investment in the UK Private Rented Sector, HMT, 2009, http://www.hm-treasury.gov.uk
the child Poverty Bill
ending child Poverty:
Mapping the route to 2020
Supporting second earners
Support for the house building
industry
unlocking future housing growth
efsr A c h i e v i n g f A i r n e s s A n d p r o v i d i n g o p p o r t u n i t y 5
77Budget 2010
invites industry to work with the Government to consider the contribution the private rented sector could make to addressing demand, housing supply and any barriers to investment. The Government is also taking forward a package of reforms to drive up quality and professionalism in the sector.
5.50 Ensuring local authorities bring forward a sufficient supply of viable land is essential to a recovery in the house building industry. The Government is publishing results from comprehensive checks of local land supply strategies alongside the Budget. Budget 2010 announces the Planning Inspectorate will continue to report on the position across the country, and from 2010-11 the Government will withhold the relevant elements of the Housing and Planning Delivery Grant from local authorities that fail to produce satisfactory five-year land supply assessments. Building on the success of the Public Land Initiative, the Government will lead the way by bringing forward more surplus public sector land and will consider further measures in this area such as introducing targets across government for the number of homes that will be built on public land.
5.51 Regulation needs to be proportionate, transparent and predictable. The Government is working closely with industry to finalise a national baseline of regulatory costs, which will enable better management of the cumulative impact of regulation. The Government will reduce the regulatory costs on the house building industry as part of the indicative £1 to £1.25 billion savings to be achieved through the Built Environment theme of the 2010-2015 Simplification Target, and intends to set out progress at Budget 2011. Furthermore, the Government will limit the consideration of new regulations to fixed intervals. The Government will work with local authorities to ensure that local requirements are proportionate, respond flexibly to economic conditions and do not unduly constrain development. The Government will shortly consult on how a scaled back Section 106 will operate. The Government has prioritised zero carbon homes and will continue to work with industry on the best way of delivering the policy.
char i t y t axa t i onThe Government is committed to increasing the role of the third sector in helping to 5.52
deliver socially beneficial outcomes. Detail of the Government’s proposals can be found in Chapter 6.
5.53 Gift Aid continues to be a very successful tax relief, with total claims from charities since 2000 now exceeding £5.7 billion.19 In February, the Government set up a Gift Aid forum to consider possible reforms and simplifications, informed by the Gift Aid donor research published in December 2009. The forum will make recommendations by the autumn.
5.54 Following a decision in the European Court of Justice in January 2009,20 Budget 2010 announces that the UK’s tax reliefs for charities and charitable giving will be extended to certain EU charities. Alongside this, a new definition of charity for tax purposes is being introduced and a number of other consequential changes are being made to the existing compliance regime and Gift Aid process.
5.55 The Government is committed to replacing the anti-avoidance rules relating to substantial donors to charities and will continue to explore the details of the proposed new purpose test with interested parties.
19 http://www.hmrc.gov.uk20 Hein Persche v Finanzamt Lüdenscheid (C-318/07).
Land supply
regulation
gift aid
charity tax relief
Substantial donors
5 A c h i e v i n g f A i r n e s s A n d p r o v i d i n g o p p o r t u n i t y efsr
78 Budget 2010
5.56 The Government will continue to consider stakeholder views and responses to last year’s consultation on charity pooled funds, along with the proposed EU directive on alternative investment fund managers before responding in the autumn.
a Modern and fa ir tax SySteM
Protec t ing t ax r evenuesThe global economic crisis and the response to it have been catalysts for concerted 5.57
domestic and international action in areas such as tax transparency, and tackling avoidance and evasion. The Government is taking further action to change the game for those who seek to bend or break the rules on tax, which will promote long-term sustainable growth.
Budget 2010 announces a package of measures to protect tax revenues of £4 billion 5.58 and which yield £1.5 billion by 2012-13.
5.59 The disclosure regime has transformed the way in which the Government tackles avoidance, providing early information that has led to the closure of over £12 billion in avoidance opportunities since 2004. Following the consultation announced in the 2009 Pre-Budget Report, Budget 2010 announces a significant package of measures to strengthen and enhance the regime to:
bring forward the time when the disclosure of a scheme is required;•
increase penalties to tackle those who do not comply with the disclosure •rules;
introduce a requirement for third party introducers to identify scheme •promoters;
introduce a requirement for promoters to provide lists of clients to whom •they have provided schemes; and
extend and enhance the hallmarks that require the disclosure of avoidance •schemes, including schemes involving employee remuneration and those designed to convert income into capital.
Furthermore, following discussions with industry, the Government is exploring how 5.60 inheritance tax charges applying to trusts can be brought within the disclosure regime.
5.61 There has been active marketing of avoidance schemes to high-income individuals in response to the new additional rate of income tax and other changes such as the restriction of relief for pension contributions. Although there is increased take-up of existing schemes, intelligence from the disclosure regime and elsewhere suggests that few new schemes are being devised. Nevertheless, the Government has demonstrated that, when new threats do arise, it acts swiftly to counter them. Moreover, improvements to the disclosure regime set out above will help HMRC to detect new threats more quickly.
HMRC has used its 5.62 Spotlights publication21 to make taxpayers and their agents aware of the risks of taking up avoidance schemes. It will continue to use litigation as a tool to tackle avoidance and has recently been successful in the areas of residence and the use of arrangements to reward employees through intermediaries to avoid tax. In addition, HMRC is strengthening its focus on the risks presented by the wealthiest individuals through its creation of the High Net Worth Unit.
21 http://www.hmrc.gov.uk
charity pooled funds
disclosure regime
Personal tax avoidance
efsr A c h i e v i n g f A i r n e s s A n d p r o v i d i n g o p p o r t u n i t y 5
79Budget 2010
Budget 2010 announces action on the use of geared growth arrangements within 5.63 the company share option plan (CSOP) and consultation in summer 2010 on taxing other returns from geared growth, following the increased use of tax-motivated arrangements involving employment-related securities. The Government also announces future action to tackle the use of arrangements to reward employees through the use of trusts or other intermediaries, with the purpose of avoiding, deferring or reducing liabilities to income tax and NICs or avoiding restrictions on pensions tax relief. The Government will consider options for tackling these avoidance arrangements with the intention of introducing any necessary legislation to take effect from April 2011.
5.64 Budget 2009 introduced, for the first time, principles-based legislation in areas that have experienced sustained attempts at avoidance. This makes the intention of the legislation clear and provides a robust defence against avoidance in the longer term. Budget 2010 builds on this success by announcing a discussion document on a principles-based approach to tackle avoidance schemes arising from the differing tax treatments of financial products within a group of companies. Budget 2010 also announces principles-based legislation, alongside targeted fixes, to stop companies claiming excessive relief in the UK for foreign taxes through abuse of the double tax relief rules.
Since the 2009 Pre-Budget Report, the Government has acted quickly in response to 5.65 emerging avoidance threats by announcing immediate action to:
block the abuse of tax relief on the donation of certain investments to •charities including potential retrospective action against further abuse in this area;
stop unjustified capital losses where non-domiciled individuals remit •overseas income from foreign currency bank accounts;
close a loophole to prevent corporate tax avoidance when trade assets are •transferred out of an overseas branch of a UK company; and
prevent the exploitation of the rules concerning sale and repurchase •transactions to exclude income receipts from tax.
Furthermore, 5.66 Budget 2010 announces action to ensure that both individuals and companies pay their fair share of tax by:
closing a loophole through which the remittance basis rules can be •circumvented;
countering avoidance using loans to participators;•
stopping corporate tax avoidance involving share incentive plans;•
applying stamp duty land tax anti-avoidance rules to certain partnership •transactions;
closing a loophole through which the sale of lessor companies election can •be exploited;
simplifying the legislation on transactions in securities while better •targeting the transactions involving avoidance;
revising the draft legislation to close a loophole through which fees are •artificially carved out of a taxable insurance contract to avoid insurance premium tax; and
Principles-based legislation
5 A c h i e v i n g f A i r n e s s A n d p r o v i d i n g o p p o r t u n i t y efsr
80 Budget 2010
introducing a targeted anti-avoidance rule to ensure that the increase in •the Annual Investment Allowance (see Chapter 4) is focused on support for genuine business investment.
5.67 The Government will introduce a power to enable the overhedging/underhedging provisions announced in the 2009 Pre-Budget Report to be extended in the case of banks and other financial traders to instruments other than loans and derivatives.
5.68 The 2009 Pre-Budget Report announced the introduction of a Code of Practice on Taxation for banks. Banks have begun to inform HMRC that they have adopted the Code. Many banks that have not yet adopted it have largely completed their internal processes; HMRC expects these banks to adopt the Code in the next few weeks. The Government is pleased with the progress to date and will publish statistics on adoption in HMRC’s Annual Report.
5.69 Last year, as G20 President, the UK led international action to improve tax transparency and to ensure that developing countries are able to share in the benefits of this new openness. The UK strongly supports these developments, and has committed to launch a multilateral instrument to increase international tax transparency by the end of 2010. The Government has written to a cross-section of developing countries to invite them to join the UK in exploring how best to take this work forward.
The UK also recognises the importance of capacity building to open up tax 5.70 information to developing countries and stands ready to host a conference focused on the technical work of tax administrations in developing countries later this year. In addition, the UK has led efforts to place Country-by-Country reporting on the international agenda and fully supports the OECD in its work to develop guidelines in this area.
5.71 Tax evaders hold their money offshore in order to try to hide it beyond the reach of HMRC’s information powers. Following the consultation launched at the 2009 Pre-Budget Report, the Government will legislate to ensure that those who fail to declare income and gains from jurisdictions that do not exchange information automatically with the UK will face tougher penalties of up to 200 per cent of the tax due. HMRC will also look further at what information it needs to collect on offshore assets, including offshore bank accounts.
5.72 The Liechtenstein Disclosure Facility (LDF) was set up following a ground-breaking agreement between the UK and Liechtenstein in August 2009. The LDF, which runs until 31 March 2015, allows people with unpaid taxes linked to investments or assets in Liechtenstein to settle their tax liability, including interest and penalties. It is estimated that, over the lifetime of the LDF, this will bring in £940 million. In addition, the LDF will enable certain people with untaxed money in other jurisdictions to take advantage of the facility to make a disclosure.
5.73 The Government is committed to fighting VAT missing trader intra-community fraud, and intends to legislate in Finance Bill 2010 to replace the temporary zero rate, introduced in July 2009 to combat fraud in emissions allowances, with a reverse charge as the agreed EU counter-measure.
5.74 The 2009 Pre-Budget Report announced the formation of the group to consider what actions HMRC can take on the hidden economy. The group has identified that there is currently no clear route for those with undeclared tax to establish their position and disclose their liabilities. HMRC will improve this process. The group has highlighted several key areas for further work and detailed analysis:
overhedging / underhedging
code of Practice on taxation for
banks
international action
offshore evasion
Liechtenstein disclosure facility
emissions allowances
trading
hidden economy advisory group
efsr A c h i e v i n g f A i r n e s s A n d p r o v i d i n g o p p o r t u n i t y 5
81Budget 2010
to build on the success of HMRC’s current and past disclosure opportunities •in offering mechanisms for leaving the hidden economy;
to consider how HMRC can better link access to work opportunities to •operating in the formal economy; and
to educate people as to the unacceptability of evading tax and the dangers of •working informally.
The group will continue to meet over the coming months to work up more detailed 5.75 proposals and the Government intends to launch a consultation later in the year.
5.76 April 2010 will see the implementation of a range of measures announced last year, which will deliver further tools with which HMRC can ensure that the correct amount of tax is paid by taxpayers:
the power to publish names of serious tax evaders;•introduction of new late-payment penalties for some taxes; and•the extension of new compliance checking powers to further taxes.•
5.77 Financial securities are currently required for VAT from some non-compliant businesses. They have proved a successful tool in protecting tax revenues. The Government announces the extension of the power to require financial securities to cover PAYE and NICs at serious risk of non-payment.
5.78 The 2009 Pre-Budget Report announced a number of consultations that closed earlier this month. Budget 2010 announces the publication of response documents and an intention to legislate as soon as possible in the next Parliament on the following:
modernising the excise compliance checking regime;• and
completing the modernisation of the penalty and interest regimes.•
5.79 The 2009 Pre-Budget Report announced a second consultation on how HMRC should work with agents to ensure that fewer inaccurate returns are submitted. Consultation on the accompanying draft legislation continues and HMRC will publish an overall response document once this has closed.
5.80 The Government is committed to tackling tax debt robustly. Budget 2010 announces a new target on debt collection for 2010-11, which will challenge HMRC to collect significantly more debt within one and three months of it arising. The details will be published in HMRC’s forthcoming Business Plan.
5.81 The Government will modernise the regime governing claims to recover overpaid stamp taxes and petroleum revenue tax to provide a simpler and more consistent approach with enhanced taxpayer safeguards. The Government intends to introduce legislation as soon as possible in the next Parliament.
a modern and f a i r t ax s y s tem5.82 The annual exempt amount for capital gains tax will be held at £10,100 for 2010-11 in line with statutory indexation.
5.83 Cider duty rates will increase by 10 per cent above inflation on 29 March 2010 to bring them more into line with the duty rates on other alcohol products. From 1 September 2010, the technical definition of cider will be changed to ensure products that more closely resemble made-wines are taxed appropriately. No changes will be made to the structure of cider duty but this will be kept under review.
compliance powers
financial securities
hMrc powers, deterrents and
safeguards
Working with tax agents
tax debt target
error & mistake
capital gains tax
cider duty
5 A c h i e v i n g f A i r n e s s A n d p r o v i d i n g o p p o r t u n i t y efsr
82 Budget 2010
5.84 As announced at Budget 2008, alcohol duty rates on beer, wine and spirits will increase by 2 per cent above inflation on 29 March 2010. This will add 2 pence to the price of a pint of beer, 10 pence to the price of a bottle of wine, and 36 pence to the price of a bottle of spirits. In addition, alcohol duty rates on all products will increase by 2 per cent above inflation each year to 2014-15.
5.85 The Government is committed to maintaining high tobacco duty rates to support health policy on smoking. The Government announces that today tobacco duty rates will increase by 1 per cent above inflation each year, adding 15 pence to a packet of cigarettes. Budget 2010 also announces that tobacco duty rates will increase by 2 per cent above inflation each year to 2014-15.
5.86 As first announced at the 2009 Pre-Budget Report, the rate of bingo duty will reduce to 20 per cent for accounting periods starting on or after 29 March 2010.
5.87 From 4pm on 26 March 2010, all rates of amusement machine licence duty will be increased in line with inflation. Gaming duty bands will increase in line with inflation for accounting periods starting on or after 1 April 2010.
5.88 The Government intends to amend VAT legislation as soon as possible in the next Parliament to:
restrict the exemption for postal services to those services which Royal Mail •is obliged to provide;
amend the scope of the zero rate for aircraft supplies from one based on the •aircraft’s weight and usage to one based on the status of the customer;
comply with a new VAT directive which requires changes to arrangements •whereby businesses pay VAT over time to reflect the private use of capital assets, and to the rules relating to natural gas, and heat and cooling, in networks; and
protect revenues associated with current arrangements relating to the non-•business use of capital assets.
5.89 The Government recognises the efficiencies that can be achieved by organisations such as charities sharing services and the potential VAT barrier that exists. The Government will work with charities and other affected sectors to consider options for implementing the EU cost sharing exemption.
5.90 The Government announces that the clearing relief rules for stamp taxes on shares will be clarified by explicitly including members of clearing houses and their nominees. The Government intends to legislate this in Finance Bill 2010.
5.91 The Government intends to modify the transfer of business rules for life insurance companies as soon as possible in the next Parliament. Although the three-year programme to improve the tax regime for life insurers came to a close last year, HMRC continues to work closely with the industry to ensure that, where beneficial, additional changes will be made.
5.92 The Government announces that, from 1 April 2010, plant and machinery capital allowances for cushion gas will be given at the special rate of 10 per cent. In addition, all leases of cushion gas will be deemed to be long funding leases, allowing the lessee to claim the capital allowances.
alcohol duty
tobacco duty
Bingo duty
gambling duties
changes to vat rules
vat shared services
Stamp taxes on shares
Life insurance
cushion gas
efsr A c h i e v i n g f A i r n e s s A n d p r o v i d i n g o p p o r t u n i t y 5
83Budget 2010
5.93 Following the introduction of the new additional rates of income tax effective from 6 April 2010, the Government will introduce legislation, as soon as possible in the next Parliament, to allow life insurance deficiency relief at the dividend additional rate and the additional rate.
5.94 The Government published a summary of responses to the consultation on false self-employment in construction on 9 March 2010. The Government is committed to addressing this problem and will continue to work with stakeholders to develop a legislative solution.
5.95 The Government launched a consultation on 5 March 2010 on possible changes to the rules on the collection of income tax deducted at source from interest and similar payments. The consultation will close on 28 May 2010.
5.96 The Government announces that, with effect from 6 April 2010, where settlors are liable to income tax on trust income at a lower rate of tax than paid by the trustees, they will be required to pay the difference to the trustees, and these resulting payments will be disregarded for inheritance tax purposes. The Government intends to legislate this measure as soon as possible in the next Parliament.
5.97 The Government intends to extend the income tax exemption for adopters to those caring for children under a Special Guardianship order or certain Residence Orders. The Government intends to legislate this measure as soon as possible in the next Parliament, with effect from 6 April 2010.
5.98 The Government is today announcing measures, which it intends to legislate as soon as possible in the next Parliament, to help trusts specifically set up to compensate asbestos victims, but which have been unable to access tax efficient structures for the benefit of those victims.
deficiency relief
false self-employment
interest: deduction of tax
Settlor trusts
Special guardians
asbestos trust taxation

84 Budget 2010
85Budget 2010
6 P r o t e c t i n g P u b l i c s e r v i c e s
The Government’s short-term priority, as Britain emerges from recession, is to foster economic recovery whilst continuing to provide targeted support to those families and businesses that need it most. Budget 2010 announces new measures to stimulate economic growth, including a £270 million university Modernisation Fund to finance 20,000 additional student places and £450 million to extend to March 2012 the guarantee of a job, training or work placement for every 18 to 24 year old who has been claiming Jobseeker’s Allowance for six months. Budget 2010 also announces that pensioner households will receive an extra payment alongside the Winter Fuel Payment later this year.
For the medium term, Budget 2010 sets out further details on the Government’s plans to protect key public service priorities whilst meeting its commitment to halve public sector net borrowing over the next four years. Planned levels of overall spending in 2010-11 will continue to rise, supporting the economy through recovery, but from 2011-12 spending growth will be slower. Public sector current expenditure will grow at an average of 0.8 per cent a year from 2011-12 to 2014-15 and public sector net investment will fall to 1¼ per cent of GDP by 2013-14.
Budget 2010 confirms that spending on frontline schools and NHS, 16 to 19 education and Sure Start will be protected in the years to 2012-13, with sufficient funding provided to maintain police officer numbers. At the same time, Budget 2010 announces further details of the tough choices the Government is making elsewhere, including:
action to control public sector pay, • including confirming a one per cent cap on basic pay uplifts for 2011-12 and 2012-13, saving £3.4 billion a year, and a new Code of Practice on senior pay-setting, with greater use of independent Remuneration Committees and escalation of decisions to ministers, or audit and regulatory bodies, where there is a proposal to pay above agreed norms;
£11 billion of operational efficiencies and other cross-cutting savings• , to streamline the centre of government;
further detail on £5 billion of savings from targeting and prioritising spending• , as announced at the 2009 Pre-Budget Report;
reforms to the welfare system to increase fairness and improve work incentives• , further reducing social security spending over the next five years on top of the existing forecast saving of £1.2 billion;
rationalising regional structures and removing burdens on local government• , including giving local authorities new discretion over £1.3 billion of funding that is currently ring-fenced; and
plans to manage assets and property more effectively by creating new strategic •property vehicles by April 2011, to help realise savings of £5 billion a year in property running costs and £20 billion savings in asset disposal by 2020. The Government will also relocate 15,000 civil service jobs out of central London within five years.
SUSTA IN ING EFF IC IENT AND EFFECT IVE PUBL IC SERV ICES
6.1 Since 1997, the Government has delivered radical and lasting improvements in Britain’s public services, matching record levels of investment with a strong focus on reform. Total public spending has increased by 57 per cent in real terms, compared with 15 per cent in the preceding 12 years, with unprecedented levels of real terms investment in frontline public services. Since 1997, NHS spending in England has more than doubled in real terms, education spending in the UK has increased by 65 per cent, spending on universities has
Improvements in public services
6 P r o t e c t i n g P u b l i c s e r v i c e s eFsr
86 Budget 2010
increased by 25 per cent, spending on the police by central government has increased by 19 per cent, and the defence budget has increased by over 10 per cent. This has enabled public services to deliver high quality and sustainable outcomes, for example:
almost all people who need it receive hospital treatment within 18 weeks, •referral to a cancer specialist within 2 weeks and A&E treatment within 4 hours;
the number of pupils gaining five or more good GCSEs has increased from 45 •per cent in 1997 to 70 per cent in 2009;
more students are able to go to university than ever before, with 390,000 more •students in 2009-10 than in 1997; and
there are now over 16,000 more police officers and 16,500 Community •Support officers than in 1997, playing a vital role in keeping Britain’s communities safe and secure.
6.2 In particular, the Government has reversed a legacy of under-investment in infrastructure. Record levels of capital investment mean that public sector net investment (PSNI) is now at its highest level in 30 years, up from 0.7 per cent of GDP in 1997-98 to 3.6 per cent in 2009-10. This has meant dramatic increases in capital investment in public services, with £3.1 billion more invested in the NHS, £6.6 billion more in education and £8.6 billion more in housing and community amenities. As a result:
the NHS has delivered the largest hospital building programme in its history, •with 118 new hospital schemes opened and a further 18 under construction;
almost 4,000 schools have been rebuilt or refurbished and 3,500 Sure Start •Children’s Centres have been established; and
1 million more social homes now meet the Decent Homes standard. With •other schemes, this is expected to lift over a million children out of poor housing.
6.3 Alongside this additional investment, the Government has implemented radical reforms to improve public services: firstly, by setting targets and clear national standards to improve performance; then, as services were improved, by increasing flexibility and incentives at the front line. Working Together – Public Services on your side1, published in March 2009, set out in more detail the three underlying principles for taking forward further public service reform:
making citizens more aware of what they can expect from public services, •creating clear entitlements and providing more choice and control;
giving frontline professionals the freedom, skills and power to respond to the •needs of the service user; and
providing clear strategic leadership from central government, setting •standards and entitlements, but then standing back.
1 Working Together – Public Services on your Side, HM Government, March 2009.
Long-term capital investment
Public service reform
eFsr P r o t e c t i n g P u b l i c s e r v i c e s 6
87Budget 2010
These principles were taken forward in 6.4 Putting the Frontline First: smarter government (Smarter Government)2 in December 2009 and progress is reported later in this chapter.
6.5 The Government also has a strong record on improving value for money in its spending. During the 2004 Spending Review period departments over-delivered on the Government’s value for money target by 20 per cent, achieving savings of £26.5 billion. During the 2007 Comprehensive Spending Review (CSR) period the Government has committed to cash-releasing value for money savings worth £35 billion by the end of 2010-11. Departments are making good progress towards this target and Budget 2010 announces that £10.8 billion of efficiencies had been delivered by autumn 2009. For example, the Department of Health (DH) has saved over £2 billion, including by promoting collaborative procurement and reducing the price of branded prescription drugs, and is driving further efficiency improvements across the NHS to improve quality and productivity, such as reducing length of stay by enabling hospital patients to recover and return home more quickly.
SUPPORT ING THE ECONOMY THROUGH RECOVERYPublic services play a vital role in supporting Britain’s long-term growth and 6.6
competitiveness. Increased investment and reform over the last decade has strengthened the ability of the British economy to respond to the difficulties experienced over the last two years, when all the world’s major advanced economies have been affected by the most severe and synchronised global downturn since the Great Depression. During the recession, the Government’s approach has been to allow spending to rise in the short term to support the economy. This timely and effective action helped to avoid a significantly worse outcome and the economy is now showing early signs of modest recovery.
6.7 At the 2008 Pre-Budget Report, the Government brought forward £3 billion of capital spending from 2010-11 into 2008-09 and 2009-10 to help support aggregate demand and maintain jobs during the economic downturn. A projected £2.3 billion of investment has been delivered to the end of February 20103, and plans are in place to deliver the remainder by the end of the year. This additional investment will:
raise 10,000 more social homes to the Decent Homes standard in 2009-10;•
benefit over 140 projects in Higher Education institutions, including a new •building for the Centre for Immunology and Infection at York. All of these projects are expected to be completed by the end of 2009-10;
assist 38,000 vulnerable households in 2009-10 through the Warm Front •programme, saving them up to £300 a year on energy bills; and
accelerate investment in high value schemes on the strategic road network, •including the A46 road-widening scheme, hard shoulder strengthening on the M6 and barrier renewals on the M1 and M18.
6.8 As well as bringing forward capital spending to support the economy, the Government has provided targeted support to families and businesses most affected by the recession. As set out in Chapter 5, Budget 2010 provides an update on those measures and announces further support in key areas. For example:
2 Putting the Frontline First: smarter government, HM Government, December 2009.3 Estimated spending to end of February 2010 based on projections and some initial estimates of financial management information. The first full year provisional outturns for fiscal stimulus spending will be published in the HM Treasury statistical release of public expenditure outturns in Summer 2010.
Value for money
Capital fiscal stimulus
Supporting families and
businesses
6 P r o t e c t i n g P u b l i c s e r v i c e s eFsr
88 Budget 2010
the guarantee of a job, work placement or training for young people who •are out of work for six months or more is now available across the country, with 120,000 Future Job Fund job placements provided up to March 2011. Budget 2010 announces that this guarantee will be extended until March 2012, funded through underspends in the money already set aside for the Department for Work and Pensions (DWP);
in 2009 an additional pensioner payment of £100 for households with •someone aged over 80 and £50 for households with someone over the female State Pension Age was made alongside the Winter Fuel Payment. Budget 2010 announces that this payment will be made again to pensioner households in winter 2010-11;
the 2009 Pre-Budget Report announced that from September 2011 all primary •school pupils in working families with a household income below £16,190 would be eligible for Free School Meals. Budget 2010 announces that from 2012-13, there will be a £4 a week supplement in the Child Tax Credit for children aged one and two, funded by a reduction in incorrect payments in benefit processing, as set out in paragraph 6.42; and
around 220,000 households have benefited from the freeze in the Standard •Interest Rate (SIR) for Support for Mortgage Interest (SMI) at 6.08 per cent. Budget 2010 announces that this will be extended for a further six months, to the end of December 2010.
6.9 The Government has an important role to play in supporting a sustainable recovery and providing the conditions for economic growth. Chapter 2 sets out the action being taken to ensure there is a stable macroeconomic environment and Chapter 4 sets out the microeconomic measures being put in place to help foster growth. The Strategic Investment Fund, launched at Budget 2009, has already announced over £800 million worth of specific support for advanced manufacturing projects of strategic importance; and the Enterprise Finance Guarantee Scheme has provided an estimated over £900 million in loans to almost 9,000 small and medium-sized enterprises (SMEs). As set out in Chapters 4 and 7, Budget 2010 announces a package of new spending measures to promote growth, partly funded through reprioritisation within overall departmental spending, including:
to support new, small and growing firms: the launch of UK Finance for •Growth (UKFG), which will be responsible for overseeing over £4 billion of existing SME support, including the Growth Capital Fund announced in the 2009 Pre-Budget Report;
to boost skills: 20,000 additional student places starting in September 2010, •with teaching costs funded through a university Modernisation Fund to promote greater efficiency, and all other costs paid by the Government; and
to help develop the UK’s infrastructure: the Government intends to establish •a Green Investment Bank. The Government will start by investing up to £1 billion from the sale of mature infrastructure-related assets, and will match this with at least £1 billion from private sector investment.
6.10 As set out in the 2009 Pre-Budget Report, capital spending in the next Spending Review will be focused in the areas where it generates high economic returns, in order to
Creating the conditions for
growth
Infrastructure spending
eFsr P r o t e c t i n g P u b l i c s e r v i c e s 6
89Budget 2010
achieve maximum long-term benefit for the taxpayer. Infrastructure UK (IUK), announced in Building Britain’s Future 4, will assist in this task, and the IUK Strategy for national infrastructure 5, published as a supplementary document to Budget 2010, sets out the actions that IUK will take to ensure the Government develops effective long-term plans and priorities, enables long-term investment and improves delivery of infrastructure projects.
SUSTA INABLE MEDIUM-TERM PATH FOR PUBL IC SPENDING
Alongside action to help foster recovery, the Government is restoring the strength 6.11 of the public finances, which is critical to long-term economic growth and stability. Risks to recovery remain and reducing spending too quickly could damage growth. So Budget 2010 confirms that levels of overall spending will continue to rise in 2010-11, locking-in the recovery and providing a platform for long-term sustainable growth. But from 2011-12, when the economy should be able to support a more rapid tightening, spending growth will reduce in order to ensure sustainable public finances over the medium term.
6.12 Budget 2010 confirms the spending growth assumptions set out in the 2009 Pre-Budget Report, with public sector current expenditure (PSCE) growing by an average of 0.8 per cent a year in real terms from 2011-12 to 2014-15 6 and public sector net investment (PSNI) decreasing to 1¼ per cent of GDP by 2013-14 and remaining at that level in 2014-15. The Government is determined to make the decisions necessary on spending to help halve public sector net borrowing over the next four years, as set out in the Fiscal Responsibility Act. To do this will require tough choices, but over the last 18 months, the Government has set out a clear plan for delivering on these commitments and Budget 2010 implements the next steps.
Pub l i c Se r v i c e Pr io r i t i e s 6.13 In the 2009 Pre-Budget Report the Government made a clear commitment to protect
key frontline public service priorities in 2011-12 and 2012-13 and announced that:
NHS frontline spending – the 95 per cent of near-cash funding that supports •patient care – will rise in line with inflation;
frontline resource spending in schools will rise by 0.7 per cent in real terms; •resource spending for 16-19s participation will rise by 0.9 per cent in real terms; and resource spending on Sure Start Children’s Centres will rise in line with inflation. Free childcare will continue to be available for three and four year olds;
sufficient funding will be available to enable Police Authorities to maintain •the current number of warranted Police Officers, Police Community Support Officers and other staff exercising police powers; and
spending on international development will continue to rise in the next •Spending Review period to meet the Government’s Official Development Assistance (ODA) commitment in 2013 as planned.
4 Building Britain’s Future, HM Government, June 2009.5 Strategy for national infrastructure, HM Treasury and Infrastructure UK, March 2010.6 Excluding the additional time limited expenditure announced in the 2009 Pre Budget Report and all the additional expenditure announced in Budget 2010.
Spending assumptions
Protecting the front line
6 P r o t e c t i n g P u b l i c s e r v i c e s eFsr
90 Budget 2010
6.14 Alongside this additional investment, the Government has a comprehensive programme in place to deliver efficiency savings at the front line to re-invest in priorities. For the NHS, work at a national level, including through the Public Value and Operational Efficiency Programmes, has identified several potential areas. But these savings can only be translated into reality by local NHS organisations, so will be challenged, tested, refined and supplemented as the NHS develops its local plans. Budget 2010 confirms that the NHS will deliver annual efficiency savings of £15 to 20 billion by 2013-14. Areas already identified include:
£3.5 billion through raising staff productivity• by systematically spreading best practice, improving staff health and well-being and reducing dependency on agency staff;
£2.7 billion by transforming the lives of people with long-term conditions, •through best practice in care planning and case management, empowering patients to self-care, reducing emergency admissions levels to be on a par with the best levels internationally and providing more efficient, integrated community services;
£2 billion through better procurement, savings in management and back •office costs and more efficient use of the hospital estate; and
£1.5 billion through more effective commissioning• by reducing unnecessary referrals and prescriptions, and improving mental health services to ensure the most effective interventions in the most effective settings.
As an interim step, £10 billion of value for money and quality improvements will be 6.15 delivered by 2012-13.
6.16 The 2009 Pre-Budget Report announced over £800 million of efficiency savings in education frontline areas by 2012-13, of which schools would need to deliver £650 million. Investing for the future, protecting the frontline: school funding 2010-137, published on 15 March 2010, announced that schools could potentially deliver a total of £950 million efficiencies to be recycled to improve educational outcomes. These will be delivered through greater use of collaborative procurement, sharing back office staff between schools within federations, and other forms of collaboration. £150 million of efficiencies will also be delivered in 16 to 19 education and Sure Start Children’s Centres. Taken together, this amounts to a total of £1.1 billion of education frontline efficiencies to be delivered by 2012-13.
6.17 As set out in Protecting the Public: Supporting the Police to Succeed,8 the police will deliver efficiency savings of at least £545 million by 2013-14. The national framework approach to police procurement, combined with the Information Systems Improvement Strategy (ISIS) will produce savings of at least £400 million a year by 2013-14 by increasing standardisation across all 43 forces in England and Wales. At least £70 million of savings from the overtime bill will be achieved through improved shift patterns and better deployment of resources, and streamlining provision of business support functions will generate a further £75 million. In addition, the police will continue to use the QUEST efficiency programme in order to increase its delivery to the public by an equivalent of at least £500 million by 2013-14.
7 Investing for the future, protecting the frontline: school funding 2010-13, Department for Children, Schools and Families, March 2010.8 Protecting the Public: Supporting the Police to Succeed, Home Office, December 2009.
Value for money in health
Value for money in education
Value for money in the police
eFsr P r o t e c t i n g P u b l i c s e r v i c e s 6
91Budget 2010
6.18 The Government will shortly set out its long-term plans for a fair and comprehensive reform of care and support alongside the steps needed in the next Parliament to move towards that goal, building on the new entitlement to free care at home for those with the highest needs already announced. Budget 2010 announces that, alongside those reforms, the Inheritance Tax threshold for the next Parliament will be frozen, as set out in Chapter 5, and that a new taskforce will be established to ensure that the reforms are accompanied by major efficiency and costs improvements.
6.19 The 2009 Pre-Budget Report committed to further real terms increases in the defence budget in 2010-11, at which point it will be over 12 per cent higher in real terms than in 1997.By the end of 2009-10, more than £18 billion of Reserve funding will have been spent on resourcing the Net Additional Costs of Military Operations in Iraq and Afghanistan.9 Of this, over £5.5 billion has been committed to spending on urgent operational equipment to meet the specific threats and requirements of those theatres. This is additional to the core defence budget.
DEL IVER ING CUTS AND EFF IC IENC IES
Protecting the Government’s priorities in health, education, the police and ODA will 6.20 require tough choices elsewhere in order to meet the Government’s commitment to halve public sector net borrowing over the next four years. The 2009 Pre-Budget Report announced over £20 billion of savings across the public sector by 2012-13 and Budget 2010 sets out further detail on how these savings will be delivered, including through:
tough choices on public sector pay and reforming public sector pensions;•
£5 billion of cuts to lower value spending;•
reforms to the welfare system to improve work incentives and increase •fairness;
£11 billion of efficiencies and other cross-cutting savings through •streamlining government; and
plans to manage the Government’s assets and property more effectively.•
Pub l i c s e c tor pay and pens ions6.21 Following substantial investment in public sector workforces since 1997, pay restraint will be important to support frontline service delivery, while ensuring sustainable public finances over the medium term. In the 2009 Pre-Budget Report, the Government announced that it will seek a one per cent cap on basic pay uplifts across the public sector for 2011-12 and 2012-13, generating savings of £3.4 billion a year by 2012-13.
6.22 The Government believes that senior staff should show leadership in pay restraint. On 10 March 2010, the Government announced that there will be no pay uplift in 2010-11 for senior public sector staff including the senior civil service, the judiciary, consultant doctors, senior managers in the NHS and self-employed GPs and dentists. At the same time, the Government announced that, excluding those on three-year deals, basic pay uplifts for other workforces will be capped at a maximum of one per cent in 2010-11. In recognition of the exceptional pressures the Armed Forces are facing, the Government accepted the Armed Forces Pay Review Body’s recommendation that those below the rank of two-star should receive a two per cent increase in 2010-11.
9 HM Treasury financial management data.
Adult social care
Defence
Tough choices on public sector pay
Pay in 2010-11
6 P r o t e c t i n g P u b l i c s e r v i c e s eFsr
92 Budget 2010
6.23 The 2009 Pre-Budget Report set out an ambitious package of reforms to pay-setting for senior staff. Budget 2010 announces that the Government is accepting the results of the Senior Salaries Review Body (SSRB) review of senior pay in the public sector, including committing to a new Code of Practice on senior pay setting. This recommends greater use of independent Remuneration Committees, which will include ‘taxpayer champions’ and escalation of decisions to ministers, or audit and regulatory bodies, where there is a proposal to pay above agreed norms. The Government is asking all public sector organisations to explain, publicly, how they will comply with the Code by the end of the year, and working with the SSRB, will consult on detailed implementation of the Code’s provisions.
To support the taxpayer champions in their work, the SSRB will recommend new 6.24 benchmarks in Non-Departmental Public Bodies (NDPBs), reporting by the summer. In addition, the Prime Minister will ask the SSRB, working with other relevant individuals as appropriate, to draw up sector-by-sector pay benchmarks for the wider public sector. They will report on local authority chief executives and senior managers across the health sector by the end of 2010. The Government will work with the SSRB to determine what legislative and non-statutory means are most appropriate to enforce compliance.
6.25 Since 1997 the Government has implemented major reforms to public sector pensions and is committed to continuing to provide sustainable defined benefit pensions. As part of this, building on the commitments to full consultation and collaboration agreed at the 2005 Public Services Forum, cap and share provisions will be implemented for Teachers, Civil Service, NHS and Local Government pension schemes. These will cap the contribution to pensions made by employers, thereby limiting the liability of the taxpayer as pensions become more valuable. This is estimated to save £1 billion a year from 2012-13, as announced in the 2009 Pre-Budget Report.
Pub l i c Va lue Programme The Public Value Programme, launched at Budget 2008, has been conducting 6.26
demanding value for money reviews across at least 50 per cent of each department’s budget. On the basis of the early findings of the programme, the 2009 Pre-Budget Report announced £5 billion of savings by 2012-13 through cutting lower value or lower priority spend. Budget 2010 announces further details of these savings, including:
reforming the criminal justice system and legal aid, saving £360 million •in total: a rigorous process of setting benchmarks and costed service specifications for prisons and probation will save £40 million, with inefficient prisons put out to competition. Five competitions were launched in November. Further savings will be made by improving the management of cases through the system and making better use of the court estate. Twenty Magistrates’ courts will be closed in the first phase of this work. Reforms to legal aid will include means testing for Crown Court cases from April 2010, and proposals to restructure the criminal legal aid market by consolidating the number of providers and increasing competition, as set out in Restructuring the Delivery of Criminal Defence Services;10
10 Restructuring the Delivery of Criminal Defence Services, Ministry of Justice, March 2010
Senior pay-setting
Public sector pensions
eFsr P r o t e c t i n g P u b l i c s e r v i c e s 6
93Budget 2010
improved targeting of housing growth and regeneration funding, saving £340 •million: including £40 million by concluding the New Deal for Communities, and a further £300 million from rationalising Regional Development Agency regeneration spending and programmes, including the Working Neighbourhoods Fund, the Local Enterprise Growth Initiative, and the Housing and Planning Delivery Grant;
reducing a range of budgets across the Department for Children, Schools •and Families (DCSF) saving £350 million: for example £25 million from the British Educational Communications and Technology Agency (BECTA), £40 million from the Training and Development Agency, £71 million from the end of extended schools start-up funding and £10.5 million from central administration and communications budgets;
improving the concessionary travel scheme, saving £180 million: legislation •has been laid to move responsibility for administering the scheme to county councils from April 2011 and to re-establish the link between eligibility for concessionary fares and the State Pension from April 2010;
reforming or eliminating allowances that are no longer relevant for staff •posted overseas: for example by ending the use of business class air travel for journeys lasting less than 5 hours, saving a total of £13 million; and
reducing unlawful occupation of social housing, saving at least £35 million in •housing benefit costs; ending smaller Communities and Local Government (CLG) funded time-limited communities programmes, saving £25 million; and rationalising other smaller CLG programmes, saving a total of £160 million.
Wel fa re r e fo rm6.27 As set out in Chapter 5, the Government is continuing its programme of welfare reform to ensure the most disadvantaged groups are not trapped on benefits dependency as growth returns to the economy, while helping to deliver balanced and sustainable public finances. The Government has introduced a new medical assessment for Incapacity Benefit, which focuses on what the individual can do, rather than what they cannot do, and has already announced that over five years this will reduce the benefits bill by £1.2 billion. This Work Capability Assessment will be extended to existing Incapacity Benefit claimants, which is expected to move more people into work, reducing the benefits bill by a further £300 million over the next five years. Budget 2010 announces that the Government is taking action to tackle excessively high Local Housing Allowance payments for a small number of tenants in the most expensive areas, saving another £50 million a year by 2014-15.
Smar te r GovernmentIn December 2009 the Government published the 6.28 Smarter Government White
Paper2, which identified three main ways in which the Government would deliver reductions in spending growth while continuing to strengthen public services and civic society:
streamlining the centre of government, saving money through sharper •delivery;
increasing innovation and efficiency by recasting the relationship between •the centre and the front line; and
driving up standards by strengthening the role of citizens and civic society.•
Welfare reform

6 P r o t e c t i n g P u b l i c s e r v i c e s eFsr
94 Budget 2010
Budget 2010 provides an update on progress made on these actions, alongside an 6.29 online progress report.11
S t reaml in ing the cen t re o f government6.30 The 2009 Pre-Budget Report announced that in the next Spending Review period the Government will deliver savings of over £11 billion a year by 2012-13, through operational efficiencies, streamlining Arm’s Length Bodies (ALBs), cutting consultancy and marketing spend, raising energy efficiency, reducing spend on IT projects, cutting the costs of staff in the public sector and improving customer channels. Budget 2010 announces that over £11 billon of savings have now been identified department-by-department for the years from 2012-13. Departments are publishing further details alongside Budget 2010 and examples are set out below. These efficiency savings will be factored into the next Spending Review, and contribute to halving public sector net borrowing and protecting key frontline services. The Devolved Administrations’ budgets will be determined at the next Spending Review in line with the Barnett formula.
6.31 Of the £11 billion, £8 billion are savings identified through the Operational Efficiency Programme (OEP) from reductions to the costs of back office functions, IT, collaborative procurement and property running costs across central government. All departments have now signed up to delivering these savings, including:
£650 million from greater use of collaborative procurement in schools. •DCSF will provide support to schools through its procurement programme, enabling them to use secure electronic procurement through the Educational Procurement Centre. DCSF will also support up to 250 groups of mainly primary schools each year to benefit from a shared schools business manager;
£550 million from the Ministry of Defence (MoD), including up to £120 •million from greater use of collaborative procurement on construction, food, IT, management of the defence estate and savings through greater efficiency in equipment support;
£236 million from HM Revenue and Customs (HMRC), by reducing its estate •by 130 offices over the next two years, utilising flexibility in PFI contracts to vacate further properties in the subsequent two years, and reducing IT costs by over £100 million through decommissioning and rationalising outdated systems; and
£40 million from DWP by using benchmarking to identify and improve •workspace utilisation in the least efficient buildings, extending flexible working arrangements in non-public facing buildings and undertaking a joint-venture with business partners to unlock greater commercial value from the retained estate.
6.32 To help deliver savings from back office functions by 2012-13 Budget 2010 announces that the Government will set up new shared service platforms. DWP Shared Services, which already provides services to 140,000 staff across three departments, will take on four new departments and move to a new corporate structure by April 2011. In addition, the Ministry of Justice (MoJ) will introduce a shared service centre for back office human resources, payroll, finance and procurement transactions, providing services to 81,000 staff.
11 Further details can be found at http://www.hmg.gov.uk/frontlinefirst.aspx
Cross-cutting savings
Operational Efficiency
Programme
Shared services
eFsr P r o t e c t i n g P u b l i c s e r v i c e s 6
95Budget 2010
The MoD will also study how best they can transform the way their civilians work to free up resources that can be deployed to the front line.
Budget 2010 also announces that to drive savings the Government will create a 6.33 small team of experts at the centre of government, reporting to the Chief Secretary to the Treasury, to set new standards for shared services, standardise processes, ensure delivery of savings and explore more opportunities to use private sector involvement to commercialise these platforms further. All departments will be required to improve against the back office benchmarks published alongside Smarter Government 2 over the next 12 months, including determining whether moving to a new shared services platform is the right solution. Where departments can move faster they will do so. The new team will initially work with the Department for Transport (DfT), the Department for Business, Innovation and Skills (BIS), the Department for Environment, Food and Rural Affairs (Defra) and HM Treasury Group on their plans for driving improvements within human resources, finance and procurement functions and a report on progress will be provided by the 2010 Pre-Budget Report.
In addition to the £8 billion of operational efficiency savings, £3 billion will be 6.34 delivered by 2012-13 through streamlining ALBs, cutting consultancy and marketing spend, reducing spend on IT projects, raising energy efficiency, cutting the costs of staff in the public sector and improving customer channels.
6.35 As set out in Reforming Arm’s Length Bodies,12 the Government will save at least £500 million by 2012-13 through reforming and rationalising ALBs. The overall number of ALBs will be reduced by over 140, a 20 per cent reduction from the 752 bodies identified in Smarter Government2. A stronger governance framework for ALBs and departments will cut duplication of functions, set restrictions on creating new bodies, and limit the use of lobbying and public relations consultants by ALBs. In addition, the paybill of senior staff in NDPBs will be reduced by 20 per cent by 2012-13. Savings and reforms include:
£90 million from improving value for money in the UK Border Agency •including through increased operational productivity, for example by improving its case management systems to speed up case resolution;
streamlining the Department for Culture, Media and Sport’s (DCMS) ALBs, •in the first instance through rationalising DCMS’s advisory bodies by half, merging the UK Film Council and British Film Institute and merging the National Lottery Commission and the Gambling Commission, subject to necessary consultation; and
£27 million by reducing the number of MoJ ALBs by one third, streamlining •the Legal Services Commission and the Youth Justice Board, bringing together HM Courts Service and the Tribunals Service into a unified agency, abolishing the 19 Courts Boards, and reviewing the role and operation of the Judicial Appointments Commission, subject to legislative approvals.
6.36 Reducing departmental consultancy spend by 50 per cent and departmental marketing and communications spend by 25 per cent from the 2008-09 spending levels set out in the Public Sector Procurement Expenditure Survey 200913 will save over £650 million by 2012-13. Savings will include:
£20 million by halving the amount spent on consultants by the Foreign •and Commonwealth Office (FCO) and the Department for International
12 Reforming Arm’s Length Bodies, March 2010, HM Treasury13 Public Sector Procurement Expenditure Survey 2009, http://www.ogc.gov.uk/publicspending
Arm’s length bodies
Consultancy, marketing and
communications
6 P r o t e c t i n g P u b l i c s e r v i c e s eFsr
96 Budget 2010
Development (DfID) now that they have built up their in-house skills, for example finance, IT and procurement;
£30 million in the MoD by reducing the use of external consultants and •expenditure on marketing and communications, including reducing the number of centrally funded publications from more than 300 in 2007 to under 30; and
£40 million from workforce improvements in the Home Office, including •through the introduction of new standard rates to reduce the use and cost of consultancy and contingent labour.
6.37 Spending on IT programmes across government will be reduced by £500 million by 2012-13, including:
£130 million within the MoD by replacing legacy IT systems;•
£100 million by taking a new approach to the NHS National Programme •for IT that offers a more flexible delivery model and greater choice to local hospitals, as announced in December 2009; and
£80 million from a 20 per cent reduction in IT expenditure in the Home •Office, including £40 million following the successful re-negotiation of existing contracts for basic IT services.
6.38 Improving energy efficiency across the public sector will save £300 million by 2012-13. Savings include:
up to £100 million from reducing energy usage in local government. 35 •councils have made reduced emissions from their own estate a priority, and 100 have made emissions from across their area a priority. For example, Coventry has developed plans with the Carbon Trust to cut emissions by 30 per cent by 2014, and save £2.75 million a year;
£60 million from reducing NHS energy usage as set out in the NHS Carbon •Reduction Strategy, which will deliver a 10 per cent cut in carbon emissions;
£50 million through schools lowering energy usage, using energy display •meters, which will be available to all schools that want them, enabling schools to typically reduce energy consumption by between 5 and 15 per cent.
All departments will shortly be publishing their Carbon Reduction Delivery Plans, 6.39 setting out how they will achieve ambitious carbon reduction targets in the short term and through to 2020.
6.40 The 2009 Pre-Budget Report announced that cutting the costs of the senior civil service by 20 per cent and reducing sickness absences would save £140 million by 2012-13. For example, significant savings will be achieved by the MoD where Gerry Grimstone is leading an independent review into the use of civilians in defence, including the distribution of tasks between military and civilian personnel and the scope for further efficiencies. The report will be published in May 2010. The MoD will continue to reduce the overall size of the civilian workforce; this is in addition to the reduction of 45,000 headcount already made since 1997.
6.41 Making better use of telephony and e-channels to deliver efficient public services will save at least £600 million a year by 2012-13. This includes:
IT programmes
Energy efficiency
Cutting the costs of senior staff
and sickness in the public sector
Customer channels
eFsr P r o t e c t i n g P u b l i c s e r v i c e s 6
97Budget 2010
£300 million from HMRC, including from increasing productivity and •efficiency in contact centres. For example, by eliminating over 20 million calls per year by using automated messaging and migrating more customer contact online; and
£200 million from DWP through more efficient processing of benefits, •including from greater use of online benefit applications.
6.42 The Government remains committed to safeguarding its expenditure and revenue streams from fraud. Building on the recommendations of the Public Sector Fraud Taskforce,14 the Government will produce an action plan by summer 2010. Building on the measures identified at the 2009 Pre-Budget Report to save £100 million per year by 2012-13, the Government has identified further actions to prevent incorrect payments in the benefits system, delivering additional net savings of £175 million in social security expenditure by 2012-13. This will be achieved by improving the interface between the IT systems for different benefits, to enable the automatic cross-checking of information on individuals’ circumstances, and by increasing resources to review existing claims to identify and remove overpayments.
6.43 Alongside Budget 2010 the Government is publishing a detailed categorisation of public procurement expenditure in central government, meeting targets set out in the OEP Collaborative Procurement review15, and providing an update on expenditure across the whole public sector in OEP categories. This will help the Government to work better with its suppliers and market places to better understand and match government buying. Totals for procurement expenditure now being managed as part of the OEP have also been published, providing a baseline to assess progress on collaborative procurement activities.
Recas t ing the r e l a t i onsh ip be tween the cen t re and the f ron t l i ne
As set out in the 6.44 Smarter Government White Paper2, the Government is committed to ensuring that funding decisions are taken at the front line where people are best able to guide resources to the priorities for their local area. Giving frontline staff more freedoms and flexibilities to decide what works best for their local areas encourages innovation, productivity and ultimately better value for money. Next steps will look to build on reforms to public service delivery by: improving market based mechanisms; better utilising digital telephony and face-to-face channels; and devolving further responsibilities and accountability to the local level.
6.45 Smarter Government 2 set out plans to give local areas a greater role in setting priorities and guiding resources. Total Place pilots have demonstrated how to deliver improved and more efficient public services through local collaboration. Further details are set out in Box 6.1. Budget 2010 announces that the Government will give local authorities new discretion over £1.3 billion of funding that is currently ring-fenced and reduce the number of funding streams from central to local government from 110 to 94. Alongside this the Government has reduced the set of indicators for local authorities by 18.
14 A Fresh Approach to Combating Fraud in the Public Sector, Smarter Government Public Sector Fraud Taskforce, National Fraud Authority, March 2010.15 Operational Efficiency Programme: collaborative procurement, HM Treasury, May 2009.
Tackling fraud and error
Public procurement
data
Local freedoms

6 P r o t e c t i n g P u b l i c s e r v i c e s eFsr
98 Budget 2010
Box 6.1 Total Place – a whole area approach to public services
Total Place: A whole area approach to public services will be published on 25 March 2010, based on extensive work since Budget 2009 by more than 63 local authorities, 34 primary care trusts and 13 police authorities and other partners, with more than 70 other local areas engaged in similar work. Total Place sets a new direction for public services. The pilots have demonstrated the greater value to be gained for taxpayers from public services working together to improve outcomes and eliminate waste and duplication. All places will benefit, both from the freedoms announced in Total Place, and the Smarter Government 2 commitments on de-ringfencing, streamlining funding and reducing burdens. The Government commits to:
new freedoms from central performance and financial controls – the Government will test •further reductions in ring-fences, indicators and burdens for places that agree to deliver improved outcomes and additional savings, above savings that all places will find during the next Spending Review period. Places will be able to retain a share of these additional savings, including all savings above the level agreed. This ‘Single Offer’ for public services will be available to the strongest performing places from April 2011. The Government will co-design thematic freedoms for areas with strengths in particular themes through an ‘Innovative Police Offer’ for example, to tackle drugs and alcohol misuse. The Government will trial a new multi-agency Children and Young People’s Grant for local authorities and Children’s Trusts;
new freedoms and incentives for local collaboration – the Government will support •collaboration by developing standardised agreements for local partnerships to use pooled individual budgets, improve joint working between local authorities and Jobcentre Plus and between local authorities and primary care trusts. The Government will work with local areas to run 11 Total Capital Asset Pathfinders, which will improve the value of capital investments, help transform services and deliver better outcomes;
new freedoms for places to invest in prevention, including trialling the first social impact •bonds, (further details are set out in Box 6.2), repeating the Community Cashback scheme in 2010-11, developing Neighbourhood Agreements to support safer neighbourhoods, and working with Manchester City Region and Birmingham City Council to develop new cost benefit analysis tools to support effective investment; and
new freedoms to drive growth – including devolution to regions, cities and localities to •drive economic growth and inclusion through the recovery, as set out in Chapter 4. The Government will strengthen the role of city regions in delivering growth and inclusion, and provide new flexibility for places to shape spending, including on skills. Newly empowered regional ministers will play a stronger role in regional planning and the allocation of funds to regions and city-regions.
6.46 At the next Spending Review, the Government will further align performance frameworks, including agreeing a consistent set of principles for the performance management of local services. A more aligned central-local performance framework will have an emphasis on significantly fewer targets, complemented by a range of indicators published online, creating more accountability through transparency. As a first step, CLG will work with the Local Public Data Panel to pilot the replacement of local authority data returns to central government with direct publication locally. This will initially cover returns to CLG. Following the publication of Total Place: A whole area approach to public services, the Government will also reduce the overall level of data burdens on the front line, to ensure reporting requirements are necessary, proportionate and do not detract from delivering frontline services; and will ensure that inspectorates focus on areas of highest risk and adopt collaborative approaches to inspection and assessment. Alongside this, steps have been
Reducing burdens
eFsr P r o t e c t i n g P u b l i c s e r v i c e s 6
99Budget 2010
taken to increase the use of comparative data to drive performance and improve value for money, including introducing a number of best practice tariffs.
6.47 Budget 2010 also announces measures to strengthen regional, sub-regional and local capability to support growth and inclusion. Enhanced regional ministers will play a key role in promoting growth and inclusion, driving through public sector reform and encouraging further devolution to sub-regional levels. The Government will also co-locate the Regional Development Agencies, Homes and Communities Agency and Government Offices. Budget 2010 announces that these reforms will deliver savings of £255 million a year by 2012-13.
6.48 The Government continues to work towards the commitments16 made in response to the recommendations of the Calman Commission17, which will increase the accountability, freedom and flexibilities of the Scottish Parliament. In future a proportion of the Scottish budget will be funded through its own decisions on taxation, which will also allow the Scottish Executive to increase borrowing, subject to HM Treasury limits. The Government envisages legislating for these changes as soon as possible during the next Parliament. In addition, as announced by the Chief Secretary to the Treasury on 1 March 2010, HMRC will establish an advisory group of stakeholders, who it will consult on the technical and practical implications of the implementation of the changes.
S t reng then ing the ro l e o f c i t i z ens and c i v i c soc i e t yAs set out in 6.49 Smarter Government 2, by increasing transparency and encouraging
people to become more empowered and engaged with public services, the Government can enable citizens to help drive value for money and, in turn, support fiscal consolidation.
6.50 To drive service improvements and genuine empowerment, the Government has introduced entitlements to high-quality services. For example, the two-week cancer referral guarantee will become an entitlement from 1 April 2010, with the offer of private provision if it is not met. The Government is continuing to encourage greater personal responsibility through the Children, Schools and Families Bill, currently being debated by Parliament, setting out stronger home-school agreements, aiming to encourage parental responsibility in their children’s education. Furthermore the Policing Pledge continues to commit neighbourhood policing teams to work visibly in their neighbourhoods for 80 per cent of the time. Alongside this, the Government will look to build on the recommendations of the forthcoming Young Foundation report, which furthers the rights and responsibilities agenda.
6.51 The Government has delivered on its Smarter Government 2 commitments to open up data, promoting transparent and effective government and improving services through empowering citizens and supporting innovative enterprise. For example, the data.gov site was launched in January 2010, making over 3,000 data sets available from a single access point, and the Met Office has released a new open access weather application. The Government will also continue to develop the new national crime mapping sevice, which enables anyone to type in their postcode and get accessible, regular and user-friendly information about crime in their area, what action police are taking and what is happening to criminals who are caught. The Government’s response to a consultation on the release of Ordnance Survey data will be published by the end of March 2010, and from 1 April, a substantial package of data will be freely available to the public without restrictions on re-use. In addition, the Local Public Data Panel is working with leading local authorities
16 Scotland’s Future in the United Kingdom, Scotland Office, November 2009.17 Serving Scotland Better: Scotland and the United Kingdom in the 21st Century, Commission on Scottish Devolution, June 2009.
Restructuring the regional tier
Flexibilities for the Scottish Parliament
Entitlements
Opening up data
6 P r o t e c t i n g P u b l i c s e r v i c e s eFsr
100 Budget 2010
(Local Data Exemplars) to make their data available via the data.gov website, with the first set of data expected to be available by the end of April 2010.
The Government believes it is important that citizens have access to transparent and 6.52 clear information on how the £3 billion capital fiscal stimulus, announced in the 2008 Pre-Budget Report, has been spent across the country. Following the example of transparency displayed by other countries, Budget 2010 announces that the Government will deliver on its commitment to publicly provide details of how the capital fiscal stimulus has been spent. This data will be disaggregated at a local level where possible, with the first tranche of information available online from 9 April 2010. Updates will be provided as more data becomes available through Spring 2010.
6.53 A key part of the Government’s commitment to delivering more efficient personalised public services is its intention to accelerate the use of technology, moving services online to save money and put power into the hands of the individual service user. Digitalising public services enables them to be delivered in ways that are more convenient for citizens and businesses and ensures more cost-effective delivery. The Government will therefore accelerate plans to drive more rapid transition to online public services and ensure that digital services will be universally accessible by delivering universal access to broadband and providing targeted help to people who face barriers to online access. The Government will establish a new Digital Public Services Unit, to drive rapid progress in transferring services to online channels. Alongside this a strategy has been set out by Martha Lane Fox, the Government’s Digital Inclusion Champion, to meet the Government’s commitment to move one million people online in the next three years and reduce the gap in digital inclusion18. Work has begun to implement Tell Us Once nationally, so citizens need only notify the Government once of any birth or death.
6.54 In addition, significant progress has been made on the Government’s commitment to building a stronger civic society, including innovative ways of providing capital to civic organisations. Budget 2010 announces the model for the Social Investment Wholesale Bank (SIWB) and new social impact bonds (SIBs). Further details are set out in Box 6.2. A report on the nation’s civic health will also be published at the end of March 2010, bringing together information at national and local levels to help citizens understand the strengths and weaknesses of civic life in their area and hold public services to account.
18 The Martha Lane Fox strategy can be found at http://raceonline2012.org. More information can be found in the National Plan for Digital Participation, Department for Business, Innovation and Skills, March 2010.
Digital channels
Civic society
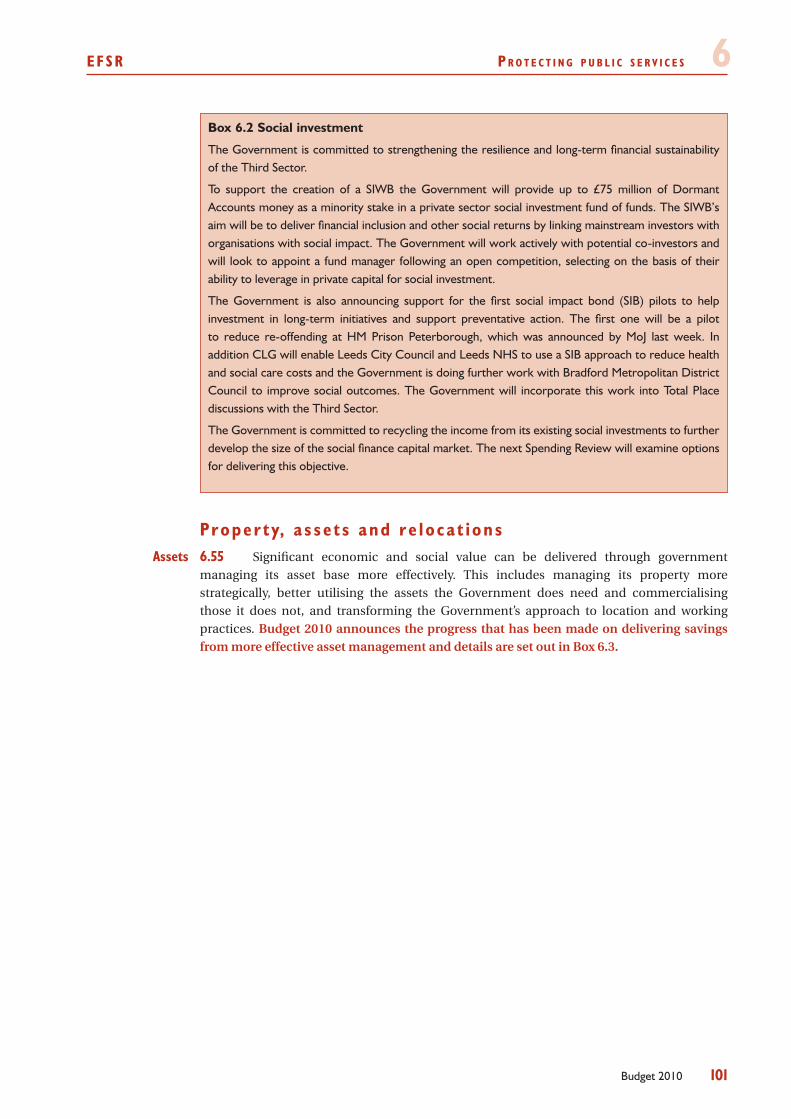
eFsr P r o t e c t i n g P u b l i c s e r v i c e s 6
101Budget 2010
Box 6.2 Social investment
The Government is committed to strengthening the resilience and long-term financial sustainability of the Third Sector.
To support the creation of a SIWB the Government will provide up to £75 million of Dormant Accounts money as a minority stake in a private sector social investment fund of funds. The SIWB’s aim will be to deliver financial inclusion and other social returns by linking mainstream investors with organisations with social impact. The Government will work actively with potential co-investors and will look to appoint a fund manager following an open competition, selecting on the basis of their ability to leverage in private capital for social investment.
The Government is also announcing support for the first social impact bond (SIB) pilots to help investment in long-term initiatives and support preventative action. The first one will be a pilot to reduce re-offending at HM Prison Peterborough, which was announced by MoJ last week. In addition CLG will enable Leeds City Council and Leeds NHS to use a SIB approach to reduce health and social care costs and the Government is doing further work with Bradford Metropolitan District Council to improve social outcomes. The Government will incorporate this work into Total Place discussions with the Third Sector.
The Government is committed to recycling the income from its existing social investments to further develop the size of the social finance capital market. The next Spending Review will examine options for delivering this objective.
Proper t y, a s se t s and re loca t i ons6.55 Significant economic and social value can be delivered through government managing its asset base more effectively. This includes managing its property more strategically, better utilising the assets the Government does need and commercialising those it does not, and transforming the Government’s approach to location and working practices. Budget 2010 announces the progress that has been made on delivering savings from more effective asset management and details are set out in Box 6.3.
Assets

6 P r o t e c t i n g P u b l i c s e r v i c e s eFsr
102 Budget 2010
Box 6.3 Operational Efficiency Programme – Asset Strand
In the Operational Efficiency Programme: Asset Portfolioa, published alongside Smarter Government2 in December 2009, the Government set out how it will manage its assets more effectively, including delivering £16 billion of asset and property sales by 2013-14.
The Government has progressed the commercialisation of the assets set out in the portfolio, and in a number of cases has already concluded that a full or partial sale is the right approach:
The Tote• – the Government is on track to launch a sale process this summer which will conclude by spring 2011;
Student Loans Portfolio• – the Government has identified options with real potential for the sale of the £25 billion student loan portfolio, and will shortly be procuring advisors to develop a sales proposal. A further update will be provided in light of Lord Browne’s recommendations on student finance;
Dartford Crossing• – initial conclusions from a review of commercial options will be considered in the light of the capacity study. The Government will provide a fuller update at the 2010 Pre-Budget Report;
High Speed 1• – the company is in detailed discussions in relation to financing arrangements to support a sale, which is expected to be launched in the summer and completed in the next 12 months; and
URENCO• – options are being explored to realise value from the Government’s stake, which ensure security issues are fully addressed and support the company’s future
development.
Sale is not always the right approach to manage assets most effectively, and the Government will publish a report on mutualisation, setting out its approach to social assets and its ambition for public authorities to think more creatively about ways of maximising social value amongst their communities:
British Waterways• – an example is the recently announced move to mutual status for British Waterways in England and Walesb.
The Government has launched a review into further assets, applying the decision-framework outlined in the Asset Portfolio to help evaluate the most appropriate delivery route for a public activities. The broad conclusion of this work is that government activities could be successfully delivered by another model where the activity is: organisationally separate from the parent department; delivers goods or services capable of being codified into a contractual structure; or delivers goods or services which can be delivered by entities outside of government, or where there is an existing private market for comparable goods and services.
aOperational Efficiency Programme: Asset Portfolio, HM Government, December 2009 bThe Scottish Government will decide if British Waterways in Scotland should be part of a new structure, taking account of the further work still to be undertaken on structures and governance.
6.56 Smarter Government 2 emphasised the need to manage property more strategically, including retaining functions in Whitehall only where they require ministerial support and the Shareholder Executive Property Unit is now creating a co-ordinated property strategy across government. The OEP identified that government owns £270 billion of property19 and the public sector estate has running costs of over £25 billion. To drive better management of government estate Budget 2010 announces that the Government will create new strategic property vehicles by April 2011. These will help the Government realise savings of £5 billion
19 Excluding social housing
Strategic property
management
eFsr P r o t e c t i n g P u b l i c s e r v i c e s 6
103Budget 2010
a year in property running costs and £20 billion in disposals by 202020 and help deliver the Government’s shorter-term target of £1.5 billion annual savings in property running costs and £2 billion of central government property disposals by 2013-14. To improve the incentives for more effective asset management and lock-in the benefits of the significant growth in capital investment since 1997, CLG will test a depreciation-based funding scheme with a small group of local authorities in 2010-11. This will be on a shadow-basis and progress will be reported at Budget 2011.
6.57 In 2004 the Lyons Review21 laid down a target of relocating 20,000 civil servants from London and the South East and Budget 2009 extended this target by an additional 4,000 posts, to 24,000. By December 2009 over 21,500 posts had been relocated22. Building on this progress, Ian Smith published his independent review Relocation: Transforming where and how Government works23. The report recommends mechanisms that will reduce the long-term complement of civil servants in the London region, stimulating economic vibrancy in the regions, bringing government closer to the people and promoting 21st century, efficient and fit for purpose public sector campuses.
Budget 2010 announces that the Government accepts Ian Smith’s recommendations 6.58 and intends to reduce the number of civil servants in London by a third over the next 10 years, starting with a relocation of 15,000 jobs from London. Progress is already being made. MoJ’s estates strategy will relocate 1,000 posts out of central London by 2015, and where value for money is demonstrated these posts will move out of London. At least 50 per cent will move out of London and the South East. This will enable MoJ to rationalise its London estate from 18 buildings to four, saving £41 million per annum by 2015. In addition, MoJ will explore further opportunities for creating regional hubs.
20 Excluding social housing21 Well Placed to Deliver? Independent Review of Public Sector Relocations, Sir Michael Lyons, March 200422 Published by the Office of Government Commerce, details can be found at http://www.ogc.gov.uk23 Relocation: Transforming where and how Government works, Independent Review, Ian Smith, March 2010
Relocations

104 Budget 2010

105Budget 2010
7 S e c u r i n g l o w - c a r b o n g r o w t h
The Government is building a platform for strong, long-term, sustainable growth. Support for the low-carbon economy is central to this as it will provide new opportunities in key growth industries of the future. In the past year, the Government has announced £1.8 billion of extra support for low-carbon sectors. This will enable £15 billion of additional low-carbon investment, providing new opportunities for business growth, boosting innovation and creating new high skilled jobs.
The Government has an important role to play in enabling the investment needed for the transition to a low-carbon economy – particularly in the energy sector, where the scale of the investment challenge is unprecedented. To support the financing of low-carbon investment and new low-carbon jobs, Budget 2010 announces:
a commitment to reform the energy market to provide clean, secure and •affordable energy in the long term. The Government will bring forward proposals this autumn, with a White Paper by spring 2011; and in the shorter term, a summer consultation on mechanisms to provide greater certainty for low-carbon investment;
to address emerging equity finance gaps, the Government intends to create a •Green Investment Bank, with a mandate to invest in low-carbon infrastructure. The Government will start by investing up to £1 billion from the sale of infrastructure-related assets and will seek to match this with at least £1 billion of private sector investment;
the launch of UK Finance for Growth to streamline the Government’s SME finance •support – including to help businesses seeking to commercialise low-carbon technologies;
up to £60 million for the development of port sites to support offshore wind •turbine manufacturers looking to locate new facilities in the UK and secure low-carbon manufacturing jobs;
a commitment to reduce government departments’ carbon emissions by at least •30 per cent by 2020, and enabling energy efficiency finance to help millions of homes save money and energy by developing Pay As You Save arrangements; and
a halving in company car tax for ultra-low carbon cars for five years from April •2010, to contribute to making the UK one of the best places in the world to design and build low-carbon vehicles.
To drive the transition to a low-carbon and resource-efficient economy, while also contributing to the Government’s plans for fiscal consolidation, Budget 2010 announces:
that, to ease pressure on business and household incomes at a time when other •prices are rising, the main fuel duty increase for 2010 will be staged, with an increase of one penny per litre on 1 April and one penny per litre on 1 October 2010, then 0.76 pence per litre on 1 January 2011. Fuel duty will also rise by one penny per litre in real terms on 1 April each year from 2011 to 2014; and
an £8 per tonne increase in the standard rate of landfill tax on 1 April 2014, to •encourage alternatives to landfill.
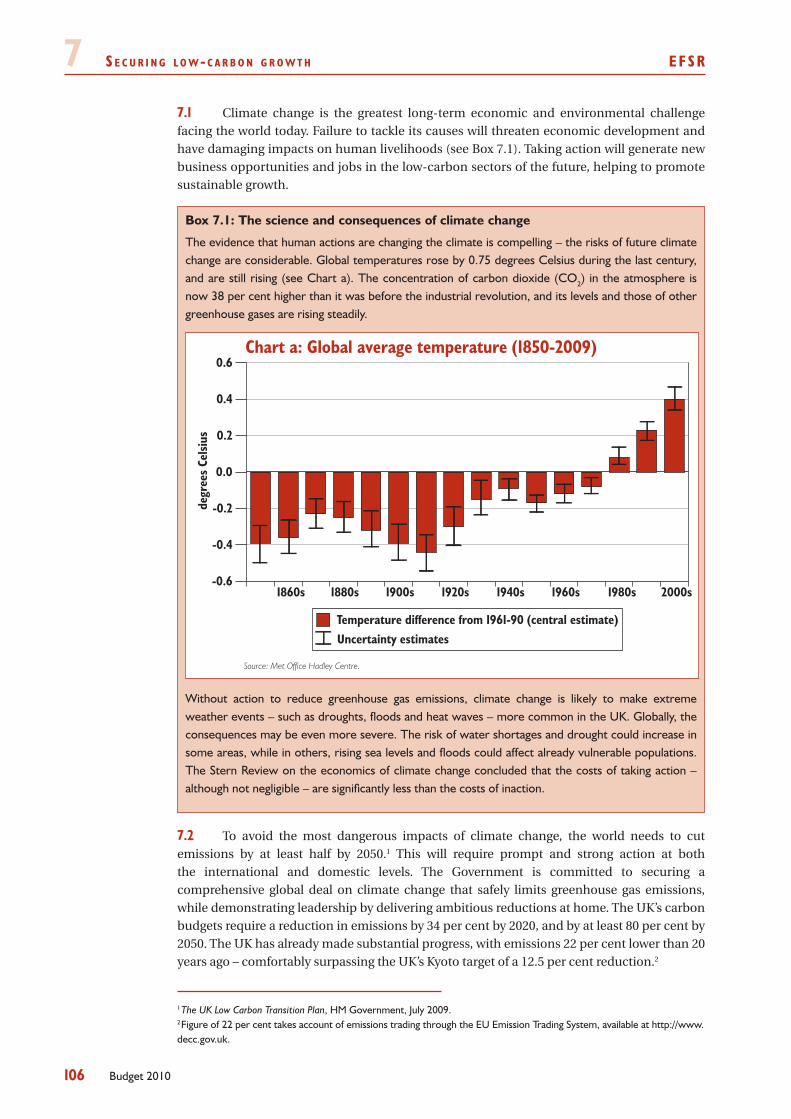
7 S e c u r i n g l o w - c a r b o n g r o w t h eFSr
106 Budget 2010
Climate change is the greatest long-term economic and environmental challenge 7.1 facing the world today. Failure to tackle its causes will threaten economic development and have damaging impacts on human livelihoods (see Box 7.1). Taking action will generate new business opportunities and jobs in the low-carbon sectors of the future, helping to promote sustainable growth.
Box 7.1: The science and consequences of climate change
The evidence that human actions are changing the climate is compelling – the risks of future climate change are considerable. Global temperatures rose by 0.75 degrees Celsius during the last century, and are still rising (see Chart a). The concentration of carbon dioxide (CO2) in the atmosphere is now 38 per cent higher than it was before the industrial revolution, and its levels and those of other greenhouse gases are rising steadily.
Without action to reduce greenhouse gas emissions, climate change is likely to make extreme weather events – such as droughts, floods and heat waves – more common in the UK. Globally, the consequences may be even more severe. The risk of water shortages and drought could increase in some areas, while in others, rising sea levels and floods could affect already vulnerable populations. The Stern Review on the economics of climate change concluded that the costs of taking action – although not negligible – are significantly less than the costs of inaction.
Source: Met Office Hadley Centre.
Chart a: Global average temperature (1850-2009)
-0.6
-0.4
-0.2
0.0
0.2
0.4
0.6
1860s 1880s 1900s 1920s 1940s 1960s 1980s 2000s
degr
ees
Cels
ius
Temperature difference from 1961-90 (central estimate)Uncertainty estimates
To avoid the most dangerous impacts of climate change, the world needs to cut 7.2 emissions by at least half by 2050.1 This will require prompt and strong action at both the international and domestic levels. The Government is committed to securing a comprehensive global deal on climate change that safely limits greenhouse gas emissions, while demonstrating leadership by delivering ambitious reductions at home. The UK’s carbon budgets require a reduction in emissions by 34 per cent by 2020, and by at least 80 per cent by 2050. The UK has already made substantial progress, with emissions 22 per cent lower than 20 years ago – comfortably surpassing the UK’s Kyoto target of a 12.5 per cent reduction.2
1 The UK Low Carbon Transition Plan, HM Government, July 2009.2 Figure of 22 per cent takes account of emissions trading through the EU Emission Trading System, available at http://www.decc.gov.uk.
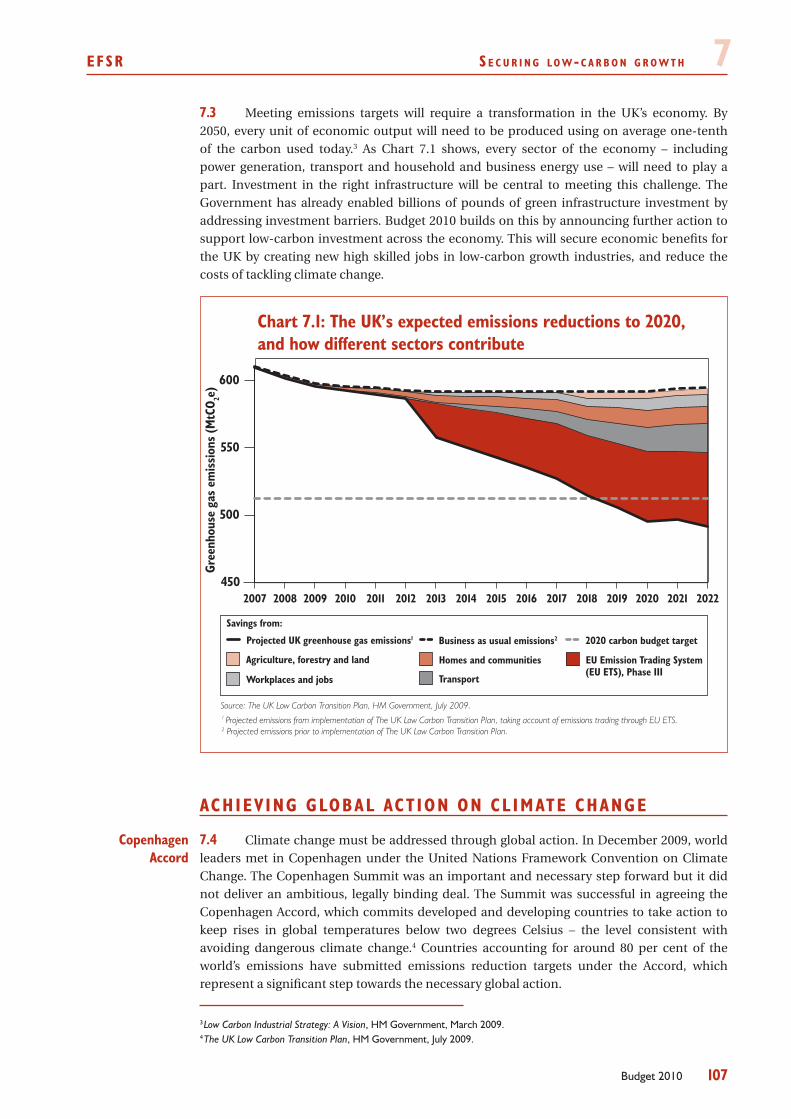
eFSr S e c u r i n g l o w - c a r b o n g r o w t h 7
107Budget 2010
Meeting emissions targets will require a transformation in the UK’s economy. By 7.3 2050, every unit of economic output will need to be produced using on average one-tenth of the carbon used today.3 As Chart 7.1 shows, every sector of the economy – including power generation, transport and household and business energy use – will need to play a part. Investment in the right infrastructure will be central to meeting this challenge. The Government has already enabled billions of pounds of green infrastructure investment by addressing investment barriers. Budget 2010 builds on this by announcing further action to support low-carbon investment across the economy. This will secure economic benefits for the UK by creating new high skilled jobs in low-carbon growth industries, and reduce the costs of tackling climate change.
Source: The UK Low Carbon Transition Plan, HM Government, July 2009.
Chart 7.1: The UK’s expected emissions reductions to 2020,and how different sectors contribute
450
500
550
600
20082007 2009 2010 2011 2012 2013 2014 2015 2016 2017 2018 2019 2020 2021 2022
Workplaces and jobs Transport
Gree
nhou
se g
as e
mis
sion
s (M
tCO 2e
)
1 Projected emissions from implementation of The UK Low Carbon Transition Plan, taking account of emissions trading through EU ETS.2 Projected emissions prior to implementation of The UK Low Carbon Transition Plan.
Savings from:
Business as usual emissions2 2020 carbon budget targetProjected UK greenhouse gas emissions1
Agriculture, forestry and land Homes and communities EU Emission Trading System(EU ETS), Phase III
ACHIEV ING GLOBAL ACT ION ON CL IMATE CHANGE
7.4 Climate change must be addressed through global action. In December 2009, world leaders met in Copenhagen under the United Nations Framework Convention on Climate Change. The Copenhagen Summit was an important and necessary step forward but it did not deliver an ambitious, legally binding deal. The Summit was successful in agreeing the Copenhagen Accord, which commits developed and developing countries to take action to keep rises in global temperatures below two degrees Celsius – the level consistent with avoiding dangerous climate change.4 Countries accounting for around 80 per cent of the world’s emissions have submitted emissions reduction targets under the Accord, which represent a significant step towards the necessary global action.
3 Low Carbon Industrial Strategy: A Vision, HM Government, March 2009.4 The UK Low Carbon Transition Plan, HM Government, July 2009.
Copenhagen Accord
7 S e c u r i n g l o w - c a r b o n g r o w t h eFSr
108 Budget 2010
7.5 A fair global deal on climate change should provide support to help developing countries adapt to climate change and reduce emissions while continuing to grow. The Copenhagen Accord sets a goal for public and private flows of climate finance to developing countries to reach $100 billion per year by 2020. The Prime Minister will co-chair, with Prime Minister Meles of Ethiopia, a high-level advisory group to look at different ways of meeting this goal. Developed countries will begin by providing up to $30 billion of public finance between 2010-12, including £1.5 billion from the UK as part of an overall EU contribution of $10 billion. In the longer term, the UK wants a reformed EU budget to make a greater contribution to climate finance.
7.6 The EU has committed to reducing emissions by 20 per cent by 2020 and has undertaken to move to a 30 per cent target as part of an ambitious global deal on climate change. The carbon market created by the EU Emission Trading System (EU ETS) will make a significant contribution to these reductions. The UK has been at the forefront of the EU ETS and was the first Member State to hold regular carbon auctions during Phase II (2008-12) of the EU ETS. In Phase III (2013-20), the Government intends to continue to hold national auctions within a coordinated EU framework and welcomes the decision of Germany, Spain and Poland to support this position.
SETT ING THE LOW- CARBON ENERGY FRAMEWORK
Modernising the UK’s energy infrastructure will be key to laying the foundations 7.7 for sustainable growth. Investment levels will need roughly to triple to deliver an estimated £110-120 billion of investment required for the sector to 2020.5 Budget 2010 sets out how the Government is responding to the long-term challenge by developing a new framework for investment in low-carbon energy infrastructure.
7.8 In the Pre-Budget Report, the Government launched an assessment of the energy market to examine whether it can deliver the investment needed to meet energy targets while securing a fair deal for consumers. Today, the Government is publishing conclusions from the first phase of this assessment (see Box 7.2).6 The UK’s existing energy market is delivering the new infrastructure investment needed to provide clean, secure and affordable energy to 2020. However, new carbon reduction targets and other commitments mean the Government must ensure that the right choices for the long-term future of the energy market are taken now, to meet its objectives of security of supply, carbon reductions and fairness for consumers.
The Government believes that a global climate deal and subsequent tightening 7.9 of the EU ETS cap provides the best long-term solution to secure a more robust carbon price. However, the Government also acknowledges the need for greater certainty. Budget 2010 therefore announces that as part of its further energy market assessment work, the Government will consult in the summer on the most appropriate mechanism to deliver greater certainty for low-carbon investment, with the intention of bringing forward proposals in the 2010 Pre-Budget Report.
The assessment has concluded that, over the long term, action on the carbon price 7.10 alone will not be sufficient to meet the Government’s energy policy objectives. Budget 2010 therefore announces that the Government will bring forward proposals for changes to the electricity policy framework for consultation this autumn – with a White Paper setting out conclusions by spring 2011. These changes will ensure that the UK has the right framework,
5 The £110-120 billion figure refers to the Department of Energy and Climate Change’s estimate of total investment requirements in the electricity sector to 2020, undiscounted and in 2009 prices. The Pre-Budget Report also referred to Ofgem’s estimate of a requirement for £200 billion of investment in energy supplies as a whole by 2020.6 Energy Market Assessment, Department of Energy and Climate Change/HM Treasury, March 2010.
Climate finance
Carbon market
Energy market assessment
eFSr S e c u r i n g l o w - c a r b o n g r o w t h 7
109Budget 2010
on the right timescale, to support the investment needed to meet the Government’s energy goals. The assessment has also highlighted the challenge of financing a secure, low-carbon energy system (see paragraph 7.16).
Box 7.2: The energy market assessmentThe initial findings of the energy market assessment have identified four key challenges in delivering the Government’s objectives beyond 2020:
the economics of low-carbon generation• – including the higher upfront capital costs of low-carbon generation and exposure to uncertainty in future electricity prices;
the finance requirements of low-carbon generation• – in the context of unprecedented levels of capital expenditure and high construction risk;
security of supply • – while the Government is confident that the current arrangements will deliver secure supplies of electricity over the next decade, the system may not give investors the right signals to invest in sufficient extra capacity during the 2020s as the generation mix changes; and
fairness for consumers • – while the current market arrangements have delivered benefits for consumers since liberalisation, the Government is concerned that substantial barriers to entry across the industry are restricting levels of innovation and competition.
The Government has considered a range of options for reform. The Government will act on some of these in the short term, through the intention to establish a Green Investment Bank and to bring forward proposals to increase certainty for low-carbon investment at the 2010 Pre-Budget Report.
The Government has concluded on the basis of this initial work that carbon price certainty alone will not be sufficient for the longer term. It has identified a number of options for further work, including:
supporting low-carbon generation within the current market framework • – providing a premium payment for low-carbon generators, in addition to their revenues from the wholesale market;
regulating to limit high-carbon generation • – giving potential investors greater confidence to invest in low-carbon generation; and
changing the market structure for low-carbon generation • – giving a guaranteed revenue stream to low-carbon generators. This revenue could be established in a number of ways: by directly determining the price low-carbon generators receive (feed-in tariffs); by a competitive tender for low-carbon generation; or by a regulator agreeing an appropriate return (regulated asset base approach).
The evidence suggests that a single buyer agency would not meet the Government’s objectives for energy policy and so this option will not be considered further.
The Government will consider these options against three principles: cost-effectiveness; affordability; and whether they provide stability and certainty to the market. The Government is committed to a smooth transition and to maintaining investor confidence in the electricity market. Under any set of reforms, the Government will need to ensure access to finance; promote customer switching; enhance consumer protection and rights; and facilitate energy efficiency.
7.11 The UK renewable energy sector is worth over £30 billion and supports over 250,000 jobs.7 Currently, the UK’s key renewable technologies are onshore and offshore wind, landfill gas and hydropower. These technologies are supported through the Renewables Obligation – the Government’s primary mechanism to subsidise renewable electricity generation. Biomass, such as energy crops or organic waste, also offers a potentially significant source for renewable energy, subject to sustainability standards. Budget 2010 announces that the Government intends to grandfather a minimum level of Renewables Obligation support for biomass installations at the point of accreditation, subject to consultation. The Government
7 Low Carbon and Environmental Goods and Services: An Industry Analysis – Update for 2008/09, Innovas, March 2010.
Renewable energy
7 S e c u r i n g l o w - c a r b o n g r o w t h eFSr
110 Budget 2010
will also consult later in the year on sustainability criteria for biomass used for heat and power.
7.12 Carbon capture and storage (CCS) will play an important role in global efforts to tackle climate change. The UK’s share of the CCS market could be worth £6.5 billion a year up to 2030, and support up to 100,000 jobs.8 The Government is making progress with the programme of four demonstration plants announced in the Pre-Budget Report. Earlier this month, the Government signed contracts for detailed preparatory studies for the two remaining bidders in the current competition.
INVEST ING IN LOW- CARBON GROWTH AND JOBS
The Government wants the UK to become a world leader in low-carbon industries, 7.13 providing an important source of future jobs. The Government’s approach is structured around four core objectives:
enabling investment in large-scale low-carbon infrastructure;•
supporting investment and growth in UK-based supply chain businesses;•
providing coordinated support for research and development and for •businesses commercialising new low-carbon technologies; and
facilitating finance for households investing in energy efficiency (see •paragraph 7.24).
The Government has already provided substantial support for low-carbon growth. 7.14 In 2009, the Government announced £1.8 billion of targeted funding, including £555 million for the development of low-carbon industries. To build on this, Budget 2010 announces new institutions and further public finance to support low-carbon investment and new low-carbon jobs.
F inanc ing l ow -carbon in f ra s t r uc tureThe Government has established Infrastructure UK to identify the UK’s long-term 7.15
infrastructure needs. Alongside Budget 2010, Infrastructure UK is publishing a Strategy for national infrastructure, as set out in Chapter 4. This strategy identifies the overarching challenges and opportunities for infrastructure investment in the UK. It finds that there are particular financing challenges for low-carbon energy investment, given the rates of deployment and risk profiles involved.
7.16 The Government is committed to ensuring that it continues to have the right regulatory and policy framework in place for infrastructure. Long-term reforms to this framework are being considered by the second phase of the energy market assessment. Infrastructure UK and other stakeholders have however identified a significant risk of a gap emerging in the provision of equity capital to large, complex low-carbon infrastructure projects in the next few years. To bridge this gap, Budget 2010 announces that the Government intends to establish a Green Investment Bank operating on a commercial basis and involving both public and private sector capital. The Government will start by investing up to £1 billion from the sale of mature government-owned infrastructure-related assets and will seek to match this with at least £1 billion of private sector investment.9
8 Future Value of Coal Carbon Abatement Technologies to UK Industry, AEA, December 2008, and additional work to be published which considered gas-fired power generation.9 These asset sales were announced in the Pre-Budget Report.
Carbon capture and storage
Green Investment Bank
eFSr S e c u r i n g l o w - c a r b o n g r o w t h 7
111Budget 2010
Infrastructure UK will publish a consultation on the establishment of the Green Investment Bank in the summer.
The Green Investment Bank’s mandate will be to invest in the low-carbon sector. 7.17 It will consider new energy and transport projects in particular, where the equity gap is expected to be most critical. It is expected that this will catalyse further investment to accelerate the rate of deployment of further projects. The timing of projects coming forward means it is likely that the Green Investment Bank will focus initially on offshore wind electricity generation. The Green Investment Bank will also consider the case for investing in other infrastructure as appropriate and as the need for investment arises. At the same time, the Government is continuing to work to enable a €100 million investment in the 2020 European Fund for Climate Change, Energy and Infrastructure, as announced in the Pre-Budget Report.
F inanc ing the g rowth o f l ow -carbon indus t r i e sTo secure maximum economic benefit for the UK from the transition to a low-carbon 7.18
economy, the Government is committed to stimulating the growth of low-carbon industries in the UK. This will encourage further innovation and investment in low-carbon sectors, creating new employment opportunities and helping to reduce the costs of tackling climate change.
7.19 The UK’s low-carbon and environmental sectors were worth an estimated £112 billion in 2008-09 – comparable in size to the healthcare and construction sectors – providing employment for almost 910,000 people. By 2015-16, these sectors could support 1.2 million jobs.10 The £1.8 billion of support announced last year is already supporting businesses and creating green jobs in the UK, as set out in Box 7.3.
Box 7.3: Support for low-carbon sectors
Budget 2009 and the 2009 Pre-Budget Report announced £1.8 billion in support for low-carbon sectors. The projects supported by this funding are helping UK firms take advantage of the opportunities provided by the transition to a low-carbon economy. They include:
£30 million support for Mitsubishi to locate a new £100 million offshore wind R&D facility •in the UK, and £18.5 million for developing offshore wind test sites in the North East;
£50 million for marine energy, establishing the South West as a marine energy hub, including •a new £22 million fund for the early stage trial of six promising technologies;
£80 million for the UK’s nuclear supply chain, through a conditional loan offer to Sheffield •Forgemasters for construction of manufacturing facilities for ultra-heavy forgings for nuclear reactor pressure vessels;
£45 million to date of loans to SMEs to install energy efficiency technologies, with 1,400 •firms receiving assistance so far. In the public sector, a similar scheme worth up to £60 million has helped support a further 1,400 projects in a range of institutions such as hospitals, universities and local authorities;
£20 million for the Central Government Low Carbon Technology Programme, to help •reduce carbon emissions from the government estate; and
£45 million for research and technology critical to the development of low-carbon aircraft •engines, to deliver substantial reductions in carbon emissions from aircraft.
10 Low Carbon and Environmental Goods and Services: An Industry Analysis – Update for 2008/09, Innovas, March 2010.
Low-carbon supply chain
7 S e c u r i n g l o w - c a r b o n g r o w t h eFSr
112 Budget 2010
The UK is a world leader in the offshore wind energy sector, which could provide 7.20 employment for more than 70,000 people in the UK by 2020.11 The Government is acting to ensure the UK benefits from the rapid manufacturing and supply chain expansion needed to meet the increased deployment of offshore wind. A key issue in building this capacity is access to port sites suitable for the particular requirements of the offshore wind sector. Budget 2010 announces up to £60 million for the development of port sites, to meet the needs of offshore wind turbine manufacturers looking to locate new facilities in the UK. The Government will launch a competition to identify host locations for, and recipients of, this funding, subject to state aid approval. This will help secure investment for offshore wind in the UK, and support jobs in the wind energy sector and its supply chain.
7.21 The Government wants to place the UK at the forefront of green innovation. To give businesses a fully joined-up range of finance support to take low-carbon technologies from concept to commercialisation, Budget 2010 announces the launch of UK Finance for Growth (UKFG), to streamline the Government’s SME finance support (see Chapter 4 for more details). UKFG will work in partnership with the Department of Energy and Climate Change and Regional Development Agencies to coordinate all public low-carbon SME equity schemes – including the £170 million stock of low-carbon finance products under the Carbon Trust’s venture capital activities and the UK Innovation Investment Fund’s (UKIIF) low-carbon programmes.12 Low-carbon businesses will also be able to access financial support from the wider £4 billion stock of SME finance products overseen by UKFG, where appropriate. UKFG will also join the Low Carbon Innovation Group, the body established to agree an overall strategy for the Government’s low-carbon grant programmes.
SAV ING ENERGY TO CUT CARBON AND B ILLS
Households, businesses and the public sector can all save money on energy bills and 7.22 cut carbon emissions cost-effectively by becoming more energy efficient. Government action has helped lower the upfront costs of energy efficiency measures. As a result of Government policies, loft and cavity wall insulation are available at discounts of 50 per cent or more. These policies have helped insulate over 2.8 million homes since April 2008.13 Budget 2010 sets out further action to drive greater improvements in energy efficiency.
He lp ing househo lds w i th energy cos t s7.23 Replacing an old, inefficient boiler cuts household energy bills and reduces carbon emissions. The Pre-Budget Report announced a boiler scrappage scheme, providing households with a £400 payment to help them upgrade from the least efficient, G-rated boilers to more efficient models or renewable heat units. The scheme was launched in January 2010 and 118,000 households have already made successful applications.14 As well as encouraging a low-carbon shift in households, the scheme is helping to sustain jobs for boiler manufacturers and installers.
7.24 In order to meet the UK’s 2020 objectives for reducing emissions, households will need support to install insulation and energy generation systems that may have higher upfront costs. The Government’s Household Energy Management Strategy, published on 2 March 2010, proposes the development of Pay As You Save financing arrangements. This will enable millions of households to finance the cost of installations from the savings they
11 Offshore Wind Power: Big Challenge, Big Opportunity, the Carbon Trust, October 2008.12 £45 million Carbon Trust venture capital activity and £125 million UKIIF Hermes Environmental Innovation Fund (£50 million of UKIIF funding alongside commitments of £75 million from private sector investors).13 Warm Homes, Greener Homes: A Strategy for Household Energy Management, HM Government, March 2010.14 Energy Saving Trust data, available at http://www.energysavingtrust.org.uk.
Low-carbon innovation
Boiler scrappage
Household Energy
Management
eFSr S e c u r i n g l o w - c a r b o n g r o w t h 7
113Budget 2010
make on their energy bills. Budget 2010 announces that the Government and the financial services industry will undertake detailed work through a joint Pay As You Save forum to develop such financing arrangements.
7.25 Financial incentives can help households and businesses generate renewable electricity and heat. The Government is:
introducing feed-in tariffs, which will be available from 1 April 2010, subject •to state aid and parliamentary approval. They are expected to support installation of low-carbon electricity generating equipment in over 750,000 homes, saving 7 MtCO
2 by 2020; and
consulting on the renewable heat incentive. This could support around 1.7 •million household installations and save up to 60 MtCO
2 in total by 2020.
The Government continues to review the basis for the longer term funding of the renewable heat incentive. In line with existing tax law, households that generate renewable heat mainly for their own use will not be subject to income tax on renewable heat incentive payments, based on the proposals in the consultation.
7.26 The Government continues to ensure support is available to help the most vulnerable. Since April 2009, 198,000 households have received heating systems, insulation and other help from the Warm Front scheme, saving them around £300 per year on their energy bills.15 In addition, the Government is taking powers through the Energy Bill to require energy companies to offer additional help with bills to the most vulnerable households. Help from energy companies will reach £300 million per year by 2013-14, potentially providing support for an additional one million households.
Encourag ing energy e f f i c i ency i n bus ines sThe transition to a low-carbon economy provides new opportunities for all 7.27
businesses – not just those in low-carbon sectors. Becoming more energy efficient saves businesses money and improves their competitiveness. The Government is helping businesses to save energy by providing incentives through the tax system.
7.28 The climate change levy helps drive energy efficiency in business and the public sector. Budget 2010 announces that climate change levy rates will be raised in line with inflation from 1 April 2011, to maintain the levy’s environmental impact. Since its introduction in 2001, the levy is estimated to have reduced energy demand in the business and public sectors by approximately 3 per cent.
7.29 Enhanced Capital Allowances for energy-saving and water-efficient products provide incentives to encourage businesses to invest in these technologies. Budget 2010 announces an update to technologies included in the Enhanced Capital Allowances scheme, including two new sub-categories – for ‘self-driving’ magnetic motors and biomass air heaters. The Carbon Trust will work with Business Link to improve the scheme’s website, so that all businesses can easily find eligible products and understand when product eligibility will be reviewed.
7.30 The EU Emission Trading System (EU ETS) sets emissions limits for sectors responsible for around half of the UK’s CO
2 emissions. Under the EU ETS Directive, Member
States can voluntarily cap emissions of greenhouse gases that are currently excluded from the system. Budget 2010 announces that the Government intends to opt nitrous oxide gases
15 Department of Energy and Climate Change data, available at http://www.decc.gov.uk.
Clean energy cashback
Help for the vulnerable
Climate change levy
Enhanced Capital Allowances
EU Emission Trading System
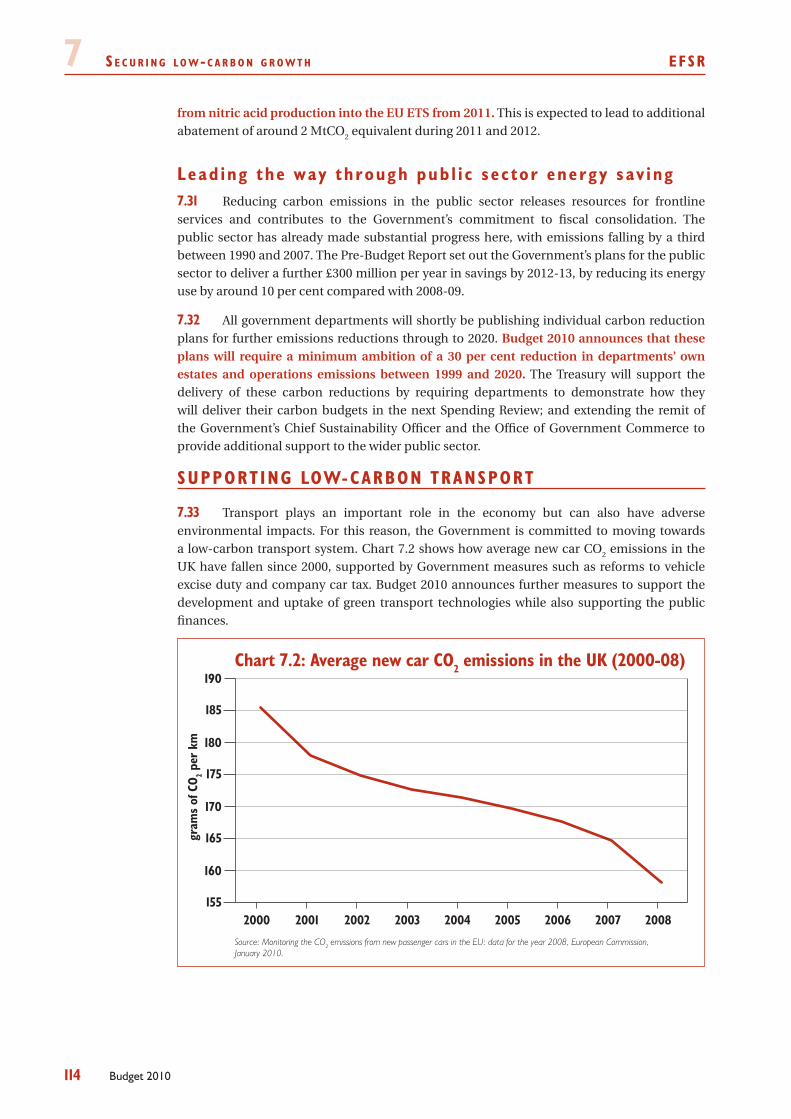
7 S e c u r i n g l o w - c a r b o n g r o w t h eFSr
114 Budget 2010
from nitric acid production into the EU ETS from 2011. This is expected to lead to additional abatement of around 2 MtCO
2 equivalent during 2011 and 2012.
Lead ing the way th rough pub l i c s e c tor energy sav ingReducing carbon emissions in the public sector releases resources for frontline 7.31
services and contributes to the Government’s commitment to fiscal consolidation. The public sector has already made substantial progress here, with emissions falling by a third between 1990 and 2007. The Pre-Budget Report set out the Government’s plans for the public sector to deliver a further £300 million per year in savings by 2012-13, by reducing its energy use by around 10 per cent compared with 2008-09.
All government departments will shortly be publishing individual carbon reduction 7.32 plans for further emissions reductions through to 2020. Budget 2010 announces that these plans will require a minimum ambition of a 30 per cent reduction in departments’ own estates and operations emissions between 1999 and 2020. The Treasury will support the delivery of these carbon reductions by requiring departments to demonstrate how they will deliver their carbon budgets in the next Spending Review; and extending the remit of the Government’s Chief Sustainability Officer and the Office of Government Commerce to provide additional support to the wider public sector.
SUPPORT ING LOW- CARBON TRANSPORT
Transport plays an important role in the economy but can also have adverse 7.33 environmental impacts. For this reason, the Government is committed to moving towards a low-carbon transport system. Chart 7.2 shows how average new car CO
2 emissions in the
UK have fallen since 2000, supported by Government measures such as reforms to vehicle excise duty and company car tax. Budget 2010 announces further measures to support the development and uptake of green transport technologies while also supporting the public finances.
Source: Monitoring the CO2 emissions from new passenger cars in the EU: data for the year 2008, European Commission,January 2010.
Chart 7.2: Average new car CO2 emissions in the UK (2000-08)
155
160
165
170
175
180
185
190
2000 2001 2002 2003 2004 2005 2006 2007 2008
gram
s of
CO 2 p
er k
m
eFSr S e c u r i n g l o w - c a r b o n g r o w t h 7
115Budget 2010
The Government has been a strong advocate of a binding long-term European 7.34 emissions target for cars. In December 2008, the EU set such a target as part of an overall Directive on reducing CO
2 emissions from cars. This regulation is forecast to save the UK
7.6 MtCO2 in 2020. The Government supports the principle of similar regulation to reduce
emissions from vans.
7.35 Ultra-low carbon vehicles offer the potential for significant further savings. The Government has committed over £450 million to support the manufacture and uptake of ultra-low carbon vehicles. The Plug-In Car Grant will provide up to £5,000 off the price of eligible cars from January 2011. Up to £30 million has been provided for the Plugged-In Places scheme to support the installation of charging infrastructure in streets, car parks, supermarkets and leisure and retail centres. The first Plugged-In Places – London, Milton Keynes and the North East – will install over 11,000 recharging points over the next three years.
The Government is providing £20.7 million under the Grant for Business Investment 7.36 scheme to support Nissan’s investment in electric battery and car production. This investment will support 550 high skilled engineering jobs at Nissan’s plant in Sunderland. In addition, the Government’s Automotive Assistance Programme offered a loan guarantee to support Ford’s £1.55 billion investment programme to develop greener engine and vehicle technology (as mentioned in Chapter 4).
The Government has also allocated a further £30 million from the Strategic 7.37 Investment Fund in December 2009 to fund low-carbon transport schemes. Some of the first schemes to benefit include:
the Technology Strategy Board’s competition to develop supply chains for low •and ultra-low carbon vehicles;
a new test centre in Nuneaton for future intelligent transport technologies, •which could increase fuel efficiency and reduce congestion; and
a second Green Bus competition to increase the number of low-carbon buses •on the UK’s roads, subject to state aid clearance.
Transpor t t axThe principal role of transport taxes is to fund public services, but they can also 7.38
play an important role in encouraging fuel-efficient behaviour and the development of low-carbon technologies. As part of the Government’s commitment to fiscal consolidation, transport taxes will be used to ensure that the burden of taxation falls in such a way as to support the transition to a low-carbon economy.
7.39 Budget 2009 announced that fuel duty would increase by one penny per litre in real terms on 1 April each year from 2010 to 2013, equivalent to 2.76 pence per litre this year. Budget 2010 announces that the 2010-11 fuel duty increase will be staged, so that main fuel duty will increase by one penny per litre on 1 April and one penny per litre on 1 October 2010, then by 0.76 pence per litre on 1 January 2011. This will ease pressure on business and household incomes at a time when other prices are rising. Rebated oils duty will rise in proportion to main road fuel duty and details of other duty rates are set out in Chapter A. Budget 2010 also announces that fuel duty will increase by a further penny per litre in real terms in April 2014. In addition to supporting the public finances in the medium term, fuel duty increases from 2010 onwards are expected to save 1.7 MtCO
2 per year by 2014-15.
Low-carbon vehicles
Fuel duty
7 S e c u r i n g l o w - c a r b o n g r o w t h eFSr
116 Budget 2010
7.40 From 1 April 2010, the Government will introduce new first-year rates of vehicle excise duty (VED), as announced at Budget 2008. Under this system, all cars emitting up to 130 grams of carbon dioxide per kilometre (g CO
2 per km) will pay no VED in the first year.
Cars emitting over 165 g CO2 per km will pay additional VED in the first year – up to £950 for
cars emitting over 255 g CO2 per km. First-year rates will encourage the purchase of more
fuel-efficient cars by providing a strong signal to the consumer at the point of purchase.
7.41 The Pre-Budget Report announced a package of support for zero-carbon vehicles, including a five-year exemption from company car tax, to help make the UK one of the best places in the world to design and build low-carbon vehicles. Budget 2010 announces that this support will be extended to ultra-low carbon cars, so that the percentage of list price subject to company car tax will be halved for cars emitting between 1 and 75 g CO2 per km, for five years from April 2010. The Government plans to legislate these measures in Finance Bill 2010.
The Pre-Budget Report also announced the provision of a 100 per cent first year 7.42 capital allowance for zero-carbon goods vehicles. This incentive will apply to new vehicles purchased from April 2010, and will be in place for five years. The Government intends to legislate this measure as soon as possible in the next Parliament. Further details are set out in Chapter A.
7.43 The Government continues to support the road haulage industry in improving environmental performance and safety. The Department for Transport published a consultation on increasing the uptake of eco-driving training on 8 March 2010, to help drivers increase fuel efficiency.16 Part of the new Strategic Investment Fund allocation will be used to provide funding for two demonstration projects – one on low-carbon Heavy Goods Vehicles (HGVs), and one on upgrading raw biogas into biomethane of the quality that can be used as a transport fuel – both subject to feasibility studies.
Reduced Pollution Certificates provide HGVs with annual VED discounts of up to 7.44 £500. Budget 2010 announces that a Reduced Pollution Certificate will be available for vehicles that achieve early compliance with the Euro VI air quality standard. This will be awarded for five years only, to support the environmental integrity of the scheme – with further details to follow at a later date.
HGV VED has been frozen since 2001, equating to a real terms cut of over 7.45 20 per cent. Budget 2010 announces that HGV VED will continue to be frozen in 2010-11. To ensure consistency with EU regulations, while minimising the impact on hauliers, exceptional rates for some vehicles will be introduced from April 2011. Further details are set out in Chapter A.
PROTECT ING NATURAL RESOURCES
The Government is committed to protecting the UK’s wider natural resources. 7.46 Sustainable use of resources will ensure the economy is able to continue to grow in the long term. Budget 2010 announces further measures to drive the transition to a resource-efficient economy.
7.47 Over half of household and business waste ends up in landfill, resulting in methane emissions.17 Landfill tax remains the key policy driver to encourage greater diversion of waste from landfill. By increasing the costs of sending waste to landfill, the tax encourages
16 Increasing the Uptake of Eco-driving Training for Drivers of Large Goods Vehicles and Passenger Carrying Vehicles, Department for Transport, March 2010.17 Department for Environment, Food and Rural Affairs data, available at http://www.defra.gov.uk.
Vehicle excise duty
Ultra-low and zero-carbon
vehicles
Heavy Goods Vehicles and road
freight
Landfill tax
eFSr S e c u r i n g l o w - c a r b o n g r o w t h 7
117Budget 2010
investment in sustainable waste management options, such as sorting machinery, recycling and anaerobic digestion. Budget 2010 announces an increase of £8 per tonne in the standard rate of landfill tax on 1 April 2014, and a freeze in the lower rate in 2011-12. The Government confirms that the standard rate will not fall below £80 per tonne in future, to provide certainty for business investment. The increase in the standard rate will divert an additional 600,000 tonnes of waste, and result in carbon savings.
7.48 Budget 2009 launched a consultation on reforms to landfill tax legislation, to ensure that the tax remains robust in the long term. A summary of responses was published on 4 December 2009. Budget 2010 announces that the list of wastes that qualify for the lower rate of landfill tax will remain broadly the same as at present. The Government will publish a new set of qualifying criteria later this year to provide a clearer environmental rationale for the lower rating of wastes. The Government does not plan to proceed with changes to the way that waste disposal is defined in the legislation for tax purposes, as originally set out in the consultation.
7.49 The landfill communities fund invests in projects that aim to improve communities around a landfill site. The fund has benefited 25,000 projects in the past 14 years.18 To ensure the fund continues to benefit local communities, Budget 2010 announces that the fund will increase in line with inflation to £74 million in 2010-11.
7.50 The aggregates levy was established to make the price of aggregates better reflect the environmental costs of quarrying, encouraging the use of recycled aggregates and alternative materials. As announced at Budget 2009, the levy will be frozen at £2 per tonne in 2010-11, to ease pressure on sectors facing difficulties due to the downturn of the construction market. Budget 2010 announces that the levy will increase just above inflation to £2.10 per tonne on 1 April 2011, to maintain the levy’s environmental effectiveness. The Government is also preparing to seek state aid approval to extend the length of the Aggregates Levy Credit Scheme operating in Northern Ireland.
7.51 The agricultural sector currently emits around 8 per cent of UK greenhouse gas emissions.19 It also remains vulnerable to outbreaks of animal disease. The farming sector needs to protect the environment, while ensuring its economic viability, so that agricultural production is sustainable. The Government is taking action to support the sector in achieving these aims:
the Government will review the farming sector’s plan on reducing greenhouse •gas emissions by 2012, to determine whether a voluntary approach can deliver the necessary reductions or whether further policies are required; and
the Government’s draft Animal Health Bill published in January 2010 •proposes steps to share responsibility for animal health within the farming sector, helping to reduce the impact and cost of future outbreaks. The Government will explore the use of financial incentives and cost-sharing to help bring about changes in farm management, and will introduce such measures through appropriate future legislation.
7.52 Cutting carbon emissions will prevent the most dangerous impacts of climate change, but individuals, businesses and public authorities will also need to adapt to a changing climate. Over recent years, the Government has increased investment in managing flooding and coastal erosion, including the provision of defences. In his review of the 2007 floods, Sir Michael Pitt noted the private as well as public benefits of defence, and argued
18 ENTRUST data.19 Department of Energy and Climate Change data, available at http://www.decc.gov.uk.
Landfill tax consultation
Landfill communities
fund
Aggregates levy
Agriculture
Adaptation
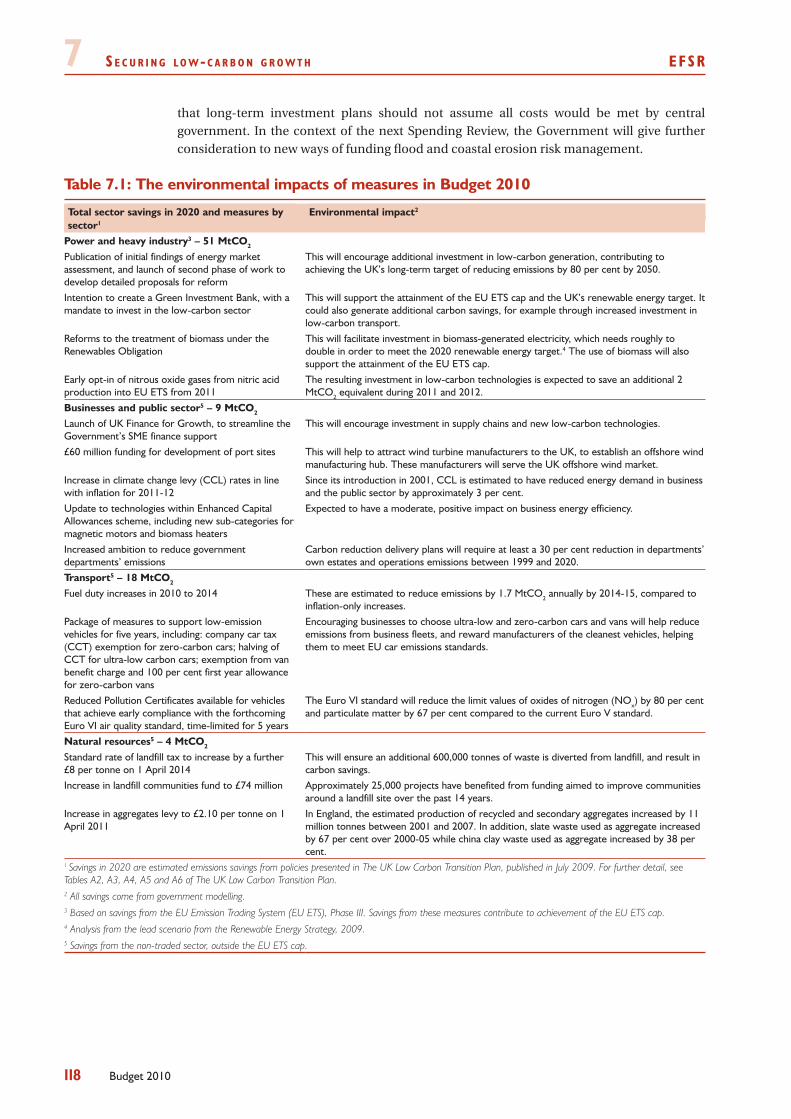
7 S e c u r i n g l o w - c a r b o n g r o w t h eFSr
118 Budget 2010
that long-term investment plans should not assume all costs would be met by central government. In the context of the next Spending Review, the Government will give further consideration to new ways of funding flood and coastal erosion risk management.
Table 7.1: The environmental impacts of measures in Budget 2010
Total sector savings in 2020 and measures by sector1
Environmental impact2
Power and heavy industry3 – 51 MtCO2
Publication of initial findings of energy market assessment, and launch of second phase of work to develop detailed proposals for reform
This will encourage additional investment in low-carbon generation, contributing to achieving the UK’s long-term target of reducing emissions by 80 per cent by 2050.
Intention to create a Green Investment Bank, with a mandate to invest in the low-carbon sector
This will support the attainment of the EU ETS cap and the UK’s renewable energy target. It could also generate additional carbon savings, for example through increased investment in low-carbon transport.
Reforms to the treatment of biomass under the Renewables Obligation
This will facilitate investment in biomass-generated electricity, which needs roughly to double in order to meet the 2020 renewable energy target.4 The use of biomass will also support the attainment of the EU ETS cap.
Early opt-in of nitrous oxide gases from nitric acid production into EU ETS from 2011
The resulting investment in low-carbon technologies is expected to save an additional 2 MtCO2 equivalent during 2011 and 2012.
Businesses and public sector5 – 9 MtCO2
Launch of UK Finance for Growth, to streamline the Government’s SME finance support
This will encourage investment in supply chains and new low-carbon technologies.
£60 million funding for development of port sites This will help to attract wind turbine manufacturers to the UK, to establish an offshore wind manufacturing hub. These manufacturers will serve the UK offshore wind market.
Increase in climate change levy (CCL) rates in line with inflation for 2011-12
Since its introduction in 2001, CCL is estimated to have reduced energy demand in business and the public sector by approximately 3 per cent.
Update to technologies within Enhanced Capital Allowances scheme, including new sub-categories for magnetic motors and biomass heaters
Expected to have a moderate, positive impact on business energy efficiency.
Increased ambition to reduce government departments’ emissions
Carbon reduction delivery plans will require at least a 30 per cent reduction in departments’ own estates and operations emissions between 1999 and 2020.
Transport5 – 18 MtCO2
Fuel duty increases in 2010 to 2014 These are estimated to reduce emissions by 1.7 MtCO2 annually by 2014-15, compared to inflation-only increases.
Package of measures to support low-emission vehicles for five years, including: company car tax (CCT) exemption for zero-carbon cars; halving of CCT for ultra-low carbon cars; exemption from van benefit charge and 100 per cent first year allowance for zero-carbon vans
Encouraging businesses to choose ultra-low and zero-carbon cars and vans will help reduce emissions from business fleets, and reward manufacturers of the cleanest vehicles, helping them to meet EU car emissions standards.
Reduced Pollution Certificates available for vehicles that achieve early compliance with the forthcoming Euro VI air quality standard, time-limited for 5 years
The Euro VI standard will reduce the limit values of oxides of nitrogen (NOx) by 80 per cent and particulate matter by 67 per cent compared to the current Euro V standard.
Natural resources5 – 4 MtCO2
Standard rate of landfill tax to increase by a further £8 per tonne on 1 April 2014
This will ensure an additional 600,000 tonnes of waste is diverted from landfill, and result in carbon savings.
Increase in landfill communities fund to £74 million Approximately 25,000 projects have benefited from funding aimed to improve communities around a landfill site over the past 14 years.
Increase in aggregates levy to £2.10 per tonne on 1 April 2011
In England, the estimated production of recycled and secondary aggregates increased by 11 million tonnes between 2001 and 2007. In addition, slate waste used as aggregate increased by 67 per cent over 2000-05 while china clay waste used as aggregate increased by 38 per cent.
1 Savings in 2020 are estimated emissions savings from policies presented in The UK Low Carbon Transition Plan, published in July 2009. For further detail, see Tables A2, A3, A4, A5 and A6 of The UK Low Carbon Transition Plan.2 All savings come from government modelling.3 Based on savings from the EU Emission Trading System (EU ETS), Phase III. Savings from these measures contribute to achievement of the EU ETS cap.4 Analysis from the lead scenario from the Renewable Energy Strategy, 2009.5 Savings from the non-traded sector, outside the EU ETS cap.
Financial Statementand Budget Report

119Budget 2010
A B u d g e t p o l i c y d e c i s i o n s
The Economic and Fiscal Strategy Report (EFSR) explains how the measures and A.1 other decisions announced in Budget 2010 build on those already introduced to advance the Government’s long-term goals. This chapter of the Financial Statement and Budget Report (FSBR) brings together in summary form all the measures and decisions that affect the Budget arithmetic that have been announced since Budget 2009 and gives their estimated effect on government revenues and spending to 2012-13. The chapter also includes a summary of the changes to the main rates and allowances for the personal tax and benefit system, the business tax system, value added tax (VAT), environmental taxes, and other indirect taxes.
The appendices to this chapter provide additional information on Budget measures:A.2
Appendix A1 provides details of tax changes and other policy decisions which ••were announced in Budget 2009 or earlier, but which take effect from April 2010 or later;
Appendix A2 explains in detail how the effects of the Budget measures on ••government revenues are calculated;
Appendix A3 previously showed estimates of the costs to the Government of some of A.3 the main tax allowances and reliefs. This is now published on the HMRC website.1
In the text of this chapter, the number or letter in brackets after each measure refers A.4 to the line in Tables A1 and A2 where its cost or yield is shown. The symbol ‘-’ indicates that the proposal has no Exchequer effect until at least 2013-14. The symbol ‘*’ indicates that the effect is negligible, amounting to less than £3 million a year.
BUDGET POL ICY DEC IS IONS
Table A1 summarises the Budget 2010 measures that affect government revenues and A.5 spending and also includes all measures announced since the 2009 Pre-Budget Report. This includes tax measures, national insurance contributions (NICs) measures, measures that affect Annually Managed Expenditure (AME), and additions to Departmental Expenditure Limits (DEL). Measures that are financed from existing DEL provisions are not included, unless otherwise stated. Measures that impact on the next spending review period when departmental budgets have not been set will be absorbed within the Government’s spending growth assumption for 2011-12 onwards. They are therefore excluded from the scorecard for this period.
1 http://www.hmrc.gov.uk/stats/tax_expenditures/menu.htm
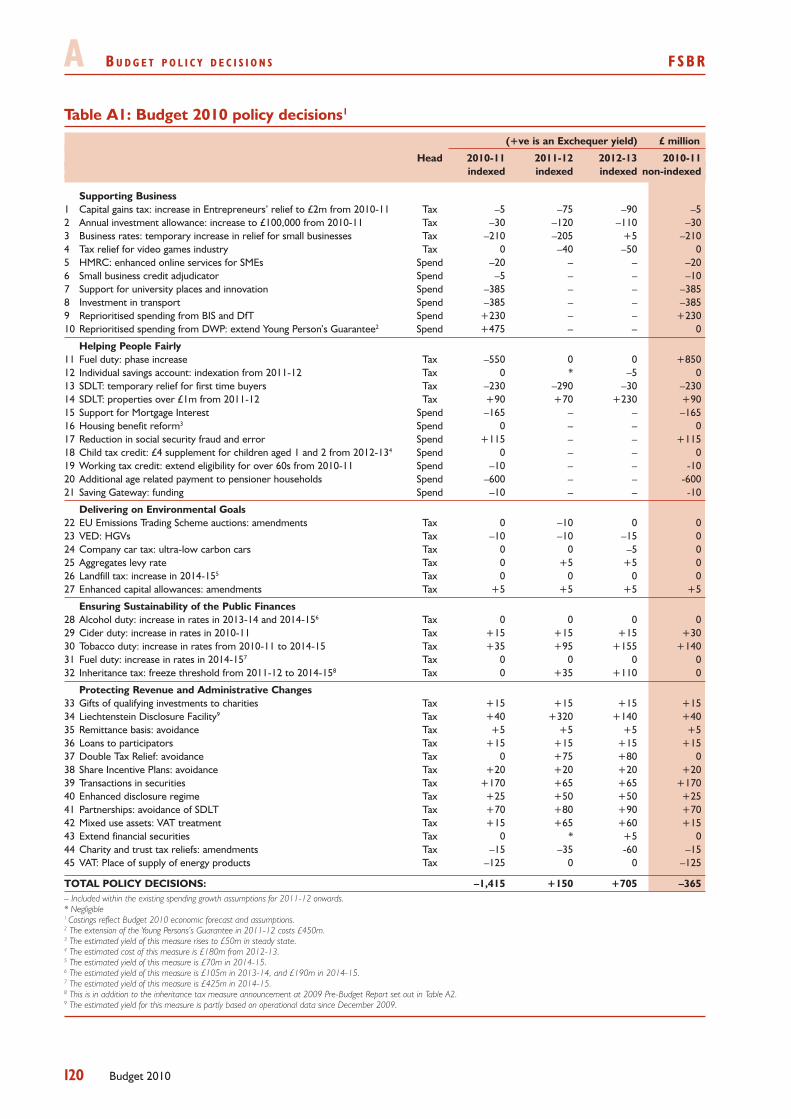
A B u d g e t p o l i c y d e c i s i o n s FsBR
120 Budget 2010
Table A1: Budget 2010 policy decisions1
(+ve is an Exchequer yield) £ million
Head 2010-11 2011-12 2012-13 2010-11 indexed indexed indexed non-indexed
Supporting Business1 Capital gains tax: increase in Entrepreneurs’ relief to £2m from 2010-11 Tax –5 –75 –90 –52 Annual investment allowance: increase to £100,000 from 2010-11 Tax –30 –120 –110 –303 Business rates: temporary increase in relief for small businesses Tax –210 –205 +5 –2104 Tax relief for video games industry Tax 0 –40 –50 05 HMRC: enhanced online services for SMEs Spend –20 – – –206 Small business credit adjudicator Spend –5 – – –107 Support for university places and innovation Spend –385 – – –3858 Investment in transport Spend –385 – – –3859 Reprioritised spending from BIS and DfT Spend +230 – – +23010 Reprioritised spending from DWP: extend Young Person’s Guarantee2 Spend +475 – – 0
Helping People Fairly11 Fuel duty: phase increase Tax –550 0 0 +85012 Individual savings account: indexation from 2011-12 Tax 0 * –5 013 SDLT: temporary relief for first time buyers Tax –230 –290 –30 –23014 SDLT: properties over £1m from 2011-12 Tax +90 +70 +230 +9015 Support for Mortgage Interest Spend –165 – – –16516 Housing benefit reform3 Spend 0 – – 017 Reduction in social security fraud and error Spend +115 – – +11518 Child tax credit: £4 supplement for children aged 1 and 2 from 2012-134 Spend 0 – – 019 Working tax credit: extend eligibility for over 60s from 2010-11 Spend –10 – – -1020 Additional age related payment to pensioner households Spend –600 – – -60021 Saving Gateway: funding Spend –10 – – -10
Delivering on Environmental Goals22 EU Emissions Trading Scheme auctions: amendments Tax 0 –10 0 023 VED: HGVs Tax –10 –10 –15 024 Company car tax: ultra-low carbon cars Tax 0 0 –5 025 Aggregates levy rate Tax 0 +5 +5 026 Landfill tax: increase in 2014-155 Tax 0 0 0 027 Enhanced capital allowances: amendments Tax +5 +5 +5 +5
Ensuring Sustainability of the Public Finances28 Alcohol duty: increase in rates in 2013-14 and 2014-156 Tax 0 0 0 029 Cider duty: increase in rates in 2010-11 Tax +15 +15 +15 +3030 Tobacco duty: increase in rates from 2010-11 to 2014-15 Tax +35 +95 +155 +14031 Fuel duty: increase in rates in 2014-157 Tax 0 0 0 032 Inheritance tax: freeze threshold from 2011-12 to 2014-158 Tax 0 +35 +110 0
Protecting Revenue and Administrative Changes33 Gifts of qualifying investments to charities Tax +15 +15 +15 +1534 Liechtenstein Disclosure Facility9 Tax +40 +320 +140 +4035 Remittance basis: avoidance Tax +5 +5 +5 +536 Loans to participators Tax +15 +15 +15 +1537 Double Tax Relief: avoidance Tax 0 +75 +80 038 Share Incentive Plans: avoidance Tax +20 +20 +20 +2039 Transactions in securities Tax +170 +65 +65 +17040 Enhanced disclosure regime Tax +25 +50 +50 +2541 Partnerships: avoidance of SDLT Tax +70 +80 +90 +7042 Mixed use assets: VAT treatment Tax +15 +65 +60 +1543 Extend financial securities Tax 0 * +5 044 Charity and trust tax reliefs: amendments Tax –15 –35 -60 –1545 VAT: Place of supply of energy products Tax –125 0 0 –125
TOTAL POLICY DECISIONS: –1,415 +150 +705 –365– Included within the existing spending growth assumptions for 2011-12 onwards.* Negligible1 Costings reflect Budget 2010 economic forecast and assumptions.2 The extension of the Young Persons’s Guarantee in 2011-12 costs £450m.3 The estimated yield of this measure rises to £50m in steady state.4 The estimated cost of this measure is £180m from 2012-13.5 The estimated yield of this measure is £70m in 2014-15.6 The estimated yield of this measure is £105m in 2013-14, and £190m in 2014-15.7 The estimated yield of this measure is £425m in 2014-15.8 This is in addition to the inheritance tax measure announcement at 2009 Pre-Budget Report set out in Table A2.9 The estimated yield for this measure is partly based on operational data since December 2009.
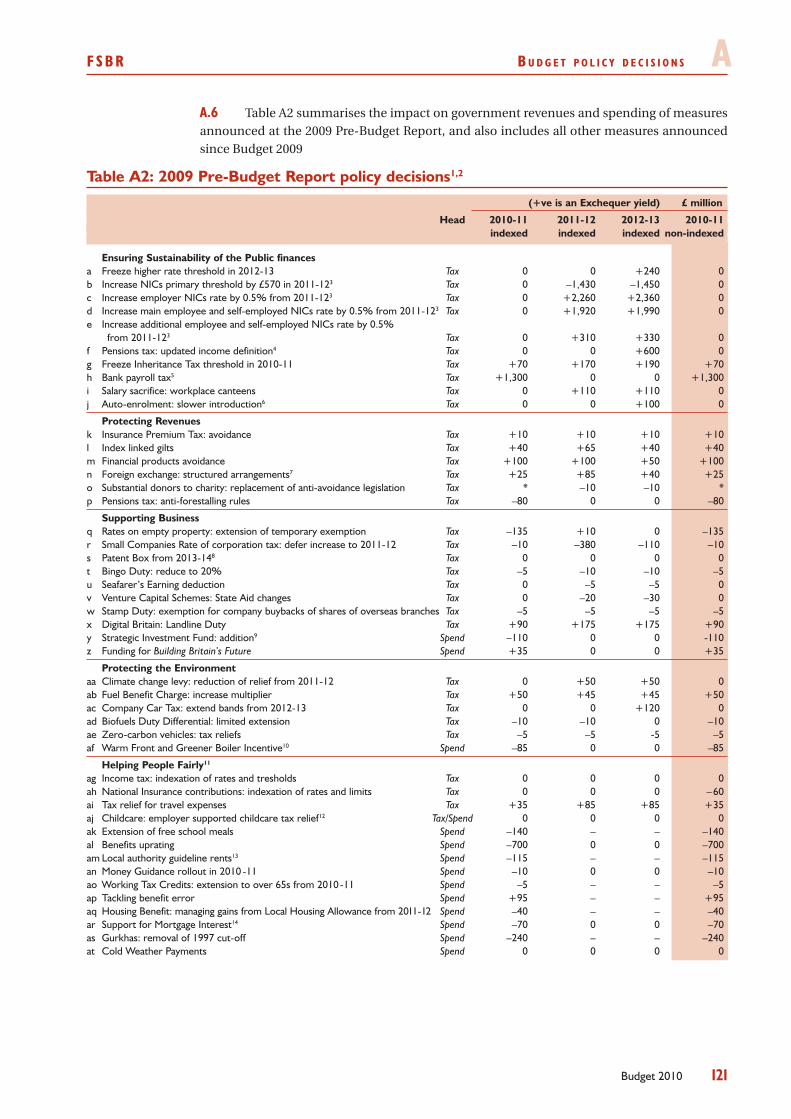
FsBR B u d g e t p o l i c y d e c i s i o n s A
121Budget 2010
Table A2 summarises the impact on government revenues and spending of measures A.6 announced at the 2009 Pre-Budget Report, and also includes all other measures announced since Budget 2009
Table A2: 2009 Pre-Budget Report policy decisions1,2
(+ve is an Exchequer yield) £ million
Head 2010-11 2011-12 2012-13 2010-11 indexed indexed indexed non-indexed
Ensuring Sustainability of the Public finances a Freeze higher rate threshold in 2012-13 Tax 0 0 +240 0b Increase NICs primary threshold by £570 in 2011-123 Tax 0 –1,430 –1,450 0c Increase employer NICs rate by 0.5% from 2011-123 Tax 0 +2,260 +2,360 0d Increase main employee and self-employed NICs rate by 0.5% from 2011-123 Tax 0 +1,920 +1,990 0e Increase additional employee and self-employed NICs rate by 0.5%
from 2011-123 Tax 0 +310 +330 0f Pensions tax: updated income definition4 Tax 0 0 +600 0g Freeze Inheritance Tax threshold in 2010-11 Tax +70 +170 +190 +70h Bank payroll tax5 Tax +1,300 0 0 +1,300i Salary sacrifice: workplace canteens Tax 0 +110 +110 0j Auto-enrolment: slower introduction6 Tax 0 0 +100 0
Protecting Revenues k Insurance Premium Tax: avoidance Tax +10 +10 +10 +10l Index linked gilts Tax +40 +65 +40 +40m Financial products avoidance Tax +100 +100 +50 +100n Foreign exchange: structured arrangements7 Tax +25 +85 +40 +25o Substantial donors to charity: replacement of anti-avoidance legislation Tax * –10 –10 *p Pensions tax: anti-forestalling rules Tax –80 0 0 –80
Supporting Business q Rates on empty property: extension of temporary exemption Tax –135 +10 0 –135r Small Companies Rate of corporation tax: defer increase to 2011-12 Tax –10 –380 –110 –10s Patent Box from 2013-148 Tax 0 0 0 0t Bingo Duty: reduce to 20% Tax –5 –10 –10 –5u Seafarer’s Earning deduction Tax 0 –5 –5 0v Venture Capital Schemes: State Aid changes Tax 0 –20 –30 0w Stamp Duty: exemption for company buybacks of shares of overseas branches Tax –5 –5 –5 –5x Digital Britain: Landline Duty Tax +90 +175 +175 +90y Strategic Investment Fund: addition9 Spend –110 0 0 -110z Funding for Building Britain’s Future Spend +35 0 0 +35
Protecting the Environment aa Climate change levy: reduction of relief from 2011-12 Tax 0 +50 +50 0ab Fuel Benefit Charge: increase multiplier Tax +50 +45 +45 +50ac Company Car Tax: extend bands from 2012-13 Tax 0 0 +120 0ad Biofuels Duty Differential: limited extension Tax –10 –10 0 –10ae Zero-carbon vehicles: tax reliefs Tax –5 –5 -5 –5af Warm Front and Greener Boiler Incentive10 Spend –85 0 0 –85
Helping People Fairly11 ag Income tax: indexation of rates and tresholds Tax 0 0 0 0ah National Insurance contributions: indexation of rates and limits Tax 0 0 0 –60ai Tax relief for travel expenses Tax +35 +85 +85 +35aj Childcare: employer supported childcare tax relief12 Tax/Spend 0 0 0 0ak Extension of free school meals Spend –140 – – –140al Benefits uprating Spend –700 0 0 –700am Local authority guideline rents13 Spend –115 – – –115an Money Guidance rollout in 2010 -11 Spend –10 0 0 –10ao Working Tax Credits: extension to over 65s from 2010-11 Spend –5 – – –5ap Tackling benefit error Spend +95 – – +95aq Housing Benefit: managing gains from Local Housing Allowance from 2011-12 Spend –40 – – –40ar Support for Mortgage Interest14 Spend –70 0 0 –70as Gurkhas: removal of 1997 cut-off Spend –240 – – –240at Cold Weather Payments Spend 0 0 0 0
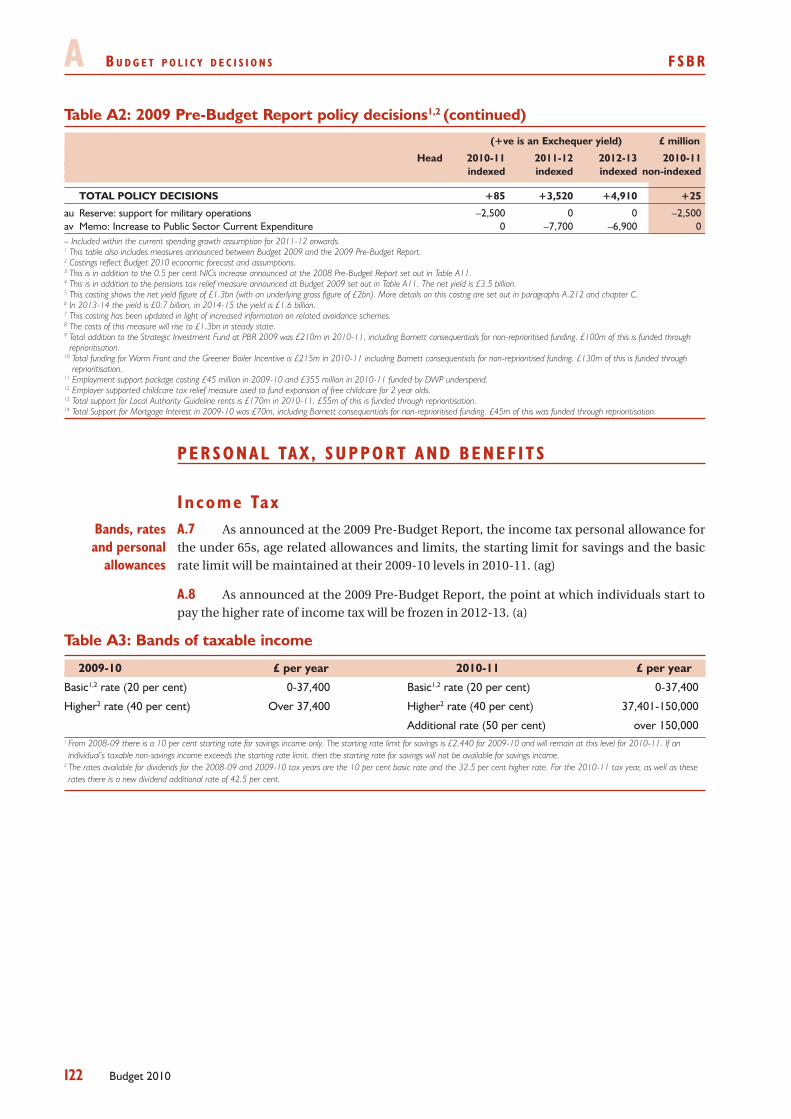
A B u d g e t p o l i c y d e c i s i o n s FsBR
122 Budget 2010
Table A2: 2009 Pre-Budget Report policy decisions1,2 (continued)
(+ve is an Exchequer yield) £ million
Head 2010-11 2011-12 2012-13 2010-11 indexed indexed indexed non-indexed
TOTAL POLICY DECISIONS +85 +3,520 +4,910 +25
au Reserve: support for military operations –2,500 0 0 –2,500av Memo: Increase to Public Sector Current Expenditure 0 –7,700 –6,900 0– Included within the current spending growth assumption for 2011-12 onwards.1 This table also includes measures announced between Budget 2009 and the 2009 Pre-Budget Report.2 Costings reflect Budget 2010 economic forecast and assumptions.3 This is in addition to the 0.5 per cent NICs increase announced at the 2008 Pre-Budget Report set out in Table A11.4 This is in addition to the pensions tax relief measure announced at Budget 2009 set out in Table A11. The net yield is £3.5 billion.5 This costing shows the net yield figure of £1.3bn (with an underlying gross figure of £2bn). More details on this costng are set out in paragraphs A.212 and chapter C.6 In 2013-14 the yield is £0.7 billion, in 2014-15 the yield is £1.6 billion.7 This costing has been updated in light of increased information on related avoidance schemes.8 The costs of this measure will rise to £1.3bn in steady state.9 Total addition to the Strategic Investment Fund at PBR 2009 was £210m in 2010-11, including Barnett consequentials for non-reprioritised funding. £100m of this is funded through
reprioritisation.10 Total funding for Warm Front and the Greener Boiler Incentive is £215m in 2010-11 including Barnett consequentials for non-reprioritised funding. £130m of this is funded through
reprioritisation.11 Employment support package costing £45 million in 2009-10 and £355 million in 2010-11 funded by DWP underspend. 12 Employer supported childcare tax relief measure used to fund expansion of free childcare for 2 year olds. 13 Total support for Local Authority Guideline rents is £170m in 2010-11. £55m of this is funded through reprioritisation.14 Total Support for Mortgage Interest in 2009-10 was £70m, including Barnett consequentials for non-reprioritised funding. £45m of this was funded through reprioritisation.
PERSONAL TAX , SUPPORT AND BENEF ITS
Income TaxA.7 As announced at the 2009 Pre-Budget Report, the income tax personal allowance for the under 65s, age related allowances and limits, the starting limit for savings and the basic rate limit will be maintained at their 2009-10 levels in 2010-11. (ag)
As announced at the 2009 Pre-Budget Report, the point at which individuals start to A.8 pay the higher rate of income tax will be frozen in 2012-13. (a)
Table A3: Bands of taxable income
2009-10 £ per year 2010-11 £ per year
Basic1,2 rate (20 per cent) 0-37,400 Basic1,2 rate (20 per cent) 0-37,400
Higher2 rate (40 per cent) Over 37,400 Higher2 rate (40 per cent) 37,401-150,000
Additional rate (50 per cent) over 150,0001 From 2008-09 there is a 10 per cent starting rate for savings income only. The starting rate limit for savings is £2,440 for 2009-10 and will remain at this level for 2010-11. If an individual’s taxable non-savings income exceeds the starting rate limit, then the starting rate for savings will not be available for savings income.
2 The rates available for dividends for the 2008-09 and 2009-10 tax years are the 10 per cent basic rate and the 32.5 per cent higher rate. For the 2010-11 tax year, as well as these rates there is a new dividend additional rate of 42.5 per cent.
Bands, rates and personal
allowances
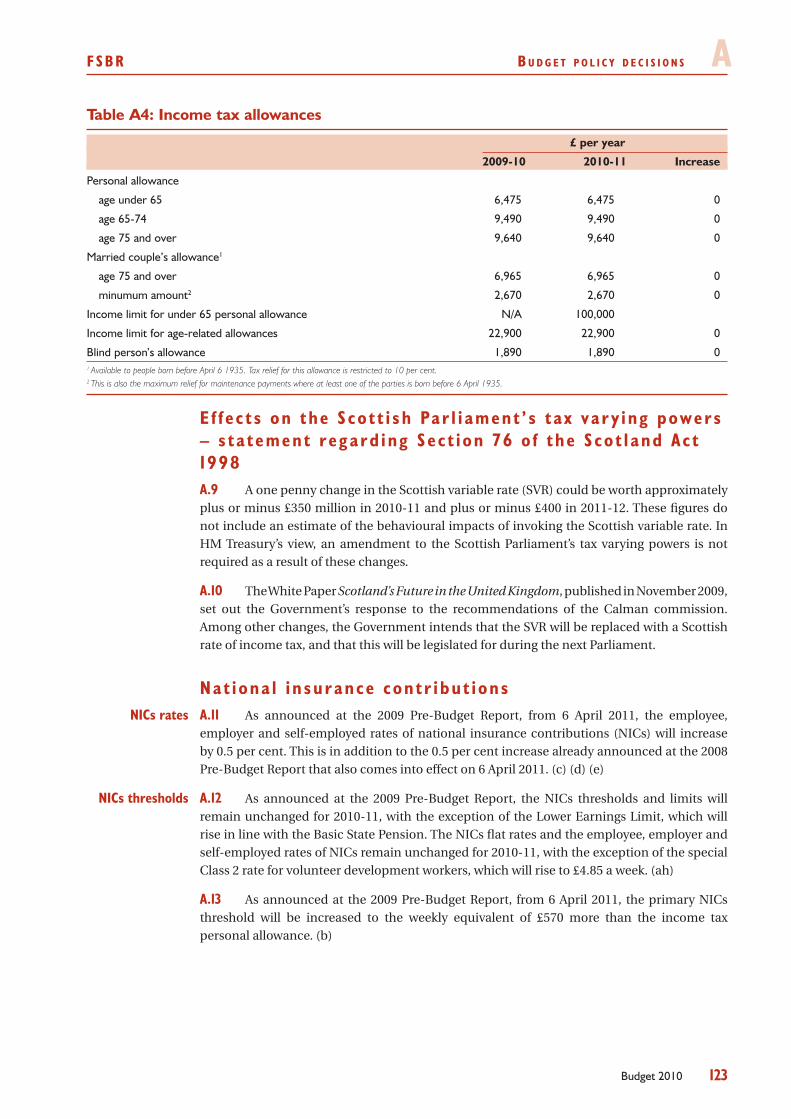
FsBR B u d g e t p o l i c y d e c i s i o n s A
123Budget 2010
Table A4: Income tax allowances
£ per year
2009-10 2010-11 Increase
Personal allowance
age under 65 6,475 6,475 0
age 65-74 9,490 9,490 0
age 75 and over 9,640 9,640 0
Married couple’s allowance1
age 75 and over 6,965 6,965 0
minumum amount2 2,670 2,670 0
Income limit for under 65 personal allowance N/A 100,000
Income limit for age-related allowances 22,900 22,900 0
Blind person’s allowance 1,890 1,890 01 Available to people born before April 6 1935. Tax relief for this allowance is restricted to 10 per cent.2 This is also the maximum relief for maintenance payments where at least one of the parties is born before 6 April 1935.
E f f e c t s on the S co t t i sh Par l i ament ’ s t ax va r y ing powers – s t a tement r egard ing Sec t i on 76 o f the S co t l and Ac t 1 998
A one penny change in the Scottish variable rate (SVR) could be worth approximately A.9 plus or minus £350 million in 2010-11 and plus or minus £400 in 2011-12. These figures do not include an estimate of the behavioural impacts of invoking the Scottish variable rate. In HM Treasury’s view, an amendment to the Scottish Parliament’s tax varying powers is not required as a result of these changes.
The White Paper A.10 Scotland’s Future in the United Kingdom, published in November 2009, set out the Government’s response to the recommendations of the Calman commission. Among other changes, the Government intends that the SVR will be replaced with a Scottish rate of income tax, and that this will be legislated for during the next Parliament.
Nat iona l i n surance con t r ibu t i onsA.11 As announced at the 2009 Pre-Budget Report, from 6 April 2011, the employee, employer and self-employed rates of national insurance contributions (NICs) will increase by 0.5 per cent. This is in addition to the 0.5 per cent increase already announced at the 2008 Pre-Budget Report that also comes into effect on 6 April 2011. (c) (d) (e)
A.12 As announced at the 2009 Pre-Budget Report, the NICs thresholds and limits will remain unchanged for 2010-11, with the exception of the Lower Earnings Limit, which will rise in line with the Basic State Pension. The NICs flat rates and the employee, employer and self-employed rates of NICs remain unchanged for 2010-11, with the exception of the special Class 2 rate for volunteer development workers, which will rise to £4.85 a week. (ah)
As announced at the 2009 Pre-Budget Report, from 6 April 2011, the primary NICs A.13 threshold will be increased to the weekly equivalent of £570 more than the income tax personal allowance. (b)
NICs rates
NICs thresholds
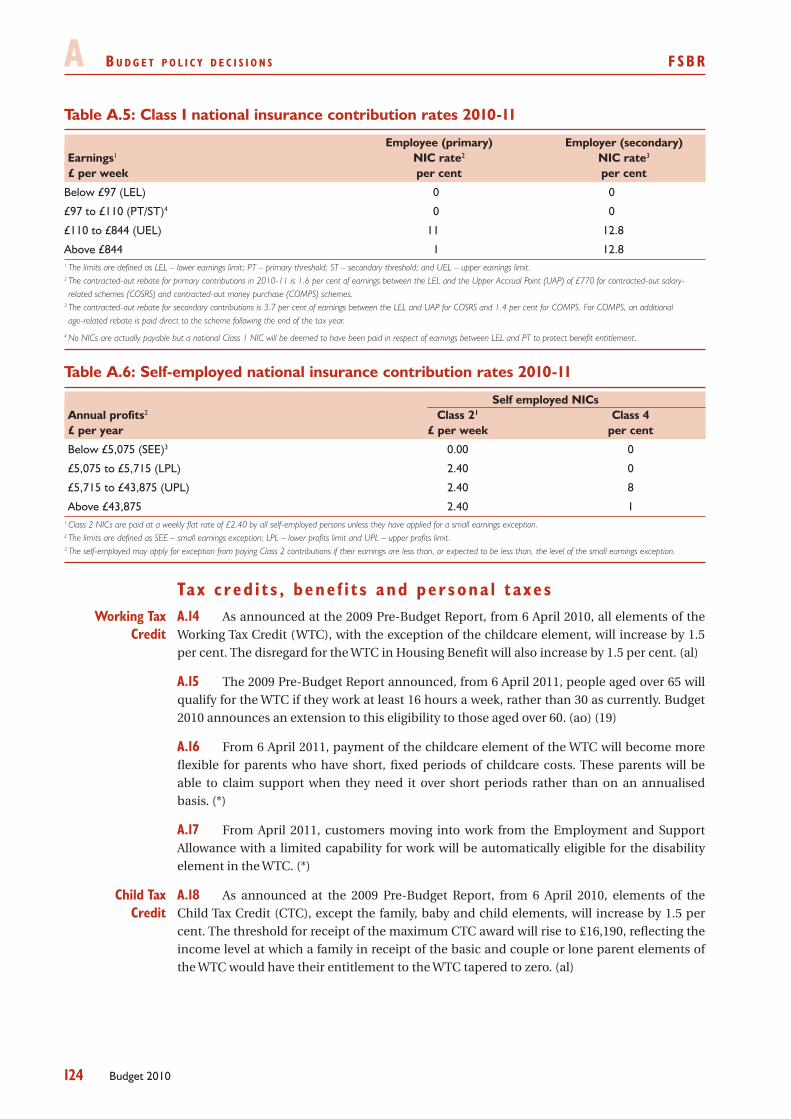
A B u d g e t p o l i c y d e c i s i o n s FsBR
124 Budget 2010
Table A.5: Class I national insurance contribution rates 2010-11
Employee (primary) Employer (secondary) Earnings1 NIC rate2 NIC rate3
£ per week per cent per cent
Below £97 (LEL) 0 0
£97 to £110 (PT/ST)4 0 0
£110 to £844 (UEL) 11 12.8
Above £844 1 12.81 The limits are defined as LEL – lower earnings limit; PT – primary threshold; ST – secondary threshold; and UEL – upper earnings limit.2 The contracted-out rebate for primary contributions in 2010-11 is 1.6 per cent of earnings between the LEL and the Upper Accrual Point (UAP) of £770 for contracted-out salary-related schemes (COSRS) and contracted-out money purchase (COMPS) schemes.
3 The contracted-out rebate for secondary contributions is 3.7 per cent of earnings between the LEL and UAP for COSRS and 1.4 per cent for COMPS. For COMPS, an additional age-related rebate is paid direct to the scheme following the end of the tax year.
4 No NICs are actually payable but a notional Class 1 NIC will be deemed to have been paid in respect of earnings between LEL and PT to protect benefit entitlement.
Table A.6: Self-employed national insurance contribution rates 2010-11
Self employed NICsAnnual profits2 Class 21 Class 4 £ per year £ per week per cent
Below £5,075 (SEE)3 0.00 0
£5,075 to £5,715 (LPL) 2.40 0
£5,715 to £43,875 (UPL) 2.40 8
Above £43,875 2.40 11 Class 2 NICs are paid at a weekly flat rate of £2.40 by all self-employed persons unless they have applied for a small earnings exception.2 The limits are defined as SEE – small earnings exception; LPL – lower profits limit and UPL – upper profits limit.3 The self-employed may apply for exception from paying Class 2 contributions if their earnings are less than, or expected to be less than, the level of the small earnings exception.
Tax c red i t s , bene f i t s and per sona l t axesA.14 As announced at the 2009 Pre-Budget Report, from 6 April 2010, all elements of the Working Tax Credit (WTC), with the exception of the childcare element, will increase by 1.5 per cent. The disregard for the WTC in Housing Benefit will also increase by 1.5 per cent. (al)
The 2009 Pre-Budget Report announced, from 6 April 2011, people aged over 65 will A.15 qualify for the WTC if they work at least 16 hours a week, rather than 30 as currently. Budget 2010 announces an extension to this eligibility to those aged over 60. (ao) (19)
From 6 April 2011, payment of the childcare element of the WTC will become more A.16 flexible for parents who have short, fixed periods of childcare costs. These parents will be able to claim support when they need it over short periods rather than on an annualised basis. (*)
From April 2011, customers moving into work from the Employment and Support A.17 Allowance with a limited capability for work will be automatically eligible for the disability element in the WTC. (*)
A.18 As announced at the 2009 Pre-Budget Report, from 6 April 2010, elements of the Child Tax Credit (CTC), except the family, baby and child elements, will increase by 1.5 per cent. The threshold for receipt of the maximum CTC award will rise to £16,190, reflecting the income level at which a family in receipt of the basic and couple or lone parent elements of the WTC would have their entitlement to the WTC tapered to zero. (al)
Working Tax Credit
Child Tax Credit
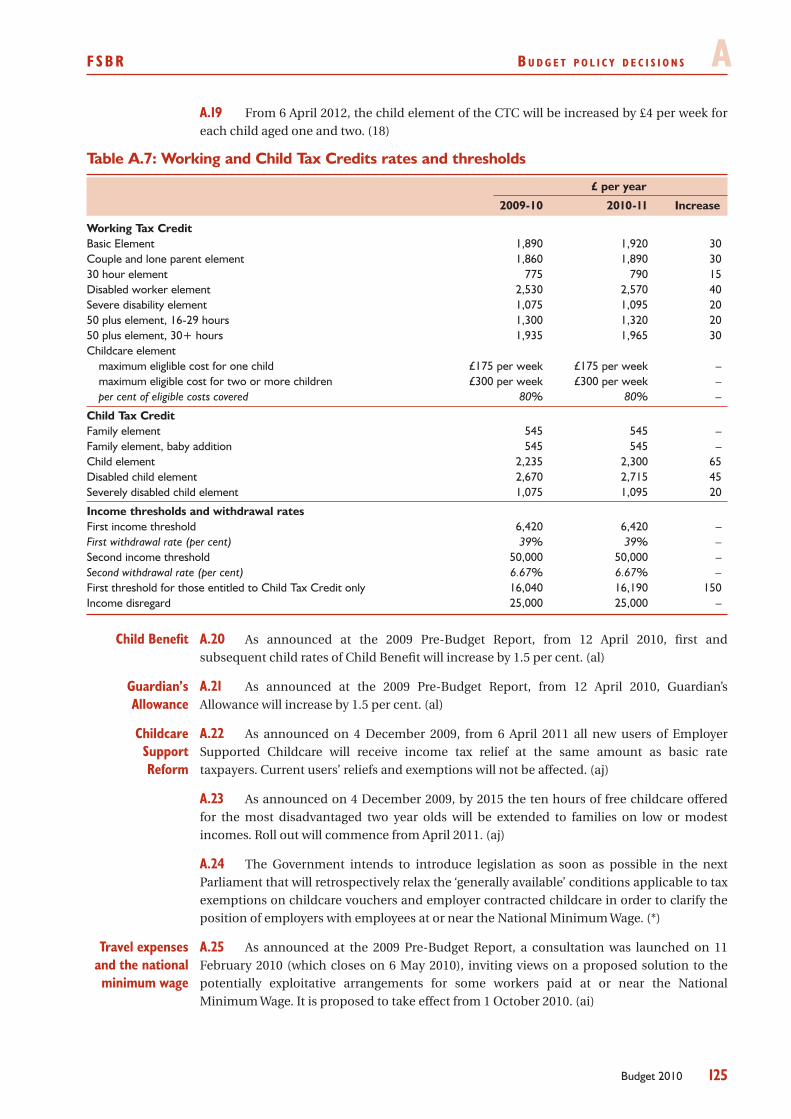
FsBR B u d g e t p o l i c y d e c i s i o n s A
125Budget 2010
From 6 April 2012, the child element of the CTC will be increased by £4 per week for A.19 each child aged one and two. (18)
Table A.7: Working and Child Tax Credits rates and thresholds
£ per year
2009-10 2010-11 Increase
Working Tax CreditBasic Element 1,890 1,920 30Couple and lone parent element 1,860 1,890 3030 hour element 775 790 15Disabled worker element 2,530 2,570 40Severe disability element 1,075 1,095 2050 plus element, 16-29 hours 1,300 1,320 2050 plus element, 30+ hours 1,935 1,965 30Childcare element maximum eliglible cost for one child £175 per week £175 per week – maximum eligible cost for two or more children £300 per week £300 per week – per cent of eligible costs covered 80% 80% –
Child Tax Credit Family element 545 545 –Family element, baby addition 545 545 –Child element 2,235 2,300 65Disabled child element 2,670 2,715 45Severely disabled child element 1,075 1,095 20
Income thresholds and withdrawal rates First income threshold 6,420 6,420 –First withdrawal rate (per cent) 39% 39% –Second income threshold 50,000 50,000 –Second withdrawal rate (per cent) 6.67% 6.67% –First threshold for those entitled to Child Tax Credit only 16,040 16,190 150Income disregard 25,000 25,000 –
A.20 As announced at the 2009 Pre-Budget Report, from 12 April 2010, first and subsequent child rates of Child Benefit will increase by 1.5 per cent. (al)
A.21 As announced at the 2009 Pre-Budget Report, from 12 April 2010, Guardian’s Allowance will increase by 1.5 per cent. (al)
A.22 As announced on 4 December 2009, from 6 April 2011 all new users of Employer Supported Childcare will receive income tax relief at the same amount as basic rate taxpayers. Current users’ reliefs and exemptions will not be affected. (aj)
As announced on 4 December 2009, by 2015 the ten hours of free childcare offered A.23 for the most disadvantaged two year olds will be extended to families on low or modest incomes. Roll out will commence from April 2011. (aj)
The Government intends to introduce legislation as soon as possible in the next A.24 Parliament that will retrospectively relax the ‘generally available’ conditions applicable to tax exemptions on childcare vouchers and employer contracted childcare in order to clarify the position of employers with employees at or near the National Minimum Wage. (*)
A.25 As announced at the 2009 Pre-Budget Report, a consultation was launched on 11 February 2010 (which closes on 6 May 2010), inviting views on a proposed solution to the potentially exploitative arrangements for some workers paid at or near the National Minimum Wage. It is proposed to take effect from 1 October 2010. (ai)
Child Benefit
Guardian’s Allowance
Childcare Support Reform
Travel expenses and the national minimum wage
A B u d g e t p o l i c y d e c i s i o n s FsBR
126 Budget 2010
A.26 As announced at the 2009 Pre-Budget Report, eligibility for Free School Meals will be extended to primary school pupils in working families with a household income below £16,190. The extension will be staged with the first roll out to eligible primary school pupils in Key Stage 1 from September 2010 and the remaining pupils benefiting from September 2011. (ak)
A.27 As announced by the Prime Minister on 15 September 2009, fathers of babies due from 6 April 2011 will be given the right to take up to six months additional paternity leave, which can be taken once the mother has returned to work. The leave may be paid if taken during the mother’s maternity pay period. (-)
A.28 As announced at the 2009 Pre-Budget Report, from 12 April 2010 the standard minimum income guarantee in Pension Credit will increase above indexation to £132.60 a week for a single pensioner and to £202.40 for a pensioner couple. (al)
A.29 As announced at the 2009 Pre-Budget Report, the restriction of pensions tax relief from 6 April 2011 will apply to individuals with gross incomes of £150,000 and over, where gross income incorporates all pension contributions. This will be subject to an income floor at £130,000 (excluding the value of any employer contributions). The anti-forestalling regime was also extended so that the special annual allowance applies to those on incomes of £130,000 and over. This is an extension to the policy announced in Budget 2009. Following a formal consultation, Budget 2010 announces how the restriction of relief will be applied and delivered, and that deemed contributions to defined benefit pension schemes will be valued using the age-related factors method. (f)
A.30 As announced at the 2009 Pre-Budget Report, the rate of the special annual allowance charge will be changed from 6 April 2010 to ensure that it continues to recover the difference between the rate of relief given on pension contributions and the basic rate of tax, following the introduction of the 50 per cent additional tax rate. (*)
A.31 Changes will be made to the pensions tax legislation at the beginning of the next Parliament to enable the National Employment Savings Trust (NEST) to operate as a registered pension scheme, to remove tax on interest charges on late contributions made by employers to qualifying pension schemes, and to amend the tax rules on unauthorised borrowing by registered pension schemes. (-)
A.32 As announced at the 2009 Pre-Budget Report, the introduction of the Government’s private pension reforms will go ahead as planned from October 2012 but will be slowed to give small businesses longer to adjust. Employers will now be brought onto the reforms over 4 years starting with largest to smallest. Reflecting this change, the second transitional period for contributions will start from October 2016, reaching steady state from October 2017. (j)
A.33 As announced at the 2009 Pre-Budget Report, the Government will implement cap and share reforms, limiting the contribution made by employers to pensions, in the Teachers, NHS, Civil Service and Local Government Pension Schemes following their next actuarial valuation.
A.34 An additional £100 will be paid to households with someone aged over 80 and an additional £50 to households with someone aged over the female State Pension Age alongside the Winter Fuel Payment in winter 2010-11. (20)
Extension of Free School
Meals
Additional paternity
leave
Pension Credit
Pensions tax relief
restriction: income
definition
Pensions: special annual
allowance
Pensions reform – pensions taxation
Slower introduction of private pension
reforms
Public sector pension reforms
Payment to pensioner
households
FsBR B u d g e t p o l i c y d e c i s i o n s A
127Budget 2010
A.35 As announced at the 2009 Pre-Budget Report, the increase in Cold Weather Payments from £8.50 to £25 has continued for winter 2009-10. (at)
A.36 On 21 May 2009 the Home Secretary announced that all former Gurkhas who retired prior to 1 July 1997 and completed four years service can apply to settle in the UK with their spouses and dependent children. (as)
A.37 As announced at the 2009 Pre-Budget Report, a proportion of the increase expected in April 2011 for certain benefits will be brought forward by a year. As such, Disability Living Allowance, Carer’s Allowance, Attendance Allowance, Industrial Injuries Benefits, Statutory Maternity Pay, Statutory Paternity Pay, Statutory Adoption Pay, Maternity Pay, and severe disability premia in income-related benefits will increase by 1.5 per cent on 12 April 2010. (al)
A.38 As announced at the 2009 Pre-Budget Report, a package of administrative reforms to Housing Benefit will be introduced from April 2010. In addition, Housing Benefit reforms previously announced at Budget 2009 will be delayed until April 2011. (aq)
Budget 2010 announces measures to control Local Housing Allowance payments for A.39 expensive properties from October 2011. (16)
A.40 As announced at the 2009 Pre-Budget Report, the Government will introduce a package of administrative reforms to the benefit system from 2010-11. This includes measures to reduce the scope for fraud and error to ensure recipients receive correct payments. (ap)
Budget 2010 announces a further package of actions to prevent incorrect payments A.41 in the benefits system. This will include measures to improve the interface between the IT systems for different benefits, to enable the automatic cross-checking of information on individuals’ circumstances, and to increase resources to review existing claims to identify and remove overpayments. (17)
A.42 As announced at the 2009 Pre-Budget Report, the average guideline rent increase for 2010-11 will be reduced from 6.1 per cent to 3.1 per cent for local authority tenants. The Housing Revenue Account Subsidy determination for 2010-11 including Local Authority Average Guideline Rent increases was issued on 3 February 2010. (am)
A.43 As announced at the 2009 Pre-Budget Report, the standard interest rate applied to the Support for Mortgage Interest scheme is maintained at 6.08 per cent for a further six months until 31 June 2010. (ar)
Budget 2010 announces that the standard interest rate applied to the Support A.44 for Mortgage Interest scheme will be frozen at 6.08 per cent for a further six months until 31 December 2010. (15)
A.45 From 6 April 2011, and annually for the duration of the next Parliament, Individual Saving Account (ISA) investment limits will be indexed in line with Retail Prices Index (RPI). The limits will be rounded each year to the nearest multiple of 120, to enable savers to plan monthly savings more easily, and frozen in the event of negative RPI. (12)
A.46 The first Saving Gateway accounts will be available in July 2010. Eligibility for Saving Gateway accounts is set out in the Saving Gateway Accounts Act 2009 and Saving Gateway Accounts Regulations 2009. (21)
A.47 As announced at the 2009 Pre-Budget Report, from 6 April 2010 Shared Lives carers (also known as Adult Placement Carers) will receive a tax free allowance for their caring
Cold Weather Payments
Former Gurkhas
Benefits uprating
Housing Benefit
reforms
Benefit administrative
reforms
Guideline rents
Support for Mortgage
Interest
ISAs
Saving Gateway
Shared Lives relief
A B u d g e t p o l i c y d e c i s i o n s FsBR
128 Budget 2010
income similar to the current Foster Care relief. From 9 December 2009 there has been no loss of capital gains tax private residence relief where adult placement carers use part of their home exclusively for the accommodation of an adult in care. Budget 2010 also announces that the Government intends to extend the income tax exemption for adopters to those caring for children under a Special Guardianship order or certain Residence Orders, from 6 April 2010. (*)
A.48 As announced at the 2009 Pre-Budget Report, legislation will be introduced to remove the tax exemption for workplace canteens when used in conjunction with salary sacrifice or flexible benefit arrangements. This will be effective from 6 April 2011. (i)
A.49 Following the introduction of the new additional rates of income tax, the Government intends to introduce legislation as soon as possible in the next Parliament, effective from 6 April 2010, to allow life insurance deficiency relief at the additional rate (and dividend additional rate). (*)
A.50 As announced at the 2009 Pre-Budget Report, the Government intends to introduce legislation as soon as possible in the next Parliament to extend the seafarers earnings deduction to EU and European Economic Area resident seafarers. (u)
TAXES ON CHARGEABLE GA INS , INHER ITANCE TAX , A SSETS AND PROPERTY
A.51 A 5 per cent rate of stamp duty land tax will be introduced in 2011-12 for purchases of residential property worth over £1 million. (14)
A two-year relief from stamp duty land tax for first time buyers of residential property A.52 up to £250,000 will take effect from the 25 March 2010. (13)
A.53 The Government intends to introduce legislation as soon as possible in the next Parliament to allow UK-REITs to issue optional stock dividends as part of their property income distribution requirement. (-)
A.54 The inheritance tax allowance will be frozen at its 2009-10 level of £325,000 until 2014-15. This extends the 2009 Pre-Budget Report announcement, which froze the allowance at its 2009-10 level in 2010-11. (g) (32)
A.55 With effect from 6 April 2010, where settlors are liable to income tax on trust income at a lower rate of tax than paid by the trustees, they will be required to pay the difference to the trustees and these resulting payments will be disregarded for inheritance tax purposes. The Government intends to legislate as soon as possible in the next Parliament. (*)
A.56 The Government intends to introduce legislation as soon as possible in the next Parliament, which will apply retrospectively to April 2006, to help trusts specifically set up to compensate asbestos victims, but which have been unable to access tax efficient structures for the benefit of victims. (44)
A.57 From 6 April 2010, the capital gains tax entrepreneurs’ relief lifetime limit will be increased from £1 million to £2 million. (1)
From 6 April 2010, the capital gains tax annual exempt amount will be held in line A.58 with statutory indexation at £10,100 for 2010-11. (-)
Salary sacrifice
Life insurance deficiency relief
Seafarers’ earnings
deduction
Stamp duty land tax
Real Estate Investment
Trusts
Inheritance tax
Settlor interested
trusts
Trusts for asbestos
victims
Capital gains tax
FsBR B u d g e t p o l i c y d e c i s i o n s A
129Budget 2010
BUS INESS AND F INANC IAL SERV ICES
A.59 The main rate of corporation tax will remain unchanged for financial year 2011-12 at 28 per cent on profits of companies other than ring fence profits, and 30 per cent on ring fence profits. (-)
A.60 As announced at the 2009 Pre-Budget Report, the planned increase in the small companies’ rate of corporation tax is being deferred for one year; and the rate will remain at 21 per cent for the financial year 2010-11. (r)
A.61 The Annual Investment Allowance for qualifying capital expenditure on plant and machinery will be raised to £100,000 from April 2010. A targeted anti-avoidance rule will also be introduced from 24 March 2010. (2)
A.62 The level of small business rate relief in England will be temporarily increased for one year, from 1 October 2010, to give full relief for eligible businesses occupying premises with a rateable value of up to £6,000 and tapering relief to £12,000. (3)
A.63 HMRC will enhance the online support it provides to SMEs by the end of 2011, including personalising businesslink.gov.uk for start-ups and making it easier for businesses to register for multiple taxes online with a single interactive form. (5)
A.64 The Government intends to introduce legislation to create a new statutory credit adjudicator, to support small businesses seeking access to finance. (6)
A.65 With effect from 1 April 2011, a measure will be introduced to further reform and simplify the associated company rules as they apply to the small companies’ rate of corporation tax. (*)
A.66 The Governement intends to introduce legislation soon as possible in the next Parliament to amend those aspects of corporate tax group relief rules that cover Consortium Relief so that EU and EEA-resident companies engaged in UK consortia will be allowed to pass on the losses of those consortia to their UK-resident subsidiaries. At the same time, legislation will be introduced to strengthen rules designed to ensure that access to consortium relief is given only in proper proportion to the member company’s involvement in the consortium. (-)
A.67 As announced at the 2009 Pre-Budget Report, the temporary increase in the threshold for empty property relief will be extended for a further year, to a rateable value of £18,000 in 2010-11. (q)
A.68 As announced at the 2009 Pre-Budget Report, a bank payroll tax will apply to banks that award discretionary bonuses, in whatever form, above £25,000 in the period from 9 December 2009 to 5 April 2010. The banks awarding these bonuses will pay a payroll tax of 50 per cent on the excess bonus over £25,000. (h)
A.69 As announced at the 2009 Pre-Budget Report, a Patent Box will be introduced, applying a 10 per cent rate of corporation tax to income from patents from 1 April 2013. (s)
A.70 As announced at the 2009 Pre-Budget Report, legislation will be introduced to abolish the condition requiring that any intellectual property (IP) deriving from the R&D be owned by the company making the claim. Legislation will be effective for any expenditure incurred by a Small or Medium sized Enterprise (SME) on R&D in an accounting period ending on or after 9 December 2009. (*)
Corporation tax rate
Small companies’
rate
Annual Investment Allowance
Small business rate relief
Enhanced online services
for SMEs
Small business credit adjudicator
Associated company rules
Consortium relief rules
Empty property relief
Bank payroll tax
Patent box
R&D tax credits
A B u d g e t p o l i c y d e c i s i o n s FsBR
130 Budget 2010
A.71 As announced on 24 February 2010, the Government will end uncertainty over the tax treatment of some types of distributions made to UK companies, in order to prevent disruption of commercial transactions. The Government intends to introduce legislation as soon as possible in the next Parliament, to apply retrospectively, but companies will be able to opt out of the retrospective effect. (-)
A.72 As announced in the Digital Britain White Paper published on 16 June 2009, a new duty will be introduced to help fund the roll-out of Next Generation Access (super-fast broadband). The duty is a 50 pence per month charge on landlines and will be introduced on 1 October 2010. (x)
A.73 As announced at the 2009 Pre-Budget Report, with effect from 9 December 2009, legislation will be introduced to correct an unintended anomaly affecting the amount of tax credit claimable where films are produced over more than one accounting period. (-)
A.74 Following consultation on design, a tax relief for the UK video games industry will be introduced, subject to state aid approval from the European Commission. (4)
A.75 As a result of further consultation with business on the practical working of the worldwide debt cap rules, a small number of additional changes are being made to the draft legislation published alongside the 2009 Pre-Budget Report. These changes will be effective from 1 January 2010. (*)
A.76 As announced at the 2009 Pre-Budget Report, the Government intends to introduce legislation as soon as possible in the next Parliament for the changes required as a condition for the state aid approval of the UK’s tax advantaged venture capital schemes. The changes will have effect on and after the date that the bill receives Royal Assent, with the exception of the definition of eligible shares for VCTs, which will not affect monies raised by the VCT before that date. (v)
A.77 As announced on 27 January 2010, secondary legislation has been introduced to extend the scope of the field allowance to remote deep water gas fields as are found in the West of Shetland area, with effect from 5th March 2010. (-)
As announced at the 2009 Pre-Budget Report, secondary legislation will be A.78 introduced as soon as possible in the next Parliament to extend the scope of the Ultra High Pressure High Temperature field allowance that acts to reduce the initial tax paid by qualifying new developments. (*)
As announced at the 2009 Pre-Budget Report, technical changes will be introduced A.79 to the oil and gas fiscal regime. This ensures legislation that removes chargeable gains from oil and gas licence swaps is effective in its application to commercial transactions, from 24 March 2010; it extends the scope of the ring fence reinvestment relief to allow the relief to apply, from 24 March 2010, when proceeds are reinvested in exploration and development expenditure, including drilling costs; and it ensures that the field allowance introduced in Finance Act 2009 can be available to fields that have previously been decommissioned, from 22 April 2009. (*)
With effect from 24 March 2010, technical changes will be introduced to the ring A.80 fence reinvestment relief rules to enable the relief to apply, as originally intended, when a group company makes the reinvestment. (-)
A.81 The Government intends to modify the transfer of business rules for life insurance companies. (-)
Capital distributions
Landline duty
Film tax relief
Video games industry relief
Debt cap
Venture Capital
Schemes
UK oil and gas fiscal regime
Life insurance companies
FsBR B u d g e t p o l i c y d e c i s i o n s A
131Budget 2010
The Government intends to introduce legislation to provide regulation making A.82 powers so that where action is taken by the Financial Services Compensation Scheme (FSCS) to protect policyholders with insurance and annuity contracts, the tax treatment remains broadly as if the FSCS had not intervened. It will have effect from Royal Assent of Finance Bill 2010. (-)
A.83 As announced at the 2009 Pre-Budget Report, the Government intends to introduce legislation to enable amendments to be made to the corporation tax rules on financial instruments when necessitated by changes to accountancy standards, with effect for periods for which such changes are adopted. (-)
A.84 As announced on 7 September 2009, a company’s purchase of its own shares, held on an overseas branch register, is regarded as exempt from stamp duty unless the instrument transfer is executed in the UK. (w)
Budget 2010 announces that clearing relief rules for stamp taxes on shares are A.85 clarified by explicitly including members of clearing houses and their nominees. The Government intends to introduce legislation that will be effective from when Finance Bill 2010 receives Royal Assent. (-)
A.86 The treatment of chargeable gains for investors subject to corporation tax in some contract-based offshore funds will change to fully align the treatment with that of overseas unit trusts, with effect from 1 April 2010. (*)
Following the introduction of the new offshore funds regime (announced at Budget A.87 2009) on 1 December 2009, amendments were introduced to the regulations that came into effect on 1 December 2009 in order to assist with transitional provisions. (-)
A.88 A new tax regime for funds investing in non-reporting offshore funds was introduced on 6 March 2010 for authorised investment funds investing more than 20 per cent in non-reporting offshore funds. (-)
A.89 As announced at the 2009 Pre-Budget Report, regulations have been introduced, with effect for the most part from 22 April 2009, to ensure that tax does not act as a barrier to transfers of engagements between mutual societies, or to demutualisations. (-)
VALUE ADDED TAX
A.90 As announced at the 2009 Pre-Budget Report, the flat rates were amended on 1 January 2010 to take account of latest sectoral data and the return of the standard VAT rate to 17.5 per cent. (*)
A.91 From 1 April 2010, the VAT registration threshold will be increased from £68,000 to £70,000 and the deregistration threshold from £66,000 to £68,000. (-)
A.92 From 1 January 2010, some amendments have been made to the Tour Operators’ VAT Margin Scheme to ensure full compliance with EU law.
A.93 The VAT and excise duties revenue sharing agreement between the UK and the Isle of Man was recalibrated in October 2009, with effect from 2010-11.
A.94 As announced on 31 July 2009, with immediate effect, a VAT zero rate for emissions allowances (also known as carbon credits) was introduced to counter an emerging Missing Trader Intra-Community (MTIC) fraud threat. (*)
Tax and accounting
changes
Stamp taxes on shares
Offshore funds
Funds investing in non-reporting
offshore funds
Mutual societies
VAT flat rate scheme
VAT registration threshold
Tour Operators’ Margin Scheme
VAT revenue sharing agreement
Emissions allowances: VAT
zero-rate
A B u d g e t p o l i c y d e c i s i o n s FsBR
132 Budget 2010
A.95 Finance Bill 2010 will enable a reverse charge to be applied to services used in Missing Trader fraud, amending the existing provision available in respect of goods used in the fraud. (*)
A.96 From 31 January 2011 VAT will be applied at the standard rate to certain postal services provided by the universal service provider (Royal Mail). The zero rating for passenger transport services will also be updated to reflect the status of the provider of a passenger transport service made in conjunction with its postal services. (*)
A.97 With effect from 1 August 2010, the scope of the zero rate for aircraft supplies will be amended from one based on the aircraft’s weight and usage to one based on the status of the customer. (*)
A.98 From 1 January 2011, the scope of special rules for natural gas, simplifying VAT treatment for business, will be adjusted and the rules (which already include electricity) will be extended to heat and cooling networks. (45)
A.99 From 1 April 2010 the basis on which businesses calculate the amount of VAT they can recover will be simplified. (*)
A.100 From 1 April 2010 amendments will be made to simplify the option to tax regime. (*)
A.101 As announced on 22 January 2010, measures will be introduced to protect revenues tied up in certain existing Lennartz schemes. In addition, from 1 January 2011 the use of Lennartz arrangements for certain assets will be withdrawn. (42)
ENV IRONMENT AND TRANSPORT
A.102 On 1 April 2010, the main fuel duty rate will increase by one penny per litre. It will then rise by a further one penny per litre on 1 October 2010 and by 0.76 pence per litre on 1 January 2011. On the same dates: leaded petrol will rise by the same amount as main fuel duty; rebated oils rates will rise in proportion to the main fuel duty rate; and the duty differential for compressed natural gas will be maintained. (11)
On 1 April 2010, the duty differential for liquefied petroleum gas will be reduced by 1 A.103 penny per litre. Also on 1 April 2010, the duty rate for aviation gasoline will rise by 3.78 pence per litre in order to meet EU minima. (11)
Fuel duty will rise by one penny per litre in real terms in April 2014. This is an A.104 extension of the Budget 2009 announcement, which increased fuel duty by one penny per litre in real terms in each April from 2011 to 2013. (31)
As announced at Budget 2008, the 20 pence per litre biofuels duty differential will A.105 cease from 1 April 2010 and biofuels will be charged the main duty rate. As announced at the 2009 Pre-Budget Report, the duty differential will continue for biodiesel produced from used cooking oil for two years. (ad)
A.106 As announced at the 2009 Pre-Budget Report, from 6 April 2010, the fuel benefit charge multiplier for company cars will increase from £16,900 to £18,000.The van fuel benefit charge will increase from £500 to £550. (ab)
A.107 From 1 May 2010, the VAT fuel scale charges will be revised to reflect updated fuel prices. (*)
A.108 As announced at the 2009 Pre-Budget Report, from 1 April 2010, the VED rate for motorcycles over 600cc will increase by £4 to £70, and the rate for motorcycles between 401cc and 600cc will increase by £2 to £50. Rates for motorcycles of 400cc or less will be frozen. (*)
VAT fraud reverse charge
VAT and postal services
Treatment of supplies of
aircraft
VAT place of supply
VAT partial exemption
VAT option to tax
VAT business and non-business
assets
Fuel duty
Fuel benefit charge
Fuel scale charges
VED
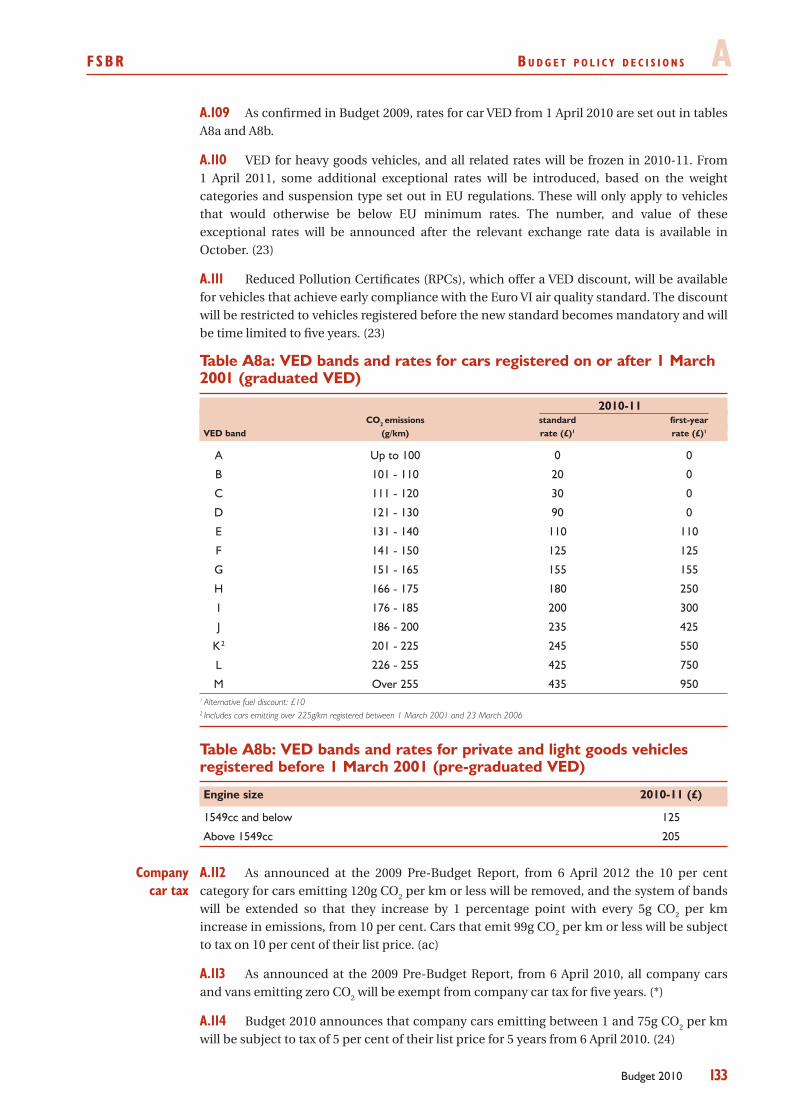
FsBR B u d g e t p o l i c y d e c i s i o n s A
133Budget 2010
As confirmed in Budget 2009, rates for car VED from 1 April 2010 are set out in tables A.109 A8a and A8b.
VED for heavy goods vehicles, and all related rates will be frozen in 2010-11. From A.110 1 April 2011, some additional exceptional rates will be introduced, based on the weight categories and suspension type set out in EU regulations. These will only apply to vehicles that would otherwise be below EU minimum rates. The number, and value of these exceptional rates will be announced after the relevant exchange rate data is available in October. (23)
Reduced Pollution Certificates (RPCs), which offer a VED discount, will be available A.111 for vehicles that achieve early compliance with the Euro VI air quality standard. The discount will be restricted to vehicles registered before the new standard becomes mandatory and will be time limited to five years. (23)
Table A8a: VED bands and rates for cars registered on or after 1 March 2001 (graduated VED)
2010-11 CO2
emissions standard first-year VED band (g/km) rate (£)1 rate (£)1
A Up to 100 0 0
B 101 - 110 20 0
C 111 - 120 30 0
D 121 - 130 90 0
E 131 - 140 110 110
F 141 - 150 125 125
G 151 - 165 155 155
H 166 - 175 180 250
I 176 - 185 200 300
J 186 - 200 235 425
K 2 201 - 225 245 550
L 226 - 255 425 750
M Over 255 435 9501 Alternative fuel discount: £102 Includes cars emitting over 225g/km registered between 1 March 2001 and 23 March 2006
Table A8b: VED bands and rates for private and light goods vehicles registered before 1 March 2001 (pre-graduated VED)
Engine size 2010-11 (£)
1549cc and below 125
Above 1549cc 205
A.112 As announced at the 2009 Pre-Budget Report, from 6 April 2012 the 10 per cent category for cars emitting 120g CO
2 per km or less will be removed, and the system of bands
will be extended so that they increase by 1 percentage point with every 5g CO2 per km
increase in emissions, from 10 per cent. Cars that emit 99g CO2 per km or less will be subject
to tax on 10 per cent of their list price. (ac)
As announced at the 2009 Pre-Budget Report, from 6 April 2010, all company cars A.113 and vans emitting zero CO
2 will be exempt from company car tax for five years. (*)
Budget 2010 announces that company cars emitting between 1 and 75g COA.114 2 per km
will be subject to tax of 5 per cent of their list price for 5 years from 6 April 2010. (24)
Company car tax
A B u d g e t p o l i c y d e c i s i o n s FsBR
134 Budget 2010
On 14 November 2009, HMRC published guidance announcing changes to the A.115 regime on car averaging for businesses that provide different company cars to their employees over the year. This will take effect from April 2010. (-)
A.116 As announced at the 2009 Pre-Budget Report, from 1 April 2010 (for corporation tax) and 6 April 2010 (for income tax) a 100 per cent first-year allowance will be provided for the purchase of new goods vehicles emitting zero CO2. Budget 2010 confirms that this will be in place for 5 years. (ae)
A.117 The Government intends to opt nitrous oxide gases from nitric acid production into the EU Emission Trading System from 2011. (22)
A.118 The standard rate of landfill tax will increase by £8 per tonne from 1 April 2014. The rate will not fall below £80 per tonne in the future. The lower rate of landfill tax will remain frozen at £2.50 per tonne in 2011-12. (26)
Following consultation, the list of wastes that qualify for the lower rate of landfill tax A.119 will remain broadly the same as present. A new qualifying criteria will be published later this year. There will be no changes to the way that waste disposal is defined in legislation for tax purposes. (*)
A.120 The landfill communities fund will increase in line with inflation in 2010-11 to £74 million. (-)
A.121 As announced at the 2009 Pre-Budget Report, from 1 April 2011 the climate change levy (CCL) discount available to energy intensive sectors participating in the climate change agreements (CCA) scheme will reduce from 80 to 65 per cent across all taxable commodities. (aa)
As announced at the 2009 Pre-Budget Report, the plastics and laundries sectors were A.122 admitted to the CCA scheme on 1 October 2009 and 1 December 2009 respectively. (-)
CCL rates will increase in line with inflation in 2011-12. (-)A.123
A.124 Aggregates levy will increase from £2.00 per tonne to £2.10 per tonne on 1 April 2011. (25)
A.125 The Government is seeking EU state aid approval to extend the Aggregates Levy Credit Scheme (ALCS) in Northern Ireland for a further ten years from 31 March 2011. (-)
A.126 The lists of designated energy saving and water-efficient technologies qualifying for 100 per cent enhanced first-year capital allowance will be updated during 2010, subject to agreement with the European Commission. (27)
OTHER IND IRECT TAXES AND DUT IES
A.127 Duties on tobacco will increase by 1 per cent above inflation on 24 March 2010. From 2011-12 to 2014-15, duties on tobacco will increase by 2 per cent above inflation each year. (30)
Capital allowances for zero-carbon
commercial vehicles
EU Emission Trading System
Landfill tax
Landfill communities fund
Climate change levy
Aggregates levy
Aggregates Levy Credit Scheme
Enhanced capital allowances
Tobacco duties
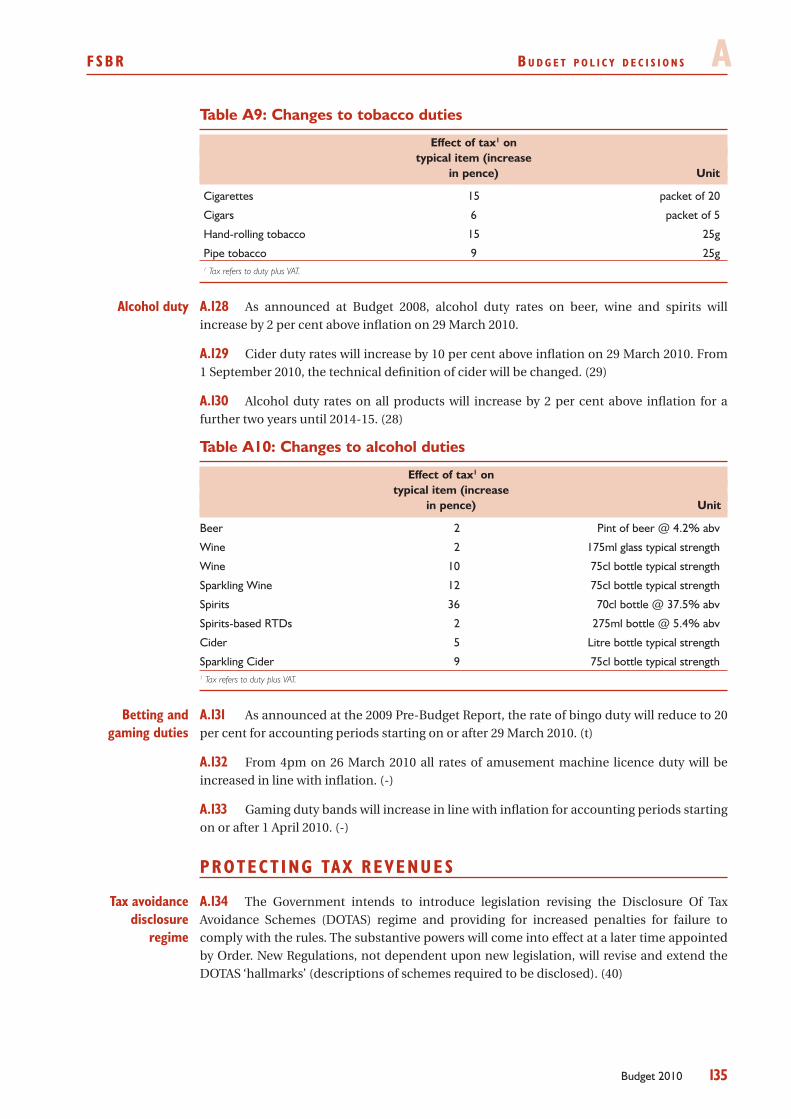
FsBR B u d g e t p o l i c y d e c i s i o n s A
135Budget 2010
Table A9: Changes to tobacco duties
Effect of tax1 on typical item (increase in pence) Unit
Cigarettes 15 packet of 20
Cigars 6 packet of 5
Hand-rolling tobacco 15 25g
Pipe tobacco 9 25g1 Tax refers to duty plus VAT.
A.128 As announced at Budget 2008, alcohol duty rates on beer, wine and spirits will increase by 2 per cent above inflation on 29 March 2010.
Cider duty rates will increase by 10 per cent above inflation on 29 March 2010. From A.129 1 September 2010, the technical definition of cider will be changed. (29)
Alcohol duty rates on all products will increase by 2 per cent above inflation for a A.130 further two years until 2014-15. (28)
Table A10: Changes to alcohol duties
Effect of tax1 on typical item (increase in pence) Unit
Beer 2 Pint of beer @ 4.2% abv
Wine 2 175ml glass typical strength
Wine 10 75cl bottle typical strength
Sparkling Wine 12 75cl bottle typical strength
Spirits 36 70cl bottle @ 37.5% abv
Spirits-based RTDs 2 275ml bottle @ 5.4% abv
Cider 5 Litre bottle typical strength
Sparkling Cider 9 75cl bottle typical strength1 Tax refers to duty plus VAT.
A.131 As announced at the 2009 Pre-Budget Report, the rate of bingo duty will reduce to 20 per cent for accounting periods starting on or after 29 March 2010. (t)
From 4pm on 26 March 2010 all rates of amusement machine licence duty will be A.132 increased in line with inflation. (-)
Gaming duty bands will increase in line with inflation for accounting periods starting A.133 on or after 1 April 2010. (-)
PROTECT ING TAX REVENUES
A.134 The Government intends to introduce legislation revising the Disclosure Of Tax Avoidance Schemes (DOTAS) regime and providing for increased penalties for failure to comply with the rules. The substantive powers will come into effect at a later time appointed by Order. New Regulations, not dependent upon new legislation, will revise and extend the DOTAS ‘hallmarks’ (descriptions of schemes required to be disclosed). (40)
Alcohol duty
Betting and gaming duties
Tax avoidance disclosure
regime
A B u d g e t p o l i c y d e c i s i o n s FsBR
136 Budget 2010
A.135 As announced at the 2009 Pre-Budget Report, two schemes that had been used to avoid inheritance tax through the use of trusts were closed down with immediate effect from 9 December 2009. (-)
A.136 At Finance Bill 2009, with effect from 22 April 2009, the special annual allowance was amended to provide more protection for those making pension contributions less regularly than quarterly. Where irregular contributions of more than £20,000 have been made over the last three years, the special annual allowance is the average of those contributions with an upper limit of £30,000. (p)
A.137 As announced at the 2009 Pre-Budget Report, with effect from 9 December 2009, legislation will be introduced to prevent companies from exploiting a weakness in the legislation that would allow a group to sell a lessor company without suffering the full effect of the charge imposed by the Schedule. (-)
As announced at the 2009 Pre-Budget Report, with effect from 9 December 2009, A.138 an option for companies to elect to defer the immediate tax charge under the sale of lessor companies legislation will be introduced. Budget 2010 announces the publication of further draft legislation to prevent alternative treatment being used for tax avoidance purposes. (-)
A.139 From 1 April 2010, leases of cushion gas will be deemed to be long funding leases and cushion gas will qualify for plant and machinery allowances at the special rate of 10 per cent. (*)
A.140 With effect from the announcement made on 21 July 2009, legislation was introduced to prevent tax avoidance through the transfer of an entitlement to benefit from capital allowances where the tax written down value of the plant or machinery exceeds its balance sheet value. Minor amendments were announced in Pre-Budget Report 2009. (-)
A.141 On 6 January 2010, the Government announced action with immediate effect to close a loophole and prevent corporate tax avoidance where trade assets are transferred out of an overseas branch of a UK company. (-)
A.142 As announced at the 2009 Pre-Budget Report, HMRC will apply a more consistent approach to the collection of debts when a tribunal or court has found against the taxpayer but there is a further appeal. This will apply to decisions made on or after 1 April 2010. (-)
A.143 As announced at the 2009 Pre-Budget Report, from 6 April 2010 HMRC will require businesses applying for Time-To-Pay for debts of £1 million or over to provide an Independent Business Review in support of their request. (*)
A.144 With effect from the announcement made on 21 October 2009, the Government intends to introduce legislation to prevent abuse of the rules on sideways loss relief. (-)
A.145 With effect from the announcement made on 21 May 2009, legislation was introduced in Finance Bill 2009, to prevent terminal loss relief from being accessed via artificial cessations of trade. (-)
A.146 The Government is committed to replacing the anti-avoidance rules relating to substantial donors to charities and will continue to explore the details of the proposed new purpose test. (o)
A.147 The Government intends to introduce legislation to close down a tax avoidance scheme involving relief for gifts of shares to charity, with effect from 15 December 2009, when this action was first announced. (33)
Inheritance tax avoidance
schemes
Pensions tax anti-forestalling
Sale of lessor companies
Cushion gas
Capital allowance
transfer
Branch asset transfers
Collecting debts during litigation
Large Time-to- Pay requests
Sideways loss relief
Terminal loss relief
Substantial donors
Gifts of shares to charity
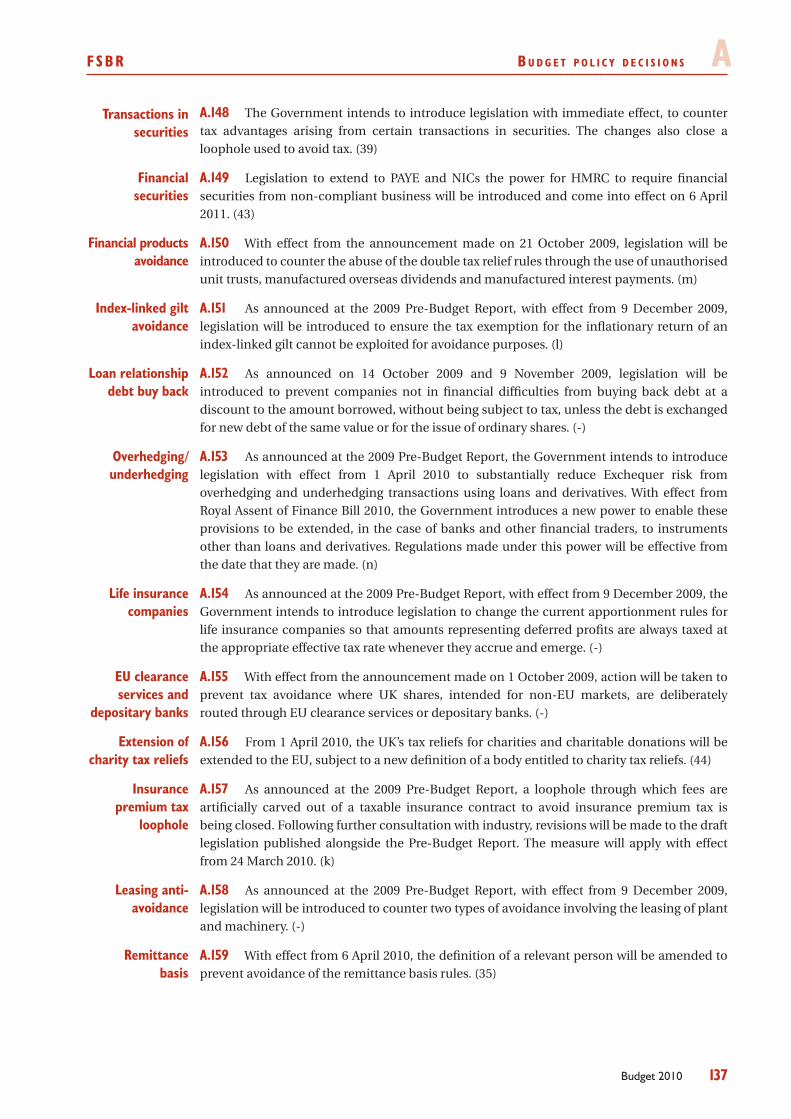
FsBR B u d g e t p o l i c y d e c i s i o n s A
137Budget 2010
A.148 The Government intends to introduce legislation with immediate effect, to counter tax advantages arising from certain transactions in securities. The changes also close a loophole used to avoid tax. (39)
A.149 Legislation to extend to PAYE and NICs the power for HMRC to require financial securities from non-compliant business will be introduced and come into effect on 6 April 2011. (43)
A.150 With effect from the announcement made on 21 October 2009, legislation will be introduced to counter the abuse of the double tax relief rules through the use of unauthorised unit trusts, manufactured overseas dividends and manufactured interest payments. (m)
A.151 As announced at the 2009 Pre-Budget Report, with effect from 9 December 2009, legislation will be introduced to ensure the tax exemption for the inflationary return of an index-linked gilt cannot be exploited for avoidance purposes. (l)
A.152 As announced on 14 October 2009 and 9 November 2009, legislation will be introduced to prevent companies not in financial difficulties from buying back debt at a discount to the amount borrowed, without being subject to tax, unless the debt is exchanged for new debt of the same value or for the issue of ordinary shares. (-)
A.153 As announced at the 2009 Pre-Budget Report, the Government intends to introduce legislation with effect from 1 April 2010 to substantially reduce Exchequer risk from overhedging and underhedging transactions using loans and derivatives. With effect from Royal Assent of Finance Bill 2010, the Government introduces a new power to enable these provisions to be extended, in the case of banks and other financial traders, to instruments other than loans and derivatives. Regulations made under this power will be effective from the date that they are made. (n)
A.154 As announced at the 2009 Pre-Budget Report, with effect from 9 December 2009, the Government intends to introduce legislation to change the current apportionment rules for life insurance companies so that amounts representing deferred profits are always taxed at the appropriate effective tax rate whenever they accrue and emerge. (-)
A.155 With effect from the announcement made on 1 October 2009, action will be taken to prevent tax avoidance where UK shares, intended for non-EU markets, are deliberately routed through EU clearance services or depositary banks. (-)
A.156 From 1 April 2010, the UK’s tax reliefs for charities and charitable donations will be extended to the EU, subject to a new definition of a body entitled to charity tax reliefs. (44)
A.157 As announced at the 2009 Pre-Budget Report, a loophole through which fees are artificially carved out of a taxable insurance contract to avoid insurance premium tax is being closed. Following further consultation with industry, revisions will be made to the draft legislation published alongside the Pre-Budget Report. The measure will apply with effect from 24 March 2010. (k)
A.158 As announced at the 2009 Pre-Budget Report, with effect from 9 December 2009, legislation will be introduced to counter two types of avoidance involving the leasing of plant and machinery. (-)
A.159 With effect from 6 April 2010, the definition of a relevant person will be amended to prevent avoidance of the remittance basis rules. (35)
Transactions in securities
Financial securities
Financial products avoidance
Index-linked gilt avoidance
Loan relationship debt buy back
Overhedging/ underhedging
Life insurance companies
EU clearance services and
depositary banks
Extension of charity tax reliefs
Insurance premium tax
loophole
Leasing anti-avoidance
Remittance basis
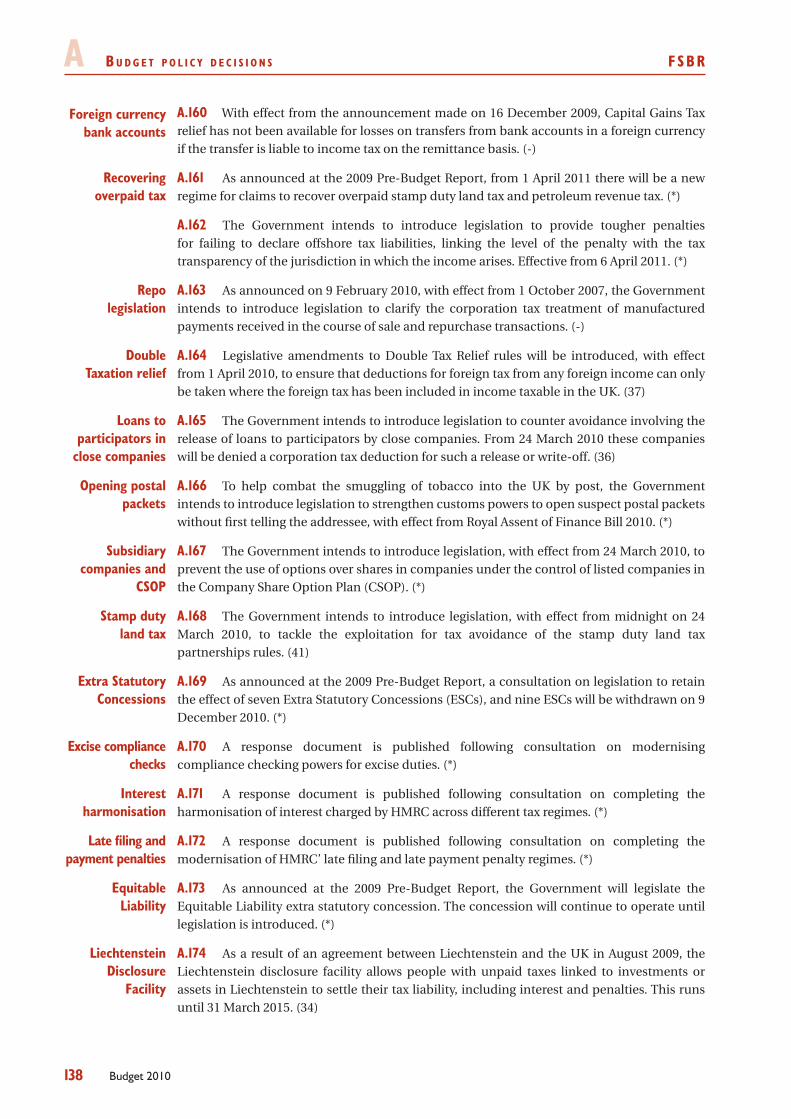
A B u d g e t p o l i c y d e c i s i o n s FsBR
138 Budget 2010
A.160 With effect from the announcement made on 16 December 2009, Capital Gains Tax relief has not been available for losses on transfers from bank accounts in a foreign currency if the transfer is liable to income tax on the remittance basis. (-)
A.161 As announced at the 2009 Pre-Budget Report, from 1 April 2011 there will be a new regime for claims to recover overpaid stamp duty land tax and petroleum revenue tax. (*)
The Government intends to introduce legislation to provide tougher penalties A.162 for failing to declare offshore tax liabilities, linking the level of the penalty with the tax transparency of the jurisdiction in which the income arises. Effective from 6 April 2011. (*)
A.163 As announced on 9 February 2010, with effect from 1 October 2007, the Government intends to introduce legislation to clarify the corporation tax treatment of manufactured payments received in the course of sale and repurchase transactions. (-)
A.164 Legislative amendments to Double Tax Relief rules will be introduced, with effect from 1 April 2010, to ensure that deductions for foreign tax from any foreign income can only be taken where the foreign tax has been included in income taxable in the UK. (37)
A.165 The Government intends to introduce legislation to counter avoidance involving the release of loans to participators by close companies. From 24 March 2010 these companies will be denied a corporation tax deduction for such a release or write-off. (36)
A.166 To help combat the smuggling of tobacco into the UK by post, the Government intends to introduce legislation to strengthen customs powers to open suspect postal packets without first telling the addressee, with effect from Royal Assent of Finance Bill 2010. (*)
A.167 The Government intends to introduce legislation, with effect from 24 March 2010, to prevent the use of options over shares in companies under the control of listed companies in the Company Share Option Plan (CSOP). (*)
A.168 The Government intends to introduce legislation, with effect from midnight on 24 March 2010, to tackle the exploitation for tax avoidance of the stamp duty land tax partnerships rules. (41)
A.169 As announced at the 2009 Pre-Budget Report, a consultation on legislation to retain the effect of seven Extra Statutory Concessions (ESCs), and nine ESCs will be withdrawn on 9 December 2010. (*)
A.170 A response document is published following consultation on modernising compliance checking powers for excise duties. (*)
A.171 A response document is published following consultation on completing the harmonisation of interest charged by HMRC across different tax regimes. (*)
A.172 A response document is published following consultation on completing the modernisation of HMRC’ late filing and late payment penalty regimes. (*)
A.173 As announced at the 2009 Pre-Budget Report, the Government will legislate the Equitable Liability extra statutory concession. The concession will continue to operate until legislation is introduced. (*)
A.174 As a result of an agreement between Liechtenstein and the UK in August 2009, the Liechtenstein disclosure facility allows people with unpaid taxes linked to investments or assets in Liechtenstein to settle their tax liability, including interest and penalties. This runs until 31 March 2015. (34)
Foreign currency bank accounts
Recovering overpaid tax
Repo legislation
Double Taxation relief
Loans to participators in
close companies
Opening postal packets
Subsidiary companies and
CSOP
Stamp duty land tax
Extra Statutory Concessions
Excise compliance checks
Interest harmonisation
Late filing and payment penalties
Equitable Liability
Liechtenstein Disclosure
Facility
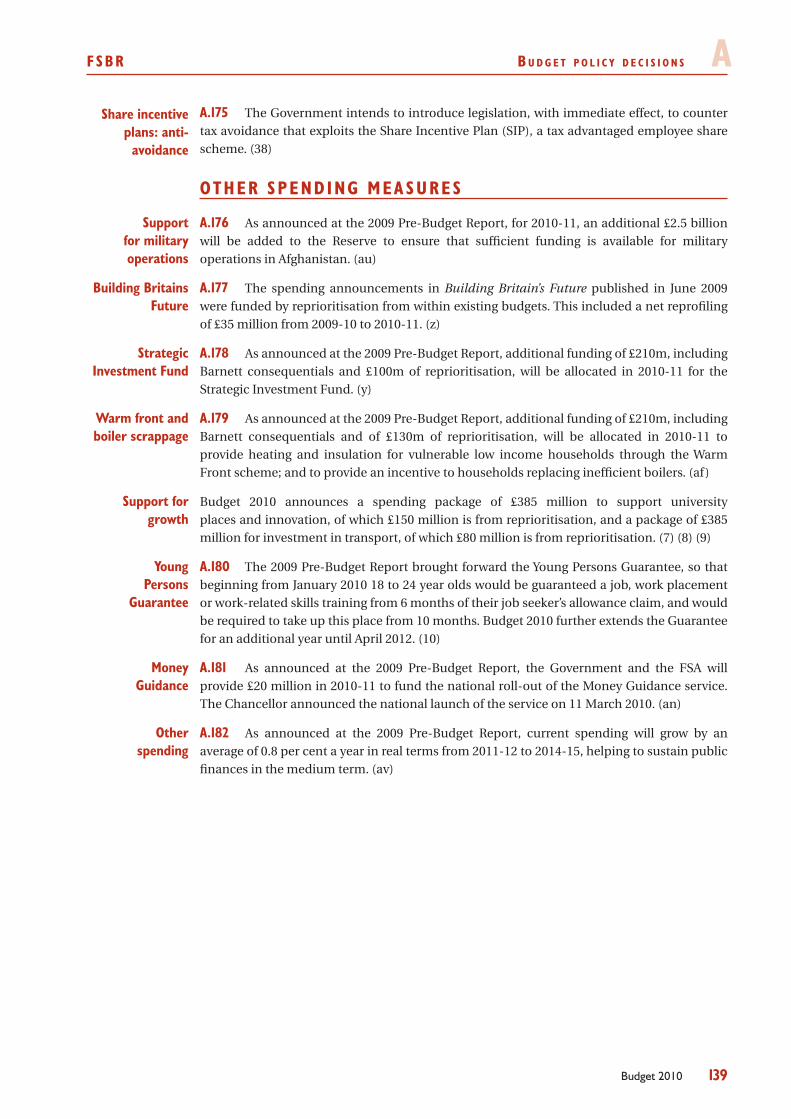
FsBR B u d g e t p o l i c y d e c i s i o n s A
139Budget 2010
A.175 The Government intends to introduce legislation, with immediate effect, to counter tax avoidance that exploits the Share Incentive Plan (SIP), a tax advantaged employee share scheme. (38)
OTHER SPENDING MEA SURES
A.176 As announced at the 2009 Pre-Budget Report, for 2010-11, an additional £2.5 billion will be added to the Reserve to ensure that sufficient funding is available for military operations in Afghanistan. (au)
A.177 The spending announcements in Building Britain’s Future published in June 2009 were funded by reprioritisation from within existing budgets. This included a net reprofiling of £35 million from 2009-10 to 2010-11. (z)
A.178 As announced at the 2009 Pre-Budget Report, additional funding of £210m, including Barnett consequentials and £100m of reprioritisation, will be allocated in 2010-11 for the Strategic Investment Fund. (y)
A.179 As announced at the 2009 Pre-Budget Report, additional funding of £210m, including Barnett consequentials and of £130m of reprioritisation, will be allocated in 2010-11 to provide heating and insulation for vulnerable low income households through the Warm Front scheme; and to provide an incentive to households replacing inefficient boilers. (af)
Budget 2010 announces a spending package of £385 million to support university places and innovation, of which £150 million is from reprioritisation, and a package of £385 million for investment in transport, of which £80 million is from reprioritisation. (7) (8) (9)
A.180 The 2009 Pre-Budget Report brought forward the Young Persons Guarantee, so that beginning from January 2010 18 to 24 year olds would be guaranteed a job, work placement or work-related skills training from 6 months of their job seeker’s allowance claim, and would be required to take up this place from 10 months. Budget 2010 further extends the Guarantee for an additional year until April 2012. (10)
A.181 As announced at the 2009 Pre-Budget Report, the Government and the FSA will provide £20 million in 2010-11 to fund the national roll-out of the Money Guidance service. The Chancellor announced the national launch of the service on 11 March 2010. (an)
A.182 As announced at the 2009 Pre-Budget Report, current spending will grow by an average of 0.8 per cent a year in real terms from 2011-12 to 2014-15, helping to sustain public finances in the medium term. (av)
Share incentive plans: anti-
avoidance
Support for military operations
Building Britains Future
Strategic Investment Fund
Warm front and boiler scrappage
Support for growth
Young Persons
Guarantee
Money Guidance
Other spending
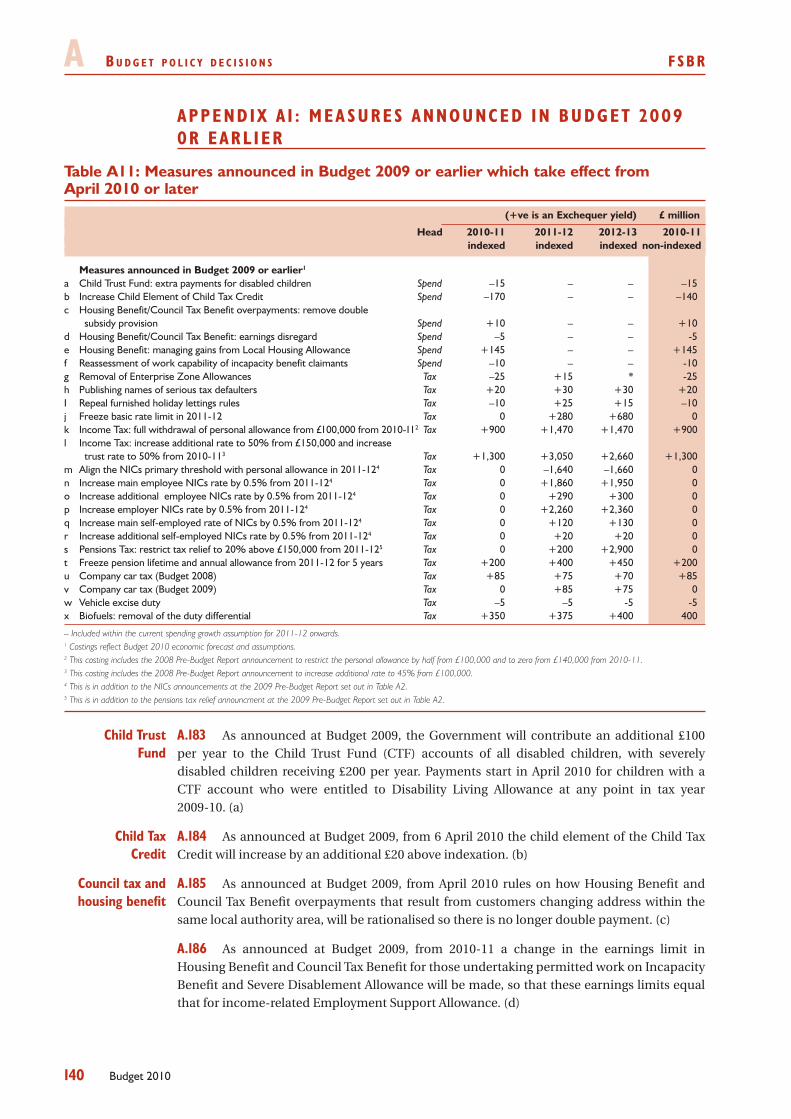
A B u d g e t p o l i c y d e c i s i o n s FsBR
140 Budget 2010
APPENDIX A I : MEA SURES ANNOUNCED IN BUDGET 2009 0R EARL IER
Table A11: Measures announced in Budget 2009 or earlier which take effect from April 2010 or later
(+ve is an Exchequer yield) £ million
Head 2010-11 2011-12 2012-13 2010-11 indexed indexed indexed non-indexed
Measures announced in Budget 2009 or earlier1
a Child Trust Fund: extra payments for disabled children Spend –15 – – –15b Increase Child Element of Child Tax Credit Spend –170 – – –140c Housing Benefit/Council Tax Benefit overpayments: remove double
subsidy provision Spend +10 – – +10d Housing Benefit/Council Tax Benefit: earnings disregard Spend –5 – – -5e Housing Benefit: managing gains from Local Housing Allowance Spend +145 – – +145f Reassessment of work capability of incapacity benefit claimants Spend –10 – – -10g Removal of Enterprise Zone Allowances Tax –25 +15 * -25h Publishing names of serious tax defaulters Tax +20 +30 +30 +20I Repeal furnished holiday lettings rules Tax –10 +25 +15 –10j Freeze basic rate limit in 2011-12 Tax 0 +280 +680 0k Income Tax: full withdrawal of personal allowance from £100,000 from 2010-112 Tax +900 +1,470 +1,470 +900l Income Tax: increase additional rate to 50% from £150,000 and increase
trust rate to 50% from 2010-113 Tax +1,300 +3,050 +2,660 +1,300m Align the NICs primary threshold with personal allowance in 2011-124 Tax 0 –1,640 –1,660 0n Increase main employee NICs rate by 0.5% from 2011-124 Tax 0 +1,860 +1,950 0o Increase additional employee NICs rate by 0.5% from 2011-124 Tax 0 +290 +300 0p Increase employer NICs rate by 0.5% from 2011-124 Tax 0 +2,260 +2,360 0q Increase main self-employed rate of NICs by 0.5% from 2011-124 Tax 0 +120 +130 0r Increase additional self-employed NICs rate by 0.5% from 2011-124 Tax 0 +20 +20 0s Pensions Tax: restrict tax relief to 20% above £150,000 from 2011-125 Tax 0 +200 +2,900 0t Freeze pension lifetime and annual allowance from 2011-12 for 5 years Tax +200 +400 +450 +200u Company car tax (Budget 2008) Tax +85 +75 +70 +85v Company car tax (Budget 2009) Tax 0 +85 +75 0w Vehicle excise duty Tax –5 –5 -5 -5x Biofuels: removal of the duty differential Tax +350 +375 +400 400
– Included within the current spending growth assumption for 2011-12 onwards.1 Costings reflect Budget 2010 economic forecast and assumptions.2 This costing includes the 2008 Pre-Budget Report announcement to restrict the personal allowance by half from £100,000 and to zero from £140,000 from 2010-11.3 This costing includes the 2008 Pre-Budget Report announcement to increase additional rate to 45% from £100,000.4 This is in addition to the NICs announcements at the 2009 Pre-Budget Report set out in Table A2.5 This is in addition to the pensions tax relief announcment at the 2009 Pre-Budget Report set out in Table A2.
A.183 As announced at Budget 2009, the Government will contribute an additional £100 per year to the Child Trust Fund (CTF) accounts of all disabled children, with severely disabled children receiving £200 per year. Payments start in April 2010 for children with a CTF account who were entitled to Disability Living Allowance at any point in tax year 2009-10. (a)
A.184 As announced at Budget 2009, from 6 April 2010 the child element of the Child Tax Credit will increase by an additional £20 above indexation. (b)
A.185 As announced at Budget 2009, from April 2010 rules on how Housing Benefit and Council Tax Benefit overpayments that result from customers changing address within the same local authority area, will be rationalised so there is no longer double payment. (c)
As announced at Budget 2009, from 2010-11 a change in the earnings limit in A.186 Housing Benefit and Council Tax Benefit for those undertaking permitted work on Incapacity Benefit and Severe Disablement Allowance will be made, so that these earnings limits equal that for income-related Employment Support Allowance. (d)
Child Trust Fund
Child Tax Credit
Council tax and housing benefit
FsBR B u d g e t p o l i c y d e c i s i o n s A
141Budget 2010
A.187 As announced at Budget 2009, from April 2010 there will no longer be scope for anyone to receive more in the LHA than they have to pay in rent. This was subsequently delayed to April 2011 (see paragraph A.38). (e)
A.188 As announced at Budget 2008, starting in October 2010, the eligibilty of incapacity benefits of all existing incapacity benefits will be reassessed using the new Employment Support Allowance Work Capability Assessment. (f).
A.189 As announced on 17 December 2007, Enterprise Zone Allowances will be withdrawn from April 2011 as a consequnce of the withdrawal of the Industrial Building’s Allowance. (g)
A.190 As announced at Budget 2009, HMRC will be able to publish the names and details of individuals and companies who are penalised for deliberate defaults leading to a loss of tax of more than £25,000. This power will come into effect by Treasury Order with effect from 1 April 2010. (h)
A.191 As announced at Budget 2009, from 6 April 2010, the furnished holiday lettings (FHL) rules will be repealed. (i)
A.192 As announced at Budget 2009, in 2010-11 the income tax personal allowance will be restricted for those with incomes over £100,000 at a rate of £1 of allowance lost for every £2 of income over that level until completely withdrawn. (j)
As announced at Budget 2009, a new additional rate of income tax of 50 per cent A.193 (and 42.5 per cent for dividend income) will be introduced in 2010-11 for those with incomes above £150,000. The tax rate applicable to trusts will also rise to 50 per cent. (k)
As announced at the 2008 Pre-Budget Report, the basic rate limit will be held at its A.194 2010-11 position in 2011-12. (l)
A.195 The 2008 Pre-Budget Report announced an increase in the primary national insurance contribution threshold to the weekly equivalent of the income tax personal allowance in 2011-12. Table A11 shows the impact of this increase. As set out at para A.13, the 2009 Pre-Budget Report announced a further primary threshold rise in 2011-12. (m)
The 2008 Pre-Budget Report announced an increase in employee, employer and self-A.196 employed rates of national insurance contributions by 0.5 per cent in 2011-12. Table A11 shows the impact of this increase. As set out at paragraph A.11, the 2009 Pre-Budget Report announced a further 0.5 per cent increase in 2011-12. (n) (o) (p) (q) (r)
A.197 Budget 2009 announced that tax relief on pension contributions would be restricted for individuals on high incomes from 2011-12. The 2009 Pre-Budget Report announced further details of the income thrsholds to determine whether individuals are affected. Anti-forestalling provisions were introduced with effect from 22 April 2009 (see paragraph A.29). (s)
A.198 As announced at 2008 Pre-Budget Report, the lifetime allowance will be maintained at the 2010-11 level of £1.8 million for a further five years, up to and including 2015-16. The annual allowance will also be held constant at £255,000 over the same period. (t)
A.199 As announced at Budget 2008, from April 2010 the lower threshold for the 15 per cent CCT band will be lowered so that it applies to drivers of company cars emitting between 121kg CO2 per km and 134g CO2 per km. (u)
As announced at Budget 2009, from April 2011 the proportion of a company car’s A.200 list price subject to tax will increase by 1 percentage point with each 5g per km that its CO
2
emission exceed this threshold, to a maximum of 35 per cent for company cars emitting 225g CO
2 per km. The £80,000 cap on the list price of company cars will also be abolished on this
Local Housing Allowance
Reassessment of work capability
Enterprise Zone Allowances
Publication of names
Furnished holiday lettings
Income tax
National insurance
contributions
Pensions tax: restrict tax relief
Pensions lifetime and annual allowances
Company car tax
A B u d g e t p o l i c y d e c i s i o n s FsBR
142 Budget 2010
date, meaning that the full list price of all company cars will be used to calculate the level of benefit that is taxable under CCT. (v)
A.201 As announced at Budget 2009, from 1 April 2010 cars imported into the UK will only pay the First-Year Rate if they are under six months old or have travelled less than 6,000 km. Wider rules on the licensing of imported vehicles imported into the UK from 23 March 2006 onwards will also be changed from April 2010. (w)
A.202 As announced at Budget 2008, from 2010-11 the biofuels duty differential will cease (see para. A.105 for exception), and support for biofuels will be provided by the Renewable Transport Fuel Obligation. (x)
APPENDIX A2 : EXPL A IN ING THE COST INGS
This appendix explains how the fiscal impacts of the Budget and Pre-Budget Report A.203 policy decisions are calculated. In the context of these calculations, the net revenue effects for the measures may include amounts for taxes, national insurance contributions, social security benefits and other charges to the Exchequer, including penalties.
Ca l cu l a t i ng the cos t ingsThe Budget Report projections for the public finances take full account of all A.204
the measures announced in this and previous Budgets and Pre-Budget Reports. This is achieved through detailed modelling of the direct effect on receipts of individual measures, including their microeconomic behavioural effects where significant, and through the use of macroeconomic models which are able to estimate the indirect impact of the Budget Report package of measures as a whole. The detailed tax models tend to only consider the impact of a measure on the tax base the measure is being applied to, or closely related tax bases. The indirect impacts on other tax bases and the impact on economic growth are generally captured through the macroeconomic models. The costings shown in Table A1, A2 and A11 are consistent with those produced using the detailed tax models.
The calculation of the expected effect of changes in duty rate on consumer demand A.205 for excise goods assumes that any change in duty is passed on in full to consumers. Where the effect of one tax change is affected by implementation of others, the measures are normally costed in the order in which they appear.
The indexed costings show the exchequer impacts of the measures against a baseline A.206 that assumes allowances, thresholds and specific tax rates will be increased in line with either the appropriate price index (more details given in paragraph A.208 below), or any pre-commitments (measures announced in previous Budgets or Pre-Budget Reports that are or were due to come into effect). As such they give an indicator of the impact of the decisions made in the current Budget report.
The non-indexed column shows the revenue effects of the policy options against A.207 a baseline that assumes allowances; thresholds and tax rates are left unchanged. The non-indexed column therefore includes the revenue impact of indexation or other pre-commitments.
Unless allowances, thresholds and specific tax rates have been pre-announced, the A.208 indexed baseline assumes the following:
income tax and National Insurance allowances and thresholds (excluding ••the higher rate limit and the income above which the income tax personal allowance will be restricted); the child element and disabled and severely
Vehicle excise duty – imported
vehicles
Biofuels differential
FsBR B u d g e t p o l i c y d e c i s i o n s A
143Budget 2010
disabled child elements of the Child Tax Credit, the single person, couple, lone parent, 30 hour 50 plus, disabled and severely disabled worker elements of the Working Tax Credit; inheritance tax nil-rate band allowance threshold; business rates and the capital gains tax annual exempt amount all increase in line with the change in the Retail Price Index (RPI) in the year to the September prior to the respective Budget or Pre-Budget Report;
the climate change and aggregates levy and the vehicle excise duty, ••amusement machine licence duty, air passenger duty, fuel, tobacco and alcohol duties all rise in line with the projected annual change in the RPI in the year to the third quarter following the respective Budget or Pre-Budget Report;
VAT thresholds and gaming duty bands rise in line with the change in the RPI ••in the year to the December prior to the respective Budget.
With the exception of business rates, when indexation rates are negative, the indexed A.209 baseline assumes allowances, thresholds and specific tax rates are held constant. The indexed baseline also takes account of statutory rounding rules.
The yields of measures that close tax avoidance loopholes or tackle tax fraud A.210 represent the estimated direct Exchequer effect of the measures with the existing level of avoidance activity.
These estimates are shown on a National Accounts basis. The National Accounts A.211 basis aims to recognise tax when the tax liability accrues irrespective of when the tax is received by the Exchequer. However, some taxes are accounted for when the Exchequer actually receives the tax, reflecting the difficulty in determining the period to which the tax liability relates. Examples of such taxes are corporation tax, self-assessment income tax, stamp duty land tax, inheritance tax and capital gains tax. This approach is consistent with other Government publications.
Notes on i nd i v idua l Budge t measuresA.212 The expected yield from the bank payroll tax is shown in table A2. The net yield of £1.3 billion compares to the expected net yield of £550 million at the 2009 Pre-Budget Report. The updated yield is based on a higher forecast for banks bonuses including deferred awards in 2009-10 which are now expected to rise by around 25 per cent on 2008-09 levels, while the Pre-Budget Report forecast a fall. Receipts from the bank payroll tax are estimated to be £2 billion but the behavioural change from introduction of the tax is expected to reduce income tax and NICs receipts relative to not introducing the tax, which reduces the net yield of the policy to £1.3 billion. Due to National Accounts rules bank payroll tax receipts are scored in 2010-11 and the behavioural impact on income tax and NICs impacts on 2009-10 receipts (see chapter C for more details).
Bank payroll tax

144 Budget 2010
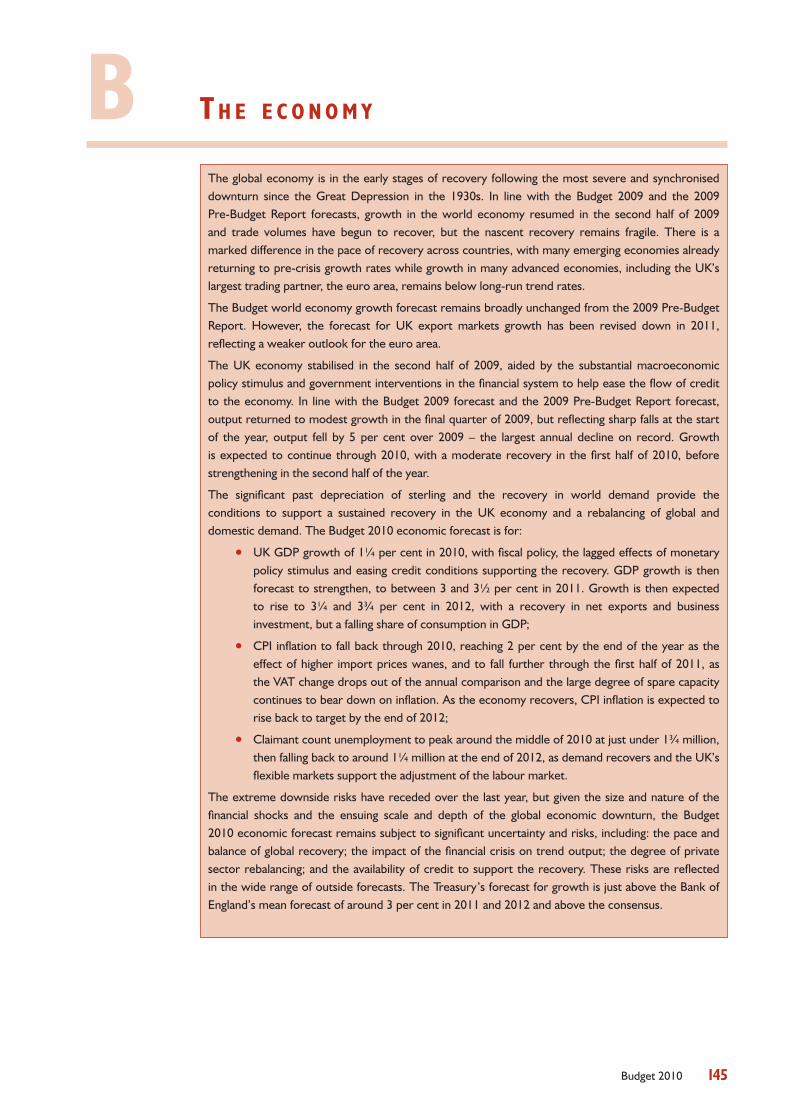
145Budget 2010
B T h e e c o n o m y
The global economy is in the early stages of recovery following the most severe and synchronised downturn since the Great Depression in the 1930s. In line with the Budget 2009 and the 2009 Pre-Budget Report forecasts, growth in the world economy resumed in the second half of 2009 and trade volumes have begun to recover, but the nascent recovery remains fragile. There is a marked difference in the pace of recovery across countries, with many emerging economies already returning to pre-crisis growth rates while growth in many advanced economies, including the UK’s largest trading partner, the euro area, remains below long-run trend rates.
The Budget world economy growth forecast remains broadly unchanged from the 2009 Pre-Budget Report. However, the forecast for UK export markets growth has been revised down in 2011, reflecting a weaker outlook for the euro area.
The UK economy stabilised in the second half of 2009, aided by the substantial macroeconomic policy stimulus and government interventions in the financial system to help ease the flow of credit to the economy. In line with the Budget 2009 forecast and the 2009 Pre-Budget Report forecast, output returned to modest growth in the final quarter of 2009, but reflecting sharp falls at the start of the year, output fell by 5 per cent over 2009 – the largest annual decline on record. Growth is expected to continue through 2010, with a moderate recovery in the first half of 2010, before strengthening in the second half of the year.
The significant past depreciation of sterling and the recovery in world demand provide the conditions to support a sustained recovery in the UK economy and a rebalancing of global and domestic demand. The Budget 2010 economic forecast is for:
UK GDP growth of 1¼ per cent in 2010, with fiscal policy, the lagged effects of monetary •policy stimulus and easing credit conditions supporting the recovery. GDP growth is then forecast to strengthen, to between 3 and 3½ per cent in 2011. Growth is then expected to rise to 3¼ and 3¾ per cent in 2012, with a recovery in net exports and business investment, but a falling share of consumption in GDP;
CPI inflation to fall back through 2010, reaching 2 per cent by the end of the year as the •effect of higher import prices wanes, and to fall further through the first half of 2011, as the VAT change drops out of the annual comparison and the large degree of spare capacity continues to bear down on inflation. As the economy recovers, CPI inflation is expected to rise back to target by the end of 2012;
Claimant count unemployment to peak around the middle of 2010 at just under 1¾ million, •then falling back to around 1¼ million at the end of 2012, as demand recovers and the UK’s flexible markets support the adjustment of the labour market.
The extreme downside risks have receded over the last year, but given the size and nature of the financial shocks and the ensuing scale and depth of the global economic downturn, the Budget 2010 economic forecast remains subject to significant uncertainty and risks, including: the pace and balance of global recovery; the impact of the financial crisis on trend output; the degree of private sector rebalancing; and the availability of credit to support the recovery. These risks are reflected in the wide range of outside forecasts. The Treasury’s forecast for growth is just above the Bank of England’s mean forecast of around 3 per cent in 2011 and 2012 and above the consensus.
B T h e e c o n o m y FSBR
146 Budget 2010
INTRODUCT ION 1,2
The global economy is recovering following the most severe and synchronised B.1 contraction since the Great Depression. The financial crisis, which was triggered in the summer 2007 by disruption in the US subprime mortgage market quickly spread concerns about the solvency of banks around the world. Although the rapid action taken by the UK and other governments prevented the collapse of the global financial system, the crisis created a severe global economic shock and it will take time for the world economy to fully recover.
The world economy was hit by a succession of shocks during 2007 and 2008. Initially, B.2 credit conditions tightened across advanced economies. Then the rise in global commodity prices squeezed real incomes. Together, these factors pushed many advanced economies into recession. Finally, the intensification of the credit shock into a global financial crisis delivered a severe blow to confidence in an already weakened world economy, precipitating a steep global downturn. World GDP fell in 2009, suffering its first full year decline in the post‑war era. Global trade and industrial production plummeted, dropping by over 18 per cent and over 11 per cent respectively in the first quarter of 2009 on a year earlier. Global equity prices fell and by early 2009 they had lost 50 per cent from their peak.
The extent of global financial and economic shocks led to unprecedented support B.3 by governments and central banks around the world. In the UK, household and corporate incomes are being supported by substantial fiscal support, worth almost 5 per cent of GDP in 2009‑10, and targeted measures to help the labour market, home‑owners and businesses. The economy continues to be reinforced by the monetary policy stimulus which remains in place: Bank Rate has been maintained at ½ per cent since March 2009 and the stock of assets purchased by the Bank of England now stands at £200 billion. The Government’s financial sector interventions to recapitalise banks and ensure access to finance for credit‑worthy borrowers have helped to promote the flow of credit to the economy.
In line with the Budget 2009 forecast, the world economy returned to growth in 2009, B.4 driven by a strong rebound in the Asian economies and substantial monetary and fiscal policy interventions across the world that helped ease conditions in financial markets and stabilise demand. The UK economy stabilised before returning to growth in the final quarter of 2009, in line with the forecast at Budget 2009 and 2009 Pre‑Budget Report.
Despite the sharper fall in UK output through this recession than in the 1990s, the B.5 decline in employment has been smaller than at that time and less than expected at the time of Budget 2009. This, combined with the smaller than expected decline in house prices, has been reflected in relatively lower arrears and repossessions than in the 1990s recession, preventing the potential adverse feedback loop of lower asset values, thinner bank capital ratios and lower lending that could have weakened the economy further. Inflation has increased since the 2009 Pre‑Budget Report, in line with the forecast, although higher than
1 The UK forecast is consistent with National Accounts and balance of payments statistics to the third quarter of 2009 released by the Office for National Statistics (ONS) on 22 December 2009, and the second estimate of GDP growth in the fourth quarter released on 26 February 2010. This release also contained revisions to earlier quarters of 2009, which the Treasury has carried through to other National Accounts series that the ONS has not yet revised, in particular sectoral saving and borrowing. A fully consistent National Accounts data set will be published by the ONS on 30 March 2010. A detailed set of charts and tables relating to the economic forecast is available in Budget 2010: the economy and public finances – supplementary material on the Treasury’s internet site. Copies can be obtained on request from the Treasury’s Public Enquiry Unit (020 7270 4558).2 The forecast is based on the assumption that the exchange rate moves in line with an uncovered interest parity condition, consistent with the interest rates underlying the economic forecast.
FSBR T h e e c o n o m y B
147Budget 2010
anticipated at Budget 2009 reflecting a more rapid pass‑through of strong import prices and a pick‑up in oil prices in 2009.
The Budget 2010 growth forecast is largely unchanged from the 2009 Pre‑Budget B.6 Report. However, the nature of the global credit shock and world downturn, and the scale of the international macroeconomic and financial policy response, have highlighted the inherent difficulties in economic forecasting. The size and scale of the unexpected global shocks have called into question the empirical models upon which economic forecasts are based, requiring more judgement to assess the distribution of risks, and take account of the high degree of uncertainty.
THE WORLD ECONOMY
B.7 After successive shocks from the commodity markets and global financial system, G20 policy action and unprecedented co‑ordination has helped to stabilise financial markets and demand, boosting short‑term global prospects. However, the nascent recovery remains fragile and there is a marked difference in the pace of recovery between advanced and emerging economies.
The return to growth has largely been driven by two common factors in most B.8 countries outside Asia: government stimulus measures and a turn in the inventory cycle. While interventions have helped to improve conditions in financial markets, expansionary monetary and fiscal policies have helped to stabilise demand and firms have been able to reduce stocks at a slower pace, helping to boost growth. This impetus from inventories may be uneven but it is likely to continue well into 2010, as will the effects of both monetary and fiscal stimulus.
The capacity of private demand to drive growth will be key in determining prospects B.9 for the global economy and recent data show tentative signs of a recovery. The global manufacturing purchasing managers survey compiled by JP Morgan reached a five and a half year high in early 2010 and world trade in goods has risen sharply. According to the CPB Netherlands Bureau for Economic Analysis, world trade grew by 6 per cent in the fourth quarter of 2009, the fastest quaterly growth since records began in 1991. Improvements in the global economy have also been reflected in global financial markets with the gains made during 2009 being consolidated since the 2009 Pre‑Budget Report – world stock prices remain over 60 per cent above their February 2009 level, helping to underpin confidence.
Maintaining confidence and reducing uncertainty will be essential to the continued B.10 recovery in private sector demand. Recent events have shown how quickly risk appetite can be reversed and how fragile financial market sentiment in the recovery can be.
B.11 Despite improvements in global financial markets, credit conditions in the advanced economies remain tight. Lending standards remain restrictive and the demand for loans is weak.
B.12 Having risen earlier in 2009, commodity prices have remained relatively stable since the 2009 Pre‑Budget Report. With a high degree of spare capacity and a stable outlook for demand, oil prices have remained in $70–$85 per barrel range, close to their level since mid 2009. Demand for oil will remain dependent on the shape and pace of the global recovery. Currently, markets are well supplied with inventories, and spare capacity remains at a comfortable level.
Global recovery
Credit conditions
Commodity prices
B T h e e c o n o m y FSBR
148 Budget 2010
Wor ld ou t lookIn contrast with the synchronised nature of the downturn, the global recovery has B.13
been characterised by a divergence in the growth rates of advanced and emerging economies. While some degree of divergence is usual given different levels of trend growth, the speed at which economies are expected to return to pre‑crisis growth rates differs – many emerging economies have already done so, while many advanced economies are not expected to grow consistently at or above trend rates until 2011.
B.14 The euro area grew by 0.4 per cent in the third quarter of 2009, but growth then slowed to 0.1 per cent in the final quarter and overall growth in the second half of 2009 was lower than expected in the 2009 Pre‑Budget Report. While the recovery in world trade continued to support euro area exports, domestic demand was subdued and investment was especially weak.
Across euro area countries an uneven picture is emerging. In part this reflects the B.15 significant challenges facing some of the region’s economies which continue to face difficult adjustments as imbalances unwind – associated, in particular, with rapid pre‑crisis growth and a steady erosion of their competitiveness against euro area partners over recent years. Divergence also reflects differences in the withdrawal of stimulus measures across countries and the different timing of inventory cycles.
Recent data have sent mixed messages over the strength of the euro area recovery, B.16 which remains a key uncertainty for the UK economic forecast. Industrial production rose by 2 per cent on a quarterly basis in the fourth quarter of 2009 after 0.8 per cent in the previous quarter, and there has been a steady rise in confidence indicators into 2010. However, growth in industrial new orders slowed to 1.1 per cent in the fourth quarter following a 7.7 per cent rise in the previous quarter and retail sales remain subdued.
The euro area is forecast to grow by ¾ per cent in 2010, driven primarily by B.17 improvements in global demand supporting moderate export growth. Domestic consumption is expected to remain subdued, weighed down by further weakening in the labour market and relatively low wage growth against a backdrop of slowly rising inflation. Growth of around 1¾ per cent is expected in 2011 as domestic demand begins to gather momentum.
B.18 The US economy returned to growth in the second half of 2009, following four consecutive quarters of contraction. The inventory cycle and government stimulus measures have been the principal drivers of the recovery in output. Over half of the stimulus package announced at the start of 2009 has yet to be spent, with the composition changing towards infrastructure spending and away from government transfers during 2010. Consistent with a significant improvement in financial conditions and rapid growth in the manufacturing sector, consensus growth forecasts for the US economy have risen in recent months.
However, risks to growth remain for the world’s largest economy and the UK’s largest B.19 single‑country export market. The labour market continues to weaken, albeit at a greatly reduced pace compared with the first half of 2009, and prospects for job creation remain heavily dependent on bank lending to smaller firms. The housing market has also shown mixed signs, with prices stabilising but activity remaining volatile with substantial excess supply. According to consensus forecasts, the US economy is set to grow by 3.1 per cent in 2010 and 3.0 per cent in 2011.
B.20 For Asian economies, growth prospects continue to be strongly influenced by the performance of the Chinese economy. China, already one of the world’s largest exporters, is
Euro area
United States
Asia
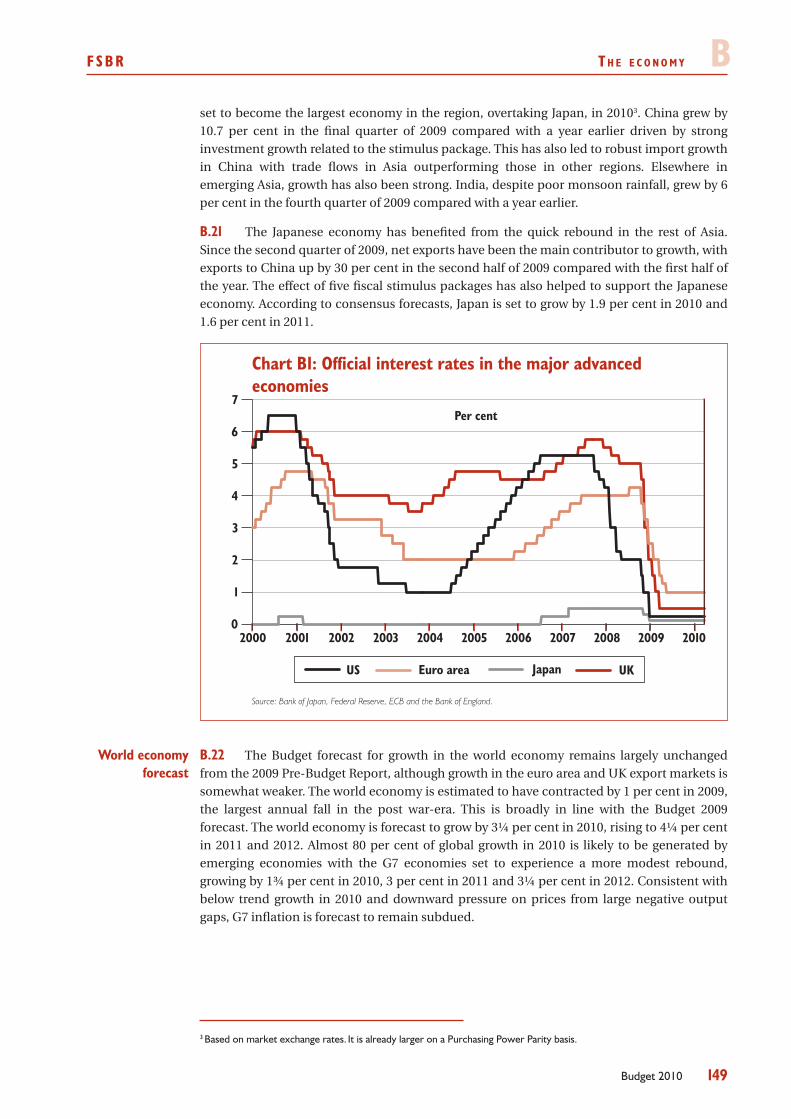
FSBR T h e e c o n o m y B
149Budget 2010
set to become the largest economy in the region, overtaking Japan, in 20103. China grew by 10.7 per cent in the final quarter of 2009 compared with a year earlier driven by strong investment growth related to the stimulus package. This has also led to robust import growth in China with trade flows in Asia outperforming those in other regions. Elsewhere in emerging Asia, growth has also been strong. India, despite poor monsoon rainfall, grew by 6 per cent in the fourth quarter of 2009 compared with a year earlier.
The Japanese economy has benefited from the quick rebound in the rest of Asia. B.21 Since the second quarter of 2009, net exports have been the main contributor to growth, with exports to China up by 30 per cent in the second half of 2009 compared with the first half of the year. The effect of five fiscal stimulus packages has also helped to support the Japanese economy. According to consensus forecasts, Japan is set to grow by 1.9 per cent in 2010 and 1.6 per cent in 2011.
Source: Bank of Japan, Federal Reserve, ECB and the Bank of England.
0
1
2
3
4
5
6
7
2000 2001 2002 2003 2004 2005 2006 2007 2008 2009 2010
UKJapanEuro areaUS
Chart B1: Official interest rates in the major advanced economies
Per cent
B.22 The Budget forecast for growth in the world economy remains largely unchanged from the 2009 Pre‑Budget Report, although growth in the euro area and UK export markets is somewhat weaker. The world economy is estimated to have contracted by 1 per cent in 2009, the largest annual fall in the post war‑era. This is broadly in line with the Budget 2009 forecast. The world economy is forecast to grow by 3¼ per cent in 2010, rising to 4¼ per cent in 2011 and 2012. Almost 80 per cent of global growth in 2010 is likely to be generated by emerging economies with the G7 economies set to experience a more modest rebound, growing by 1¾ per cent in 2010, 3 per cent in 2011 and 3¼ per cent in 2012. Consistent with below trend growth in 2010 and downward pressure on prices from large negative output gaps, G7 inflation is forecast to remain subdued.
3 Based on market exchange rates. It is already larger on a Purchasing Power Parity basis.
World economy forecast
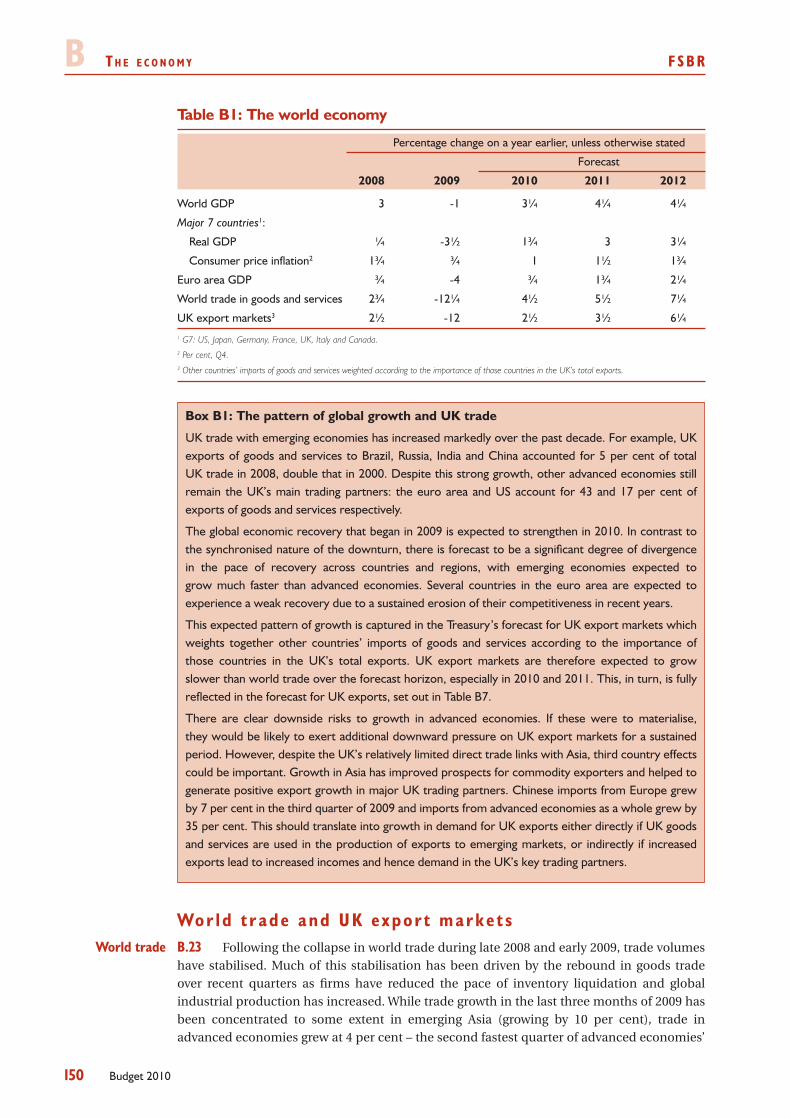
B T h e e c o n o m y FSBR
150 Budget 2010
Table B1: The world economy
Percentage change on a year earlier, unless otherwise stated
Forecast
2008 2009 2010 2011 2012
World GDP 3 -1 3¼ 4¼ 4¼
Major 7 countries1:
Real GDP ¼ -3½ 1¾ 3 3¼
Consumer price inflation2 1¾ ¾ 1 1½ 1¾
Euro area GDP ¾ -4 ¾ 1¾ 2¼
World trade in goods and services 2¾ -12¼ 4½ 5½ 7¼
UK export markets3 2½ -12 2½ 3½ 6¼1 G7: US, Japan, Germany, France, UK, Italy and Canada. 2 Per cent, Q4.3 Other countries’ imports of goods and services weighted according to the importance of those countries in the UK’s total exports.
Box B1: The pattern of global growth and UK trade
UK trade with emerging economies has increased markedly over the past decade. For example, UK exports of goods and services to Brazil, Russia, India and China accounted for 5 per cent of total UK trade in 2008, double that in 2000. Despite this strong growth, other advanced economies still remain the UK’s main trading partners: the euro area and US account for 43 and 17 per cent of exports of goods and services respectively.
The global economic recovery that began in 2009 is expected to strengthen in 2010. In contrast to the synchronised nature of the downturn, there is forecast to be a significant degree of divergence in the pace of recovery across countries and regions, with emerging economies expected to grow much faster than advanced economies. Several countries in the euro area are expected to experience a weak recovery due to a sustained erosion of their competitiveness in recent years.
This expected pattern of growth is captured in the Treasury’s forecast for UK export markets which weights together other countries’ imports of goods and services according to the importance of those countries in the UK’s total exports. UK export markets are therefore expected to grow slower than world trade over the forecast horizon, especially in 2010 and 2011. This, in turn, is fully reflected in the forecast for UK exports, set out in Table B7.
There are clear downside risks to growth in advanced economies. If these were to materialise, they would be likely to exert additional downward pressure on UK export markets for a sustained period. However, despite the UK’s relatively limited direct trade links with Asia, third country effects could be important. Growth in Asia has improved prospects for commodity exporters and helped to generate positive export growth in major UK trading partners. Chinese imports from Europe grew by 7 per cent in the third quarter of 2009 and imports from advanced economies as a whole grew by 35 per cent. This should translate into growth in demand for UK exports either directly if UK goods and services are used in the production of exports to emerging markets, or indirectly if increased exports lead to increased incomes and hence demand in the UK’s key trading partners.
Wor ld t rade and UK expor t marke t sB.23 Following the collapse in world trade during late 2008 and early 2009, trade volumes have stabilised. Much of this stabilisation has been driven by the rebound in goods trade over recent quarters as firms have reduced the pace of inventory liquidation and global industrial production has increased. While trade growth in the last three months of 2009 has been concentrated to some extent in emerging Asia (growing by 10 per cent), trade in advanced economies grew at 4 per cent – the second fastest quarter of advanced economies’
World trade
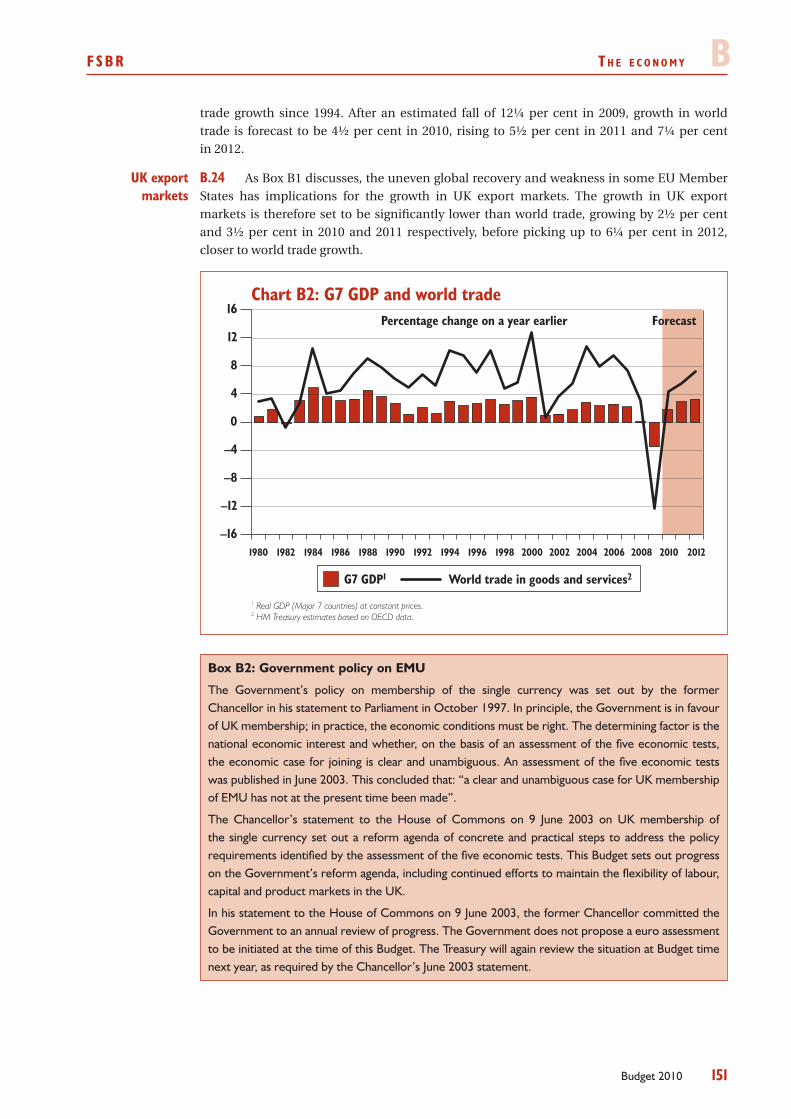
FSBR T h e e c o n o m y B
151Budget 2010
trade growth since 1994. After an estimated fall of 12¼ per cent in 2009, growth in world trade is forecast to be 4½ per cent in 2010, rising to 5½ per cent in 2011 and 7¼ per cent in 2012.
B.24 As Box B1 discusses, the uneven global recovery and weakness in some EU Member States has implications for the growth in UK export markets. The growth in UK export markets is therefore set to be significantly lower than world trade, growing by 2½ per cent and 3½ per cent in 2010 and 2011 respectively, before picking up to 6¼ per cent in 2012, closer to world trade growth.
1 Real GDP (Major 7 countries) at constant prices.2 HM Treasury estimates based on OECD data.
Chart B2: G7 GDP and world trade
–16
–12
–8
–4
0
4
8
12
16Percentage change on a year earlier Forecast
1980 20121982 1984 1986 1988 1990 1992 1994 1996 1998 2000 2002 2004 2006 2008 2010
G7 GDPI World trade in goods and services2
Box B2: Government policy on EMU
The Government’s policy on membership of the single currency was set out by the former Chancellor in his statement to Parliament in October 1997. In principle, the Government is in favour of UK membership; in practice, the economic conditions must be right. The determining factor is the national economic interest and whether, on the basis of an assessment of the five economic tests, the economic case for joining is clear and unambiguous. An assessment of the five economic tests was published in June 2003. This concluded that: “a clear and unambiguous case for UK membership of EMU has not at the present time been made”.
The Chancellor’s statement to the House of Commons on 9 June 2003 on UK membership of the single currency set out a reform agenda of concrete and practical steps to address the policy requirements identified by the assessment of the five economic tests. This Budget sets out progress on the Government’s reform agenda, including continued efforts to maintain the flexibility of labour, capital and product markets in the UK.
In his statement to the House of Commons on 9 June 2003, the former Chancellor committed the Government to an annual review of progress. The Government does not propose a euro assessment to be initiated at the time of this Budget. The Treasury will again review the situation at Budget time next year, as required by the Chancellor’s June 2003 statement.
UK export markets
B T h e e c o n o m y FSBR
152 Budget 2010
THE UK ECONOMY
Over v i ew o f r e cen t deve lopmentsB.25 The UK economy stabilised in the second half of 2009, following a substantial fall in output in the wake of the global financial crisis. The cumulative decline in output through the recession is estimated at around 6 per cent, similar to the loss in output seen in the 1980s recession, but greater than that in the early 1990s. Through 2009, the pace of decline eased as the substantial policy stimulus fed through into the economy, and global and domestic confidence picked up. In line with the Budget 2009 and 2009 Pre‑Budget Report forecasts, the UK economy returned to growth in the fourth quarter of the year. The Office for National Statistics (ONS) estimate GDP to have risen by 0.3 per cent, as government consumption continued to support the economy and household consumption rose. Nominal GDP rose by 1.9 per cent in the second half of 2009, although in the fourth quarter it remained 3 per cent below its pre‑recession peak in the second quarter of 2008. Nominal GDP did not fall in the 1980s and 1990s recessions.
Although bad weather has complicated the assessment, a range of measures suggest B.26 output continued to recover at the start of 2010. Consumer and business confidence measures have improved, and labour market indicators have started to stabilise at a relatively early stage in the recovery. The latest estimate from the National Institute of Economic and Social Research (NIESR) suggests output rose by 0.3 per cent over the three months to February4.
B.27 Consumer price inflation has increased from its trough of 1.1 per cent in September 2009, as expected in the 2009 Pre‑Budget Report forecast. CPI inflation peaked at 3.5 per cent in January 2010, falling to 3.0 per cent in February. An increase in CPI inflation due to the reversal of the pre‑announced VAT rate cut in January 2010 was expected. Fuel prices have also added to inflation. While the overall rate of inflation has risen significantly over recent months, this masks a divergence in the path of services and goods price inflation largely reflecting the downward effect of domestic disinflationary pressure on services prices and the upward effect of sterling’s depreciation on goods prices. This is discussed further in Box B3.
RPI inflation has also increased markedly since the 2009 Pre‑Budget Report, turning B.28 positive in November 2009, and exceeding CPI inflation in January 2010 for the first time since April 2008. The increase in RPI inflation reflects the same factors influencing CPI inflation, but the RPI has also been boosted by house price increases in 2009 and the large cuts in mortgage rates falling out of the annual comparison.
B.29 Credit conditions have continued to improve since the 2009 Pre‑Budget Report, although as in other advanced economies, they remain tight compared to pre‑recession levels. The spread of interbank lending rates over market expectations of policy rates has fallen substantially from its high of more than 200 basis points in October 2008 to an average of 18 basis points since February 2010.
The lower level of Bank Rate has helped to reduce the absolute cost of lending faced B.30 by households and companies. For example, the Bank of England’s measure of the effective rate on new corporate loans has fallen from its peak of 7½ per cent in 2007 to around 2 per cent in January this year. However, as discussed at the 2009 Pre‑Budget Report the spreads over Bank Rate and LIBOR for new secured lending to households and credit to small and medium‑sized companies widened during the financial crisis, as credit and liquidity risks
4 www.niesr.ac.uk/gdp/GDPestimates.thp
GDP growth
Inflation
Credit conditions
FSBR T h e e c o n o m y B
153Budget 2010
rose and risk was re‑priced. In recent months, spreads have shown signs of stabilisation, but they remain at elevated levels.
Lending to households and companies was subdued in 2009, but weak credit growth B.31 is not uncommon in downturns. In recent months, lending has shown signs of stabilisation. In the final quarter of 2009, the flow of net secured lending to households increased by nearly £4 billion, the highest quarterly increase since the third quarter of 2008, and net sterling lending flows to Private Non‑Financial Corporations (PNFCs) rose by nearly £2 billion, following large falls earlier in the year. For PNFCs, these falls were largely offset by net capital issuance, as conditions in capital markets improved. In particular, yields on corporate bonds, rated lower than AA, have fallen substantially since early 2009. See Box B6 for further discussion on developments in the structure of corporate finance.
The latest Bank of England’s B.32 Credit Conditions Survey reports that the availability of both secured credit to households and credit companies increased in the final quarter of 2009. The Bank’s Trends in Lending Report in March suggests that the availability of credit to firms and households has continued to improve, possibly reflecting an improvement in lenders’ expectations of mortgage and corporate distress: the Report noted that mortgage arrears and write‑off rates on corporate loans were lower than expected by lenders and write‑off rates on corporate loans and mortgages have risen by less than in the 1990s recession.
B.33 In spite of the steep decline in employment seen in the first half of 2009, the labour market has been more resilient than many expected. The rate of unemployment has stabilised and is below that seen at the end of previous recessions. Since the 2009 Pre‑Budget Report, employment has continued to decline but at a much lower rate, redundancies have fallen back sharply and vacancies have picked up slightly. Unemployment has fallen and in February the claimant count saw its largest decline since the end of 1997, bringing the claimant count back to its lowest level since July 2009. Average earnings growth has continued to slow over the past year, reflecting firms’ response to weak demand.
THE ECONOMY FORECA ST
Economic forecasting inevitably involves judgement about both the uncertain B.34 path of future events and the current position of the economy. While the severe short‑term downside risks have receded since Budget 2009, the nature and scale of the global recession means that forecasts remain subject to more than normal degrees of uncertainty.
B.35 The Treasury’s approach to forecasting macroeconomic developments, set out in detail in Budget 20075, accords with the growth cycle approach favoured by many policymakers. The essential building blocks of this approach are estimates of the ‘trend’ level and rate of growth of output, and analysis of cyclical movements around that trend, the ‘output gap’6. The trend output projection provides the medium‑term anchor for the forecast. The current mechanical output gap estimate, and an assessment of the economy’s momentum based on analysis of individual output, income and expenditure components of activity, informs the judgement on the path of the economy back towards trend. At a time when large shocks have hit the economy and are likely to have reduced the level of trend, or potential, output these estimates and analyses are particularly challenging. For Budget 2010, the Treasury has maintained its usual forecast ranges, which represent alternative assumptions about the supply‑side performance of the economy, not forecast uncertainties.
5 See paragraph B.30 to B.35 of Budget 2007.6 The Treasury assesses trend output growth on the basis of non-oil gross value added (GVA) rather than overall GDP because, while the oil and gas sector affects output, it has little direct impact on capacity pressures in the rest of the economy, and hence the sustainable level of non-oil economic activity and employment.
Labour market
Growth cycle approach
B T h e e c o n o m y FSBR
154 Budget 2010
Asses sment o f t r end g rowthThe global financial crisis has substantially increased the uncertainties surrounding B.36
the outlook for trend output. In principle, there are a number of different ways in which the shock could affect the path of trend output, largely related to the impact on the price and supply of credit. A change in the relative size of the financial sector may also impact on trend output in the event that its contribution to total productivity falls. This is discussed in more detail in Box B4.
In addition, lower net migration would tend to imply a weaker outlook for the trend B.37 population component of trend output. Recent International Passenger Survey (IPS) data continue to point to more subdued levels of net inflows, with provisional estimates of long‑term net migration falling to 147,000 in the year to June 2009 from 168,000 in the year to June 2008. Administrative data provide further support for a slowdown in net migration, with applications from A8 nationals to the Worker Registration Scheme (WRS) falling by a third between 2008 and 2009 while National Insurance numbers allocated to non‑UK nationals fell back in the third quarter of 2009 compared to a year earlier.
B.38 Table B2 sets out the Budget 2010 assumptions for trend output. The Budget 2010 forecast assumes a reduction to the level of trend output of just over 5 per cent between mid‑2007 and mid‑2010, reflecting a downward adjustment to the trend productivity component of around 4¾ per cent and a downward adjustment to the trend population component of around ½ per cent. This adjustment means that trend output grows by just under 1 per cent a year between 2007Q3 and 2010Q3. Beyond mid‑2010, trend output growth is assumed to return to 2¾ per cent, in line with the rate observed over the second half of the most recently completed economic cycle. The downward adjustment to trend output of just over 5 per cent remains well within the range of external estimates. This judgement continues to remain subject to significant uncertainty and it will be kept under review.
Budget 2010 assumptions
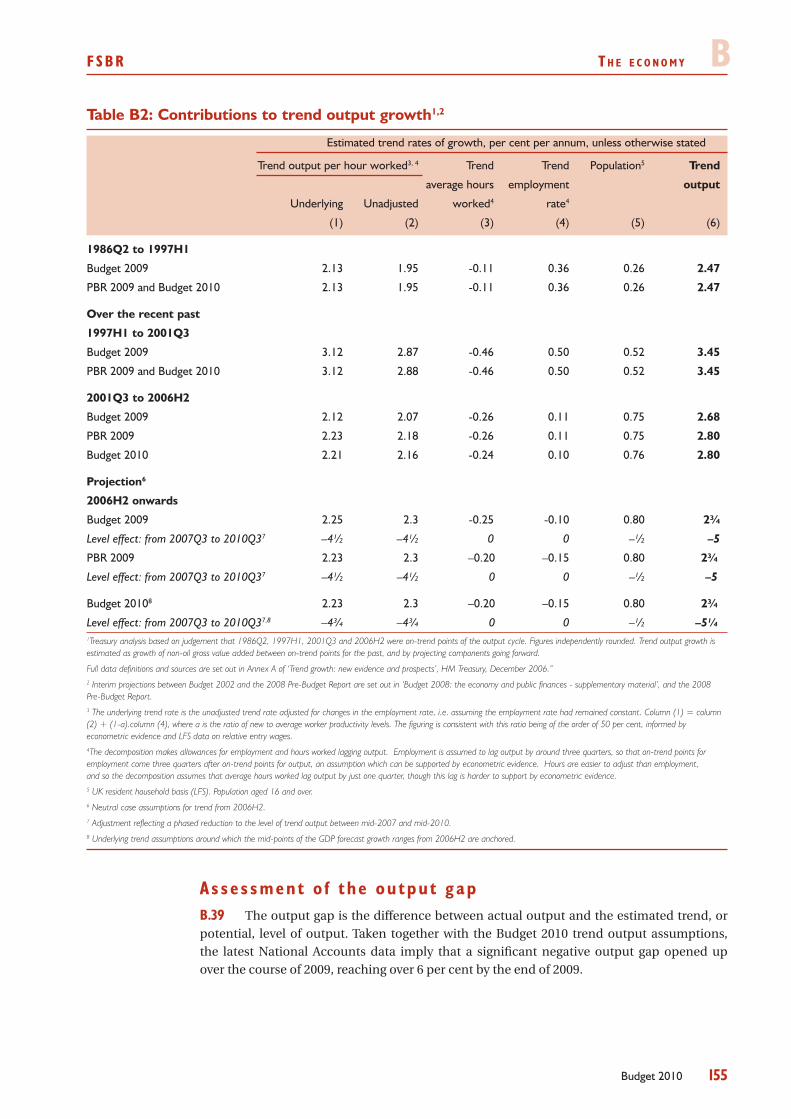
FSBR T h e e c o n o m y B
155Budget 2010
Table B2: Contributions to trend output growth1,2
Estimated trend rates of growth, per cent per annum, unless otherwise stated
Trend output per hour worked3, 4 Trend Trend Population5 Trend
average hours employment output
Underlying Unadjusted worked4 rate4
(1) (2) (3) (4) (5) (6)
1986Q2 to 1997H1
Budget 2009 2.13 1.95 -0.11 0.36 0.26 2.47
PBR 2009 and Budget 2010 2.13 1.95 -0.11 0.36 0.26 2.47
Over the recent past
1997H1 to 2001Q3
Budget 2009 3.12 2.87 -0.46 0.50 0.52 3.45
PBR 2009 and Budget 2010 3.12 2.88 -0.46 0.50 0.52 3.45
2001Q3 to 2006H2
Budget 2009 2.12 2.07 -0.26 0.11 0.75 2.68
PBR 2009 2.23 2.18 -0.26 0.11 0.75 2.80
Budget 2010 2.21 2.16 -0.24 0.10 0.76 2.80
Projection6
2006H2 onwards
Budget 2009 2.25 2.3 -0.25 -0.10 0.80 2¾
Level effect: from 2007Q3 to 2010Q37 –4½ –4½ 0 0 –½ –5
PBR 2009 2.23 2.3 –0.20 –0.15 0.80 2¾
Level effect: from 2007Q3 to 2010Q37 –4½ –4½ 0 0 –½ –5
Budget 20108 2.23 2.3 –0.20 –0.15 0.80 2¾
Level effect: from 2007Q3 to 2010Q37,8 –4¾ –4¾ 0 0 –½ –5¼1Treasury analysis based on judgement that 1986Q2, 1997H1, 2001Q3 and 2006H2 were on-trend points of the output cycle. Figures independently rounded. Trend output growth is estimated as growth of non-oil gross value added between on-trend points for the past, and by projecting components going forward.
Full data definitions and sources are set out in Annex A of ‘Trend growth: new evidence and prospects’, HM Treasury, December 2006.”2 Interim projections between Budget 2002 and the 2008 Pre-Budget Report are set out in ‘Budget 2008: the economy and public finances - supplementary material’, and the 2008 Pre-Budget Report. 3 The underlying trend rate is the unadjusted trend rate adjusted for changes in the employment rate, i.e. assuming the employment rate had remained constant. Column (1) = column (2) + (1-a).column (4), where a is the ratio of new to average worker productivity levels. The figuring is consistent with this ratio being of the order of 50 per cent, informed by econometric evidence and LFS data on relative entry wages.4The decomposition makes allowances for employment and hours worked lagging output. Employment is assumed to lag output by around three quarters, so that on-trend points for employment come three quarters after on-trend points for output, an assumption which can be supported by econometric evidence. Hours are easier to adjust than employment, and so the decomposition assumes that average hours worked lag output by just one quarter, though this lag is harder to support by econometric evidence. 5 UK resident household basis (LFS). Population aged 16 and over. 6 Neutral case assumptions for trend from 2006H2. 7 Adjustment reflecting a phased reduction to the level of trend output between mid-2007 and mid-2010.8 Underlying trend assumptions around which the mid-points of the GDP forecast growth ranges from 2006H2 are anchored.
Asses sment o f the ou tput gapThe output gap is the difference between actual output and the estimated trend, or B.39
potential, level of output. Taken together with the Budget 2010 trend output assumptions, the latest National Accounts data imply that a significant negative output gap opened up over the course of 2009, reaching over 6 per cent by the end of 2009.
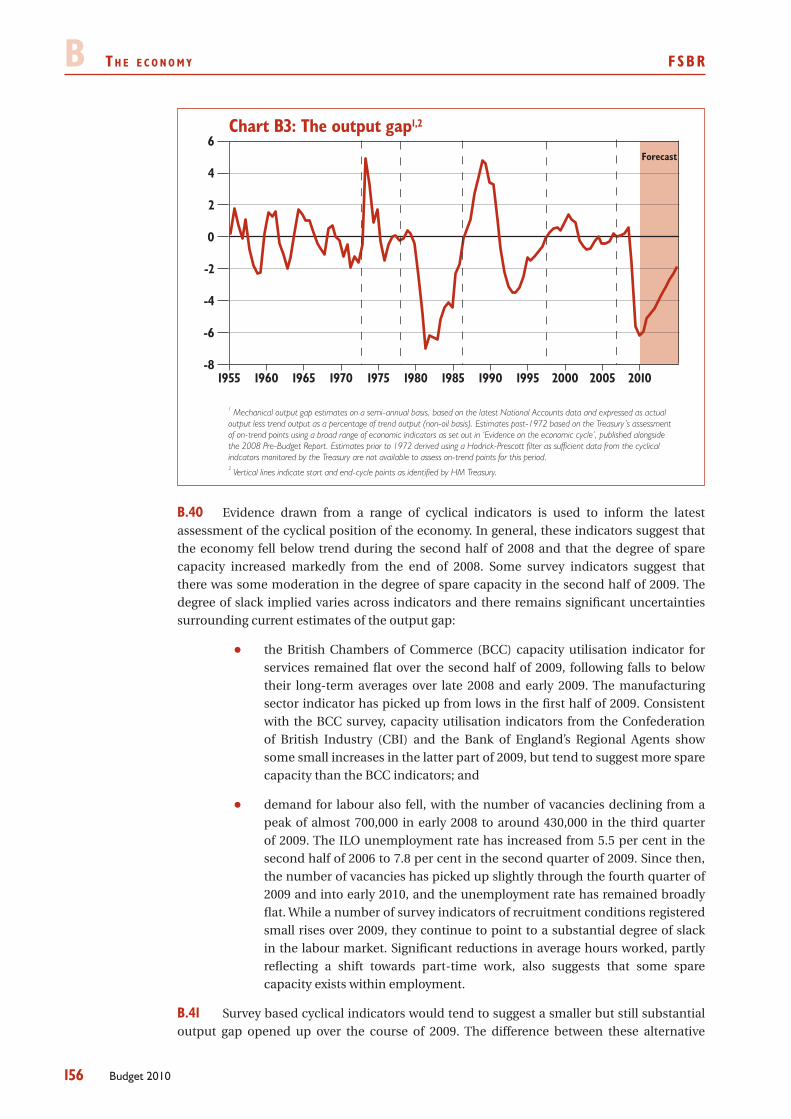
B T h e e c o n o m y FSBR
156 Budget 2010
Chart B3: The output gap1,2
-8
-6
-4
-2
0
2
4
6Forecast
1 Mechanical output gap estimates on a semi-annual basis, based on the latest National Accounts data and expressed as actual output less trend output as a percentage of trend output (non-oil basis). Estimates post-1972 based on the Treasury’s assessmentof on-trend points using a broad range of economic indicators as set out in ‘Evidence on the economic cycle’, published alongsidethe 2008 Pre-Budget Report. Estimates prior to 1972 derived using a Hodrick-Prescott filter as sufficient data from the cyclical indcators monitored by the Treasury are not available to assess on-trend points for this period. 2 Vertical lines indicate start and end-cycle points as identified by HM Treasury.
1955 1960 1965 1970 1975 1980 1985 1990 1995 2000 2005 2010
Evidence drawn from a range of cyclical indicators is used to inform the latest B.40 assessment of the cyclical position of the economy. In general, these indicators suggest that the economy fell below trend during the second half of 2008 and that the degree of spare capacity increased markedly from the end of 2008. Some survey indicators suggest that there was some moderation in the degree of spare capacity in the second half of 2009. The degree of slack implied varies across indicators and there remains significant uncertainties surrounding current estimates of the output gap:
the British Chambers of Commerce (BCC) capacity utilisation indicator for •services remained flat over the second half of 2009, following falls to below their long‑term averages over late 2008 and early 2009. The manufacturing sector indicator has picked up from lows in the first half of 2009. Consistent with the BCC survey, capacity utilisation indicators from the Confederation of British Industry (CBI) and the Bank of England’s Regional Agents show some small increases in the latter part of 2009, but tend to suggest more spare capacity than the BCC indicators; and
demand for labour also fell, with the number of vacancies declining from a •peak of almost 700,000 in early 2008 to around 430,000 in the third quarter of 2009. The ILO unemployment rate has increased from 5.5 per cent in the second half of 2006 to 7.8 per cent in the second quarter of 2009. Since then, the number of vacancies has picked up slightly through the fourth quarter of 2009 and into early 2010, and the unemployment rate has remained broadly flat. While a number of survey indicators of recruitment conditions registered small rises over 2009, they continue to point to a substantial degree of slack in the labour market. Significant reductions in average hours worked, partly reflecting a shift towards part‑time work, also suggests that some spare capacity exists within employment.
Survey based cyclical indicators would tend to suggest a smaller but still substantial B.41 output gap opened up over the course of 2009. The difference between these alternative
FSBR T h e e c o n o m y B
157Budget 2010
approaches and the Treasury’s mechanical estimates of the output gap could reflect a number of factors:
the size and timing of the overall impact of the financial crisis on trend output •is very uncertain (the risks section at the end of the chapter provides a further discussion);
the degree to which the survey indicators of the cyclical position of the •economy are affected by shorter‑term supply constraints, including, for example, temporary constraints on working capital that might be expected to dissipate as the economy recovers; and
there may be potential measurement issues associated with both the survey •indicators and official data. In particular, survey indicators typically capture the number of firms operating below capacity, but may not necessarily capture the depth of the fall in resource utilisation within individual firms during a downturn. Any revisions to National Accounts data would change the size of mechanical output gap estimates.
GDP and in f l a t i on f o recas t sB.42 The Budget 2010 economic forecast is underpinned by the following assumptions:
the G20 continues to deliver on policy commitments which are effective, and •support a robust recovery in the world economy. UK export market growth is notably weaker than world trade, especially in 2010 and 2011, reflecting the relatively slower recovery in the UK’s largest trading partner, the euro area;
fiscal policy supports the level of economic activity through 2010, before •tightening from 2011 onwards to ensure sound public finances and facilitate the rebalancing of private and public sector contributions to demand;
through the course of 2010 the price of credit continues to return closer •to historical norms, adjusted for a general repricing of risk, and credit availability continues to improve;
the positive impact of the monetary policy stimulus will continue to support •demand in the economy throughout the forecast horizon, with market expectations suggesting Bank Rate will remain historically low; and
the shape of the recovery in the UK economy reflects an orderly adjustment •in the sectoral financial balances, and a rebalancing between domestic and external demand supported by sterling’s depreciation.
B.43 Given the impact of the global financial market shock and the scale of the global macroeconomic and financial policy response, these judgements and assumptions are subject to great uncertainty, as discussed in Box B7. To represent the uncertainty in the Treasury’s economic forecasts, the average absolute forecast errors from past forecasts are presented alongside the latest forecasts, as in Table B9. The average absolute error for year‑ahead forecasts has risen significantly since Budget 2009, reflecting the substantially larger fall in output in 2009 than was forecast in Budget 2008, and it is now similar in magnitude to the average absolute forecast error following the 1990s recession. Key uncertainties around the central forecast are discussed further in the text on economic developments and prospects and in the section on forecast risks, at the end of the chapter.
Forecasting judgement
Uncertainty in the forecast
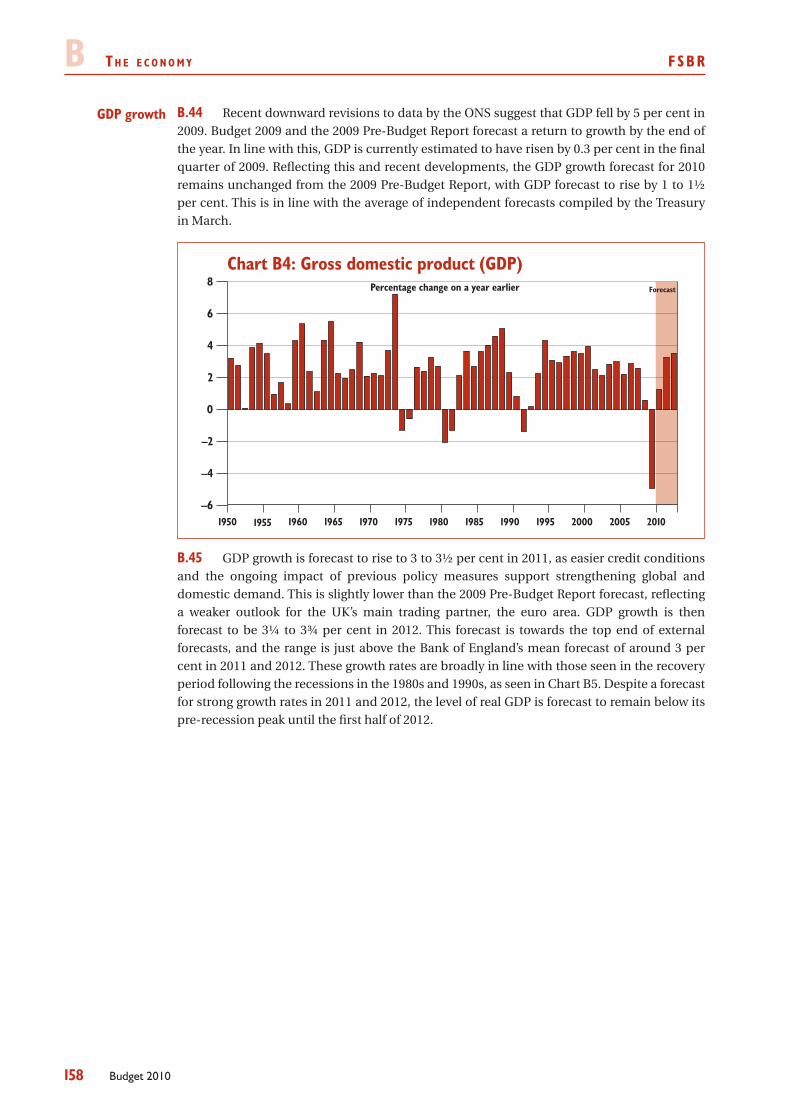
B T h e e c o n o m y FSBR
158 Budget 2010
B.44 Recent downward revisions to data by the ONS suggest that GDP fell by 5 per cent in 2009. Budget 2009 and the 2009 Pre‑Budget Report forecast a return to growth by the end of the year. In line with this, GDP is currently estimated to have risen by 0.3 per cent in the final quarter of 2009. Reflecting this and recent developments, the GDP growth forecast for 2010 remains unchanged from the 2009 Pre‑Budget Report, with GDP forecast to rise by 1 to 1½ per cent. This is in line with the average of independent forecasts compiled by the Treasury in March.
Chart B4: Gross domestic product (GDP)
–6
–4
–2
0
2
4
6
8 Percentage change on a year earlier Forecast
1950 20101955 1960 1965 1970 1975 1980 1985 1990 1995 2000 2005
GDP growth is forecast to rise to 3 to 3½ per cent in 2011, as easier credit conditions B.45 and the ongoing impact of previous policy measures support strengthening global and domestic demand. This is slightly lower than the 2009 Pre‑Budget Report forecast, reflecting a weaker outlook for the UK’s main trading partner, the euro area. GDP growth is then forecast to be 3¼ to 3¾ per cent in 2012. This forecast is towards the top end of external forecasts, and the range is just above the Bank of England’s mean forecast of around 3 per cent in 2011 and 2012. These growth rates are broadly in line with those seen in the recovery period following the recessions in the 1980s and 1990s, as seen in Chart B5. Despite a forecast for strong growth rates in 2011 and 2012, the level of real GDP is forecast to remain below its pre‑recession peak until the first half of 2012.
GDP growth
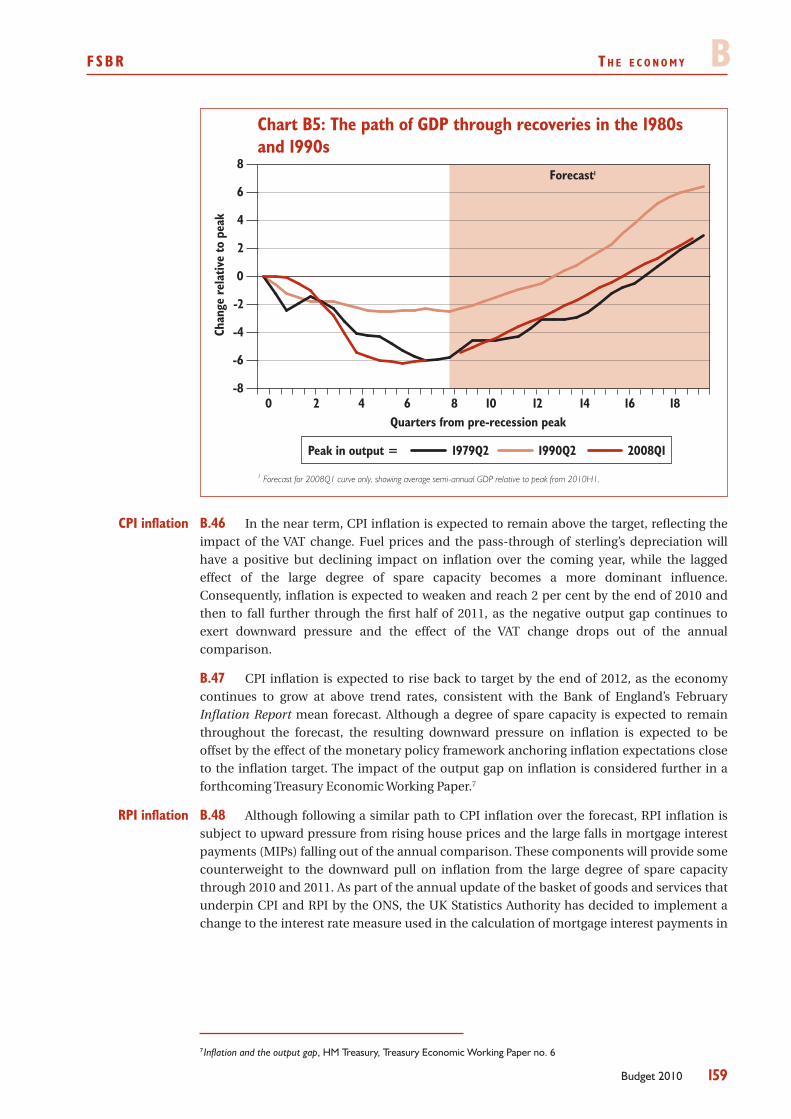
FSBR T h e e c o n o m y B
159Budget 2010
1 Forecast for 2008Q1 curve only, showing average semi-annual GDP relative to peak from 2010H1.
Chart B5: The path of GDP through recoveries in the 1980s and 1990s
-8
-6
-4
-2
0
2
4
6
8
Quarters from pre-recession peak0 2 4 6 8 10 12 14 16 18
1979Q2Peak in output = 2008Q11990Q2
Chan
ge r
elat
ive
to p
eak
Forecast1
B.46 In the near term, CPI inflation is expected to remain above the target, reflecting the impact of the VAT change. Fuel prices and the pass‑through of sterling’s depreciation will have a positive but declining impact on inflation over the coming year, while the lagged effect of the large degree of spare capacity becomes a more dominant influence. Consequently, inflation is expected to weaken and reach 2 per cent by the end of 2010 and then to fall further through the first half of 2011, as the negative output gap continues to exert downward pressure and the effect of the VAT change drops out of the annual comparison.
CPI inflation is expected to rise back to target by the end of 2012, as the economy B.47 continues to grow at above trend rates, consistent with the Bank of England’s February Inflation Report mean forecast. Although a degree of spare capacity is expected to remain throughout the forecast, the resulting downward pressure on inflation is expected to be offset by the effect of the monetary policy framework anchoring inflation expectations close to the inflation target. The impact of the output gap on inflation is considered further in a forthcoming Treasury Economic Working Paper.7
B.48 Although following a similar path to CPI inflation over the forecast, RPI inflation is subject to upward pressure from rising house prices and the large falls in mortgage interest payments (MIPs) falling out of the annual comparison. These components will provide some counterweight to the downward pull on inflation from the large degree of spare capacity through 2010 and 2011. As part of the annual update of the basket of goods and services that underpin CPI and RPI by the ONS, the UK Statistics Authority has decided to implement a change to the interest rate measure used in the calculation of mortgage interest payments in
7 Inflation and the output gap, HM Treasury, Treasury Economic Working Paper no. 6
CPI inflation
RPI inflation
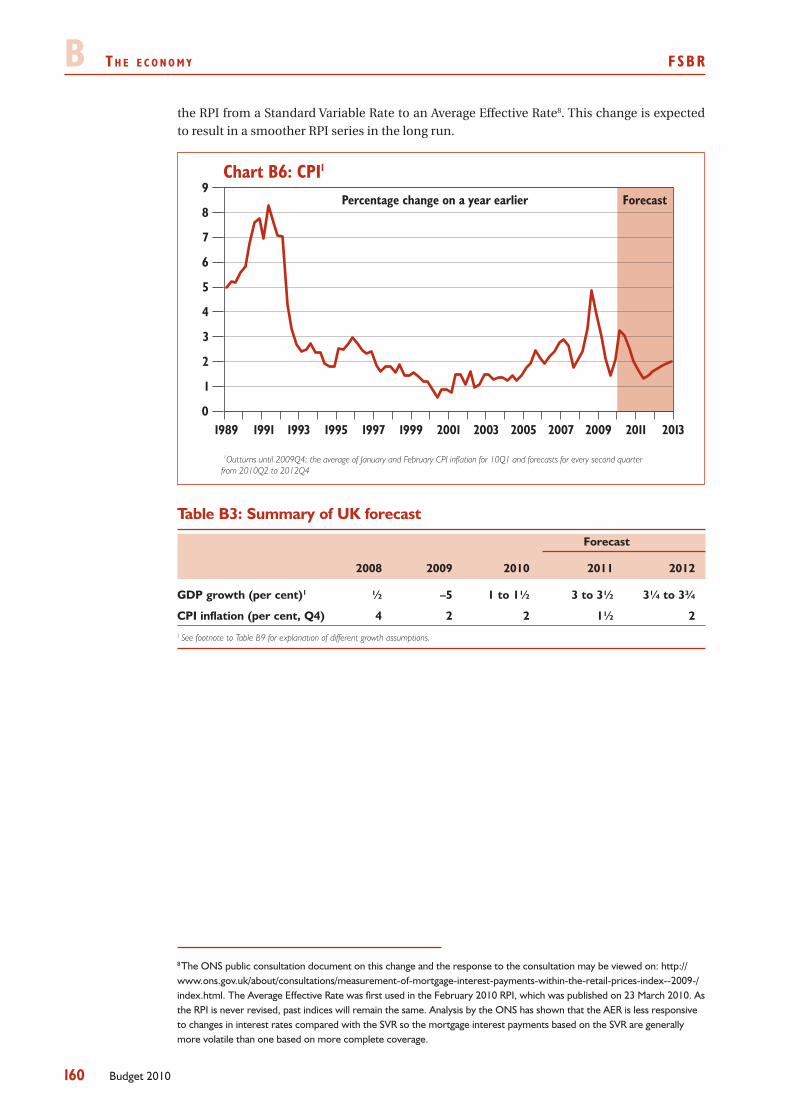
B T h e e c o n o m y FSBR
160 Budget 2010
the RPI from a Standard Variable Rate to an Average Effective Rate8. This change is expected to result in a smoother RPI series in the long run.
1Outturns until 2009Q4; the average of January and February CPI inflation for 10Q1 and forecasts for every second quarter from 2010Q2 to 2012Q4
Chart B6: CPI1
0
1
2
3
4
5
6
7
8
9
2011 201320092007200520032001199919971995199319911989
Percentage change on a year earlier Forecast
Table B3: Summary of UK forecast
Forecast
2008 2009 2010 2011 2012
GDP growth (per cent)1 ½ –5 1 to 1½ 3 to 3½ 3¼ to 3¾
CPI inflation (per cent, Q4) 4 2 2 1½ 21 See footnote to Table B9 for explanation of different growth assumptions.
8 The ONS public consultation document on this change and the response to the consultation may be viewed on: http://www.ons.gov.uk/about/consultations/measurement-of-mortgage-interest-payments-within-the-retail-prices-index--2009-/index.html. The Average Effective Rate was first used in the February 2010 RPI, which was published on 23 March 2010. As the RPI is never revised, past indices will remain the same. Analysis by the ONS has shown that the AER is less responsive to changes in interest rates compared with the SVR so the mortgage interest payments based on the SVR are generally more volatile than one based on more complete coverage.
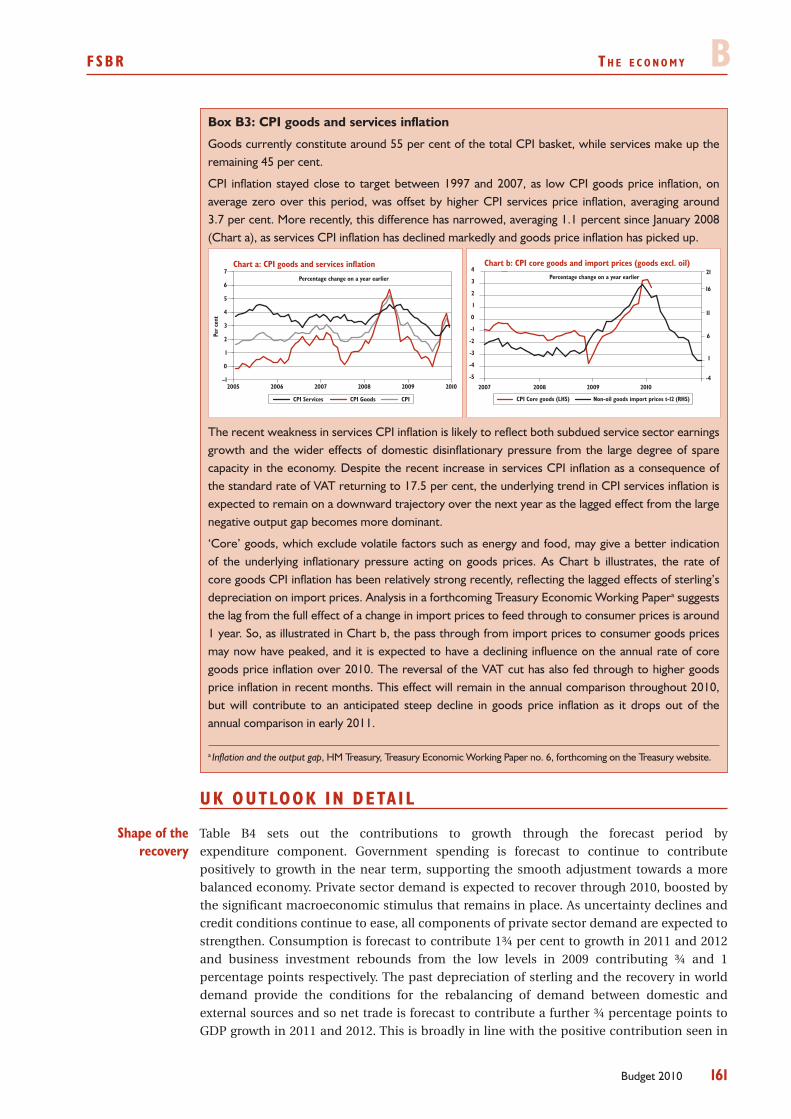
FSBR T h e e c o n o m y B
161Budget 2010
Box B3: CPI goods and services inflation
Goods currently constitute around 55 per cent of the total CPI basket, while services make up the remaining 45 per cent.
CPI inflation stayed close to target between 1997 and 2007, as low CPI goods price inflation, on average zero over this period, was offset by higher CPI services price inflation, averaging around 3.7 per cent. More recently, this difference has narrowed, averaging 1.1 percent since January 2008 (Chart a), as services CPI inflation has declined markedly and goods price inflation has picked up.
Chart a: CPI goods and services inflation
–1
0
1
2
3
4
5
6
7
2005 2006 2007 2008 2009 2010
CPI Services CPI Goods CPI
Per
cent
Percentage change on a year earlier
Chart b: CPI core goods and import prices (goods excl. oil)
-5
-4
-3
-2
-1
0
1
2
3
4
-4
1
6
11
16
21
CPI Core goods (LHS) Non-oil goods import prices t-12 (RHS)
2007 2008 2009 2010
Percentage change on a year earlier
The recent weakness in services CPI inflation is likely to reflect both subdued service sector earnings growth and the wider effects of domestic disinflationary pressure from the large degree of spare capacity in the economy. Despite the recent increase in services CPI inflation as a consequence of the standard rate of VAT returning to 17.5 per cent, the underlying trend in CPI services inflation is expected to remain on a downward trajectory over the next year as the lagged effect from the large negative output gap becomes more dominant.
‘Core’ goods, which exclude volatile factors such as energy and food, may give a better indication of the underlying inflationary pressure acting on goods prices. As Chart b illustrates, the rate of core goods CPI inflation has been relatively strong recently, reflecting the lagged effects of sterling’s depreciation on import prices. Analysis in a forthcoming Treasury Economic Working Papera suggests the lag from the full effect of a change in import prices to feed through to consumer prices is around 1 year. So, as illustrated in Chart b, the pass through from import prices to consumer goods prices may now have peaked, and it is expected to have a declining influence on the annual rate of core goods price inflation over 2010. The reversal of the VAT cut has also fed through to higher goods price inflation in recent months. This effect will remain in the annual comparison throughout 2010, but will contribute to an anticipated steep decline in goods price inflation as it drops out of the annual comparison in early 2011.
a Inflation and the output gap, HM Treasury, Treasury Economic Working Paper no. 6, forthcoming on the Treasury website.
UK OUTLOOK IN DETA IL
Table B4 sets out the contributions to growth through the forecast period by expenditure component. Government spending is forecast to continue to contribute positively to growth in the near term, supporting the smooth adjustment towards a more balanced economy. Private sector demand is expected to recover through 2010, boosted by the significant macroeconomic stimulus that remains in place. As uncertainty declines and credit conditions continue to ease, all components of private sector demand are expected to strengthen. Consumption is forecast to contribute 1¾ per cent to growth in 2011 and 2012 and business investment rebounds from the low levels in 2009 contributing ¾ and 1 percentage points respectively. The past depreciation of sterling and the recovery in world demand provide the conditions for the rebalancing of demand between domestic and external sources and so net trade is forecast to contribute a further ¾ percentage points to GDP growth in 2011 and 2012. This is broadly in line with the positive contribution seen in
Shape of the recovery
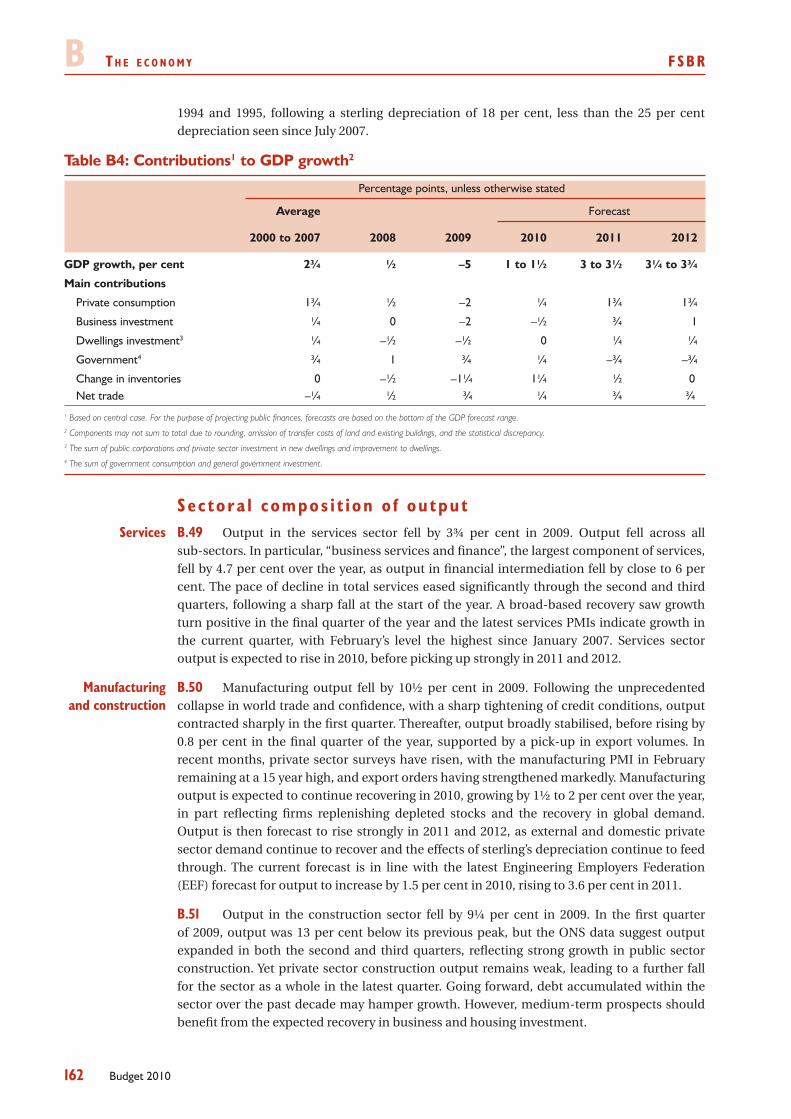
B T h e e c o n o m y FSBR
162 Budget 2010
1994 and 1995, following a sterling depreciation of 18 per cent, less than the 25 per cent depreciation seen since July 2007.
Table B4: Contributions1 to GDP growth2
Percentage points, unless otherwise stated
Average Forecast
2000 to 2007 2008 2009 2010 2011 2012
GDP growth, per cent 2¾ ½ –5 1 to 1½ 3 to 3½ 3¼ to 3¾
Main contributions
Private consumption 1¾ ½ –2 ¼ 1¾ 1¾
Business investment ¼ 0 –2 –½ ¾ 1
Dwellings investment3 ¼ –½ –½ 0 ¼ ¼
Government4 ¾ 1 ¾ ¼ –¾ –¾
Change in inventories 0 –½ –1¼ 1¼ ½ 0 Net trade –¼ ½ ¾ ¼ ¾ ¾1 Based on central case. For the purpose of projecting public finances, forecasts are based on the bottom of the GDP forecast range.2 Components may not sum to total due to rounding, omission of transfer costs of land and existing buildings, and the statistical discrepancy.3 The sum of public corporations and private sector investment in new dwellings and improvement to dwellings.4 The sum of government consumption and general government investment.
Sec tora l compos i t i on o f ou tputB.49 Output in the services sector fell by 3¾ per cent in 2009. Output fell across all sub‑sectors. In particular, “business services and finance”, the largest component of services, fell by 4.7 per cent over the year, as output in financial intermediation fell by close to 6 per cent. The pace of decline in total services eased significantly through the second and third quarters, following a sharp fall at the start of the year. A broad‑based recovery saw growth turn positive in the final quarter of the year and the latest services PMIs indicate growth in the current quarter, with February’s level the highest since January 2007. Services sector output is expected to rise in 2010, before picking up strongly in 2011 and 2012.
B.50 Manufacturing output fell by 10½ per cent in 2009. Following the unprecedented collapse in world trade and confidence, with a sharp tightening of credit conditions, output contracted sharply in the first quarter. Thereafter, output broadly stabilised, before rising by 0.8 per cent in the final quarter of the year, supported by a pick‑up in export volumes. In recent months, private sector surveys have risen, with the manufacturing PMI in February remaining at a 15 year high, and export orders having strengthened markedly. Manufacturing output is expected to continue recovering in 2010, growing by 1½ to 2 per cent over the year, in part reflecting firms replenishing depleted stocks and the recovery in global demand. Output is then forecast to rise strongly in 2011 and 2012, as external and domestic private sector demand continue to recover and the effects of sterling’s depreciation continue to feed through. The current forecast is in line with the latest Engineering Employers Federation (EEF) forecast for output to increase by 1.5 per cent in 2010, rising to 3.6 per cent in 2011.
Output in the construction sector fell by 9¼ per cent in 2009. In the first quarter B.51 of 2009, output was 13 per cent below its previous peak, but the ONS data suggest output expanded in both the second and third quarters, reflecting strong growth in public sector construction. Yet private sector construction output remains weak, leading to a further fall for the sector as a whole in the latest quarter. Going forward, debt accumulated within the sector over the past decade may hamper growth. However, medium‑term prospects should benefit from the expected recovery in business and housing investment.
Services
Manufacturing and construction
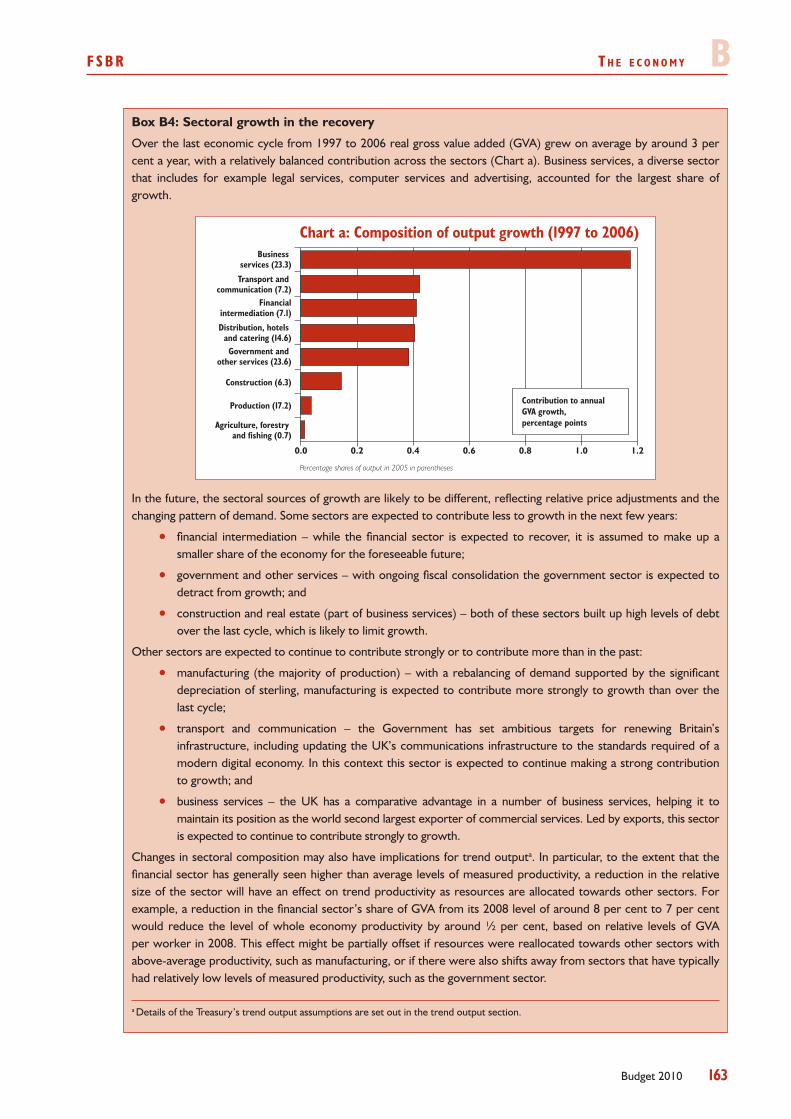
FSBR T h e e c o n o m y B
163Budget 2010
Box B4: Sectoral growth in the recovery
Over the last economic cycle from 1997 to 2006 real gross value added (GVA) grew on average by around 3 per cent a year, with a relatively balanced contribution across the sectors (Chart a). Business services, a diverse sector that includes for example legal services, computer services and advertising, accounted for the largest share of growth.
Percentage shares of output in 2005 in parentheses
Chart a: Composition of output growth (1997 to 2006)
0.0 0.2 0.4 0.6 0.8 1.0 1.2
Contribution to annualGVA growth,percentage points
Business services (23.3)
Production (17.2)
Construction (6.3)
Government and other services (23.6)
Distribution, hotels and catering (14.6)
Financialintermediation (7.1)
Transport and communication (7.2)
Agriculture, forestry and fishing (0.7)
In the future, the sectoral sources of growth are likely to be different, reflecting relative price adjustments and the changing pattern of demand. Some sectors are expected to contribute less to growth in the next few years:
financial intermediation – while the financial sector is expected to recover, it is assumed to make up a •smaller share of the economy for the foreseeable future;
government and other services – with ongoing fiscal consolidation the government sector is expected to •detract from growth; and
construction and real estate (part of business services) – both of these sectors built up high levels of debt •over the last cycle, which is likely to limit growth.
Other sectors are expected to continue to contribute strongly or to contribute more than in the past:
manufacturing (the majority of production) – with a rebalancing of demand supported by the significant •depreciation of sterling, manufacturing is expected to contribute more strongly to growth than over the last cycle;
transport and communication – the Government has set ambitious targets for renewing Britain’s •infrastructure, including updating the UK’s communications infrastructure to the standards required of a modern digital economy. In this context this sector is expected to continue making a strong contribution to growth; and
business services – the UK has a comparative advantage in a number of business services, helping it to •maintain its position as the world second largest exporter of commercial services. Led by exports, this sector is expected to continue to contribute strongly to growth.
Changes in sectoral composition may also have implications for trend outputa. In particular, to the extent that the financial sector has generally seen higher than average levels of measured productivity, a reduction in the relative size of the sector will have an effect on trend productivity as resources are allocated towards other sectors. For example, a reduction in the financial sector’s share of GVA from its 2008 level of around 8 per cent to 7 per cent would reduce the level of whole economy productivity by around ½ per cent, based on relative levels of GVA per worker in 2008. This effect might be partially offset if resources were reallocated towards other sectors with above-average productivity, such as manufacturing, or if there were also shifts away from sectors that have typically had relatively low levels of measured productivity, such as the government sector.
a Details of the Treasury’s trend output assumptions are set out in the trend output section.
B T h e e c o n o m y FSBR
164 Budget 2010
Labour marke tIn spite of the steep decline in employment seen in the first half of 2009, the B.52
labour market has been more resilient than most forecasters had expected. The rate of unemployment is below that seen at the end of the previous recessions and a number of indicators started to show signs of recovery as early as the middle of 2009. Flexibility has been a key driver of the resilience in the labour market. While the relative cost of labour rose in the 1990s recession, real hourly labour costs – the nominal cost of labour relative to companies’ prices – has remained broadly flat in the recession, as workers and firms have agreed on lower settlements or pay freezes to maintain employment. Sizeable gross labour market flows, a characteristic of the UK labour market, have largely remained: over the last six months more than 2 million people have moved off the claimant count, aided by Jobcentre Plus.
B.53 Conditions in the labour market have been fairly stable since autumn 2009. While employment has continued to decline, firms are not laying off full‑time employees at the same pace as over the first three quarters of 2009. Having risen to more than 300,000 per quarter through the first half of 2009, redundancies have fallen back sharply. The number of vacancies has picked up slightly in the last few months, primarily driven by stronger private sector demand. This is in line with a number of private business surveys of employment intentions that are consistent with moderate rates of employment growth in early 2010.
ILO unemployment fell by 33,000 in the three months to January 2010 and the B.54 unemployment rate has now remained broadly constant at just below 8 per cent since the middle of 2009. The number of people claiming Jobseekers Allowance has fallen in three of the last four months, surprising markets. In February, the claimant count saw its largest decline since the end of 1997, bringing the claimant count back to its lowest level since July 2009. The level of inactivity has risen to 8.2 million in the three months to January 2010, but the inactivity rate is now only slightly above its average over the last decade. An increase in the number of inactive students more than accounts for the increase in total inactivity. Excluding students, the level of inactivity is lower than at the start of 2008 and the rate is only slightly above the record low seen in the first quarter of 2009.
B.55 The Average Weekly Earnings (AWE) measure replaced the Average Earnings Index (AEI) as the main monthly National Statistic for earnings in January 2010. The AWE differs from the AEI in that it also captures effects on earnings from shifts in the composition of employment, such as employees moving from low to relatively high paid industries. In addition, the AWE is the first monthly indicator of the level of earnings, disaggregated across different sectors and industries. Abstracting from methodological differences, both series have recorded broadly similar trends in earnings growth since 2001.
Average earnings growth has continued to slow over the past year, as firms tempered B.56 real labour cost growth in light of weak nominal demand. Regular pay drift – the component of earnings growth that is linked to factors such as overtime – has weighed on earnings growth through the recession. While the negative drag from pay drift started to ease going into the second half of 2009, average pay settlements – the regularly negotiated element of earnings growth – have fallen back to record lows. Nearly a third of all settlements in the year to March 2010 were pay freezes, far in excess of the usual proportion of pay freezes since 19989. The employment component of the AWE suggests that a shift in the composition of employment to relatively lower paid industries has also weighed down on average earnings growth. AWE regular pay growth has slowed by more than half to 1.4 per cent in the three
9 Income Data Services Pay Online settlements database.
Employment and unemployment
Average earnings
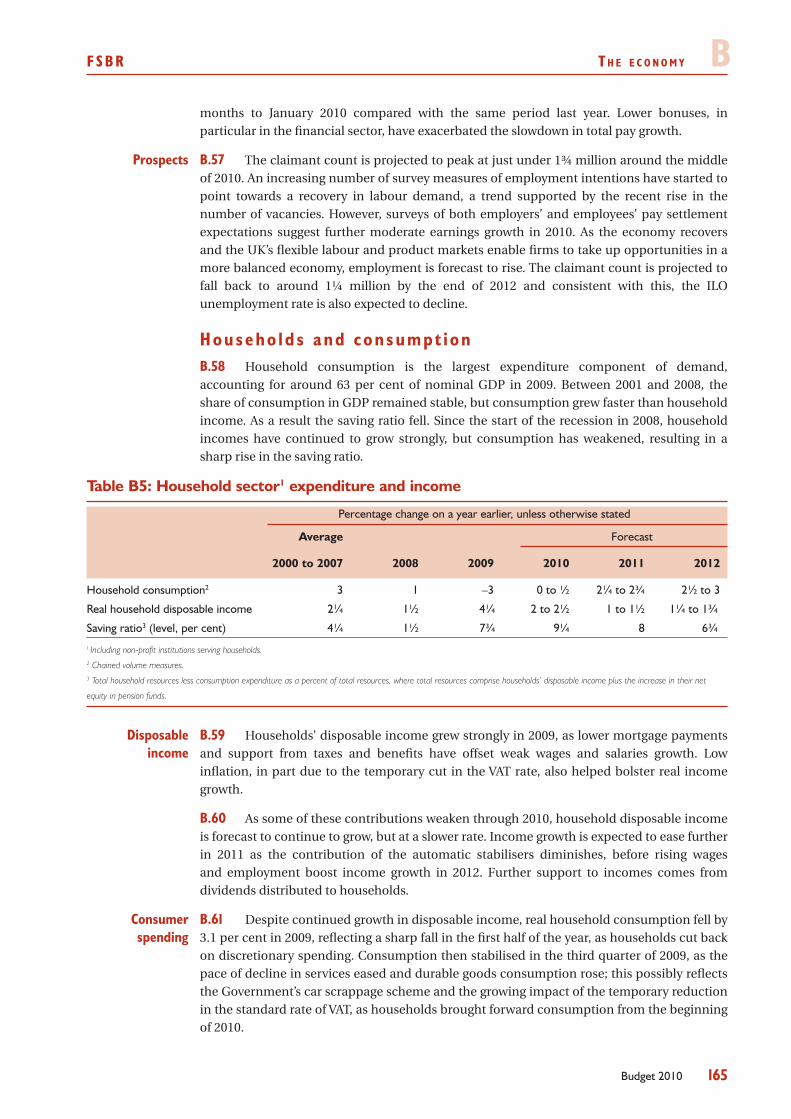
FSBR T h e e c o n o m y B
165Budget 2010
months to January 2010 compared with the same period last year. Lower bonuses, in particular in the financial sector, have exacerbated the slowdown in total pay growth.
B.57 The claimant count is projected to peak at just under 1¾ million around the middle of 2010. An increasing number of survey measures of employment intentions have started to point towards a recovery in labour demand, a trend supported by the recent rise in the number of vacancies. However, surveys of both employers’ and employees’ pay settlement expectations suggest further moderate earnings growth in 2010. As the economy recovers and the UK’s flexible labour and product markets enable firms to take up opportunities in a more balanced economy, employment is forecast to rise. The claimant count is projected to fall back to around 1¼ million by the end of 2012 and consistent with this, the ILO unemployment rate is also expected to decline.
Househo lds and consumpt ionHousehold consumption is the largest expenditure component of demand, B.58
accounting for around 63 per cent of nominal GDP in 2009. Between 2001 and 2008, the share of consumption in GDP remained stable, but consumption grew faster than household income. As a result the saving ratio fell. Since the start of the recession in 2008, household incomes have continued to grow strongly, but consumption has weakened, resulting in a sharp rise in the saving ratio.
Table B5: Household sector1 expenditure and income
Percentage change on a year earlier, unless otherwise stated
Average Forecast
2000 to 2007 2008 2009 2010 2011 2012
Household consumption2 3 1 –3 0 to ½ 2¼ to 2¾ 2½ to 3
Real household disposable income 2¼ 1½ 4¼ 2 to 2½ 1 to 1½ 1¼ to 1¾
Saving ratio3 (level, per cent) 4¼ 1½ 7¾ 9¼ 8 6¾I Including non-profit institutions serving households.2 Chained volume measures.3 Total household resources less consumption expenditure as a percent of total resources, where total resources comprise households’ disposable income plus the increase in their net
equity in pension funds.
B.59 Households’ disposable income grew strongly in 2009, as lower mortgage payments and support from taxes and benefits have offset weak wages and salaries growth. Low inflation, in part due to the temporary cut in the VAT rate, also helped bolster real income growth.
As some of these contributions weaken through 2010, household disposable income B.60 is forecast to continue to grow, but at a slower rate. Income growth is expected to ease further in 2011 as the contribution of the automatic stabilisers diminishes, before rising wages and employment boost income growth in 2012. Further support to incomes comes from dividends distributed to households.
B.61 Despite continued growth in disposable income, real household consumption fell by 3.1 per cent in 2009, reflecting a sharp fall in the first half of the year, as households cut back on discretionary spending. Consumption then stabilised in the third quarter of 2009, as the pace of decline in services eased and durable goods consumption rose; this possibly reflects the Government’s car scrappage scheme and the growing impact of the temporary reduction in the standard rate of VAT, as households brought forward consumption from the beginning of 2010.
Prospects
Disposable income
Consumer spending
B T h e e c o n o m y FSBR
166 Budget 2010
The combined effect of falling consumption and rising incomes led to a steep rise in B.62 the saving ratio, to 8.6 per cent in the third quarter of 2009.
Household consumption rose by 0.4 per cent in the final quarter of the year. Retail B.63 sales volumes, which constitute a third of consumption, rose by 0.5 per cent over the quarter and 3.3 per cent over the year, in contrast with the early 1990s recession when sales volumes declined. Retail sales fell in January. However, the British Retail Consortium’s (BRC) retail sales monitor reported signs that sales may have strengthened in February. Spending on household goods recovered, which is likely to be linked to the growth in property transactions in the second half of the year.
B.64 Consumer spending is forecast to be weak in the first half of 2010 reflecting the VAT change and a forecast rise in the saving ratio. Consumption growth strengthens over the course of the year, as the accommodative stance of monetary policy remains in place. Recent increases in asset prices have led to a significant rise in the ratio of net financial wealth to income, which combined with rising confidence should also serve to support consumption this year.
The saving ratio is expected to remain high through 2010, before falling through B.65 2011, as uncertainty in the macroeconomic outlook continues to ease and the labour market improves, reducing households’ precautionary saving. As the saving ratio declines, consumption is forecast to grow, by 2½ per cent in 2011 and 2¾ per cent in 2012, more slowly than GDP so that the consumption share of GDP declines through the forecast.
B.66 Risks remain over the outlook for consumption. Households might cut consumption more sharply as they seek to rebuild their net wealth, following asset price declines. Households have already made an adjustment to their financial balances, but further adjustment may arise if credit conditions remain constrained or income uncertainty rises. On the other hand, as confidence improves the saving ratio could fall back more quickly than assumed.
Hous ingAccording to the Communities and Local Government (CLG) house price index, B.67
average house prices fell by 13.6 per cent from their peak in late 2007 to their trough in the second quarter of 2009. Prices subsequently rose by 5.4 per cent in the second half of 2009. Survey data from the Royal Institute of Chartered Surveyors suggests that while stocks of properties for sale remain low compared with historical averages, demand from new buyers has picked up leading to house price increases in 2009 despite property transactions being around half the level in 2007. Indeed, the fragility of the housing market was demonstrated by February’s house price indices, with both the Nationwide and Halifax reporting falls, following strong increases from last spring. Transactions also fell back slightly at the beginning of 2010. This may be due in part to the end of the stamp duty holiday for some properties on 31 December 2009, with some transactions having been brought forward in advance of the change.
B.68 The Treasury is using the median of the independent forecasts as the basis of its assumption for projecting house prices. This assumption implies prices will grow moderately in both 2010 and 2011, before returning to their long‑run average growth rate of 5 per cent.
There are several measures to gauge the sustainable level of house prices, such B.69 as the house price‑earnings ratio.10 This ratio fell sharply with the fall in house prices and has picked up only marginally recently. Relating this ratio to a long‑run value requires
10 See Budget 2010: The Economy and Public Finances Supplementary Material, HM Treasury, March 2010.
Prospects
Risks
Prospects
FSBR T h e e c o n o m y B
167Budget 2010
an assumption about its long‑run trend as there is no reason to suppose the ratio will be constant in the long run. A simple linear trend would suggest prices are relatively close to their long‑run relationship with earnings. However, given the ratio has departed from such trends for long periods, such estimates offer little guide to short‑term price movements. For a further discussion of the house‑price earnings ratio, see Box B5.
Box B5: Assessing long-run house prices
Demographic changes, supply constraints, credit conditions and households’ willingness to devote more of their income to housing may have led to a higher house price–earnings ratio over time. Other factors may also have played a role, such as the respective paths of interest rates and unemployment, which will have affected demand and supply through forced sales and repossessions. In the 1990s, a large number of repossessions increased the unsold stock of properties and put further downward pressure on prices. Supported by government policy measures, repossessions in this recession so far have been much lower than originally forecast by the Council of Mortgage Lenders (CML) and significantly less than in the 1990s recession. Outturns for unemployment have also been far lower than expected by many external forecasters.
The ratio of interest rates to income provides a measure of the cost of financing house purchase. A reduction in effective interest rates over the last two years has lowered this ratio. As the CML have noted, there has also been some move towards variable rates as current mortgage deals have expired. This may increase the sensitivity of the housing market to interest rate increases, although that may also coincide with households increasing their demand for fixed rate deals.
Alternative estimates of the long-run tendency in house prices can be made by comparing them with rental prices. If rents are significantly cheaper than the cost of owner occupied housing then there is an incentive for owners to move into rents accommodation. In the long run, prices should equalise. Looking at rents and house prices suggests that house prices were not significantly overvalued at the beginning of 2010. However, this analysis is predicated upon regular financial conditions. The continued restrictions on mortgage availability in the wake of the financial crisis may have lowered the level of house prices to rents in the short run.
Overall, there are a wide range of factors that impinge on house prices and the implications of their interaction are very uncertain. However, a number of different approaches would suggest that house prices are not currently very far from their longer-term trends.
B.70 Dwellings investment fell sharply over the course of 2008 and into the first half of 2009, as tight availability of mortgage finance and expectations of further falls in house prices constrained activity. Reflecting sharp falls at the beginning of the year, investment in dwellings is forecast to fall by 19¼ per cent in 2009, despite positive growth in the third quarter. The latest data suggests the rate of annual decline has eased and growth in dwellings investment is forecast to pick up progressively over the forecast horizon as credit conditions improve and uncertainty subsides.
Compan ie s and i nves tmentBusiness investment is critical to determining the future supply potential by B.71
increasing the physical capital available with which to produce goods and services. In 2008, business investment accounted for around 10 per cent of nominal GDP, but it fell to just over 8 per cent in 2009 given its significantly steeper fall over the year relative to GDP. The role of investment in the economy may be greater than suggested by conventional measures of the capital stock, given the importance of investment in intangible assets in the UK’s knowledge‑intensive economy11.
11 Intangible investment in Britain’s productivity, HM Treasury, Treasury Economic Working Paper No.1, October 2007.
Investment in dwellings
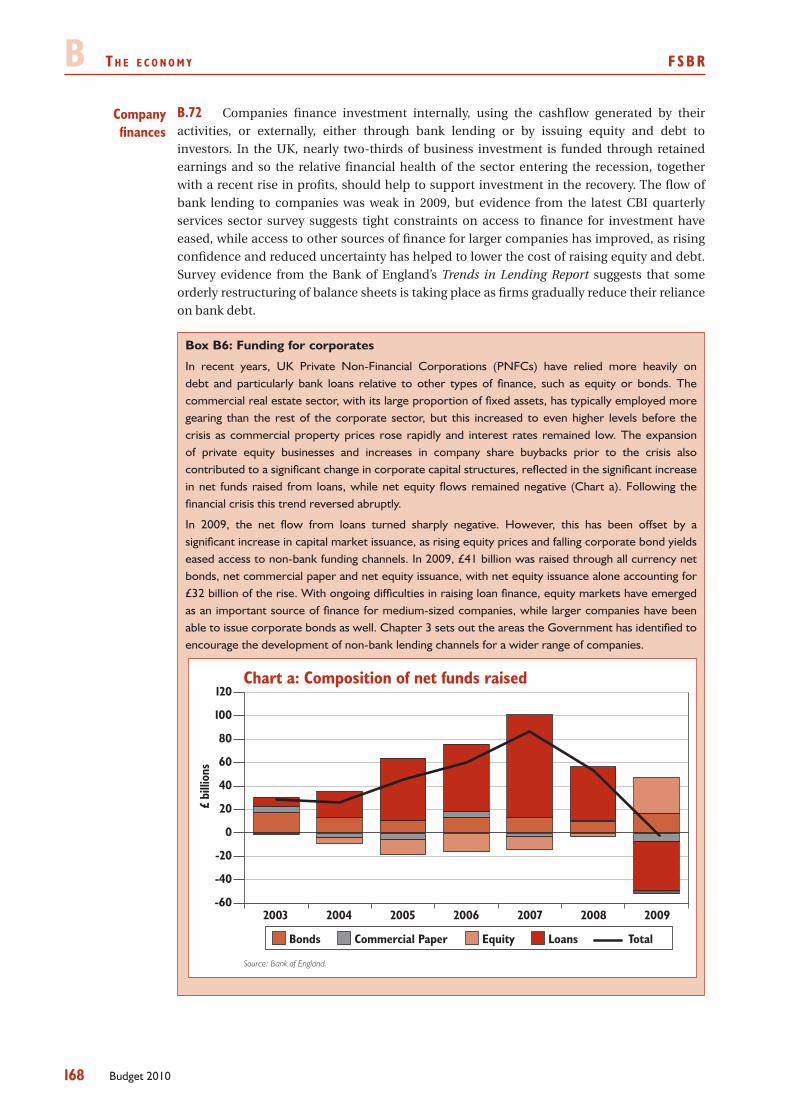
B T h e e c o n o m y FSBR
168 Budget 2010
B.72 Companies finance investment internally, using the cashflow generated by their activities, or externally, either through bank lending or by issuing equity and debt to investors. In the UK, nearly two‑thirds of business investment is funded through retained earnings and so the relative financial health of the sector entering the recession, together with a recent rise in profits, should help to support investment in the recovery. The flow of bank lending to companies was weak in 2009, but evidence from the latest CBI quarterly services sector survey suggests tight constraints on access to finance for investment have eased, while access to other sources of finance for larger companies has improved, as rising confidence and reduced uncertainty has helped to lower the cost of raising equity and debt. Survey evidence from the Bank of England’s Trends in Lending Report suggests that some orderly restructuring of balance sheets is taking place as firms gradually reduce their reliance on bank debt.
Box B6: Funding for corporates
In recent years, UK Private Non-Financial Corporations (PNFCs) have relied more heavily on debt and particularly bank loans relative to other types of finance, such as equity or bonds. The commercial real estate sector, with its large proportion of fixed assets, has typically employed more gearing than the rest of the corporate sector, but this increased to even higher levels before the crisis as commercial property prices rose rapidly and interest rates remained low. The expansion of private equity businesses and increases in company share buybacks prior to the crisis also contributed to a significant change in corporate capital structures, reflected in the significant increase in net funds raised from loans, while net equity flows remained negative (Chart a). Following the financial crisis this trend reversed abruptly.
In 2009, the net flow from loans turned sharply negative. However, this has been offset by a significant increase in capital market issuance, as rising equity prices and falling corporate bond yields eased access to non-bank funding channels. In 2009, £41 billion was raised through all currency net bonds, net commercial paper and net equity issuance, with net equity issuance alone accounting for £32 billion of the rise. With ongoing difficulties in raising loan finance, equity markets have emerged as an important source of finance for medium-sized companies, while larger companies have been able to issue corporate bonds as well. Chapter 3 sets out the areas the Government has identified to encourage the development of non-bank lending channels for a wider range of companies.
Source: Bank of England.
Chart a: Composition of net funds raised
-60
-40
-20
0
20
40
60
80
100
120
2003 2004 2005 2006 2007 2008 2009
Bonds Commercial Paper Equity Loans Total
£ bi
llion
s
Company finances
FSBR T h e e c o n o m y B
169Budget 2010
B.73 Business investment fell very steeply in 2009, with the provisional estimate of a 19 per cent fall by far the largest since records began. The contraction was sharp across all private sectors, with the largest fall of over 32 per cent in the construction sector.
Manufacturing and service sector surveys conducted by the CBI continue to suggest B.74 that uncertainty over demand prospects is the key factor holding back investment. However, investment intentions have picked up at an earlier stage in comparison with previous recoveries, indicative of a recovery in investment this year given the typical historical two‑quarter lag between the pick‑up in investment intentions and actual investment.
Table B6: Gross fixed capital formation
Percentage change on a year earlier
Average Forecast
2000 to 2007 2008 2009 2010 2011 2012
Whole economy1 4 –3½ –14½ –2¾ to –2¼ 4½ to 5 9 to 9½
of which:
Business2,3 3½ 1¼ –19 –5¼ to –4¾ 9¼ to 9¾ 11½ to 12
Private dwellings3 4¼ –11½ –19¼ ¼ to ¾ 7½ to 8 10¼ to 10¾ General government3 5¼ 17¾ 16½ –2½ –19 –8½1 Includes costs associated with the transfer of ownership of land and existing buildings.2 Private sector and public corporations’ non-residential investment. Includes investment under the Private Finance Initiative. 3 Excludes purchases less sales of land and existing buildings.
B.75 Business investment is forecast to stabilise in the first half of this year, before rising gradually as the positive impact of significant macroeconomic stimulus continues, credit conditions ease further and uncertainty subsides. After base effects have unwound, business investment is then forecast to pick up strongly in 2011 and 2012. This reflects the judgement that easing in credit conditions and strengthening global and domestic demand encourage firms to reinstate investment plans placed temporarily on hold prior to the recession, rebuild their depreciated capital stocks and take advantage of new opportunities. But despite the strong business investment growth forecast beyond 2010, the level of business investment is expected to remain below its pre‑recession peak level throughout the forecast horizon.
B.76 Despite firms in aggregate appearing to be in a strong financial position, future business investment may be constrained if the supply of credit in the recovery fails to meet demand. This is particularly the case for loans to the commercial property sector, which account for around 50 per cent of outstanding PNFC bank loans. In the near term, business investment may also be dampened if firms continue to pay down debt to help restructure balance sheets given concerns about a sustained recovery in demand.
GovernmentReal government expenditure – consumption and investment – continued to rise B.77
through the recession, supporting the economy as demand in the private sector declined. Government consumption rose by 2 per cent over the year as a whole in 2009 and is forecast to rise by 1¼ per cent in 2010. As private sector demand strengthens and financial sector conditions continue to improve, fiscal policy will tighten gradually, with a substantial part coming from lower government consumption and investment. This can be seen in the negative contributions to growth in 2011 and 2012, shown in Table B4.
Business investment
Prospects
Risks
B T h e e c o n o m y FSBR
170 Budget 2010
Trade and ba l ance o f payments 12
B.78 Having fallen by over 13 per cent between the second quarter of 2008 and the second quarter of 2009, UK export volumes increased in the second half of 2009, alongside the recovery in global demand and trade. The growth in exports in the three months to January eased, but survey evidence points to rising volumes in the coming months. The BCC Report for the final quarter of 2009 recorded an increase in both the export sales and orders balances, with a notably strong rise in the manufacturing sector. The manufacturing exports balance in the PMI manufacturing survey rose in February, to its highest level since January 1996. Consistent with current weak global demand for financial services, UK services exports remain subdued, growing by 0.8 per cent in the final quarter of 2009.
B.79 Since its peak in the middle of 2007, sterling has depreciated by around 25 per cent. As seen previously, the depreciation is expected to boost future export volumes as UK export companies reduce the price of their goods in foreign markets and increase market share. Due to factors such as fixed contracts and concerns over credit availability, this effect is expected to take time to feed through. Indeed, the rise in import and export prices since mid 2007 have been broadly comparable, suggesting some exporters may be raising profit margins rather than trying to gain market share. This effect is more pronounced in EU exports, where the rise in export prices has been greater than goods destined for other regions. However, as firms increase their output and new firms enter the market in response to higher profit margins, export volumes are expected to pick up. For example, the Bank of England’s Regional Agents suggest businesses expect a rise in exports in 2010.
B.80 Export growth is forecast to be positive in 2010, and rise over the forecast horizon as the recovery in world demand strengthens. Reflecting the weaker forecast for euro area growth, export growth in 2011 has been revised down since the 2009 Pre‑Budget Report.
B.81 Import volumes declined by 12 per cent in 2009, reflecting a sharp fall in the first half of the year. The rate of decline then eased, with growth of 4 per cent resuming in the final quarter of the year. Both goods and services trade volumes have fallen, but goods volumes recovered strongly in the second half of 2009, possibly supported by the Government’s car scrappage scheme with passenger cars constituting nearly half of the rise in total imports.
12 The volume of exports and imports in the economic forecast abstracts from the effects of activity related to Missing Trader Intra-Community fraud (MTIC), by making a neutral assumption that the adjustment for MTIC-related activity remains constant throughout the forecast horizon at the latest quarterly estimate, and that trade grows in line with underlying determinants. For a fuller explanation of the effect of MTIC-related activity on trade in recent years, see paragraphs B.76 to B.82 of Budget 2008. All figures cited in this section and those reported in Table B7 relate to export and import growth excluding the MTIC adjustment.
Exports
Sterling and export prices
Prospects
Imports
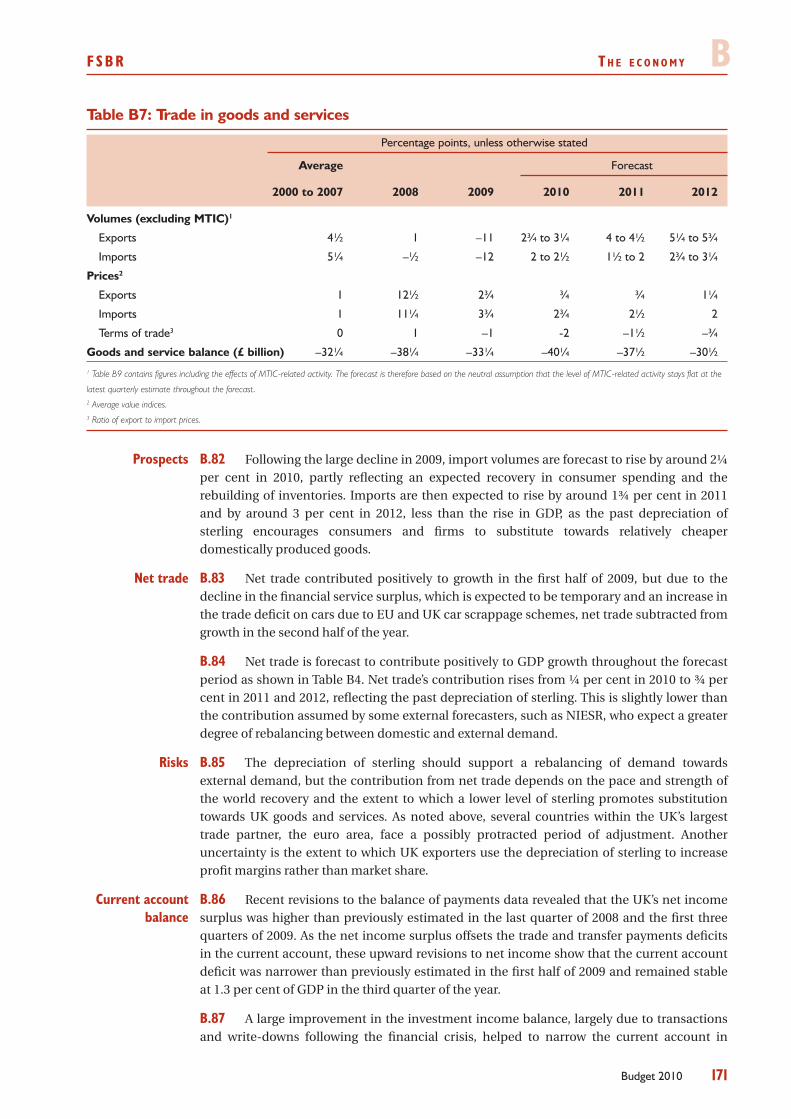
FSBR T h e e c o n o m y B
171Budget 2010
Table B7: Trade in goods and services
Percentage points, unless otherwise stated
Average Forecast
2000 to 2007 2008 2009 2010 2011 2012
Volumes (excluding MTIC)1
Exports 4½ 1 –11 2¾ to 3¼ 4 to 4½ 5¼ to 5¾
Imports 5¼ –½ –12 2 to 2½ 1½ to 2 2¾ to 3¼
Prices2
Exports 1 12½ 2¾ ¾ ¾ 1¼
Imports 1 11¼ 3¾ 2¾ 2½ 2
Terms of trade3 0 1 –1 -2 –1½ –¾
Goods and service balance (£ billion) –32¼ –38¼ –33¼ –40¼ –37½ –30½1 Table B9 contains figures including the effects of MTIC-related activity. The forecast is therefore based on the neutral assumption that the level of MTIC-related activity stays flat at the
latest quarterly estimate throughout the forecast.2 Average value indices.3 Ratio of export to import prices.
B.82 Following the large decline in 2009, import volumes are forecast to rise by around 2¼ per cent in 2010, partly reflecting an expected recovery in consumer spending and the rebuilding of inventories. Imports are then expected to rise by around 1¾ per cent in 2011 and by around 3 per cent in 2012, less than the rise in GDP, as the past depreciation of sterling encourages consumers and firms to substitute towards relatively cheaper domestically produced goods.
B.83 Net trade contributed positively to growth in the first half of 2009, but due to the decline in the financial service surplus, which is expected to be temporary and an increase in the trade deficit on cars due to EU and UK car scrappage schemes, net trade subtracted from growth in the second half of the year.
Net trade is forecast to contribute positively to GDP growth throughout the forecast B.84 period as shown in Table B4. Net trade’s contribution rises from ¼ per cent in 2010 to ¾ per cent in 2011 and 2012, reflecting the past depreciation of sterling. This is slightly lower than the contribution assumed by some external forecasters, such as NIESR, who expect a greater degree of rebalancing between domestic and external demand.
B.85 The depreciation of sterling should support a rebalancing of demand towards external demand, but the contribution from net trade depends on the pace and strength of the world recovery and the extent to which a lower level of sterling promotes substitution towards UK goods and services. As noted above, several countries within the UK’s largest trade partner, the euro area, face a possibly protracted period of adjustment. Another uncertainty is the extent to which UK exporters use the depreciation of sterling to increase profit margins rather than market share.
B.86 Recent revisions to the balance of payments data revealed that the UK’s net income surplus was higher than previously estimated in the last quarter of 2008 and the first three quarters of 2009. As the net income surplus offsets the trade and transfer payments deficits in the current account, these upward revisions to net income show that the current account deficit was narrower than previously estimated in the first half of 2009 and remained stable at 1.3 per cent of GDP in the third quarter of the year.
A large improvement in the investment income balance, largely due to transactions B.87 and write‑downs following the financial crisis, helped to narrow the current account in
Prospects
Net trade
Risks
Current account balance
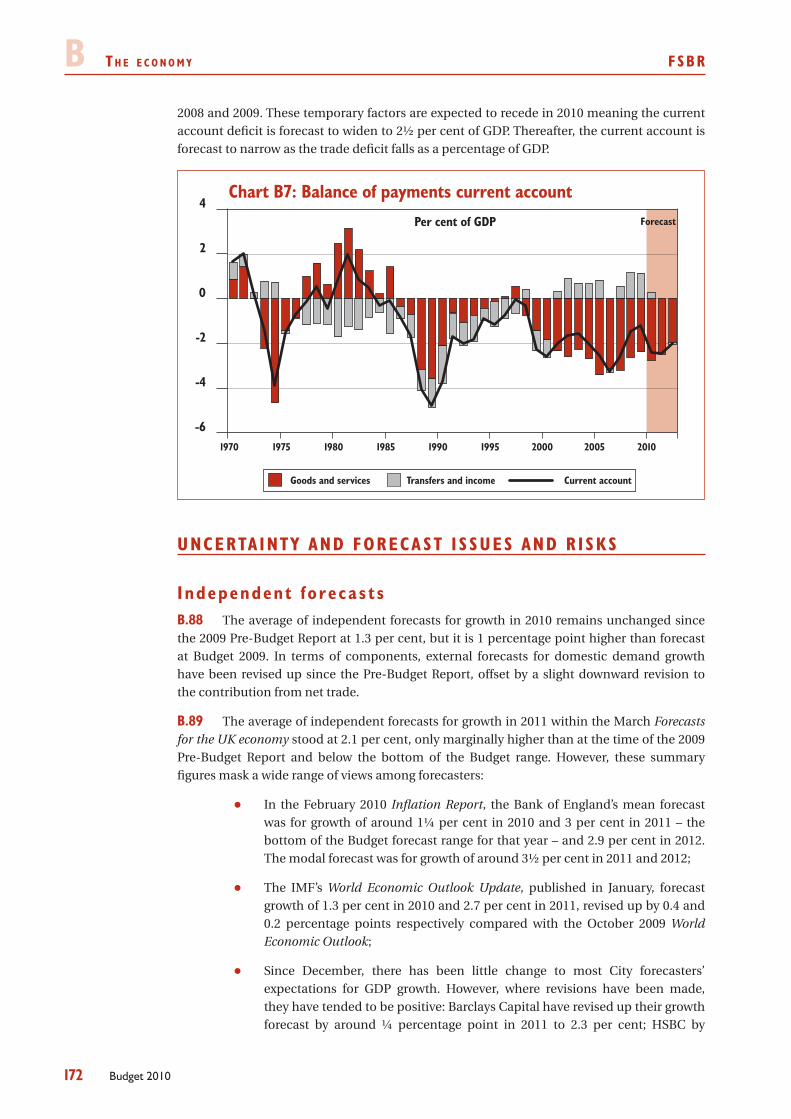
B T h e e c o n o m y FSBR
172 Budget 2010
2008 and 2009. These temporary factors are expected to recede in 2010 meaning the current account deficit is forecast to widen to 2½ per cent of GDP. Thereafter, the current account is forecast to narrow as the trade deficit falls as a percentage of GDP.
Source:.
Chart B7: Balance of payments current account
-6
-4
-2
0
2
4Per cent of GDP Forecast
1970 20101975 1980 1985 1990 1995 2000 2005
Goods and services Transfers and income Current account
UNCERTA INTY AND FORECA ST I SSUES AND R ISKS
Independent f o recas t sThe average of independent forecasts for growth in 2010 remains unchanged since B.88
the 2009 Pre‑Budget Report at 1.3 per cent, but it is 1 percentage point higher than forecast at Budget 2009. In terms of components, external forecasts for domestic demand growth have been revised up since the Pre‑Budget Report, offset by a slight downward revision to the contribution from net trade.
The average of independent forecasts for growth in 2011 within the March B.89 Forecasts for the UK economy stood at 2.1 per cent, only marginally higher than at the time of the 2009 Pre‑Budget Report and below the bottom of the Budget range. However, these summary figures mask a wide range of views among forecasters:
In the February 2010 • Inflation Report, the Bank of England’s mean forecast was for growth of around 1¼ per cent in 2010 and 3 per cent in 2011 – the bottom of the Budget forecast range for that year – and 2.9 per cent in 2012. The modal forecast was for growth of around 3½ per cent in 2011 and 2012;
The IMF’s • World Economic Outlook Update, published in January, forecast growth of 1.3 per cent in 2010 and 2.7 per cent in 2011, revised up by 0.4 and 0.2 percentage points respectively compared with the October 2009 World Economic Outlook;
Since December, there has been little change to most City forecasters’ •expectations for GDP growth. However, where revisions have been made, they have tended to be positive: Barclays Capital have revised up their growth forecast by around ¼ percentage point in 2011 to 2.3 per cent; HSBC by
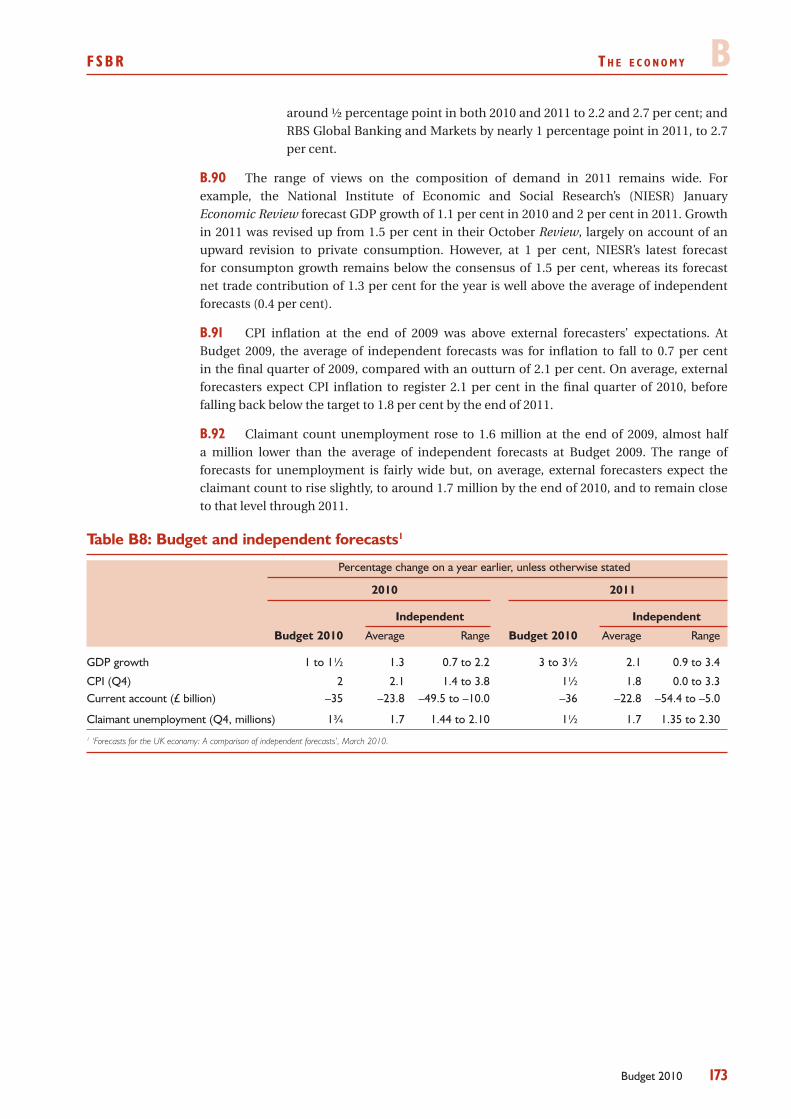
FSBR T h e e c o n o m y B
173Budget 2010
around ½ percentage point in both 2010 and 2011 to 2.2 and 2.7 per cent; and RBS Global Banking and Markets by nearly 1 percentage point in 2011, to 2.7 per cent.
The range of views on the composition of demand in 2011 remains wide. For B.90 example, the National Institute of Economic and Social Research’s (NIESR) January Economic Review forecast GDP growth of 1.1 per cent in 2010 and 2 per cent in 2011. Growth in 2011 was revised up from 1.5 per cent in their October Review, largely on account of an upward revision to private consumption. However, at 1 per cent, NIESR’s latest forecast for consumpton growth remains below the consensus of 1.5 per cent, whereas its forecast net trade contribution of 1.3 per cent for the year is well above the average of independent forecasts (0.4 per cent).
CPI inflation at the end of 2009 was above external forecasters’ expectations. At B.91 Budget 2009, the average of independent forecasts was for inflation to fall to 0.7 per cent in the final quarter of 2009, compared with an outturn of 2.1 per cent. On average, external forecasters expect CPI inflation to register 2.1 per cent in the final quarter of 2010, before falling back below the target to 1.8 per cent by the end of 2011.
Claimant count unemployment rose to 1.6 million at the end of 2009, almost half B.92 a million lower than the average of independent forecasts at Budget 2009. The range of forecasts for unemployment is fairly wide but, on average, external forecasters expect the claimant count to rise slightly, to around 1.7 million by the end of 2010, and to remain close to that level through 2011.
Table B8: Budget and independent forecasts1
Percentage change on a year earlier, unless otherwise stated
2010 2011
Independent Independent
Budget 2010 Average Range Budget 2010 Average Range
GDP growth 1 to 1½ 1.3 0.7 to 2.2 3 to 3½ 2.1 0.9 to 3.4
CPI (Q4) 2 2.1 1.4 to 3.8 1½ 1.8 0.0 to 3.3Current account (£ billion) –35 –23.8 –49.5 to –10.0 –36 –22.8 –54.4 to –5.0
Claimant unemployment (Q4, millions) 1¾ 1.7 1.44 to 2.10 1½ 1.7 1.35 to 2.301 ‘Forecasts for the UK economy: A comparison of independent forecasts’, March 2010.
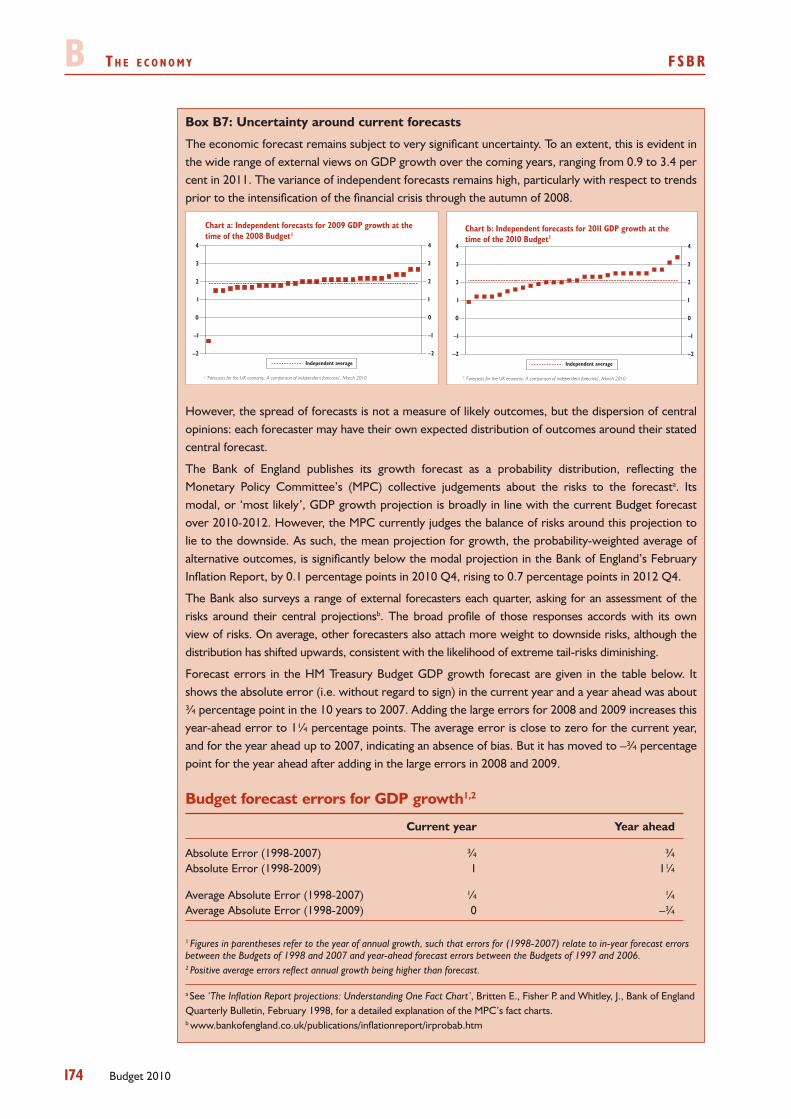
B T h e e c o n o m y FSBR
174 Budget 2010
Box B7: Uncertainty around current forecasts
The economic forecast remains subject to very significant uncertainty. To an extent, this is evident in the wide range of external views on GDP growth over the coming years, ranging from 0.9 to 3.4 per cent in 2011. The variance of independent forecasts remains high, particularly with respect to trends prior to the intensification of the financial crisis through the autumn of 2008.
–2
–1
0
1
2
3
4
–2
–1
0
1
2
3
4
Chart a: Independent forecasts for 2009 GDP growth at thetime of the 2008 Budget 1
Independent average
1 ‘Forecasts for the UK economy: A comparison of independent forecasts’, March 2010.
Chart b: Independent forecasts for 2011 GDP growth at thetime of the 2010 Budget1
Independent average
–2
–1
0
1
2
3
4
–2
–1
0
1
2
3
4
1 ‘Forecasts for the UK economy: A comparison of independent forecasts’, March 2010.
However, the spread of forecasts is not a measure of likely outcomes, but the dispersion of central opinions: each forecaster may have their own expected distribution of outcomes around their stated central forecast.
The Bank of England publishes its growth forecast as a probability distribution, reflecting the Monetary Policy Committee’s (MPC) collective judgements about the risks to the forecasta. Its modal, or ‘most likely’, GDP growth projection is broadly in line with the current Budget forecast over 2010-2012. However, the MPC currently judges the balance of risks around this projection to lie to the downside. As such, the mean projection for growth, the probability-weighted average of alternative outcomes, is significantly below the modal projection in the Bank of England’s February Inflation Report, by 0.1 percentage points in 2010 Q4, rising to 0.7 percentage points in 2012 Q4.
The Bank also surveys a range of external forecasters each quarter, asking for an assessment of the risks around their central projectionsb. The broad profile of those responses accords with its own view of risks. On average, other forecasters also attach more weight to downside risks, although the distribution has shifted upwards, consistent with the likelihood of extreme tail-risks diminishing.
Forecast errors in the HM Treasury Budget GDP growth forecast are given in the table below. It shows the absolute error (i.e. without regard to sign) in the current year and a year ahead was about ¾ percentage point in the 10 years to 2007. Adding the large errors for 2008 and 2009 increases this year-ahead error to 1¼ percentage points. The average error is close to zero for the current year, and for the year ahead up to 2007, indicating an absence of bias. But it has moved to –¾ percentage point for the year ahead after adding in the large errors in 2008 and 2009.
Budget forecast errors for GDP growth1,2
Current year Year ahead
Absolute Error (1998-2007) ¾ ¾Absolute Error (1998-2009) 1 1¼
Average Absolute Error (1998-2007) ¼ ¼Average Absolute Error (1998-2009) 0 –¾
1 Figures in parentheses refer to the year of annual growth, such that errors for (1998-2007) relate to in-year forecast errors between the Budgets of 1998 and 2007 and year-ahead forecast errors between the Budgets of 1997 and 2006.2 Positive average errors reflect annual growth being higher than forecast.
a See ‘The Inflation Report projections: Understanding One Fact Chart’, Britten E., Fisher P. and Whitley, J., Bank of England Quarterly Bulletin, February 1998, for a detailed explanation of the MPC’s fact charts.b www.bankofengland.co.uk/publications/inflationreport/irprobab.htm
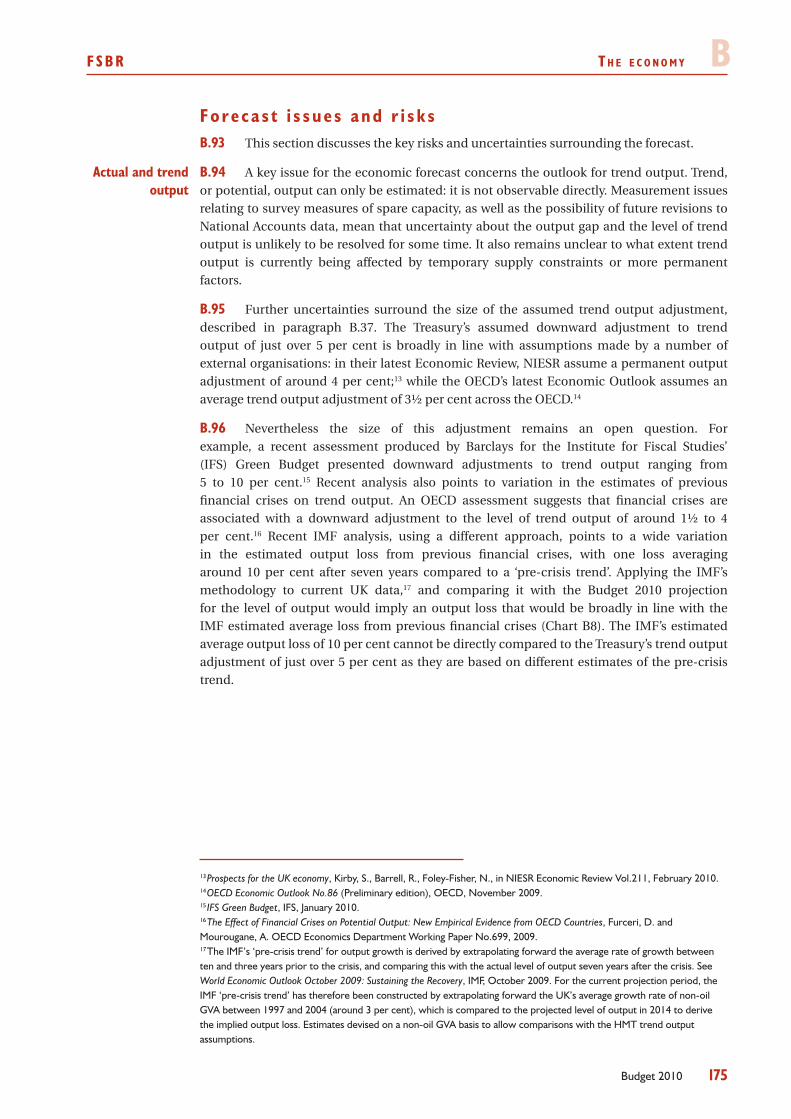
FSBR T h e e c o n o m y B
175Budget 2010
Forecas t i s sues and r i sk sThis section discusses the key risks and uncertainties surrounding the forecast.B.93
B.94 A key issue for the economic forecast concerns the outlook for trend output. Trend, or potential, output can only be estimated: it is not observable directly. Measurement issues relating to survey measures of spare capacity, as well as the possibility of future revisions to National Accounts data, mean that uncertainty about the output gap and the level of trend output is unlikely to be resolved for some time. It also remains unclear to what extent trend output is currently being affected by temporary supply constraints or more permanent factors.
Further uncertainties surround the size of the assumed trend output adjustment, B.95 described in paragraph B.37. The Treasury’s assumed downward adjustment to trend output of just over 5 per cent is broadly in line with assumptions made by a number of external organisations: in their latest Economic Review, NIESR assume a permanent output adjustment of around 4 per cent;13 while the OECD’s latest Economic Outlook assumes an average trend output adjustment of 3½ per cent across the OECD.14
Nevertheless the size of this adjustment remains an open question. For B.96 example, a recent assessment produced by Barclays for the Institute for Fiscal Studies’ (IFS) Green Budget presented downward adjustments to trend output ranging from 5 to 10 per cent.15 Recent analysis also points to variation in the estimates of previous financial crises on trend output. An OECD assessment suggests that financial crises are associated with a downward adjustment to the level of trend output of around 1½ to 4 per cent.16 Recent IMF analysis, using a different approach, points to a wide variation in the estimated output loss from previous financial crises, with one loss averaging around 10 per cent after seven years compared to a ‘pre‑crisis trend’. Applying the IMF’s methodology to current UK data,17 and comparing it with the Budget 2010 projection for the level of output would imply an output loss that would be broadly in line with the IMF estimated average loss from previous financial crises (Chart B8). The IMF’s estimated average output loss of 10 per cent cannot be directly compared to the Treasury’s trend output adjustment of just over 5 per cent as they are based on different estimates of the pre‑crisis trend.
13 Prospects for the UK economy, Kirby, S., Barrell, R., Foley-Fisher, N., in NIESR Economic Review Vol.211, February 2010.14 OECD Economic Outlook No.86 (Preliminary edition), OECD, November 2009.15 IFS Green Budget, IFS, January 2010.16 The Effect of Financial Crises on Potential Output: New Empirical Evidence from OECD Countries, Furceri, D. and Mourougane, A. OECD Economics Department Working Paper No.699, 2009.17 The IMF’s ‘pre-crisis trend’ for output growth is derived by extrapolating forward the average rate of growth between ten and three years prior to the crisis, and comparing this with the actual level of output seven years after the crisis. See World Economic Outlook October 2009: Sustaining the Recovery, IMF, October 2009. For the current projection period, the IMF ‘pre-crisis trend’ has therefore been constructed by extrapolating forward the UK’s average growth rate of non-oil GVA between 1997 and 2004 (around 3 per cent), which is compared to the projected level of output in 2014 to derive the implied output loss. Estimates devised on a non-oil GVA basis to allow comparisons with the HMT trend output assumptions.
Actual and trend output
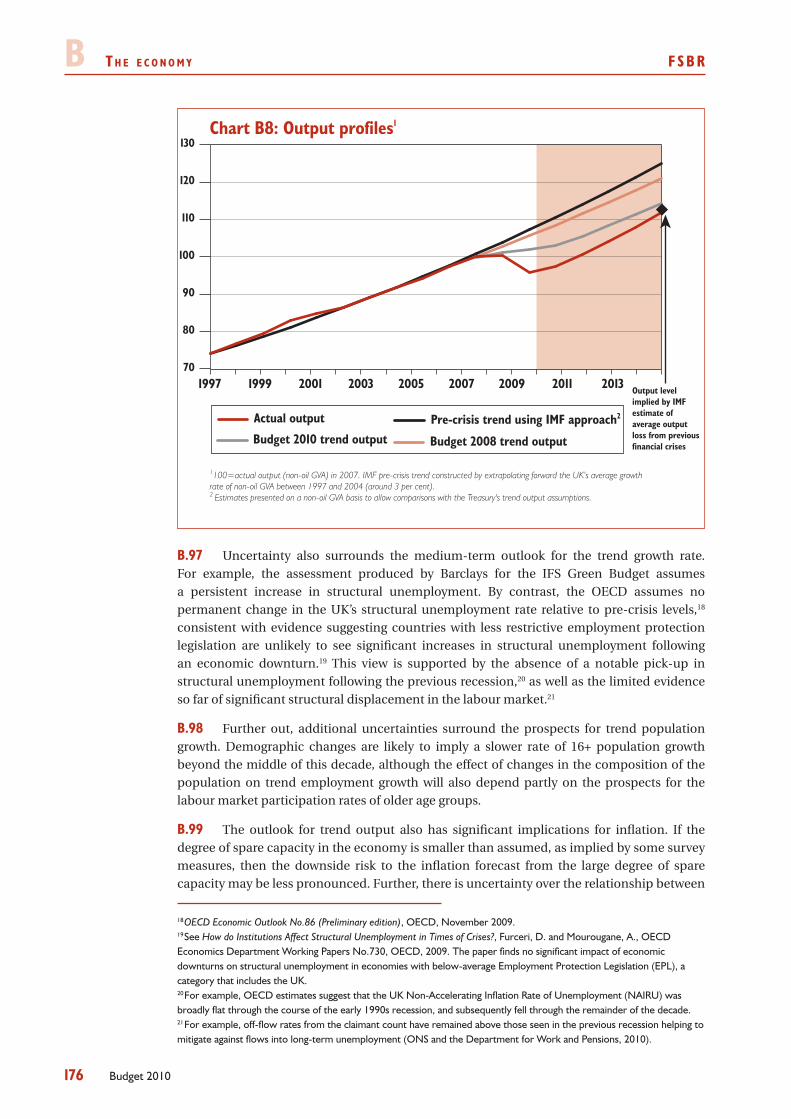
B T h e e c o n o m y FSBR
176 Budget 2010
1100=actual output (non-oil GVA) in 2007. IMF pre-crisis trend constructed by extrapolating forward the UK’s average growth rate of non-oil GVA between 1997 and 2004 (around 3 per cent).2 Estimates presented on a non-oil GVA basis to allow comparisons with the Treasury's trend output assumptions.
Chart B8: Output profiles1
70
80
90
100
110
120
130
Output level implied by IMF estimate of average output loss from previous financial crisesBudget 2008 trend outputBudget 2010 trend output
Pre-crisis trend using IMF approach2Actual output
1997 1999 2001 2003 2005 2007 2009 2011 2013
Uncertainty also surrounds the medium‑term outlook for the trend growth rate. B.97 For example, the assessment produced by Barclays for the IFS Green Budget assumes a persistent increase in structural unemployment. By contrast, the OECD assumes no permanent change in the UK’s structural unemployment rate relative to pre‑crisis levels,18 consistent with evidence suggesting countries with less restrictive employment protection legislation are unlikely to see significant increases in structural unemployment following an economic downturn.19 This view is supported by the absence of a notable pick‑up in structural unemployment following the previous recession,20 as well as the limited evidence so far of significant structural displacement in the labour market.21
Further out, additional uncertainties surround the prospects for trend population B.98 growth. Demographic changes are likely to imply a slower rate of 16+ population growth beyond the middle of this decade, although the effect of changes in the composition of the population on trend employment growth will also depend partly on the prospects for the labour market participation rates of older age groups.
The outlook for trend output also has significant implications for inflation. If the B.99 degree of spare capacity in the economy is smaller than assumed, as implied by some survey measures, then the downside risk to the inflation forecast from the large degree of spare capacity may be less pronounced. Further, there is uncertainty over the relationship between
18 OECD Economic Outlook No.86 (Preliminary edition), OECD, November 2009.19 See How do Institutions Affect Structural Unemployment in Times of Crises?, Furceri, D. and Mourougane, A., OECD Economics Department Working Papers No.730, OECD, 2009. The paper finds no significant impact of economic downturns on structural unemployment in economies with below-average Employment Protection Legislation (EPL), a category that includes the UK. 20 For example, OECD estimates suggest that the UK Non-Accelerating Inflation Rate of Unemployment (NAIRU) was broadly flat through the course of the early 1990s recession, and subsequently fell through the remainder of the decade.21 For example, off-flow rates from the claimant count have remained above those seen in the previous recession helping to mitigate against flows into long-term unemployment (ONS and the Department for Work and Pensions, 2010).
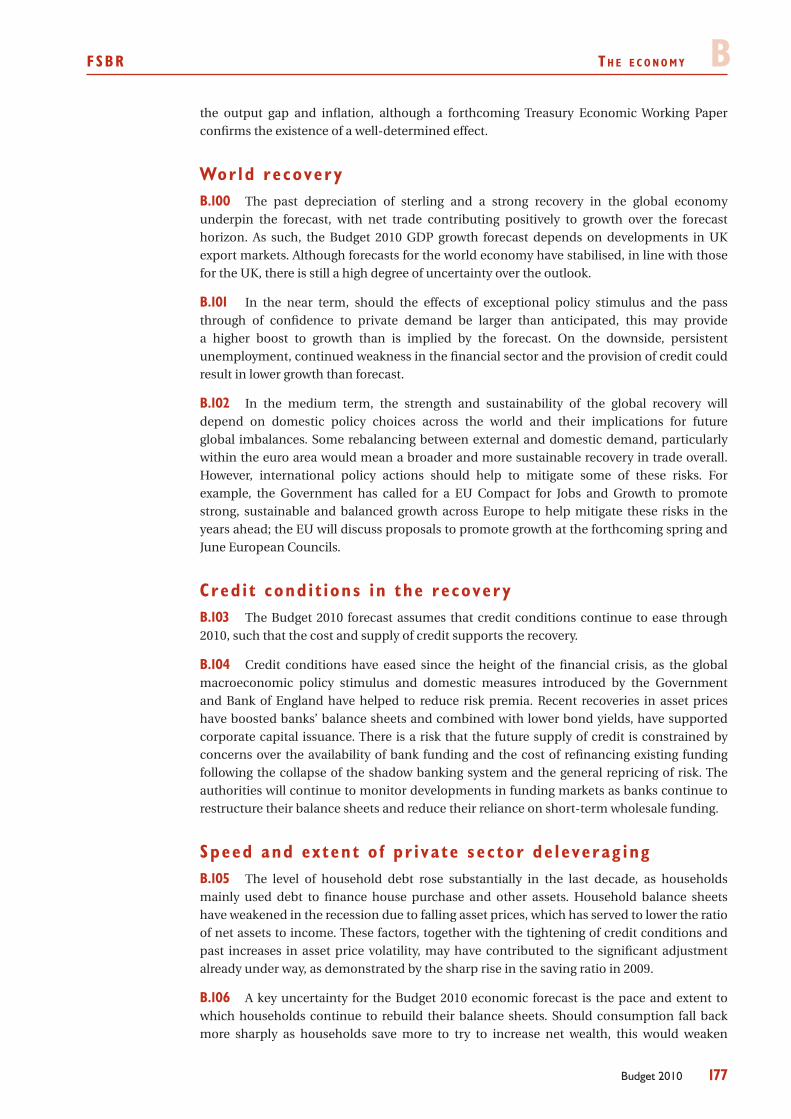
FSBR T h e e c o n o m y B
177Budget 2010
the output gap and inflation, although a forthcoming Treasury Economic Working Paper confirms the existence of a well‑determined effect.
Wor ld recover yThe past depreciation of sterling and a strong recovery in the global economy B.100
underpin the forecast, with net trade contributing positively to growth over the forecast horizon. As such, the Budget 2010 GDP growth forecast depends on developments in UK export markets. Although forecasts for the world economy have stabilised, in line with those for the UK, there is still a high degree of uncertainty over the outlook.
In the near term, should the effects of exceptional policy stimulus and the pass B.101 through of confidence to private demand be larger than anticipated, this may provide a higher boost to growth than is implied by the forecast. On the downside, persistent unemployment, continued weakness in the financial sector and the provision of credit could result in lower growth than forecast.
In the medium term, the strength and sustainability of the global recovery will B.102 depend on domestic policy choices across the world and their implications for future global imbalances. Some rebalancing between external and domestic demand, particularly within the euro area would mean a broader and more sustainable recovery in trade overall. However, international policy actions should help to mitigate some of these risks. For example, the Government has called for a EU Compact for Jobs and Growth to promote strong, sustainable and balanced growth across Europe to help mitigate these risks in the years ahead; the EU will discuss proposals to promote growth at the forthcoming spring and June European Councils.
Cred i t cond i t i ons i n the r e cover yThe Budget 2010 forecast assumes that credit conditions continue to ease through B.103
2010, such that the cost and supply of credit supports the recovery.
Credit conditions have eased since the height of the financial crisis, as the global B.104 macroeconomic policy stimulus and domestic measures introduced by the Government and Bank of England have helped to reduce risk premia. Recent recoveries in asset prices have boosted banks’ balance sheets and combined with lower bond yields, have supported corporate capital issuance. There is a risk that the future supply of credit is constrained by concerns over the availability of bank funding and the cost of refinancing existing funding following the collapse of the shadow banking system and the general repricing of risk. The authorities will continue to monitor developments in funding markets as banks continue to restructure their balance sheets and reduce their reliance on short‑term wholesale funding.
Speed and ex ten t o f p r i va te s e c tor de l eve rag ingThe level of household debt rose substantially in the last decade, as households B.105
mainly used debt to finance house purchase and other assets. Household balance sheets have weakened in the recession due to falling asset prices, which has served to lower the ratio of net assets to income. These factors, together with the tightening of credit conditions and past increases in asset price volatility, may have contributed to the significant adjustment already under way, as demonstrated by the sharp rise in the saving ratio in 2009.
A key uncertainty for the Budget 2010 economic forecast is the pace and extent to B.106 which households continue to rebuild their balance sheets. Should consumption fall back more sharply as households save more to try to increase net wealth, this would weaken

B T h e e c o n o m y FSBR
178 Budget 2010
overall demand and hamper the recovery. To illustrate this point, if the saving ratio were to rise by 1 percentage point more than forecast in 2010 due to lower consumption, this would reduce GDP growth by ½ percentage point, taking into account the partial offset from lower imports. The overall effect could be larger, particularly if firms reacted to weaker demand by cutting staff, leading to a potential feedback from lower employment to weaker demand.
However, these risks need to be weighed against current conditions: the historically B.107 low level of interest rates, which has reduced the cost of servicing debt; the rebound in asset prices; improved confidence; and the signs of stabilisation in the labour market. These factors should help to smooth any further adjustment over the course of the forecast period.
The relatively high concentration of debt in the real estate and finance sectors poses B.108 a wider risk as concerns, over refinancing and potential losses on commercial property loans may weigh down on the supply of credit in the recovery. However, the corporate sector as a whole is well‑positioned, having entered the recession in a relatively healthy financial position. Firms appear to have managed their financial and cash positions well through the recession, with the corporate liquidity ratio having risen from historic lows to around 50 per cent by the end of 2009, and with net capital and income gearing ratios now back down to low levels by historical standards.
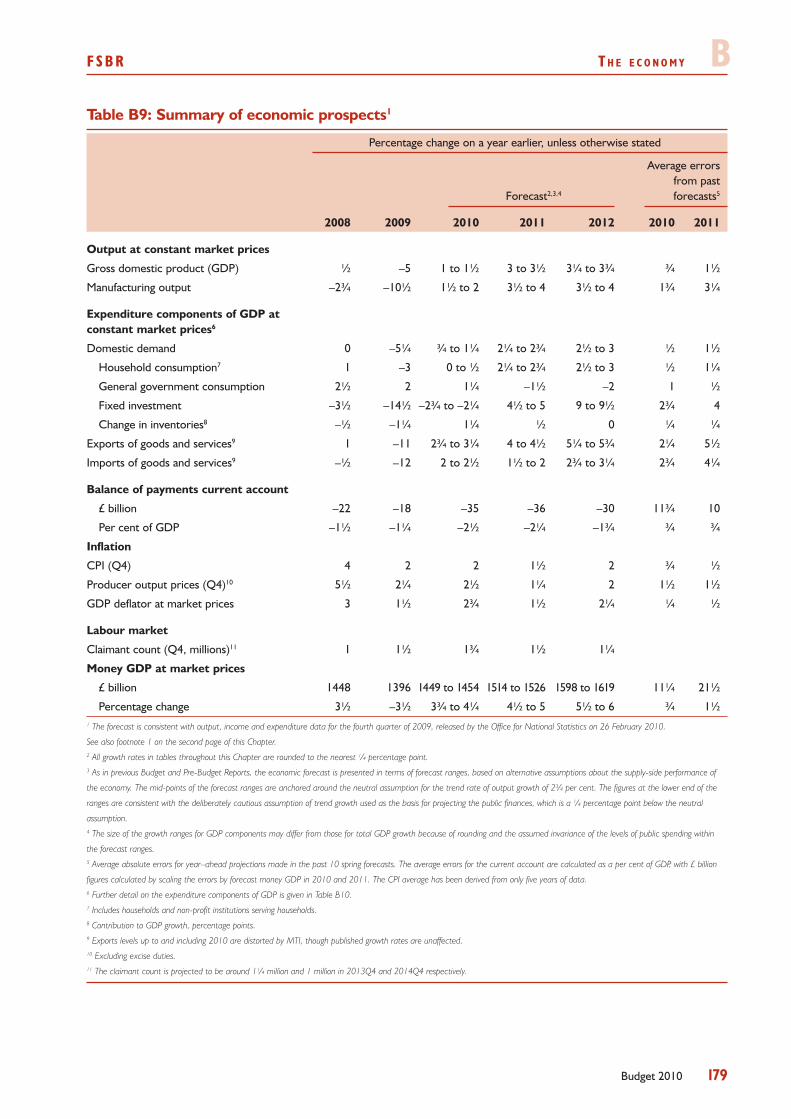
FSBR T h e e c o n o m y B
179Budget 2010
Table B9: Summary of economic prospects1
Percentage change on a year earlier, unless otherwise stated
Average errors from past Forecast2,3,4 forecasts5
2008 2009 2010 2011 2012 2010 2011
Output at constant market prices
Gross domestic product (GDP) ½ –5 1 to 1½ 3 to 3½ 3¼ to 3¾ ¾ 1½
Manufacturing output –2¾ –10½ 1½ to 2 3½ to 4 3½ to 4 1¾ 3¼
Expenditure components of GDP at constant market prices6
Domestic demand 0 –5¼ ¾ to 1¼ 2¼ to 2¾ 2½ to 3 ½ 1½
Household consumption7 1 –3 0 to ½ 2¼ to 2¾ 2½ to 3 ½ 1¼
General government consumption 2½ 2 1¼ –1½ –2 1 ½
Fixed investment –3½ –14½ –2¾ to –2¼ 4½ to 5 9 to 9½ 2¾ 4
Change in inventories8 –½ –1¼ 1¼ ½ 0 ¼ ¼
Exports of goods and services9 1 –11 2¾ to 3¼ 4 to 4½ 5¼ to 5¾ 2¼ 5½
Imports of goods and services9 –½ –12 2 to 2½ 1½ to 2 2¾ to 3¼ 2¾ 4¼
Balance of payments current account
£ billion –22 –18 –35 –36 –30 11¾ 10
Per cent of GDP –1½ –1¼ –2½ –2¼ –1¾ ¾ ¾
Inflation
CPI (Q4) 4 2 2 1½ 2 ¾ ½
Producer output prices (Q4)10 5½ 2¼ 2½ 1¼ 2 1½ 1½
GDP deflator at market prices 3 1½ 2¾ 1½ 2¼ ¼ ½
Labour market
Claimant count (Q4, millions)11 1 1½ 1¾ 1½ 1¼
Money GDP at market prices
£ billion 1448 1396 1449 to 1454 1514 to 1526 1598 to 1619 11¼ 21½
Percentage change 3½ –3½ 3¾ to 4¼ 4½ to 5 5½ to 6 ¾ 1½1 The forecast is consistent with output, income and expenditure data for the fourth quarter of 2009, released by the Office for National Statistics on 26 February 2010.
See also footnote 1 on the second page of this Chapter.2 All growth rates in tables throughout this Chapter are rounded to the nearest ¼ percentage point.3 As in previous Budget and Pre-Budget Reports, the economic forecast is presented in terms of forecast ranges, based on alternative assumptions about the supply-side performance of
the economy. The mid-points of the forecast ranges are anchored around the neutral assumption for the trend rate of output growth of 2¾ per cent. The figures at the lower end of the
ranges are consistent with the deliberately cautious assumption of trend growth used as the basis for projecting the public finances, which is a ¼ percentage point below the neutral
assumption.4 The size of the growth ranges for GDP components may differ from those for total GDP growth because of rounding and the assumed invariance of the levels of public spending within
the forecast ranges.5 Average absolute errors for year–ahead projections made in the past 10 spring forecasts. The average errors for the current account are calculated as a per cent of GDP, with £ billion
figures calculated by scaling the errors by forecast money GDP in 2010 and 2011. The CPI average has been derived from only five years of data.6 Further detail on the expenditure components of GDP is given in Table B10.7 Includes households and non-profit institutions serving households.8 Contribution to GDP growth, percentage points.9 Exports levels up to and including 2010 are distorted by MTI, though published growth rates are unaffected.10 Excluding excise duties.11 The claimant count is projected to be around 1¼ million and 1 million in 2013Q4 and 2014Q4 respectively.
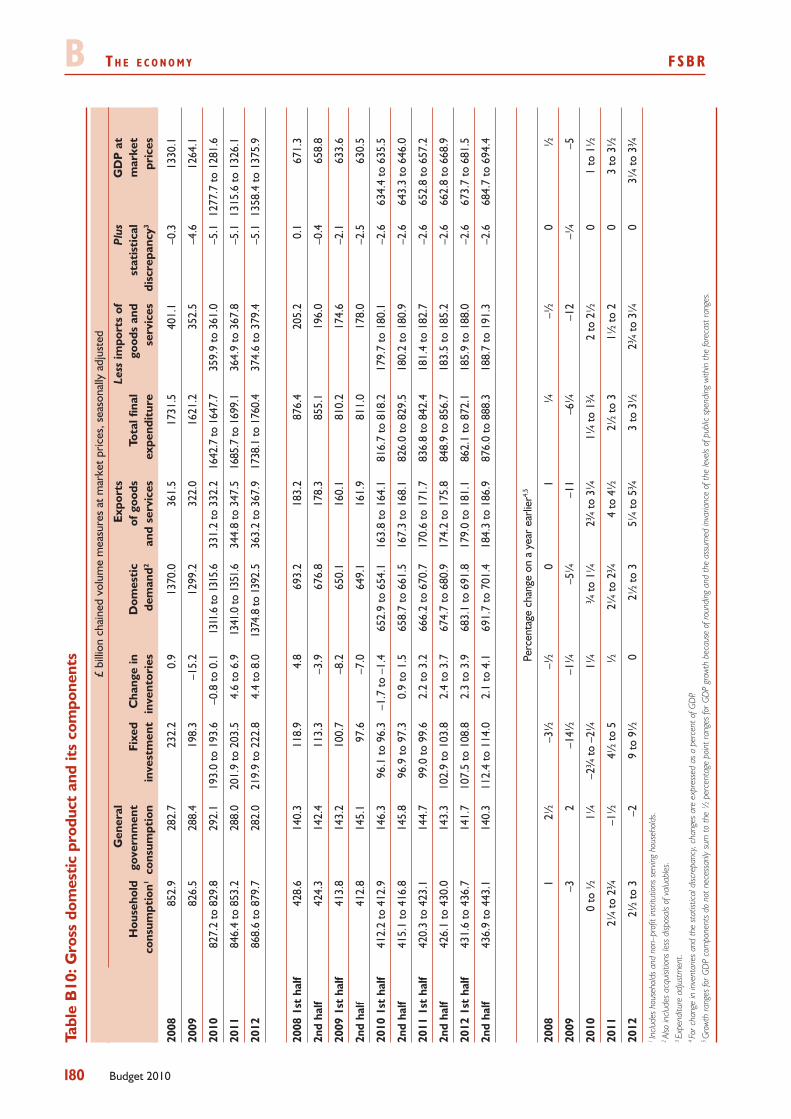
B T h e e c o n o m y FSBR
180 Budget 2010
Tabl
e B
10: G
ross
dom
esti
c pr
oduc
t an
d it
s co
mpo
nent
s
£
billi
on c
hain
ed v
olum
e m
easu
res
at m
arke
t pr
ices
, sea
sona
lly a
djus
ted
G
ener
al
Ex
port
s
Less
impo
rts
of
Plus
G
DP
at
Hou
seho
ld
gove
rnm
ent
Fixe
d C
hang
e in
D
omes
tic
of g
oods
To
tal f
inal
go
ods
and
stat
isti
cal
mar
ket
co
nsum
ptio
n1 co
nsum
ptio
n in
vest
men
t in
vent
orie
s de
man
d2 an
d se
rvic
es
expe
ndit
ure
serv
ices
di
scre
panc
y3 pr
ices
2008
85
2.9
282.
7 23
2.2
0.9
1370
.0
361.
5 17
31.5
40
1.1
–0.3
13
30.1
2009
82
6.5
288.
4 19
8.3
–15.
2 12
99.2
32
2.0
1621
.2
352.
5 –4
.6
1264
.1
2010
82
7.2
to 8
29.8
29
2.1
193.
0 to
193
.6
–0.8
to 0
.1
1311
.6 to
131
5.6
331.
2 to
332
.2
1642
.7 to
164
7.7
359.
9 to
361
.0
–5.1
12
77.7
to 1
281.
6
2011
84
6.4
to 8
53.2
28
8.0
201.
9 to
203
.5
4.6
to 6
.9
1341
.0 to
135
1.6
344.
8 to
347
.5
1685
.7 to
169
9.1
364.
9 to
367
.8
–5.1
13
15.6
to 1
326.
1
2012
86
8.6
to 8
79.7
28
2.0
219.
9 to
222
.8
4.4
to 8
.0
1374
.8 to
139
2.5
363.
2 to
367
.9
1738
.1 to
176
0.4
374.
6 to
379
.4
–5.1
13
58.4
to 1
375.
9
2008
1st
hal
f 42
8.6
140.
3 11
8.9
4.8
693.
2 18
3.2
876.
4 20
5.2
0.1
671.
3
2nd
half
424.
3 14
2.4
113.
3 –3
.9
676.
8 17
8.3
855.
1 19
6.0
–0.4
65
8.8
2009
1st
hal
f 41
3.8
143.
2 10
0.7
–8.2
65
0.1
160.
1 81
0.2
174.
6 –2
.1
633.
6
2nd
half
412.
8 14
5.1
97.6
–7
.0
649.
1 16
1.9
811.
0 17
8.0
–2.5
63
0.5
2010
1st
hal
f 41
2.2
to 4
12.9
14
6.3
96.1
to 9
6.3
–1.7
to –
1.4
652.
9 to
654
.1
163.
8 to
164
.1
816.
7 to
818
.2
179.
7 to
180
.1
–2.6
63
4.4
to 6
35.5
2nd
half
415.
1 to
416
.8
145.
8 96
.9 to
97.
3 0.
9 to
1.5
65
8.7
to 6
61.5
16
7.3
to 1
68.1
82
6.0
to 8
29.5
18
0.2
to 1
80.9
–2
.6
643.
3 to
646
.0
2011
1st
hal
f 42
0.3
to 4
23.1
14
4.7
99.0
to 9
9.6
2.2
to 3
.2
666.
2 to
670
.7
170.
6 to
171
.7
836.
8 to
842
.4
181.
4 to
182
.7
–2.6
65
2.8
to 6
57.2
2nd
half
426.
1 to
430
.0
143.
3 10
2.9
to 1
03.8
2.
4 to
3.7
67
4.7
to 6
80.9
17
4.2
to 1
75.8
84
8.9
to 8
56.7
18
3.5
to 1
85.2
–2
.6
662.
8 to
668
.9
2012
1st
hal
f 43
1.6
to 4
36.7
14
1.7
107.
5 to
108
.8
2.3
to 3
.9
683.
1 to
691
.8
179.
0 to
181
.1
862.
1 to
872
.1
185.
9 to
188
.0
–2.6
67
3.7
to 6
81.5
2nd
half
436.
9 to
443
.1
140.
3 11
2.4
to 1
14.0
2.
1 to
4.1
69
1.7
to 7
01.4
18
4.3
to 1
86.9
87
6.0
to 8
88.3
18
8.7
to 1
91.3
–2
.6
684.
7 to
694
.4
Perc
enta
ge c
hang
e on
a y
ear
earli
er4,
5
2008
1
2½
–3½
–½
0
1 ¼
–½
0
½
2009
–3
2
–14½
–1
¼
–5¼
–1
1 –6
¼
–12
–¼
–5
2010
0
to ½
1¼
–2
¾ to
–2¼
1¼
¾
to 1
¼
2¾ to
3¼
1¼
to 1
¾
2 to
2½
0
1 to
1½
2011
2¼
to 2
¾
–1½
4½
to 5
½
2¼
to 2
¾
4 to
4½
2½
to 3
1½
to 2
0
3 to
3½
2012
2½
to 3
–2
9
to 9
½
0 2½
to 3
5¼
to 5
¾
3 to
3½
2¾
to 3
¼
0 3¼
to 3
¾1 I
nclu
des
hous
ehol
ds a
nd n
on–p
rofit
inst
itutio
ns s
ervin
g ho
useh
olds
.2 A
lso in
clude
s ac
quisi
tions
less
disp
osal
s of
val
uabl
es.
3 Exp
endi
ture
adj
ustm
ent.
4 For
cha
nge
in in
vent
orie
s an
d th
e st
atist
ical d
iscre
panc
y, ch
ange
s ar
e ex
pres
sed
as a
per
cent
of G
DP.
5 Gro
wth
rang
es fo
r GD
P co
mpo
nent
s do
not
nec
essa
rily
sum
to th
e ½
per
cent
age
poin
t ran
ges
for G
DP
grow
th b
ecau
se o
f rou
ndin
g an
d th
e as
sum
ed in
varia
nce
of th
e le
vels
of p
ublic
spe
ndin
g wi
thin
the
fore
cast
rang
es.

181Budget 2010
C T h e p u b l i c f i n a n c e s
The financial crisis and global downturn have had a profound and persistent impact on the public finances, resulting in a significant increase in government borrowing and debt. Responding to these developments, in line with its fiscal objectives, the Government’s fiscal strategy has been to:
base policy decisions on a realistic fiscal forecast, based on a range of assumptions, some of •which are designed to provide caution to allow for uncertainty;
set out a credible plan for delivering a sustained consolidation over the medium term, •to ensure sound public finances and create space in the short term for continued fiscal support;
ensure that the fiscal policy framework is set to deliver the Government’s fiscal policy •objectives given the outlook for the public finances and the economy; and
minimise the long-term cost of debt issuance, subject to risk, and reduce refinancing risk, all •else equal, by issuing a larger proportion of long-maturity and index-linked gilts.
Chapter 2 sets out the action the Government is taking to achieve these goals. This chapter presents more detailed information on the fiscal projections, consistent with the Code for fiscal stability.
This chapter explains the latest public finance outturns and the fiscal projections in C.1 more detail1. It includes:
five-year projections of the current budget, the cyclically-adjusted current •budget, public sector net borrowing and public sector net debt;
detailed analyses of the outlook for government receipts and expenditure;•
analysis of the impact of the financial interventions on the public finances; •and
information on the financing requirement.•
The Budget presents information on the public finances on two different bases:C.2
including the temporary effects of financial interventions• . These measures include the temporary effects from, for example, the inclusion of the balance sheets and operations of banks classified to the public sector; and
excluding the temporary effects of financial interventions.• These measures remove the temporary effects of financial interventions on the fiscal aggregates but retain the permanent effects which are recorded as they occur.
The long-term impact of the financial interventions on the taxpayer and the C.3 sustainability of the public finances will be determined by the eventual net profit or loss on these interventions. The Government’s assessment of the fiscal position therefore uses the basis which excludes the temporary effects of the interventions and accounts for these permanent effects. Fiscal aggregates in this chapter are presented on this basis unless otherwise stated.
1 For further detail see Budget 2010: the economy and public finances – supplementary material. This includes tables on public expenditure and sub-sector and economic category analyses, and conventions used in presenting the public finances.
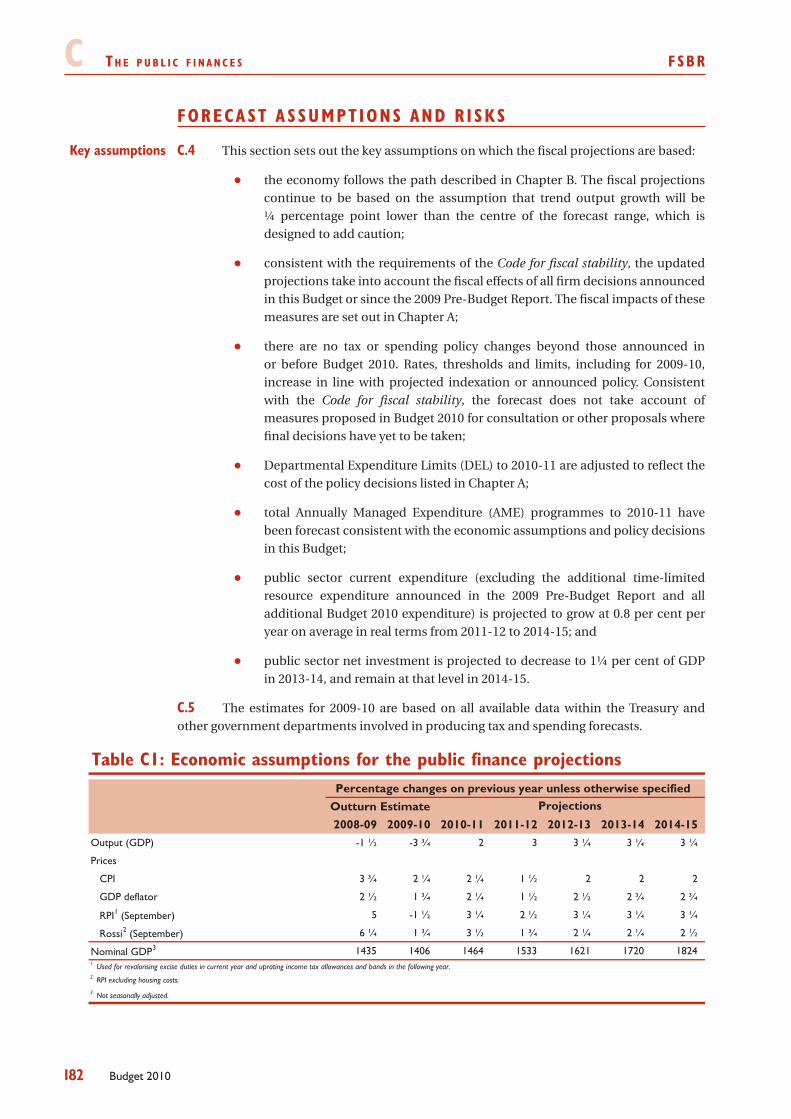
c T h e p u b l i c f i n a n c e s fsbR
182 Budget 2010
FORECA ST A SSUMPT IONS AND R ISKS
C.4 This section sets out the key assumptions on which the fiscal projections are based:
the economy follows the path described in Chapter B. The fiscal projections •continue to be based on the assumption that trend output growth will be ¼ percentage point lower than the centre of the forecast range, which is designed to add caution;
consistent with the requirements of the • Code for fiscal stability, the updated projections take into account the fiscal effects of all firm decisions announced in this Budget or since the 2009 Pre-Budget Report. The fiscal impacts of these measures are set out in Chapter A;
there are no tax or spending policy changes beyond those announced in •or before Budget 2010. Rates, thresholds and limits, including for 2009-10, increase in line with projected indexation or announced policy. Consistent with the Code for fiscal stability, the forecast does not take account of measures proposed in Budget 2010 for consultation or other proposals where final decisions have yet to be taken;
Departmental Expenditure Limits (DEL) to 2010-11 are adjusted to reflect the •cost of the policy decisions listed in Chapter A;
total Annually Managed Expenditure (AME) programmes to 2010-11 have •been forecast consistent with the economic assumptions and policy decisions in this Budget;
public sector current expenditure (excluding the additional time-limited •resource expenditure announced in the 2009 Pre-Budget Report and all additional Budget 2010 expenditure) is projected to grow at 0.8 per cent per year on average in real terms from 2011-12 to 2014-15; and
public sector net investment is projected to decrease to 1¼ per cent of GDP •in 2013-14, and remain at that level in 2014-15.
The estimates for 2009-10 are based on all available data within the Treasury and C.5 other government departments involved in producing tax and spending forecasts.
Table C1: Economic assumptions for the public finance projectionsPercentage changes on previous year unless otherwise specified
Outturn Estimate2008-09 2009-10 2010-11 2011-12 2012-13 2013-14 2014-15
Output (GDP) -1 ½ -3 ¾ 2 3 3 ¼ 3 ¼ 3 ¼
Prices
CPI 3 ¾ 2 ¼ 2 ¼ 1 ½ 2 2 2
GDP deflator 2 ½ 1 ¾ 2 ¼ 1 ½ 2 ½ 2 ¾ 2 ¾
RPI1 (September) 5 -1 ½ 3 ¼ 2 ½ 3 ¼ 3 ¼ 3 ¼
Rossi2 (September) 6 ¼ 1 ¾ 3 ½ 1 ¾ 2 ¼ 2 ¼ 2 ½
Nominal GDP3 1435 1406 1464 1533 1621 1720 1824
3 Not seasonally adjusted.
1 Used for revalorising excise duties in current year and uprating income tax allowances and bands in the following year.
Projections
2 RPI excluding housing costs.
Key assumptions
fsbR T h e p u b l i c f i n a n c e s c
183Budget 2010
C.6 The fiscal balances represent the difference between the two large aggregates of expenditure and receipts, and forecasts are inevitably subject to wide margins of uncertainty. This is particularly the case at times such as now when the economy is recovering from significant shocks. The uncertainty surrounding economic prospects at the current time therefore implies greater than usual risks surrounding the public finance projections.
Risks to specific tax and spending projections are discussed in further detail in C.7 subsequent sections. A number of key risks relate to the economic determinants that underpin the fiscal projections. The Budget projections assume a return to above-trend levels of economic growth in 2011-12 which drives a recovery in cyclical tax receipts. The projections also assume a recovery in labour income and consumption, though at lower rates of growth than forecast for nominal GDP. These determinants are the key drivers of the forecasts of income tax and VAT receipts.
On the spending side, two key determinants are the claimant count and gilt rates. C.8 For the claimant count, the fiscal forecast uses the NAO assumption based on the average of independent forecasts. Under that convention, unemployment rises from 1.62 million at the end of 2009 to 1.74 million at the end of 2010 and is then flat across the projection period. A change in the claimant count of 100,000 is equal on an approximate ready-reckoner basis to a change of around £0.5 billion in social security payments.2 Interest rates applying to new issuance of Government gilts are a key driver of the forecast for the cost of funding Government debt. The projections use market expectations of gilt rates, in line with the NAO assumption, which are currently low by historical standards.
C.9 The use of assumptions audited by the National Audit Office (NAO) under the three-year rolling review process is designed to add caution into the public finance projections. Details of the audited assumptions are given in Box C1. For Budget 2010, the Comptroller and Auditor General audited the assumptions on the VAT gap, tobacco revenues, factor income shares and funding.
C.10 For Budget 2010, the Comptroller and Auditor General has audited the Treasury’s assumption for VAT revenues. He concluded that the overall approach for estimating the VAT gap was reasonable and cautious over the rolling review period and remains reasonable for the future. He noted that there has been significant volatility around the growth of the VAT gap in recent years and recommended that the Treasury should consider whether to do more to assess factors, such as VAT debt levels, that may be causes of this volatility.
C.11 The Comptroller and Auditor General has also audited the tobacco revenues assumption used for the Treasury’s public finance projections. The report concluded that over the rolling review period the assumption proved cautious. He noted that in the short term the assumption may be susceptible to the uncertainty of the current economic conditions, but includes a safeguard that a faster rate of decline in duty-paid cigarettes can be assumed if necessary, which introduces an element of caution, to the extent that a faster rate of decline can be forecast in advance. He recommended that the Treasury should keep under review the impact of other factors, such as current economic uncertainties and the impact of legislative changes on cigarette consumption.
2 The ‘ready-reckoned’ impact of an NAO assumption or economic determinant on the public finances is an approximate estimate which has been made by varying the assumption in the appropriate receipts or expenditure forecast model. However these estimates should be treated with caution as the actual impact will depend crucially on the particular set of economic conditions at the time of the change. In addition these estimates measure only the direct effects and not the wider indirect effects.
Forecast differences and
risks
The use of NAO-audited assumptions
VAT gap assumption
Tobacco revenues assumption
c T h e p u b l i c f i n a n c e s fsbR
184 Budget 2010
C.12 The Comptroller and Auditor General concluded that the factor shares assumption was reasonable over the rolling review period and remains reasonable. He recommended that the Treasury should consider further investigation of the impact of cyclical factors on the relative proportions of labour and profits shares in domestic income, to provide additional checks on the reasonableness of the approach.
C.13 The review also covered the funding assumption used for the Treasury’s public finance projections. The Comptroller and Auditor General confirmed that, through the audit period of Budget 2007 to the 2009 Pre-Budget Report, the figures for government borrowing used to calculate debt interest payments in the relevant Budget or Pre-Budget Report were consistent with the forecast of government borrowing and that they reflected the policy assumptions in the relevant Debt and Reserves Management Report, and that the data input to the Treasury’s economic forecasting system was consistent with the detailed forecast of debt interest as stated in the relevant Budget or Pre-Budget Report. No other assumptions were due for review at this Budget.
Factor income shares
assumption
Funding assumption
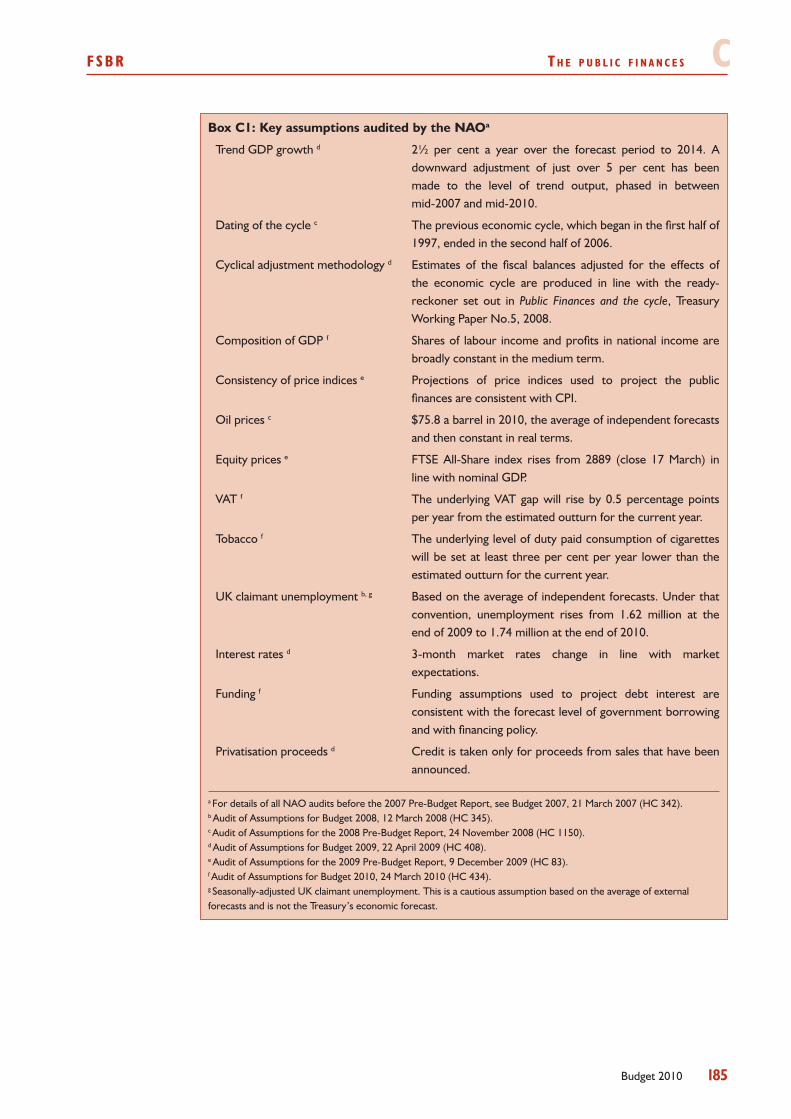
fsbR T h e p u b l i c f i n a n c e s c
185Budget 2010
Box C1: Key assumptions audited by the NAOa
Trend GDP growth d 2½ per cent a year over the forecast period to 2014. A downward adjustment of just over 5 per cent has been made to the level of trend output, phased in between mid-2007 and mid-2010.
Dating of the cycle c The previous economic cycle, which began in the first half of 1997, ended in the second half of 2006.
Cyclical adjustment methodology d Estimates of the fiscal balances adjusted for the effects of the economic cycle are produced in line with the ready-reckoner set out in Public Finances and the cycle, Treasury Working Paper No.5, 2008.
Composition of GDP f Shares of labour income and profits in national income are broadly constant in the medium term.
Consistency of price indices e Projections of price indices used to project the public finances are consistent with CPI.
Oil prices c $75.8 a barrel in 2010, the average of independent forecasts and then constant in real terms.
Equity prices e FTSE All-Share index rises from 2889 (close 17 March) in line with nominal GDP.
VAT f The underlying VAT gap will rise by 0.5 percentage points per year from the estimated outturn for the current year.
Tobacco f The underlying level of duty paid consumption of cigarettes will be set at least three per cent per year lower than the estimated outturn for the current year.
UK claimant unemployment b, g Based on the average of independent forecasts. Under that convention, unemployment rises from 1.62 million at the end of 2009 to 1.74 million at the end of 2010.
Interest rates d 3-month market rates change in line with market expectations.
Funding f Funding assumptions used to project debt interest are consistent with the forecast level of government borrowing and with financing policy.
Privatisation proceeds d Credit is taken only for proceeds from sales that have been announced.
a For details of all NAO audits before the 2007 Pre-Budget Report, see Budget 2007, 21 March 2007 (HC 342).b Audit of Assumptions for Budget 2008, 12 March 2008 (HC 345).c Audit of Assumptions for the 2008 Pre-Budget Report, 24 November 2008 (HC 1150).d Audit of Assumptions for Budget 2009, 22 April 2009 (HC 408).e Audit of Assumptions for the 2009 Pre-Budget Report, 9 December 2009 (HC 83).f Audit of Assumptions for Budget 2010, 24 March 2010 (HC 434).g Seasonally-adjusted UK claimant unemployment. This is a cautious assumption based on the average of external forecasts and is not the Treasury’s economic forecast.
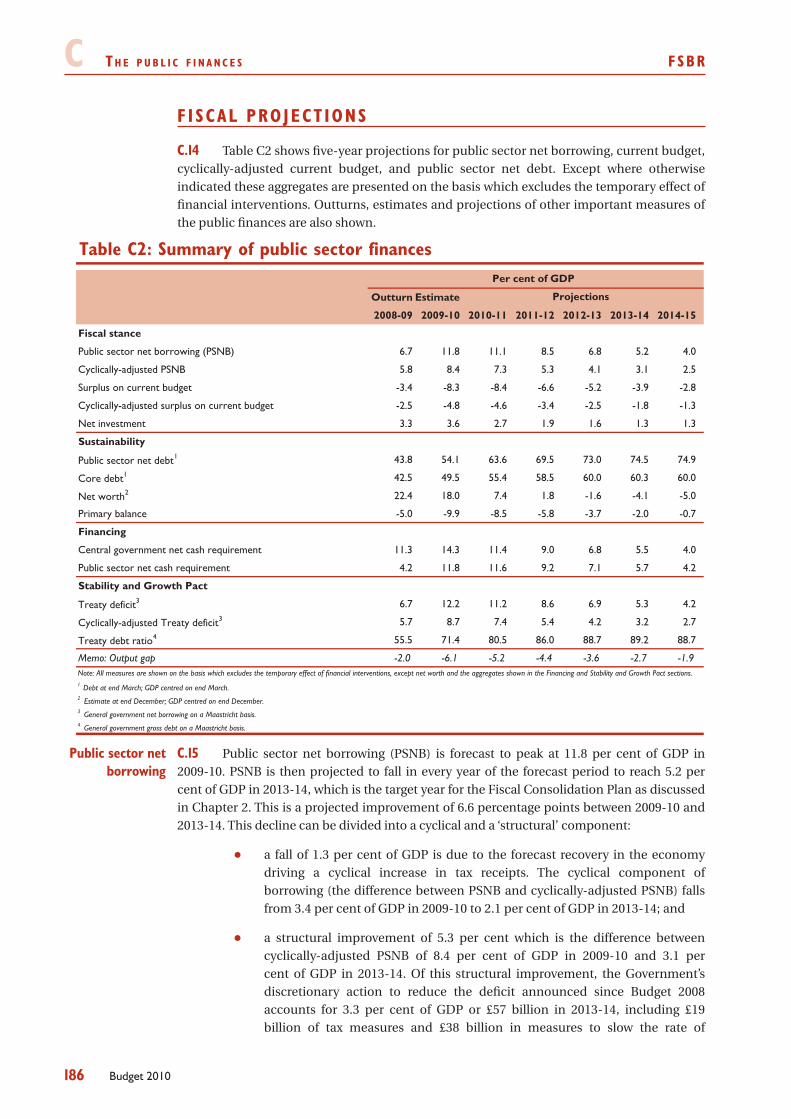
c T h e p u b l i c f i n a n c e s fsbR
186 Budget 2010
F ISCAL PROJECT IONS
Table C2 shows five-year projections for public sector net borrowing, current budget, C.14 cyclically-adjusted current budget, and public sector net debt. Except where otherwise indicated these aggregates are presented on the basis which excludes the temporary effect of financial interventions. Outturns, estimates and projections of other important measures of the public finances are also shown.
Table C2: Summary of public sector finances
Outturn Estimate
2008-09 2009-10 2010-11 2011-12 2012-13 2013-14 2014-15
Fiscal stance
Public sector net borrowing (PSNB) 6.7 11.8 11.1 8.5 6.8 5.2 4.0
Cyclically-adjusted PSNB 5.8 8.4 7.3 5.3 4.1 3.1 2.5
Surplus on current budget -3.4 -8.3 -8.4 -6.6 -5.2 -3.9 -2.8
Cyclically-adjusted surplus on current budget -2.5 -4.8 -4.6 -3.4 -2.5 -1.8 -1.3
Net investment 3.3 3.6 2.7 1.9 1.6 1.3 1.3
Sustainability
Public sector net debt1 43.8 54.1 63.6 69.5 73.0 74.5 74.9
Core debt1 42.5 49.5 55.4 58.5 60.0 60.3 60.0
Net worth2 22.4 18.0 7.4 1.8 -1.6 -4.1 -5.0
Primary balance -5.0 -9.9 -8.5 -5.8 -3.7 -2.0 -0.7
Financing
Central government net cash requirement 11.3 14.3 11.4 9.0 6.8 5.5 4.0
Public sector net cash requirement 4.2 11.8 11.6 9.2 7.1 5.7 4.2
Stability and Growth Pact
Treaty deficit3 6.7 12.2 11.2 8.6 6.9 5.3 4.2
Cyclically-adjusted Treaty deficit3 5.7 8.7 7.4 5.4 4.2 3.2 2.7
Treaty debt ratio4 55.5 71.4 80.5 86.0 88.7 89.2 88.7
Memo: Output gap -2.0 -6.1 -5.2 -4.4 -3.6 -2.7 -1.9
1 Debt at end March; GDP centred on end March.2 Estimate at end December; GDP centred on end December.3 General government net borrowing on a Maastricht basis. 4 General government gross debt on a Maastricht basis.
Per cent of GDP
Projections
Note: All measures are shown on the basis which excludes the temporary effect of financial interventions, except net worth and the aggregates shown in the Financing and Stability and Growth Pact sections.
C.15 Public sector net borrowing (PSNB) is forecast to peak at 11.8 per cent of GDP in 2009-10. PSNB is then projected to fall in every year of the forecast period to reach 5.2 per cent of GDP in 2013-14, which is the target year for the Fiscal Consolidation Plan as discussed in Chapter 2. This is a projected improvement of 6.6 percentage points between 2009-10 and 2013-14. This decline can be divided into a cyclical and a ‘structural’ component:
a fall of 1.3 per cent of GDP is due to the forecast recovery in the economy •driving a cyclical increase in tax receipts. The cyclical component of borrowing (the difference between PSNB and cyclically-adjusted PSNB) falls from 3.4 per cent of GDP in 2009-10 to 2.1 per cent of GDP in 2013-14; and
a structural improvement of 5.3 per cent which is the difference between •cyclically-adjusted PSNB of 8.4 per cent of GDP in 2009-10 and 3.1 per cent of GDP in 2013-14. Of this structural improvement, the Government’s discretionary action to reduce the deficit announced since Budget 2008 accounts for 3.3 per cent of GDP or £57 billion in 2013-14, including £19 billion of tax measures and £38 billion in measures to slow the rate of
Public sector net borrowing
fsbR T h e p u b l i c f i n a n c e s c
187Budget 2010
spending growth. Around a further 1 per cent of GDP is due to the reversal of the measures introduced to support the economy in 2009-10, such as the VAT rate reduction and capital spending. The assumptions in place to reduce the rate of spending growth from before Budget 2008 also contribute to the reduction in borrowing. The remaining structural improvement is due to a projected rise in receipts not allowed for in the cyclical adjustment methodology, for example from a recovery in the financial and housing sectors.
In 2010-11 PSNB falls by 0.7 per cent of GDP compared to 2009-10. After falling C.16 sharply in 2009-10, nominal tax receipts rise in 2010-11 reflecting the economic recovery and the reversal of the VAT rate cut. In total the Government’s measures to support the economy increased borrowing in 2009-10 compared to 2010-11 by around 1 per cent of GDP. Part of the underlying growth in receipts in 2010-11 is due to a recovery in receipts from the housing and financial sectors, which fell very sharply in 2009-10 as a result of the financial crisis. Wider corporation tax receipts are also expected to recover more sharply than after previous recessions, in part due to changes in the payment regime.
C.17 The Budget projections show that the current budget is in deficit throughout the forecast period, peaking at 8.4 per cent of GDP in 2010-11, and then falling to 2.8 per cent by 2014-15. The current budget peaks a year later than public sector net borrowing, reflecting the profiles of current and capital spending. The cyclically-adjusted current budget, which removes the estimated effect of the economic cycle, falls from a deficit of 4.6 per cent of GDP in 2010-11 to 1.3 per cent in 2014-15.
C.18 Net investment rose to 3.6 per cent of GDP in 2009-10 and is projected to reach 2.7 per cent of GDP in 2010-11. Net investment will decrease to 1¼ per cent of GDP by 2013-14. In 2008-09 and 2009-10, net investment is increased by the portion of the Government’s capital injections into public sector banks that is scored as capital grants, as set out in further detail in the financial interventions section of this chapter.
C.19 Public sector net debt is projected to rise over the forecast period to a peak of 74.9 per cent of GDP in 2014-15. The projections for core debt, which excludes the estimated impact of the economic cycle, are expected to rise to 60.0 per cent in 2014-15.
C.20 Fiscal aggregates published by the Government, such as net debt and net worth, reflect public sector liabilities that have been accrued in the past and are certain to require future transfers to meet the obligations. In addition, there are provisions or contingent liabilities that may have to be met in the future but where the timing or existence of the liability is not certain. Measures based on Generally Accepted Accounting Practice (GAAP) take into account the extent to which past transactions have already committed future funding flows, such as nuclear decommissioning or public sector pensions. The Government has announced that it will publish a GAAP-based balance sheet as part of its move towards publishing Whole of Government Accounts (WGA) for 2009-10. When WGA are published for the year 2009-10, contingent liabilities will be disclosed as a note to the accounts. However, measures of contingent liability are subject to significant uncertainties, which limits the extent to which they can be used to determine fiscal policy in the short run.
C.21 Public sector financial and non-financial assets net of financial liabilities can be calculated to provide an estimated measure of net worth. Because capital spending financed by borrowing leaves net worth unaffected, this measure is the approximate stock counterpart of the current budget. On this measure, net worth is projected to become negative in the medium term as current borrowing continues. This borrowing reduces net worth, as it is not offset by an increase in the Government’s assets. As such measures include liabilities accrued to date that will have to be met in the future, but do not take account of future government
Current budget
Net investment
Net debt to GDP ratio
Contingent liabilities
Net worth
c T h e p u b l i c f i n a n c e s fsbR
188 Budget 2010
revenues, the concept of net worth is not comprehensive. Net worth is not used as a key indicator of the public finances, mainly as a result of the difficulties involved in accurately measuring many government assets and liabilities. The estimates of values of assets are subject to wide margins of error because they depend on broad assumptions, for example about asset lives, which may not be appropriate in all cases.
C.22 The central government net cash requirement (CGNCR) is projected to be 11.4 per cent of GDP in 2010-11 and is expected to fall to 4.0 per cent in 2014-15 as net borrowing falls. The impact on the CGNCR of the financial interventions is included in Table C14. The CGNCR in 2009-10 is now £22 billion lower than forecast at the Pre-Budget Report. This is driven by lower borrowing (due to higher receipts and lower accrued spending), lower cash transactions related to the financial sector interventions and lower cash spending. Full details are provided in the final section of this chapter. In 2008-09 and 2009-10, there was a large gap between PSNB and CGNCR, caused by substantial financial transactions associated with the financial sector interventions such as the equity injections. With the absence of such interventions in future years, this gap is small across the forecast period as shown in Table C14.
C.23 Table C2 shows the Treaty measures of debt and deficit used for the purposes of the Excessive Deficit Procedure – Article 126 (1) of the Treaty of Maastricht. The main difference between the Treaty deficit measure and PSNB is that the Treaty measure is calculated for general government only (central and local government) whereas PSNB covers the whole public sector and so also includes public corporations. Similarly, PSND includes public corporations while Treaty debt does not. In addition PSND is net of liquid assets such as the Official Reserves, while Treaty debt is a gross measure. The Treaty deficit is projected to fall from 11.2 per cent of GDP in 2010-11 to 4.2 per cent in 2014-15. Treaty debt is forecast to rise from 80.5 per cent of GDP in 2010-11 to 88.7 per cent in 2014-15.
Tables C3 and C4 provide more detail on the projections for the current and capital C.24 budgets. The current budget surplus is equal to public sector current receipts less public sector current expenditure and depreciation. The reasons for changes in receipts and current expenditure are explained in later sections.
Financing
Stability and Growth Pact
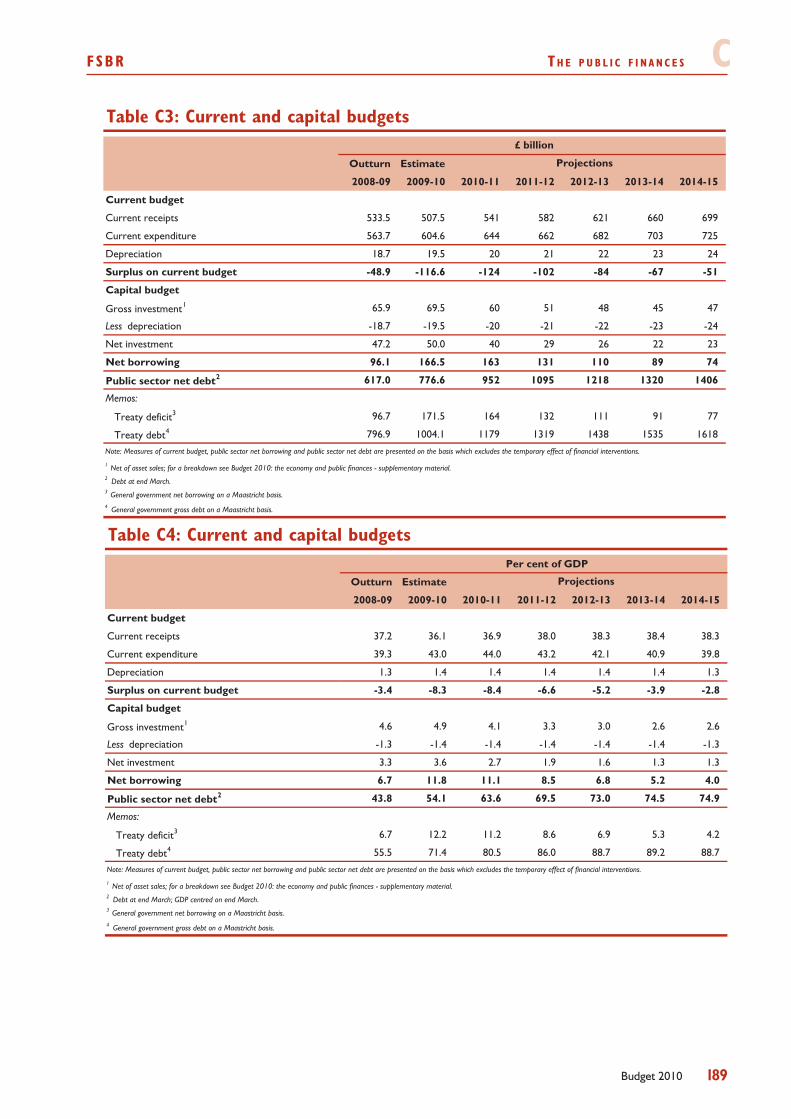
fsbR T h e p u b l i c f i n a n c e s c
189Budget 2010
Table C3: Current and capital budgets
Outturn Estimate
2008-09 2009-10 2010-11 2011-12 2012-13 2013-14 2014-15
Current budget
Current receipts 533.5 507.5 541 582 621 660 699
Current expenditure 563.7 604.6 644 662 682 703 725
Depreciation 18.7 19.5 20 21 22 23 24
Surplus on current budget -48.9 -116.6 -124 -102 -84 -67 -51
Capital budget
Gross investment1 65.9 69.5 60 51 48 45 47
Less depreciation -18.7 -19.5 -20 -21 -22 -23 -24
Net investment 47.2 50.0 40 29 26 22 23
Net borrowing 96.1 166.5 163 131 110 89 74
Public sector net debt2 617.0 776.6 952 1095 1218 1320 1406
Memos:
Treaty deficit3 96.7 171.5 164 132 111 91 77
Treaty debt4 796.9 1004.1 1179 1319 1438 1535 1618
1 Net of asset sales; for a breakdown see Budget 2010: the economy and public finances - supplementary material.2 Debt at end March.3 General government net borrowing on a Maastricht basis. 4 General government gross debt on a Maastricht basis.
£ billion
Projections
Note: Measures of current budget, public sector net borrowing and public sector net debt are presented on the basis which excludes the temporary effect of financial interventions.
Table C4: Current and capital budgets
Per cent of GDP
Outturn Estimate
2008-09 2009-10 2010-11 2011-12 2012-13 2013-14 2014-15
Current budget
Current receipts 37.2 36.1 36.9 38.0 38.3 38.4 38.3
Current expenditure 39.3 43.0 44.0 43.2 42.1 40.9 39.8
Depreciation 1.3 1.4 1.4 1.4 1.4 1.4 1.3
Surplus on current budget -3.4 -8.3 -8.4 -6.6 -5.2 -3.9 -2.8
Capital budget
Gross investment1 4.6 4.9 4.1 3.3 3.0 2.6 2.6
Less depreciation -1.3 -1.4 -1.4 -1.4 -1.4 -1.4 -1.3
Net investment 3.3 3.6 2.7 1.9 1.6 1.3 1.3
Net borrowing 6.7 11.8 11.1 8.5 6.8 5.2 4.0
Public sector net debt2 43.8 54.1 63.6 69.5 73.0 74.5 74.9
Memos:
Treaty deficit3 6.7 12.2 11.2 8.6 6.9 5.3 4.2
Treaty debt4 55.5 71.4 80.5 86.0 88.7 89.2 88.7
1 Net of asset sales; for a breakdown see Budget 2010: the economy and public finances - supplementary material.2 Debt at end March; GDP centred on end March.3 General government net borrowing on a Maastricht basis. 4 General government gross debt on a Maastricht basis.
Projections
Note: Measures of current budget, public sector net borrowing and public sector net debt are presented on the basis which excludes the temporary effect of financial interventions.
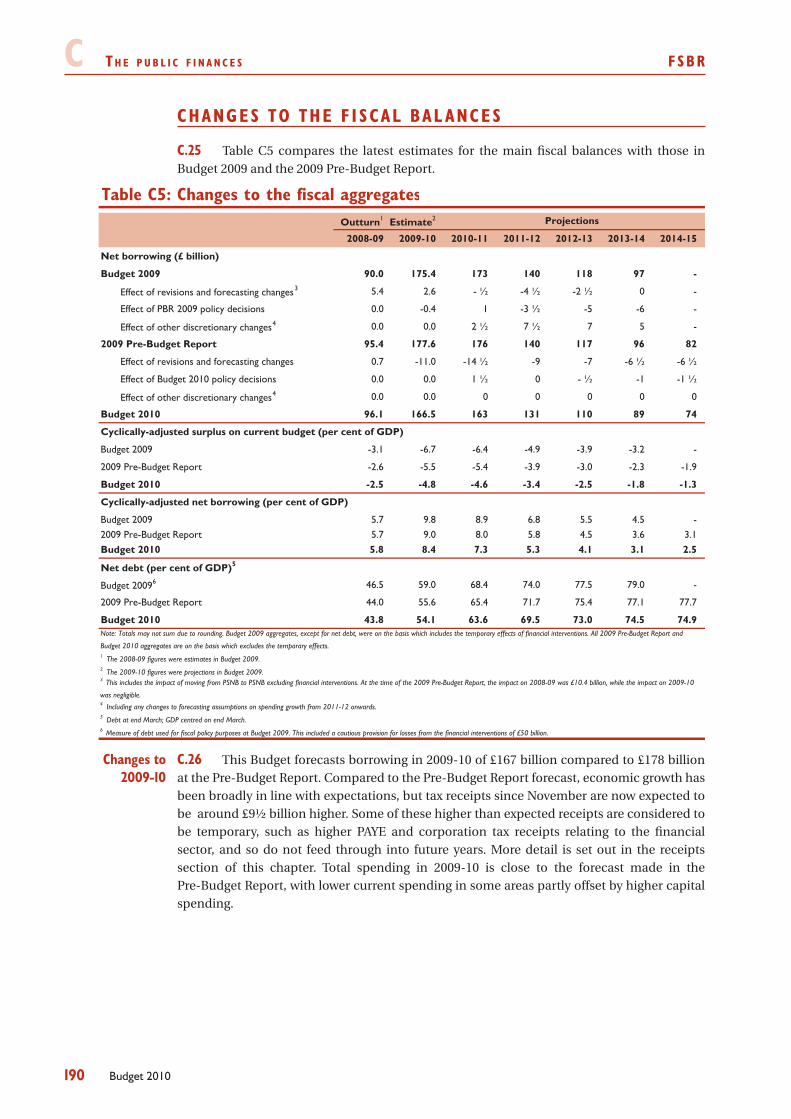
c T h e p u b l i c f i n a n c e s fsbR
190 Budget 2010
CHANGES TO THE F I SCAL BAL ANCES
Table C5 compares the latest estimates for the main fiscal balances with those in C.25 Budget 2009 and the 2009 Pre-Budget Report.
Outturn1 Estimate2
2008-09 2009-10 2010-11 2011-12 2012-13 2013-14 2014-15
Net borrowing (£ billion)
Budget 2009 90.0 175.4 173 140 118 97 -
Effect of revisions and forecasting changes3 5.4 2.6 - ½ -4 ½ -2 ½ 0 -
Effect of PBR 2009 policy decisions 0.0 -0.4 1 -3 ½ -5 -6 -
Effect of other discretionary changes4 0.0 0.0 2 ½ 7 ½ 7 5 -
2009 Pre-Budget Report 95.4 177.6 176 140 117 96 82
Effect of revisions and forecasting changes 0.7 -11.0 -14 ½ -9 -7 -6 ½ -6 ½
Effect of Budget 2010 policy decisions 0.0 0.0 1 ½ 0 - ½ -1 -1 ½
Effect of other discretionary changes4 0.0 0.0 0 0 0 0 0
Budget 2010 96.1 166.5 163 131 110 89 74
Cyclically-adjusted surplus on current budget (per cent of GDP)
Budget 2009 -3.1 -6.7 -6.4 -4.9 -3.9 -3.2 -
2009 Pre-Budget Report -2.6 -5.5 -5.4 -3.9 -3.0 -2.3 -1.9
Budget 2010 -2.5 -4.8 -4.6 -3.4 -2.5 -1.8 -1.3
Cyclically-adjusted net borrowing (per cent of GDP)
Budget 2009 5.7 9.8 8.9 6.8 5.5 4.5 -2009 Pre-Budget Report 5.7 9.0 8.0 5.8 4.5 3.6 3.1Budget 2010 5.8 8.4 7.3 5.3 4.1 3.1 2.5
Net debt (per cent of GDP)5
Budget 20096 46.5 59.0 68.4 74.0 77.5 79.0 -
2009 Pre-Budget Report 44.0 55.6 65.4 71.7 75.4 77.1 77.7
Budget 2010 43.8 54.1 63.6 69.5 73.0 74.5 74.9
1 The 2008-09 figures were estimates in Budget 2009.2 The 2009-10 figures were projections in Budget 2009.
4 Including any changes to forecasting assumptions on spending growth from 2011-12 onwards.5 Debt at end March; GDP centred on end March.6 Measure of debt used for fiscal policy purposes at Budget 2009. This included a cautious provision for losses from the financial interventions of £50 billion.
Projections
Table C5: Changes to the fiscal aggregates
Note: Totals may not sum due to rounding. Budget 2009 aggregates, except for net debt, were on the basis which includes the temporary effects of financial interventions. All 2009 Pre-Budget Report and
Budget 2010 aggregates are on the basis which excludes the temporary effects.
3 This includes the impact of moving from PSNB to PSNB excluding financial interventions. At the time of the 2009 Pre-Budget Report, the impact on 2008-09 was £10.4 billion, while the impact on 2009-10
was negligible.
C.26 This Budget forecasts borrowing in 2009-10 of £167 billion compared to £178 billion at the Pre-Budget Report. Compared to the Pre-Budget Report forecast, economic growth has been broadly in line with expectations, but tax receipts since November are now expected to be around £9½ billion higher. Some of these higher than expected receipts are considered to be temporary, such as higher PAYE and corporation tax receipts relating to the financial sector, and so do not feed through into future years. More detail is set out in the receipts section of this chapter. Total spending in 2009-10 is close to the forecast made in the Pre-Budget Report, with lower current spending in some areas partly offset by higher capital spending.
Changes to 2009-10
fsbR T h e p u b l i c f i n a n c e s c
191Budget 2010
C.27 Borrowing in 2010-11 at £163 billion is £13 billion lower than at the Pre-Budget Report. Forecasting changes reduce borrowing by £14½ billion, offset by approximately £1½ billion of policy changes announced in this Budget. Some of the stronger than expected receipts in the final months of 2009-10 are expected to be sustained into 2010-11. Other one-off factors also raise expected receipts in 2010-11, including the temporary Bank Payroll Tax which adds an additional £2 billion of gross receipts in 2010-11. At the time of the Pre-Budget Report it was assumed this tax would accrue to 2009-10. The ONS have now decided that in line with Eurostat guidelines it should accrue to the point at which the tax passes into law which is assumed to be in 2010-11.
Total expenditure in 2010-11 is expected to be around £2.7 billion lower than at the C.28 time of the Pre-Budget Report. Debt interest payments in 2010-11 are around £2.9 billion lower than forecast at the Pre-Budget Report due to a reduced cash requirement in 2009-10 and 2010-11 and updated information on the DMO’s gilt issuance strategy. In line with normal convention the AME margin has been reset at £1 billion for 2010-11, compared to £2 billion at the Pre-Budget Report.
C.29 The forecast for GDP growth in 2011 has been reduced to 3 to 3½ per cent. The fiscal forecast is based on the lower end of the forecast range, at 3 per cent. Recent developments suggest that this growth will be less tax-rich due to lower forecast earnings and consumption. This reduces medium-term receipts growth slightly compared to the Pre-Budget Report, which partially offsets the impact of higher than expected receipts in 2009-10.
Public sector current expenditure from 2011-12 grows at the Pre-Budget Report C.30 assumption of 0.8 per cent per year in real terms from 2010-11 levels. With spending in 2010-11 lower than at the Pre-Budget Report, as set out above, current expenditure is therefore around £3.5 billion lower each year in the medium-term.
Overall, forecasting changes reduce borrowing by around £14½ billion in 2010-11 and C.31 by £6½ billion in 2014-15. The impact of policy measures announced in this Budget reduces borrowing by a further £1½ billion in 2014-15. By 2014-15, borrowing is around £8 billion lower than forecast at the Pre-Budget Report and reaches 4.0 per cent of GDP.
Public sector net debt is now forecast to peak at 74.9 per cent of GDP in 2014-15. C.32 This is 2.8 per cent of GDP lower than forecast at the Pre-Budget Report, driven by lower projected borrowing over the forecast period. Debt in 2013-14 is now projected to be 4.5 per cent of GDP lower than the measure of debt used for fiscal policy purposes at Budget 2009. This partly reflects a reduction in the estimate of net losses from the financial interventions from £50 billion at Budget 2009 (3½ per cent of GDP) to around £10 billion at the 2009 Pre-Budget Report as the Asset Protection Scheme (APS) was finalised and risks receded.
RECE IPTS
This section analyses the projections for tax receipts in detail. It begins by looking C.33 at the main determinants of changes in the overall projections since the 2009 Pre-Budget Report, before looking at changes in the projections of individual tax receipts. Finally it provides updated forecasts for the tax-GDP ratio. Box C2 describes the caution inherent in the fiscal forecast, and Box C3 describes the impact of the financial and housing sectors on receipts.
Changes to 2010-11
Changes from 2011-12
c T h e p u b l i c f i n a n c e s fsbR
192 Budget 2010
Changes i n to ta l r e ce ip t s s i n ce the 2009 Pre -Budge t Repor t
Tax receipts in the months since the 2009 Pre-Budget Report have been around C.34 £9½ billion higher than expected. Self-assessed (SA) income tax paid in January 2010 related to economic activity in 2008-09 at the worst point of the downturn. Receipts of SA income tax fell by 3.2 per cent compared to last year but were higher than the forecast at the Pre-Budget Report. VAT receipts since the Pre-Budget Report have also been stronger than expected, partly because businesses have repaid more VAT debt than expected, and possibly due to stronger consumer spending ahead of the standard rate of VAT reverting to 17.5 per cent and the end of the Government’s scrappage schemes. In addition, financial sector profits have boosted corporation tax and PAYE from financial sector bonuses. Some of these higher than expected receipts are considered to be temporary such as the additional corporation tax and PAYE from the financial sector. In the medium term, much of this strength in receipts is offset by the reduced forecast of GDP growth in 2010-11, and by lower earnings and consumption growth.
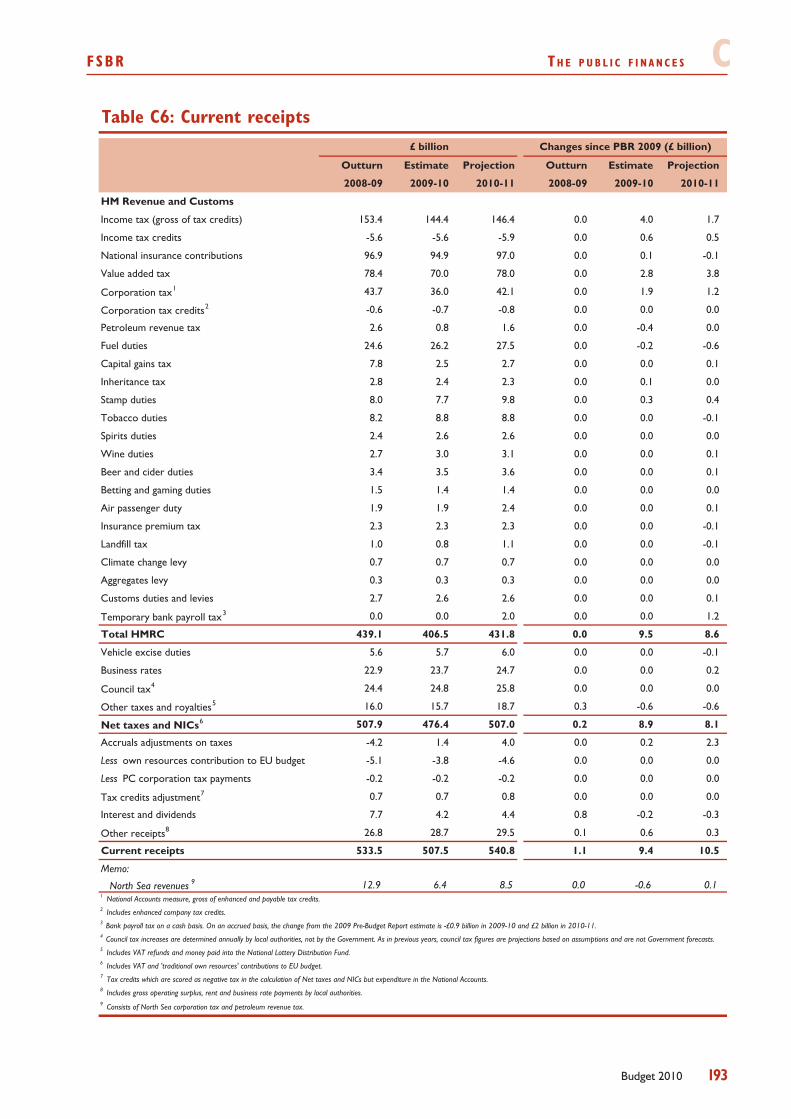
fsbR T h e p u b l i c f i n a n c e s c
193Budget 2010
Outturn Estimate Projection Outturn Estimate Projection
2008-09 2009-10 2010-11 2008-09 2009-10 2010-11
HM Revenue and Customs
Income tax (gross of tax credits) 153.4 144.4 146.4 0.0 4.0 1.7
Income tax credits -5.6 -5.6 -5.9 0.0 0.6 0.5
National insurance contributions 96.9 94.9 97.0 0.0 0.1 -0.1
Value added tax 78.4 70.0 78.0 0.0 2.8 3.8
Corporation tax1 43.7 36.0 42.1 0.0 1.9 1.2
Corporation tax credits2 -0.6 -0.7 -0.8 0.0 0.0 0.0
Petroleum revenue tax 2.6 0.8 1.6 0.0 -0.4 0.0
Fuel duties 24.6 26.2 27.5 0.0 -0.2 -0.6
Capital gains tax 7.8 2.5 2.7 0.0 0.0 0.1
Inheritance tax 2.8 2.4 2.3 0.0 0.1 0.0
Stamp duties 8.0 7.7 9.8 0.0 0.3 0.4
Tobacco duties 8.2 8.8 8.8 0.0 0.0 -0.1
Spirits duties 2.4 2.6 2.6 0.0 0.0 0.0
Wine duties 2.7 3.0 3.1 0.0 0.0 0.1
Beer and cider duties 3.4 3.5 3.6 0.0 0.0 0.1
Betting and gaming duties 1.5 1.4 1.4 0.0 0.0 0.0
Air passenger duty 1.9 1.9 2.4 0.0 0.0 0.1
Insurance premium tax 2.3 2.3 2.3 0.0 0.0 -0.1
Landfill tax 1.0 0.8 1.1 0.0 0.0 -0.1
Climate change levy 0.7 0.7 0.7 0.0 0.0 0.0
Aggregates levy 0.3 0.3 0.3 0.0 0.0 0.0
Customs duties and levies 2.7 2.6 2.6 0.0 0.0 0.1
Temporary bank payroll tax3 0.0 0.0 2.0 0.0 0.0 1.2
Total HMRC 439.1 406.5 431.8 0.0 9.5 8.6
Vehicle excise duties 5.6 5.7 6.0 0.0 0.0 -0.1
Business rates 22.9 23.7 24.7 0.0 0.0 0.2
Council tax4 24.4 24.8 25.8 0.0 0.0 0.0
Other taxes and royalties5 16.0 15.7 18.7 0.3 -0.6 -0.6
Net taxes and NICs6 507.9 476.4 507.0 0.2 8.9 8.1
Accruals adjustments on taxes -4.2 1.4 4.0 0.0 0.2 2.3
Less own resources contribution to EU budget -5.1 -3.8 -4.6 0.0 0.0 0.0
Less PC corporation tax payments -0.2 -0.2 -0.2 0.0 0.0 0.0
Tax credits adjustment7 0.7 0.7 0.8 0.0 0.0 0.0
Interest and dividends 7.7 4.2 4.4 0.8 -0.2 -0.3
Other receipts8 26.8 28.7 29.5 0.1 0.6 0.3
Current receipts 533.5 507.5 540.8 1.1 9.4 10.5
Memo:
North Sea revenues 9 12.9 6.4 8.5 0.0 -0.6 0.1
Table C6: Current receipts Changes since PBR 2009 (£ billion)£ billion
1 National Accounts measure, gross of enhanced and payable tax credits.
9 Consists of North Sea corporation tax and petroleum revenue tax.
4 Council tax increases are determined annually by local authorities, not by the Government. As in previous years, council tax figures are projections based on assumptions and are not Government forecasts.
2 Includes enhanced company tax credits.
5 Includes VAT refunds and money paid into the National Lottery Distribution Fund.6 Includes VAT and 'traditional own resources' contributions to EU budget. 7 Tax credits which are scored as negative tax in the calculation of Net taxes and NICs but expenditure in the National Accounts.8 Includes gross operating surplus, rent and business rate payments by local authorities.
3 Bank payroll tax on a cash basis. On an accrued basis, the change from the 2009 Pre-Budget Report estimate is -£0.9 billion in 2009-10 and £2 billion in 2010-11.
c T h e p u b l i c f i n a n c e s fsbR
194 Budget 2010
Tax by t ax ana l y s i sTable C6 shows the main components of public sector receipts outturn for 2008-C.35
09, the estimate for 2009-10 and the projections for 2010-11, as well as the changes to the projections of individual taxes since the 2009 Pre-Budget Report. Table 2.9 in Budget 2010: the economy and public finances – supplementary material provides projections of individual taxes to 2014-15.
C.36 Cash receipts of income tax and NICs in 2009-10 are expected to be £4.1 billion above their 2009 Pre-Budget Report projection, reflecting higher than expected PAYE and NIC receipts as well as self-assessment receipts. The stronger PAYE and NIC receipts are mainly due to higher than forecast financial sector bonuses. Bonuses in the whole of the financial sector on which PAYE is payable are now expected to rise by 15 per cent on 2008-09 levels, while the Pre-Budget Report forecast a fall of more than 25 per cent relative to 2008-09. The Pre-Budget Report forecast was a cautious judgement based on the information available before bonus awards were agreed. Budget 2010 has updated this forecast based on further evidence from January and February PAYE receipts and firms’ compensation announcements. Income tax and NICs collected within the self-assessment system were around £2¼ billion higher than expected in 2009-10, although still lower than in 2008-09. The 2009 Pre-Budget Report incorporated a cautious estimate for 2009-10 reflecting the fact that these receipts relate to 2008-09 liabilities, when the economic downturn was at its most severe.
Some recovery in income tax and NICs receipts is expected in 2010-11 with survey C.37 measures starting to point towards an upturn in labour demand, but receipts will continue to be held back by the low level of pay settlements. The 2010-11 forecast allows for the Budget 2009 measure for a 50 per cent rate of income tax on incomes above £150,000. However, self-assessment receipts are expected to fall further in 2010-11, since these refer to 2009-10 liabilities.
Growth in income tax and NICs picks up from 2011-12 onwards, in part because of C.38 the rise in National Insurance rates. Earnings growth remains more subdued for longer than assumed in the 2009 Pre-Budget Report forecast. This contributes to growth in wages and salaries, the key driver of income tax and NIC receipts, growing substantially more slowly than the overall growth in nominal GDP.
C.39 The forecast of receipts from the temporary Bank Payroll Tax is based on the updated forecast for bonuses in 2009-10. Bonuses eligible for the payroll tax, which includes deferred awards in 2009-10, are now expected to rise by around 25 per cent on 2008-09 levels. This is higher than the expected 15 per cent increase in wider financial sector bonuses because it includes deferred bonus awards and applies to banks only. The 2009 Pre-Budget Report forecast was a cautious judgement based on the information available at the time and has been updated at this Budget based on the information set out above. The gross yield is estimated at £2 billion and is set out in Table C6. The final level of Bank Payroll Tax receipts will be known when payments are made in August 2010. Chapter A sets out that the net yield, after reductions in PAYE due to lower bonus payments resulting from the tax, is £1.3 billion.
At the time of the Pre-Budget Report it was assumed the Bank Payroll Tax would C.40 accrue to 2009-10. The ONS have now decided that in line with Eurostat guidelines it should accrue to the point at which the tax passes into law which is assumed to be in 2010-11.
Income tax and NICs
Temporary Bank Payroll tax
fsbR T h e p u b l i c f i n a n c e s c
195Budget 2010
C.41 Cash receipts of VAT in 2009-10 are expected to be £2.8 billion above their 2009 Pre-Budget Report projection. Higher receipts reflect both the composition of recent consumer spending growth towards goods subject to the standard rate of VAT, as well as movements in VAT debt. VAT debts rose sharply in 2008-09 reflecting pressure on firms’ cash flows from the economic downturn and restrictive credit conditions. This pushed up the VAT gap (the difference between the theoretical tax liability and actual receipts). As 2009-10 has progressed, the VAT gap has started to fall back with less new VAT debt being created than was expected, and businesses repaying existing debt. Spending on consumer durables in the latter half of 2009 may have been buoyed by the growing effect of the temporary reduction in VAT, as households brought forward consumption before the rate reverted to 17.5 per cent. This was supplemented by the effect of the car scrappage scheme and low interest rates.
VAT receipts are expected to rise by 11 per cent in 2010-11 largely reflecting the C.42 ending of the temporary reduction in VAT. However, some of this will be offset by repayments relating to the judicial ruling in Fleming and Condé Nast on the three-year time limit for reclaiming over-declared or under-claimed VAT for tax periods before May 1997. Growth in VAT receipts in 2010-11 and through the forecast is held back by the judgement that consumer spending will lag overall growth in the economy, as households continue to adjust their finances. While the NAO-audited assumption on the VAT gap has a lower starting point than in the 2009 Pre-Budget Report, the assumption requires at least a 0.5 percentage point rise in the underlying VAT gap each year. This is likely to build in caution if the economic recovery leads to a further fall in VAT debt.
C.43 Non-North Sea corporation tax is one of the most cyclical of taxes and has fallen by just over a quarter in the last two years. The drop in receipts has been most marked in the financial sector with receipts down by almost 60 per cent since 2007-08. The decline in receipts has been more rapid than in previous downturns, reflecting in part the fact that the tax payment lag for corporation tax has lessened since the move to Quarterly Instalment Payments for medium and large companies. However, the decline in non-North Sea corporation tax receipts in 2009-10 is not as steep as forecast in the 2009 Pre-Budget Report, with receipts £2.2 billion higher than expected. Receipts relating to liabilities incurred in current and previous years have been stronger than expected in both the financial and non-financial sectors.
Non-North Sea corporation tax is expected to start to recover in 2010-11, with growth C.44 in receipts of around 16 per cent. A sizeable element of the rebound in 2010-11 reflects a lessening of the impact from factors that reduced 2009-10 receipts, in particular the one-year enhanced capital allowances measure and higher repayments as firms carried back losses to relieve against earlier liabilities. Repayments are expected to fall back, as firms return to profit and also because loss-making firms can only carry back losses against recently paid tax for one year. Receipts will also benefit from the resumption of profit growth in 2010, forecast at 9 per cent in the financial sector and around 3 per cent in the non-financial sector.
With the economic forecast assuming a rebalancing of the economy towards C.45 investment and exports, profit growth in the non-oil, non-financial sector is expected to grow more strongly than the overall growth in the economy from 2011 onwards. This will boost receipts, although there will be some offset from firms carrying forward downturn-related losses to use against future liabilities. Financial sector profits are assumed to grow by just under 7 per cent a year from 2011 onwards, only bringing profits as a percentage of GDP back to close to their 20-year average by 2014-15. The smaller contribution of the financial sector than that envisaged prior to the downturn leads to non-North Sea corporation tax averaging 2.6 per cent of GDP in the medium-term, 0.3 percentage points below the recent peak of 2.9 per cent of GDP in 2007-08.
Value added tax
Non-North Sea corporation tax
c T h e p u b l i c f i n a n c e s fsbR
196 Budget 2010
C.46 With oil prices in 2009 averaging $36 a barrel less than in 2008, North Sea revenues for 2009-10 are approximately half those received during 2008-09. Relative to the 2009 Pre-Budget Report, North Sea revenues were £0.6 billion below expectations. This reflected lower than anticipated gas prices and production in the latter half of 2009.
North Sea revenues are expected to rise by 33 per cent in 2010-11. The forecast uses C.47 the NAO-audited assumption on oil prices. Based on the average of independent forecasts, oil prices are expected to be $75.8 per barrel in 2010 and then assumed to be constant in real terms. This is around $13 per barrel higher than in 2009 and $3 per barrel higher than the 2010 oil price incorporated in the Pre-Budget Report. The weakening of sterling against the dollar will mean that the rise in oil prices in sterling terms will be higher.
The boost from higher sterling oil prices is offset in future years by the incorporation C.48 of the 2010 survey data on both production and capital expenditure from the Department of Energy and Climate Change. In particular, the forecast allows for substantially higher capital expenditure by oil and gas producers in 2012-13 and 2013-14. The forecast also allows for weaker gas prices in 2010 and 2011 than assumed in the 2009 Pre-Budget Report. Reflecting declining oil and gas production, North Sea revenues fall as a percentage of GDP after 2010-11.
C.49 In line with the 2009 Pre-Budget Report projection, capital gains tax (CGT) fell sharply from £7.8 billion in 2008-09 to just £2.5 billion in 2009-10. CGT paid in 2009-10 relates to gains realised in the previous year and the steep fall reflects a number of factors. CGT is particularly sensitive to changes in equity prices, reflecting the fact that it is taxed on the gain rather than the whole disposal price and that financial assets account for around two-thirds of chargeable gains. Equity prices fell by over 25 per cent in 2008-09 compared with the previous year. The year-on-year drop in CGT receipts also reflects particularly strong receipts in 2008-09, as investors rearranged their affairs ahead of the abolition of taper relief when the CGT regime was reformed in the 2007 Pre-Budget Report.
Inheritance tax also fell sharply in 2009-10 by around 17 per cent, reflecting asset C.50 price falls and the continuing impact of the 2007 Pre-Budget Report measure on transferable tax-free allowances for married couples and civil partners. Tax payment lags for both CGT and inheritance tax mean that the rise in both equity and house prices from their low point will help stabilise receipts in 2010-11, with receipts rising thereafter.
C.51 The forecast of stamp duties on property and shares in 2009-10 is £0.3 billion higher than at the 2009 Pre-Budget Report, driven primarily by higher than expected receipts, mainly from stamp duty land tax. The strong year-on-year growth in stamp duties expected in 2010-11 will reflect the fact that the annual comparison in the first half of the financial year will be against a period when both property transactions and asset prices were close to their low point. House prices are assumed to grow modestly in 2010 and 2011 in line with the median of independent forecasts, before growing at around 5 per cent in the medium-term, consistent with their long-term average real growth rate. Property transactions are assumed to return to a level consistent with the historical average duration of ownership.
C.52 Fuel duties in 2009-10 are expected to be £0.2 billion lower than assumed in the 2009 Pre-Budget Report. This is likely to be the result of the adverse weather conditions this winter reducing the demand for road fuel. With fuel duty charged on a per litre basis, higher pump prices reduce demand and hence receipts. The higher oil price in sterling terms lowers the fuel duty forecast by around £0.2 to £0.3 billion from 2010-11 onwards.
North Sea revenues
Capital gains tax and inheritance
tax
Stamp duties
Excise duties
fsbR T h e p u b l i c f i n a n c e s c
197Budget 2010
The estimates for both alcohol and tobacco duties in 2009-10 are in line with their C.53 Pre-Budget Report forecasts. Tobacco duties in 2009-10 have been buoyed by a rise in duty-paid consumption. A combination of the weaker exchange rate and less overseas travel is likely to have reduced cross-border shopping and made illicit behaviour less attractive. The tobacco forecast is based on an NAO-audited assumption that the underlying duty-paid consumption of cigarettes will be set at least 3 per cent lower than the estimated outturn for the current year. As the economy recovers and overseas travel rebounds, some of the 2009-10 rise in consumption could be reversed. To allow for this risk, duty paid consumption is assumed to fall by greater than 3 per cent in both 2010-11 and 2011-12.
C.54 Changes to other receipts include a rise in interest and dividend payments in the medium term due to changes in the expected profile of interest rates, student loans and other financial assets. Council tax increases are determined annually by local authorities, not by the Government. The council tax projections are based on stylised assumptions and are not Government forecasts. The council tax figures for 2010-11 onwards are based on the arithmetic average of council tax increases over the past three years. Since changes to council tax are broadly balanced by changes to locally financed expenditure, they have little material impact on the current balance or on net borrowing.
Other receipts
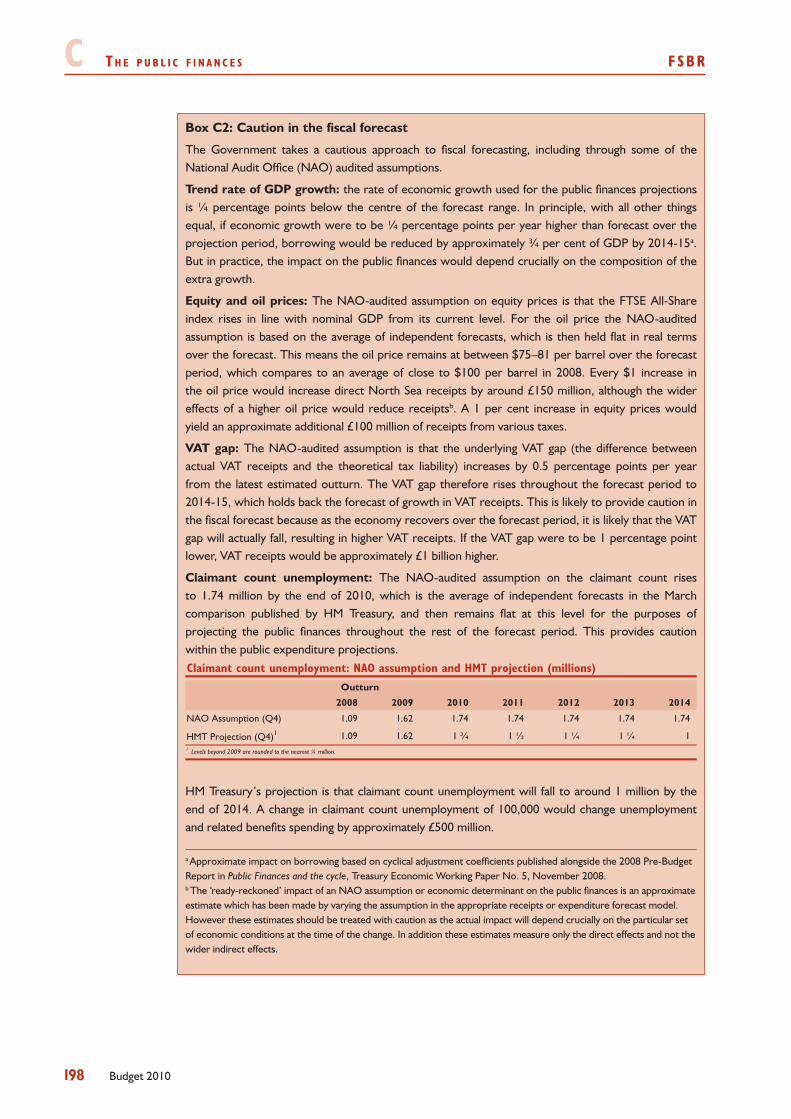
c T h e p u b l i c f i n a n c e s fsbR
198 Budget 2010
Box C2: Caution in the fiscal forecast
The Government takes a cautious approach to fiscal forecasting, including through some of the National Audit Office (NAO) audited assumptions.
Trend rate of GDP growth: the rate of economic growth used for the public finances projections is ¼ percentage points below the centre of the forecast range. In principle, with all other things equal, if economic growth were to be ¼ percentage points per year higher than forecast over the projection period, borrowing would be reduced by approximately ¾ per cent of GDP by 2014-15a. But in practice, the impact on the public finances would depend crucially on the composition of the extra growth.
Equity and oil prices: The NAO-audited assumption on equity prices is that the FTSE All-Share index rises in line with nominal GDP from its current level. For the oil price the NAO-audited assumption is based on the average of independent forecasts, which is then held flat in real terms over the forecast. This means the oil price remains at between $75–81 per barrel over the forecast period, which compares to an average of close to $100 per barrel in 2008. Every $1 increase in the oil price would increase direct North Sea receipts by around £150 million, although the wider effects of a higher oil price would reduce receiptsb. A 1 per cent increase in equity prices would yield an approximate additional £100 million of receipts from various taxes.
VAT gap: The NAO-audited assumption is that the underlying VAT gap (the difference between actual VAT receipts and the theoretical tax liability) increases by 0.5 percentage points per year from the latest estimated outturn. The VAT gap therefore rises throughout the forecast period to 2014-15, which holds back the forecast of growth in VAT receipts. This is likely to provide caution in the fiscal forecast because as the economy recovers over the forecast period, it is likely that the VAT gap will actually fall, resulting in higher VAT receipts. If the VAT gap were to be 1 percentage point lower, VAT receipts would be approximately £1 billion higher.
Claimant count unemployment: The NAO-audited assumption on the claimant count rises to 1.74 million by the end of 2010, which is the average of independent forecasts in the March comparison published by HM Treasury, and then remains flat at this level for the purposes of projecting the public finances throughout the rest of the forecast period. This provides caution within the public expenditure projections.Claimant count unemployment: NAO assumption and HMT projection (millions)
2008 2009 2010 2011 2012 2013 2014
NAO Assumption (Q4) 1.09 1.62 1.74 1.74 1.74 1.74 1.74
HMT Projection (Q4)1 1.09 1.62 1 ¾ 1 ½ 1 ¼ 1 ¼ 11 Levels beyond 2009 are rounded to the nearest ¼ million.
Outturn
HM Treasury’s projection is that claimant count unemployment will fall to around 1 million by the end of 2014. A change in claimant count unemployment of 100,000 would change unemployment and related benefits spending by approximately £500 million.
a Approximate impact on borrowing based on cyclical adjustment coefficients published alongside the 2008 Pre-Budget Report in Public Finances and the cycle, Treasury Economic Working Paper No. 5, November 2008.b The ‘ready-reckoned’ impact of an NAO assumption or economic determinant on the public finances is an approximate estimate which has been made by varying the assumption in the appropriate receipts or expenditure forecast model. However these estimates should be treated with caution as the actual impact will depend crucially on the particular set of economic conditions at the time of the change. In addition these estimates measure only the direct effects and not the wider indirect effects.
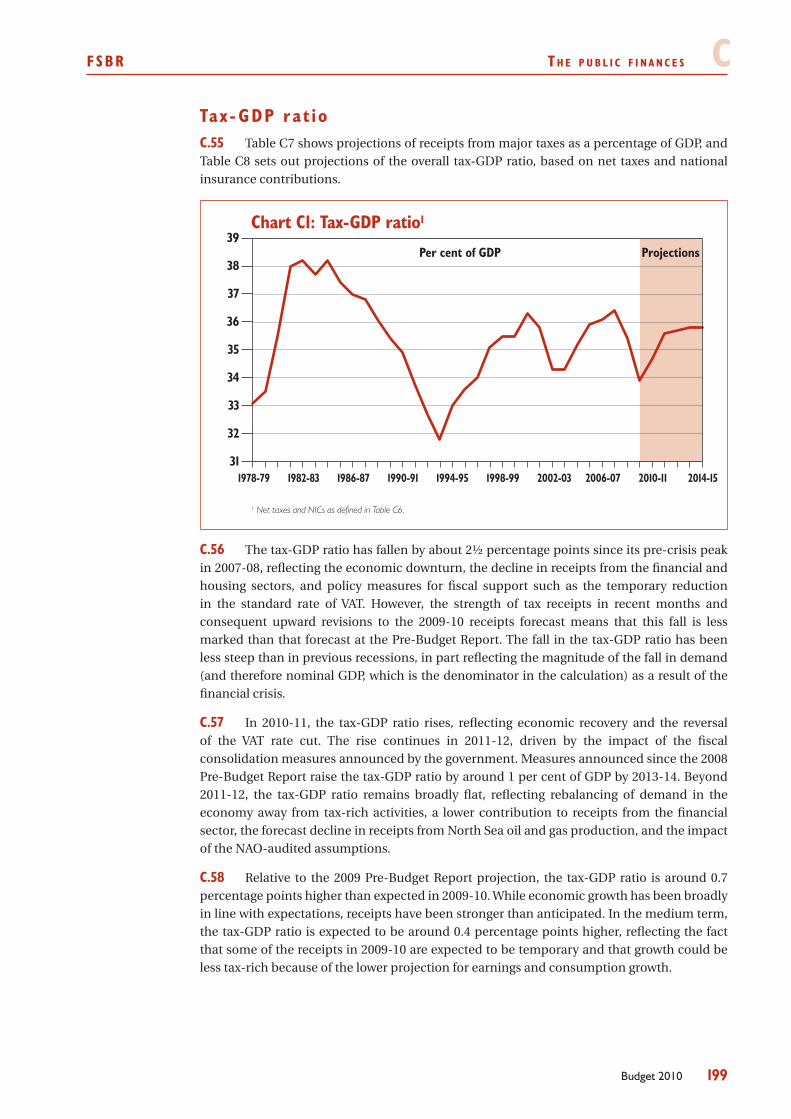
fsbR T h e p u b l i c f i n a n c e s c
199Budget 2010
Tax - GDP ra t i oTable C7 shows projections of receipts from major taxes as a percentage of GDP, and C.55
Table C8 sets out projections of the overall tax-GDP ratio, based on net taxes and national insurance contributions.
¹ Net taxes and NICs as defined in Table C6.
Chart C1: Tax-GDP ratio¹
31
32
33
34
35
36
37
38
39
2014-152010-112006-072002-031998-991994-951990-911986-871982-831978-79
Per cent of GDP Projections
2014-152010-112006-072002-031998-991994-951990-911986-871982-831978-79
The tax-GDP ratio has fallen by about 2½ percentage points since its pre-crisis peak C.56 in 2007-08, reflecting the economic downturn, the decline in receipts from the financial and housing sectors, and policy measures for fiscal support such as the temporary reduction in the standard rate of VAT. However, the strength of tax receipts in recent months and consequent upward revisions to the 2009-10 receipts forecast means that this fall is less marked than that forecast at the Pre-Budget Report. The fall in the tax-GDP ratio has been less steep than in previous recessions, in part reflecting the magnitude of the fall in demand (and therefore nominal GDP, which is the denominator in the calculation) as a result of the financial crisis.
In 2010-11, the tax-GDP ratio rises, reflecting economic recovery and the reversal C.57 of the VAT rate cut. The rise continues in 2011-12, driven by the impact of the fiscal consolidation measures announced by the government. Measures announced since the 2008 Pre-Budget Report raise the tax-GDP ratio by around 1 per cent of GDP by 2013-14. Beyond 2011-12, the tax-GDP ratio remains broadly flat, reflecting rebalancing of demand in the economy away from tax-rich activities, a lower contribution to receipts from the financial sector, the forecast decline in receipts from North Sea oil and gas production, and the impact of the NAO-audited assumptions.
Relative to the 2009 Pre-Budget Report projection, the tax-GDP ratio is around 0.7 C.58 percentage points higher than expected in 2009-10. While economic growth has been broadly in line with expectations, receipts have been stronger than anticipated. In the medium term, the tax-GDP ratio is expected to be around 0.4 percentage points higher, reflecting the fact that some of the receipts in 2009-10 are expected to be temporary and that growth could be less tax-rich because of the lower projection for earnings and consumption growth.
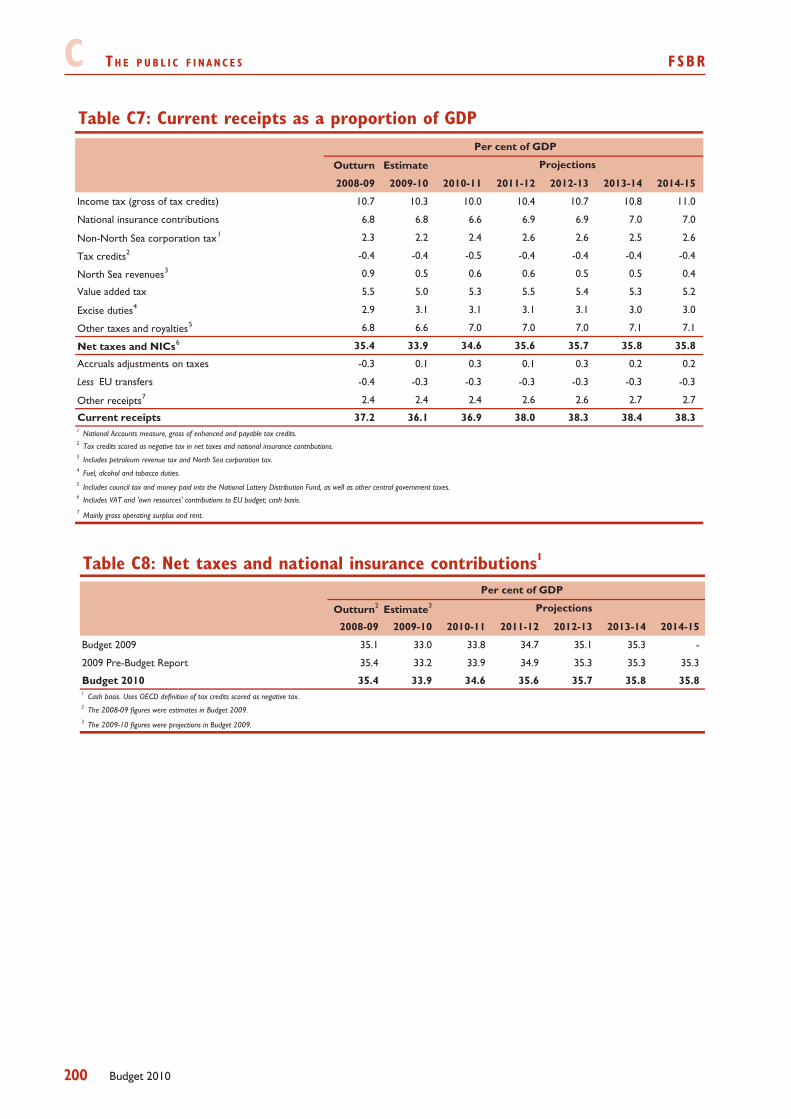
c T h e p u b l i c f i n a n c e s fsbR
200 Budget 2010
Table C7: Current receipts as a proportion of GDP
Outturn Estimate
2008-09 2009-10 2010-11 2011-12 2012-13 2013-14 2014-15
Income tax (gross of tax credits) 10.7 10.3 10.0 10.4 10.7 10.8 11.0
National insurance contributions 6.8 6.8 6.6 6.9 6.9 7.0 7.0
Non-North Sea corporation tax1 2.3 2.2 2.4 2.6 2.6 2.5 2.6
Tax credits2 -0.4 -0.4 -0.5 -0.4 -0.4 -0.4 -0.4
North Sea revenues3 0.9 0.5 0.6 0.6 0.5 0.5 0.4
Value added tax 5.5 5.0 5.3 5.5 5.4 5.3 5.2
Excise duties4 2.9 3.1 3.1 3.1 3.1 3.0 3.0
Other taxes and royalties5 6.8 6.6 7.0 7.0 7.0 7.1 7.1
Net taxes and NICs6 35.4 33.9 34.6 35.6 35.7 35.8 35.8
Accruals adjustments on taxes -0.3 0.1 0.3 0.1 0.3 0.2 0.2
Less EU transfers -0.4 -0.3 -0.3 -0.3 -0.3 -0.3 -0.3
Other receipts7 2.4 2.4 2.4 2.6 2.6 2.7 2.7
Current receipts 37.2 36.1 36.9 38.0 38.3 38.4 38.31 National Accounts measure, gross of enhanced and payable tax credits.
5 Includes council tax and money paid into the National Lottery Distribution Fund, as well as other central government taxes.
7 Mainly gross operating surplus and rent.
Per cent of GDP
3 Includes petroleum revenue tax and North Sea corporation tax.4 Fuel, alcohol and tobacco duties.
6 Includes VAT and 'own resources' contributions to EU budget; cash basis.
2 Tax credits scored as negative tax in net taxes and national insurance contributions.
Projections
Table C8: Net taxes and national insurance contributions1
Outturn2 Estimate3
2008-09 2009-10 2010-11 2011-12 2012-13 2013-14 2014-15
Budget 2009 35.1 33.0 33.8 34.7 35.1 35.3 -
2009 Pre-Budget Report 35.4 33.2 33.9 34.9 35.3 35.3 35.3
Budget 2010 35.4 33.9 34.6 35.6 35.7 35.8 35.81 Cash basis. Uses OECD definition of tax credits scored as negative tax.2 The 2008-09 figures were estimates in Budget 2009.3 The 2009-10 figures were projections in Budget 2009.
Per cent of GDP
Projections
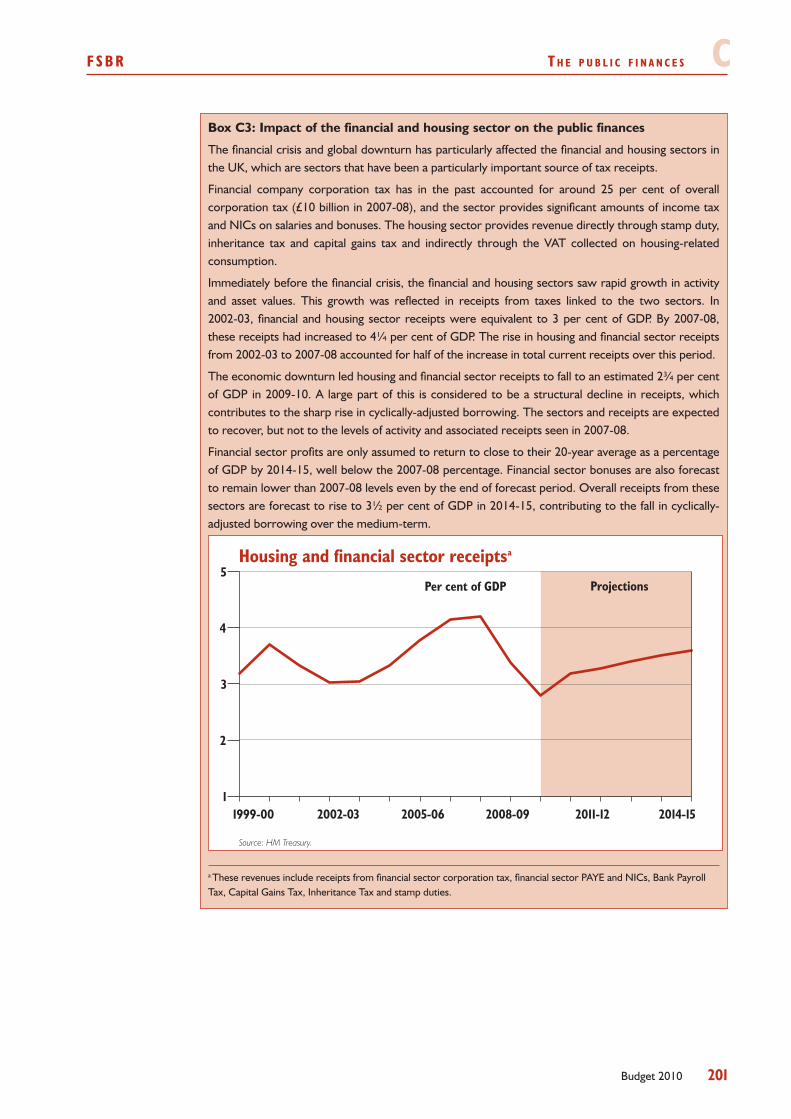
fsbR T h e p u b l i c f i n a n c e s c
201Budget 2010
Box C3: Impact of the financial and housing sector on the public finances
The financial crisis and global downturn has particularly affected the financial and housing sectors in the UK, which are sectors that have been a particularly important source of tax receipts.
Financial company corporation tax has in the past accounted for around 25 per cent of overall corporation tax (£10 billion in 2007-08), and the sector provides significant amounts of income tax and NICs on salaries and bonuses. The housing sector provides revenue directly through stamp duty, inheritance tax and capital gains tax and indirectly through the VAT collected on housing-related consumption.
Immediately before the financial crisis, the financial and housing sectors saw rapid growth in activity and asset values. This growth was reflected in receipts from taxes linked to the two sectors. In 2002-03, financial and housing sector receipts were equivalent to 3 per cent of GDP. By 2007-08, these receipts had increased to 4¼ per cent of GDP. The rise in housing and financial sector receipts from 2002-03 to 2007-08 accounted for half of the increase in total current receipts over this period.
The economic downturn led housing and financial sector receipts to fall to an estimated 2¾ per cent of GDP in 2009-10. A large part of this is considered to be a structural decline in receipts, which contributes to the sharp rise in cyclically-adjusted borrowing. The sectors and receipts are expected to recover, but not to the levels of activity and associated receipts seen in 2007-08.
Financial sector profits are only assumed to return to close to their 20-year average as a percentage of GDP by 2014-15, well below the 2007-08 percentage. Financial sector bonuses are also forecast to remain lower than 2007-08 levels even by the end of forecast period. Overall receipts from these sectors are forecast to rise to 3½ per cent of GDP in 2014-15, contributing to the fall in cyclically-adjusted borrowing over the medium-term.
Housing and financial sector receiptsa
1
2
3
4
5
2014-152011-122008-092005-062002-031999-00
ProjectionsPer cent of GDP
Source: HM Treasury.
a These revenues include receipts from financial sector corporation tax, financial sector PAYE and NICs, Bank Payroll Tax, Capital Gains Tax, Inheritance Tax and stamp duties.
c T h e p u b l i c f i n a n c e s fsbR
202 Budget 2010
PUBL IC EXPENDITURE
This section looks in detail at the projections for public expenditure. It includes C.59 outturns for 2008-09, the latest estimates for 2009-10 and public expenditure plans for 2010-11. The spending projections cover the whole of the public sector, using the National Accounts aggregate Total Managed Expenditure (TME).
For fiscal aggregates purposes, TME is split into National Accounts components C.60 covering public sector current expenditure, public sector net investment and depreciation. For budgeting and other purposes, TME is split into DEL (firm three-year limits for departments’ programme expenditure) and AME (expenditure that is not easily subject to firm multi-year limits). Departments have separate budgets, for current and capital expenditure.
In line with the Government’s normal convention, the Budget publishes firm DEL C.61 plans and a forecast of AME for each year of the current spending review period, which is up to the end of 2010-11. Beyond the current spending review from 2011-12, in line with the Government’s normal convention the Budget presents the overall level of spending, with TME broken down into public sector current expenditure (PSCE) and public sector net investment (PSNI).
Projections of AME are sensitive to movements in a number of economic C.62 determinants, such as inflation, claimant count unemployment, and interest rates. Movements in these variables could therefore drive significant changes in AME. Given the uncertainty and volatility inherent in these forecasts it has not been the Government’s practice to publish an AME forecast beyond the current spending review period.
Table C9 sets out projected spending on DEL and the main components of AME to C.63 the end of the 2007 Comprehensive Spending Review period in 2010-11. Table C10 shows changes since the 2009 Pre-Budget Report.
Changes i n TME s ince the 2009 Pre -Budge t Repor tLatest estimates suggest that TME for 2009-10 will be lower than in the 2009 Pre-C.64
Budget Report. Current expenditure is £2.4 billion lower due to a number of changes including removing the remaining AME margin, lower net payments on public sector pensions, and lower VAT refund payments, where the change in VAT refunds is offset in current receipts. Public sector net investment is higher by £0.5 billion reflecting the higher final market value of the capital grant component of the Government’s equity injection into Royal Bank of Scotland (RBS) in December.
TME is estimated to be £2.7 billion lower in 2010-11 than at the Pre-Budget Report, C.65 mainly due to a lower forecast for debt interest payments, and the normal convention of resetting the AME margin to £1 billion for the year immediately ahead. The reasons for changes in TME are explained in more detail in the paragraphs below on DELs and the individual AME components.
After the end of the current spending review period, PSCE is projected to grow at C.66 0.8 per cent per year on average in real terms from 2011-12 to 2014-153, the same growth rate assumption as at the Pre-Budget Report. As at the Pre-Budget Report, public sector net
3 Excluding the additional time-limited expenditure announced in the 2009 Pre-Budget Report and all additional expenditure announced in Budget 2010.
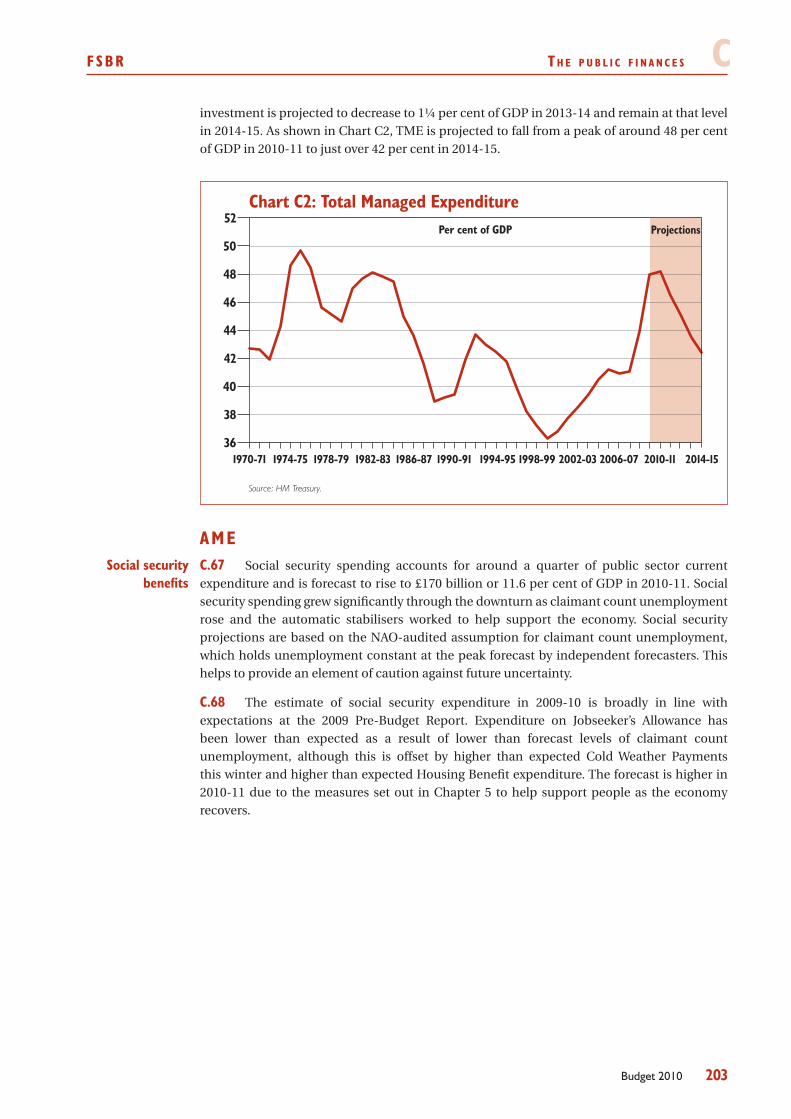
fsbR T h e p u b l i c f i n a n c e s c
203Budget 2010
investment is projected to decrease to 1¼ per cent of GDP in 2013-14 and remain at that level in 2014-15. As shown in Chart C2, TME is projected to fall from a peak of around 48 per cent of GDP in 2010-11 to just over 42 per cent in 2014-15.
Chart C2: Total Managed Expenditure
36
38
40
42
44
46
48
50
52
2014-152010-112006-072002-031998-991994-951990-911986-871982-831978-791974-751970-71
ProjectionsPer cent of GDP
Source: HM Treasury.
AMEC.67 Social security spending accounts for around a quarter of public sector current expenditure and is forecast to rise to £170 billion or 11.6 per cent of GDP in 2010-11. Social security spending grew significantly through the downturn as claimant count unemployment rose and the automatic stabilisers worked to help support the economy. Social security projections are based on the NAO-audited assumption for claimant count unemployment, which holds unemployment constant at the peak forecast by independent forecasters. This helps to provide an element of caution against future uncertainty.
The estimate of social security expenditure in 2009-10 is broadly in line with C.68 expectations at the 2009 Pre-Budget Report. Expenditure on Jobseeker’s Allowance has been lower than expected as a result of lower than forecast levels of claimant count unemployment, although this is offset by higher than expected Cold Weather Payments this winter and higher than expected Housing Benefit expenditure. The forecast is higher in 2010-11 due to the measures set out in Chapter 5 to help support people as the economy recovers.
Social security benefits
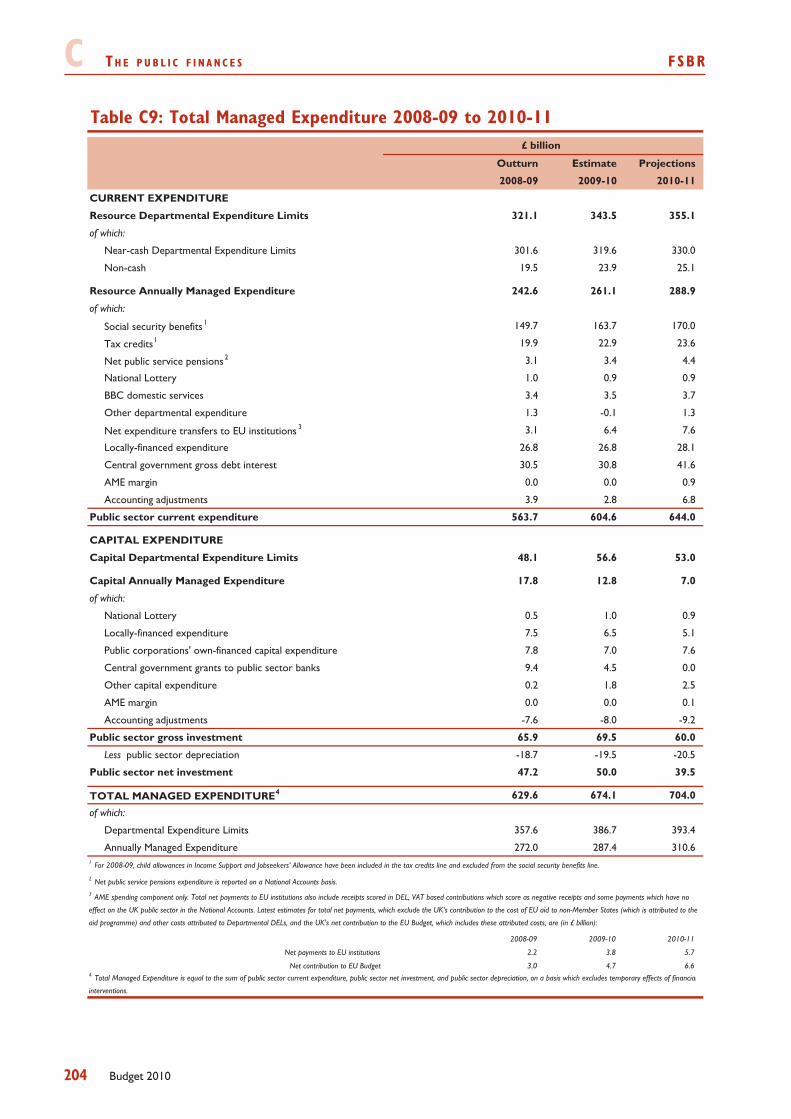
c T h e p u b l i c f i n a n c e s fsbR
204 Budget 2010
Table C9: Total Managed Expenditure 2008-09 to 2010-11
Outturn Estimate Projections
2008-09 2009-10 2010-11
CURRENT EXPENDITURE
Resource Departmental Expenditure Limits 321.1 343.5 355.1
of which:
Near-cash Departmental Expenditure Limits 301.6 319.6 330.0
Non-cash 19.5 23.9 25.1
Resource Annually Managed Expenditure 242.6 261.1 288.9
of which:
Social security benefits1 149.7 163.7 170.0
Tax credits1 19.9 22.9 23.6
Net public service pensions2 3.1 3.4 4.4
National Lottery 1.0 0.9 0.9
BBC domestic services 3.4 3.5 3.7
Other departmental expenditure 1.3 -0.1 1.3
Net expenditure transfers to EU institutions 3 3.1 6.4 7.6
Locally-financed expenditure 26.8 26.8 28.1
Central government gross debt interest 30.5 30.8 41.6
AME margin 0.0 0.0 0.9
Accounting adjustments 3.9 2.8 6.8
Public sector current expenditure 563.7 604.6 644.0
CAPITAL EXPENDITURE
Capital Departmental Expenditure Limits 48.1 56.6 53.0
Capital Annually Managed Expenditure 17.8 12.8 7.0
of which:
National Lottery 0.5 1.0 0.9
Locally-financed expenditure 7.5 6.5 5.1
Public corporations' own-financed capital expenditure 7.8 7.0 7.6
Central government grants to public sector banks 9.4 4.5 0.0
Other capital expenditure 0.2 1.8 2.5
AME margin 0.0 0.0 0.1
Accounting adjustments -7.6 -8.0 -9.2
Public sector gross investment 65.9 69.5 60.0
Less public sector depreciation -18.7 -19.5 -20.5
Public sector net investment 47.2 50.0 39.5
TOTAL MANAGED EXPENDITURE4 629.6 674.1 704.0
of which:
Departmental Expenditure Limits 357.6 386.7 393.4
Annually Managed Expenditure 272.0 287.4 310.6
2 Net public service pensions expenditure is reported on a National Accounts basis.
2008-09 2009-10 2010-11
Net payments to EU institutions 2.2 3.8 5.7
Net contribution to EU Budget 3.0 4.7 6.64 Total Managed Expenditure is equal to the sum of public sector current expenditure, public sector net investment, and public sector depreciation, on a basis which excludes temporary effects of financial
interventions.
£ billion
1 For 2008-09, child allowances in Income Support and Jobseekers' Allowance have been included in the tax credits line and excluded from the social security benefits line.
3 AME spending component only. Total net payments to EU institutions also include receipts scored in DEL, VAT based contributions which score as negative receipts and some payments which have no
effect on the UK public sector in the National Accounts. Latest estimates for total net payments, which exclude the UK's contribution to the cost of EU aid to non-Member States (which is attributed to the
aid programme) and other costs attributed to Departmental DELs, and the UK's net contribution to the EU Budget, which includes these attributed costs, are (in £ billion):
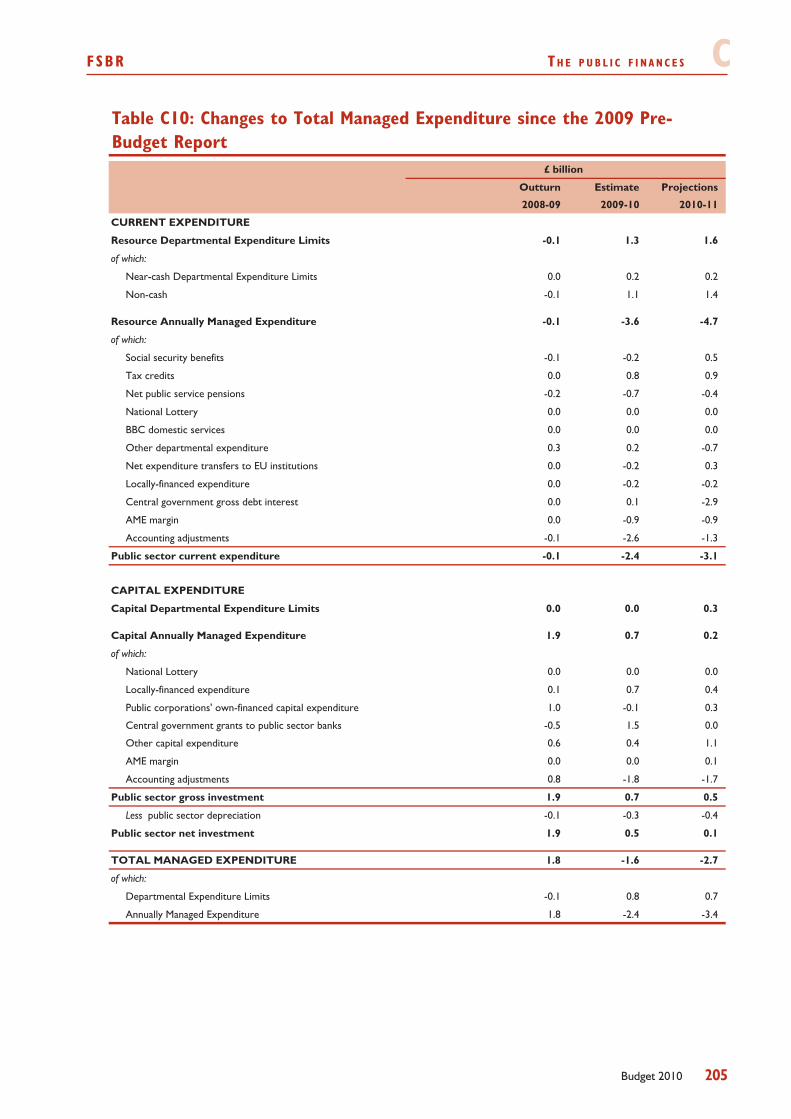
fsbR T h e p u b l i c f i n a n c e s c
205Budget 2010
Outturn Estimate Projections
2008-09 2009-10 2010-11
CURRENT EXPENDITURE
Resource Departmental Expenditure Limits -0.1 1.3 1.6
of which:
Near-cash Departmental Expenditure Limits 0.0 0.2 0.2
Non-cash -0.1 1.1 1.4
Resource Annually Managed Expenditure -0.1 -3.6 -4.7
of which:
Social security benefits -0.1 -0.2 0.5
Tax credits 0.0 0.8 0.9
Net public service pensions -0.2 -0.7 -0.4
National Lottery 0.0 0.0 0.0
BBC domestic services 0.0 0.0 0.0
Other departmental expenditure 0.3 0.2 -0.7
Net expenditure transfers to EU institutions 0.0 -0.2 0.3
Locally-financed expenditure 0.0 -0.2 -0.2
Central government gross debt interest 0.0 0.1 -2.9
AME margin 0.0 -0.9 -0.9
Accounting adjustments -0.1 -2.6 -1.3
Public sector current expenditure -0.1 -2.4 -3.1
CAPITAL EXPENDITURE
Capital Departmental Expenditure Limits 0.0 0.0 0.3
Capital Annually Managed Expenditure 1.9 0.7 0.2
of which:
National Lottery 0.0 0.0 0.0
Locally-financed expenditure 0.1 0.7 0.4
Public corporations' own-financed capital expenditure 1.0 -0.1 0.3
Central government grants to public sector banks -0.5 1.5 0.0
Other capital expenditure 0.6 0.4 1.1
AME margin 0.0 0.0 0.1
Accounting adjustments 0.8 -1.8 -1.7
Public sector gross investment 1.9 0.7 0.5
Less public sector depreciation -0.1 -0.3 -0.4
Public sector net investment 1.9 0.5 0.1
TOTAL MANAGED EXPENDITURE 1.8 -1.6 -2.7
of which:
Departmental Expenditure Limits -0.1 0.8 0.7
Annually Managed Expenditure 1.8 -2.4 -3.4
£ billion
Table C10: Changes to Total Managed Expenditure since the 2009 Pre-Budget Report
c T h e p u b l i c f i n a n c e s fsbR
206 Budget 2010
C.69 Child and Working Tax credits have been an important automatic stabiliser in the recent recession, with total expenditure increasing between 2008-09 and 2009-10 by £3.0 billion. Overall, tax credits in 2009-10 are broadly as forecast at the Pre-Budget Report. The changes to the AME estimates for 2009-10 and 2010-11 since the 2009 Pre-Budget Report largely reflect revisions to the split of expenditure classified as negative tax and AME, where more tax credit payments have become classified as AME. The economic downturn has meant that, for a greater number of recipients, tax credit entitlements now more than offset income tax liabilities. This change in the split has a neutral effect on the public finances overall, as the increase in payments classified as AME is exactly equal to the increase in tax receipts caused by the shift away from classification as negative tax.
C.70 Net public service pensions are measured on a National Accounts basis, and report benefits paid less contributions received by central government pay-as-you-go public service pension schemes. Net public service pensions expenditure has fallen across the forecast horizon since the 2009 Pre-Budget Report.
The lower net expenditure for 2009-10 than at the Pre-Budget Report is largely due C.71 to a one-off receipt into the Northern Ireland NHS pension scheme, which takes account of actuarial revisions to past payments of employers’ pension contributions. There is also a corresponding one-off increase in the Northern Ireland Executive DEL to reflect the payments of employers’ contributions into the scheme. In addition, net pensions expenditure in 2010-11 has been reduced by higher receipts of contributions due to changes in workforce demographics and increased average contribution rates.
C.72 The National Lottery figures reflect the latest view on the timing of drawdown by distributing bodies. The figures are broadly unchanged from the 2009 Pre-Budget Report. The forecasts are consistent with the latest information from the distribution funds, and projected revenues from ticket sales.
C.73 The forecast for other departmental current expenditure is lower in 2010-11 than at the 2009 Pre-Budget Report. This is largely the result of the inclusion of those fees received to date for 2010-11 in respect of the Asset Protection Scheme. The increase in 2009-10 for capital grants to public sector banks since the 2009 Pre-Budget Report reflects the final market value for the Royal Bank of Scotland equity injection. Other capital expenditure has increased in both 2009-10 and 2010-11 because of a classification change to departments’ budgets, where departments’ AME spending now includes capital grants to local authorities’ spending, or PSNI, and so they are removed in the AME capital accounting adjustments, which are lower as a result.
C.74 Net expenditure transfers to EU Institutions, which consist of Gross National Income (GNI) based contributions less the UK abatement, are unchanged in 2008-09, lower in 2009-10 and higher in 2010-11 than was estimated at the time of the 2009 Pre-Budget Report. The main factors for these changes are the use of later information on the size of the EU Budget for 2010, and the level and pattern of UK payments to this Budget, and changes in UK GNI-based contributions resulting from the use of latest economic assumptions.
C.75 Locally financed expenditure mainly consists of local authority self-financed expenditure (LASFE) and Scottish spending financed by local taxation. LASFE is the local authority spending financed by local authorities’ own sources of net income, other than central government support. The main determinant of the LASFE forecast is council tax. The council tax projections used to derive current LASFE are based on stylised assumptions, which are not government forecasts, and are mirrored in the projections for council tax
Tax credits
Public service pensions
National Lottery
Other departmental
expenditure
EU contributions
Locally financed expenditure
fsbR T h e p u b l i c f i n a n c e s c
207Budget 2010
included in current receipts, so that these assumptions have no material effect on the fiscal aggregates. Current LASFE also includes current spending financed by local authorities’ net drawdown from their current reserves, and interest receipts earned on all their investments, net of their repayments of debt. Capital LASFE reflects forecasts on the level of capital expenditure financed by the use of capital receipts, revenue sources of capital finance, private sector contributions and self-financed borrowing. Capital LASFE is net of local authority asset sales.
There are significant uncertainties in the forecasts for current and capital LASFE, C.76 particularly on local authorities’ net use of reserves (affecting current LASFE), and their levels of self-financed borrowing and asset sales (affecting capital LASFE). The forecasts in this Budget are based on recent outturns, where available, and projections based on local authorities’ budgets, adjusted to reflect known spending pressures and the large historical variation between local authorities’ budgets and final outturns.
The changes in the LASFE forecast since the 2009 Pre-Budget Report mainly reflect C.77 an increase to the capital forecast, following the higher level of capital spending reported by local authorities during the last quarter of 2009, and some small switches from current to capital LASFE, reflecting an improvement in the methodology for attributing Northern Ireland expenditure between current and capital LASFE.
C.78 Estimates for central government gross interest payments have been revised to take account of latest assumptions for economic determinants and improved information on gilts issuance. The debt interest forecast is broadly unchanged compared to the 2009 Pre-Budget Report in 2009-10, but has fallen in 2010-11. Market expectations of gilt rates have increased since the Pre-Budget Report, raising forecast debt interest payments. However in 2010-11 this is more than offset by the following factors:
significantly lower forecasts for the CGNCR in 2009-10 and 2010-11. The •CGNCR in 2009-10 and 2010-11 is cumulatively lower by £30 billion than at the Pre-Budget Report, which has reduced the debt interest forecast in 2010-11 by around £1 billion;
lower RPI inflation, which reduces accrued debt interest payments on index-•linked gilts; and
moving to a more detailed, fully-specified model of year-ahead gilt issuance, •to replace the top-down model estimate made in the Pre-Budget Report. This is the normal forecasting convention at Budget and takes account of detailed information from the Debt Management Office on expected gilt operations in 2010-11 and also enables the implications of issuance in 2009-10, which is now known, to be allowed for more precisely.
The debt interest forecast rises in line with the increase in public sector debt over the C.79 forecast period.
CG debt interest
c T h e p u b l i c f i n a n c e s fsbR
208 Budget 2010
C.80 Public corporations’ own-financed capital expenditure (PCOFCE) measures the total amount of public corporations’ net capital expenditure, less the amount of spending that is financed by central government departments, which is already included in DEL and elsewhere in AME. The forecast for PCOFCE in 2010-11 has increased since the Pre-Budget Report, which largely reflects a higher estimate of Housing Revenue Account net capital expenditure, due to a lower forecast for local authority housing sales.
C.81 The AME margin has been reset at £1 billion for 2010-11 in line with the usual convention. The AME margin provides an element of caution to mitigate the risks of higher than expected spending.
C.82 The accounting adjustments reconcile the budgeting aggregates DEL and AME with the National Accounts definition of TME, removing items that score in DEL or AME but not in TME, and adding in items included in TME but not in DEL or AME. A breakdown of these adjustments is given in Budget 2010: the economy and public finances – supplementary material. The reduction in current accounting adjustments in 2009-10 is due to a number of factors, including lower than anticipated VAT refunds, which is offset in receipts, and a lower estimate of defence capital spending classified as ‘single use military equipment’ (SUME), which is treated as current in National Accounts. The SUME spending is switched from capital to current spending in the accounting adjustments, and so the capital accounting adjustments include an offsetting increase. The capital accounting adjustments are reduced overall largely because of a new adjustment to remove grants to local authorities which finance debt repayments.
PC capital expenditure
AME margin
Accounting adjustments
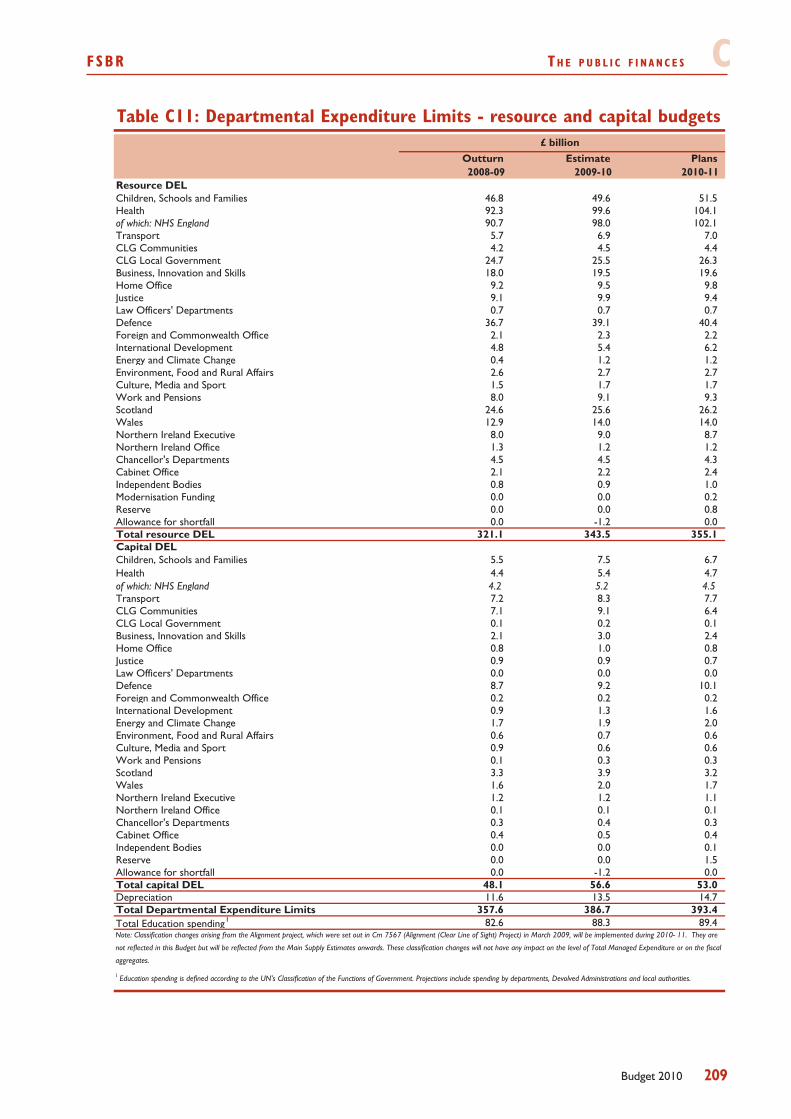
fsbR T h e p u b l i c f i n a n c e s c
209Budget 2010
Table C11: Departmental Expenditure Limits - resource and capital budgets
Outturn Estimate Plans2008-09 2009-10 2010-11
Resource DELChildren, Schools and Families 46.8 49.6 51.5Health 92.3 99.6 104.1of which: NHS England 90.7 98.0 102.1Transport 5.7 6.9 7.0CLG Communities 4.2 4.5 4.4CLG Local Government 24.7 25.5 26.3Business, Innovation and Skills 18.0 19.5 19.6Home Office 9.2 9.5 9.8Justice 9.1 9.9 9.4Law Officers' Departments 0.7 0.7 0.7Defence 36.7 39.1 40.4Foreign and Commonwealth Office 2.1 2.3 2.2International Development 4.8 5.4 6.2Energy and Climate Change 0.4 1.2 1.2Environment, Food and Rural Affairs 2.6 2.7 2.7Culture, Media and Sport 1.5 1.7 1.7Work and Pensions 8.0 9.1 9.3Scotland 24.6 25.6 26.2Wales 12.9 14.0 14.0Northern Ireland Executive 8.0 9.0 8.7Northern Ireland Office 1.3 1.2 1.2Chancellor's Departments 4.5 4.5 4.3Cabinet Office 2.1 2.2 2.4Independent Bodies 0.8 0.9 1.0Modernisation Funding 0.0 0.0 0.2Reserve 0.0 0.0 0.8Allowance for shortfall 0.0 -1.2 0.0Total resource DEL 321.1 343.5 355.1Capital DELChildren, Schools and Families 5.5 7.5 6.7Health 4.4 5.4 4.7of which: NHS England 4.2 5.2 4.5Transport 7.2 8.3 7.7CLG Communities 7.1 9.1 6.4CLG Local Government 0.1 0.2 0.1Business, Innovation and Skills 2.1 3.0 2.4Home Office 0.8 1.0 0.8Justice 0.9 0.9 0.7Law Officers' Departments 0.0 0.0 0.0Defence 8.7 9.2 10.1Foreign and Commonwealth Office 0.2 0.2 0.2International Development 0.9 1.3 1.6Energy and Climate Change 1.7 1.9 2.0Environment, Food and Rural Affairs 0.6 0.7 0.6Culture, Media and Sport 0.9 0.6 0.6Work and Pensions 0.1 0.3 0.3Scotland 3.3 3.9 3.2Wales 1.6 2.0 1.7Northern Ireland Executive 1.2 1.2 1.1Northern Ireland Office 0.1 0.1 0.1Chancellor's Departments 0.3 0.4 0.3Cabinet Office 0.4 0.5 0.4Independent Bodies 0.0 0.0 0.1Reserve 0.0 0.0 1.5Allowance for shortfall 0.0 -1.2 0.0Total capital DEL 48.1 56.6 53.0Depreciation 11.6 13.5 14.7Total Departmental Expenditure Limits 357.6 386.7 393.4Total Education spending1 82.6 88.3 89.4
£ billion
Note: Classification changes arising from the Alignment project, which were set out in Cm 7567 (Alignment (Clear Line of Sight) Project) in March 2009, will be implemented during 2010- 11. They are
not reflected in this Budget but will be reflected from the Main Supply Estimates onwards. These classification changes will not have any impact on the level of Total Managed Expenditure or on the fiscal
aggregates.
1 Education spending is defined according to the UN's Classification of the Functions of Government. Projections include spending by departments, Devolved Administrations and local authorities.
c T h e p u b l i c f i n a n c e s fsbR
210 Budget 2010
DELThe detailed allocation of DEL is shown in Table C11. In line with previous practice, C.83
resource and capital DEL for 2009-10 reflect the latest available information and include an allowance for shortfall reflecting likely underspends against departmental provisions.
There are a number of changes to DEL budgets since the 2009 Pre-Budget Report. C.84 These mostly reflect:
Budget 2010 policy decisions, which are set out in more detail in Chapter A;•
reprioritisation measures to fund new spending policies from within existing •budgets;
access to End of Year Flexibility for a number of departments in 2009-10, •including for the Department for Children, Schools and Families (DCSF) and the Department for Business, Innovation and Skills (BIS);
access to the DEL Reserve for a number of departments, including an •allocation to the Ministry of Defence in both 2009-10 and 2010-11 to fund military operations;
adjustments to the resource and capital budgets for a number of departments •as a result of the implementation of International Financial Reporting Standards; and
other classification and budgetary changes, which have no impact on •National Accounts definitions or TME.
F INANC IAL INTERVENT IONS
C.85 On 6 November 2009, the independent Office for National Statistics (ONS) issued comprehensive documentation describing how measures to maintain financial stability and support the effective functioning of the financial sector should be classified in National Accounts and included in outturn data4. This followed consultation with Eurostat (the statistical office of the European Union) and statistical offices in other Member States, to ensure consistent interpretation of international statistical guidance.
C.86 The long-term impact of the financial interventions on the taxpayer and the sustainability of public finances will be determined by the eventual net profit or loss on the interventions. The Government therefore bases its assessment of the fiscal position on measures that account for these permanent effects and which exclude any temporary effects of liabilities incurred as a result of the interventions. The treatment of net losses from the financial interventions in the fiscal projections is described further in Box C4.
As set out at the start of this chapter, and consistent with this approach, this Budget C.87 uses the measure of net borrowing that excludes the temporary effects of the financial interventions, introduced in the 2009 Pre-Budget Report. The measure is consistent with the measure of PSND excluding the temporary effects of the financial interventions announced at Budget 2008 and the ONS now publish outturn data for both5. These measures essentially treat the public sector banks and central government-administered schemes as if they were in the private sector. Bank of England schemes (Special Liquidity Scheme and Asset
4 Public Sector Interventions in the Financial Crisis, Office for National Statistics, 6 November 2009.5 Public Sector Finances excluding Financial Interventions, Office for National Statistics, 18 March 2010.
Classification in National
Accounts
Treatment in the public finances
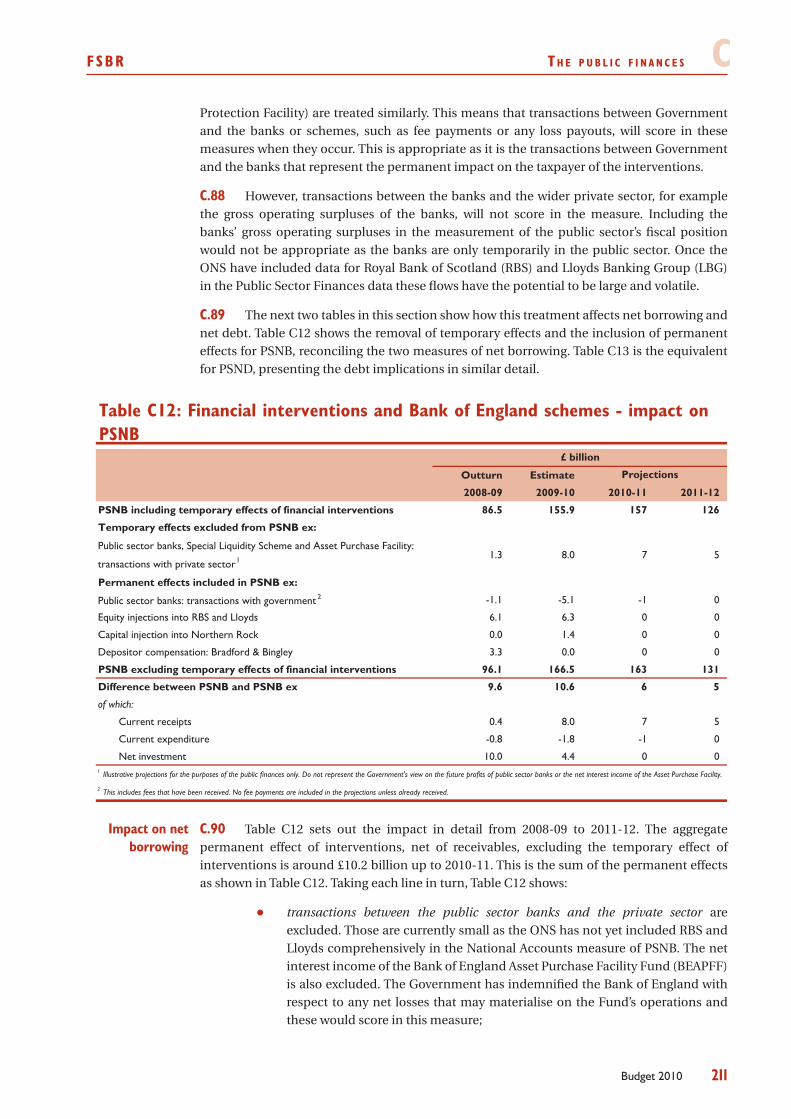
fsbR T h e p u b l i c f i n a n c e s c
211Budget 2010
Protection Facility) are treated similarly. This means that transactions between Government and the banks or schemes, such as fee payments or any loss payouts, will score in these measures when they occur. This is appropriate as it is the transactions between Government and the banks that represent the permanent impact on the taxpayer of the interventions.
However, transactions between the banks and the wider private sector, for example C.88 the gross operating surpluses of the banks, will not score in the measure. Including the banks’ gross operating surpluses in the measurement of the public sector’s fiscal position would not be appropriate as the banks are only temporarily in the public sector. Once the ONS have included data for Royal Bank of Scotland (RBS) and Lloyds Banking Group (LBG) in the Public Sector Finances data these flows have the potential to be large and volatile.
The next two tables in this section show how this treatment affects net borrowing and C.89 net debt. Table C12 shows the removal of temporary effects and the inclusion of permanent effects for PSNB, reconciling the two measures of net borrowing. Table C13 is the equivalent for PSND, presenting the debt implications in similar detail. Live C12
Outturn Estimate
2008-09 2009-10 2010-11 2011-12
PSNB including temporary effects of financial interventions 86.5 155.9 157 126
Temporary effects excluded from PSNB ex:
Public sector banks, Special Liquidity Scheme and Asset Purchase Facility:
transactions with private sector1 1.3 8.0 7 5
Permanent effects included in PSNB ex:
Public sector banks: transactions with government 2 -1.1 -5.1 -1 0
Equity injections into RBS and Lloyds 6.1 6.3 0 0
Capital injection into Northern Rock 0.0 1.4 0 0
Depositor compensation: Bradford & Bingley 3.3 0.0 0 0
PSNB excluding temporary effects of financial interventions 96.1 166.5 163 131
Difference between PSNB and PSNB ex 9.6 10.6 6 5
of which:
Current receipts 0.4 8.0 7 5
Current expenditure -0.8 -1.8 -1 0
Net investment 10.0 4.4 0 01 Illustrative projections for the purposes of the public finances only. Do not represent the Government's view on the future profits of public sector banks or the net interest income of the Asset Purchase Facility.
2 This includes fees that have been received. No fee payments are included in the projections unless already received.
£ billion
Projections
Table C12: Financial interventions and Bank of England schemes - impact on PSNB
C.90 Table C12 sets out the impact in detail from 2008-09 to 2011-12. The aggregate permanent effect of interventions, net of receivables, excluding the temporary effect of interventions is around £10.2 billion up to 2010-11. This is the sum of the permanent effects as shown in Table C12. Taking each line in turn, Table C12 shows:
transactions between the public sector banks and the private sector• are excluded. Those are currently small as the ONS has not yet included RBS and Lloyds comprehensively in the National Accounts measure of PSNB. The net interest income of the Bank of England Asset Purchase Facility Fund (BEAPFF) is also excluded. The Government has indemnified the Bank of England with respect to any net losses that may materialise on the Fund’s operations and these would score in this measure;
Impact on net borrowing
c T h e p u b l i c f i n a n c e s fsbR
212 Budget 2010
public sector banks’ transactions with Government• are included in PSNB ex. This currently includes fees paid to the Government by RBS and Lloyds related to recapitalisations and the APS. Any losses on the APS would also be included in this line;
equity injections into RBS and Lloyds are included• . On a National Accounts basis the difference between the price paid for the acquisition of shares in the public sector banks and the market price of that equity on the day of purchase is included as a capital grant. The remainder of the purchase price only affects the central government net cash requirement;
capital injection into Northern Rock• , which also scores as a capital grant; and
depositor compensation:• the Government’s support for depositors in Bradford & Bingley for that element of their deposits over the FSCS depositor compensation limit is also included as a capital grant.
The borrowing projections in this chapter do not include any estimate of fee C.91 or dividend income from the interventions. Payments and receipts associated with interventions are only included in estimated outturn and in the Budget projections where these have already been made, or a firm announcement has been made of a future transaction. The additional borrowing to finance these payments gives rise to an increase in the Government’s debt interest costs which is included in the projections in this chapter. Net interest flows are included in the projections.
fsbR T h e p u b l i c f i n a n c e s c
213Budget 2010
Box C4: The net fiscal cost of the financial interventions
The 2009 Pre-Budget Report set out the Government’s assessment of the net fiscal cost of its financial sector interventions. There have been no material changes to the Government’s assessment other than changes in market prices. The treatment of the interventions for fiscal policy purposes remains prudent.
The eventual fiscal cost remains dependent on a number of factors, including the eventual sale price achieved for the shares in Royal Bank of Scotland (RBS) and Lloyds Banking Group (LBG) compared to the purchase price. At current market prices the cost of the financial sector interventions net of fees and other income would total £6 billion, a decrease since the Pre-Budget Report. This estimate is based on the current market value of the Government’s shareholdings, the expected net benefit from the Asset Protection Scheme (APS) following due diligence, and the expectation that the aggregate costs of all other interventions will not be material. It is calculated on the basis of a detailed assessment of the liabilities, potential losses and fee income associated with each scheme. Some external estimates have taken a broad cross-country approach, for example using average losses following previous financial crises, leading to higher estimates. However, these estimates do not take into account the specific set of safeguards built into the UK interventions.
The key elements on which the final net cost will depend are:
the eventual net profit or loss on the recapitalisations of RBS and LBG. UK Financial •Investments (UKFI) have today published updated details about the Government’s investmentsa. One way to value these investments is on the basis of current market prices. This would point to a cost of £12 billion which is net of the value of the Government’s RBS dividend access share. However, the actual profit or loss will depend upon the share price at the time of sale. The Government has also received a total of £0.7 billion in underwriting fees and a £0.3 billion fee for the RBS contingent capital guarantee; and
net payouts under the APS scheme. The Asset Protection Agency (APA) has been •established to operate the APS and continues to examine the APS assets. Under the APS the Government has now received fees totalling £3.9 billion and will receive at least a further £1.1 billion from RBS. Based on the APA’s assessment of the assets the central expectation remains that there will be a net benefit to the taxpayer of at least £5 billion from the scheme (taking account of the £60 billion first loss, fees and recoveries).
Other interventions, not expected to have a material cost to the taxpayer after fees, other income and recoveries are taken into account, are:
the repayment and recovery of financial support provided to protect retail depositors. •As part of the resolution of a number of financial institutions during the crisis (Bradford & Bingley, Dunfermline Building Society, London Scottish Bank, Kaupthing Singer & Friedlander, Heritable Bank and the payout to Icesave depositors) the Government provided loans and other financial support in order to protect retail depositors. The outstanding amount totals £27 billion. The majority of this is repayable from the Financial Services Compensation Scheme through recoveries from the resolved institutions and, if necessary, levies on the financial industry. HM Treasury also has claims to proceeds from the winding-up of the relevant institutions and continues to expect full repayment of the loan to the Icelandic Depositor Compensation Scheme and is continuing to discuss the terms of the repayment with the Icelandic authorities;
returns on the disposal and wind-down of Northern Rock. Northern Rock was restructured •into two separate companies from 1 January 2010: Northern Rock plc and Northern Rock (Asset Management) plc. The Government remains the sole shareholder and has provided support to the two companies in the form of: a loan (current outstanding balance of £23 billion) to Northern Rock (Asset Management) plc; an equity injection of £1.4 billion into Northern Rock plc; and a Working Capital Facility of up to £2.5 billion to Northern Rock
c T h e p u b l i c f i n a n c e s fsbR
214 Budget 2010
(Asset Management) plc to support the company’s business plan. Certain wholesale deposit guarantees remain in place but notice has been given of the intention to lift the retail deposit guarantee from 24 May. Given the financial position of both companies it is expected that all of this money will be returned to the taxpayer;
returns on the wind-down of Bradford & Bingley. The Government is also a sole •shareholder in Bradford & Bingley and provides it with a Working Capital Facility (currently the commitment is up to £11.5 billion) and certain deposit and capital guarantees. Given the level of loss absorbing capital of Bradford & Bingley the Government expects to recover all of this money;
losses suffered by the Bank of England on the Special Liquidity Scheme (SLS) (HM Treasury •has indemnified the Bank of England for any such losses). However given the high quality of collateral required by the Bank of England and the amount of collateral pledged (£287 billion nominal value of securities against £185 billion of nominal Treasury bills) losses are considered unlikely; and
fees received and payouts under the Credit Guarantee Scheme (CGS). Losses would occur •under the CGS only in the event that a financial institution which had participated in the scheme went into administration and insufficient recoveries were available to pay back creditors.
Thus, with a cost of £12 billion from recapitalisation and a minimum £6 billion of fees associated with recapitalisation and the APS, overall these elements point to a net cost of £6 billion at current market prices, although the actual cost will depend on the eventual value achieved for the Government’s shareholdings on sale.
Treatment in the public finance statistics and for fiscal policy purposes
Since the 2009 Pre-Budget Report the estimated net losses from the financial sector interventions have been incorporated into the public finances on a National Accounts basis. This treatment is consistent with the approach set out above:
the main element is a treatment of the implied paper loss on the Government’s holdings of •shares in RBS and Lloyds. On a National Accounts basis the difference between the price paid for the acquisition of shares in the public sector banks and the market price of that equity on the day of purchase is included as a capital grant. In 2008-09 these were £6.1 billion and in 2009-10 £6.3 billion, net of the value of the dividend access share, as shown in Table C12. The 2009-10 capital grant is £2.2 billion higher than estimated at the Pre-Budget Report. These figures were computed on the day of purchase and are now fixed and will not move when share prices change in the market; and
as above, this paper loss is offset by the fees that have been received so far, also shown •in Table C12 in the line ‘Public sector banks’ transactions with Government’. Fee receipts estimated to be of a similar value across the projection period are excluded from the forecast.
As set out in Table C13 the aggregate permanent effect of interventions, net of receivables, on the measure of net debt excluding the temporary effect of interventions is around £10 billion up to 2010-11 on a National Accounts basis. Given that this is higher than the loss at current market prices, the approach taken for fiscal policy purposes remains prudent.
a Update on UKFI market investments, UK Financial Investments, 24 March 2010 (www.ukfi.co.uk).
Consistent with National Accounts, a number of transactions relating to the financial C.92 interventions will not affect any measure of PSNB because they take the form of financial transactions, such as loans or share purchases, which do not constitute borrowing (as one financial asset is being exchanged for another), or they are offset by recoveries imputed in
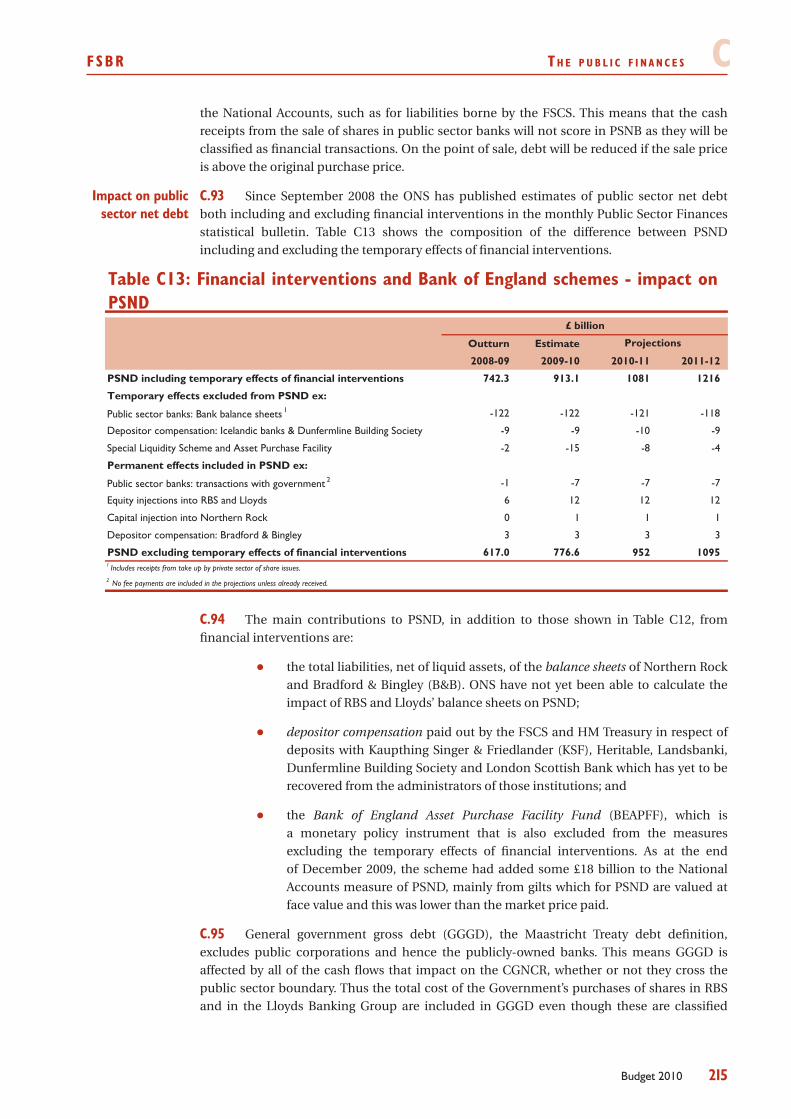
fsbR T h e p u b l i c f i n a n c e s c
215Budget 2010
the National Accounts, such as for liabilities borne by the FSCS. This means that the cash receipts from the sale of shares in public sector banks will not score in PSNB as they will be classified as financial transactions. On the point of sale, debt will be reduced if the sale price is above the original purchase price.
C.93 Since September 2008 the ONS has published estimates of public sector net debt both including and excluding financial interventions in the monthly Public Sector Finances statistical bulletin. Table C13 shows the composition of the difference between PSND including and excluding the temporary effects of financial interventions.
Outturn Estimate
2008-09 2009-10 2010-11 2011-12
PSND including temporary effects of financial interventions 742.3 913.1 1081 1216
Temporary effects excluded from PSND ex:
Public sector banks: Bank balance sheets 1 -122 -122 -121 -118
Depositor compensation: Icelandic banks & Dunfermline Building Society -9 -9 -10 -9
Special Liquidity Scheme and Asset Purchase Facility -2 -15 -8 -4
Permanent effects included in PSND ex:
Public sector banks: transactions with government 2 -1 -7 -7 -7
Equity injections into RBS and Lloyds 6 12 12 12
Capital injection into Northern Rock 0 1 1 1
Depositor compensation: Bradford & Bingley 3 3 3 3
PSND excluding temporary effects of financial interventions 617.0 776.6 952 1095
2 No fee payments are included in the projections unless already received.
1 Includes receipts from take up by private sector of share issues.
Projections
£ billion
Table C13: Financial interventions and Bank of England schemes - impact on PSND
The main contributions to PSND, in addition to those shown in Table C12, from C.94 financial interventions are:
the total liabilities, net of liquid assets, of the • balance sheets of Northern Rock and Bradford & Bingley (B&B). ONS have not yet been able to calculate the impact of RBS and Lloyds’ balance sheets on PSND;
depositor compensation• paid out by the FSCS and HM Treasury in respect of deposits with Kaupthing Singer & Friedlander (KSF), Heritable, Landsbanki, Dunfermline Building Society and London Scottish Bank which has yet to be recovered from the administrators of those institutions; and
the • Bank of England Asset Purchase Facility Fund (BEAPFF), which is a monetary policy instrument that is also excluded from the measures excluding the temporary effects of financial interventions. As at the end of December 2009, the scheme had added some £18 billion to the National Accounts measure of PSND, mainly from gilts which for PSND are valued at face value and this was lower than the market price paid.
General government gross debt (GGGD), the Maastricht Treaty debt definition, C.95 excludes public corporations and hence the publicly-owned banks. This means GGGD is affected by all of the cash flows that impact on the CGNCR, whether or not they cross the public sector boundary. Thus the total cost of the Government’s purchases of shares in RBS and in the Lloyds Banking Group are included in GGGD even though these are classified
Impact on public sector net debt
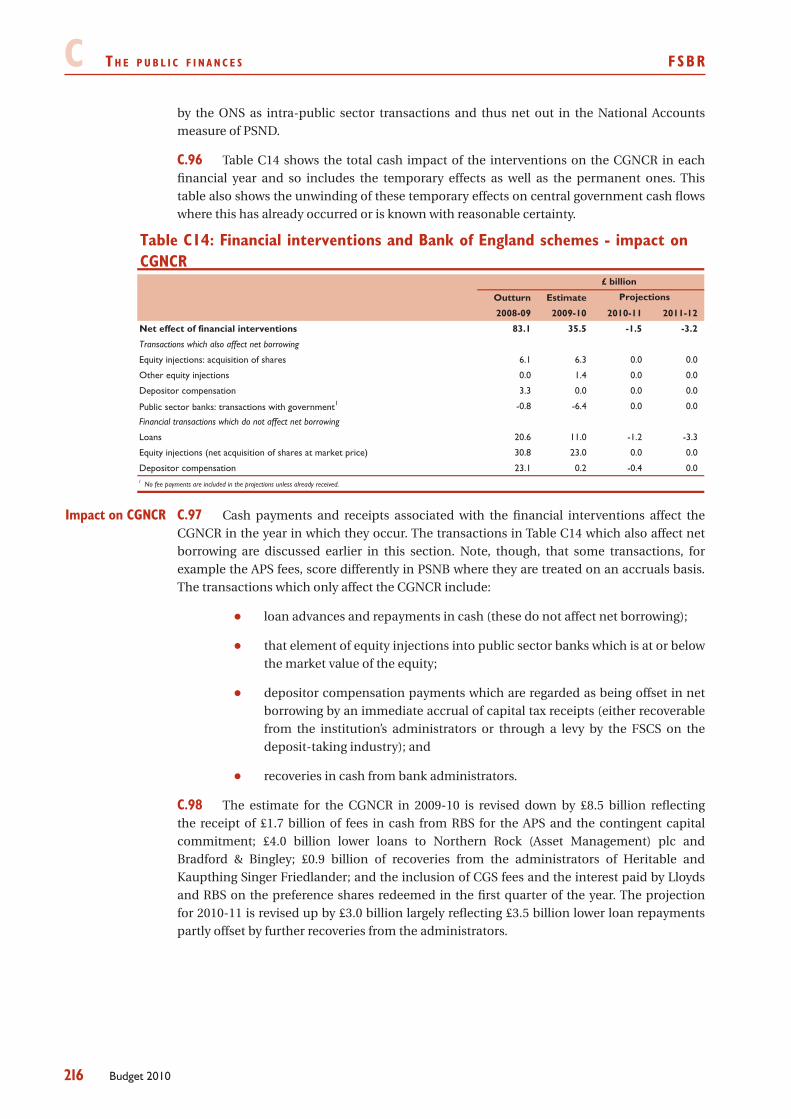
c T h e p u b l i c f i n a n c e s fsbR
216 Budget 2010
by the ONS as intra-public sector transactions and thus net out in the National Accounts measure of PSND.
Table C14 shows the total cash impact of the interventions on the CGNCR in each C.96 financial year and so includes the temporary effects as well as the permanent ones. This table also shows the unwinding of these temporary effects on central government cash flows where this has already occurred or is known with reasonable certainty. Live C14
Outturn Estimate
2008-09 2009-10 2010-11 2011-12
Net effect of financial interventions 83.1 35.5 -1.5 -3.2
Transactions which also affect net borrowing
Equity injections: acquisition of shares 6.1 6.3 0.0 0.0
Other equity injections 0.0 1.4 0.0 0.0
Depositor compensation 3.3 0.0 0.0 0.0
Public sector banks: transactions with government1 -0.8 -6.4 0.0 0.0
Financial transactions which do not affect net borrowing
Loans 20.6 11.0 -1.2 -3.3
Equity injections (net acquisition of shares at market price) 30.8 23.0 0.0 0.0
Depositor compensation 23.1 0.2 -0.4 0.01 No fee payments are included in the projections unless already received.
£ billion
Projections
Table C14: Financial interventions and Bank of England schemes - impact on CGNCR
C.97 Cash payments and receipts associated with the financial interventions affect the CGNCR in the year in which they occur. The transactions in Table C14 which also affect net borrowing are discussed earlier in this section. Note, though, that some transactions, for example the APS fees, score differently in PSNB where they are treated on an accruals basis. The transactions which only affect the CGNCR include:
loan advances and repayments in cash (these do not affect net borrowing);•
that element of equity injections into public sector banks which is at or below •the market value of the equity;
depositor compensation payments which are regarded as being offset in net •borrowing by an immediate accrual of capital tax receipts (either recoverable from the institution’s administrators or through a levy by the FSCS on the deposit-taking industry); and
recoveries in cash from bank administrators.•
The estimate for the CGNCR in 2009-10 is revised down by £8.5 billion reflecting C.98 the receipt of £1.7 billion of fees in cash from RBS for the APS and the contingent capital commitment; £4.0 billion lower loans to Northern Rock (Asset Management) plc and Bradford & Bingley; £0.9 billion of recoveries from the administrators of Heritable and Kaupthing Singer Friedlander; and the inclusion of CGS fees and the interest paid by Lloyds and RBS on the preference shares redeemed in the first quarter of the year. The projection for 2010-11 is revised up by £3.0 billion largely reflecting £3.5 billion lower loan repayments partly offset by further recoveries from the administrators.
Impact on CGNCR
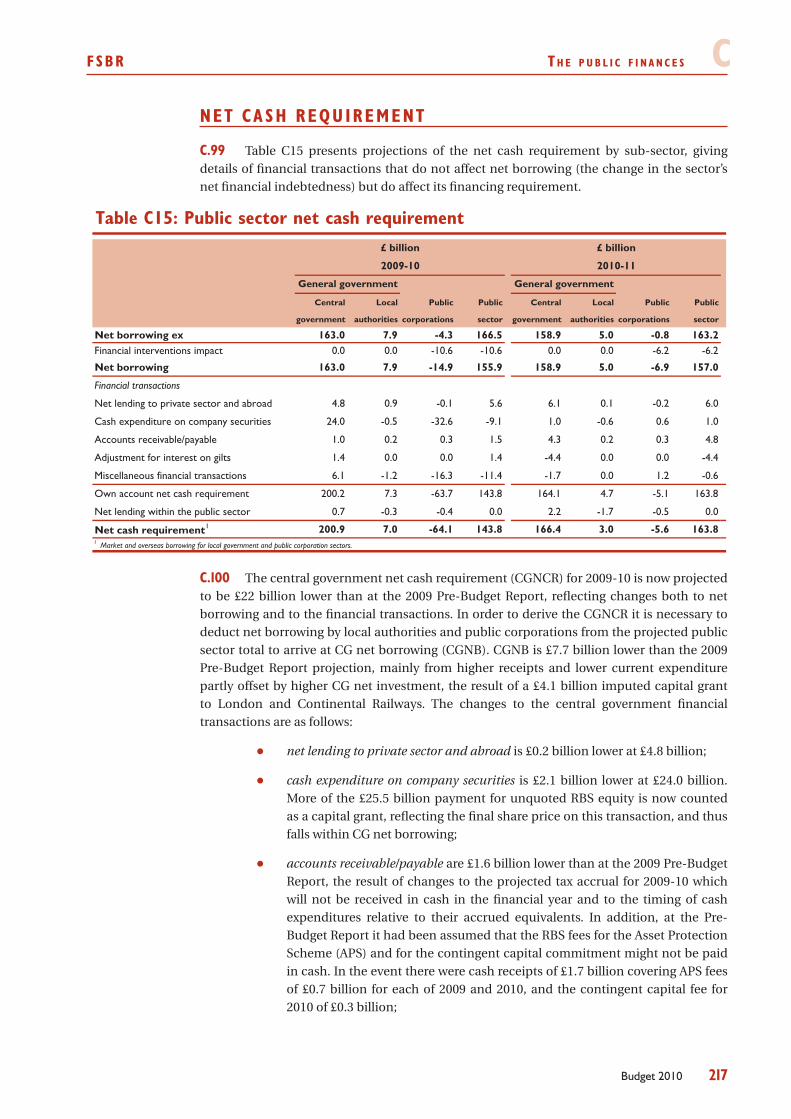
fsbR T h e p u b l i c f i n a n c e s c
217Budget 2010
NET CA SH REQUIREMENT
Table C15 presents projections of the net cash requirement by sub-sector, giving C.99 details of financial transactions that do not affect net borrowing (the change in the sector’s net financial indebtedness) but do affect its financing requirement.
Central Local Public Public Central Local Public Public
government authorities corporations sector government authorities corporations sector
Net borrowing ex 163.0 7.9 -4.3 166.5 158.9 5.0 -0.8 163.2Financial interventions impact 0.0 0.0 -10.6 -10.6 0.0 0.0 -6.2 -6.2
Net borrowing 163.0 7.9 -14.9 155.9 158.9 5.0 -6.9 157.0
Financial transactions
Net lending to private sector and abroad 4.8 0.9 -0.1 5.6 6.1 0.1 -0.2 6.0
Cash expenditure on company securities 24.0 -0.5 -32.6 -9.1 1.0 -0.6 0.6 1.0
Accounts receivable/payable 1.0 0.2 0.3 1.5 4.3 0.2 0.3 4.8
Adjustment for interest on gilts 1.4 0.0 0.0 1.4 -4.4 0.0 0.0 -4.4
Miscellaneous financial transactions 6.1 -1.2 -16.3 -11.4 -1.7 0.0 1.2 -0.6
Own account net cash requirement 200.2 7.3 -63.7 143.8 164.1 4.7 -5.1 163.8
Net lending within the public sector 0.7 -0.3 -0.4 0.0 2.2 -1.7 -0.5 0.0
Net cash requirement1 200.9 7.0 -64.1 143.8 166.4 3.0 -5.6 163.81 Market and overseas borrowing for local government and public corporation sectors.
Table C15: Public sector net cash requirement
General government General government
2009-10 2010-11
£ billion £ billion
The central government net cash requirement (CGNCR) for 2009-10 is now projected C.100 to be £22 billion lower than at the 2009 Pre-Budget Report, reflecting changes both to net borrowing and to the financial transactions. In order to derive the CGNCR it is necessary to deduct net borrowing by local authorities and public corporations from the projected public sector total to arrive at CG net borrowing (CGNB). CGNB is £7.7 billion lower than the 2009 Pre-Budget Report projection, mainly from higher receipts and lower current expenditure partly offset by higher CG net investment, the result of a £4.1 billion imputed capital grant to London and Continental Railways. The changes to the central government financial transactions are as follows:
net lending to private sector and abroad• is £0.2 billion lower at £4.8 billion;
cash expenditure on company securities• is £2.1 billion lower at £24.0 billion. More of the £25.5 billion payment for unquoted RBS equity is now counted as a capital grant, reflecting the final share price on this transaction, and thus falls within CG net borrowing;
accounts receivable/payable• are £1.6 billion lower than at the 2009 Pre-Budget Report, the result of changes to the projected tax accrual for 2009-10 which will not be received in cash in the financial year and to the timing of cash expenditures relative to their accrued equivalents. In addition, at the Pre-Budget Report it had been assumed that the RBS fees for the Asset Protection Scheme (APS) and for the contingent capital commitment might not be paid in cash. In the event there were cash receipts of £1.7 billion covering APS fees of £0.7 billion for each of 2009 and 2010, and the contingent capital fee for 2010 of £0.3 billion;
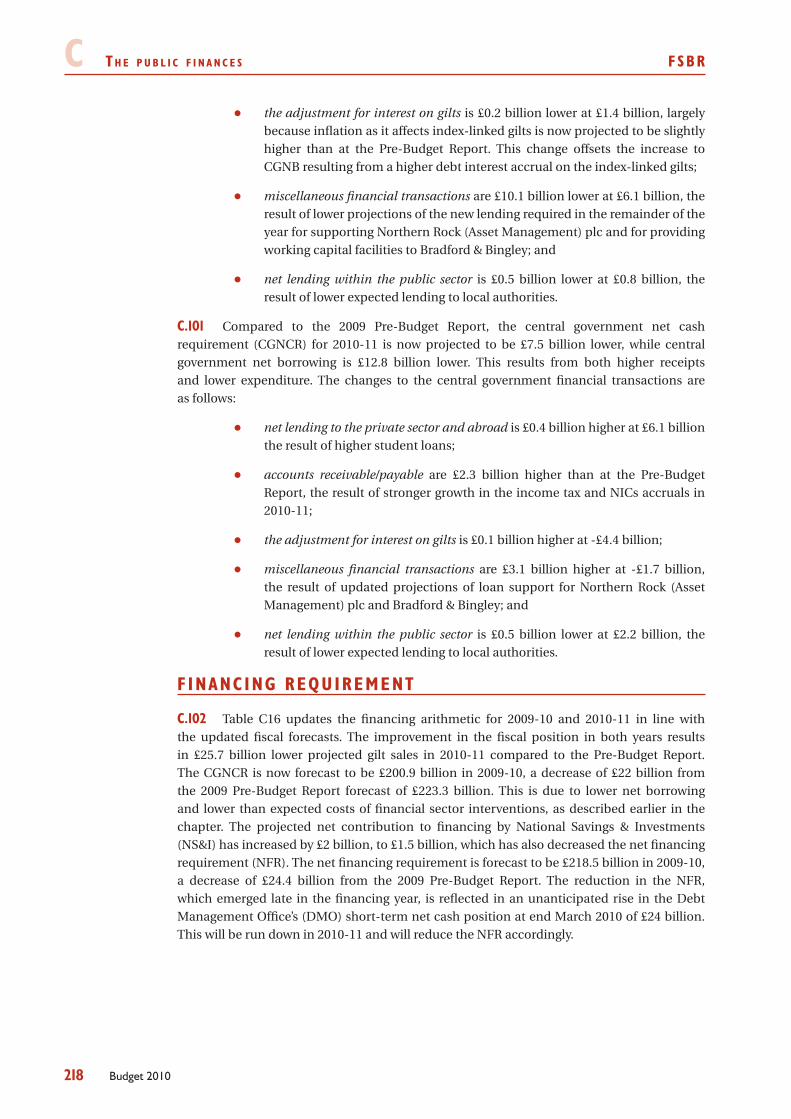
c T h e p u b l i c f i n a n c e s fsbR
218 Budget 2010
the adjustment for interest on gilts• is £0.2 billion lower at £1.4 billion, largely because inflation as it affects index-linked gilts is now projected to be slightly higher than at the Pre-Budget Report. This change offsets the increase to CGNB resulting from a higher debt interest accrual on the index-linked gilts;
miscellaneous financial transactions• are £10.1 billion lower at £6.1 billion, the result of lower projections of the new lending required in the remainder of the year for supporting Northern Rock (Asset Management) plc and for providing working capital facilities to Bradford & Bingley; and
net lending within the public sector• is £0.5 billion lower at £0.8 billion, the result of lower expected lending to local authorities.
Compared to the 2009 Pre-Budget Report, the central government net cash C.101 requirement (CGNCR) for 2010-11 is now projected to be £7.5 billion lower, while central government net borrowing is £12.8 billion lower. This results from both higher receipts and lower expenditure. The changes to the central government financial transactions are as follows:
net lending to the private sector and abroad• is £0.4 billion higher at £6.1 billion the result of higher student loans;
accounts receivable/payable• are £2.3 billion higher than at the Pre-Budget Report, the result of stronger growth in the income tax and NICs accruals in 2010-11;
the adjustment for interest on gilts• is £0.1 billion higher at -£4.4 billion;
miscellaneous financial transactions• are £3.1 billion higher at -£1.7 billion, the result of updated projections of loan support for Northern Rock (Asset Management) plc and Bradford & Bingley; and
net lending within the public sector• is £0.5 billion lower at £2.2 billion, the result of lower expected lending to local authorities.
F INANC ING REQUIREMENT
Table C16 updates the financing arithmetic for 2009-10 and 2010-11 in line with C.102 the updated fiscal forecasts. The improvement in the fiscal position in both years results in £25.7 billion lower projected gilt sales in 2010-11 compared to the Pre-Budget Report. The CGNCR is now forecast to be £200.9 billion in 2009-10, a decrease of £22 billion from the 2009 Pre-Budget Report forecast of £223.3 billion. This is due to lower net borrowing and lower than expected costs of financial sector interventions, as described earlier in the chapter. The projected net contribution to financing by National Savings & Investments (NS&I) has increased by £2 billion, to £1.5 billion, which has also decreased the net financing requirement (NFR). The net financing requirement is forecast to be £218.5 billion in 2009-10, a decrease of £24.4 billion from the 2009 Pre-Budget Report. The reduction in the NFR, which emerged late in the financing year, is reflected in an unanticipated rise in the Debt Management Office’s (DMO) short-term net cash position at end March 2010 of £24 billion. This will be run down in 2010-11 and will reduce the NFR accordingly.
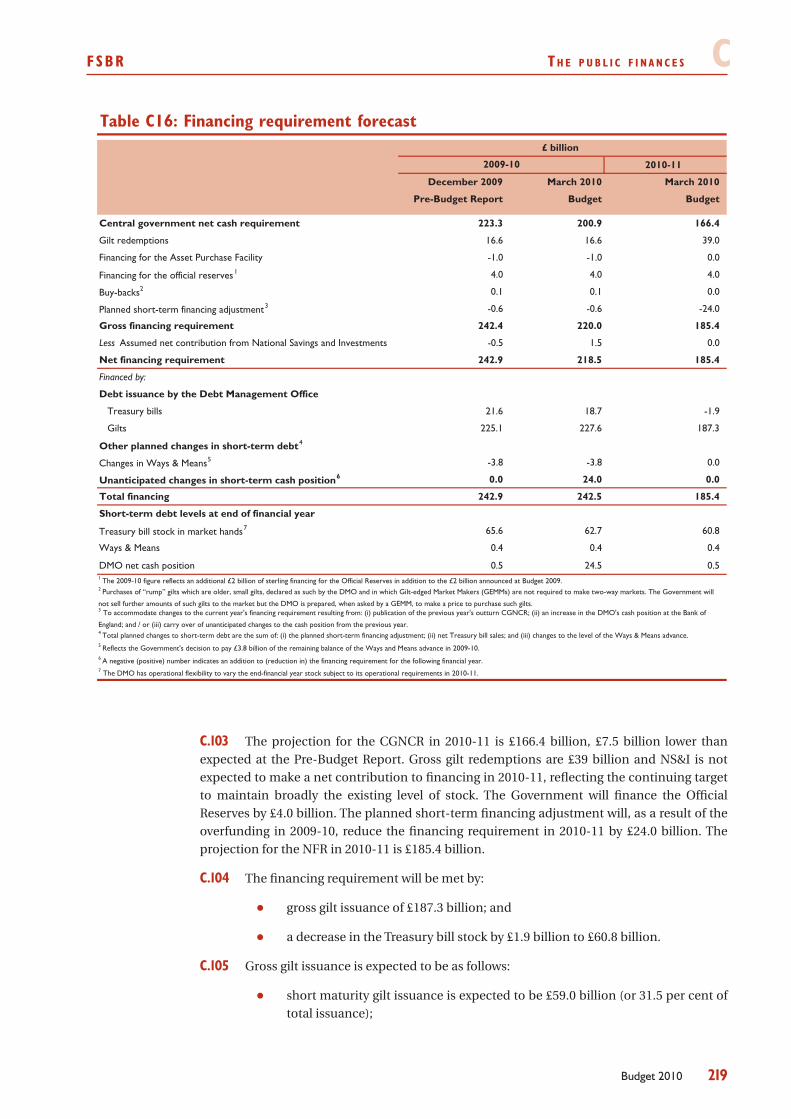
fsbR T h e p u b l i c f i n a n c e s c
219Budget 2010
Table C16: Financing requirement forecast
2010-11
December 2009 March 2010 March 2010
Pre-Budget Report Budget Budget
Central government net cash requirement 223.3 200.9 166.4
Gilt redemptions 16.6 16.6 39.0
Financing for the Asset Purchase Facility -1.0 -1.0 0.0
Financing for the official reserves1 4.0 4.0 4.0
Buy-backs2 0.1 0.1 0.0
Planned short-term financing adjustment3 -0.6 -0.6 -24.0
Gross financing requirement 242.4 220.0 185.4
Less Assumed net contribution from National Savings and Investments -0.5 1.5 0.0
Net financing requirement 242.9 218.5 185.4
Financed by:
Debt issuance by the Debt Management Office
Treasury bills 21.6 18.7 -1.9
Gilts 225.1 227.6 187.3
Other planned changes in short-term debt4
Changes in Ways & Means5 -3.8 -3.8 0.0
Unanticipated changes in short-term cash position6 0.0 24.0 0.0
Total financing 242.9 242.5 185.4
Short-term debt levels at end of financial year
Treasury bill stock in market hands7 65.6 62.7 60.8
Ways & Means 0.4 0.4 0.4
DMO net cash position 0.5 24.5 0.5
£ billion
2 Purchases of “rump” gilts which are older, small gilts, declared as such by the DMO and in which Gilt-edged Market Makers (GEMMs) are not required to make two-way markets. The Government will
not sell further amounts of such gilts to the market but the DMO is prepared, when asked by a GEMM, to make a price to purchase such gilts.3 To accommodate changes to the current year's financing requirement resulting from: (i) publication of the previous year's outturn CGNCR; (ii) an increase in the DMO's cash position at the Bank of
England; and / or (iii) carry over of unanticipated changes to the cash position from the previous year.
1 The 2009-10 figure reflects an additional £2 billion of sterling financing for the Official Reserves in addition to the £2 billion announced at Budget 2009.
6 A negative (positive) number indicates an addition to (reduction in) the financing requirement for the following financial year.
4 Total planned changes to short-term debt are the sum of: (i) the planned short-term financing adjustment; (ii) net Treasury bill sales; and (iii) changes to the level of the Ways & Means advance.
2009-10
7 The DMO has operational flexibility to vary the end-financial year stock subject to its operational requirements in 2010-11.
5 Reflects the Government's decision to pay £3.8 billion of the remaining balance of the Ways and Means advance in 2009-10.
The projection for the CGNCR in 2010-11 is £166.4 billion, £7.5 billion lower than C.103 expected at the Pre-Budget Report. Gross gilt redemptions are £39 billion and NS&I is not expected to make a net contribution to financing in 2010-11, reflecting the continuing target to maintain broadly the existing level of stock. The Government will finance the Official Reserves by £4.0 billion. The planned short-term financing adjustment will, as a result of the overfunding in 2009-10, reduce the financing requirement in 2010-11 by £24.0 billion. The projection for the NFR in 2010-11 is £185.4 billion.
The financing requirement will be met by:C.104
gross gilt issuance of £187.3 billion; and•
a decrease in the Treasury bill stock by £1.9 billion to £60.8 billion.•
Gross gilt issuance is expected to be as follows:C.105
short maturity gilt issuance is expected to be £59.0 billion (or 31.5 per cent of •total issuance);
c T h e p u b l i c f i n a n c e s fsbR
220 Budget 2010
medium maturity gilt issuance is expected to be £45.0 billion (or 24.0 per cent •of total issuance);
long maturity gilt issuance is expected to be £45.3 billion (or 24.2 per cent of •total issuance); and
issuance of index-linked gilts is expected to be £38.0 billion (or 20.3 per cent •of total issuance).
Auctions will remain the Government’s primary method by which to issue gilts. C.106 However, consistent with the strategy adopted in 2009-10 and drawing on experience from implementing the 2009-10 financing remit, the Government has decided to continue to use supplementary methods to issue gilts in 2010-11. In particular, the Government will continue its programme of syndicated offerings and mini-tenders, and continue to make the post-auction ‘top-up’ facility available after auctions.
It is anticipated that:C.107
£148.1 billion (79.1 per cent of total issuance) will be issued through pre-•announced auctions;
£29.2 billion (15.6 per cent of total issuance) will be issued by syndication; •and
£10.0 billion (5.3 per cent of total issuance) will be issued through mini-•tenders.
The planning assumption is that short and medium maturity gilts will be sold at C.108 auction only. Long maturity and index-linked gilts will be issued also by way of syndication and mini tender.
Full details of the DMO’s financing remit including further information on the C.109 structure of gilts issuance and the gilt auction calendar for 2010-11 can be found in the Debt and reserves management report 2010-11 which is published alongside this Budget and is available on HM Treasury’s website.
ADDIT IONAL ANALYSES
Historical series for the main fiscal aggregates are included in Tables C17 and C18. C.110 Further information on general government transactions and more detailed breakdowns of the public sector are included in Budget 2010: the economy and public finances – supplementary material, along with a detailed description of the conventions used in presenting the public finances.
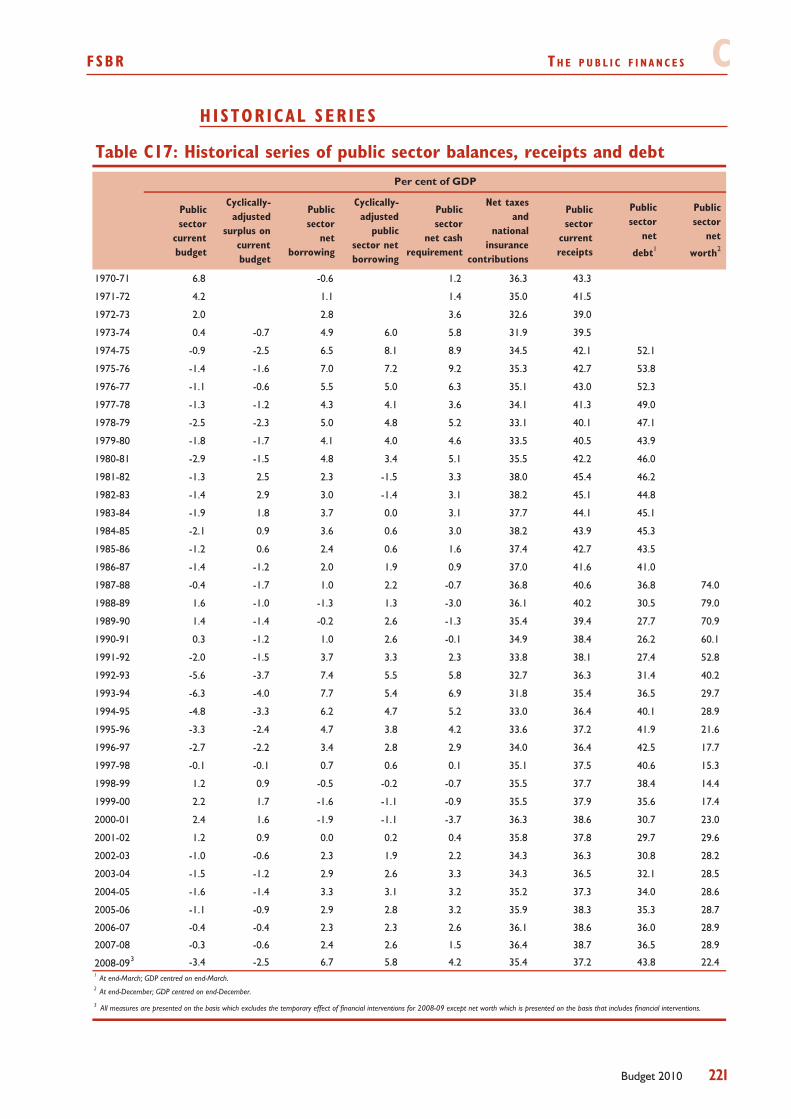
fsbR T h e p u b l i c f i n a n c e s c
221Budget 2010
HISTORICAL SER IES
Table C17: Historical series of public sector balances, receipts and debt
Public sector
current budget
Cyclically-adjusted
surplus on current budget
Public sector
net borrowing
Cyclically-adjusted
public sector net borrowing
Public sector
net cash requirement
Net taxes and
national insurance
contributions
Public sector
current receipts
Public sector
net
debt1
Public sector
net
worth2
1970-71 6.8 -0.6 1.2 36.3 43.3
1971-72 4.2 1.1 1.4 35.0 41.5
1972-73 2.0 2.8 3.6 32.6 39.0
1973-74 0.4 -0.7 4.9 6.0 5.8 31.9 39.5
1974-75 -0.9 -2.5 6.5 8.1 8.9 34.5 42.1 52.1
1975-76 -1.4 -1.6 7.0 7.2 9.2 35.3 42.7 53.8
1976-77 -1.1 -0.6 5.5 5.0 6.3 35.1 43.0 52.3
1977-78 -1.3 -1.2 4.3 4.1 3.6 34.1 41.3 49.0
1978-79 -2.5 -2.3 5.0 4.8 5.2 33.1 40.1 47.1
1979-80 -1.8 -1.7 4.1 4.0 4.6 33.5 40.5 43.9
1980-81 -2.9 -1.5 4.8 3.4 5.1 35.5 42.2 46.0
1981-82 -1.3 2.5 2.3 -1.5 3.3 38.0 45.4 46.2
1982-83 -1.4 2.9 3.0 -1.4 3.1 38.2 45.1 44.8
1983-84 -1.9 1.8 3.7 0.0 3.1 37.7 44.1 45.1
1984-85 -2.1 0.9 3.6 0.6 3.0 38.2 43.9 45.3
1985-86 -1.2 0.6 2.4 0.6 1.6 37.4 42.7 43.5
1986-87 -1.4 -1.2 2.0 1.9 0.9 37.0 41.6 41.0
1987-88 -0.4 -1.7 1.0 2.2 -0.7 36.8 40.6 36.8 74.0
1988-89 1.6 -1.0 -1.3 1.3 -3.0 36.1 40.2 30.5 79.0
1989-90 1.4 -1.4 -0.2 2.6 -1.3 35.4 39.4 27.7 70.9
1990-91 0.3 -1.2 1.0 2.6 -0.1 34.9 38.4 26.2 60.1
1991-92 -2.0 -1.5 3.7 3.3 2.3 33.8 38.1 27.4 52.8
1992-93 -5.6 -3.7 7.4 5.5 5.8 32.7 36.3 31.4 40.2
1993-94 -6.3 -4.0 7.7 5.4 6.9 31.8 35.4 36.5 29.7
1994-95 -4.8 -3.3 6.2 4.7 5.2 33.0 36.4 40.1 28.9
1995-96 -3.3 -2.4 4.7 3.8 4.2 33.6 37.2 41.9 21.6
1996-97 -2.7 -2.2 3.4 2.8 2.9 34.0 36.4 42.5 17.7
1997-98 -0.1 -0.1 0.7 0.6 0.1 35.1 37.5 40.6 15.3
1998-99 1.2 0.9 -0.5 -0.2 -0.7 35.5 37.7 38.4 14.4
1999-00 2.2 1.7 -1.6 -1.1 -0.9 35.5 37.9 35.6 17.4
2000-01 2.4 1.6 -1.9 -1.1 -3.7 36.3 38.6 30.7 23.0
2001-02 1.2 0.9 0.0 0.2 0.4 35.8 37.8 29.7 29.6
2002-03 -1.0 -0.6 2.3 1.9 2.2 34.3 36.3 30.8 28.2
2003-04 -1.5 -1.2 2.9 2.6 3.3 34.3 36.5 32.1 28.5
2004-05 -1.6 -1.4 3.3 3.1 3.2 35.2 37.3 34.0 28.6
2005-06 -1.1 -0.9 2.9 2.8 3.2 35.9 38.3 35.3 28.7
2006-07 -0.4 -0.4 2.3 2.3 2.6 36.1 38.6 36.0 28.9
2007-08 -0.3 -0.6 2.4 2.6 1.5 36.4 38.7 36.5 28.9
2008-093 -3.4 -2.5 6.7 5.8 4.2 35.4 37.2 43.8 22.41 At end-March; GDP centred on end-March.2 At end-December; GDP centred on end-December.
Per cent of GDP
3 All measures are presented on the basis which excludes the temporary effect of financial interventions for 2008-09 except net worth which is presented on the basis that includes financial interventions.
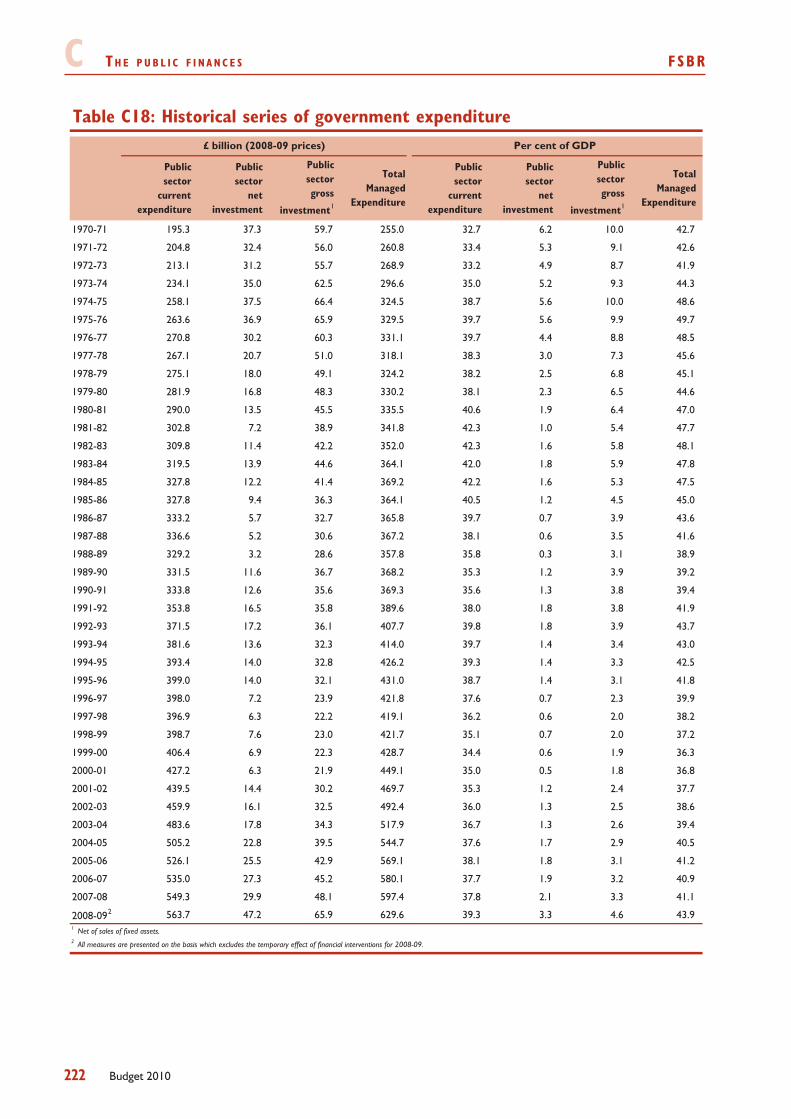
c T h e p u b l i c f i n a n c e s fsbR
222 Budget 2010
Table C18: Historical series of government expenditure
Public sector
current expenditure
Public sector
net investment
Public sector gross
investment1
Total Managed
Expenditure
Public sector
current expenditure
Public sector
net investment
Public sector gross
investment1
Total Managed
Expenditure
1970-71 195.3 37.3 59.7 255.0 32.7 6.2 10.0 42.7
1971-72 204.8 32.4 56.0 260.8 33.4 5.3 9.1 42.6
1972-73 213.1 31.2 55.7 268.9 33.2 4.9 8.7 41.9
1973-74 234.1 35.0 62.5 296.6 35.0 5.2 9.3 44.3
1974-75 258.1 37.5 66.4 324.5 38.7 5.6 10.0 48.6
1975-76 263.6 36.9 65.9 329.5 39.7 5.6 9.9 49.7
1976-77 270.8 30.2 60.3 331.1 39.7 4.4 8.8 48.5
1977-78 267.1 20.7 51.0 318.1 38.3 3.0 7.3 45.6
1978-79 275.1 18.0 49.1 324.2 38.2 2.5 6.8 45.1
1979-80 281.9 16.8 48.3 330.2 38.1 2.3 6.5 44.6
1980-81 290.0 13.5 45.5 335.5 40.6 1.9 6.4 47.0
1981-82 302.8 7.2 38.9 341.8 42.3 1.0 5.4 47.7
1982-83 309.8 11.4 42.2 352.0 42.3 1.6 5.8 48.1
1983-84 319.5 13.9 44.6 364.1 42.0 1.8 5.9 47.8
1984-85 327.8 12.2 41.4 369.2 42.2 1.6 5.3 47.5
1985-86 327.8 9.4 36.3 364.1 40.5 1.2 4.5 45.0
1986-87 333.2 5.7 32.7 365.8 39.7 0.7 3.9 43.6
1987-88 336.6 5.2 30.6 367.2 38.1 0.6 3.5 41.6
1988-89 329.2 3.2 28.6 357.8 35.8 0.3 3.1 38.9
1989-90 331.5 11.6 36.7 368.2 35.3 1.2 3.9 39.2
1990-91 333.8 12.6 35.6 369.3 35.6 1.3 3.8 39.4
1991-92 353.8 16.5 35.8 389.6 38.0 1.8 3.8 41.9
1992-93 371.5 17.2 36.1 407.7 39.8 1.8 3.9 43.7
1993-94 381.6 13.6 32.3 414.0 39.7 1.4 3.4 43.0
1994-95 393.4 14.0 32.8 426.2 39.3 1.4 3.3 42.5
1995-96 399.0 14.0 32.1 431.0 38.7 1.4 3.1 41.8
1996-97 398.0 7.2 23.9 421.8 37.6 0.7 2.3 39.9
1997-98 396.9 6.3 22.2 419.1 36.2 0.6 2.0 38.2
1998-99 398.7 7.6 23.0 421.7 35.1 0.7 2.0 37.2
1999-00 406.4 6.9 22.3 428.7 34.4 0.6 1.9 36.3
2000-01 427.2 6.3 21.9 449.1 35.0 0.5 1.8 36.8
2001-02 439.5 14.4 30.2 469.7 35.3 1.2 2.4 37.7
2002-03 459.9 16.1 32.5 492.4 36.0 1.3 2.5 38.6
2003-04 483.6 17.8 34.3 517.9 36.7 1.3 2.6 39.4
2004-05 505.2 22.8 39.5 544.7 37.6 1.7 2.9 40.5
2005-06 526.1 25.5 42.9 569.1 38.1 1.8 3.1 41.2
2006-07 535.0 27.3 45.2 580.1 37.7 1.9 3.2 40.9
2007-08 549.3 29.9 48.1 597.4 37.8 2.1 3.3 41.1
2008-092 563.7 47.2 65.9 629.6 39.3 3.3 4.6 43.91 Net of sales of fixed assets.
Per cent of GDP£ billion (2008-09 prices)
2 All measures are presented on the basis which excludes the temporary effect of financial interventions for 2008-09.
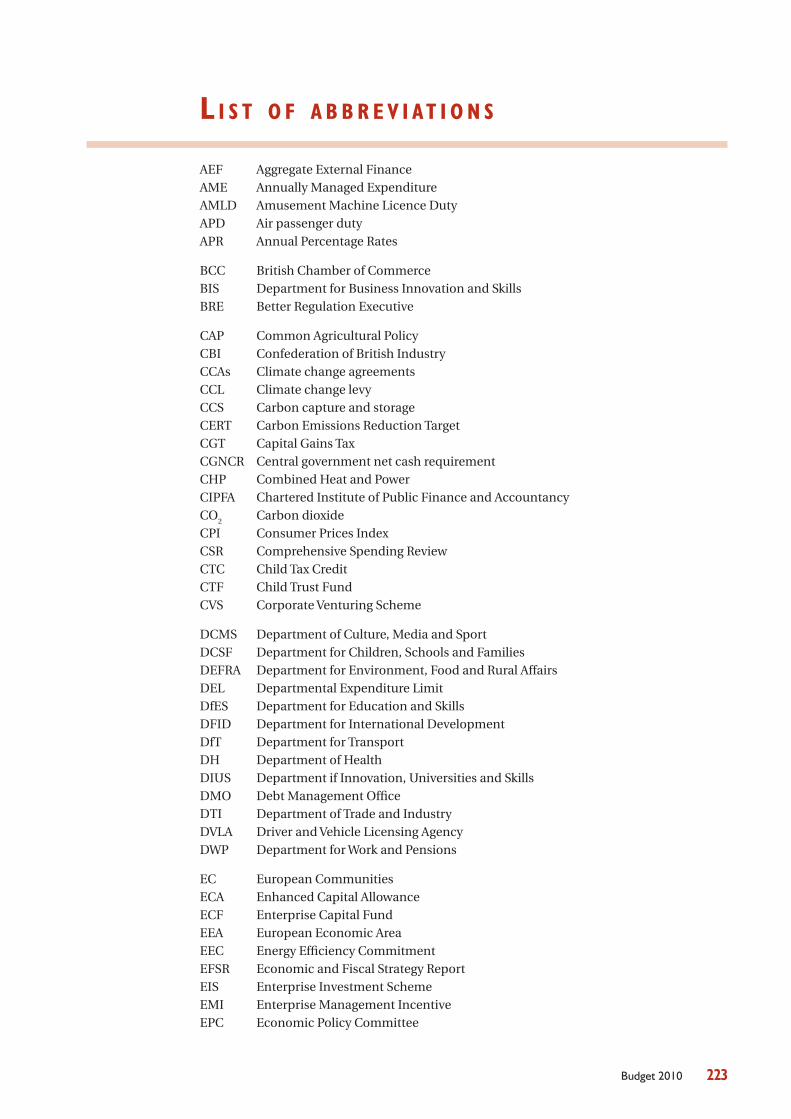
223Budget 2010
L i s t o f a b b r e v i a t i o n s
AEF Aggregate External FinanceAME Annually Managed ExpenditureAMLD Amusement Machine Licence DutyAPD Air passenger dutyAPR Annual Percentage Rates
BCC British Chamber of CommerceBIS Department for Business Innovation and SkillsBRE Better Regulation Executive
CAP Common Agricultural PolicyCBI Confederation of British IndustryCCAs Climate change agreementsCCL Climate change levyCCS Carbon capture and storageCERT Carbon Emissions Reduction TargetCGT Capital Gains TaxCGNCR Central government net cash requirementCHP Combined Heat and PowerCIPFA Chartered Institute of Public Finance and AccountancyCO
2 Carbon dioxide
CPI Consumer Prices IndexCSR Comprehensive Spending ReviewCTC Child Tax CreditCTF Child Trust FundCVS Corporate Venturing Scheme
DCMS Department of Culture, Media and SportDCSF Department for Children, Schools and FamiliesDEFRA Department for Environment, Food and Rural AffairsDEL Departmental Expenditure LimitDfES Department for Education and SkillsDFID Department for International DevelopmentDfT Department for TransportDH Department of HealthDIUS Department if Innovation, Universities and Skills DMO Debt Management OfficeDTI Department of Trade and IndustryDVLA Driver and Vehicle Licensing AgencyDWP Department for Work and Pensions
EC European CommunitiesECA Enhanced Capital AllowanceECF Enterprise Capital FundEEA European Economic AreaEEC Energy Efficiency CommitmentEFSR Economic and Fiscal Strategy ReportEIS Enterprise Investment SchemeEMI Enterprise Management IncentiveEPC Economic Policy Committee
224 Budget 2010
ESA Employment and Support AllowanceESA95 European System of Accounts 1995EU European UnionEU ETS EU Emissions Trading Scheme
FDI Foreign direct investmentFE Further EducationFRS Financial Reporting StandardFSA Financial Services AuthorityFSBR Financial Statement and Budget Report
G7 A group of seven major industrial nations (comprising: Canada, France, Germany, Italy, Japan, UK and US).
G8 The G8 is an informal group of eight countries: Canada, France, Germany, Italy, Japan, Russia, the UK and the US.
G20 A group of 20 Finance Ministers and Central Bank Governors representing nineteen countries plus the European Community
GAAP Generally Accepted Accounting PracticesGAD Government Actuary's DepartmentGCSE General Certificate of Secondary EducationGDP Gross Domestic ProductGGNB General government net borrowingGLA Greater London AuthorityGNI Gross National IncomeGVA Gross Value Added
HB Housing BenefitHMRC Her Majesty’s Revenue and CustomsHMT Her Majesty's Treasury
IAS International Accounting StandardsIB Incapacity BenefitIFRS International Financial Reporting StandardsIFS Institute for Fiscal StudiesIHT Inheritance TaxILO International Labour OrganisationIMF International Monetary FundIPCC Intergovernmental Panel on Climate ChangeISA Individual Savings AccountISB Invest to Save Budget IWC In Work Credit
JSA Jobseeker’s Allowance
LASFE Local authority self-financed expenditureLATS Landfill Allowance Trading SchemeLFS Labour Force SurveyLHA Local Housing AllowanceLIBOR London Inter-Bank Offered RateLPG Liquefied petroleum gasLTCS Landfill Tax Credit SchemeLTPFR Long Term Public Finance Report LSC Learning and Skills Council
225Budget 2010
MDGs Millennium Development GoalsMDRs Marginal deduction ratesMDRI Multilateral Debt Relief InitiativeMIG Minimum Income GuaranteeMoD Ministry of DefenceMORI Market and Opinion Research InternationalMPC Monetary Policy CommitteeMTIC Missing Trader Intra-Community
NAO National Audit OfficeNCIS National Criminal Intelligence ServiceNEET Not in education, employment or trainingNHS National Health ServiceNICs National Insurance ContributionsNIESR National Institute of Economic and Social ResearchNMW National Minimum WageNVQ National Vocational Qualification
ODPM Office of the Deputy Prime MinisterOECD Organisation for Economic Cooperation and DevelopmentOFCOM Office of CommunicationsOFGEM Office of Gas and Electricity MarketsOFT Office of Fair TradingOGC Office of Government CommerceONS Office for National StatisticsOPEC Organisation of Petroleum Exporting Countries
PAC Public Accounts CommitteePAYE Pay As You EarnPBR Pre-Budget ReportPCT Primary Care TrustPEP Personal Equity PlanPFI Private Finance InitiativePGS Planning-gain SupplementPSA Public Service AgreementPSNB Public sector net borrowingPSNI Public sector net investment
R&D Research and DevelopmentRDA Regional Development AgencyREITs Real Estate Investment Trusts RES Regional Economic StrategyRPI Retail Prices IndexRPIX Retail Prices Index excluding mortgage interest paymentsRTFO Renewable Transport Fuels Obligation
SBRI Small Business Research InitiativeSDLT Stamp Duty Land TaxSDRT Stamp Duty Reserve TaxSERPS State Earnings Related Pension SchemeSFLG Small Firms Loan GuaranteeSME Small and medium-sized enterpriseSTEM Science Technology Engineering and Mathematics
226 Budget 2010
TME Total Managed ExpenditureTSB Technology Strategy Board
UKFI United Kingdom Financial Investments
VAT Value Added TaxVCT Venture Capital TrustVED Vehicle excise duty
WGA Whole of Government AccountsWTC Working Tax Credit
L IST OF TABLES
Economic and F i s ca l S t ra tegy Repor t1.1 Meeting the fiscal rules1.2 Budget 2010 policy decisions
2.1 Summary of UK forecast2.2 Changes to the fiscal aggregates2.3 Fiscal balances compared with Budget 20092.4 Central government net cash requirement and gilt sales
5.1 Weekly minimum income guarantees 5.2 Marginal deduction rates
6.1 Contribution by departments to cross-cutting efficiencies
7.1 The environmental impacts of measures in Budget 2010
F inanc i a l S t a tement and Budge t Repor tA1 Budget 2010 policy decisions A2 Other measures announced at the Pre-Budget Report 2009A3 Bands of taxable income A4 Income tax allowances A5 Class 1 National Insurance contribution rates 2010-11A6 Self-employed National Insurance contribution rates 2010-11A7 Working and Child Tax Credit rates and thresholdsA8a VED bands and rates for cars registered after 1 March 2001 (graduated VED)A8b VED bands and rates for private and light goods vehicles registered before 1 March
2001 (pre-graduated VED)A9 Changes to tobacco dutiesA10 Changes to alcohol dutiesA11 Measures announced in Budget 2009 or earlier which take effect from April 2010 or
later
B1 The world economyB2 Contributions to trend output growthB3 Summary of UK forecastB4 Contributions to GDP growthB5 Household sector expenditure and income
227Budget 2010
B6 Gross fixed capital formationB7 Trade in goods and servicesB8 Budget and independent forecasts B9 Summary of economic forecastsB10 Gross domestic product and its components
C1 Economic assumptions for the public finance projections C2 Summary of public sector financesC3 Current and capital budgetsC4 Current and capital budgetsC5 Changes to the fiscal aggregatesC6 Current receiptsC7 Current receipts as a proportion of GDPC8 Net taxes and national insurance contributionsC9 Total Managed Expenditure 2008-09 to 2010-11C10 Changes to Total Managed Expenditure since the 2009 Pre-Budget ReportC11 Departmental Expenditure Limits – resource and capital budgetsC12 Financial interventions – impact on PSNBC13 Financial interventions – impact on PSNDC14 Financial interventions – impact on CGNCRC15 Public sector net cash requirementC16 Financing requirement forecastC17 Historical series of public sector balances, receipts and debtC18 Historical series of government expenditure
L IST OF CHARTS
Economic and F i s ca l S t ra tegy Repor t1.1 Government spending by function1.2 Government receipts
2.1 Inflation performance and expectations 2.2 Change in projection of cyclically-adjusted net borrowing2.3 Meeting the fiscal consolidation plan2.4 Balancing the cyclically-adjusted current budget2.5 Fiscal policy supporting economic stability
5.1 UK employment and unemployment rates5.2 Claimant count, inflows and outflows 5.3 Average annual gain (£) from 1997 to 2010
7.1 The UK’s expected emissions reductions to 2020, and how different sectors contribute
7.2 Average new car CO2 emissions in the UK (2000-08)
F inanc i a l S t a tement and Budge t Repor tB1 Official interest rates in the major advanced economiesB2 G7 GDP and world tradeB3 The output gap
228 Budget 2010
B4 Gross Domestic Product (GDP)B5 The path of GDP growth through recoveriesB6 CPI inflation B7 Balance of payments current accountB8 Output profiles
C1 Tax-GDP ratioC2 Total Managed Expenditure
Cover photography:Department for Business, Innovation and Skills
Getty Images / Kim Steele
Transport for London
Getty Images / Jane Florio