Embed Size (px)
Citation preview
BUILDING ASTRONGERENTERPRISE Annual Report 2011-12
Statements in this report that describe
the Company’s objectives, projections,
estimates, expectations or predictions of
the future may be ‘forward-looking
statements’ within the meaning of the
applicable securities laws and
regulations. The Company cautions that
such statements involve risks and
uncertainty and that actual results could
differ materially from those expressed or
implied. Important factors that could
cause differences include raw materials’
cost or availability, cyclical demand and
pricing in the Company’s principal
markets, changes in government
regulations, economic developments
within the countries in which the
Company conducts business, and other
factors relating to the Company’s
operations, such as litigation, labour
negotiations and fiscal regimes.
Forward-looking statement
CONTENTS
Corporate identity 2Highlights, 2011-12 4CEO’s review 10Strengths 12Management discussion and analysis 14Financial statement analysis 24Risk management 26Five-year financials 28Directors’ report 30Report on corporate governance 36Financial section 49
For a number of years, we hadstrengthened our business
through a combination ofmanufacture and prudentoutsourcing.
This business model worked well forour Company. We reportedhandsome profits in 45 years out ofthe 47 years of our existence. Duringthis period, we emerged as one ofthe highest margin tile companiesIndia.
In 2011-12, we reported a loss of Rs. 55.45 crore on account of a sharpfluctuation in the value of the Indiancurrency.
At Nitco, we are capitalising on thisexperience to create a stronger andprogressively de-risked company withthe objective to return the Companyto profits, high margins andenhanced shareholder value.
2 | NITCO Limited Innovation for a better life
“IF IT IS INNOVATIVE, IT MUST BE FROM NITCO.” THIS ONE LINE VOICED BY OUR TILE ANDMARBLE CUSTOMERS ACROSS THE COUNTRYHAS UNDERLINED WHAT WE HAVE ALWAYSSTOOD FOR – A PRIDE-ENHANCING PRODUCT. THE RESULT IS THAT NITCO HAS GROWNREVENUES AT A CAGR OF 21 PER CENT IN THEFIVE YEARS LEADING TO 2011-12. PAST INSPIRES. PRIDE WORKS. PASSION PAYS.
BACKGROUNDNitco (established in 1966 by Mr. Pran Nath
Talwar) is among the top premium tile companies
in India
The Company is headed by Mr. Vivek Talwar
(Managing Director)
The Company diversified into the business of
property development in 2007, leveraging
decades of experience of the building materials
industry
PRODUCT PORTFOLIO(The capacity for the entire Alibaug plant is 80.85 lakh Sqm. There is no separate capacity according to separate category of tiles)
Products Portfolio
Floor tiles Ceramic tiles, vitrified tiles, polished glazed vitrified tiles,
naturoc gres tiles and duracottura tiles
Wall tiles HD digital tiles and mosaic highlighters
Marble Natural marble and engineered marble
Mosaic Signature collection, magnum opus collection, décor
collection, solitaire collection, naturale collection,
crust collection, frame collection, steps, risers and skirting
EXPERTISE Nitco is one of India’s largest floor tiles manufacturers
The Company’s tile manufacturing facility is located in Alibaug
(off Mumbai) with an installed capacity of 80.85 Lakhs Sq mt
(as on 31st March 2012); the plant’s fuel supplies are assured
through a 5.5 MW gas-based cogeneration power plant
The Company’s marble cutting and processing facilities are
located at Kanjurmarg (Mumbai) and Silvassa (Dadra and Nagar
Haveli)
Annual Report 2011-12 | 3
PRESENCEThe Company is headquartered in Mumbai, India
Its pan-India presence is facilitated through 30 offices
Its strong and vibrant distribution network comprises
1100 dealers and 5500 sub-dealers
The Company exports 1% of its tile volumes to 24
countries (including the US, Canada, Oman and the UAE
as well as countries from Europe, Africa)
The Company’s shares are listed on the BSE and NSE.
The promoters own 48.90% of the Company’s equity.
The Company enjoyed a market capitalisation of
Rs. 124 crore as on 31st March, 2012
VISION To be better and faster than everybody else in the
business
MISSION To launch innovative and world-class products to help
customers realise their dreams
To manufacture products of the highest quality,
creating industry benchmarks
To be fast and flexible to be grasp opportunities in a
fast-changing world
To be transparent and fair to customers, shareholders,
suppliers and employees in all our dealings
PIONEERINGThe Company produces safe lead-free glazed tiles, using
lead-free inputs from Europe.
The Company is the only Indian tile manufacturer (and
one of 30 in the world) to have introduced rustic tiles
reconciling a unique ‘dry powder application’ technology
leading to a natural stone look. The uniqueness of the
technology is that tiles with undulated surface can be
decorated using special glazes to replicate the aesthetic
finish of natural stone.
The Company introduced super gloss floor tiles (with
enhanced aesthetic finish similar to natural marble), dirt-
free and anti-bacterial (nano-coated) and scratch resistant
tiles.
The Company introduced 600x600 mm glazed vitrified
tiles, one of the largest in the country
The Company introduced 100% matt finish tiles in satin
and rustic finish with anti-skid properties addressing
medium and heavy traffic
The Company introduced dirt-free tiles leveraging
unique sharp-edge technology wherein tiles are cut to a
perfect square ensuring minimal joints following laying
resulting in lower dirt accumulation; besides, the micro
porosity makes the tiles dirt-free and antibacterial.
The Company introduced rectangular wood strips for
the first time in India, the product reconciling the texture
and colours of natural wood with superior porcelain tile
quality. These durable products do not need lower
maintenance than traditional wood flooring.
AWARDS AND ACCREDITATIONThe Alibaug plant is certified for ISO 9001:2008, ISO
14001:2004 and OHSAS 18001:2007
The corporate office has been certified for ISO
9001:2008
Awarded 13 Capexil awards for innovation and design
Won two Construction World awards
Awarded the ‘Best SAP Project Implementation’ by SAP
India
Won the ‘Quality Excellence Award for Processing Unit’
in Silvassa
Bagged the ‘Building Industry Leadership Award 2007’
from the Builder Information Bureau
4 | NITCO Limited Innovation for a better life
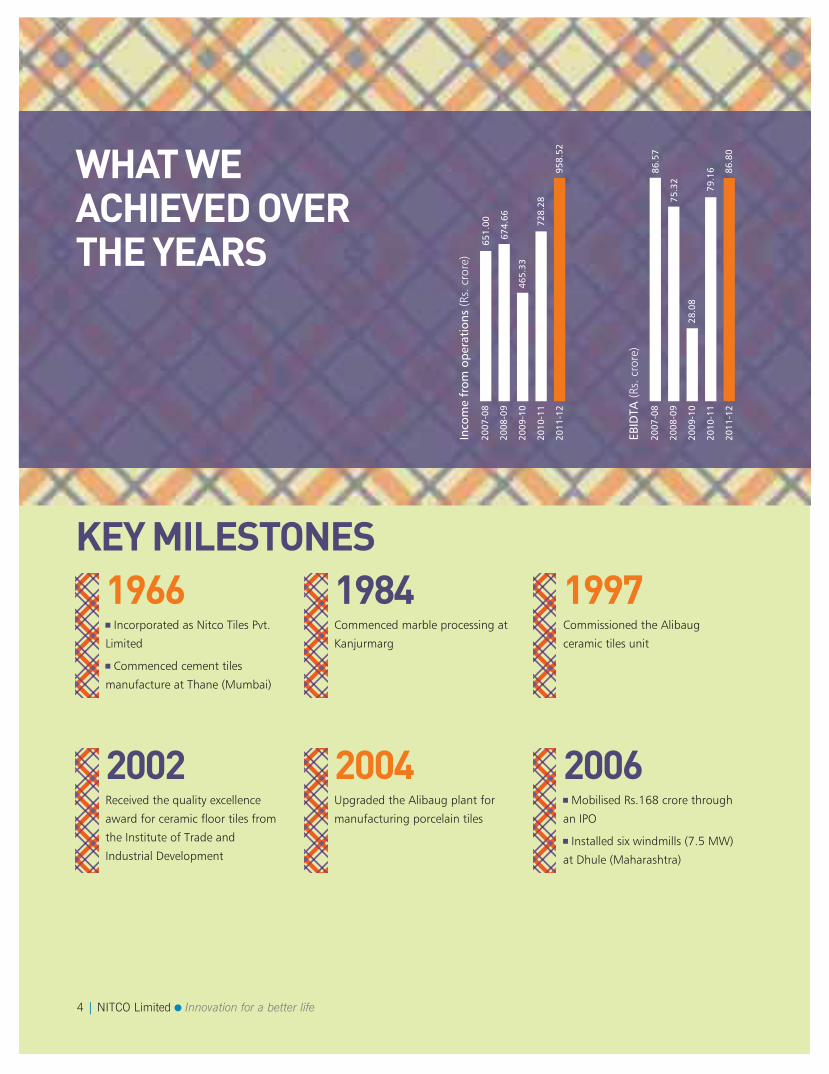
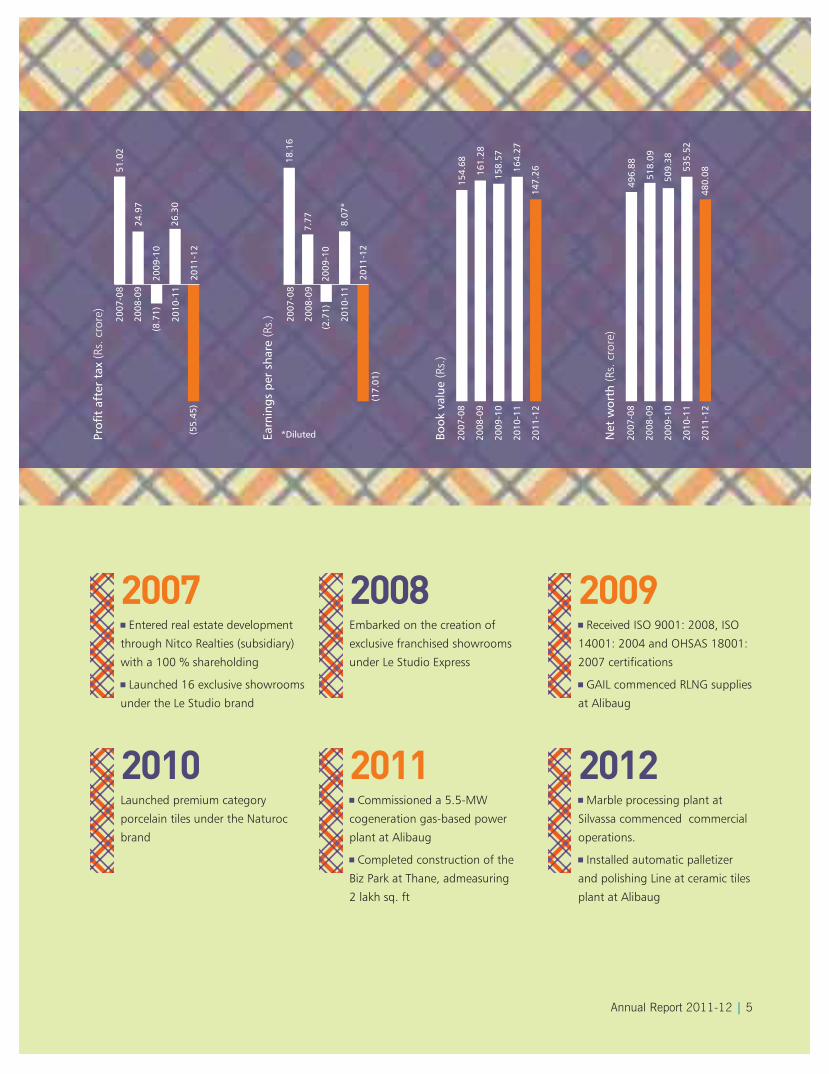
WHAT WEACHIEVED OVERTHE YEARS
KEY MILESTONES1966
2007
-08
2008
-09
2009
-10
2010
-11
2011
-12
Inco
me
from
ope
rati
ons
(Rs.
cro
re)
651.
00
674.
66 728.
28
465.
33
958.
52
2007
-08
2008
-09
2009
-10
2010
-11
2011
-12
EBID
TA (R
s. c
rore
)
86.5
7
75.3
2
79.1
6
28.0
8
86.8
0
Incorporated as Nitco Tiles Pvt.
Limited
Commenced cement tiles
manufacture at Thane (Mumbai)
1997Commissioned the Alibaug
ceramic tiles unit
2004Upgraded the Alibaug plant for
manufacturing porcelain tiles
1984 Commenced marble processing at
Kanjurmarg
2002 Received the quality excellence
award for ceramic floor tiles from
the Institute of Trade and
Industrial Development
2006Mobilised Rs.168 crore through
an IPO
Installed six windmills (7.5 MW)
at Dhule (Maharashtra)
Annual Report 2011-12 | 5
Prof
it a
fter
tax
(Rs.
cro
re)
51.0
2
24.9
7
26.3
0
(8.7
1)
(55.
45)
Earn
ings
per
sha
re (R
s.)
18.1
6
7.77 8.07
*
(2.7
1)
(17.
01)
2011
-12
2011
-12
2010
-11
2010
-11
2008
-09
2008
-09
2007
-08
2007
-08
*Diluted
2009
-10
2009
-10
2007
-08
2008
-09
2009
-10
2010
-11
2011
-12
Book
val
ue (R
s.)
154.
68
161.
28
164.
27
158.
57
147.
26
2007
-08
2008
-09
2009
-10
2010
-11
2011
-12
Net
wor
th (R
s. c
rore
)
496.
88
518.
09
535.
52
509.
38
480.
08
2007Entered real estate development
through Nitco Realties (subsidiary)
with a 100 % shareholding
Launched 16 exclusive showrooms
under the Le Studio brand
2009Received ISO 9001: 2008, ISO
14001: 2004 and OHSAS 18001:
2007 certifications
GAIL commenced RLNG supplies
at Alibaug
2011Commissioned a 5.5-MW
cogeneration gas-based power
plant at Alibaug
Completed construction of the
Biz Park at Thane, admeasuring
2 lakh sq. ft
2008Embarked on the creation of
exclusive franchised showrooms
under Le Studio Express
2010 Launched premium category
porcelain tiles under the Naturoc
brand
2012 Marble processing plant at
Silvassa commenced commercial
operations.
Installed automatic palletizer
and polishing Line at ceramic tiles
plant at Alibaug
6 | NITCO Limited Innovation for a better life
Annual Report 2011-12 | 7
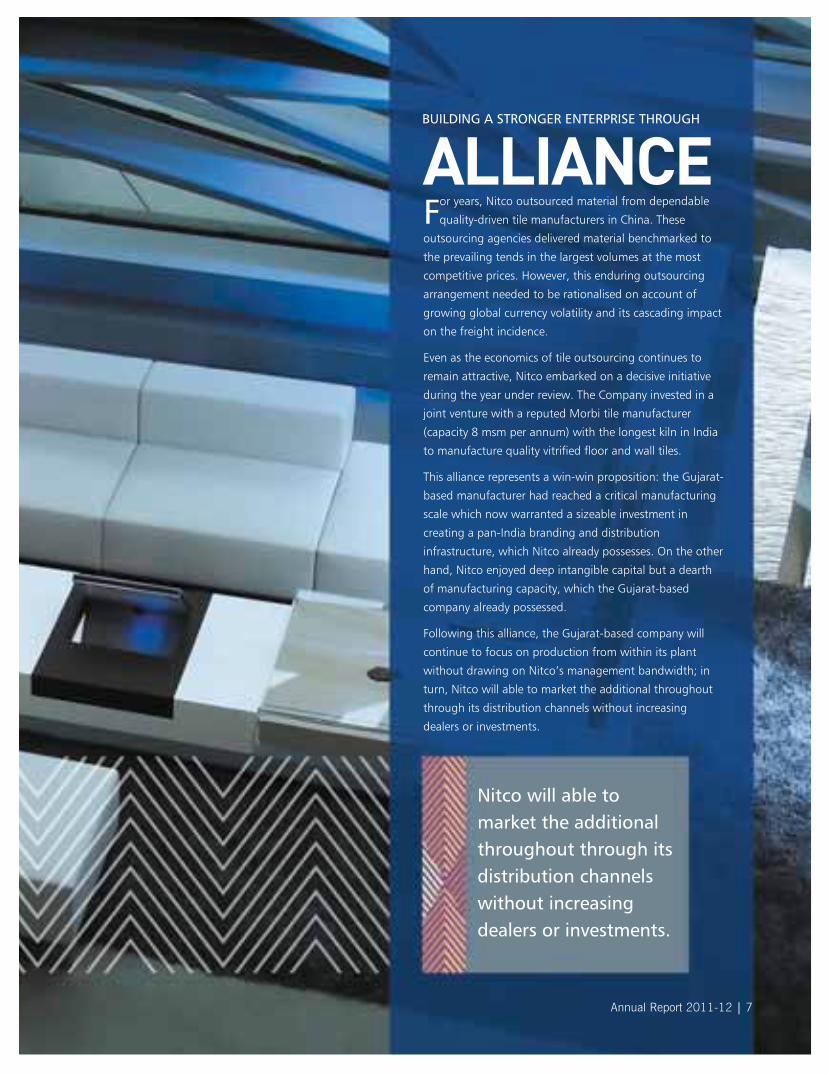
BUILDING A STRONGER ENTERPRISE THROUGH
ALLIANCEFor years, Nitco outsourced material from dependable
quality-driven tile manufacturers in China. These
outsourcing agencies delivered material benchmarked to
the prevailing tends in the largest volumes at the most
competitive prices. However, this enduring outsourcing
arrangement needed to be rationalised on account of
growing global currency volatility and its cascading impact
on the freight incidence.
Even as the economics of tile outsourcing continues to
remain attractive, Nitco embarked on a decisive initiative
during the year under review. The Company invested in a
joint venture with a reputed Morbi tile manufacturer
(capacity 8 msm per annum) with the longest kiln in India
to manufacture quality vitrified floor and wall tiles.
This alliance represents a win-win proposition: the Gujarat-
based manufacturer had reached a critical manufacturing
scale which now warranted a sizeable investment in
creating a pan-India branding and distribution
infrastructure, which Nitco already possesses. On the other
hand, Nitco enjoyed deep intangible capital but a dearth
of manufacturing capacity, which the Gujarat-based
company already possessed.
Following this alliance, the Gujarat-based company will
continue to focus on production from within its plant
without drawing on Nitco’s management bandwidth; in
turn, Nitco will able to market the additional throughout
through its distribution channels without increasing
dealers or investments.
Nitco will able tomarket the additionalthroughout through itsdistribution channelswithout increasingdealers or investments.
8 | NITCO Limited Innovation for a better life
Annual Report 2011-12 | 9
BUILDING A STRONGER ENTERPRISE THROUGH
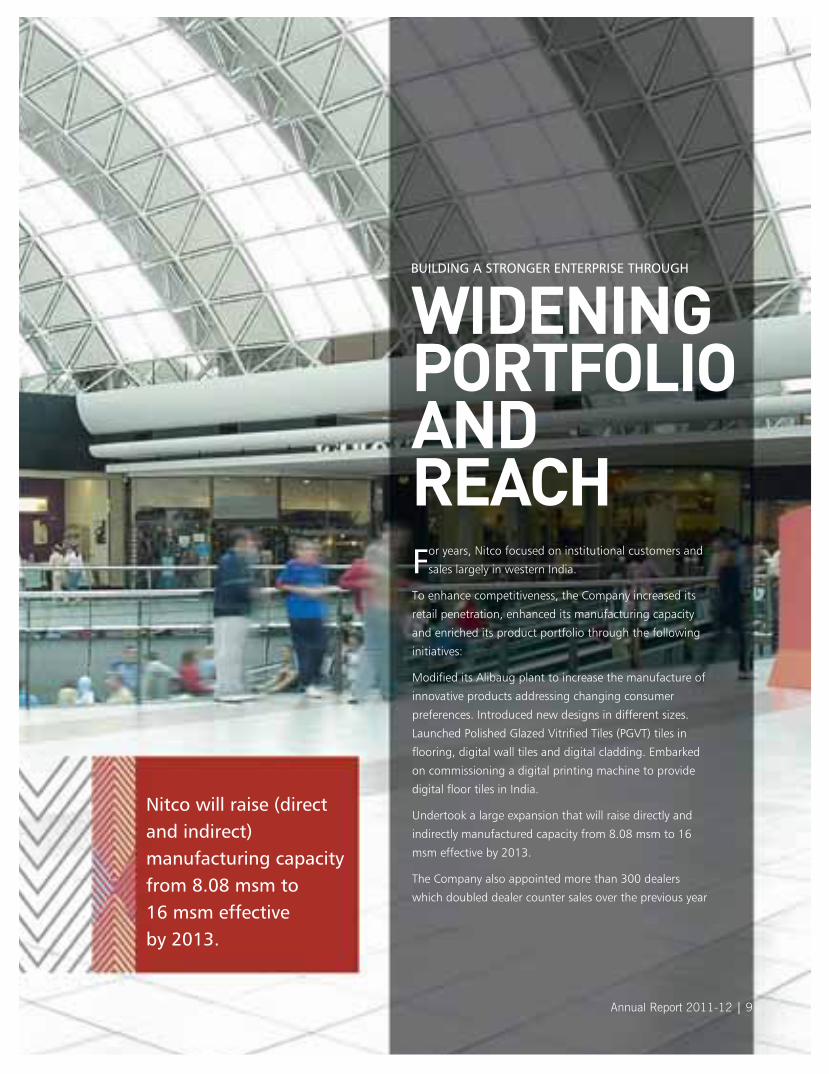
WIDENINGPORTFOLIOANDREACHFor years, Nitco focused on institutional customers and
sales largely in western India.
To enhance competitiveness, the Company increased its
retail penetration, enhanced its manufacturing capacity
and enriched its product portfolio through the following
initiatives:
Modified its Alibaug plant to increase the manufacture of
innovative products addressing changing consumer
preferences. Introduced new designs in different sizes.
Launched Polished Glazed Vitrified Tiles (PGVT) tiles in
flooring, digital wall tiles and digital cladding. Embarked
on commissioning a digital printing machine to provide
digital floor tiles in India.
Undertook a large expansion that will raise directly and
indirectly manufactured capacity from 8.08 msm to 16
msm effective by 2013.
The Company also appointed more than 300 dealers
which doubled dealer counter sales over the previous year
Nitco will raise (directand indirect)manufacturing capacityfrom 8.08 msm to 16 msm effective by 2013.
10 | NITCO Limited Innovation for a better life
OUR PRIMARY OBJECTIVE IS TORETURN NITCO TO THE BLACK,ENHANCE MARGINS ANDRESTORE OUR CORPORATEVALUATION A PERSPECTIVE BY ALOK GOEL, CEO
Q: HOW WOULD YOUEVALUATE NITCO’S 2011-12PERFORMANCE?This was one of the most challenging
years in our existence. To enable
shareholders to get a fair idea of about
how we reported the largest single
reversal in our history, it would be
important understand the enduring
nature of our business model. Nitco was
one of the first companies in India to have
successfully reconciled a manufacture and
outsource business model: the Company
selected to manufacture premium tiles
within its manufacturing facility in Alibaug
on the one hand and outsourced the
manufacture of a variety of premium
vitrified tiles on the other. At Nitco, this
asset-light approach translated into
margins that were generally higher than
the industry average. The speed derived
from the ability to respond to changes in
marketplace developments translated into
revenue growth higher than the sectoral
mean. As a result, this combination of
manufacture and outsourcing translated
into a superior volume and value
proposition.
Q: HOW WOULD YOU THENEXPLAIN THE LOSS THAT NITCOSUFFERED IN 2011-12?For a number of years, we marketed tiles
to dealers and institutional customers
and then outsourced from established
quality-respecting production lines in
China. This arrangement worked
predictably well for 10 years of a stable
currency environment. However, this
model was severely tested during the last
financial year: the Indian rupee lost
ground against the US dollar to the
extent of 25 percent in the space of only
few weeks. This sharp and sudden
depreciation did two things: one, we
were required to pay higher for our
imports and two, we were required to
earn the same from our rupee-based
sales within India. The result was that
following this currency depreciation we
were compelled to book a loss on the
import of each consignment. This
explains the sizable loss of Rs. 55.45
crore in 2011-12, which extended to a
loss of Rs. 78.57 crore in the first quarter
of the current financial year.
Q: THE BIG QUESTION IS WHATTHE COMPANY IS DOINGABOUT THIS DEVELOPMENT.At Nitco, we recognise that currency
volatility is here to stay and we cannot
continue to import and sell without
exposing our balance sheet to a large
potential downside. In view of this, the
management at Nitco resolved to sustain
its strategic outsourcing but shift from
the sourcing of material from China to
India. Besides, this India-centric
outsourcing was secured through
investment in a joint venture with a large
unorganised Gujarat-based tile
manufacturer possessing the longest kiln
in India for the manufacture of vitrified
and wall tiles. The result is that we
rationalised our Chinese imports from a
peak of 2,000 containers a month to
almost 80 containers a month, plugging
the decline with an increase in
outsourcing from our Gujarat joint
venture.
This arrangement will make it possible
for the Company to continue remaining
asset-light while leveraging logistic,
transportation and outsourcing
Annual Report 2011-12 | 11
economies. More importantly, this
arrangement will make it possible for us
to be largely insulated from currency
fluctuations on end product import,
limiting our exposure to input import,
which is being comfortably hedged
through the export of tiles. So we would
like to assure our shareholders that we
have emerged stronger from this
experience and it is only a matter of time
when the benefits of this robust
business model translate into our
financials.
Q: WHAT WERE SOME OF THEOTHER BUSINESS-STRENGTHENING INITIATIVESTAKEN BY THE COMPANY? At Nitco, even as we were affected by a
trading loss, we continued to make
business-strengthening investments:
We modified one of our ceramic lines
at our Alibaug unit to produce larger
sized (2x2 ft) tiles; we introduced new
wood-like tile designs
We launched PGVT tiles (flooring,
digital wall tiles and digital cladding),
which were well-received
We are in the process of
commissioning our digital floor tile
making machine at Alibaug
We appointed 300 more dealers,
strengthening our ability to push
material through our distribution
pipeline
Q: SHAREHOLDERS AREAPPREHENSIVE ON WHERENITCO IS NOW PLACED IN THEINDIAN TILE INDUSTRY SPACE? At Nitco, our objective is to aggregate
our manufacturing and outsourcing
capabilities with the objective to
enhance our shelf space presence. We
expect that our Alibaug unit will be able
to deliver around 7.2 million sq m of
production at full blast while our joint
venture will be able to generate an
incremental 8 million sq m per annum.
However, we recognise that this is not
going to be enough as Nitco has
generated an aggregate 10.5 million sq
m in a year like 2010-11 when its
outsourcing cum manufacturing model
was in full evidence. Therefore, the
principal objective at Nitco will be to
seek more outsourcing arrangements,
bring these capacities to the marketplace
with speed and grow our shelf space
presence as a decisive step towards
increased market share.
Q: IS THE INDIANMARKETPLACE CONDUCIVEFOR THIS DEVELOPMENT?At Nitco, our strategy is compatible with
the needs, trends and realities of the
Indian marketplace. With real estate
values rising, the cost of a tile as a
percentage of the finished cost of
creating a new home has declined.
Concurrently, there has been a growing
sense of pride and aspiration across a
larger number of people and a growing
preference for value-added tiles down to
Tier II and Tier III Indian cities. What is
pleasantly surprising is that even as the
country is passing through a marked
slowdown in construction activity, the
market is becoming broader and deeper.
A combination of these realities has
catalysed the growth of India’s tile
sector over the last few years, marked by
improved financials of manufacturers,
investment in retail-based distribution,
increase in manufacturing capacities and
a growing number of outsourcing-linked
alliances.
Q: HOW DOES THE COMPANYINTEND TO ENHANCESHAREHOLDER VALUE? At Nitco, the idea is to de-risk the
business model at one end and
maximize value at the other. So let me
address these subjects separately:
De-risking: We will progressively develop
our real estate portfolio without
enhancing our working capital outlay,
generate attractive accruals and
progressively pare down debt. We
intend to remain asset-light, reduce our
exposure to currency, commodity and
marketplace volatility.
Value-addition: We expect to increase
the first pass proportion of our
manufactured tiles from 76 per cent
(2010-11) to 80 per cent. We also
expect to increase the value-added
proportion of our product mix from 35
per cent to 38 - 40 per cent and in
doing so strengthen our realisations per
sq m from an average Rs. 514 per sq m
in 2011-12.
I would end by stating that one of my
key result areas is an increase in
shareholder value. We are painfully
aware that our market capitalisation at
less than Rs. 100 crore is way below the
intrinsic value of our brand and
undeveloped real estate portfolio. Our
primary objective is to return the
Company to the black starting from the
fourth quarter of the current financial
year and then scale profits with speed
with the objective to enhance investor
confidence and value.
12 | NITCO Limited Innovation for a better life
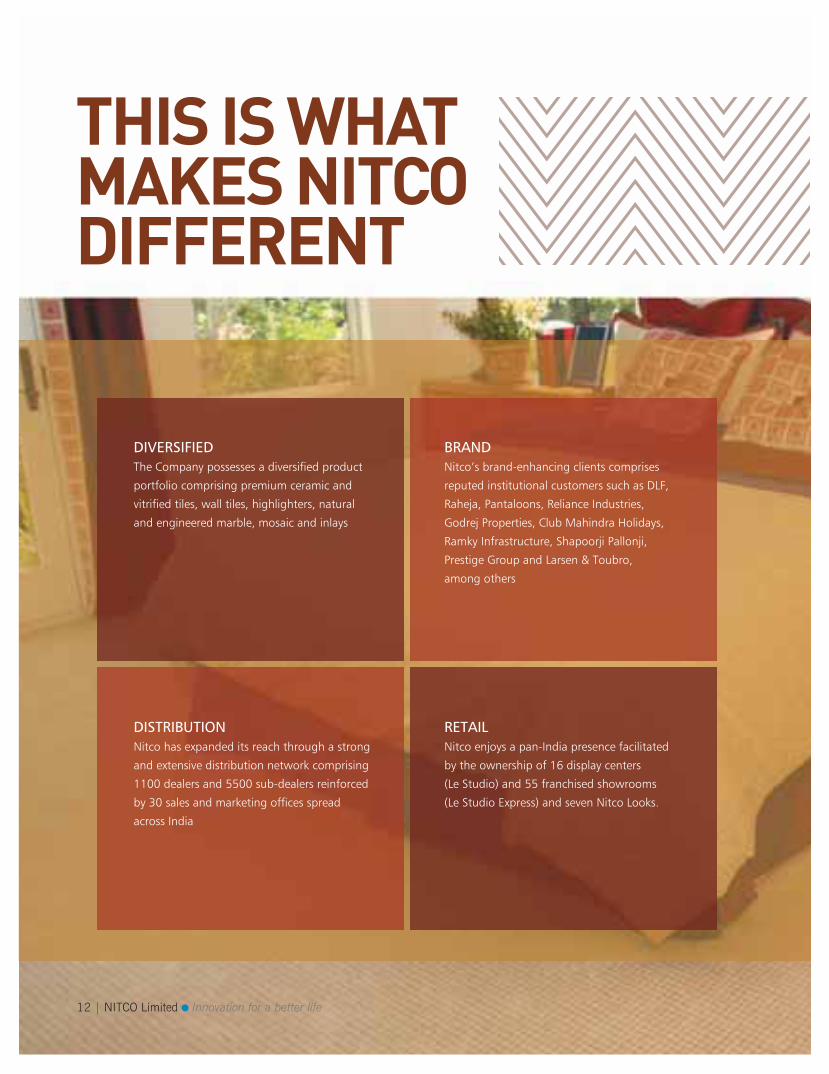
THIS IS WHATMAKES NITCODIFFERENT
DIVERSIFIEDThe Company possesses a diversified product
portfolio comprising premium ceramic and
vitrified tiles, wall tiles, highlighters, natural
and engineered marble, mosaic and inlays
BRANDNitco’s brand-enhancing clients comprises
reputed institutional customers such as DLF,
Raheja, Pantaloons, Reliance Industries,
Godrej Properties, Club Mahindra Holidays,
Ramky Infrastructure, Shapoorji Pallonji,
Prestige Group and Larsen & Toubro,
among others
RETAILNitco enjoys a pan-India presence facilitated
by the ownership of 16 display centers
(Le Studio) and 55 franchised showrooms
(Le Studio Express) and seven Nitco Looks.
DISTRIBUTIONNitco has expanded its reach through a strong
and extensive distribution network comprising
1100 dealers and 5500 sub-dealers reinforced
by 30 sales and marketing offices spread
across India
Annual Report 2011-12 | 13
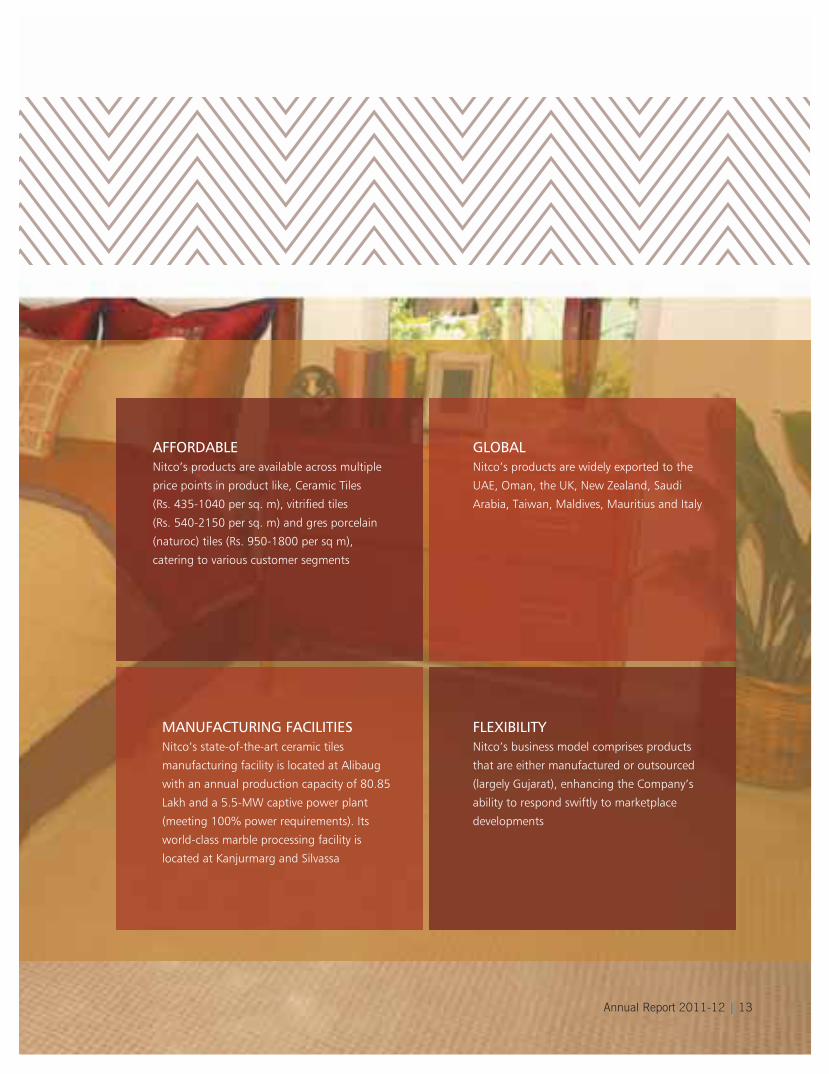
AFFORDABLENitco’s products are available across multiple
price points in product like, Ceramic Tiles
(Rs. 435-1040 per sq. m), vitrified tiles
(Rs. 540-2150 per sq. m) and gres porcelain
(naturoc) tiles (Rs. 950-1800 per sq m),
catering to various customer segments
GLOBALNitco’s products are widely exported to the
UAE, Oman, the UK, New Zealand, Saudi
Arabia, Taiwan, Maldives, Mauritius and Italy
FLEXIBILITYNitco’s business model comprises products
that are either manufactured or outsourced
(largely Gujarat), enhancing the Company’s
ability to respond swiftly to marketplace
developments
MANUFACTURING FACILITIESNitco’s state-of-the-art ceramic tiles
manufacturing facility is located at Alibaug
with an annual production capacity of 80.85
Lakh and a 5.5-MW captive power plant
(meeting 100% power requirements). Its
world-class marble processing facility is
located at Kanjurmarg and Silvassa
14 | NITCO Limited Innovation for a better life
MANAGEMENTDISCUSSIONAND ANALYSIS
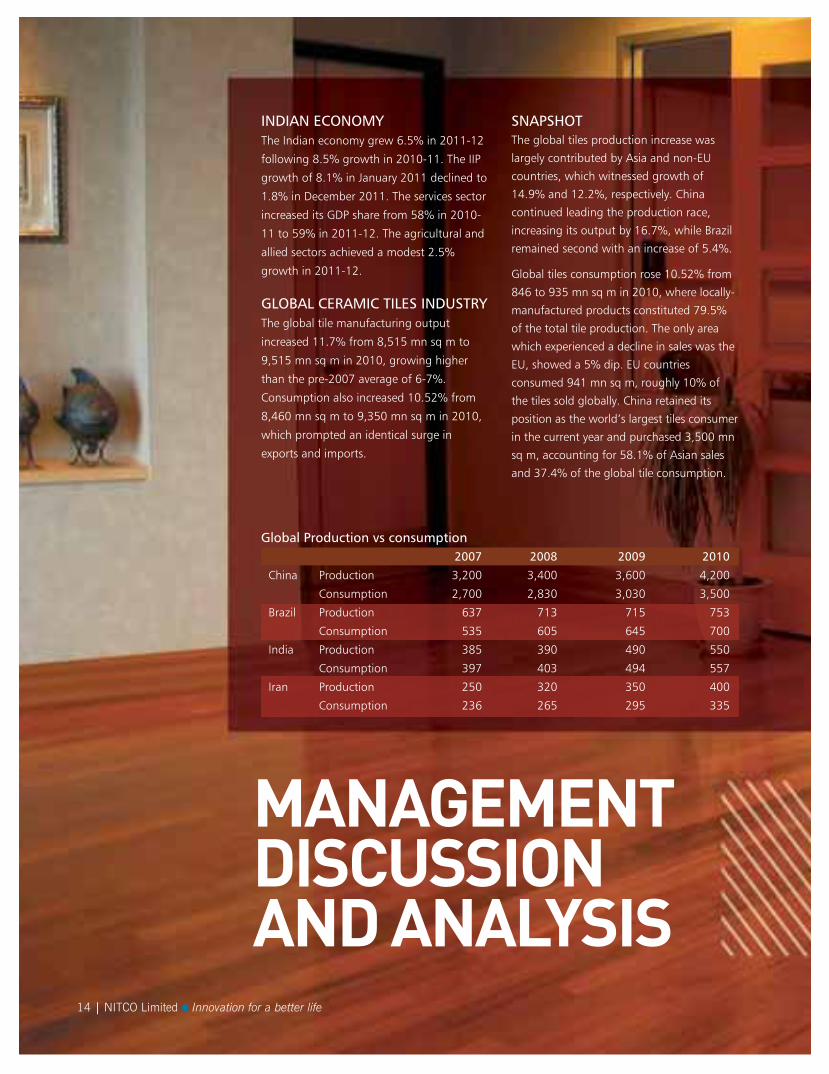
INDIAN ECONOMYThe Indian economy grew 6.5% in 2011-12
following 8.5% growth in 2010-11. The IIP
growth of 8.1% in January 2011 declined to
1.8% in December 2011. The services sector
increased its GDP share from 58% in 2010-
11 to 59% in 2011-12. The agricultural and
allied sectors achieved a modest 2.5%
growth in 2011-12.
GLOBAL CERAMIC TILES INDUSTRYThe global tile manufacturing output
increased 11.7% from 8,515 mn sq m to
9,515 mn sq m in 2010, growing higher
than the pre-2007 average of 6-7%.
Consumption also increased 10.52% from
8,460 mn sq m to 9,350 mn sq m in 2010,
which prompted an identical surge in
exports and imports.
SNAPSHOTThe global tiles production increase was
largely contributed by Asia and non-EU
countries, which witnessed growth of
14.9% and 12.2%, respectively. China
continued leading the production race,
increasing its output by 16.7%, while Brazil
remained second with an increase of 5.4%.
Global tiles consumption rose 10.52% from
846 to 935 mn sq m in 2010, where locally-
manufactured products constituted 79.5%
of the total tile production. The only area
which experienced a decline in sales was the
EU, showed a 5% dip. EU countries
consumed 941 mn sq m, roughly 10% of
the tiles sold globally. China retained its
position as the world’s largest tiles consumer
in the current year and purchased 3,500 mn
sq m, accounting for 58.1% of Asian sales
and 37.4% of the global tile consumption.
2007 2008 2009 2010
China Production 3,200 3,400 3,600 4,200
Consumption 2,700 2,830 3,030 3,500
Brazil Production 637 713 715 753
Consumption 535 605 645 700
India Production 385 390 490 550
Consumption 397 403 494 557
Iran Production 250 320 350 400
Consumption 236 265 295 335
Global Production vs consumption
Annual Report 2011-12 | 15
INDIAN TILES INDUSTRYThe Indian tiles industry (third largest
producer and consumer after China and
Brazil) is growing at an annual rate of
15% over the last few years,
outperforming the global growth of 6%
per annum. The booming demand for
tiles in the housing, retail, IT and BPO
sectors led the 12.24% production
increase in 2011, while rapid
urbanisation, rising disposable incomes
and affordability led to an increase in
Indian tiles consumption by 12.75%
during the period.
10 REASONS DRIVING TILECONSUMPTION IN INDIA Rising population: The Indian
population is expected to grow at a
CAGR of 1.2% during 2010-2020.
According to McKinsey, 590 million
people (twice the size of the US
population) will be urbanised by 2030
Burgeoning middle-class: The size of
the upper middle-class household
group is expected to grow from 58
million in 2010 to 110 million by 2020
(40% of the total national households
from 24% in 2010). This segment is
adopting international trends much
faster than expected and consumption
is moving beyond big centers to smaller
cities
Low per capita consumption: India’s
per capita tiles consumption is merely
0.46 mn sq m while the world average
is three times that at 1.20 mn sq m;
China’s average is more than five times
higher at 2.26 mn sq m
Growing urbanisation: According to
reports, India has 42 cities with more
than a million population, which is
expected to rise to 68 by 2030, which
will propel ceramic tiles consumption
Affordable housing: Affordable
housing demand is expected to grow at
a CAGR of 13% in 2011-2013 (Source:
RNCOS Research). According to reports,
India will witness a demand of 3.94
million units during 2011-15
Nuclear families: India’s dependency
ratio has declined from 58% in 2005 to
55.06% in 2010 and is expected to
drop to 52% by 2015. This reduction
will increase housing and related
product demand
Commercial real estate: The Indian
commercial space is expected to grow
20-22% over the next five years,
expected to reach 243.5 mn sq ft;
demand for malls and other retail space
is estimated to reach 57 mn sq ft and
112.57 mn sq ft, respectively in
2011-15
Retail sector growth: The annual
demand for retail space is expected to
remain at 10-20 mn sq ft with strong
growth coming out of Tier-I and II
cities, catalysed by consumerism and
organised annual retail growth of
25-30%
Hospitality: India’s tourism industry is
expected to grow from USD 67.2 billion
in 2010 to USD 262.7 billion in 2021.
India has over 200,000 hotel rooms
across various categories and is still
facing a shortfall of over 100,000
rooms (Source: FHRAI)
Aviation sector: There is increasing
passenger traffic (CAGR of 18.8%) and
cargo (CAGR 11.4%) in India. The AAI is
mobilising Rs. 50 billion for airport
infrastructure to develop 15 airports.
Better airspace management will require
an investment of about Rs. 67,500
crore in the Twelfth Five Year Plan in the
sector, enhancing opportunities for tile
manufacturers
16 | NITCO Limited Innovation for a better life
BUSINESS SEGMENT REVIEW 1
TILES
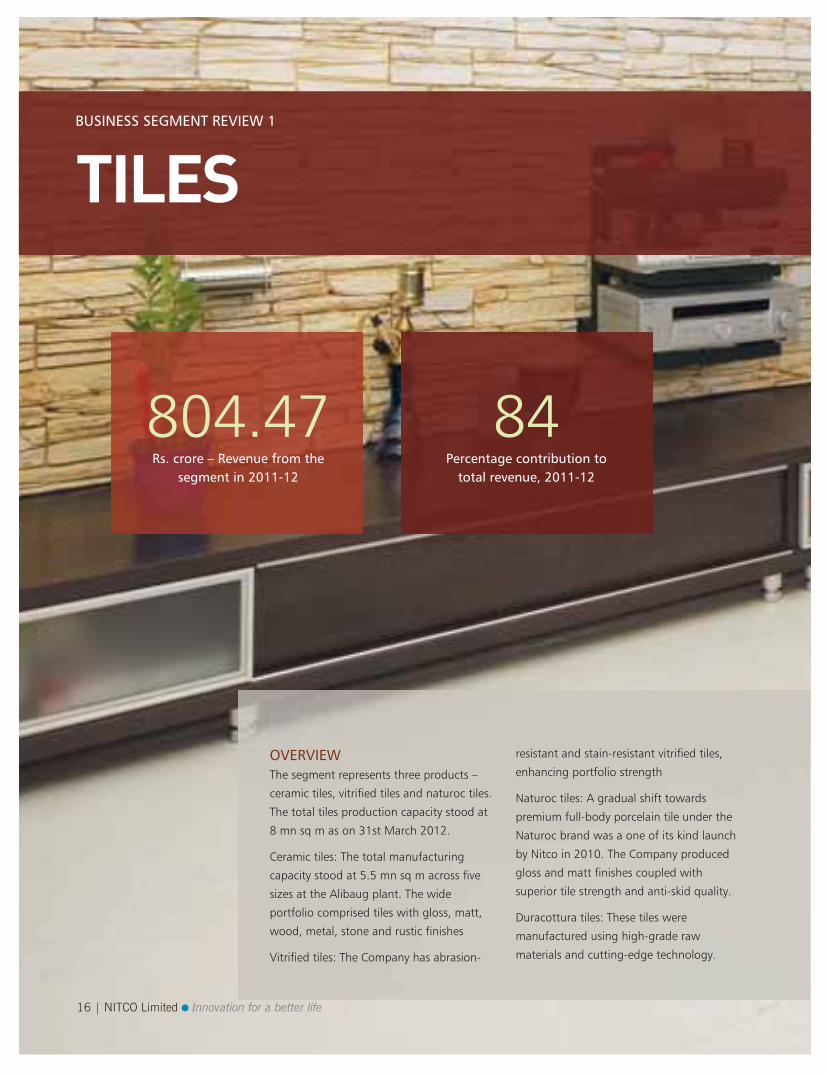
804.47Rs. crore – Revenue from the
segment in 2011-12
84Percentage contribution to
total revenue, 2011-12
OVERVIEWThe segment represents three products –
ceramic tiles, vitrified tiles and naturoc tiles.
The total tiles production capacity stood at
8 mn sq m as on 31st March 2012.
Ceramic tiles: The total manufacturing
capacity stood at 5.5 mn sq m across five
sizes at the Alibaug plant. The wide
portfolio comprised tiles with gloss, matt,
wood, metal, stone and rustic finishes
Vitrified tiles: The Company has abrasion-
resistant and stain-resistant vitrified tiles,
enhancing portfolio strength
Naturoc tiles: A gradual shift towards
premium full-body porcelain tile under the
Naturoc brand was a one of its kind launch
by Nitco in 2010. The Company produced
gloss and matt finishes coupled with
superior tile strength and anti-skid quality.
Duracottura tiles: These tiles were
manufactured using high-grade raw
materials and cutting-edge technology.
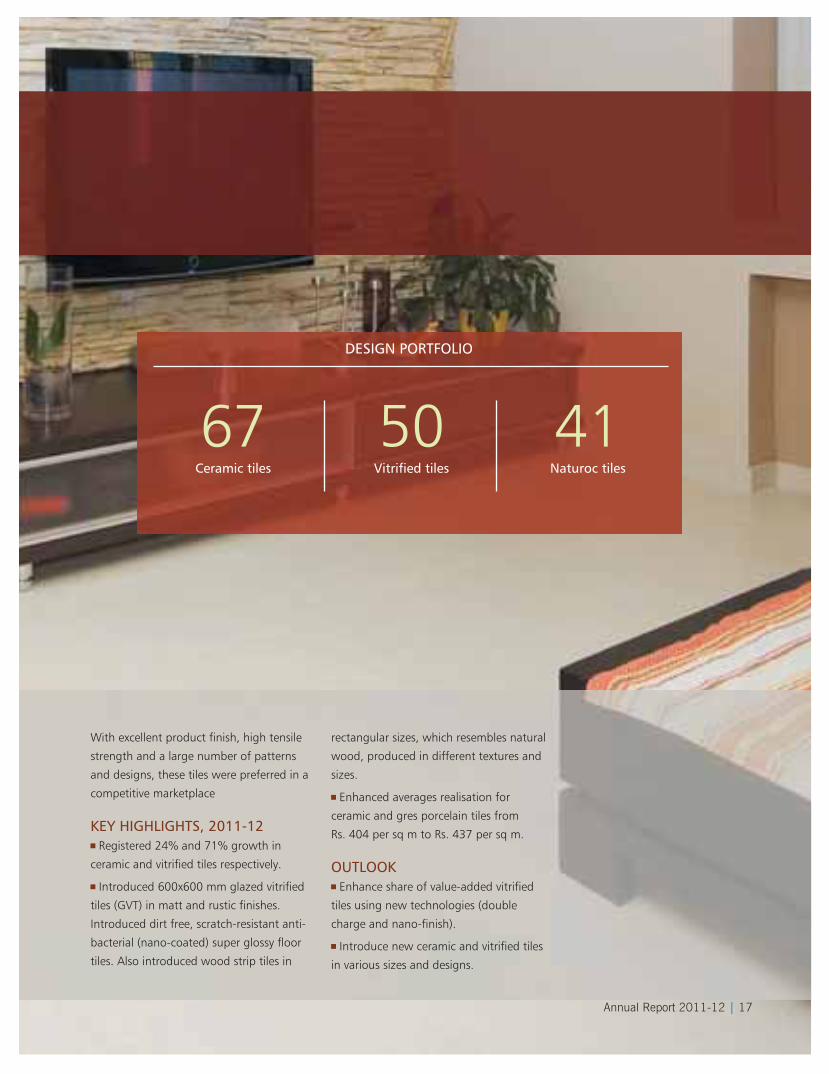
Annual Report 2011-12 | 17
67Ceramic tiles
50Vitrified tiles
41Naturoc tiles
DESIGN PORTFOLIO
With excellent product finish, high tensile
strength and a large number of patterns
and designs, these tiles were preferred in a
competitive marketplace
KEY HIGHLIGHTS, 2011-12Registered 24% and 71% growth in
ceramic and vitrified tiles respectively.
Introduced 600x600 mm glazed vitrified
tiles (GVT) in matt and rustic finishes.
Introduced dirt free, scratch-resistant anti-
bacterial (nano-coated) super glossy floor
tiles. Also introduced wood strip tiles in
rectangular sizes, which resembles natural
wood, produced in different textures and
sizes.
Enhanced averages realisation for
ceramic and gres porcelain tiles from
Rs. 404 per sq m to Rs. 437 per sq m.
OUTLOOKEnhance share of value-added vitrified
tiles using new technologies (double
charge and nano-finish).
Introduce new ceramic and vitrified tiles
in various sizes and designs.
18 | NITCO Limited Innovation for a better life
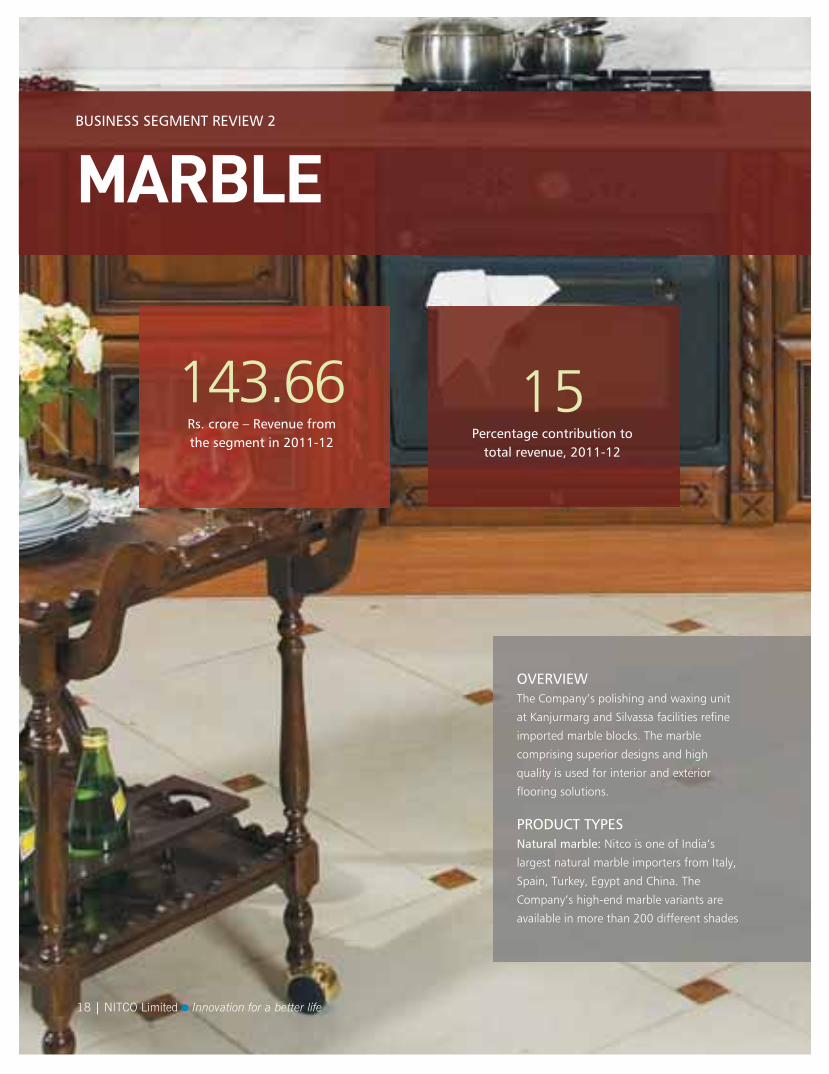
BUSINESS SEGMENT REVIEW 2
MARBLE
143.66Rs. crore – Revenue fromthe segment in 2011-12
15Percentage contribution to
total revenue, 2011-12
OVERVIEWThe Company’s polishing and waxing unit
at Kanjurmarg and Silvassa facilities refine
imported marble blocks. The marble
comprising superior designs and high
quality is used for interior and exterior
flooring solutions.
PRODUCT TYPESNatural marble: Nitco is one of India’s
largest natural marble importers from Italy,
Spain, Turkey, Egypt and China. The
Company’s high-end marble variants are
available in more than 200 different shades
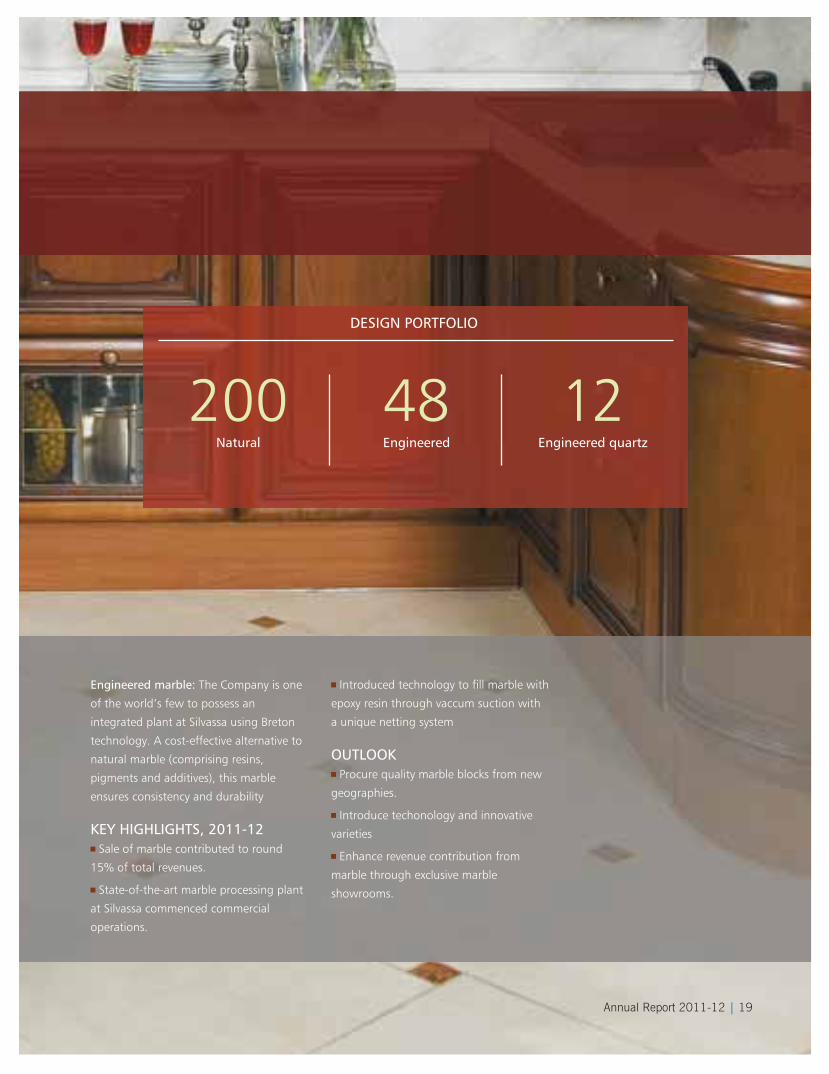
Annual Report 2011-12 | 19
200Natural
48Engineered
12Engineered quartz
DESIGN PORTFOLIO
Engineered marble: The Company is one
of the world’s few to possess an
integrated plant at Silvassa using Breton
technology. A cost-effective alternative to
natural marble (comprising resins,
pigments and additives), this marble
ensures consistency and durability
KEY HIGHLIGHTS, 2011-12Sale of marble contributed to round
15% of total revenues.
State-of-the-art marble processing plant
at Silvassa commenced commercial
operations.
Introduced technology to fill marble with
epoxy resin through vaccum suction with
a unique netting system
OUTLOOKProcure quality marble blocks from new
geographies.
Introduce techonology and innovative
varieties
Enhance revenue contribution from
marble through exclusive marble
showrooms.
20 | NITCO Limited Innovation for a better life
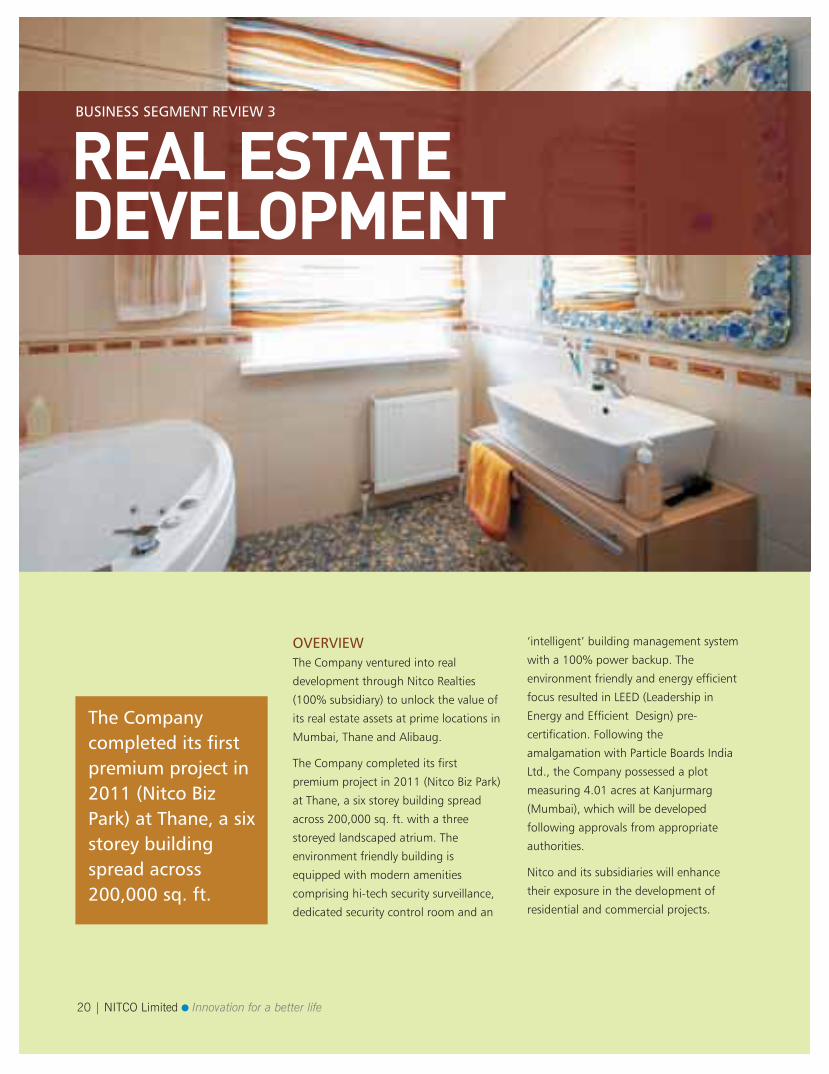
BUSINESS SEGMENT REVIEW 3
REAL ESTATEDEVELOPMENT
OVERVIEWThe Company ventured into real
development through Nitco Realties
(100% subsidiary) to unlock the value of
its real estate assets at prime locations in
Mumbai, Thane and Alibaug.
The Company completed its first
premium project in 2011 (Nitco Biz Park)
at Thane, a six storey building spread
across 200,000 sq. ft. with a three
storeyed landscaped atrium. The
environment friendly building is
equipped with modern amenities
comprising hi-tech security surveillance,
dedicated security control room and an
‘intelligent’ building management system
with a 100% power backup. The
environment friendly and energy efficient
focus resulted in LEED (Leadership in
Energy and Efficient Design) pre-
certification. Following the
amalgamation with Particle Boards India
Ltd., the Company possessed a plot
measuring 4.01 acres at Kanjurmarg
(Mumbai), which will be developed
following approvals from appropriate
authorities.
Nitco and its subsidiaries will enhance
their exposure in the development of
residential and commercial projects.
The Companycompleted its firstpremium project in2011 (Nitco BizPark) at Thane, a sixstorey buildingspread across200,000 sq. ft.
Annual Report 2011-12 | 21
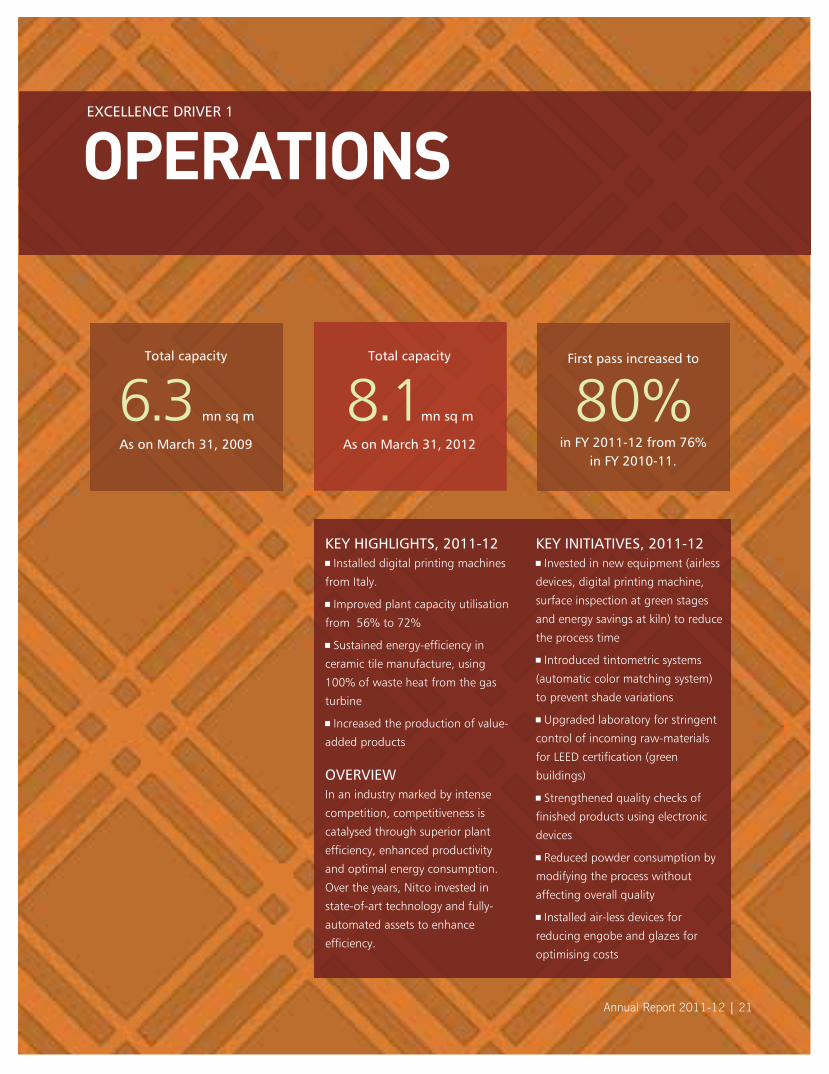
EXCELLENCE DRIVER 1
OPERATIONS
6.3 mn sq m
Total capacity First pass increased to
in FY 2011-12 from 76% in FY 2010-11.
80%8.1mn sq m
Total capacity
As on March 31, 2012As on March 31, 2009
KEY HIGHLIGHTS, 2011-12Installed digital printing machines
from Italy.
Improved plant capacity utilisation
from 56% to 72%
Sustained energy-efficiency in
ceramic tile manufacture, using
100% of waste heat from the gas
turbine
Increased the production of value-
added products
OVERVIEWIn an industry marked by intense
competition, competitiveness is
catalysed through superior plant
efficiency, enhanced productivity
and optimal energy consumption.
Over the years, Nitco invested in
state-of-art technology and fully-
automated assets to enhance
efficiency.
KEY INITIATIVES, 2011-12Invested in new equipment (airless
devices, digital printing machine,
surface inspection at green stages
and energy savings at kiln) to reduce
the process time
Introduced tintometric systems
(automatic color matching system)
to prevent shade variations
Upgraded laboratory for stringent
control of incoming raw-materials
for LEED certification (green
buildings)
Strengthened quality checks of
finished products using electronic
devices
Reduced powder consumption by
modifying the process without
affecting overall quality
Installed air-less devices for
reducing engobe and glazes for
optimising costs
22 | NITCO Limited Innovation for a better life
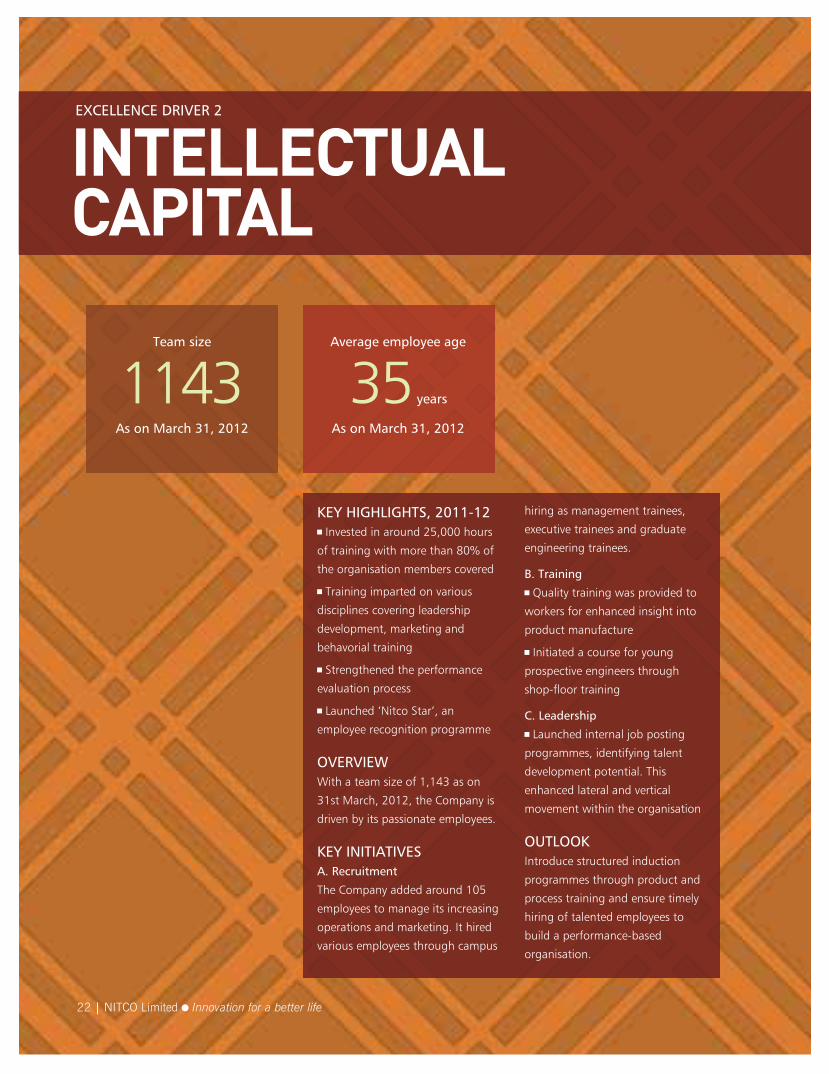
EXCELLENCE DRIVER 2
INTELLECTUALCAPITAL
1143Team size
35 years
Average employee age
As on March 31, 2012As on March 31, 2012
KEY HIGHLIGHTS, 2011-12Invested in around 25,000 hours
of training with more than 80% of
the organisation members covered
Training imparted on various
disciplines covering leadership
development, marketing and
behavorial training
Strengthened the performance
evaluation process
Launched ‘Nitco Star’, an
employee recognition programme
OVERVIEWWith a team size of 1,143 as on
31st March, 2012, the Company is
driven by its passionate employees.
KEY INITIATIVESA. Recruitment
The Company added around 105
employees to manage its increasing
operations and marketing. It hired
various employees through campus
hiring as management trainees,
executive trainees and graduate
engineering trainees.
B. Training
Quality training was provided to
workers for enhanced insight into
product manufacture
Initiated a course for young
prospective engineers through
shop-floor training
C. Leadership
Launched internal job posting
programmes, identifying talent
development potential. This
enhanced lateral and vertical
movement within the organisation
OUTLOOKIntroduce structured induction
programmes through product and
process training and ensure timely
hiring of talented employees to
build a performance-based
organisation.
Annual Report 2011-12 | 23
EXCELLENCE DRIVER 3
INFORMATIONTECHNOLOGY (IT)
KEY HIGHLIGHTS, 2011-12Invested in strengthening IT
infrastructure
Strengthened the SAP data
warehouse and SAP business
intelligence system to facilitate
decision-making
OVERVIEWAt Nitco, the use of information
technology has emerged as a
critical business driver, connecting
the Company’s dispersed
manufacturing and marketing
operations. The comprehensive IT
system enabled it to stay
interconnected with its dealers.
KEY INITIATIVES, 2011-12Implemented customer
relationship management through
the launch of www.salesforce.com,
enabling direct access and ease in
inventory management
Implemented e-payment for
vendors, facilitated through the
SAP financial accounting module
Implemented checks and
balances in commercial processes
through automation and SAP
process to facilitate better
monitoring
Implemented online connectivity
to all new warehouses
OUTLOOKStrengthen CRM systems
Continually upgrade SAP systems
Initiate plans to focus around
major cost reduction programmes
Focus towards establishing a
paperless work environment
24 | NITCO Limited Innovation for a better life
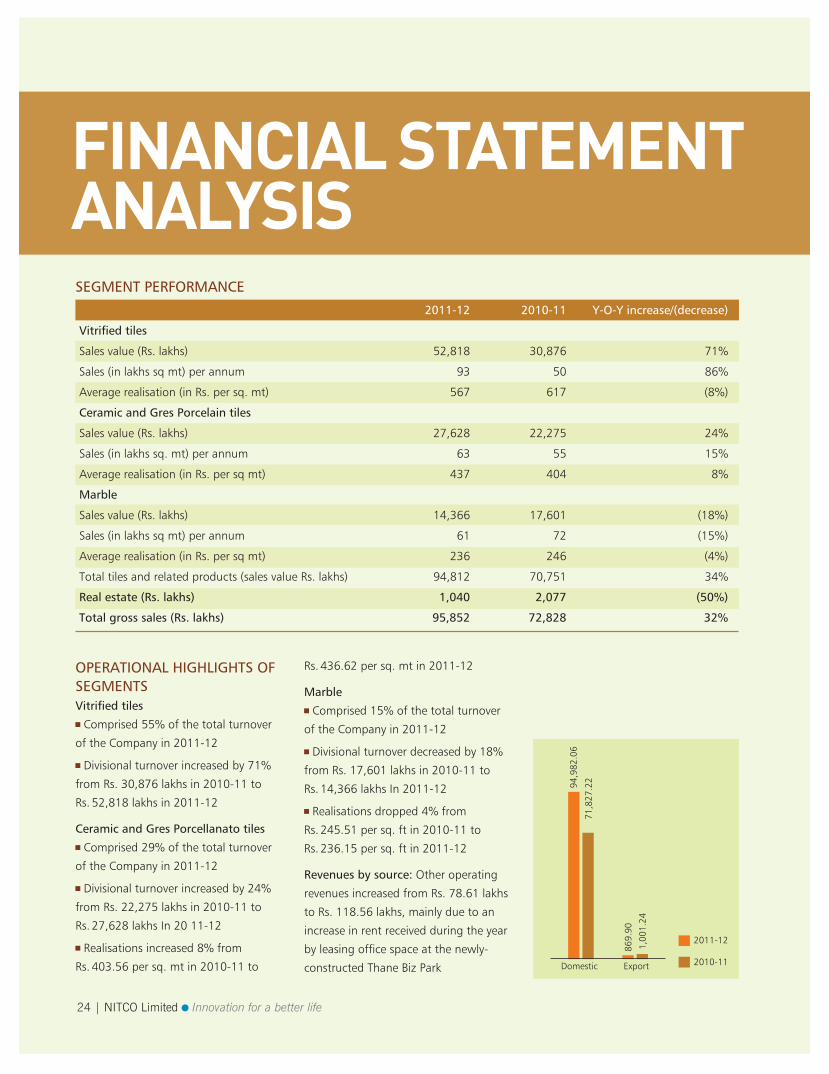
FINANCIAL STATEMENTANALYSIS
OPERATIONAL HIGHLIGHTS OFSEGMENTSVitrified tiles
Comprised 55% of the total turnover
of the Company in 2011-12
Divisional turnover increased by 71%
from Rs. 30,876 lakhs in 2010-11 to
Rs. 52,818 lakhs in 2011-12
Ceramic and Gres Porcellanato tiles
Comprised 29% of the total turnover
of the Company in 2011-12
Divisional turnover increased by 24%
from Rs. 22,275 lakhs in 2010-11 to
Rs. 27,628 lakhs In 20 11-12
Realisations increased 8% from
Rs. 403.56 per sq. mt in 2010-11 to
Rs. 436.62 per sq. mt in 2011-12
Marble
Comprised 15% of the total turnover
of the Company in 2011-12
Divisional turnover decreased by 18%
from Rs. 17,601 lakhs in 2010-11 to
Rs. 14,366 lakhs In 2011-12
Realisations dropped 4% from
Rs. 245.51 per sq. ft in 2010-11 to
Rs. 236.15 per sq. ft in 2011-12
Revenues by source: Other operating
revenues increased from Rs. 78.61 lakhs
to Rs. 118.56 lakhs, mainly due to an
increase in rent received during the year
by leasing office space at the newly-
constructed Thane Biz Park
SEGMENT PERFORMANCE
2011-12 2010-11 Y-O-Y increase/(decrease)
Vitrified tiles
Sales value (Rs. lakhs) 52,818 30,876 71%
Sales (in lakhs sq mt) per annum 93 50 86%
Average realisation (in Rs. per sq. mt) 567 617 (8%)
Ceramic and Gres Porcelain tiles
Sales value (Rs. lakhs) 27,628 22,275 24%
Sales (in lakhs sq. mt) per annum 63 55 15%
Average realisation (in Rs. per sq mt) 437 404 8%
Marble
Sales value (Rs. lakhs) 14,366 17,601 (18%)
Sales (in lakhs sq mt) per annum 61 72 (15%)
Average realisation (in Rs. per sq mt) 236 246 (4%)
Total tiles and related products (sales value Rs. lakhs) 94,812 70,751 34%
Real estate (Rs. lakhs) 1,040 2,077 (50%)
Total gross sales (Rs. lakhs) 95,852 72,828 32%
Domestic Export
94,9
82.0
6
2011-12
2010-11
71,8
27.2
2
869.
90
1,00
1.24
Annual Report 2011-12 | 25
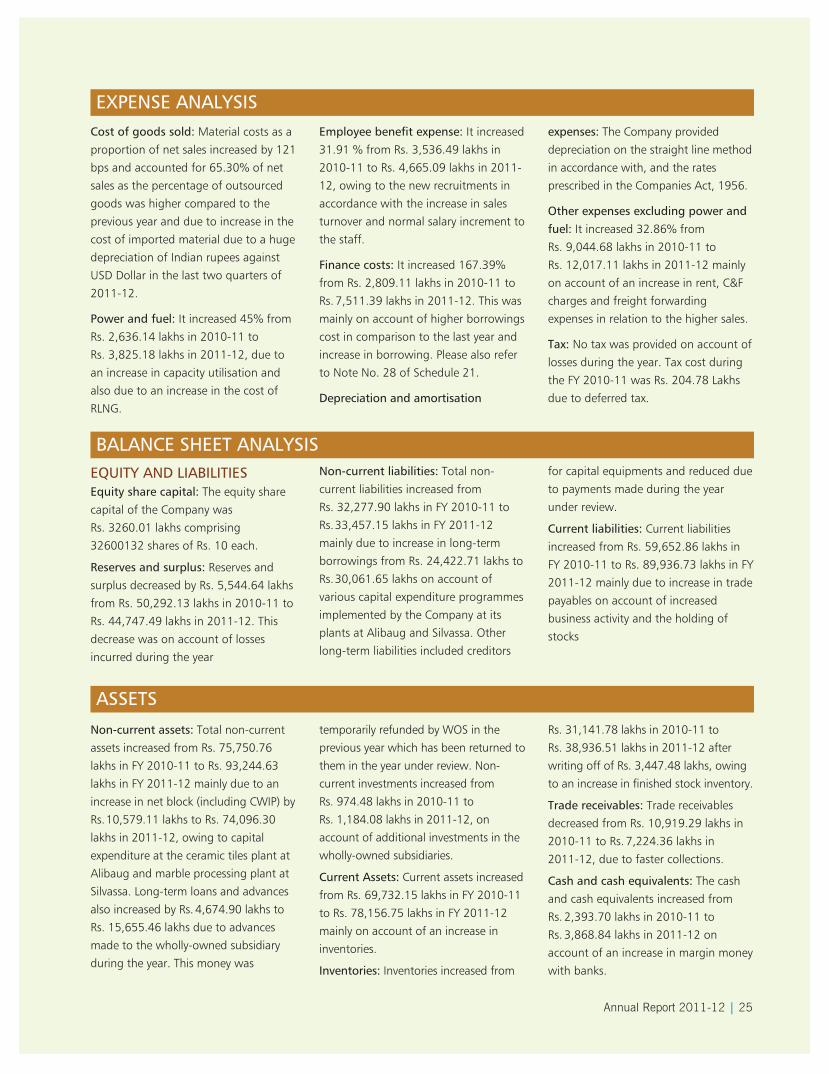
EQUITY AND LIABILITIESEquity share capital: The equity share
capital of the Company was
Rs. 3260.01 lakhs comprising
32600132 shares of Rs. 10 each.
Reserves and surplus: Reserves and
surplus decreased by Rs. 5,544.64 lakhs
from Rs. 50,292.13 lakhs in 2010-11 to
Rs. 44,747.49 lakhs in 2011-12. This
decrease was on account of losses
incurred during the year
Non-current liabilities: Total non-
current liabilities increased from
Rs. 32,277.90 lakhs in FY 2010-11 to
Rs.33,457.15 lakhs in FY 2011-12
mainly due to increase in long-term
borrowings from Rs. 24,422.71 lakhs to
Rs.30,061.65 lakhs on account of
various capital expenditure programmes
implemented by the Company at its
plants at Alibaug and Silvassa. Other
long-term liabilities included creditors
for capital equipments and reduced due
to payments made during the year
under review.
Current liabilities: Current liabilities
increased from Rs. 59,652.86 lakhs in
FY 2010-11 to Rs. 89,936.73 lakhs in FY
2011-12 mainly due to increase in trade
payables on account of increased
business activity and the holding of
stocks
BALANCE SHEET ANALYSIS
Non-current assets: Total non-current
assets increased from Rs. 75,750.76
lakhs in FY 2010-11 to Rs. 93,244.63
lakhs in FY 2011-12 mainly due to an
increase in net block (including CWIP) by
Rs.10,579.11 lakhs to Rs. 74,096.30
lakhs in 2011-12, owing to capital
expenditure at the ceramic tiles plant at
Alibaug and marble processing plant at
Silvassa. Long-term loans and advances
also increased by Rs. 4,674.90 lakhs to
Rs. 15,655.46 lakhs due to advances
made to the wholly-owned subsidiary
during the year. This money was
temporarily refunded by WOS in the
previous year which has been returned to
them in the year under review. Non-
current investments increased from
Rs. 974.48 lakhs in 2010-11 to
Rs. 1,184.08 lakhs in 2011-12, on
account of additional investments in the
wholly-owned subsidiaries.
Current Assets: Current assets increased
from Rs. 69,732.15 lakhs in FY 2010-11
to Rs. 78,156.75 lakhs in FY 2011-12
mainly on account of an increase in
inventories.
Inventories: Inventories increased from
Rs. 31,141.78 lakhs in 2010-11 to
Rs. 38,936.51 lakhs in 2011-12 after
writing off of Rs. 3,447.48 lakhs, owing
to an increase in finished stock inventory.
Trade receivables: Trade receivables
decreased from Rs. 10,919.29 lakhs in
2010-11 to Rs. 7,224.36 lakhs in
2011-12, due to faster collections.
Cash and cash equivalents: The cash
and cash equivalents increased from
Rs. 2,393.70 lakhs in 2010-11 to
Rs. 3,868.84 lakhs in 2011-12 on
account of an increase in margin money
with banks.
ASSETS
Cost of goods sold: Material costs as a
proportion of net sales increased by 121
bps and accounted for 65.30% of net
sales as the percentage of outsourced
goods was higher compared to the
previous year and due to increase in the
cost of imported material due to a huge
depreciation of Indian rupees against
USD Dollar in the last two quarters of
2011-12.
Power and fuel: It increased 45% from
Rs. 2,636.14 lakhs in 2010-11 to
Rs. 3,825.18 lakhs in 2011-12, due to
an increase in capacity utilisation and
also due to an increase in the cost of
RLNG.
Employee benefit expense: It increased
31.91 % from Rs. 3,536.49 lakhs in
2010-11 to Rs. 4,665.09 lakhs in 2011-
12, owing to the new recruitments in
accordance with the increase in sales
turnover and normal salary increment to
the staff.
Finance costs: It increased 167.39%
from Rs. 2,809.11 lakhs in 2010-11 to
Rs. 7,511.39 lakhs in 2011-12. This was
mainly on account of higher borrowings
cost in comparison to the last year and
increase in borrowing. Please also refer
to Note No. 28 of Schedule 21.
Depreciation and amortisation
expenses: The Company provided
depreciation on the straight line method
in accordance with, and the rates
prescribed in the Companies Act, 1956.
Other expenses excluding power andfuel: It increased 32.86% from
Rs. 9,044.68 lakhs in 2010-11 to
Rs. 12,017.11 lakhs in 2011-12 mainly
on account of an increase in rent, C&F
charges and freight forwarding
expenses in relation to the higher sales.
Tax: No tax was provided on account of
losses during the year. Tax cost during
the FY 2010-11 was Rs. 204.78 Lakhs
due to deferred tax.
EXPENSE ANALYSIS
26 | NITCO Limited Innovation for a better life
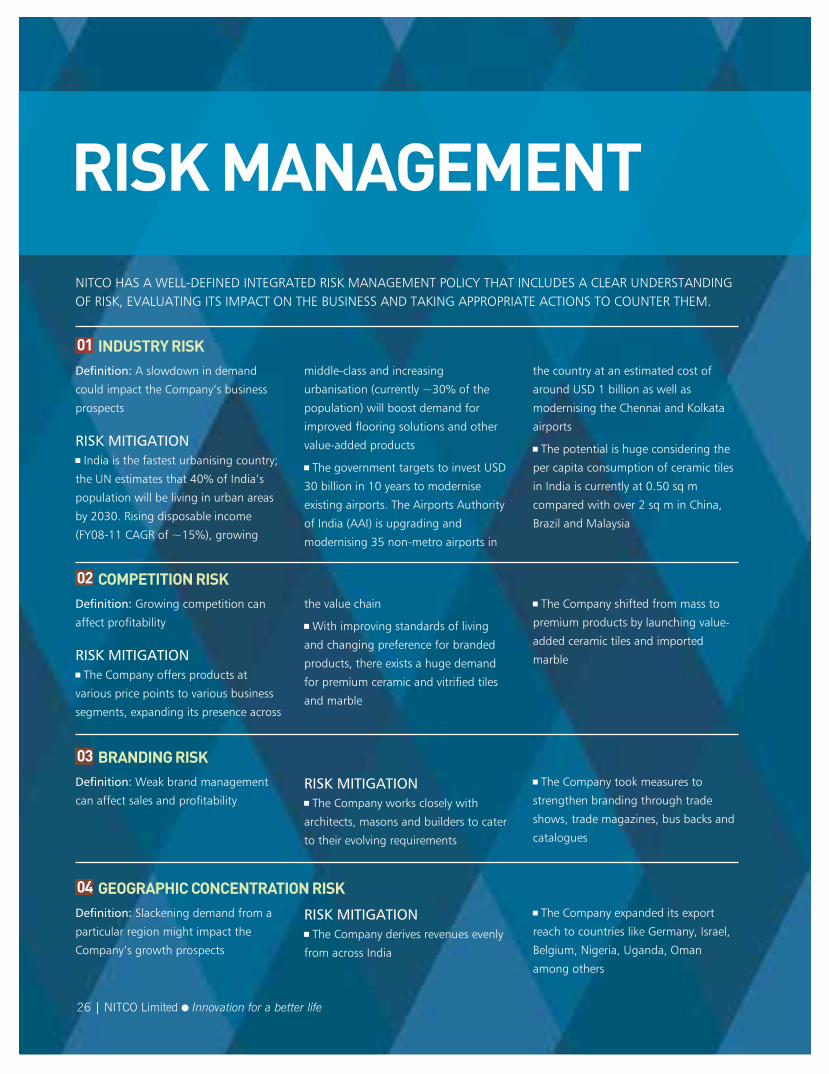
RISK MANAGEMENT
INDUSTRY RISK
NITCO HAS A WELL-DEFINED INTEGRATED RISK MANAGEMENT POLICY THAT INCLUDES A CLEAR UNDERSTANDINGOF RISK, EVALUATING ITS IMPACT ON THE BUSINESS AND TAKING APPROPRIATE ACTIONS TO COUNTER THEM.
Definition: A slowdown in demand
could impact the Company’s business
prospects
RISK MITIGATIONIndia is the fastest urbanising country;
the UN estimates that 40% of India’s
population will be living in urban areas
by 2030. Rising disposable income
(FY08-11 CAGR of ~15%), growing
middle-class and increasing
urbanisation (currently ~30% of the
population) will boost demand for
improved flooring solutions and other
value-added products
The government targets to invest USD
30 billion in 10 years to modernise
existing airports. The Airports Authority
of India (AAI) is upgrading and
modernising 35 non-metro airports in
the country at an estimated cost of
around USD 1 billion as well as
modernising the Chennai and Kolkata
airports
The potential is huge considering the
per capita consumption of ceramic tiles
in India is currently at 0.50 sq m
compared with over 2 sq m in China,
Brazil and Malaysia
01
COMPETITION RISKDefinition: Growing competition can
affect profitability
RISK MITIGATIONThe Company offers products at
various price points to various business
segments, expanding its presence across
the value chain
With improving standards of living
and changing preference for branded
products, there exists a huge demand
for premium ceramic and vitrified tiles
and marble
The Company shifted from mass to
premium products by launching value-
added ceramic tiles and imported
marble
02
BRANDING RISKDefinition: Weak brand management
can affect sales and profitability RISK MITIGATION
The Company works closely with
architects, masons and builders to cater
to their evolving requirements
The Company took measures to
strengthen branding through trade
shows, trade magazines, bus backs and
catalogues
03
GEOGRAPHIC CONCENTRATION RISKDefinition: Slackening demand from a
particular region might impact the
Company’s growth prospects
RISK MITIGATIONThe Company derives revenues evenly
from across India
The Company expanded its export
reach to countries like Germany, Israel,
Belgium, Nigeria, Uganda, Oman
among others
04
Annual Report 2011-12 | 27
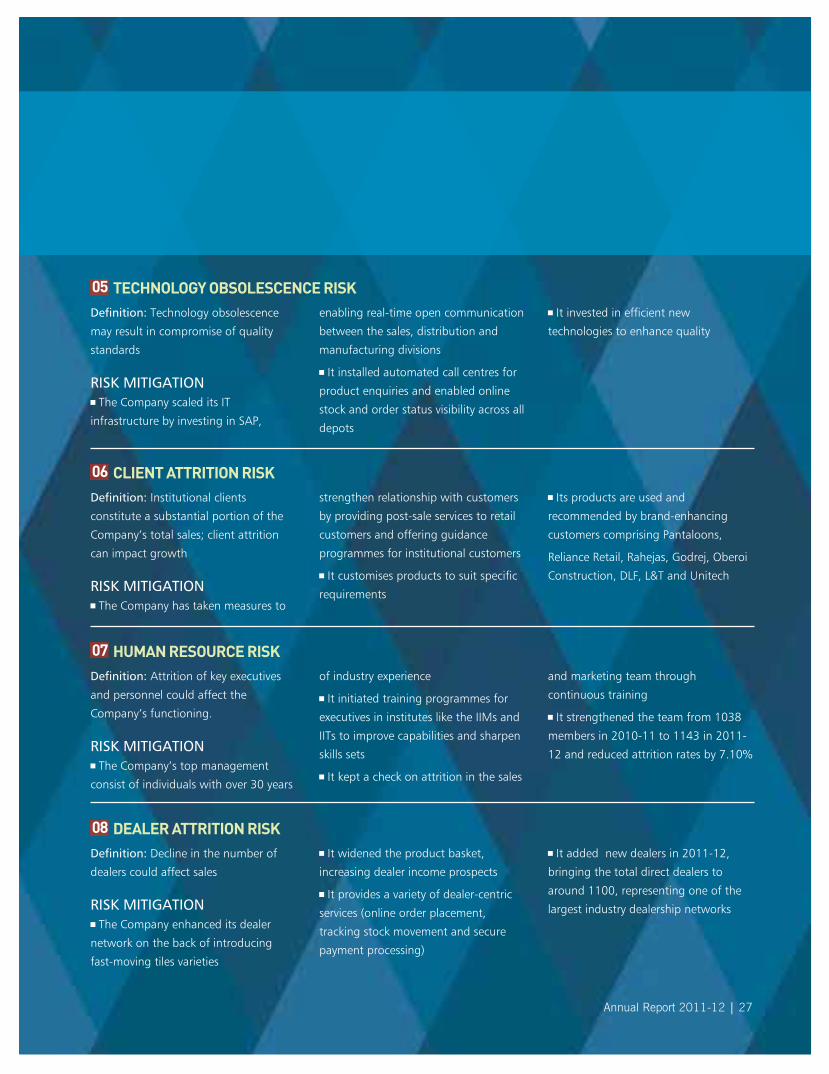
TECHNOLOGY OBSOLESCENCE RISKDefinition: Technology obsolescence
may result in compromise of quality
standards
RISK MITIGATIONThe Company scaled its IT
infrastructure by investing in SAP,
enabling real-time open communication
between the sales, distribution and
manufacturing divisions
It installed automated call centres for
product enquiries and enabled online
stock and order status visibility across all
depots
It invested in efficient new
technologies to enhance quality
05
CLIENT ATTRITION RISKDefinition: Institutional clients
constitute a substantial portion of the
Company’s total sales; client attrition
can impact growth
RISK MITIGATIONThe Company has taken measures to
strengthen relationship with customers
by providing post-sale services to retail
customers and offering guidance
programmes for institutional customers
It customises products to suit specific
requirements
Its products are used and
recommended by brand-enhancing
customers comprising Pantaloons,
Reliance Retail, Rahejas, Godrej, Oberoi
Construction, DLF, L&T and Unitech
06
HUMAN RESOURCE RISKDefinition: Attrition of key executives
and personnel could affect the
Company’s functioning.
RISK MITIGATIONThe Company’s top management
consist of individuals with over 30 years
of industry experience
It initiated training programmes for
executives in institutes like the IIMs and
IITs to improve capabilities and sharpen
skills sets
It kept a check on attrition in the sales
and marketing team through
continuous training
It strengthened the team from 1038
members in 2010-11 to 1143 in 2011-
12 and reduced attrition rates by 7.10%
07
DEALER ATTRITION RISKDefinition: Decline in the number of
dealers could affect sales
RISK MITIGATIONThe Company enhanced its dealer
network on the back of introducing
fast-moving tiles varieties
It widened the product basket,
increasing dealer income prospects
It provides a variety of dealer-centric
services (online order placement,
tracking stock movement and secure
payment processing)
It added new dealers in 2011-12,
bringing the total direct dealers to
around 1100, representing one of the
largest industry dealership networks
08
28 | NITCO Limited Innovation for a better life
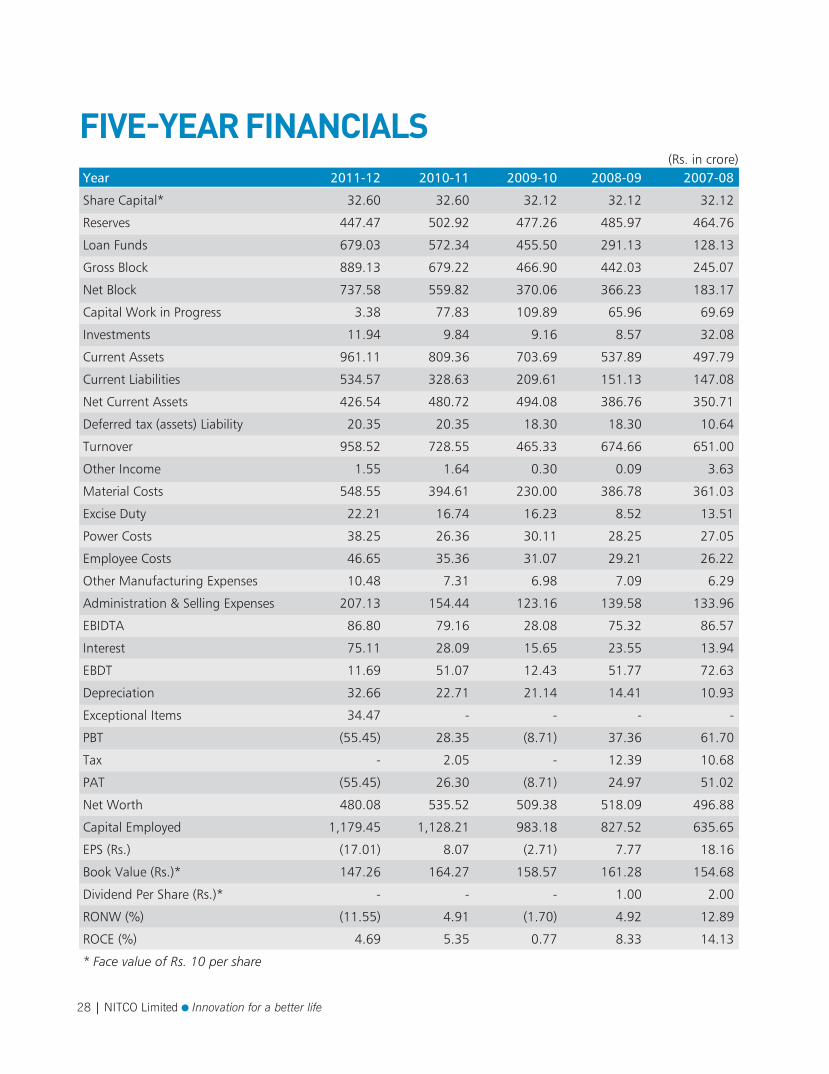
Year 2011-12 2010-11 2009-10 2008-09 2007-08
Share Capital* 32.60 32.60 32.12 32.12 32.12
Reserves 447.47 502.92 477.26 485.97 464.76
Loan Funds 679.03 572.34 455.50 291.13 128.13
Gross Block 889.13 679.22 466.90 442.03 245.07
Net Block 737.58 559.82 370.06 366.23 183.17
Capital Work in Progress 3.38 77.83 109.89 65.96 69.69
Investments 11.94 9.84 9.16 8.57 32.08
Current Assets 961.11 809.36 703.69 537.89 497.79
Current Liabilities 534.57 328.63 209.61 151.13 147.08
Net Current Assets 426.54 480.72 494.08 386.76 350.71
Deferred tax (assets) Liability 20.35 20.35 18.30 18.30 10.64
Turnover 958.52 728.55 465.33 674.66 651.00
Other Income 1.55 1.64 0.30 0.09 3.63
Material Costs 548.55 394.61 230.00 386.78 361.03
Excise Duty 22.21 16.74 16.23 8.52 13.51
Power Costs 38.25 26.36 30.11 28.25 27.05
Employee Costs 46.65 35.36 31.07 29.21 26.22
Other Manufacturing Expenses 10.48 7.31 6.98 7.09 6.29
Administration & Selling Expenses 207.13 154.44 123.16 139.58 133.96
EBIDTA 86.80 79.16 28.08 75.32 86.57
Interest 75.11 28.09 15.65 23.55 13.94
EBDT 11.69 51.07 12.43 51.77 72.63
Depreciation 32.66 22.71 21.14 14.41 10.93
Exceptional Items 34.47 - - - -
PBT (55.45) 28.35 (8.71) 37.36 61.70
Tax - 2.05 - 12.39 10.68
PAT (55.45) 26.30 (8.71) 24.97 51.02
Net Worth 480.08 535.52 509.38 518.09 496.88
Capital Employed 1,179.45 1,128.21 983.18 827.52 635.65
EPS (Rs.) (17.01) 8.07 (2.71) 7.77 18.16
Book Value (Rs.)* 147.26 164.27 158.57 161.28 154.68
Dividend Per Share (Rs.)* - - - 1.00 2.00
RONW (%) (11.55) 4.91 (1.70) 4.92 12.89
ROCE (%) 4.69 5.35 0.77 8.33 14.13
* Face value of Rs. 10 per share
(Rs. in crore)
FIVE-YEAR FINANCIALS
Annual Report 2011-12 | 29
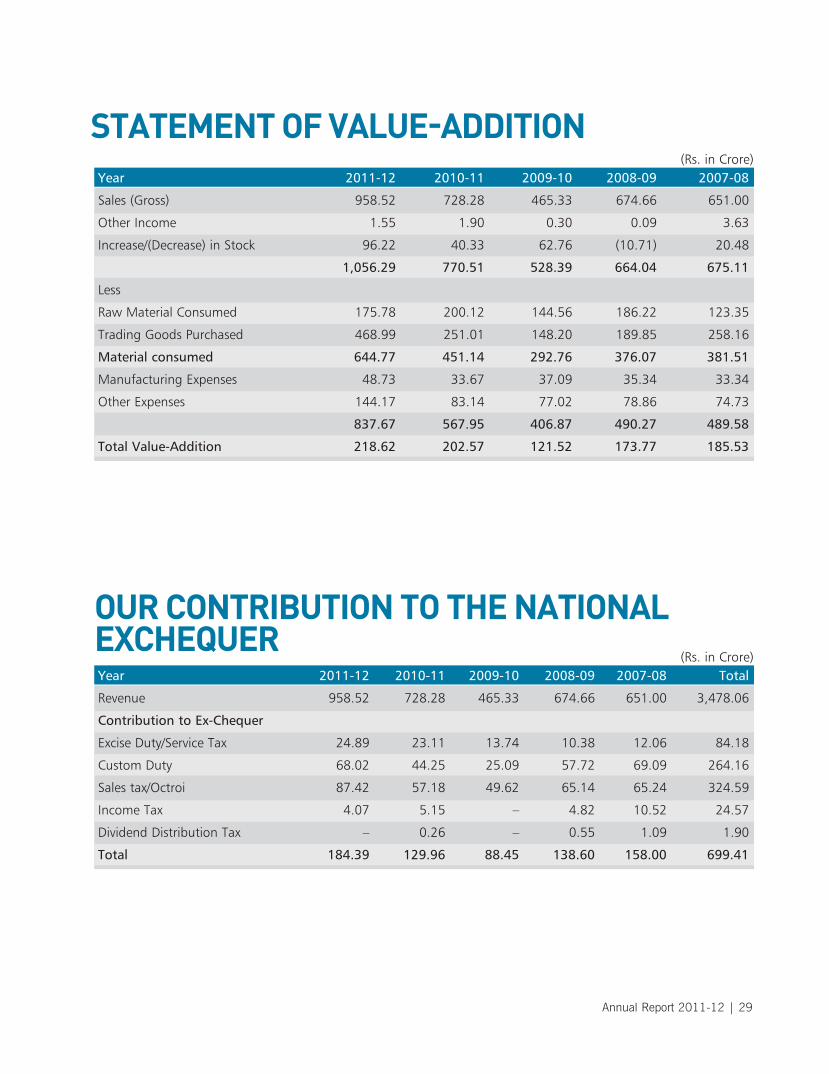
Year 2011-12 2010-11 2009-10 2008-09 2007-08
Sales (Gross) 958.52 728.28 465.33 674.66 651.00
Other Income 1.55 1.90 0.30 0.09 3.63
Increase/(Decrease) in Stock 96.22 40.33 62.76 (10.71) 20.48
1,056.29 770.51 528.39 664.04 675.11
Less
Raw Material Consumed 175.78 200.12 144.56 186.22 123.35
Trading Goods Purchased 468.99 251.01 148.20 189.85 258.16
Material consumed 644.77 451.14 292.76 376.07 381.51
Manufacturing Expenses 48.73 33.67 37.09 35.34 33.34
Other Expenses 144.17 83.14 77.02 78.86 74.73
837.67 567.95 406.87 490.27 489.58
Total Value-Addition 218.62 202.57 121.52 173.77 185.53
(Rs. in Crore)
STATEMENT OF VALUE-ADDITION
Year 2011-12 2010-11 2009-10 2008-09 2007-08 Total
Revenue 958.52 728.28 465.33 674.66 651.00 3,478.06
Contribution to Ex-Chequer
Excise Duty/Service Tax 24.89 23.11 13.74 10.38 12.06 84.18
Custom Duty 68.02 44.25 25.09 57.72 69.09 264.16
Sales tax/Octroi 87.42 57.18 49.62 65.14 65.24 324.59
Income Tax 4.07 5.15 – 4.82 10.52 24.57
Dividend Distribution Tax – 0.26 – 0.55 1.09 1.90
Total 184.39 129.96 88.45 138.60 158.00 699.41
(Rs. in Crore)
OUR CONTRIBUTION TO THE NATIONALEXCHEQUER
30 | NITCO Limited Innovation for a better life
Director’sReport
Your Directors take pleasure in presenting the Annual Report with the audited statement of accounts of the Company for the year
ended March 31, 2012.
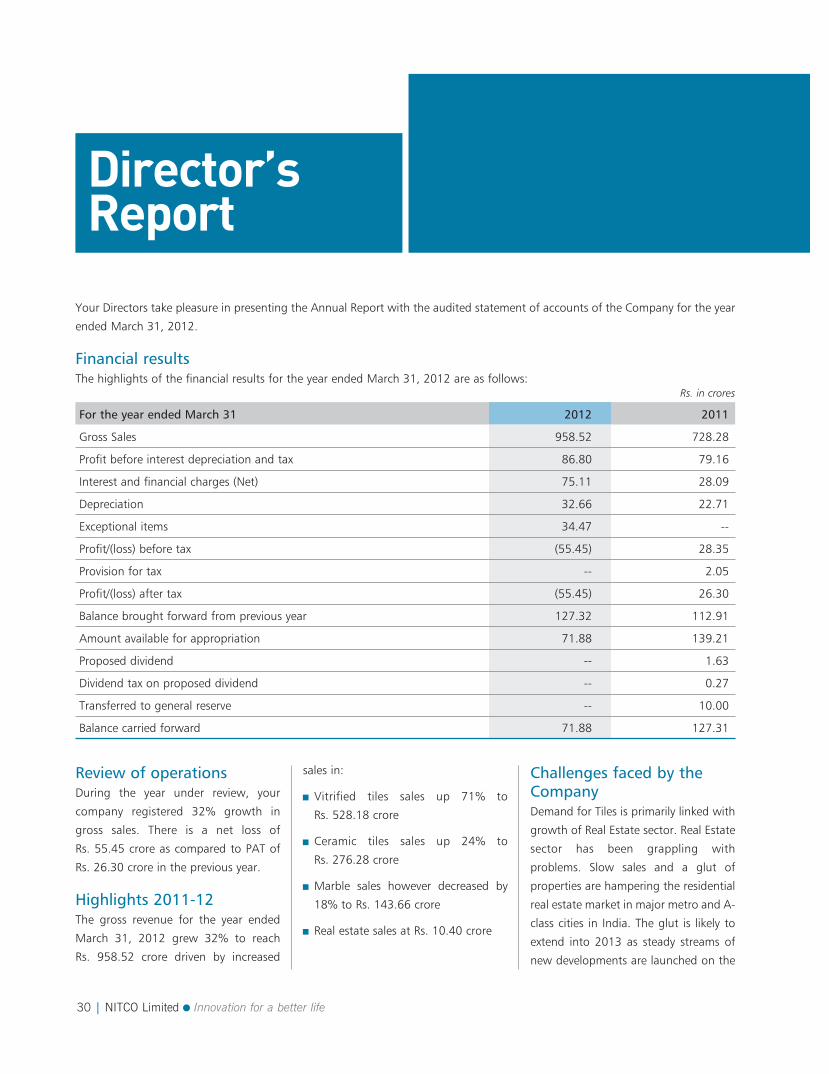
Financial resultsThe highlights of the financial results for the year ended March 31, 2012 are as follows:
Review of operationsDuring the year under review, your
company registered 32% growth in
gross sales. There is a net loss of
Rs. 55.45 crore as compared to PAT of
Rs. 26.30 crore in the previous year.
Highlights 2011-12The gross revenue for the year ended
March 31, 2012 grew 32% to reach
Rs. 958.52 crore driven by increased
sales in:
Vitrified tiles sales up 71% to
Rs. 528.18 crore
Ceramic tiles sales up 24% to
Rs. 276.28 crore
Marble sales however decreased by
18% to Rs. 143.66 crore
Real estate sales at Rs. 10.40 crore
Challenges faced by theCompanyDemand for Tiles is primarily linked with
growth of Real Estate sector. Real Estate
sector has been grappling with
problems. Slow sales and a glut of
properties are hampering the residential
real estate market in major metro and A-
class cities in India. The glut is likely to
extend into 2013 as steady streams of
new developments are launched on the
For the year ended March 31 2012 2011
Gross Sales 958.52 728.28
Profit before interest depreciation and tax 86.80 79.16
Interest and financial charges (Net) 75.11 28.09
Depreciation 32.66 22.71
Exceptional items 34.47 --
Profit/(loss) before tax (55.45) 28.35
Provision for tax -- 2.05
Profit/(loss) after tax (55.45) 26.30
Balance brought forward from previous year 127.32 112.91
Amount available for appropriation 71.88 139.21
Proposed dividend -- 1.63
Dividend tax on proposed dividend -- 0.27
Transferred to general reserve -- 10.00
Balance carried forward 71.88 127.31
Rs. in crores
Annual Report 2011-12 | 31
market. Developers who bought land at
high prices, are not ready to bring prices
down. The overall sentiments of the
market and the consistent rate of new
project launches in major cities give a
clear indication of an impending
oversupply in 2012 and 2013. A lot of
developers in the most severely affected
locations are currently open to closing
sales at lower rates. Prices for
commercial properties slumped in the
Indian city in 2009 and many developers
switched from offices to residential in
the hope of keeping profits high. But
now there is slump in the residential
sector in major metros as well.
As the economy shows signs of lower
GDP growth rate, the Indian real estate
industry faces its own share of concerns.
Real estate developers are reeling under
high debt and FDI inflows have also
slowed down. The increase in home
loan interest rates is dampening the
sales even further. Amidst these
macroeconomic conditions, Indian real
estate asset classes across the prime
cities of India have seen mixed
sentiments.
Because of the prevailing uncertainties
on the global market and there is no
likelihood of major interest rate
reduction by RBI, sentiments on the
residential market will remain cautious
over the short term. The absorption rate
– meaning the ratio of sales over
inventory in the market – is likely to be
low, and the incidence of new launches
will decline. Rise in capital values will be
marginal because of low sales.
Project-specific price increases can be
expected across all sub-markets – this
pertains specially to projects that are
being delivered or are nearing
completion. The mid-end and
affordable housing segments will record
healthy appreciation in capital values in
the short term from a low base. We
expect these trends to continue during
FY 13.
For more than a decade, your Company
has been following a policy of part in-
house manufacturing and part
outsourcing from China which had
served the Company well during the last
several years. As per business model,
your Company needs to import
significant portion of outsourced
products from China. The exchange rate
between Indian Rupee and US Dollar
has changed dramatically during 3rd
and 4th quarter of FY 2011-12. This has
impacted the landed cost of the
outsourced products. Due to
competitive pressure the Company was
not able to pass on the excess burden
on account of higher exchange rate to
its customers. This has resulted in
operating losses during 4th Quarter.
The proportion of outsourcing from
China has over the years considerably
increased. As the China factories
generally remain closed for two months
in the early calendar year, it was
required to procure stocks in advance in
anticipation of sales. Because of the
large lead times in procurement and
frequent changes in the consumer
tastes, there has been a mismatch
between products procured and sales
achieved. The inventory has gone up to
Rs. 424 crore (including the stock
written off of Rs. 34 crore) as on year
ended March 2012 as against Rs. 311
crore as on year ended March 2011. The
Company has reviewed the realisability
of stocks and upon a review and as a
measure of abundant precaution, the
management has written off
obsolete/damaged stock of Rs. 34 crore
in March 2012 as exceptional items.
Joint Venture with NewVardhman Vitrified Tiles Pvt.Ltd.With imports from China becoming
progressively unviable, Company has
entered into a Memorandum of
Understanding with New Vardhman
Vitrified Tiles Pvt. Ltd.and its promoters
for a 51% stake in New Vardhman
Vitrified Tiles Pvt. Ltd . The said
Company is setting up a plant in
Wakaner, Morbi, Gujarat for
manufacturing 8 million sq. mtrs
(approximately) of vitrified tiles and
Wall tiles. The plant is expected to start
production in Q3 of the current financial
year. The entire production of this plant
32 | NITCO Limited Innovation for a better life
will be marketed by the Company under
its brand name. With this arrangement,
Company’s dependence on China for
tiles sourcing will significantly reduce.
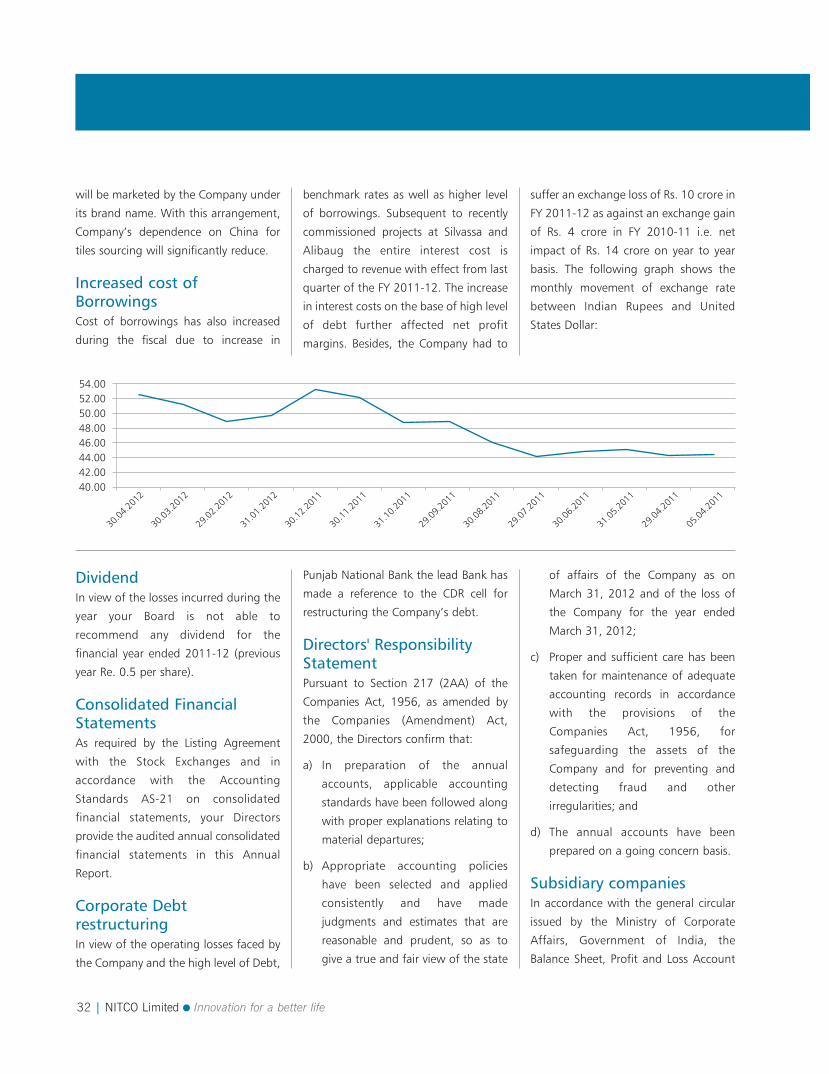
Increased cost ofBorrowingsCost of borrowings has also increased
during the fiscal due to increase in
benchmark rates as well as higher level
of borrowings. Subsequent to recently
commissioned projects at Silvassa and
Alibaug the entire interest cost is
charged to revenue with effect from last
quarter of the FY 2011-12. The increase
in interest costs on the base of high level
of debt further affected net profit
margins. Besides, the Company had to
suffer an exchange loss of Rs. 10 crore in
FY 2011-12 as against an exchange gain
of Rs. 4 crore in FY 2010-11 i.e. net
impact of Rs. 14 crore on year to year
basis. The following graph shows the
monthly movement of exchange rate
between Indian Rupees and United
States Dollar:
DividendIn view of the losses incurred during the
year your Board is not able to
recommend any dividend for the
financial year ended 2011-12 (previous
year Re. 0.5 per share).
Consolidated FinancialStatementsAs required by the Listing Agreement
with the Stock Exchanges and in
accordance with the Accounting
Standards AS-21 on consolidated
financial statements, your Directors
provide the audited annual consolidated
financial statements in this Annual
Report.
Corporate DebtrestructuringIn view of the operating losses faced by
the Company and the high level of Debt,
Punjab National Bank the lead Bank has
made a reference to the CDR cell for
restructuring the Company’s debt.
Directors' ResponsibilityStatementPursuant to Section 217 (2AA) of the
Companies Act, 1956, as amended by
the Companies (Amendment) Act,
2000, the Directors confirm that:
a) In preparation of the annual
accounts, applicable accounting
standards have been followed along
with proper explanations relating to
material departures;
b) Appropriate accounting policies
have been selected and applied
consistently and have made
judgments and estimates that are
reasonable and prudent, so as to
give a true and fair view of the state
of affairs of the Company as on
March 31, 2012 and of the loss of
the Company for the year ended
March 31, 2012;
c) Proper and sufficient care has been
taken for maintenance of adequate
accounting records in accordance
with the provisions of the
Companies Act, 1956, for
safeguarding the assets of the
Company and for preventing and
detecting fraud and other
irregularities; and
d) The annual accounts have been
prepared on a going concern basis.
Subsidiary companiesIn accordance with the general circular
issued by the Ministry of Corporate
Affairs, Government of India, the
Balance Sheet, Profit and Loss Account
52.0050.0048.0046.0044.0042.00
30.04
.2012
30.03
.2012
29.02
.2012
31.01
.2012
30.12
.2011
30.11
.2011
31.10
.2011
29.09
.2011
30.08
.2011
29.07
.2011
29.04
.2011
05.04
.2011
30.06
.2011
31.05
.2011
40.00
54.00
Annual Report 2011-12 | 33
and other documents of the subsidiary
companies are not being attached with
the Balance Sheet of the Company. The
Company shall provide a copy of the
Annual Report of its subsidiary
companies, free of cost, as required
under Section 212 of the Act to
members on their written request to the
Company Secretary at the registered
office of the Company. These
documents will also be available for
inspection by any shareholder at the
registered office of your company on
any working day during business hours.
The Consolidated Financial Statements
presented by the Company include the
financial results of its subsidiary
companies.
A statement pursuant to section 212 of
the Companies Act, 1956, containing
details of subsidiaries of the Company
also forms part of this Annual Report.
DirectorsMr. Shivkumar Bhardwaj, Mr. Atul Sud
and Mrs. Poonam Talwar resigned as
Director of the Board. The Board placed
on record its deep sense of appreciation
for the services rendered by them as
Directors of the Company.
The Board places on record its
condolences for the sad demise of Mr.
Prannath Talwar, who has passed away
on 2nd May, 2012.
Mr. Pradeep Saxena, Mr. Vishal Malik
and Mr. Rohan Talwar were appointed
as Additional Directors at the Meeting
of the Board of Directors held on 3rd
May, 2012 and they hold office until the
conclusion of the ensuing Annual
General Meeting. Notices have been
received from Members of the Company
for appointing them at the ensuing
General Meeting.
Brief resume of Mr. Pradeep Saxena, Mr.
Vishal Malik and Mr. Rohan Talwar the
nature of their expertise in specific
functional areas and the names of the
companies in which they hold
directorships as stipulated in Clause 49
of the Listing agreement is provided in
the report on Corporate Governance
annexed to the Annual Report.
Corporate GovernancePursuant to Clause 49 of the Listing
Agreement with the Stock Exchanges, a
detailed report on Corporate
Governance forms a part of this Annual
Report. A certificate from the auditors of
the Company confirming their
compliance with the conditions of
Corporate Governance as stipulated
under Clause 49 of the Listing
Agreement is attached to this Report.
Management Discussionand AnalysisManagement Discussion and Analysis
on matters related to business
performance, as stipulated in Clause 49
of the Listing Agreement with the Stock
Exchanges, is given in a separate
statement which forms part of the
Annual Report.
PersonnelRelationships with employees continued
to be cordial. The HR policies of your
Company were focused on the
development potential of each
employee. With this premise, a
comprehensive set of HR policies were
laid down, aiming to attract, retain and
motivate employees at all levels.
Information required under Section
217(2A) of the Companies Act, 1956,
read with Companies (Particulars of
Employees) Rules, 1975 as amended, is
provided in the Annexure forming part
of the Directors’ Report. In terms of
Section 219(1)(b)(iv) of the Act, the
Report and Accounts are being sent to
the shareholders excluding the aforesaid
Annexure. Any shareholder interested in
obtaining a copy of the same may write
to the Company Secretary at the
Registered Office of the Company.
Corporate SocialResponsibilityToday’s business environment demands
that corporate play a pivotal role in
shouldering social responsibility. You
will be happy to note that in the year
under review your company executed
several Corporate Social Responsibility
(CSR) programmes for the benefit of the
communities where your company
operates. Your company contributed
actively towards community welfare
measures, taking several initiatives
related to education, health,
environmental improvement and other
development measures such as:
Regular medical check up
Blood donation camps
Tree plantation programmes on
World Environment Day and Earth
Day to promote awareness about the
effect of climate change and
importance of environment
protection
34 | NITCO Limited Innovation for a better life
Conducting Safety Awareness
programmes regularly
Support to sports activities including
local sports championships for
kabaddi and cricket.
First aid centre at manufacturing
facility
Conservation of Energy,Technology Absorption andForeign ExchangeEarnings/Outgo The information required under Section
217(1)(e) of the Companies Act, 1956,
read with the Companies (Disclosure of
Particulars in the Report of Board of
Directors) Rules, 1988, with respect to
conservation of energy, technology
absorption and foreign exchange
earnings/outgo is given in Annexure A,
which forms part of this Report.
Risk and ConcernChanges in macro economic factors like
inflation, interest rate, world trade,
exchange rate, etc. also play an
important role in our industry thereby
affecting the operations of business.
Any adverse change in the above may
affect the performance of your
Company. Your Company periodically
reviews the risk associated with the
business and takes steps to mitigate and
minimise the impact of risk.
Quality Safety andenvironmentYour Company, in order to ensure
highest standard of safety, has
implemented and initiated various
measures with respect to Quality, Safety
and Environment Management Systems.
The initiatives by your Company have
been rewarded with several
recognitions.
Internal control frameworkYour Company conducts its business
with integrity and high standards of
ethical behavior and in compliance with
the laws and regulations that govern its
business. Your Company has a well
established framework of internal
controls in operation, including suitable
monitoring procedures. In addition to
the external audit, the financial and
operating controls of your Company at
various locations are reviewed by
Internal Auditors, who report their
observations to the Audit Committee of
the Board.
Auditors’ ReportThe Board has duly examined the
statutory auditor’s report to accounts
and clarifications, wherever necessary,
have been included in the Notes to
Accounts section of the Annual Report.
AuditorsThe present auditors of the Company,
M/s. A. Husein Noumanali & Co.,
Chartered Accountants, retire at the
conclusion of the Annual General
Meeting and being eligible, offer
themselves for re-appointment. Your
Directors recommend their
appointment.
Appreciation andacknowledgementYour Directors wish to place on record
their sincere thanks to the following
stakeholders:
Customers, who continue to be
delighted in the Company's range of
products and their quality, and who
therefore continue to patronise the
Company's products despite
competition
Banks and financial institutions for
their continued support
Employees for their sincere efforts
during the year under review.
Annual Report 2011-12 | 35
Particulars as per the Companies
(Disclosure of particulars in the report of
the Board of Directors) Rules, 1988.
A) Conservation of Energy:The Company’s manufacturing
operations are energy intensive. The
concern for more efficient utilisation
and conservation of energy has
remained not only in the domain of the
top management but has also
percolated to the shop floor.
Continuous improvements in the
manufacturing processes and practices
are carried out with one of the
objectives of energy conservation. The
Company has installed a 5.5 MW captive
power plant. The waste heat generated
from this captive power plant is used in
spray dryers resulting in a daily RLNG
saving of around 405 MMBTU.
B) Technology Absorption:The state of the art Marble processing
plant commenced operations during FY
2011-12. Major equipments have been
imported from leading equipment
manufacturers like Breton (Italy), Omis
(Italy), Fraccarole E Balzan SPA (Italy)
and Matec (Italy). The Company’s
technicians have been imparted training
in maintenance of this equipment by
supplier’s technicians.
C) Foreign exchangeearnings and outgo:The information on foreign exchange
earnings and outgo is furnished in the
Notes to the Accounts.
Annexure toDirector’s Report
For and on behalf of the Board
Sd/- Sd/-
Date: 27th July, 2012 Vivek Talwar Vishal Malik
Place: Mumbai Managing Director Director
36 | NITCO Limited Innovation for a better life
Report on Corporate Governance
Corporate Governance pertains to the
system by which companies are directed
and controlled, keeping in mind the
long-term interests of stakeholders. It
refers to the blend of law, regulations
and voluntary practices, which enable
the Company to attract financial and
human capital, perform efficiently and
thereby perpetually generate long-term
economic value for its shareholders,
while respecting and balancing the
interests of other stakeholders and
society as a whole.
It aims to align the interest of the
Company with that of its shareholders
and other key stakeholders. The
incentive for companies, and for those
who own and manage them, to adopt
global governance standards which will
help them achieve a long-term
partnership with their stakeholders
and achieve their corporate
objectives efficiently. The principal
characteristics of Corporate Governance
are transparency, independence,
accountability, fairness and social
responsibility.
In sum, Corporate Governance focuses
on the treatment of all shareholders and
reinforces the belief among the
shareholders that it is ‘Your Company’
as it belongs to them. The Chairman and
Board of Directors are the shareholders’
fiduciaries and trustees pushing the
business forward and maximising long-
term value for them.
A good governance process provides
transparent corporate policies,
strategies and the decision-making
process and also strengthens internal
control systems and helps in building
relationships with all stakeholders. We
at NITCO believe in being transparent
and commit ourselves to adherence to
good Corporate Governance practices at
all times, as we believe that good
governance generates goodwill among
business partners, customers and
investors and helps the Company grow.
A. Board of Directors 1. Composition of the Board and abrief profile of DirectorsThe Board of Nitco consists of two
Independent Directors, which together
constitute 50% of the total number of
Board of Directors.
The composition of the Board of
Directors is in conformity with Clause 49
of the Listing Agreement.
The day-to-day management of the
Company is conducted by the Managing
Director.
Mr. Vivek Talwar, son of Mr. Pran Nath
Talwar, aged 55 years, is the Managing
Director of your Company. He holds a
Bachelor’s Degree in Science and has a
rich experience of over 30 years in the
tile industry. He joined the Company as
a Director in 1980. The operational
responsibility and day-to-day
functioning of the Company were
gradually handed over to him. He was
instrumental in setting up a plant at
Alibaug to manufacture ceramic floor
tiles and also in diversifying the business
of the Company by entering into new
activities such as marketing of imported
marble, vitrified tiles and cement in
India. Mr. Vivek Talwar holds 63,23,669
equity shares in the Company.
Mr. Pradeep Saxena, aged 64 years,
joined the Company as a Director in the
Board Meeting held on 3rd May, 2012.
His career spans 30 years in
international banking and five years in
information technology. He was
President of e-Funds International from
2000 to 2003. Earlier he was Managing
Director and CEO, South Asia Region of
ING Barings and Executive Director with
Merrill Lynch International. Starting his
career with Grindlays Bank, he has
worked in senior management positions
for the Gulf International Bank, the
American Express Bank, and Grindlays
Bank in the US, the UK, Europe, the Gulf
and India. Mr. Saxena is a consultant
and specialist advisor engaged primarily
with SMEs and start-ups for advice on
corporate strategy and management
and business development. Among his
assignments, he serves as the Executive
Director of the Indian Institute for
Human Settlements (IIHS), a prospective
independent national university for
innovation, an initiative which has been
established by a group of publically-
minded citizens. He has a Bachelor’s
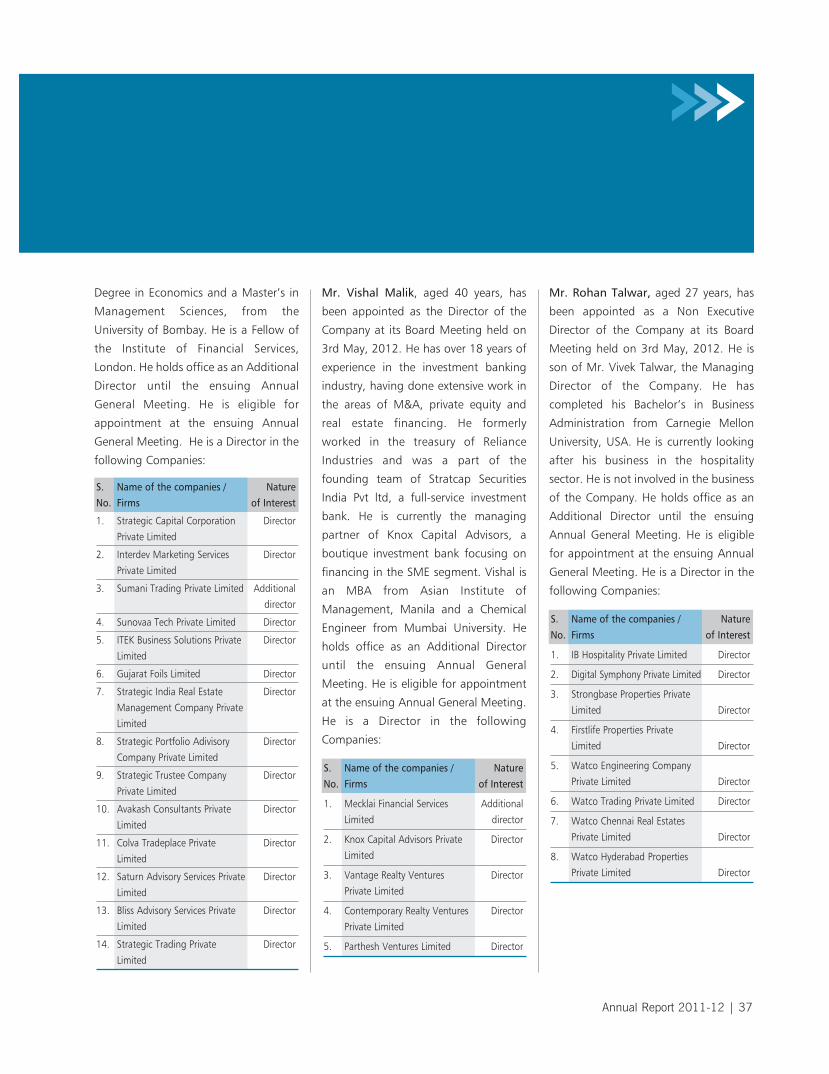
Annual Report 2011-12 | 37
Mr. Rohan Talwar, aged 27 years, has
been appointed as a Non Executive
Director of the Company at its Board
Meeting held on 3rd May, 2012. He is
son of Mr. Vivek Talwar, the Managing
Director of the Company. He has
completed his Bachelor’s in Business
Administration from Carnegie Mellon
University, USA. He is currently looking
after his business in the hospitality
sector. He is not involved in the business
of the Company. He holds office as an
Additional Director until the ensuing
Annual General Meeting. He is eligible
for appointment at the ensuing Annual
General Meeting. He is a Director in the
following Companies:
Degree in Economics and a Master’s in
Management Sciences, from the
University of Bombay. He is a Fellow of
the Institute of Financial Services,
London. He holds office as an Additional
Director until the ensuing Annual
General Meeting. He is eligible for
appointment at the ensuing Annual
General Meeting. He is a Director in the
following Companies:
S. Name of the companies / Nature No. Firms of Interest
1. Strategic Capital Corporation Director
Private Limited
2. Interdev Marketing Services Director
Private Limited
3. Sumani Trading Private Limited Additional
director
4. Sunovaa Tech Private Limited Director
5. ITEK Business Solutions Private Director
Limited
6. Gujarat Foils Limited Director
7. Strategic India Real Estate Director
Management Company Private
Limited
8. Strategic Portfolio Adivisory Director
Company Private Limited
9. Strategic Trustee Company Director
Private Limited
10. Avakash Consultants Private Director
Limited
11. Colva Tradeplace Private Director
Limited
12. Saturn Advisory Services Private Director
Limited
13. Bliss Advisory Services Private Director
Limited
14. Strategic Trading Private Director
Limited
S. Name of the companies / Nature No. Firms of Interest
1. Mecklai Financial Services Additional
Limited director
2. Knox Capital Advisors Private Director
Limited
3. Vantage Realty Ventures Director
Private Limited
4. Contemporary Realty Ventures Director
Private Limited
5. Parthesh Ventures Limited Director
Mr. Vishal Malik, aged 40 years, has
been appointed as the Director of the
Company at its Board Meeting held on
3rd May, 2012. He has over 18 years of
experience in the investment banking
industry, having done extensive work in
the areas of M&A, private equity and
real estate financing. He formerly
worked in the treasury of Reliance
Industries and was a part of the
founding team of Stratcap Securities
India Pvt ltd, a full-service investment
bank. He is currently the managing
partner of Knox Capital Advisors, a
boutique investment bank focusing on
financing in the SME segment. Vishal is
an MBA from Asian Institute of
Management, Manila and a Chemical
Engineer from Mumbai University. He
holds office as an Additional Director
until the ensuing Annual General
Meeting. He is eligible for appointment
at the ensuing Annual General Meeting.
He is a Director in the following
Companies:
S. Name of the companies / Nature No. Firms of Interest
1. IB Hospitality Private Limited Director
2. Digital Symphony Private Limited Director
3. Strongbase Properties Private
Limited Director
4. Firstlife Properties Private
Limited Director
5. Watco Engineering Company
Private Limited Director
6. Watco Trading Private Limited Director
7. Watco Chennai Real Estates
Private Limited Director
8. Watco Hyderabad Properties
Private Limited Director
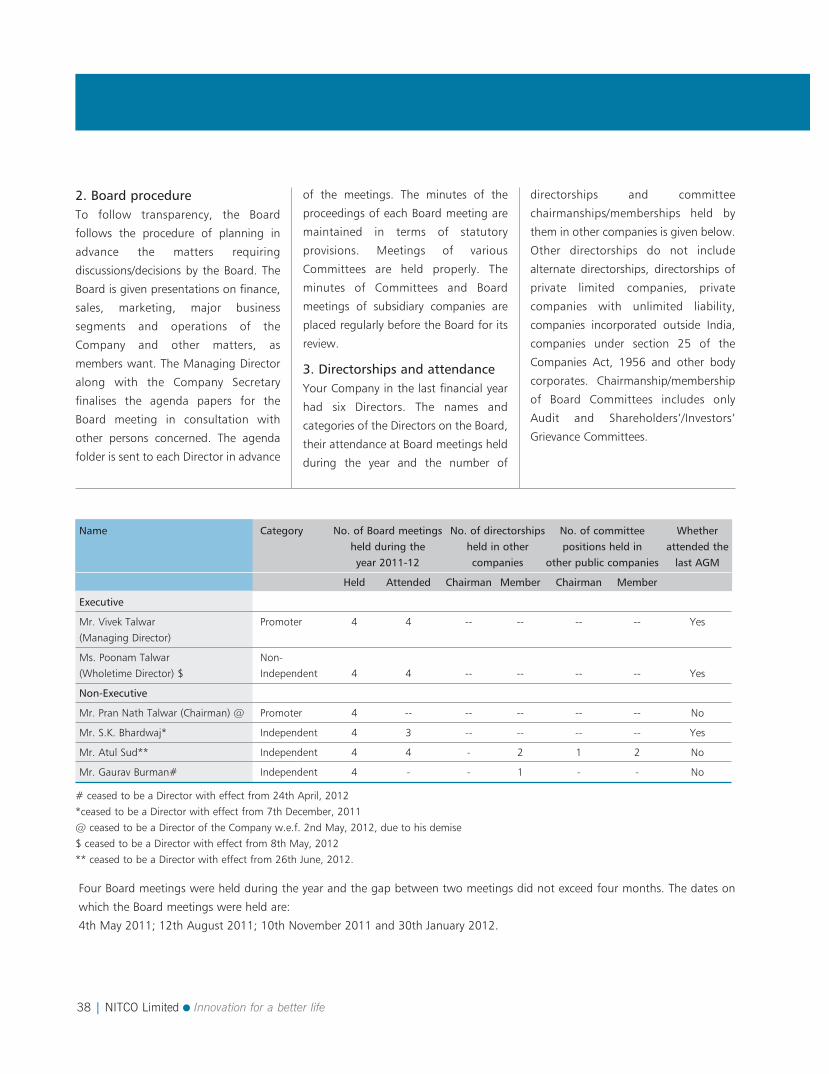
38 | NITCO Limited Innovation for a better life
Name Category No. of Board meetings No. of directorships No. of committee Whether held during the held in other positions held in attended the year 2011-12 companies other public companies last AGM
Held Attended Chairman Member Chairman Member
Executive
Mr. Vivek Talwar Promoter 4 4 -- -- -- -- Yes
(Managing Director)
Ms. Poonam Talwar Non-
(Wholetime Director) $ Independent 4 4 -- -- -- -- Yes
Non-Executive
Mr. Pran Nath Talwar (Chairman) @ Promoter 4 -- -- -- -- -- No
Mr. S.K. Bhardwaj* Independent 4 3 -- -- -- -- Yes
Mr. Atul Sud** Independent 4 4 - 2 1 2 No
Mr. Gaurav Burman# Independent 4 - - 1 - - No
# ceased to be a Director with effect from 24th April, 2012
*ceased to be a Director with effect from 7th December, 2011
@ ceased to be a Director of the Company w.e.f. 2nd May, 2012, due to his demise
$ ceased to be a Director with effect from 8th May, 2012
** ceased to be a Director with effect from 26th June, 2012.
Four Board meetings were held during the year and the gap between two meetings did not exceed four months. The dates on
which the Board meetings were held are:
4th May 2011; 12th August 2011; 10th November 2011 and 30th January 2012.
2. Board procedureTo follow transparency, the Board
follows the procedure of planning in
advance the matters requiring
discussions/decisions by the Board. The
Board is given presentations on finance,
sales, marketing, major business
segments and operations of the
Company and other matters, as
members want. The Managing Director
along with the Company Secretary
finalises the agenda papers for the
Board meeting in consultation with
other persons concerned. The agenda
folder is sent to each Director in advance
of the meetings. The minutes of the
proceedings of each Board meeting are
maintained in terms of statutory
provisions. Meetings of various
Committees are held properly. The
minutes of Committees and Board
meetings of subsidiary companies are
placed regularly before the Board for its
review.
3. Directorships and attendanceYour Company in the last financial year
had six Directors. The names and
categories of the Directors on the Board,
their attendance at Board meetings held
during the year and the number of
directorships and committee
chairmanships/memberships held by
them in other companies is given below.
Other directorships do not include
alternate directorships, directorships of
private limited companies, private
companies with unlimited liability,
companies incorporated outside India,
companies under section 25 of the
Companies Act, 1956 and other body
corporates. Chairmanship/membership
of Board Committees includes only
Audit and Shareholders’/Investors’
Grievance Committees.
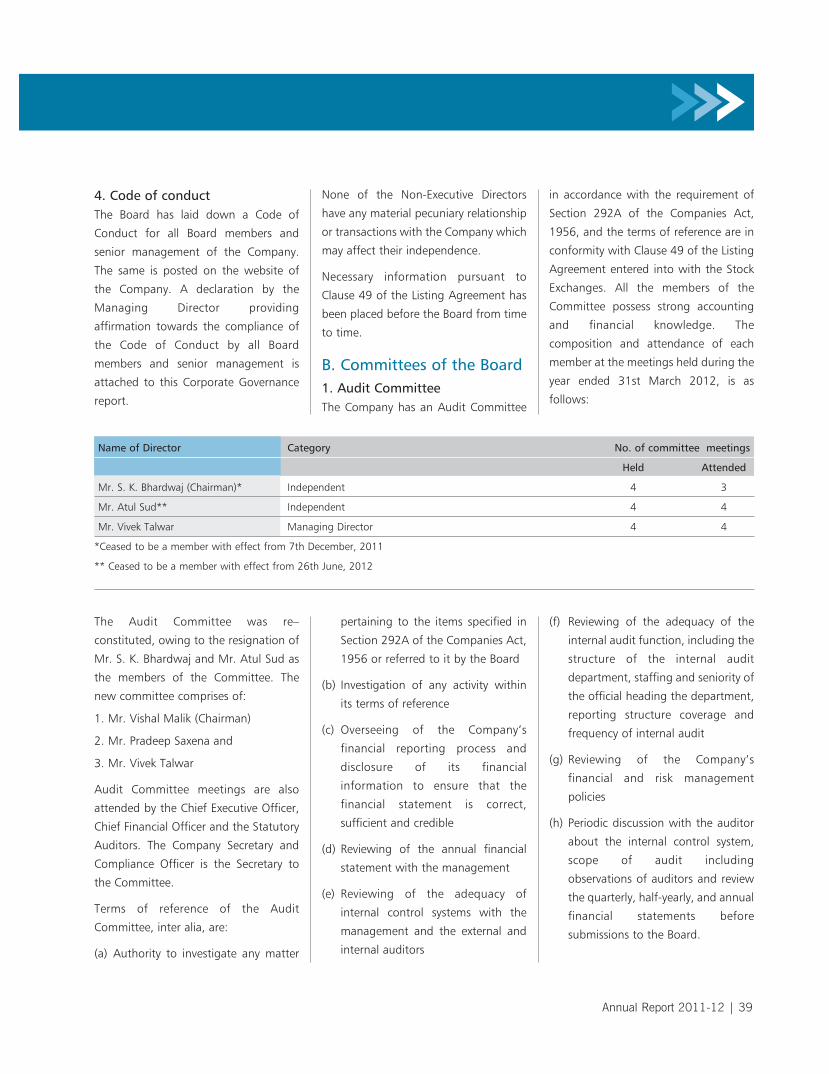
Annual Report 2011-12 | 39
Name of Director Category No. of committee meetings
Held Attended
Mr. S. K. Bhardwaj (Chairman)* Independent 4 3
Mr. Atul Sud** Independent 4 4
Mr. Vivek Talwar Managing Director 4 4
*Ceased to be a member with effect from 7th December, 2011
** Ceased to be a member with effect from 26th June, 2012
4. Code of conductThe Board has laid down a Code of
Conduct for all Board members and
senior management of the Company.
The same is posted on the website of
the Company. A declaration by the
Managing Director providing
affirmation towards the compliance of
the Code of Conduct by all Board
members and senior management is
attached to this Corporate Governance
report.
None of the Non-Executive Directors
have any material pecuniary relationship
or transactions with the Company which
may affect their independence.
Necessary information pursuant to
Clause 49 of the Listing Agreement has
been placed before the Board from time
to time.
B. Committees of the Board1. Audit Committee The Company has an Audit Committee
in accordance with the requirement of
Section 292A of the Companies Act,
1956, and the terms of reference are in
conformity with Clause 49 of the Listing
Agreement entered into with the Stock
Exchanges. All the members of the
Committee possess strong accounting
and financial knowledge. The
composition and attendance of each
member at the meetings held during the
year ended 31st March 2012, is as
follows:
The Audit Committee was re–
constituted, owing to the resignation of
Mr. S. K. Bhardwaj and Mr. Atul Sud as
the members of the Committee. The
new committee comprises of:
1. Mr. Vishal Malik (Chairman)
2. Mr. Pradeep Saxena and
3. Mr. Vivek Talwar
Audit Committee meetings are also
attended by the Chief Executive Officer,
Chief Financial Officer and the Statutory
Auditors. The Company Secretary and
Compliance Officer is the Secretary to
the Committee.
Terms of reference of the Audit
Committee, inter alia, are:
(a) Authority to investigate any matter
pertaining to the items specified in
Section 292A of the Companies Act,
1956 or referred to it by the Board
(b) Investigation of any activity within
its terms of reference
(c) Overseeing of the Company’s
financial reporting process and
disclosure of its financial
information to ensure that the
financial statement is correct,
sufficient and credible
(d) Reviewing of the annual financial
statement with the management
(e) Reviewing of the adequacy of
internal control systems with the
management and the external and
internal auditors
(f) Reviewing of the adequacy of the
internal audit function, including the
structure of the internal audit
department, staffing and seniority of
the official heading the department,
reporting structure coverage and
frequency of internal audit
(g) Reviewing of the Company’s
financial and risk management
policies
(h) Periodic discussion with the auditor
about the internal control system,
scope of audit including
observations of auditors and review
the quarterly, half-yearly, and annual
financial statements before
submissions to the Board.
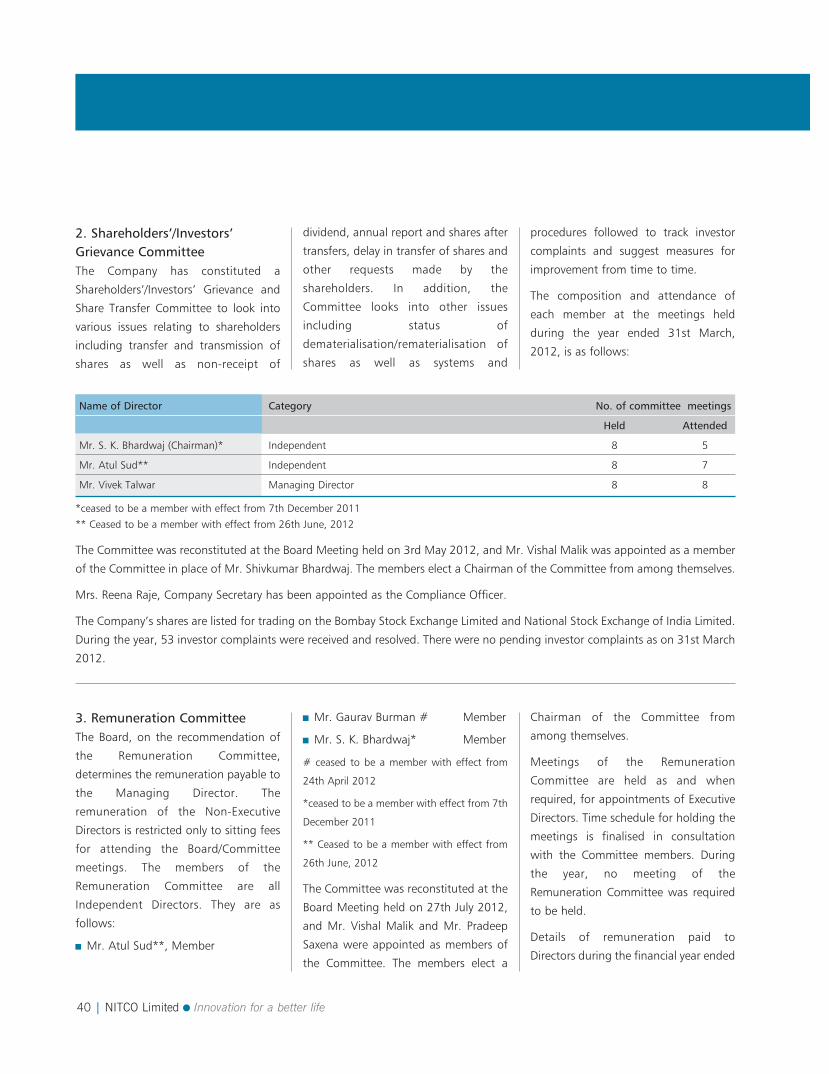
40 | NITCO Limited Innovation for a better life
2. Shareholders’/Investors’Grievance Committee The Company has constituted a
Shareholders’/Investors’ Grievance and
Share Transfer Committee to look into
various issues relating to shareholders
including transfer and transmission of
shares as well as non-receipt of
dividend, annual report and shares after
transfers, delay in transfer of shares and
other requests made by the
shareholders. In addition, the
Committee looks into other issues
including status of
dematerialisation/rematerialisation of
shares as well as systems and
procedures followed to track investor
complaints and suggest measures for
improvement from time to time.
The composition and attendance of
each member at the meetings held
during the year ended 31st March,
2012, is as follows:
3. Remuneration CommitteeThe Board, on the recommendation of
the Remuneration Committee,
determines the remuneration payable to
the Managing Director. The
remuneration of the Non-Executive
Directors is restricted only to sitting fees
for attending the Board/Committee
meetings. The members of the
Remuneration Committee are all
Independent Directors. They are as
follows:
Mr. Atul Sud**, Member
Mr. Gaurav Burman # Member
Mr. S. K. Bhardwaj* Member
# ceased to be a member with effect from
24th April 2012
*ceased to be a member with effect from 7th
December 2011
** Ceased to be a member with effect from
26th June, 2012
The Committee was reconstituted at the
Board Meeting held on 27th July 2012,
and Mr. Vishal Malik and Mr. Pradeep
Saxena were appointed as members of
the Committee. The members elect a
Chairman of the Committee from
among themselves.
Meetings of the Remuneration
Committee are held as and when
required, for appointments of Executive
Directors. Time schedule for holding the
meetings is finalised in consultation
with the Committee members. During
the year, no meeting of the
Remuneration Committee was required
to be held.
Details of remuneration paid to
Directors during the financial year ended
Name of Director Category No. of committee meetings
Held Attended
Mr. S. K. Bhardwaj (Chairman)* Independent 8 5
Mr. Atul Sud** Independent 8 7
Mr. Vivek Talwar Managing Director 8 8
*ceased to be a member with effect from 7th December 2011
** Ceased to be a member with effect from 26th June, 2012
The Committee was reconstituted at the Board Meeting held on 3rd May 2012, and Mr. Vishal Malik was appointed as a member
of the Committee in place of Mr. Shivkumar Bhardwaj. The members elect a Chairman of the Committee from among themselves.
Mrs. Reena Raje, Company Secretary has been appointed as the Compliance Officer.
The Company’s shares are listed for trading on the Bombay Stock Exchange Limited and National Stock Exchange of India Limited.
During the year, 53 investor complaints were received and resolved. There were no pending investor complaints as on 31st March
2012.
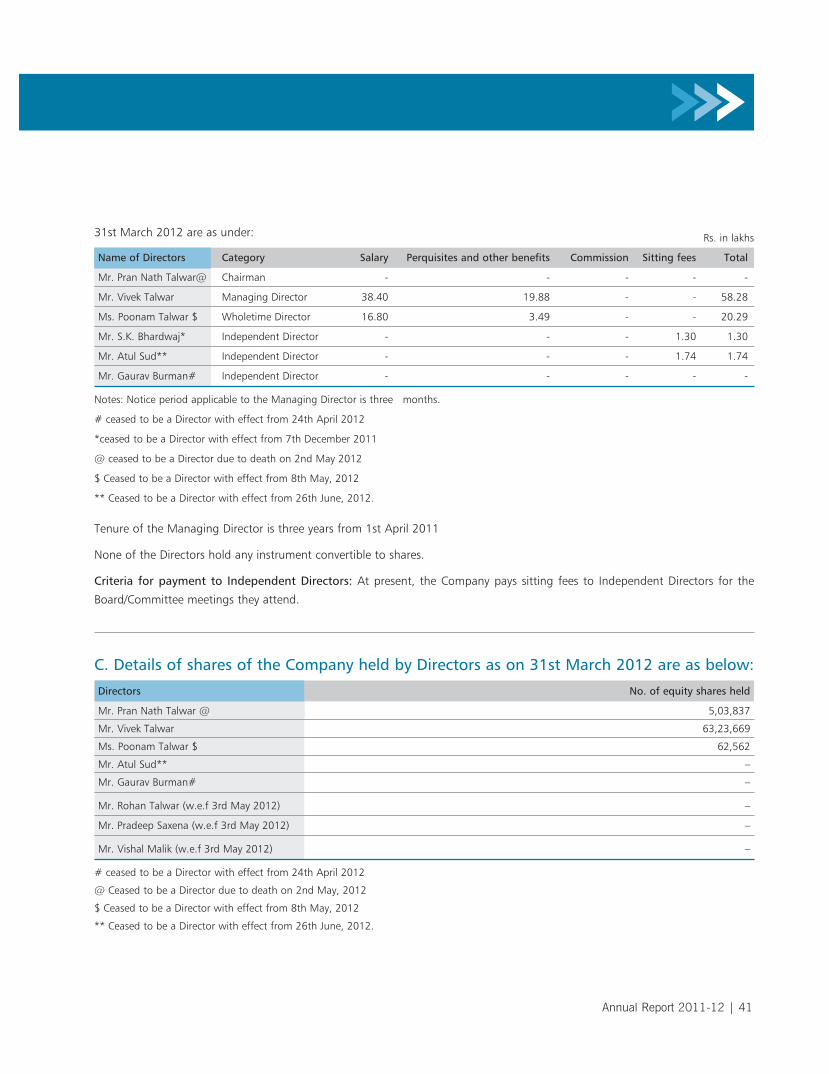
Annual Report 2011-12 | 41
Directors No. of equity shares held
Mr. Pran Nath Talwar @ 5,03,837
Mr. Vivek Talwar 63,23,669
Ms. Poonam Talwar $ 62,562
Mr. Atul Sud** –
Mr. Gaurav Burman# –
Mr. Rohan Talwar (w.e.f 3rd May 2012) –
Mr. Pradeep Saxena (w.e.f 3rd May 2012) –
Mr. Vishal Malik (w.e.f 3rd May 2012) –
# ceased to be a Director with effect from 24th April 2012
@ Ceased to be a Director due to death on 2nd May, 2012
$ Ceased to be a Director with effect from 8th May, 2012
** Ceased to be a Director with effect from 26th June, 2012.
Name of Directors Category Salary Perquisites and other benefits Commission Sitting fees Total
Mr. Pran Nath Talwar@ Chairman - - - - -
Mr. Vivek Talwar Managing Director 38.40 19.88 - - 58.28
Ms. Poonam Talwar $ Wholetime Director 16.80 3.49 - - 20.29
Mr. S.K. Bhardwaj* Independent Director - - - 1.30 1.30
Mr. Atul Sud** Independent Director - - - 1.74 1.74
Mr. Gaurav Burman# Independent Director - - - - -
Notes: Notice period applicable to the Managing Director is three months.
# ceased to be a Director with effect from 24th April 2012
*ceased to be a Director with effect from 7th December 2011
@ ceased to be a Director due to death on 2nd May 2012
$ Ceased to be a Director with effect from 8th May, 2012
** Ceased to be a Director with effect from 26th June, 2012.
Tenure of the Managing Director is three years from 1st April 2011
None of the Directors hold any instrument convertible to shares.
Criteria for payment to Independent Directors: At present, the Company pays sitting fees to Independent Directors for the
Board/Committee meetings they attend.
C. Details of shares of the Company held by Directors as on 31st March 2012 are as below:
Rs. in lakhs31st March 2012 are as under:
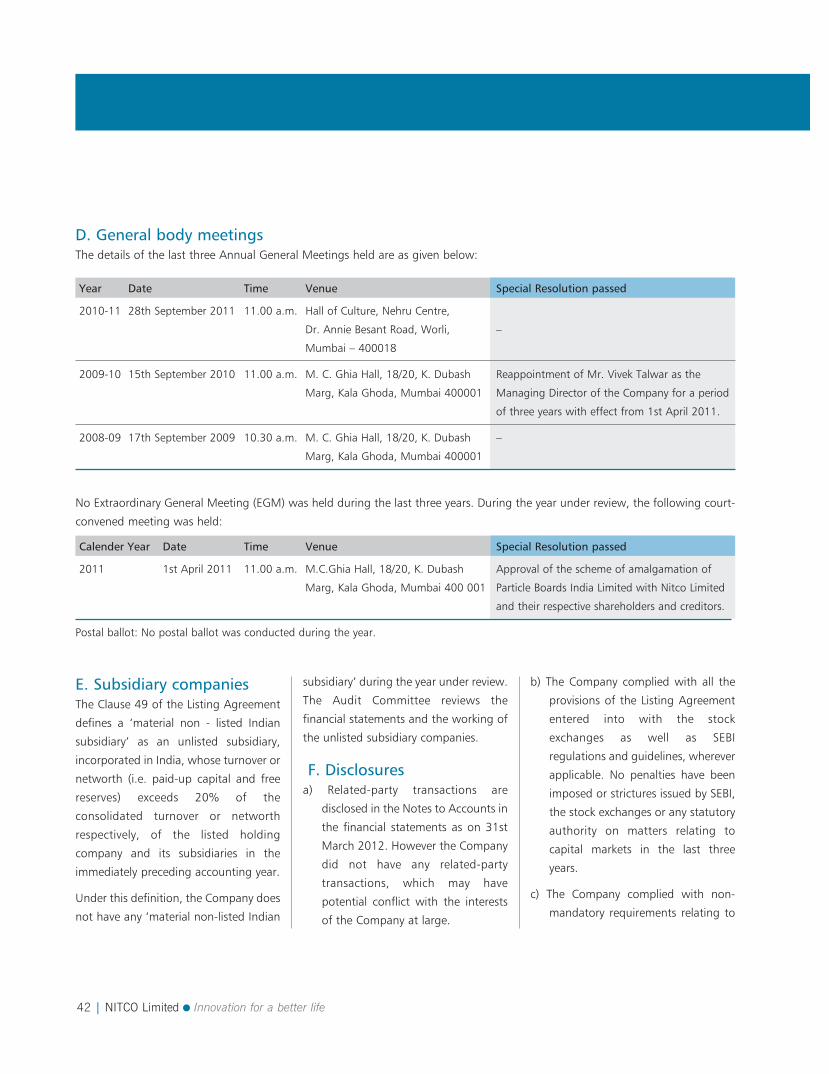
42 | NITCO Limited Innovation for a better life
D. General body meetingsThe details of the last three Annual General Meetings held are as given below:
E. Subsidiary companiesThe Clause 49 of the Listing Agreement
defines a ‘material non - listed Indian
subsidiary’ as an unlisted subsidiary,
incorporated in India, whose turnover or
networth (i.e. paid-up capital and free
reserves) exceeds 20% of the
consolidated turnover or networth
respectively, of the listed holding
company and its subsidiaries in the
immediately preceding accounting year.
Under this definition, the Company does
not have any ‘material non-listed Indian
subsidiary’ during the year under review.
The Audit Committee reviews the
financial statements and the working of
the unlisted subsidiary companies.
F. Disclosuresa) Related-party transactions are
disclosed in the Notes to Accounts in
the financial statements as on 31st
March 2012. However the Company
did not have any related-party
transactions, which may have
potential conflict with the interests
of the Company at large.
b) The Company complied with all the
provisions of the Listing Agreement
entered into with the stock
exchanges as well as SEBI
regulations and guidelines, wherever
applicable. No penalties have been
imposed or strictures issued by SEBI,
the stock exchanges or any statutory
authority on matters relating to
capital markets in the last three
years.
c) The Company complied with non-
mandatory requirements relating to
No Extraordinary General Meeting (EGM) was held during the last three years. During the year under review, the following court-
convened meeting was held:
Year Date Time Venue Special Resolution passed
2010-11 28th September 2011 11.00 a.m. Hall of Culture, Nehru Centre,
Dr. Annie Besant Road, Worli, –
Mumbai – 400018
2009-10 15th September 2010 11.00 a.m. M. C. Ghia Hall, 18/20, K. Dubash Reappointment of Mr. Vivek Talwar as the
Marg, Kala Ghoda, Mumbai 400001 Managing Director of the Company for a period
of three years with effect from 1st April 2011.
2008-09 17th September 2009 10.30 a.m. M. C. Ghia Hall, 18/20, K. Dubash –
Marg, Kala Ghoda, Mumbai 400001
Calender Year Date Time Venue Special Resolution passed
2011 1st April 2011 11.00 a.m. M.C.Ghia Hall, 18/20, K. Dubash Approval of the scheme of amalgamation of
Marg, Kala Ghoda, Mumbai 400 001 Particle Boards India Limited with Nitco Limited
and their respective shareholders and creditors.
Postal ballot: No postal ballot was conducted during the year.
Annual Report 2011-12 | 43
the Remuneration Committee and
that the financial statements of the
Company are unqualified.
d) A qualified Practicing Company
Secretary carried out a secretarial
audit to reconcile the total admitted
capital with National Securities
Depository Limited (NSDL) and
Central Depository Services (India)
Limited (CDSL), total issued and
listed capital. The secretarial audit
report, provided quarterly, confirms
that the total issued/paid-up capital
is in agreement with the total
number of shares in physical form
and number of dematerialised
shares held with NSDL and CDSL.
e) In compliance with the SEBI’s
regulations on prevention of insider
trading, the Company has instituted
a comprehensive Code of Conduct
for the prevention of insider trading
for its Directors, officers and
designated employees. The Code
lays down guidelines which advise
them on the procedures to be
followed and disclosures to be
made, while dealing with the shares
of the Company and cautioning
them of the consequences of
violations.
G. Risk managementYour Company has a well-defined risk
management framework in place. The
risk management framework adopted
by the Company is discussed in detail in
the management discussion and
analysis chapter of this annual report.
Your Company established procedures
for minimising the risk and steps are
taken by it for mitigating the risk.
H. Means of communicationThe quarterly and half-yearly results of
the Company are published within 48
hours in ‘Business Standard’ (English)
and ‘Sakal’ (Marathi). The results,
press releases and the shareholding
pattern of the Company are displayed
on the Company’s website
www.nitco.in from time to time.
Presentations, if any, made to
institutional investors and analysts
after the declaration of quarterly, half-
yearly and annual results are also
displayed on the Company’s website.
The Company also informs, by way of
intimation, to the stock exchanges all
price-sensitive matters or such other
matters which in its opinion are
material and relevant to shareholders.
All data/reports required to be filed
with the stock exchanges have been
regularly filed with them.
Management discussion and analysis:
A report on management discussion
and analysis is appended and forms
part of this annual report.
I. Shareholders’ information a) The Annual General Meeting is
scheduled to be held on Saturday,
the 22nd Day of September 2012 at
11.00 am at Hall of Culture, Nehru
Centre, Dr. Annie Besant Road,
Worli, Mumbai - 400 018.
b) Financial year: The Company
follows April-March as its financial
year.
c) Date of book closure: 15th
September 2012 to 22nd September
2012 (both days inclusive).
d) Listing on stock exchanges: The
Company's equity shares are listed
on the National Stock Exchange of
India Limited and Bombay Stock
Exchange Limited. The Company has
paid listing fees to the stock
exchanges for the financial year
2012-13.
e) Stock code/symbol: BSE - 532722
NSE - NITCO
Demat International
Security Identification
Number in NSDL and
CDSL for equity
shares – ISIN -
INE858F01012.
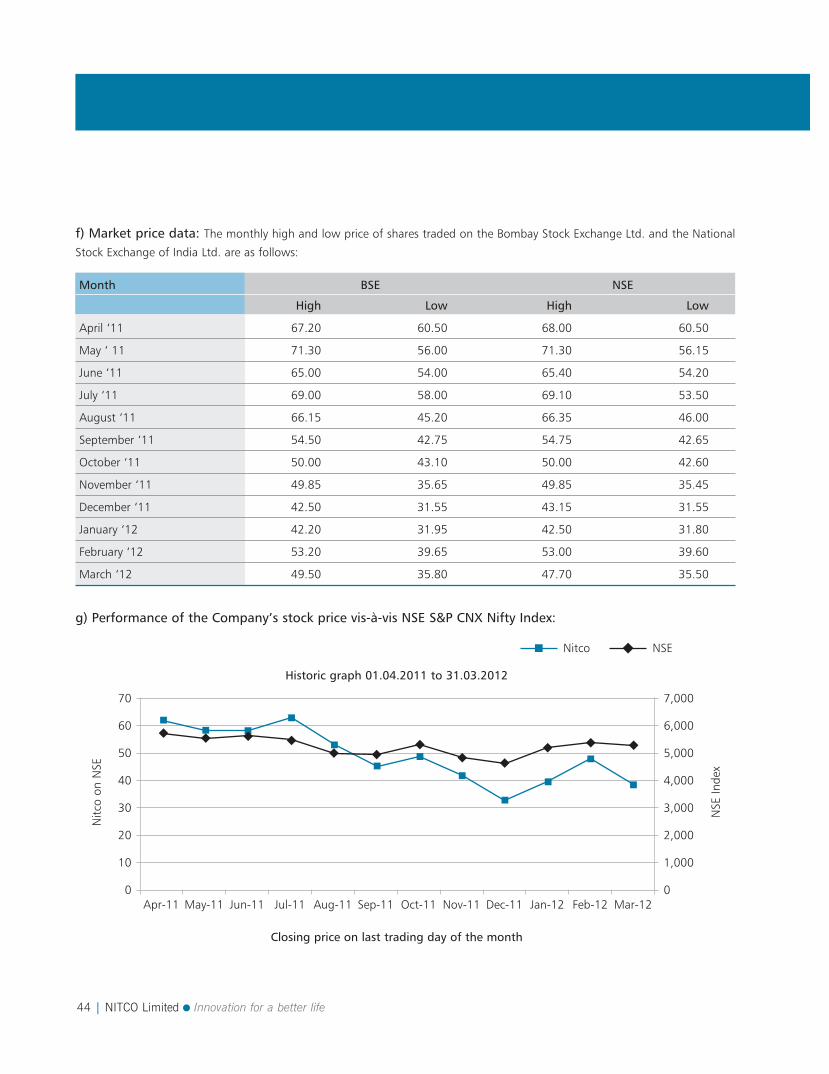
44 | NITCO Limited Innovation for a better life
Month BSE NSE
High Low High Low
April ‘11 67.20 60.50 68.00 60.50
May ‘ 11 71.30 56.00 71.30 56.15
June ‘11 65.00 54.00 65.40 54.20
July ‘11 69.00 58.00 69.10 53.50
August ‘11 66.15 45.20 66.35 46.00
September ‘11 54.50 42.75 54.75 42.65
October ‘11 50.00 43.10 50.00 42.60
November ‘11 49.85 35.65 49.85 35.45
December ‘11 42.50 31.55 43.15 31.55
January ‘12 42.20 31.95 42.50 31.80
February ‘12 53.20 39.65 53.00 39.60
March ‘12 49.50 35.80 47.70 35.50
f) Market price data: The monthly high and low price of shares traded on the Bombay Stock Exchange Ltd. and the National
Stock Exchange of India Ltd. are as follows:
g) Performance of the Company’s stock price vis-à-vis NSE S&P CNX Nifty Index:
Historic graph 01.04.2011 to 31.03.2012
Closing price on last trading day of the month
Nitco
Nitc
o on
NSE
NSE
Inde
x
Apr-110
10
20
30
40
50
60
70
0
1,000
2,000
3,000
4,000
5,000
6,000
7,000
May-11 Jun-11 Jul-11 Aug-11 Sep-11 Oct-11 Nov-11 Dec-11 Jan-12 Feb-12 Mar-12
NSE
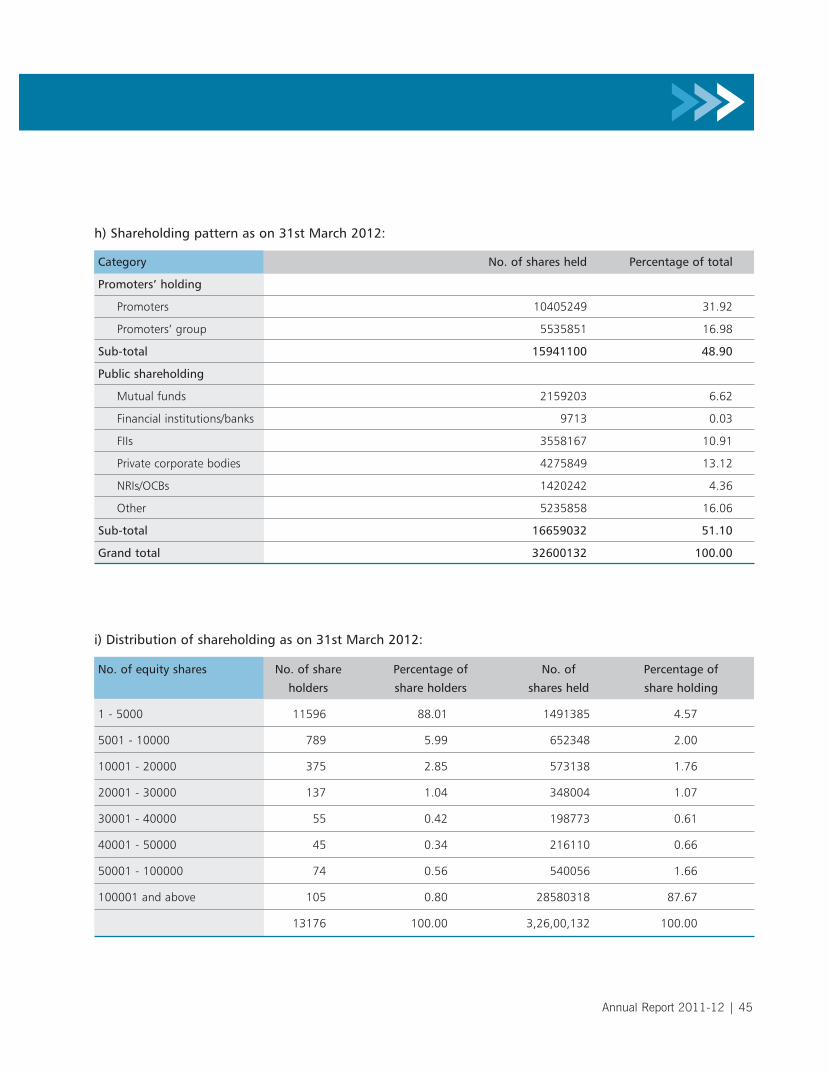
Annual Report 2011-12 | 45
Category No. of shares held Percentage of total
Promoters’ holding
Promoters 10405249 31.92
Promoters’ group 5535851 16.98
Sub-total 15941100 48.90
Public shareholding
Mutual funds 2159203 6.62
Financial institutions/banks 9713 0.03
FIIs 3558167 10.91
Private corporate bodies 4275849 13.12
NRIs/OCBs 1420242 4.36
Other 5235858 16.06
Sub-total 16659032 51.10
Grand total 32600132 100.00
h) Shareholding pattern as on 31st March 2012:
No. of equity shares No. of share Percentage of No. of Percentage of
holders share holders shares held share holding
1 - 5000 11596 88.01 1491385 4.57
5001 - 10000 789 5.99 652348 2.00
10001 - 20000 375 2.85 573138 1.76
20001 - 30000 137 1.04 348004 1.07
30001 - 40000 55 0.42 198773 0.61
40001 - 50000 45 0.34 216110 0.66
50001 - 100000 74 0.56 540056 1.66
100001 and above 105 0.80 28580318 87.67
13176 100.00 3,26,00,132 100.00
i) Distribution of shareholding as on 31st March 2012:
46 | NITCO Limited Innovation for a better life
j) Registered office: Nitco Limited, Nitco House, Recondo
Compound, Inside Municipal Asphalt
Compound, S. K. Ahire Marg, Worli,
Mumbai - 400 030.
Tel: 022 6616 4555;
Fax: 022 6616 4657
k) Corporate office:Nitco Limited, Plot No.3, Kanjur Village,
Station Road, Kanjurmarg (East),
Mumbai – 400042.
Tel No.: 022 6752 1555;
Fax No.: 022 6752 1500
Email: [email protected]
Website: www.nitco.in
l) Plant locations: Our existing production facilities are
located at Poynad (Alibaug) for
ceramic/porcelain tiles. Our marble
processing facilities are located at
Kanjurmarg (Mumbai) and Silvassa.
m) Registrars and Transfer Agents: Link Intime India Private Limited, C-13
Pannalal Silk Mills Compound, L. B. S.
Marg, Bhandup (W), Mumbai - 400 078.
Tel: 022 2594 6970;
Fax: 022 2596 2691
E-mail: [email protected]
Website: www.linkintime.co.in
n) Share transfer system:Transfers of the dematerialised shares
are done through depository participant
where there is no involvement of the
Company. The transfer of shares in
physical form as and when received are
normally processed within 15 days from
the date of receipt subject to the
documents being valid and complete in
all respects.
n) Dematerialisation of shares andliquidity:The Company’s shares are compulsorily
traded in dematerialised form and are
available for trading on both the
depositories viz. National Securities
Depository Limited (NSDL) and Central
Depository Services (India) Limited
(CDSL).
Percentage of shares held in physical
and dematerialised form as on 31st
March 2012:
Physical Form : 1.95
Electronic Form with CDSL : 29.48
Electronic Form with NSDL : 68.57
We have no GDR/ADR or any convertible
instrument.
o) Equity shares in the suspenseaccount:As per Clause 5A of the Listing
Agreements with the Stock Exchanges,
the Company reports the following
details in respect of equity shares lying
in the suspense account which were
issued pursuant to the public issue of
the Company:
The voting rights shall remain frozen till
the rightful owner of such shares claims
the shares.
p) Nomination facility: Shareholders holding shares in the
physical form and desirous of making a
nomination in respect of their holding in
the Company, as permitted under
Section 109A of the Companies Act,
1956, are requested to submit to the
Company the prescribed Form 2B for
this purpose.
Securities As on April 1, 2011 Shareholders who approached Balance as on
the Registrars and shares March 31, 2012
transferred in their favour
during the year
No. of No. of No. of No. of No. of No. of
records shares records shares records shares
Equity shares 11 785 0 0 11 785
For and on behalf of the Board
Sd/-
Date: 27th July 2012 Vivek Talwar
Place: Mumbai Managing Director
Annual Report 2011-12 | 47
Declaration
Auditor’s certificateon Corporate Governance
In accordance with Clause 49 of the Listing Agreement with the stock exchanges, I hereby confirm and declare that all the Board
of Directors and the senior management personnel of the Company have affirmed compliance with the ‘Code of Conduct for
Board Members and Senior Management’ laid down for them for the financial year ended 31st March 2012.
For Nitco Limited
Sd/-
Place: Mumbai Vivek Talwar
Date: 3rd May, 2012 Managing Director
To
The Members
Nitco Limited
We have examined the compliance of conditions of Corporate Governance procedures implemented by Nitco Limited for the year
ended March 31, 2012, as stipulated in Clause 49 of the Listing Agreement of the said Company with the Stock Exchanges of
India.
The compliance with the conditions of Corporate Governance is the responsibility of the management. Our examination was
limited to a review of procedures and implementation thereof, adopted by the Company for ensuring compliance with the
conditions of Corporate Governance. It is neither an audit nor an expression of opinion on the financial statements of the
Company.
In our opinion and to the best of our information and according to the explanations given to us, we hereby certify that the
Company has complied in all respects with the conditions of Corporate Governance as stipulated in the above mentioned Listing
Agreement.
We further state that such compliance is neither an assurance as to the future viability of the Company nor the efficiency or the
effectiveness with which the management has conducted the affairs of the Company.
For A. Husein Noumanali & Co.
Chartered Accountants
Sd/-
A. Husein Noumanali
Proprietor
Membership No. 14757
Place: Mumbai
Date: 3rd May 2012

48 | NITCO Limited Innovation for a better life
Financial Section
Annual Report 2011-12 | 49
We have audited the attached Balance Sheet of M/s NITCO
LIMITED as on 31 March, 2012 and also the Profit & Loss Account
of the Company for the year ended on that date, annexed thereto
and the Cash Flow Statement for the year ended on that date.
These financial statements are the responsibility of the Company's
management. Our responsibility is to express an opinion on these
financial statements based on our audit.
We conducted our audit in accordance with auditing standards
generally accepted in India. Those Standards require that we plan
and perform the audit to obtain reasonable assurance about
whether the financial statements are free of material misstatement.
An audit includes examining, on a test basis, evidence supporting
the amounts and disclosures in the financial statements. An audit
also includes assessing the accounting principles used and
significant estimates made by management, as well as evaluating the
overall financial statement presentation. We believe that our audit
provides a reasonable basis for our opinion.
As required by the Companies (Auditors' Report) Order, 2003
issued by the Central Government of India in terms of sub-section
(4A) of section 227 of the Companies Act, 1956, we enclose in the
Annexure, a statement on the matters specified in paragraph 4 and
5 of the said Order.
Further to our comments in the Annexure referred to above, we
report that:
1) We have obtained all the information and explanations, which
to the best of our knowledge and belief were necessary for
the purpose of our audit;
2) In our opinion proper books of accounts as required by law
have been kept by the Company, so far as appears from our
examination of the books;
3) The Balance Sheet, Profit & Loss Account and Cash Flow
Statement dealt with by this report are in agreement with the
books of accounts;
4) In our opinion, the Balance Sheet, Profit & Loss Account and
Cash Flow Statements dealt with by this report comply with
the accounting standards referred to in sub-section (3C) of
Section 211 of the Companies Act, 1956 to the extent
applicable.
5) On the basis of written representations received from the
directors of the Company, as on 31 March, 2012, and taken on
record by the Board of Directors, we report that none of the
directors are disqualified as on 31 March, 2012 from being
appointed as a director in terms of clause (g) of sub-section
(1) of section 274 of the Companies Act, 1956.
6) In our opinion and to the best of our information and
according to the explanation given to us, the said accounts,
read together with the notes to accounts and in particular
note no. 27 give the information as required by the Companies
Act, 1956 in the manner so required and give a true and fair
view in conformity with the accounting principles generally
accepted in India :
a) In the case of the Balance Sheet, of the state of affair of the
Company as at 31 March, 2012 and
b) In the case of Profit & Loss account, of the Loss for the
year ended on that date and
c) In the case of the Cash Flow Statement, of the cash flow
for the year ended on that date.
For A. Husein Noumanali & Co.
Chartered Accountants
Firm Registration No. 107173W
A. Husein Noumanali
Place: Mumbai Proprietor
Date: May 3, 2012 Membership No.: 14757
To
The Members of Nitco Limited
50 | NITCO Limited Innovation for a better life
ANNEXURE TO THE AUDITORS’ REPORT
1 (a) The Company has maintained proper records showing
full particulars including quantitative details and situation
of fixed assets;
(b) As per the information and explanations given to us,
physical verification of fixed assets has been carried out
in terms of the phased programme of verification of its
fixed assets adopted by the Company and no material
discrepancies were noticed on such verification. In our
opinion, the frequency of verification is reasonable, having
regard to the size of the Company and nature of its
business.
(c) During the year, the Company has not disposed of any
substantial / major part of fixed assets.
2 (a) The inventory has been physically verified at reasonable
intervals during the year by the Management/ internal
Auditors.
(b) In our opinion and according to the information and
explanations given to us, procedures of physical
verification of inventory followed by the management/
Internal Auditors are reasonable and adequate in relation
to the size of the Company and the nature of its
business.
(c) The Company is maintaining proper records of
inventories in so far as such records were examined by
us and no material discrepancies were noticed on
physical verification However based on the verification of
inventory the management has identified obsolete, slow
moving and defective inventory of Rs. 3447.47 lacs and
the same has been written off as exceptional items.
3 (a) The Company has granted unsecured loans to wholly
owned subsidiary company. The maximum amount
outstanding at any time during the year is Rs 15160.59
lacs and the year end balance is same.
(b) The rate of interest on aforesaid loans and advances
granted is reasonable. In our opinion rates of interest and
other terms and condition of loans are not prejudicial to
the interest of company. There is no repayment schedule
and loans and advances are repayable on demand,
therefore clause 4 (iii) (c) & (d) of the Companies (Audit
Report) Order,2003 are not applicable.
(e) As informed, the Company has not taken any loans,
secured or unsecured from companies, firms or other
parties covered in the register maintained under section
301 of the Companies Act,1956.Therefore, provisions of
clause 4(iii)(f) and (g) of the Companies (Audit Report)
Order,2003 are not applicable.
4 In our opinion and according to the information and
explanations given to us, there are adequate internal control
procedures commensurate with the size of the Company and
the nature of its business with regard to purchase of inventory
and fixed assets and for the sale of goods. During the course
of our audit, no major weakness has been noticed in the
internal controls.
5 (a) In our opinion and according to the information and
explanations given to us, transactions that need to be
entered into the Register in pursuance of Section 301 of
the Companies Act, 1956 have been so entered.
(b) In our opinion and according to the information and
explanations given to us, the transactions exceeding
Rupees Five Lakhs in respect of each party made in
pursuance of contracts or arrangements entered in the
register maintained under Section 301 of the Companies
Act, 1956 have been made at prices, which are
reasonable having regard to prevailing market prices at
the relevant time.
6. The Company has not accepted any deposits during the year
from the public within the meaning of the provisions of
Section 58A and 58AA of the Companies Act, 1956 and rules
made there under. Hence; the Clause (vi) of the order is not
applicable.
7. In our opinion, the internal audit functions carried out during
the year by firms of Chartered Accountants appointed by the
management have been commensurate with the size of the
company and the nature of its business.
8. According to the information and explanations furnished to
us, the Central Government has not prescribed maintenance
of cost records u/s 209(1)(d) of the Companies Act, 1956 to
this company.
9 (a) According to the records of the Company, the Company
is regular in depositing undisputed statutory dues
including Employees' State Insurance, Income tax, Sales
Annual Report 2011-12 | 51
tax, Wealth-tax, Customs Duty, Excise Duty, Cess and
other statutory dues with appropriate authorities.
According to the information and explanations given to
us, there are no undisputed amounts payable in respect
of such statutory dues which have remained outstanding
at 31March, 2012 for a period more than six months
from the date they became payable.
(b) According to the records of the Company, the dues of
sales tax, income-tax, customs, wealth-tax, excise duty,
cess which have not been deposited on account of
disputes and the forum where the dispute is pending are
as under:-
Name of Nature of Amount Forum
Statute the dues (Rs./lakhs)
Central Duty demand/ 25.10 Customs, Excise &
Excise Act penalty Service Tax Appellate
Tribunal, Mumbai
Central Duty demand/ 658.87 Commissioner Central
Excise Act penalty Excise (Appeals)
Customs Duty demand/ 390.00 Customs, Excise &
Act penalty Service Tax Appellate
Tribunal, Mumbai
10. The Company has no accumulated losses as per books of
accounts at the end of the financial year. It has incurred cash
losses in the financial year under report and no cash losses in
the immediately preceding financial year.
11. In our opinion and according to the information and
explanation provided to us, there has been delay in repayment
of loan which is outstanding as on March 31, 2012 due to a
lender amounting to Rs. 1792.98 lacs which has not been paid
till date.
12. The Company has not granted any loans or advances on the
basis of security by way of pledge of shares, debentures or
other securities.
13. The provisions of any Special Statute applicable to Chit Fund,
Nidhi or Mutual benefit Fund / Societies are not applicable to
the Company.
14. In our opinion and according to the information and
explanations given to us, the Company is not dealing in or
trading in shares, securities, debentures and other investments.
Accordingly, the provisions of clause 4 (xiv) of the Companies
(Auditor's Report) Order, 2003 are not applicable to the
Company.
15. According to the information and explanations given to us,
the company has not given any guarantee for loans taken by
others from banks and financial institutions.
16.. According to the information and explanations given to us,
the term loans raised during the year have been applied for
the purpose for which they were raised.
17. According to the information given to us and on an overall
examination of balance sheet of the company, we report that
no funds raised on short term basis have been used for long
term Investment.
18. The Company has not made any preferential allotment of
shares to parties and companies covered in the Register
maintained under Section 301 of the Companies Act, 1956.
19 The Company has not issued any secured debentures during
the year. Hence, provisions of Clause 4 (xix) of the Companies
(Auditor's Report) Order, 2003 are not applicable to the
Company.
20 The company has not raised any money by public issue during
the year.
21 During the course of our examination of the books and
records of the Company, carried out in accordance with the
generally accepted auditing principles in India, and according
to the information and explanation given to us, we have
neither come across any instances of fraud on or by the
company, noticed or reported during the year, nor have been
informed of such case by the management.
For A. Husein Noumanali & Co.
Chartered Accountants
Firm Registration No. 107173W
A. Husein Noumanali
Place: Mumbai Proprietor
Date: May 3, 2012 Membership No.: 14757
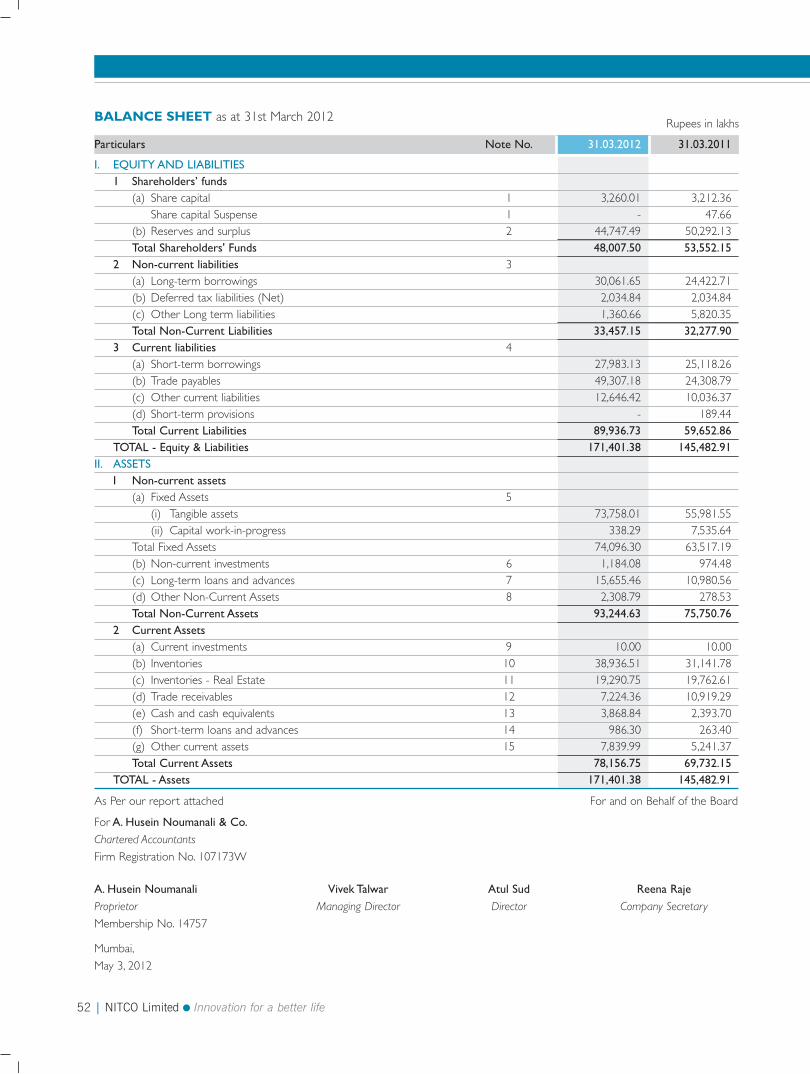
52 | NITCO Limited Innovation for a better life
BALANCE SHEET as at 31st March 2012 Rupees in lakhs
Particulars Note No. 31.03.2012 31.03.2011
I. EQUITY AND LIABILITIES
1 Shareholders’ funds
(a) Share capital 1 3,260.01 3,212.36 Share capital Suspense 1 - 47.66
(b) Reserves and surplus 2 44,747.49 50,292.13 Total Shareholders' Funds 48,007.50 53,552.15
2 Non-current liabilities 3(a) Long-term borrowings 30,061.65 24,422.71(b) Deferred tax liabilities (Net) 2,034.84 2,034.84 (c) Other Long term liabilities 1,360.66 5,820.35 Total Non-Current Liabilities 33,457.15 32,277.90
3 Current liabilities 4(a) Short-term borrowings 27,983.13 25,118.26 (b) Trade payables 49,307.18 24,308.79 (c) Other current liabilities 12,646.42 10,036.37 (d) Short-term provisions - 189.44 Total Current Liabilities 89,936.73 59,652.86
TOTAL - Equity & Liabilities 171,401.38 145,482.91
II. ASSETS
I Non-current assets
(a) Fixed Assets 5(i) Tangible assets 73,758.01 55,981.55 (ii) Capital work-in-progress 338.29 7,535.64
Total Fixed Assets 74,096.30 63,517.19 (b) Non-current investments 6 1,184.08 974.48 (c) Long-term loans and advances 7 15,655.46 10,980.56 (d) Other Non-Current Assets 8 2,308.79 278.53 Total Non-Current Assets 93,244.63 75,750.76
2 Current Assets
(a) Current investments 9 10.00 10.00 (b) Inventories 10 38,936.51 31,141.78 (c) Inventories - Real Estate 11 19,290.75 19,762.61 (d) Trade receivables 12 7,224.36 10,919.29 (e) Cash and cash equivalents 13 3,868.84 2,393.70 (f) Short-term loans and advances 14 986.30 263.40 (g) Other current assets 15 7,839.99 5,241.37 Total Current Assets 78,156.75 69,732.15
TOTAL - Assets 171,401.38 145,482.91
As Per our report attached For and on Behalf of the Board
For A. Husein Noumanali & Co.Chartered Accountants
Firm Registration No. 107173W
A. Husein Noumanali Vivek Talwar Atul Sud Reena RajeProprietor Managing Director Director Company Secretary
Membership No. 14757
Mumbai,
May 3, 2012
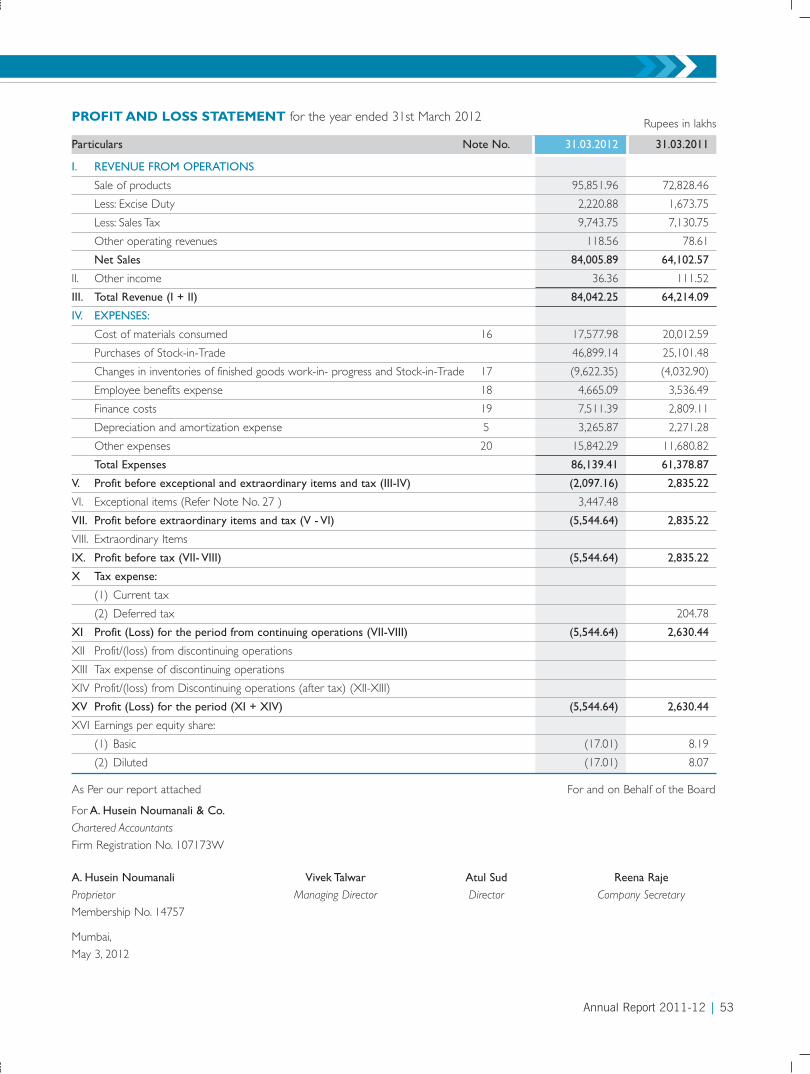
Annual Report 2011-12 | 53
As Per our report attached For and on Behalf of the Board
For A. Husein Noumanali & Co.Chartered Accountants
Firm Registration No. 107173W
A. Husein Noumanali Vivek Talwar Atul Sud Reena RajeProprietor Managing Director Director Company Secretary
Membership No. 14757
Mumbai,
May 3, 2012
PROFIT AND LOSS STATEMENT for the year ended 31st March 2012 Rupees in lakhs
Particulars Note No. 31.03.2012 31.03.2011
I. REVENUE FROM OPERATIONS
Sale of products 95,851.96 72,828.46
Less: Excise Duty 2,220.88 1,673.75
Less: Sales Tax 9,743.75 7,130.75
Other operating revenues 118.56 78.61
Net Sales 84,005.89 64,102.57
II. Other income 36.36 111.52
III. Total Revenue (I + II) 84,042.25 64,214.09
IV. EXPENSES:
Cost of materials consumed 16 17,577.98 20,012.59
Purchases of Stock-in-Trade 46,899.14 25,101.48
Changes in inventories of finished goods work-in- progress and Stock-in-Trade 17 (9,622.35) (4,032.90)
Employee benefits expense 18 4,665.09 3,536.49
Finance costs 19 7,511.39 2,809.11
Depreciation and amortization expense 5 3,265.87 2,271.28
Other expenses 20 15,842.29 11,680.82
Total Expenses 86,139.41 61,378.87
V. Profit before exceptional and extraordinary items and tax (III-IV) (2,097.16) 2,835.22
VI. Exceptional items (Refer Note No. 27 ) 3,447.48
VII. Profit before extraordinary items and tax (V - VI) (5,544.64) 2,835.22
VIII. Extraordinary Items
IX. Profit before tax (VII- VIII) (5,544.64) 2,835.22
X Tax expense:
(1) Current tax
(2) Deferred tax 204.78
XI Profit (Loss) for the period from continuing operations (VII-VIII) (5,544.64) 2,630.44
XII Profit/(loss) from discontinuing operations
XIII Tax expense of discontinuing operations
XIV Profit/(loss) from Discontinuing operations (after tax) (XII-XIII)
XV Profit (Loss) for the period (XI + XIV) (5,544.64) 2,630.44
XVI Earnings per equity share:
(1) Basic (17.01) 8.19
(2) Diluted (17.01) 8.07
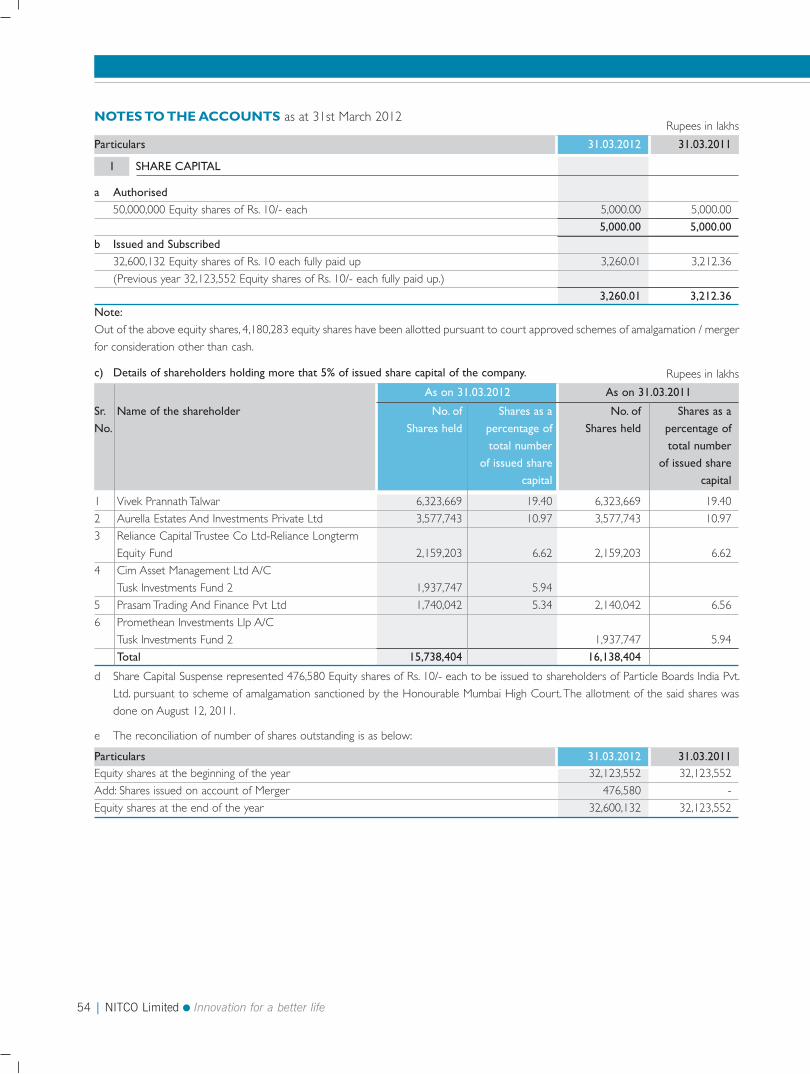
54 | NITCO Limited Innovation for a better life
NOTES TO THE ACCOUNTS as at 31st March 2012Rupees in lakhs
Particulars 31.03.2012 31.03.2011
a Authorised
50,000,000 Equity shares of Rs. 10/- each 5,000.00 5,000.00
5,000.00 5,000.00
b Issued and Subscribed
32,600,132 Equity shares of Rs. 10 each fully paid up 3,260.01 3,212.36
(Previous year 32,123,552 Equity shares of Rs. 10/- each fully paid up.)
3,260.01 3,212.36
Note:
Out of the above equity shares, 4,180,283 equity shares have been allotted pursuant to court approved schemes of amalgamation / merger
for consideration other than cash.
d Share Capital Suspense represented 476,580 Equity shares of Rs. 10/- each to be issued to shareholders of Particle Boards India Pvt.
Ltd. pursuant to scheme of amalgamation sanctioned by the Honourable Mumbai High Court. The allotment of the said shares was
done on August 12, 2011.
e The reconciliation of number of shares outstanding is as below:
c) Details of shareholders holding more that 5% of issued share capital of the company.
1 SHARE CAPITAL
Particulars 31.03.2012 31.03.2011Equity shares at the beginning of the year 32,123,552 32,123,552
Add: Shares issued on account of Merger 476,580 -
Equity shares at the end of the year 32,600,132 32,123,552
Rupees in lakhs
As on 31.03.2012 As on 31.03.2011
Sr. Name of the shareholder No. of Shares as a No. of Shares as a
No. Shares held percentage of Shares held percentage of
total number total number
of issued share of issued share
capital capital
1 Vivek Prannath Talwar 6,323,669 19.40 6,323,669 19.40
2 Aurella Estates And Investments Private Ltd 3,577,743 10.97 3,577,743 10.97
3 Reliance Capital Trustee Co Ltd-Reliance Longterm
Equity Fund 2,159,203 6.62 2,159,203 6.62
4 Cim Asset Management Ltd A/C
Tusk Investments Fund 2 1,937,747 5.94
5 Prasam Trading And Finance Pvt Ltd 1,740,042 5.34 2,140,042 6.56
6 Promethean Investments Llp A/C
Tusk Investments Fund 2 1,937,747 5.94
Total 15,738,404 16,138,404
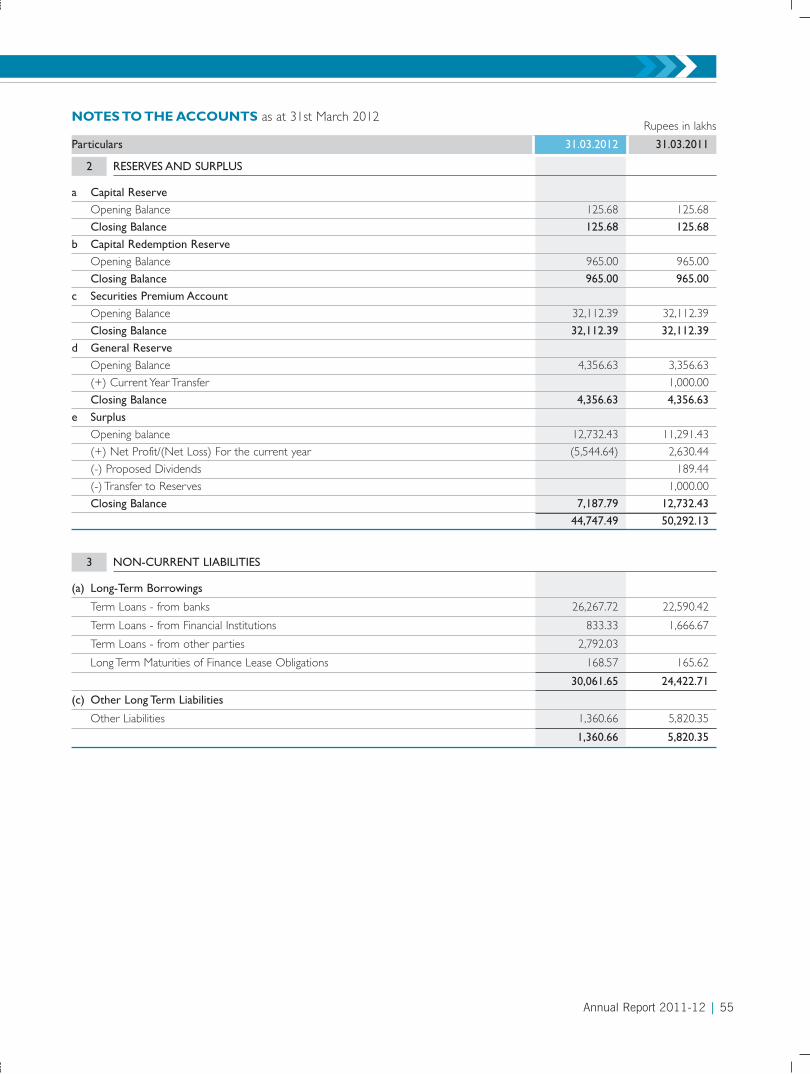
Annual Report 2011-12 | 55
NOTES TO THE ACCOUNTS as at 31st March 2012Rupees in lakhs
Particulars 31.03.2012 31.03.2011
a Capital Reserve
Opening Balance 125.68 125.68
Closing Balance 125.68 125.68
b Capital Redemption Reserve
Opening Balance 965.00 965.00
Closing Balance 965.00 965.00
c Securities Premium Account
Opening Balance 32,112.39 32,112.39
Closing Balance 32,112.39 32,112.39
d General Reserve
Opening Balance 4,356.63 3,356.63
(+) Current Year Transfer 1,000.00
Closing Balance 4,356.63 4,356.63
e Surplus
Opening balance 12,732.43 11,291.43
(+) Net Profit/(Net Loss) For the current year (5,544.64) 2,630.44
(-) Proposed Dividends 189.44
(-) Transfer to Reserves 1,000.00
Closing Balance 7,187.79 12,732.43
44,747.49 50,292.13
2 RESERVES AND SURPLUS
(a) Long-Term Borrowings
Term Loans - from banks 26,267.72 22,590.42
Term Loans - from Financial Institutions 833.33 1,666.67
Term Loans - from other parties 2,792.03
Long Term Maturities of Finance Lease Obligations 168.57 165.62
30,061.65 24,422.71
(c) Other Long Term Liabilities
Other Liabilities 1,360.66 5,820.35
1,360.66 5,820.35
3 NON-CURRENT LIABILITIES
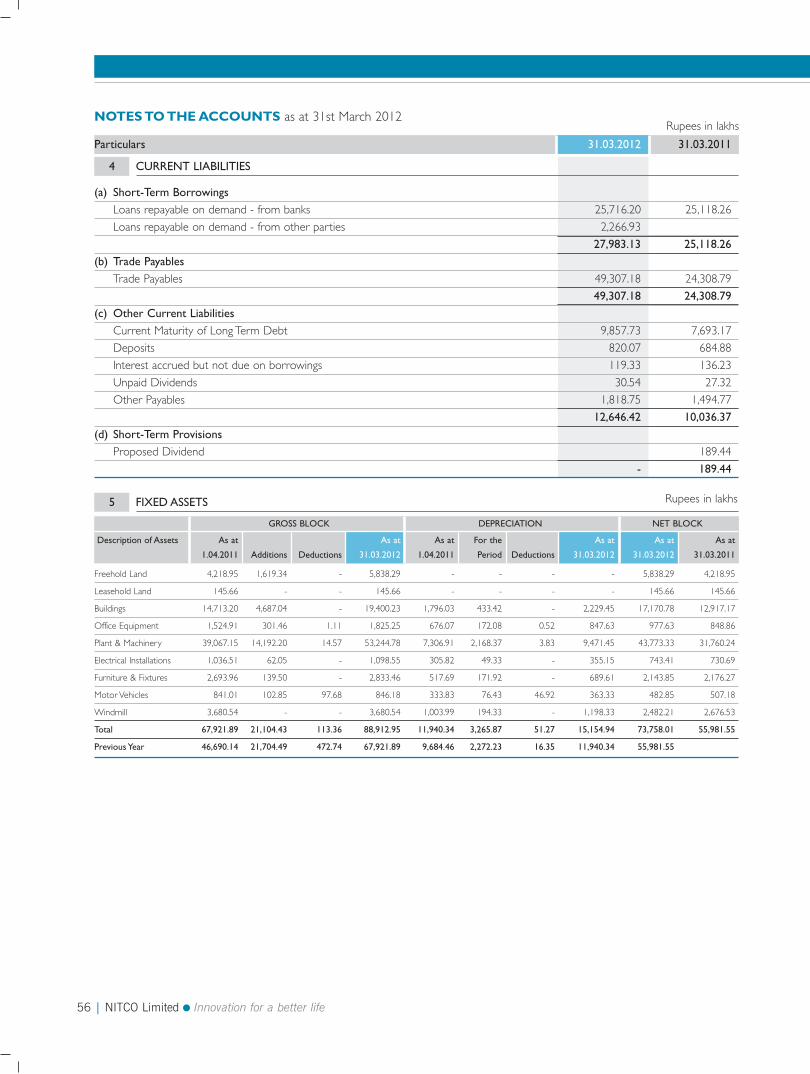
56 | NITCO Limited Innovation for a better life
5 FIXED ASSETS Rupees in lakhs
GROSS BLOCK DEPRECIATION NET BLOCK
Description of Assets As at As at As at For the As at As at As at
1.04.2011 Additions Deductions 31.03.2012 1.04.2011 Period Deductions 31.03.2012 31.03.2012 31.03.2011
Freehold Land 4,218.95 1,619.34 - 5,838.29 - - - - 5,838.29 4,218.95
Leasehold Land 145.66 - - 145.66 - - - - 145.66 145.66
Buildings 14,713.20 4,687.04 - 19,400.23 1,796.03 433.42 - 2,229.45 17,170.78 12,917.17
Office Equipment 1,524.91 301.46 1.11 1,825.25 676.07 172.08 0.52 847.63 977.63 848.86
Plant & Machinery 39,067.15 14,192.20 14.57 53,244.78 7,306.91 2,168.37 3.83 9,471.45 43,773.33 31,760.24
Electrical Installations 1,036.51 62.05 - 1,098.55 305.82 49.33 - 355.15 743.41 730.69
Furniture & Fixtures 2,693.96 139.50 - 2,833.46 517.69 171.92 - 689.61 2,143.85 2,176.27
Motor Vehicles 841.01 102.85 97.68 846.18 333.83 76.43 46.92 363.33 482.85 507.18
Windmill 3,680.54 - - 3,680.54 1,003.99 194.33 - 1,198.33 2,482.21 2,676.53
Total 67,921.89 21,104.43 113.36 88,912.95 11,940.34 3,265.87 51.27 15,154.94 73,758.01 55,981.55
Previous Year 46,690.14 21,704.49 472.74 67,921.89 9,684.46 2,272.23 16.35 11,940.34 55,981.55
NOTES TO THE ACCOUNTS as at 31st March 2012Rupees in lakhs
Particulars 31.03.2012 31.03.2011
(a) Short-Term Borrowings
Loans repayable on demand - from banks 25,716.20 25,118.26
Loans repayable on demand - from other parties 2,266.93
27,983.13 25,118.26
(b) Trade Payables
Trade Payables 49,307.18 24,308.79
49,307.18 24,308.79
(c) Other Current Liabilities
Current Maturity of Long Term Debt 9,857.73 7,693.17
Deposits 820.07 684.88
Interest accrued but not due on borrowings 119.33 136.23
Unpaid Dividends 30.54 27.32
Other Payables 1,818.75 1,494.77
12,646.42 10,036.37
(d) Short-Term Provisions
Proposed Dividend 189.44
- 189.44
4 CURRENT LIABILITIES
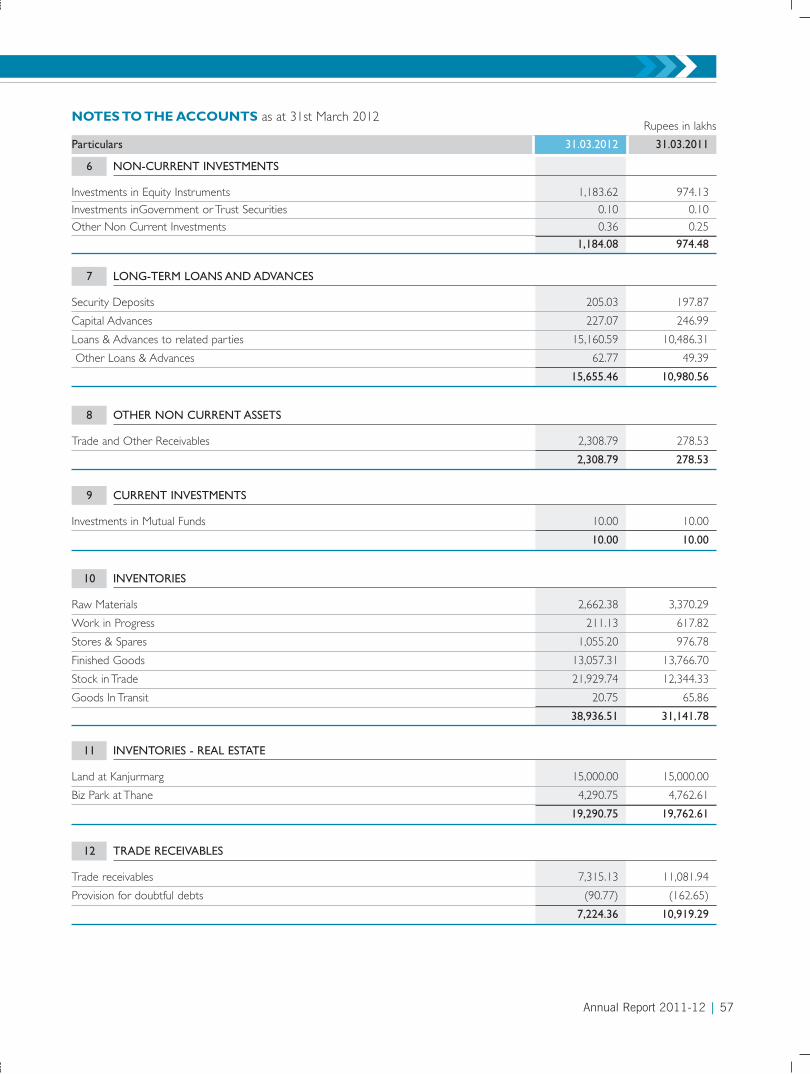
Annual Report 2011-12 | 57
Raw Materials 2,662.38 3,370.29
Work in Progress 211.13 617.82
Stores & Spares 1,055.20 976.78
Finished Goods 13,057.31 13,766.70
Stock in Trade 21,929.74 12,344.33
Goods In Transit 20.75 65.86
38,936.51 31,141.78
10 INVENTORIES
Land at Kanjurmarg 15,000.00 15,000.00
Biz Park at Thane 4,290.75 4,762.61
19,290.75 19,762.61
11 INVENTORIES - REAL ESTATE
Trade receivables 7,315.13 11,081.94
Provision for doubtful debts (90.77) (162.65)
7,224.36 10,919.29
12 TRADE RECEIVABLES
Security Deposits 205.03 197.87
Capital Advances 227.07 246.99
Loans & Advances to related parties 15,160.59 10,486.31
Other Loans & Advances 62.77 49.39
15,655.46 10,980.56
7 LONG-TERM LOANS AND ADVANCES
Trade and Other Receivables 2,308.79 278.53
2,308.79 278.53
8 OTHER NON CURRENT ASSETS
Investments in Mutual Funds 10.00 10.00
10.00 10.00
9 CURRENT INVESTMENTS
NOTES TO THE ACCOUNTS as at 31st March 2012Rupees in lakhs
Particulars 31.03.2012 31.03.2011
Investments in Equity Instruments 1,183.62 974.13
Investments inGovernment or Trust Securities 0.10 0.10
Other Non Current Investments 0.36 0.25
1,184.08 974.48
6 NON-CURRENT INVESTMENTS
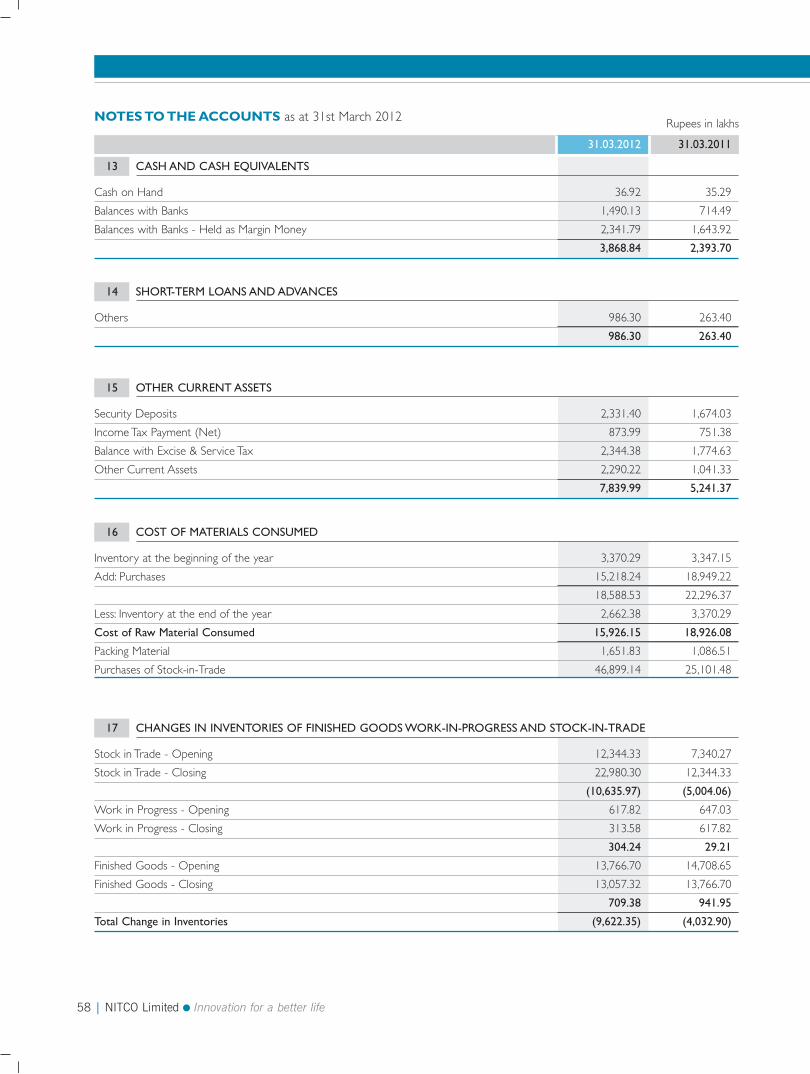
58 | NITCO Limited Innovation for a better life
NOTES TO THE ACCOUNTS as at 31st March 2012 Rupees in lakhs
31.03.2012 31.03.2011
Cash on Hand 36.92 35.29
Balances with Banks 1,490.13 714.49
Balances with Banks - Held as Margin Money 2,341.79 1,643.92
3,868.84 2,393.70
13 CASH AND CASH EQUIVALENTS
Security Deposits 2,331.40 1,674.03
Income Tax Payment (Net) 873.99 751.38
Balance with Excise & Service Tax 2,344.38 1,774.63
Other Current Assets 2,290.22 1,041.33
7,839.99 5,241.37
15 OTHER CURRENT ASSETS
Inventory at the beginning of the year 3,370.29 3,347.15
Add: Purchases 15,218.24 18,949.22
18,588.53 22,296.37
Less: Inventory at the end of the year 2,662.38 3,370.29
Cost of Raw Material Consumed 15,926.15 18,926.08
Packing Material 1,651.83 1,086.51
Purchases of Stock-in-Trade 46,899.14 25,101.48
16 COST OF MATERIALS CONSUMED
Stock in Trade - Opening 12,344.33 7,340.27
Stock in Trade - Closing 22,980.30 12,344.33
(10,635.97) (5,004.06)
Work in Progress - Opening 617.82 647.03
Work in Progress - Closing 313.58 617.82
304.24 29.21
Finished Goods - Opening 13,766.70 14,708.65
Finished Goods - Closing 13,057.32 13,766.70
709.38 941.95
Total Change in Inventories (9,622.35) (4,032.90)
17 CHANGES IN INVENTORIES OF FINISHED GOODS WORK-IN-PROGRESS AND STOCK-IN-TRADE
Others 986.30 263.40
986.30 263.40
14 SHORT-TERM LOANS AND ADVANCES
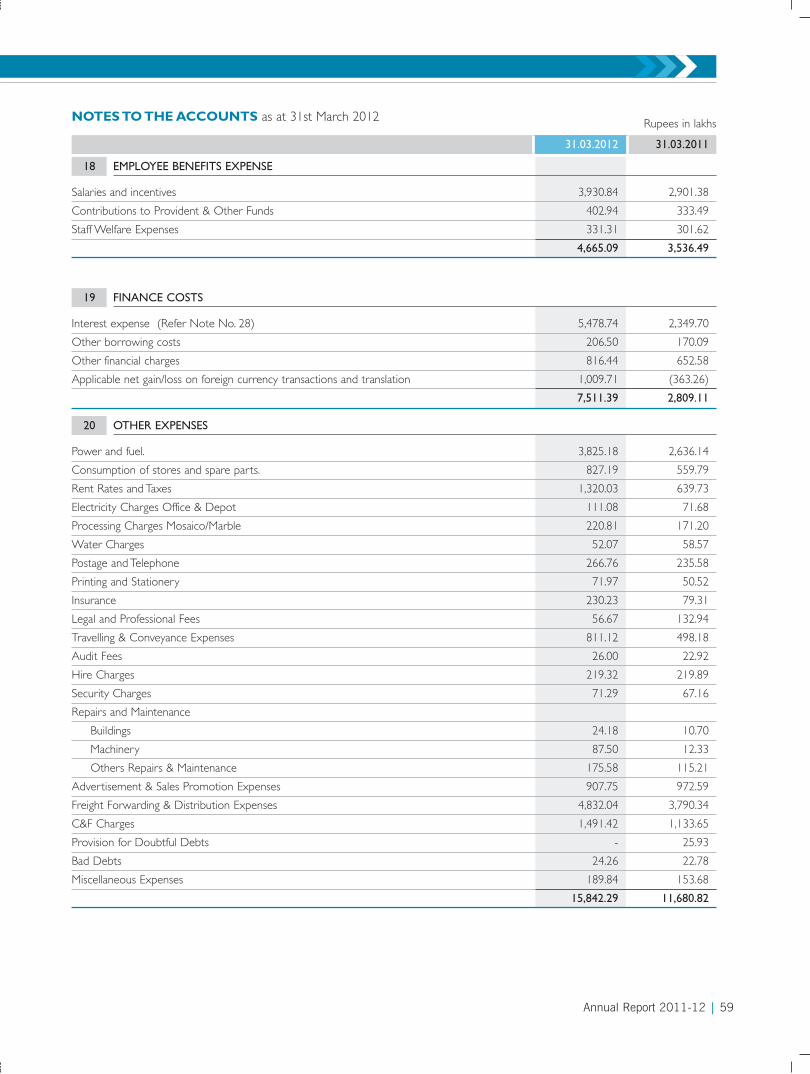
Annual Report 2011-12 | 59
NOTES TO THE ACCOUNTS as at 31st March 2012 Rupees in lakhs
31.03.2012 31.03.2011
Salaries and incentives 3,930.84 2,901.38
Contributions to Provident & Other Funds 402.94 333.49
Staff Welfare Expenses 331.31 301.62
4,665.09 3,536.49
18 EMPLOYEE BENEFITS EXPENSE
Interest expense (Refer Note No. 28) 5,478.74 2,349.70
Other borrowing costs 206.50 170.09
Other financial charges 816.44 652.58
Applicable net gain/loss on foreign currency transactions and translation 1,009.71 (363.26)
7,511.39 2,809.11
19 FINANCE COSTS
Power and fuel. 3,825.18 2,636.14
Consumption of stores and spare parts. 827.19 559.79
Rent Rates and Taxes 1,320.03 639.73
Electricity Charges Office & Depot 111.08 71.68
Processing Charges Mosaico/Marble 220.81 171.20
Water Charges 52.07 58.57
Postage and Telephone 266.76 235.58
Printing and Stationery 71.97 50.52
Insurance 230.23 79.31
Legal and Professional Fees 56.67 132.94
Travelling & Conveyance Expenses 811.12 498.18
Audit Fees 26.00 22.92
Hire Charges 219.32 219.89
Security Charges 71.29 67.16
Repairs and Maintenance
Buildings 24.18 10.70
Machinery 87.50 12.33
Others Repairs & Maintenance 175.58 115.21
Advertisement & Sales Promotion Expenses 907.75 972.59
Freight Forwarding & Distribution Expenses 4,832.04 3,790.34
C&F Charges 1,491.42 1,133.65
Provision for Doubtful Debts - 25.93
Bad Debts 24.26 22.78
Miscellaneous Expenses 189.84 153.68
15,842.29 11,680.82
20 OTHER EXPENSES
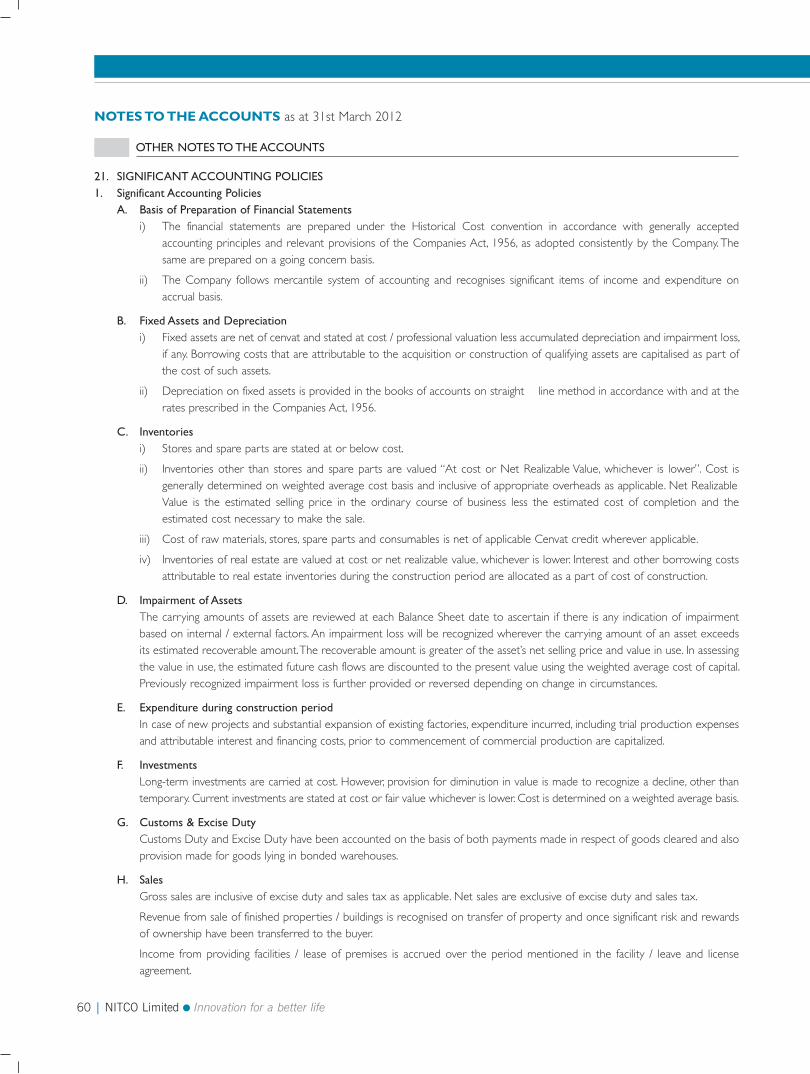
60 | NITCO Limited Innovation for a better life
NOTES TO THE ACCOUNTS as at 31st March 2012
21. SIGNIFICANT ACCOUNTING POLICIES
1. Significant Accounting PoliciesA. Basis of Preparation of Financial Statements
i) The financial statements are prepared under the Historical Cost convention in accordance with generally acceptedaccounting principles and relevant provisions of the Companies Act, 1956, as adopted consistently by the Company. Thesame are prepared on a going concern basis.
ii) The Company follows mercantile system of accounting and recognises significant items of income and expenditure onaccrual basis.
B. Fixed Assets and Depreciation
i) Fixed assets are net of cenvat and stated at cost / professional valuation less accumulated depreciation and impairment loss,if any. Borrowing costs that are attributable to the acquisition or construction of qualifying assets are capitalised as part ofthe cost of such assets.
ii) Depreciation on fixed assets is provided in the books of accounts on straight line method in accordance with and at therates prescribed in the Companies Act, 1956.
C. Inventories
i) Stores and spare parts are stated at or below cost.
ii) Inventories other than stores and spare parts are valued “At cost or Net Realizable Value, whichever is lower”. Cost isgenerally determined on weighted average cost basis and inclusive of appropriate overheads as applicable. Net RealizableValue is the estimated selling price in the ordinary course of business less the estimated cost of completion and theestimated cost necessary to make the sale.
iii) Cost of raw materials, stores, spare parts and consumables is net of applicable Cenvat credit wherever applicable.
iv) Inventories of real estate are valued at cost or net realizable value, whichever is lower. Interest and other borrowing costsattributable to real estate inventories during the construction period are allocated as a part of cost of construction.
D. Impairment of Assets
The carrying amounts of assets are reviewed at each Balance Sheet date to ascertain if there is any indication of impairmentbased on internal / external factors. An impairment loss will be recognized wherever the carrying amount of an asset exceedsits estimated recoverable amount. The recoverable amount is greater of the asset’s net selling price and value in use. In assessingthe value in use, the estimated future cash flows are discounted to the present value using the weighted average cost of capital.Previously recognized impairment loss is further provided or reversed depending on change in circumstances.
E. Expenditure during construction period
In case of new projects and substantial expansion of existing factories, expenditure incurred, including trial production expensesand attributable interest and financing costs, prior to commencement of commercial production are capitalized.
F. Investments
Long-term investments are carried at cost. However, provision for diminution in value is made to recognize a decline, other thantemporary. Current investments are stated at cost or fair value whichever is lower. Cost is determined on a weighted average basis.
G. Customs & Excise Duty
Customs Duty and Excise Duty have been accounted on the basis of both payments made in respect of goods cleared and alsoprovision made for goods lying in bonded warehouses.
H. Sales
Gross sales are inclusive of excise duty and sales tax as applicable. Net sales are exclusive of excise duty and sales tax.
Revenue from sale of finished properties / buildings is recognised on transfer of property and once significant risk and rewardsof ownership have been transferred to the buyer.
Income from providing facilities / lease of premises is accrued over the period mentioned in the facility / leave and licenseagreement.
OTHER NOTES TO THE ACCOUNTS
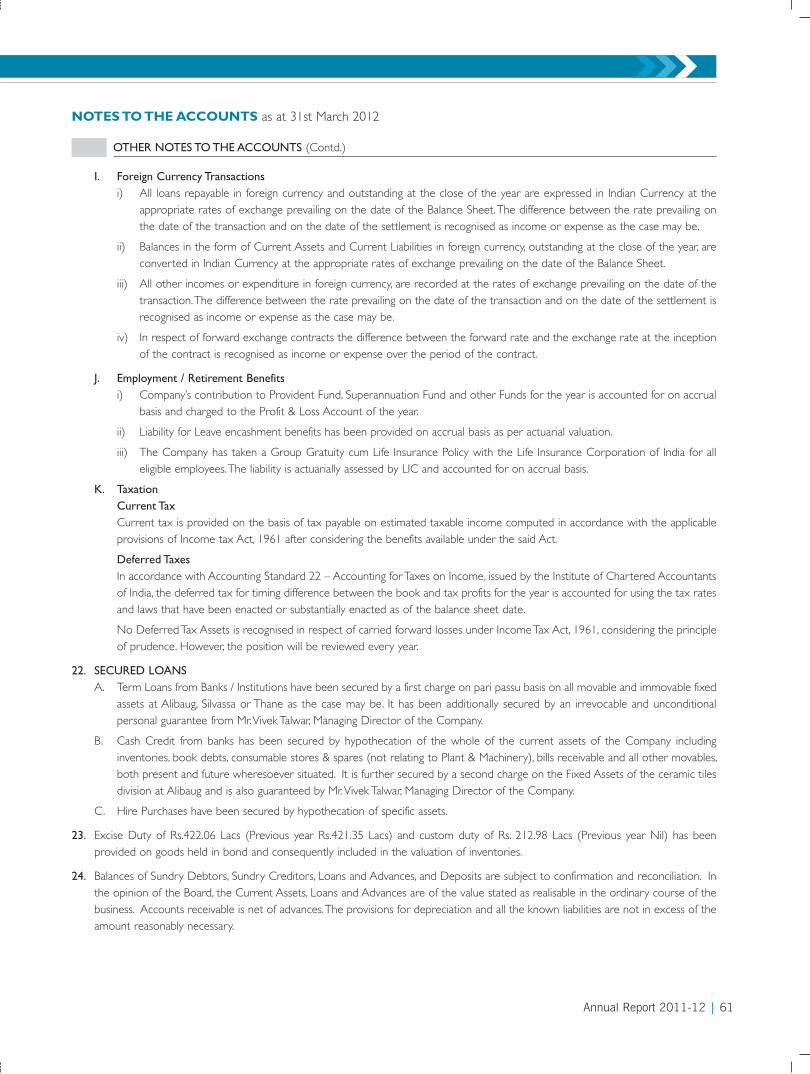
Annual Report 2011-12 | 61
NOTES TO THE ACCOUNTS as at 31st March 2012
I. Foreign Currency Transactions
i) All loans repayable in foreign currency and outstanding at the close of the year are expressed in Indian Currency at theappropriate rates of exchange prevailing on the date of the Balance Sheet. The difference between the rate prevailing onthe date of the transaction and on the date of the settlement is recognised as income or expense as the case may be.
ii) Balances in the form of Current Assets and Current Liabilities in foreign currency, outstanding at the close of the year, areconverted in Indian Currency at the appropriate rates of exchange prevailing on the date of the Balance Sheet.
iii) All other incomes or expenditure in foreign currency, are recorded at the rates of exchange prevailing on the date of thetransaction. The difference between the rate prevailing on the date of the transaction and on the date of the settlement isrecognised as income or expense as the case may be.
iv) In respect of forward exchange contracts the difference between the forward rate and the exchange rate at the inceptionof the contract is recognised as income or expense over the period of the contract.
J. Employment / Retirement Benefits
i) Company’s contribution to Provident Fund, Superannuation Fund and other Funds for the year is accounted for on accrualbasis and charged to the Profit & Loss Account of the year.
ii) Liability for Leave encashment benefits has been provided on accrual basis as per actuarial valuation.
iii) The Company has taken a Group Gratuity cum Life Insurance Policy with the Life Insurance Corporation of India for alleligible employees. The liability is actuarially assessed by LIC and accounted for on accrual basis.
K. Taxation
Current Tax
Current tax is provided on the basis of tax payable on estimated taxable income computed in accordance with the applicableprovisions of Income tax Act, 1961 after considering the benefits available under the said Act.
Deferred Taxes
In accordance with Accounting Standard 22 – Accounting for Taxes on Income, issued by the Institute of Chartered Accountantsof India, the deferred tax for timing difference between the book and tax profits for the year is accounted for using the tax ratesand laws that have been enacted or substantially enacted as of the balance sheet date.
No Deferred Tax Assets is recognised in respect of carried forward losses under Income Tax Act, 1961, considering the principleof prudence. However, the position will be reviewed every year.
22. SECURED LOANS
A. Term Loans from Banks / Institutions have been secured by a first charge on pari passu basis on all movable and immovable fixedassets at Alibaug, Silvassa or Thane as the case may be. It has been additionally secured by an irrevocable and unconditionalpersonal guarantee from Mr. Vivek Talwar, Managing Director of the Company.
B. Cash Credit from banks has been secured by hypothecation of the whole of the current assets of the Company includinginventories, book debts, consumable stores & spares (not relating to Plant & Machinery), bills receivable and all other movables,both present and future wheresoever situated. It is further secured by a second charge on the Fixed Assets of the ceramic tilesdivision at Alibaug and is also guaranteed by Mr. Vivek Talwar, Managing Director of the Company.
C. Hire Purchases have been secured by hypothecation of specific assets.
23. Excise Duty of Rs.422.06 Lacs (Previous year Rs.421.35 Lacs) and custom duty of Rs. 212.98 Lacs (Previous year Nil) has beenprovided on goods held in bond and consequently included in the valuation of inventories.
24. Balances of Sundry Debtors, Sundry Creditors, Loans and Advances, and Deposits are subject to confirmation and reconciliation. Inthe opinion of the Board, the Current Assets, Loans and Advances are of the value stated as realisable in the ordinary course of thebusiness. Accounts receivable is net of advances. The provisions for depreciation and all the known liabilities are not in excess of theamount reasonably necessary.
OTHER NOTES TO THE ACCOUNTS (Contd.)
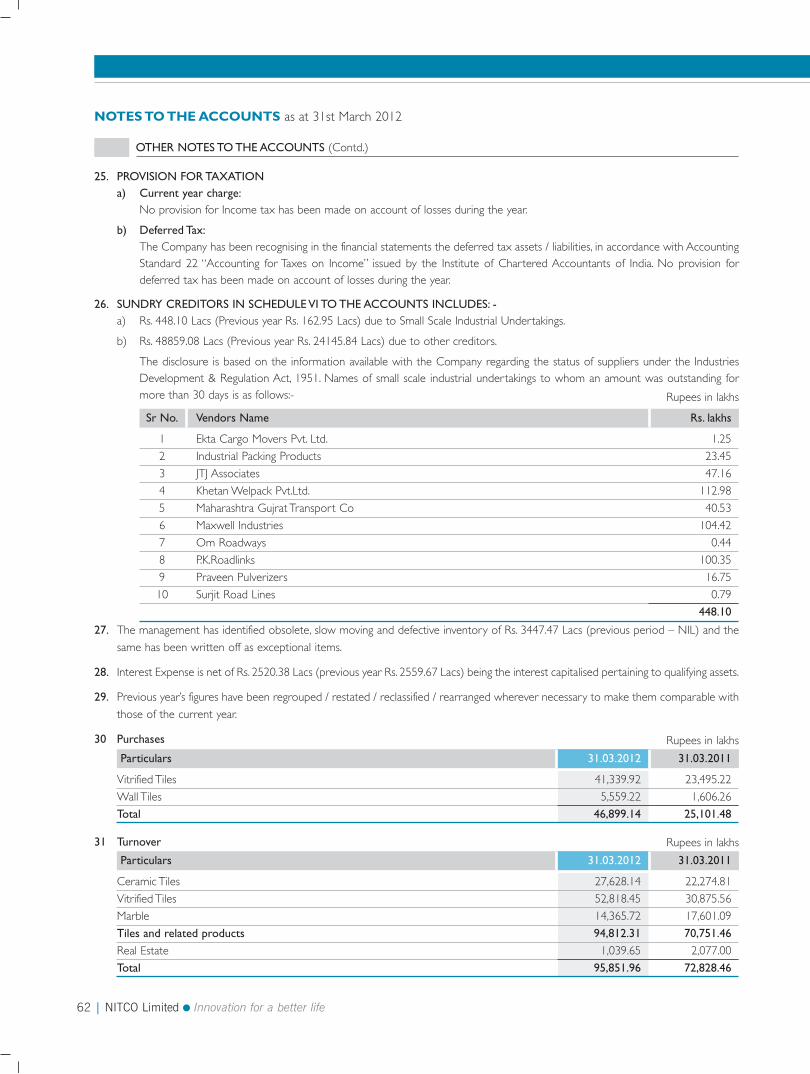
62 | NITCO Limited Innovation for a better life
27. The management has identified obsolete, slow moving and defective inventory of Rs. 3447.47 Lacs (previous period – NIL) and the
same has been written off as exceptional items.
28. Interest Expense is net of Rs. 2520.38 Lacs (previous year Rs. 2559.67 Lacs) being the interest capitalised pertaining to qualifying assets.
29. Previous year’s figures have been regrouped / restated / reclassified / rearranged wherever necessary to make them comparable with
those of the current year.
30 Purchases
Rupees in lakhs
Sr No. Vendors Name Rs. lakhs
1 Ekta Cargo Movers Pvt. Ltd. 1.25
2 Industrial Packing Products 23.45
3 JTJ Associates 47.16
4 Khetan Welpack Pvt.Ltd. 112.98
5 Maharashtra Gujrat Transport Co 40.53
6 Maxwell Industries 104.42
7 Om Roadways 0.44
8 P.K.Roadlinks 100.35
9 Praveen Pulverizers 16.75
10 Surjit Road Lines 0.79
448.10
NOTES TO THE ACCOUNTS as at 31st March 2012
25. PROVISION FOR TAXATION
a) Current year charge:
No provision for Income tax has been made on account of losses during the year.
b) Deferred Tax:
The Company has been recognising in the financial statements the deferred tax assets / liabilities, in accordance with AccountingStandard 22 “Accounting for Taxes on Income” issued by the Institute of Chartered Accountants of India. No provision fordeferred tax has been made on account of losses during the year.
26. SUNDRY CREDITORS IN SCHEDULE VI TO THE ACCOUNTS INCLUDES: -
a) Rs. 448.10 Lacs (Previous year Rs. 162.95 Lacs) due to Small Scale Industrial Undertakings.
b) Rs. 48859.08 Lacs (Previous year Rs. 24145.84 Lacs) due to other creditors.
The disclosure is based on the information available with the Company regarding the status of suppliers under the IndustriesDevelopment & Regulation Act, 1951. Names of small scale industrial undertakings to whom an amount was outstanding formore than 30 days is as follows:-
OTHER NOTES TO THE ACCOUNTS (Contd.)
Rupees in lakhs
Particulars 31.03.2012 31.03.2011
Vitrified Tiles 41,339.92 23,495.22
Wall Tiles 5,559.22 1,606.26
Total 46,899.14 25,101.48
31 Turnover Rupees in lakhs
Particulars 31.03.2012 31.03.2011
Ceramic Tiles 27,628.14 22,274.81
Vitrified Tiles 52,818.45 30,875.56
Marble 14,365.72 17,601.09
Tiles and related products 94,812.31 70,751.46
Real Estate 1,039.65 2,077.00
Total 95,851.96 72,828.46
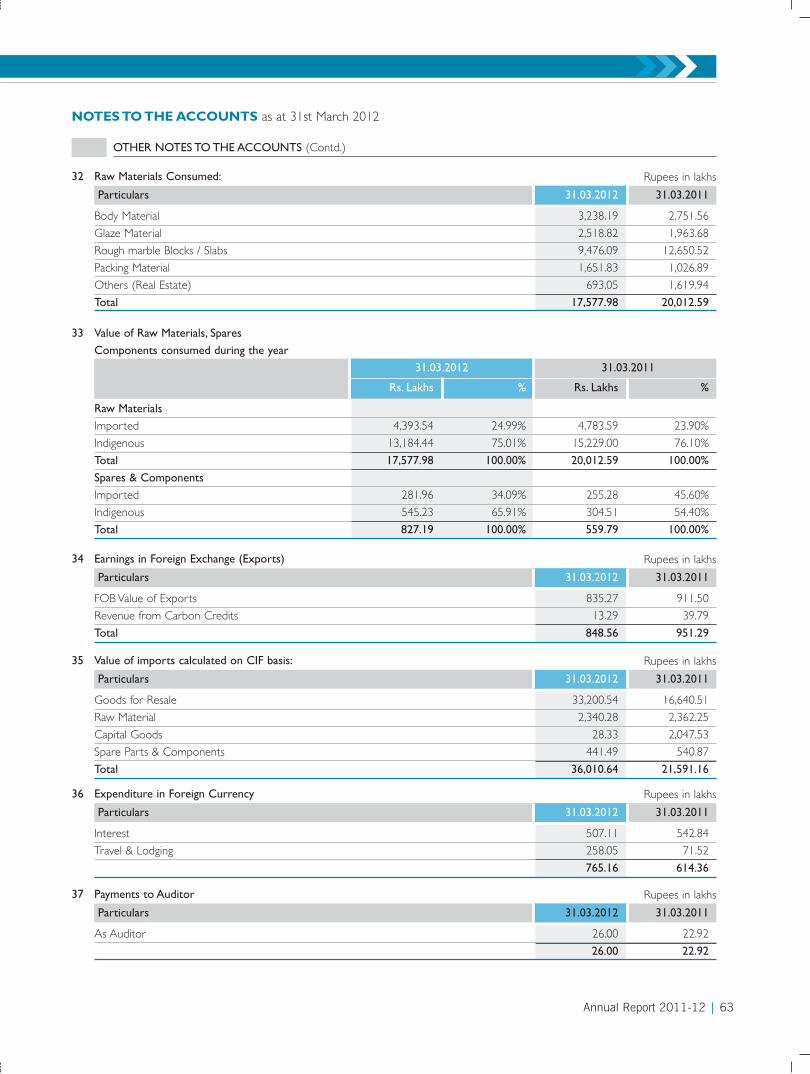
Annual Report 2011-12 | 63
NOTES TO THE ACCOUNTS as at 31st March 2012
OTHER NOTES TO THE ACCOUNTS (Contd.)
32 Raw Materials Consumed:
33 Value of Raw Materials, Spares Components consumed during the year
Rupees in lakhs
Particulars 31.03.2012 31.03.2011
Body Material 3,238.19 2,751.56
Glaze Material 2,518.82 1,963.68
Rough marble Blocks / Slabs 9,476.09 12,650.52
Packing Material 1,651.83 1,026.89
Others (Real Estate) 693.05 1,619.94
Total 17,577.98 20,012.59
35 Value of imports calculated on CIF basis: Rupees in lakhs
Particulars 31.03.2012 31.03.2011
Goods for Resale 33,200.54 16,640.51
Raw Material 2,340.28 2,362.25
Capital Goods 28.33 2,047.53
Spare Parts & Components 441.49 540.87
Total 36,010.64 21,591.16
34 Earnings in Foreign Exchange (Exports) Rupees in lakhs
Particulars 31.03.2012 31.03.2011
FOB Value of Exports 835.27 911.50
Revenue from Carbon Credits 13.29 39.79
Total 848.56 951.29
36 Expenditure in Foreign Currency Rupees in lakhs
Particulars 31.03.2012 31.03.2011
Interest 507.11 542.84
Travel & Lodging 258.05 71.52
765.16 614.36
37 Payments to Auditor Rupees in lakhs
Particulars 31.03.2012 31.03.2011
As Auditor 26.00 22.92
26.00 22.92
Rs. Lakhs % Rs. Lakhs %
Raw Materials
Imported 4,393.54 24.99% 4,783.59 23.90%
Indigenous 13,184.44 75.01% 15,229.00 76.10%
Total 17,577.98 100.00% 20,012.59 100.00%
Spares & Components
Imported 281.96 34.09% 255.28 45.60%
Indigenous 545.23 65.91% 304.51 54.40%
Total 827.19 100.00% 559.79 100.00%
31.03.2012 31.03.2011
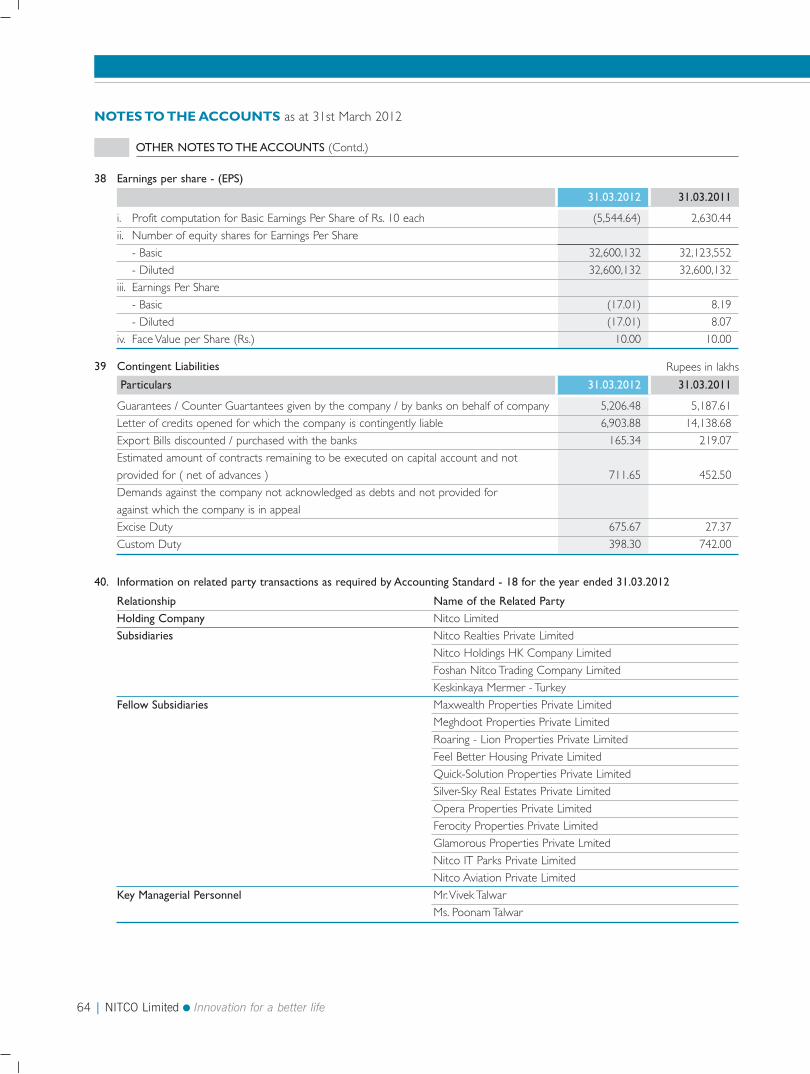
64 | NITCO Limited Innovation for a better life
NOTES TO THE ACCOUNTS as at 31st March 2012
OTHER NOTES TO THE ACCOUNTS (Contd.)
38 Earnings per share - (EPS)
31.03.2012 31.03.2011
i. Profit computation for Basic Earnings Per Share of Rs. 10 each (5,544.64) 2,630.44
ii. Number of equity shares for Earnings Per Share
- Basic 32,600,132 32,123,552
- Diluted 32,600,132 32,600,132
iii. Earnings Per Share
- Basic (17.01) 8.19
- Diluted (17.01) 8.07
iv. Face Value per Share (Rs.) 10.00 10.00
39 Contingent Liabilities Rupees in lakhs
Particulars 31.03.2012 31.03.2011
Guarantees / Counter Guartantees given by the company / by banks on behalf of company 5,206.48 5,187.61
Letter of credits opened for which the company is contingently liable 6,903.88 14,138.68
Export Bills discounted / purchased with the banks 165.34 219.07
Estimated amount of contracts remaining to be executed on capital account and not
provided for ( net of advances ) 711.65 452.50
Demands against the company not acknowledged as debts and not provided for
against which the company is in appeal
Excise Duty 675.67 27.37
Custom Duty 398.30 742.00
40. Information on related party transactions as required by Accounting Standard - 18 for the year ended 31.03.2012
Relationship Name of the Related PartyHolding Company Nitco Limited
Subsidiaries Nitco Realties Private Limited
Nitco Holdings HK Company Limited
Foshan Nitco Trading Company Limited
Keskinkaya Mermer - Turkey
Fellow Subsidiaries Maxwealth Properties Private Limited
Meghdoot Properties Private Limited
Roaring - Lion Properties Private Limited
Feel Better Housing Private Limited
Quick-Solution Properties Private Limited
Silver-Sky Real Estates Private Limited
Opera Properties Private Limited
Ferocity Properties Private Limited
Glamorous Properties Private Lmited
Nitco IT Parks Private Limited
Nitco Aviation Private Limited
Key Managerial Personnel Mr. Vivek Talwar
Ms. Poonam Talwar
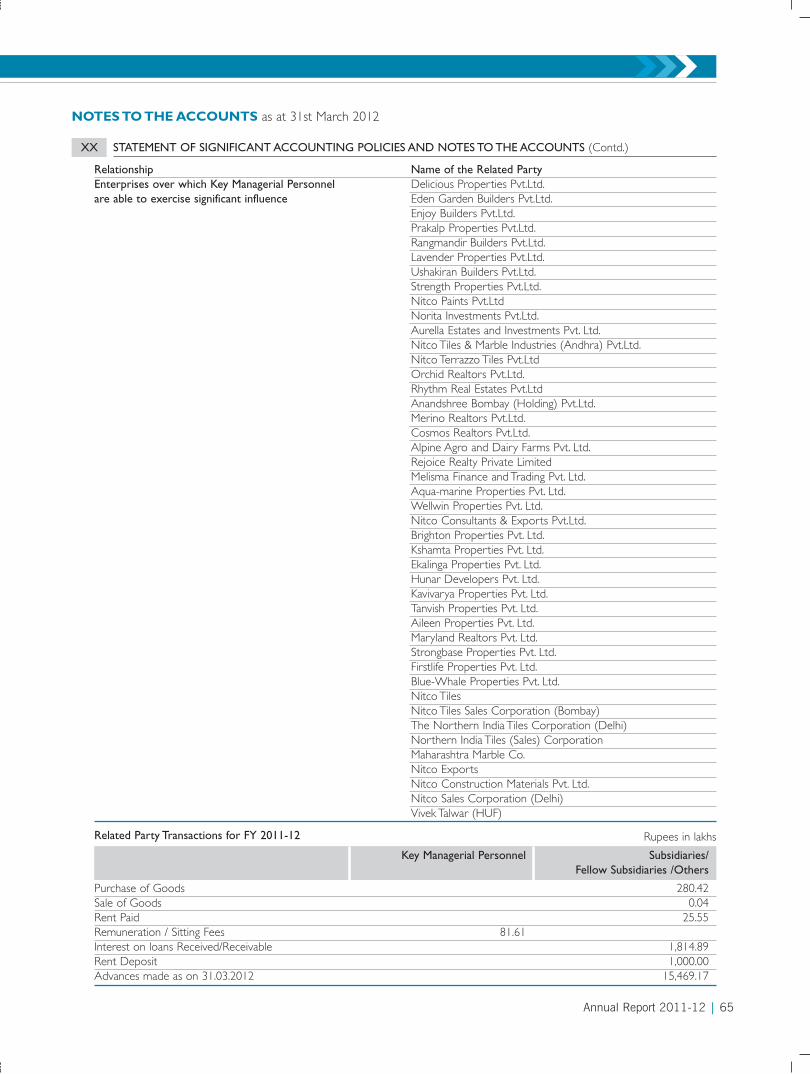
NOTES TO THE ACCOUNTS as at 31st March 2012
XX STATEMENT OF SIGNIFICANT ACCOUNTING POLICIES AND NOTES TO THE ACCOUNTS (Contd.)
Relationship Name of the Related PartyEnterprises over which Key Managerial Personnel Delicious Properties Pvt.Ltd.are able to exercise significant influence Eden Garden Builders Pvt.Ltd.
Enjoy Builders Pvt.Ltd.Prakalp Properties Pvt.Ltd.Rangmandir Builders Pvt.Ltd.Lavender Properties Pvt.Ltd.Ushakiran Builders Pvt.Ltd.Strength Properties Pvt.Ltd.Nitco Paints Pvt.LtdNorita Investments Pvt.Ltd.Aurella Estates and Investments Pvt. Ltd.Nitco Tiles & Marble Industries (Andhra) Pvt.Ltd.Nitco Terrazzo Tiles Pvt.LtdOrchid Realtors Pvt.Ltd.Rhythm Real Estates Pvt.LtdAnandshree Bombay (Holding) Pvt.Ltd.Merino Realtors Pvt.Ltd.Cosmos Realtors Pvt.Ltd.Alpine Agro and Dairy Farms Pvt. Ltd.Rejoice Realty Private LimitedMelisma Finance and Trading Pvt. Ltd.Aqua-marine Properties Pvt. Ltd.Wellwin Properties Pvt. Ltd.Nitco Consultants & Exports Pvt.Ltd.Brighton Properties Pvt. Ltd.Kshamta Properties Pvt. Ltd.Ekalinga Properties Pvt. Ltd.Hunar Developers Pvt. Ltd.Kavivarya Properties Pvt. Ltd.Tanvish Properties Pvt. Ltd.Aileen Properties Pvt. Ltd.Maryland Realtors Pvt. Ltd.Strongbase Properties Pvt. Ltd.Firstlife Properties Pvt. Ltd.Blue-Whale Properties Pvt. Ltd.Nitco TilesNitco Tiles Sales Corporation (Bombay)The Northern India Tiles Corporation (Delhi)Northern India Tiles (Sales) CorporationMaharashtra Marble Co.Nitco ExportsNitco Construction Materials Pvt. Ltd. Nitco Sales Corporation (Delhi)Vivek Talwar (HUF)
Annual Report 2011-12 | 65
Key Managerial Personnel Subsidiaries/Fellow Subsidiaries /Others
Purchase of Goods 280.42 Sale of Goods 0.04 Rent Paid 25.55 Remuneration / Sitting Fees 81.61Interest on loans Received/Receivable 1,814.89 Rent Deposit 1,000.00 Advances made as on 31.03.2012 15,469.17
Related Party Transactions for FY 2011-12 Rupees in lakhs
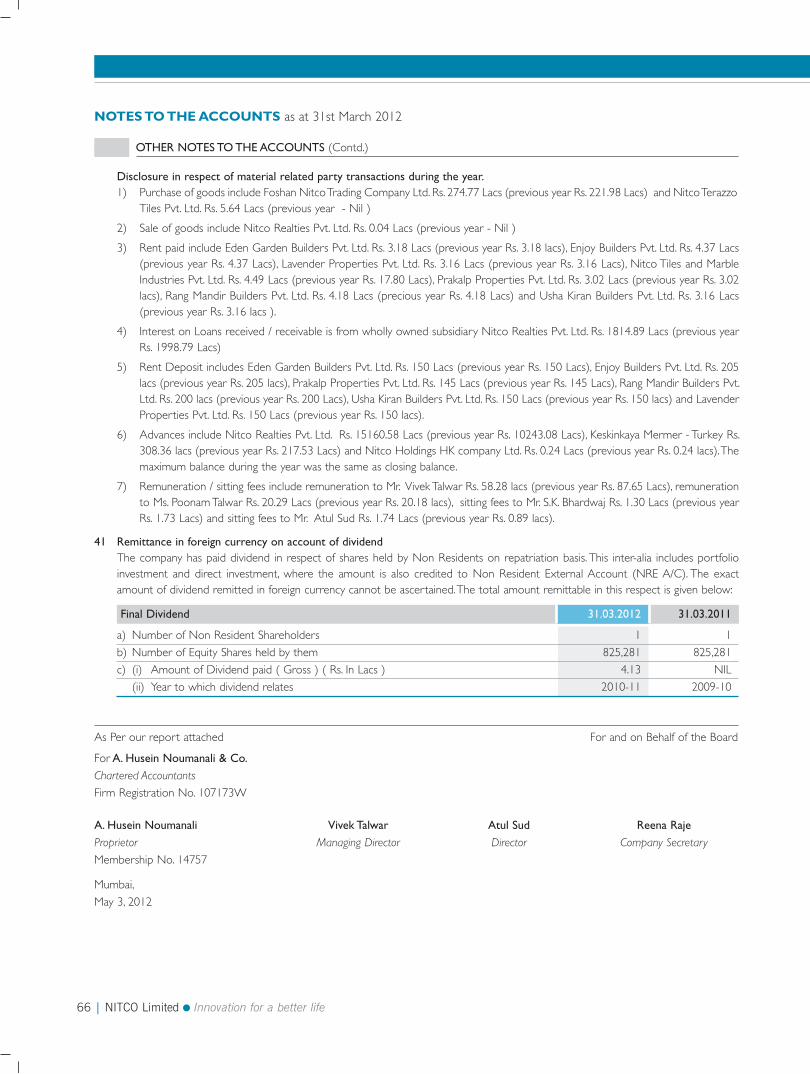
66 | NITCO Limited Innovation for a better life
Disclosure in respect of material related party transactions during the year.
1) Purchase of goods include Foshan Nitco Trading Company Ltd. Rs. 274.77 Lacs (previous year Rs. 221.98 Lacs) and Nitco TerazzoTiles Pvt. Ltd. Rs. 5.64 Lacs (previous year - Nil )
2) Sale of goods include Nitco Realties Pvt. Ltd. Rs. 0.04 Lacs (previous year - Nil )
3) Rent paid include Eden Garden Builders Pvt. Ltd. Rs. 3.18 Lacs (previous year Rs. 3.18 lacs), Enjoy Builders Pvt. Ltd. Rs. 4.37 Lacs(previous year Rs. 4.37 Lacs), Lavender Properties Pvt. Ltd. Rs. 3.16 Lacs (previous year Rs. 3.16 Lacs), Nitco Tiles and MarbleIndustries Pvt. Ltd. Rs. 4.49 Lacs (previous year Rs. 17.80 Lacs), Prakalp Properties Pvt. Ltd. Rs. 3.02 Lacs (previous year Rs. 3.02lacs), Rang Mandir Builders Pvt. Ltd. Rs. 4.18 Lacs (precious year Rs. 4.18 Lacs) and Usha Kiran Builders Pvt. Ltd. Rs. 3.16 Lacs(previous year Rs. 3.16 lacs ).
4) Interest on Loans received / receivable is from wholly owned subsidiary Nitco Realties Pvt. Ltd. Rs. 1814.89 Lacs (previous yearRs. 1998.79 Lacs)
5) Rent Deposit includes Eden Garden Builders Pvt. Ltd. Rs. 150 Lacs (previous year Rs. 150 Lacs), Enjoy Builders Pvt. Ltd. Rs. 205lacs (previous year Rs. 205 lacs), Prakalp Properties Pvt. Ltd. Rs. 145 Lacs (previous year Rs. 145 Lacs), Rang Mandir Builders Pvt.Ltd. Rs. 200 lacs (previous year Rs. 200 Lacs), Usha Kiran Builders Pvt. Ltd. Rs. 150 Lacs (previous year Rs. 150 lacs) and LavenderProperties Pvt. Ltd. Rs. 150 Lacs (previous year Rs. 150 lacs).
6) Advances include Nitco Realties Pvt. Ltd. Rs. 15160.58 Lacs (previous year Rs. 10243.08 Lacs), Keskinkaya Mermer - Turkey Rs.308.36 lacs (previous year Rs. 217.53 Lacs) and Nitco Holdings HK company Ltd. Rs. 0.24 Lacs (previous year Rs. 0.24 lacs). Themaximum balance during the year was the same as closing balance.
7) Remuneration / sitting fees include remuneration to Mr. Vivek Talwar Rs. 58.28 lacs (previous year Rs. 87.65 Lacs), remunerationto Ms. Poonam Talwar Rs. 20.29 Lacs (previous year Rs. 20.18 lacs), sitting fees to Mr. S.K. Bhardwaj Rs. 1.30 Lacs (previous yearRs. 1.73 Lacs) and sitting fees to Mr. Atul Sud Rs. 1.74 Lacs (previous year Rs. 0.89 lacs).
41 Remittance in foreign currency on account of dividend
The company has paid dividend in respect of shares held by Non Residents on repatriation basis. This inter-alia includes portfolioinvestment and direct investment, where the amount is also credited to Non Resident External Account (NRE A/C). The exactamount of dividend remitted in foreign currency cannot be ascertained. The total amount remittable in this respect is given below:
NOTES TO THE ACCOUNTS as at 31st March 2012
OTHER NOTES TO THE ACCOUNTS (Contd.)
As Per our report attached For and on Behalf of the Board
For A. Husein Noumanali & Co.Chartered Accountants
Firm Registration No. 107173W
A. Husein Noumanali Vivek Talwar Atul Sud Reena RajeProprietor Managing Director Director Company Secretary
Membership No. 14757
Mumbai,
May 3, 2012
Final Dividend 31.03.2012 31.03.2011
a) Number of Non Resident Shareholders 1 1
b) Number of Equity Shares held by them 825,281 825,281
c) (i) Amount of Dividend paid ( Gross ) ( Rs. In Lacs ) 4.13 NIL
(ii) Year to which dividend relates 2010-11 2009-10
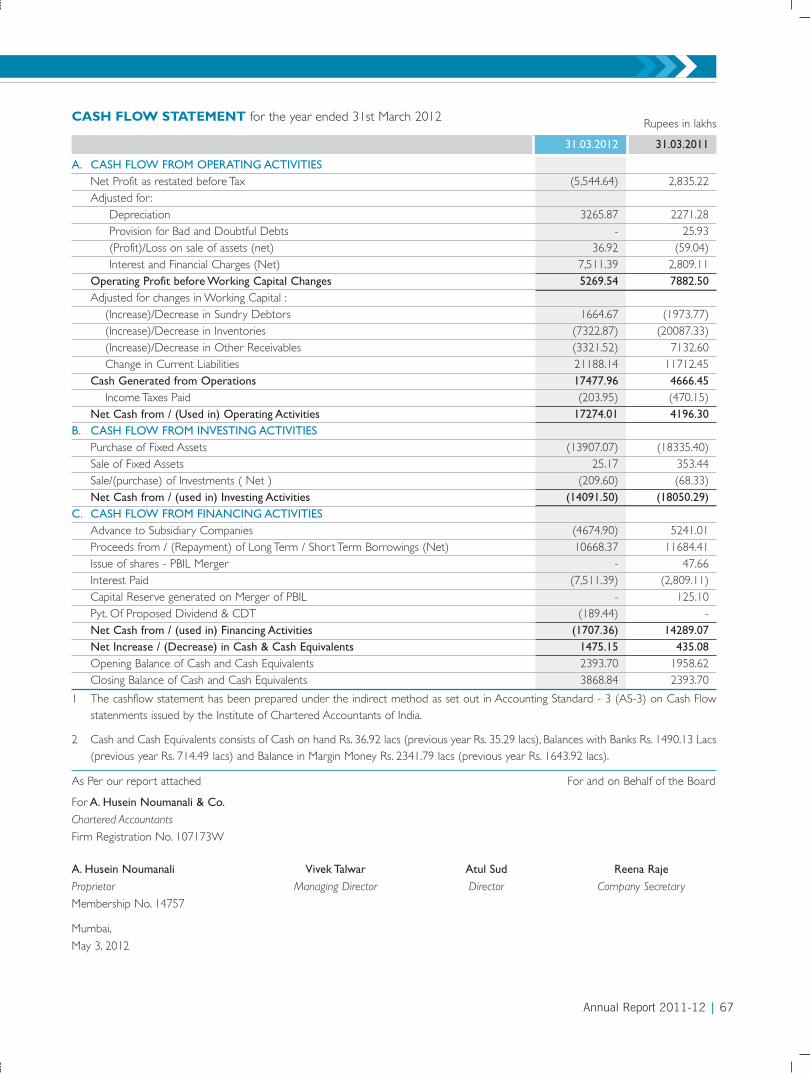
Annual Report 2011-12 | 67
As Per our report attached For and on Behalf of the Board
For A. Husein Noumanali & Co.Chartered Accountants
Firm Registration No. 107173W
A. Husein Noumanali Vivek Talwar Atul Sud Reena RajeProprietor Managing Director Director Company Secretary
Membership No. 14757
Mumbai,
May 3, 2012
CASH FLOW STATEMENT for the year ended 31st March 2012 Rupees in lakhs
31.03.2012 31.03.2011
A. CASH FLOW FROM OPERATING ACTIVITIESNet Profit as restated before Tax (5,544.64) 2,835.22 Adjusted for :
Depreciation 3265.87 2271.28 Provision for Bad and Doubtful Debts - 25.93 (Profit)/Loss on sale of assets (net) 36.92 (59.04)Interest and Financial Charges (Net) 7,511.39 2,809.11
Operating Profit before Working Capital Changes 5269.54 7882.50
Adjusted for changes in Working Capital :(Increase)/Decrease in Sundry Debtors 1664.67 (1973.77)(Increase)/Decrease in Inventories (7322.87) (20087.33)(Increase)/Decrease in Other Receivables (3321.52) 7132.60 Change in Current Liabilities 21188.14 11712.45
Cash Generated from Operations 17477.96 4666.45
Income Taxes Paid (203.95) (470.15)Net Cash from / (Used in) Operating Activities 17274.01 4196.30
B. CASH FLOW FROM INVESTING ACTIVITIESPurchase of Fixed Assets (13907.07) (18335.40)Sale of Fixed Assets 25.17 353.44Sale/(purchase) of Investments ( Net ) (209.60) (68.33)Net Cash from / (used in) Investing Activities (14091.50) (18050.29)
C. CASH FLOW FROM FINANCING ACTIVITIES
Advance to Subsidiary Companies (4674.90) 5241.01 Proceeds from / (Repayment) of Long Term / Short Term Borrowings (Net) 10668.37 11684.41 Issue of shares - PBIL Merger - 47.66 Interest Paid (7,511.39) (2,809.11)Capital Reserve generated on Merger of PBIL - 125.10 Pyt. Of Proposed Dividend & CDT (189.44) - Net Cash from / (used in) Financing Activities (1707.36) 14289.07
Net Increase / (Decrease) in Cash & Cash Equivalents 1475.15 435.08
Opening Balance of Cash and Cash Equivalents 2393.70 1958.62 Closing Balance of Cash and Cash Equivalents 3868.84 2393.70
1 The cashflow statement has been prepared under the indirect method as set out in Accounting Standard - 3 (AS-3) on Cash Flowstatenments issued by the Institute of Chartered Accountants of India.
2 Cash and Cash Equivalents consists of Cash on hand Rs. 36.92 lacs (previous year Rs. 35.29 lacs), Balances with Banks Rs. 1490.13 Lacs(previous year Rs. 714.49 lacs) and Balance in Margin Money Rs. 2341.79 lacs (previous year Rs. 1643.92 lacs).
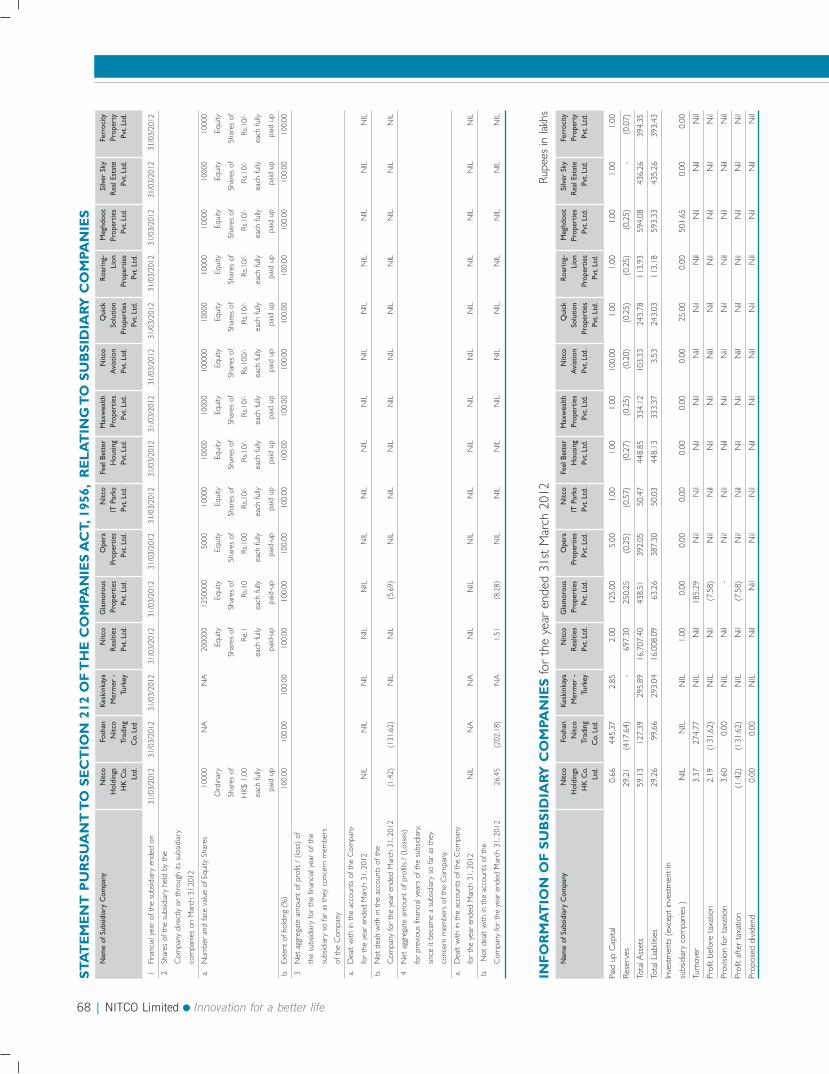
68 | NITCO Limited Innovation for a better life
ST
AT
EM
EN
T P
UR
SU
AN
T T
O S
EC
TIO
N 2
12 O
F T
HE
CO
MPA
NIE
S A
CT,
195
6,
RE
LA
TIN
G T
O S
UB
SID
IARY
CO
MPA
NIE
S
Nam
e of
Sub
sidia
ry C
ompa
ny
Nitc
o Fo
shan
Kesk
inka
yaN
itco
Gla
mor
ous
Ope
ra
Nitc
oFe
el B
ette
rM
axw
ealth
Nitc
oQ
uick
Ro
arin
g-M
eghd
oot
Silv
er S
kyFe
rroc
ityH
oldi
ngs
Nitc
oM
erm
er -
Re
altie
sPr
oper
ties
Prop
ertie
sIT
Par
ksH
ousin
g Pr
oper
ties
Avi
atio
nSo
lutio
nLi
onPr
oper
ties
Real
Est
ate
Prop
erty
HK
Co.
Tr
adin
gTu
rkey
Pvt.
Ltd.
Pv
t. Lt
d.Pv
t. Lt
d.Pv
t. Lt
d.Pv
t. Lt
d.Pv
t. Lt
d.Pv
t. Lt
d.Pr
oper
ties
Prop
ertie
sPv
t. Lt
d.Pv
t. Lt
d.Pv
t. Lt
d.Lt
d.C
o. L
td.
Pvt.
Ltd.
Pvt.
Ltd.
1Fi
nanc
ial y
ear
of t
he s
ubsid
iary
end
ed o
n 31
/03/
2012
31/0
3/20
1231
/03/
2012
31/0
3/20
1231
/03/
2012
31/0
3/20
1231
/03/
2012
31/0
3/20
1231
/03/
2012
31/0
3/20
1231
/03/
2012
31/0
3/20
1231
/03/
2012
31/0
3/20
1231
/03/
2012
2Sh
ares
of t
he s
ubsid
iary
hel
d by
the
Com
pany
dire
ctly
or
thro
ugh
its s
ubsid
iary
a.N
umbe
r an
d fa
ce v
alue
of E
quity
Sha
res
1000
0N
AN
A20
0000
5000
1000
010
000
1000
010
0000
1000
010
000
1000
010
000
1000
0
Ord
inar
yEq
uity
Equi
tyEq
uity
Equi
tyEq
uity
Equi
tyEq
uity
Equi
tyEq
uity
Equi
tyEq
uity
Equi
ty
Shar
es o
fSh
ares
of
Shar
es o
fSh
ares
of
Shar
es o
fSh
ares
of
Shar
es o
fSh
ares
of
Shar
es o
fSh
ares
of
Shar
es o
fSh
ares
of
Shar
es o
f
HK$
1.0
0Re
.1Rs
.10
Rs.1
00Rs
.10/
-Rs
.10/
-Rs
.10/
-Rs
.100
/-Rs
.10/
-Rs
.10/
-Rs
.10/
-Rs
.10/
-Rs
.10/
-
each
fully
each
fully
each
fully
each
fully
each
fully
each
fully
each
fully
each
fully
each
fully
each
fully
each
fully
each
fully
each
fully
paid
up
paid
-up
paid
-up
paid
-up
paid
up
paid
up
paid
up
paid
up
paid
up
paid
up
paid
up
paid
up
paid
up
b.Ex
tent
of h
oldi
ng (
%)
100.
00
100.
00
100.
00
100.
00
100.
00
100.
00
100.
00
100.
00
100.
00
100.
00
100.
00
100.
00
100.
00
100.
00
100.
00
3N
et a
ggre
gate
am
ount
of p
rofit
/ (
loss
) of
the
subs
idia
ry fo
r th
e fin
anci
al y
ear
of t
he
subs
idia
ry s
o fa
r as
the
y co
ncer
n m
embe
rs
of t
he C
ompa
ny
a.D
ealt
with
in t
he a
ccou
nts
of t
he C
ompa
ny
for
the
year
end
ed M
arch
31,
201
2N
ILN
ILN
ILN
ILN
ILN
ILN
ILN
ILN
ILN
ILN
ILN
ILN
ILN
ILN
IL
b.N
ot d
ealt
with
in t
he a
ccou
nts
of t
he
Com
pany
for
the
year
end
ed M
arch
31,
201
2(1
.42)
(131
.62)
NIL
NIL
(5.6
9)N
ILN
ILN
ILN
ILN
ILN
ILN
ILN
ILN
ILN
IL
4N
et a
ggre
gate
am
ount
of p
rofit
s /
(Los
ses)
for
prev
ious
fina
ncia
l yea
rs o
f the
sub
sidia
ry,
since
it b
ecam
e a
subs
idia
ry s
o fa
r as
the
y
conc
ern
mem
bers
of t
he C
ompa
ny.
a.D
ealt
with
in t
he a
ccou
nts
of t
he C
ompa
ny
for
the
year
end
ed M
arch
31,
201
2N
ILN
AN
AN
ILN
ILN
ILN
ILN
ILN
ILN
ILN
ILN
ILN
ILN
ILN
IL
b.N
ot d
ealt
with
in t
he a
ccou
nts
of t
he
Com
pany
for
the
year
end
ed M
arch
31,
201
226
.45
(202
.18)
NA
1.51
(8
.28)
NIL
NIL
NIL
NIL
NIL
NIL
NIL
NIL
NIL
NIL
INF
OR
MA
TIO
N O
F S
UB
SID
IARY
CO
MPA
NIE
S fo
r th
e ye
ar e
nded
31s
t M
arch
201
2N
ame
of S
ubsid
iary
Com
pany
N
itco
Fosh
anKe
skin
kaya
Nitc
oG
lam
orou
sO
pera
N
itco
Feel
Bet
ter
Max
wea
lthN
itco
Qui
ck
Roar
ing-
Meg
hdoo
tSi
lver
Sky
Ferr
ocity
Hol
ding
sN
itco
Mer
mer
-
Real
ties
Prop
ertie
sPr
oper
ties
IT P
arks
Hou
sing
Prop
ertie
sA
viat
ion
Solu
tion
Lion
Prop
ertie
sRe
al E
stat
ePr
oper
tyH
K C
o.
Trad
ing
Turk
eyPv
t. Lt
d.
Pvt.
Ltd.
Pvt.
Ltd.
Pvt.
Ltd.
Pvt.
Ltd.
Pvt.
Ltd.
Pvt.
Ltd.
Prop
ertie
sPr
oper
ties
Pvt.
Ltd.
Pvt.
Ltd.
Pvt.
Ltd.
Ltd.
Co.
Ltd
.Pv
t. Lt
d.Pv
t. Lt
d.
Paid
up
Cap
ital
0.66
44
5.37
2.
85
2.00
12
5.00
5.
00
1.00
1.
00
1.00
10
0.00
1.
00
1.00
1.
00
1.00
1.
00
Rese
rves
29
.21
(417
.64)
-
697.
30
250.
25
(0.2
5)(0
.57)
(0.2
7)(0
.25)
(0.2
0)(0
.25)
(0.2
5)(0
.25)
-
(0.0
7)
Tota
l Ass
ets
59.1
3 12
7.39
29
5.89
16
,707
.40
438.
51
392.
05
50.4
7 44
8.85
33
4.12
10
3.33
24
3.78
11
3.93
59
4.08
43
6.26
39
4.35
Tota
l Lia
bilit
ies
29.2
6 99
.66
293.
04
16,0
08.0
9 63
.26
387.
30
50.0
3 44
8.13
33
3.37
3.
53
243.
03
113.
18
593.
33
435.
26
393.
43
Inve
stm
ents
(ex
cept
inve
stm
ent
in
subs
idia
ry c
ompa
nies
)N
ILN
ILN
IL1.
00
0.00
0.
00
0.00
0.
00
0.00
0.
00
25.0
0 0.
00
501.
65
0.00
0.
00
Turn
over
3.
37
274.
77
NIL
Nil
185.
29
Nil
Nil
Nil
Nil
Nil
Nil
Nil
Nil
Nil
Nil
Prof
it be
fore
tax
atio
n 2.
19
(131
.62)
NIL
Nil
(7.5
8)N
ilN
ilN
ilN
ilN
ilN
ilN
ilN
ilN
ilN
il
Prov
ision
for
taxa
tion
3.60
0.
00
NIL
Nil
-
Nil
Nil
Nil
Nil
Nil
Nil
Nil
Nil
Nil
Nil
Prof
it af
ter
taxa
tion
(1.4
2)(1
31.6
2)N
ILN
il(7
.58)
Nil
Nil
Nil
Nil
Nil
Nil
Nil
Nil
Nil
Nil
Prop
osed
div
iden
d0.
00
0.00
N
ILN
ilN
ilN
ilN
ilN
ilN
ilN
ilN
ilN
ilN
ilN
ilN
il
Rupe
es in
lakh
s
com
pani
es o
n M
arch
31,
2012
1250
000
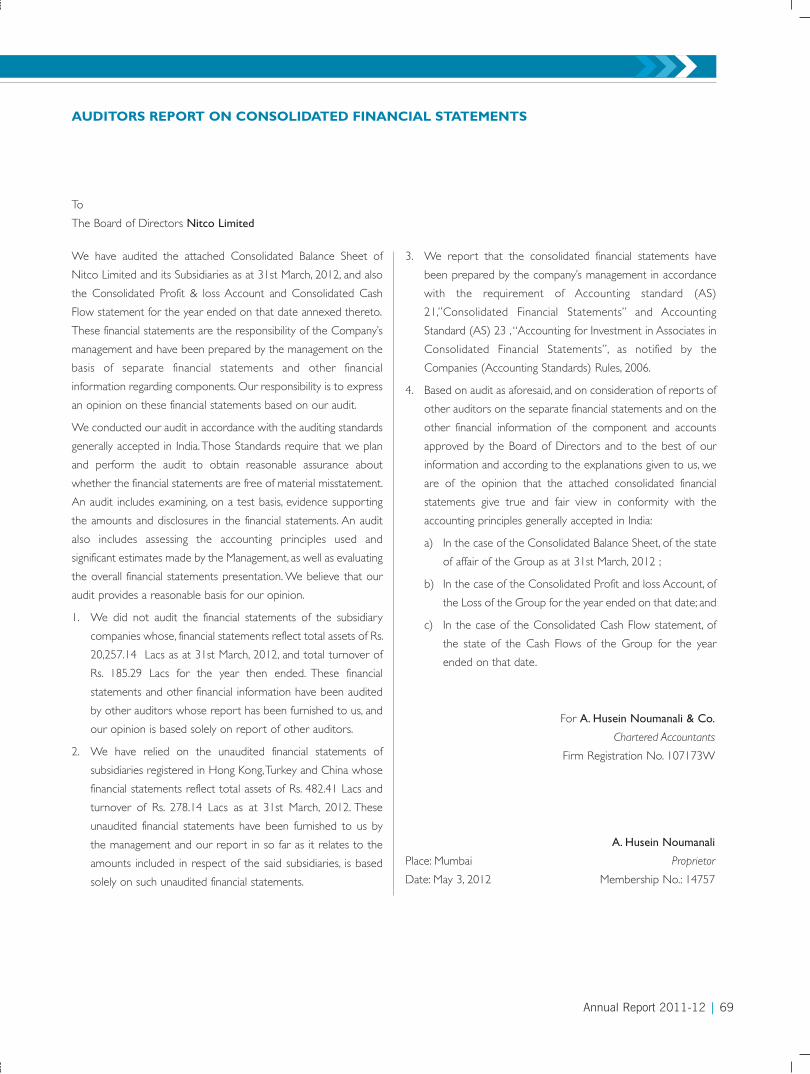
Annual Report 2011-12 | 69
AUDITORS REPORT ON CONSOLIDATED FINANCIAL STATEMENTS
We have audited the attached Consolidated Balance Sheet of
Nitco Limited and its Subsidiaries as at 31st March, 2012, and also
the Consolidated Profit & loss Account and Consolidated Cash
Flow statement for the year ended on that date annexed thereto.
These financial statements are the responsibility of the Company’s
management and have been prepared by the management on the
basis of separate financial statements and other financial
information regarding components. Our responsibility is to express
an opinion on these financial statements based on our audit.
We conducted our audit in accordance with the auditing standards
generally accepted in India. Those Standards require that we plan
and perform the audit to obtain reasonable assurance about
whether the financial statements are free of material misstatement.
An audit includes examining, on a test basis, evidence supporting
the amounts and disclosures in the financial statements. An audit
also includes assessing the accounting principles used and
significant estimates made by the Management, as well as evaluating
the overall financial statements presentation. We believe that our
audit provides a reasonable basis for our opinion.
1. We did not audit the financial statements of the subsidiary
companies whose, financial statements reflect total assets of Rs.
20,257.14 Lacs as at 31st March, 2012, and total turnover of
Rs. 185.29 Lacs for the year then ended. These financial
statements and other financial information have been audited
by other auditors whose report has been furnished to us, and
our opinion is based solely on report of other auditors.
2. We have relied on the unaudited financial statements of
subsidiaries registered in Hong Kong, Turkey and China whose
financial statements reflect total assets of Rs. 482.41 Lacs and
turnover of Rs. 278.14 Lacs as at 31st March, 2012. These
unaudited financial statements have been furnished to us by
the management and our report in so far as it relates to the
amounts included in respect of the said subsidiaries, is based
solely on such unaudited financial statements.
3. We report that the consolidated financial statements have
been prepared by the company’s management in accordance
with the requirement of Accounting standard (AS)
21,”Consolidated Financial Statements” and Accounting
Standard (AS) 23 , “Accounting for Investment in Associates in
Consolidated Financial Statements”, as notified by the
Companies (Accounting Standards) Rules, 2006.
4. Based on audit as aforesaid, and on consideration of reports of
other auditors on the separate financial statements and on the
other financial information of the component and accounts
approved by the Board of Directors and to the best of our
information and according to the explanations given to us, we
are of the opinion that the attached consolidated financial
statements give true and fair view in conformity with the
accounting principles generally accepted in India:
a) In the case of the Consolidated Balance Sheet, of the state
of affair of the Group as at 31st March, 2012 ;
b) In the case of the Consolidated Profit and loss Account, of
the Loss of the Group for the year ended on that date; and
c) In the case of the Consolidated Cash Flow statement, of
the state of the Cash Flows of the Group for the year
ended on that date.
For A. Husein Noumanali & Co.
Chartered Accountants
Firm Registration No. 107173W
A. Husein Noumanali
Place: Mumbai Proprietor
Date: May 3, 2012 Membership No.: 14757
To
The Board of Directors Nitco Limited
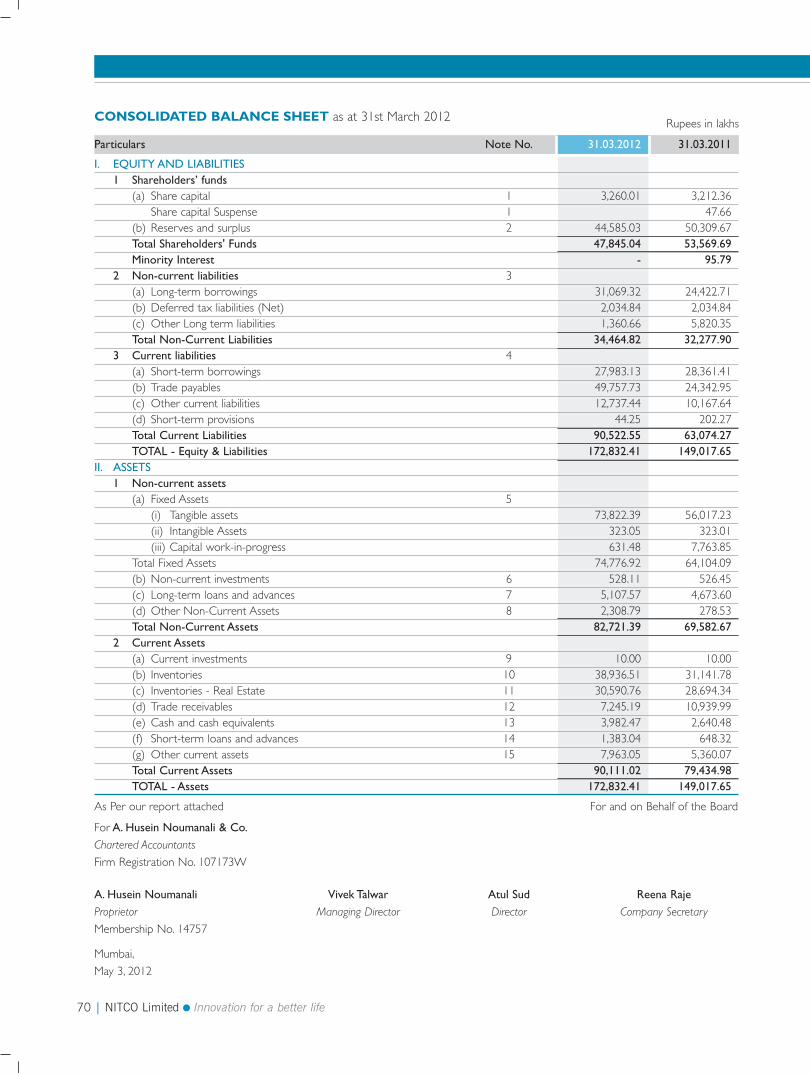
70 | NITCO Limited Innovation for a better life
CONSOLIDATED BALANCE SHEET as at 31st March 2012 Rupees in lakhs
Particulars Note No. 31.03.2012 31.03.2011
I. EQUITY AND LIABILITIES
1 Shareholders’ funds
(a) Share capital 1 3,260.01 3,212.36 Share capital Suspense 1 47.66
(b) Reserves and surplus 2 44,585.03 50,309.67 Total Shareholders' Funds 47,845.04 53,569.69
Minority Interest - 95.79
2 Non-current liabilities 3(a) Long-term borrowings 31,069.32 24,422.71 (b) Deferred tax liabilities (Net) 2,034.84 2,034.84 (c) Other Long term liabilities 1,360.66 5,820.35 Total Non-Current Liabilities 34,464.82 32,277.90
3 Current liabilities 4(a) Short-term borrowings 27,983.13 28,361.41 (b) Trade payables 49,757.73 24,342.95 (c) Other current liabilities 12,737.44 10,167.64 (d) Short-term provisions 44.25 202.27 Total Current Liabilities 90,522.55 63,074.27
TOTAL - Equity & Liabilities 172,832.41 149,017.65
II. ASSETS
1 Non-current assets
(a) Fixed Assets 5(i) Tangible assets 73,822.39 56,017.23 (ii) Intangible Assets 323.05 323.01 (iii) Capital work-in-progress 631.48 7,763.85
Total Fixed Assets 74,776.92 64,104.09 (b) Non-current investments 6 528.11 526.45 (c) Long-term loans and advances 7 5,107.57 4,673.60 (d) Other Non-Current Assets 8 2,308.79 278.53 Total Non-Current Assets 82,721.39 69,582.67
2 Current Assets
(a) Current investments 9 10.00 10.00 (b) Inventories 10 38,936.51 31,141.78 (c) Inventories - Real Estate 11 30,590.76 28,694.34 (d) Trade receivables 12 7,245.19 10,939.99 (e) Cash and cash equivalents 13 3,982.47 2,640.48 (f) Short-term loans and advances 14 1,383.04 648.32 (g) Other current assets 15 7,963.05 5,360.07 Total Current Assets 90,111.02 79,434.98
TOTAL - Assets 172,832.41 149,017.65
As Per our report attached For and on Behalf of the Board
For A. Husein Noumanali & Co.Chartered Accountants
Firm Registration No. 107173W
A. Husein Noumanali Vivek Talwar Atul Sud Reena RajeProprietor Managing Director Director Company Secretary
Membership No. 14757
Mumbai,
May 3, 2012
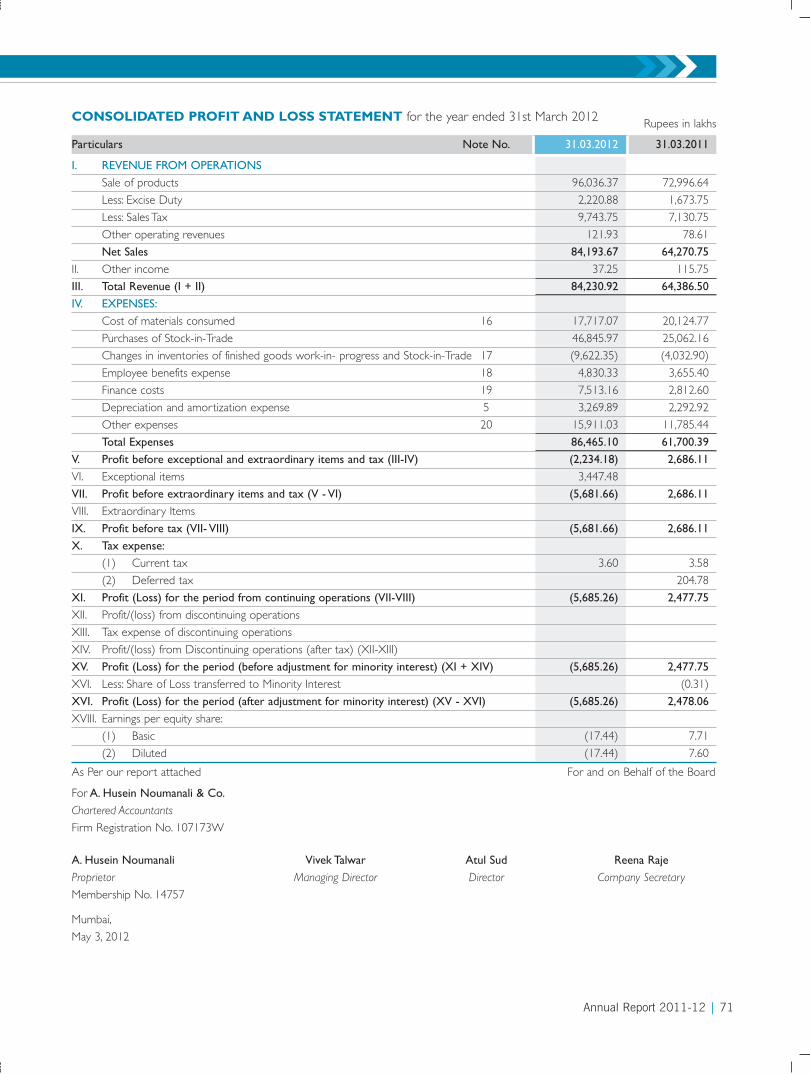
Annual Report 2011-12 | 71
As Per our report attached For and on Behalf of the Board
For A. Husein Noumanali & Co.Chartered Accountants
Firm Registration No. 107173W
A. Husein Noumanali Vivek Talwar Atul Sud Reena RajeProprietor Managing Director Director Company Secretary
Membership No. 14757
Mumbai,
May 3, 2012
CONSOLIDATED PROFIT AND LOSS STATEMENT for the year ended 31st March 2012 Rupees in lakhs
Particulars Note No. 31.03.2012 31.03.2011
I. REVENUE FROM OPERATIONS
Sale of products 96,036.37 72,996.64
Less: Excise Duty 2,220.88 1,673.75
Less: Sales Tax 9,743.75 7,130.75
Other operating revenues 121.93 78.61
Net Sales 84,193.67 64,270.75
II. Other income 37.25 115.75
III. Total Revenue (I + II) 84,230.92 64,386.50
IV. EXPENSES:
Cost of materials consumed 16 17,717.07 20,124.77
Purchases of Stock-in-Trade 46,845.97 25,062.16
Changes in inventories of finished goods work-in- progress and Stock-in-Trade 17 (9,622.35) (4,032.90)
Employee benefits expense 18 4,830.33 3,655.40
Finance costs 19 7,513.16 2,812.60
Depreciation and amortization expense 5 3,269.89 2,292.92
Other expenses 20 15,911.03 11,785.44
Total Expenses 86,465.10 61,700.39
V. Profit before exceptional and extraordinary items and tax (III-IV) (2,234.18) 2,686.11
VI. Exceptional items 3,447.48
VII. Profit before extraordinary items and tax (V - VI) (5,681.66) 2,686.11
VIII. Extraordinary Items
IX. Profit before tax (VII- VIII) (5,681.66) 2,686.11
X. Tax expense:
(1) Current tax 3.60 3.58
(2) Deferred tax 204.78
XI. Profit (Loss) for the period from continuing operations (VII-VIII) (5,685.26) 2,477.75
XII. Profit/(loss) from discontinuing operations
XIII. Tax expense of discontinuing operations
XIV. Profit/(loss) from Discontinuing operations (after tax) (XII-XIII)
XV. Profit (Loss) for the period (before adjustment for minority interest) (XI + XIV) (5,685.26) 2,477.75
XVI. Less: Share of Loss transferred to Minority Interest (0.31)
XVI. Profit (Loss) for the period (after adjustment for minority interest) (XV - XVI) (5,685.26) 2,478.06
XVIII. Earnings per equity share:
(1) Basic (17.44) 7.71
(2) Diluted (17.44) 7.60
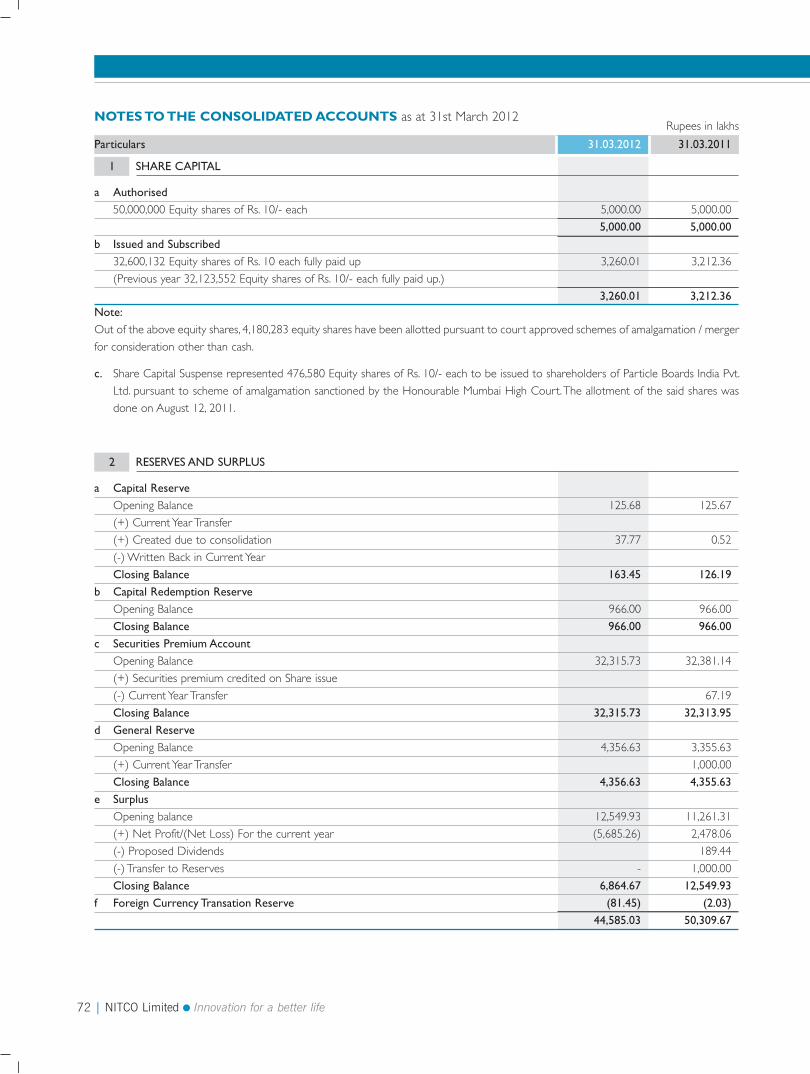
72 | NITCO Limited Innovation for a better life
NOTES TO THE CONSOLIDATED ACCOUNTS as at 31st March 2012Rupees in lakhs
Particulars 31.03.2012 31.03.2011
a Authorised
50,000,000 Equity shares of Rs. 10/- each 5,000.00 5,000.00
5,000.00 5,000.00
b Issued and Subscribed
32,600,132 Equity shares of Rs. 10 each fully paid up 3,260.01 3,212.36
(Previous year 32,123,552 Equity shares of Rs. 10/- each fully paid up.)
3,260.01 3,212.36
Note:
Out of the above equity shares, 4,180,283 equity shares have been allotted pursuant to court approved schemes of amalgamation / merger
for consideration other than cash.
c. Share Capital Suspense represented 476,580 Equity shares of Rs. 10/- each to be issued to shareholders of Particle Boards India Pvt.
Ltd. pursuant to scheme of amalgamation sanctioned by the Honourable Mumbai High Court. The allotment of the said shares was
done on August 12, 2011.
1 SHARE CAPITAL
a Capital Reserve
Opening Balance 125.68 125.67
(+) Current Year Transfer
(+) Created due to consolidation 37.77 0.52
(-) Written Back in Current Year
Closing Balance 163.45 126.19
b Capital Redemption Reserve
Opening Balance 966.00 966.00
Closing Balance 966.00 966.00
c Securities Premium Account
Opening Balance 32,315.73 32,381.14
(+) Securities premium credited on Share issue
(-) Current Year Transfer 67.19
Closing Balance 32,315.73 32,313.95
d General Reserve
Opening Balance 4,356.63 3,355.63
(+) Current Year Transfer 1,000.00
Closing Balance 4,356.63 4,355.63
e Surplus
Opening balance 12,549.93 11,261.31
(+) Net Profit/(Net Loss) For the current year (5,685.26) 2,478.06
(-) Proposed Dividends 189.44
(-) Transfer to Reserves - 1,000.00
Closing Balance 6,864.67 12,549.93
f Foreign Currency Transation Reserve (81.45) (2.03)
44,585.03 50,309.67
2 RESERVES AND SURPLUS
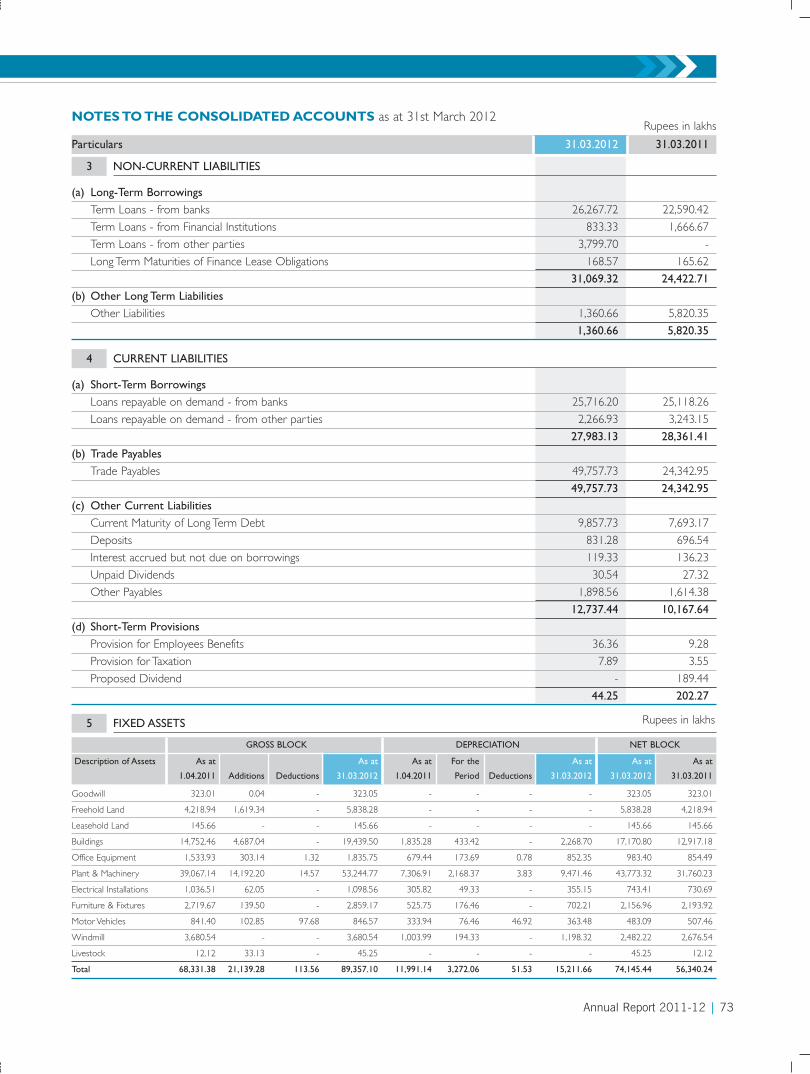
Annual Report 2011-12 | 73
NOTES TO THE CONSOLIDATED ACCOUNTS as at 31st March 2012Rupees in lakhs
Particulars 31.03.2012 31.03.2011
(a) Long-Term Borrowings
Term Loans - from banks 26,267.72 22,590.42
Term Loans - from Financial Institutions 833.33 1,666.67
Term Loans - from other parties 3,799.70 -
Long Term Maturities of Finance Lease Obligations 168.57 165.62
31,069.32 24,422.71
(b) Other Long Term Liabilities
Other Liabilities 1,360.66 5,820.35
1,360.66 5,820.35
3 NON-CURRENT LIABILITIES
(a) Short-Term Borrowings
Loans repayable on demand - from banks 25,716.20 25,118.26
Loans repayable on demand - from other parties 2,266.93 3,243.15
27,983.13 28,361.41
(b) Trade Payables
Trade Payables 49,757.73 24,342.95
49,757.73 24,342.95
(c) Other Current Liabilities
Current Maturity of Long Term Debt 9,857.73 7,693.17
Deposits 831.28 696.54
Interest accrued but not due on borrowings 119.33 136.23
Unpaid Dividends 30.54 27.32
Other Payables 1,898.56 1,614.38
12,737.44 10,167.64
(d) Short-Term Provisions
Provision for Employees Benefits 36.36 9.28
Provision for Taxation 7.89 3.55
Proposed Dividend - 189.44
44.25 202.27
4 CURRENT LIABILITIES
5 FIXED ASSETS Rupees in lakhs
GROSS BLOCK DEPRECIATION NET BLOCK
Description of Assets As at As at As at For the As at As at As at
1.04.2011 Additions Deductions 31.03.2012 1.04.2011 Period Deductions 31.03.2012 31.03.2012 31.03.2011
Goodwill 323.01 0.04 - 323.05 - - - - 323.05 323.01
Freehold Land 4,218.94 1,619.34 - 5,838.28 - - - - 5,838.28 4,218.94
Leasehold Land 145.66 - - 145.66 - - - - 145.66 145.66
Buildings 14,752.46 4,687.04 - 19,439.50 1,835.28 433.42 - 2,268.70 17,170.80 12,917.18
Office Equipment 1,533.93 303.14 1.32 1,835.75 679.44 173.69 0.78 852.35 983.40 854.49
Plant & Machinery 39,067.14 14,192.20 14.57 53,244.77 7,306.91 2,168.37 3.83 9,471.46 43,773.32 31,760.23
Electrical Installations 1,036.51 62.05 - 1,098.56 305.82 49.33 - 355.15 743.41 730.69
Furniture & Fixtures 2,719.67 139.50 - 2,859.17 525.75 176.46 - 702.21 2,156.96 2,193.92
Motor Vehicles 841.40 102.85 97.68 846.57 333.94 76.46 46.92 363.48 483.09 507.46
Windmill 3,680.54 - - 3,680.54 1,003.99 194.33 - 1,198.32 2,482.22 2,676.54
Livestock 12.12 33.13 - 45.25 - - - - 45.25 12.12
Total 68,331.38 21,139.28 113.56 89,357.10 11,991.14 3,272.06 51.53 15,211.66 74,145.44 56,340.24
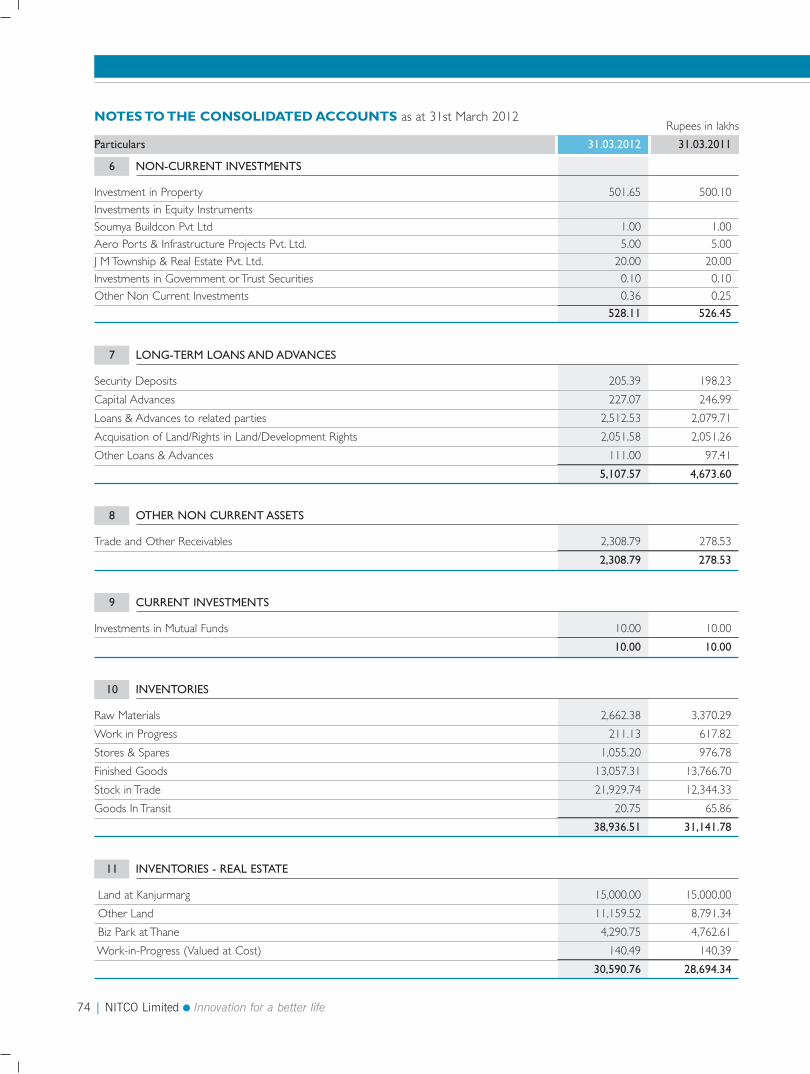
74 | NITCO Limited Innovation for a better life
Raw Materials 2,662.38 3,370.29
Work in Progress 211.13 617.82
Stores & Spares 1,055.20 976.78
Finished Goods 13,057.31 13,766.70
Stock in Trade 21,929.74 12,344.33
Goods In Transit 20.75 65.86
38,936.51 31,141.78
10 INVENTORIES
Land at Kanjurmarg 15,000.00 15,000.00
Other Land 11,159.52 8,791.34
Biz Park at Thane 4,290.75 4,762.61
Work-in-Progress (Valued at Cost) 140.49 140.39
30,590.76 28,694.34
11 INVENTORIES - REAL ESTATE
Security Deposits 205.39 198.23
Capital Advances 227.07 246.99
Loans & Advances to related parties 2,512.53 2,079.71
Acquisation of Land/Rights in Land/Development Rights 2,051.58 2,051.26
Other Loans & Advances 111.00 97.41
5,107.57 4,673.60
7 LONG-TERM LOANS AND ADVANCES
Trade and Other Receivables 2,308.79 278.53
2,308.79 278.53
8 OTHER NON CURRENT ASSETS
Investments in Mutual Funds 10.00 10.00
10.00 10.00
9 CURRENT INVESTMENTS
NOTES TO THE CONSOLIDATED ACCOUNTS as at 31st March 2012Rupees in lakhs
Particulars 31.03.2012 31.03.2011
Investment in Property 501.65 500.10
Investments in Equity Instruments
Soumya Buildcon Pvt Ltd 1.00 1.00
Aero Ports & Infrastructure Projects Pvt. Ltd. 5.00 5.00
J M Township & Real Estate Pvt. Ltd. 20.00 20.00
Investments in Government or Trust Securities 0.10 0.10
Other Non Current Investments 0.36 0.25
528.11 526.45
6 NON-CURRENT INVESTMENTS
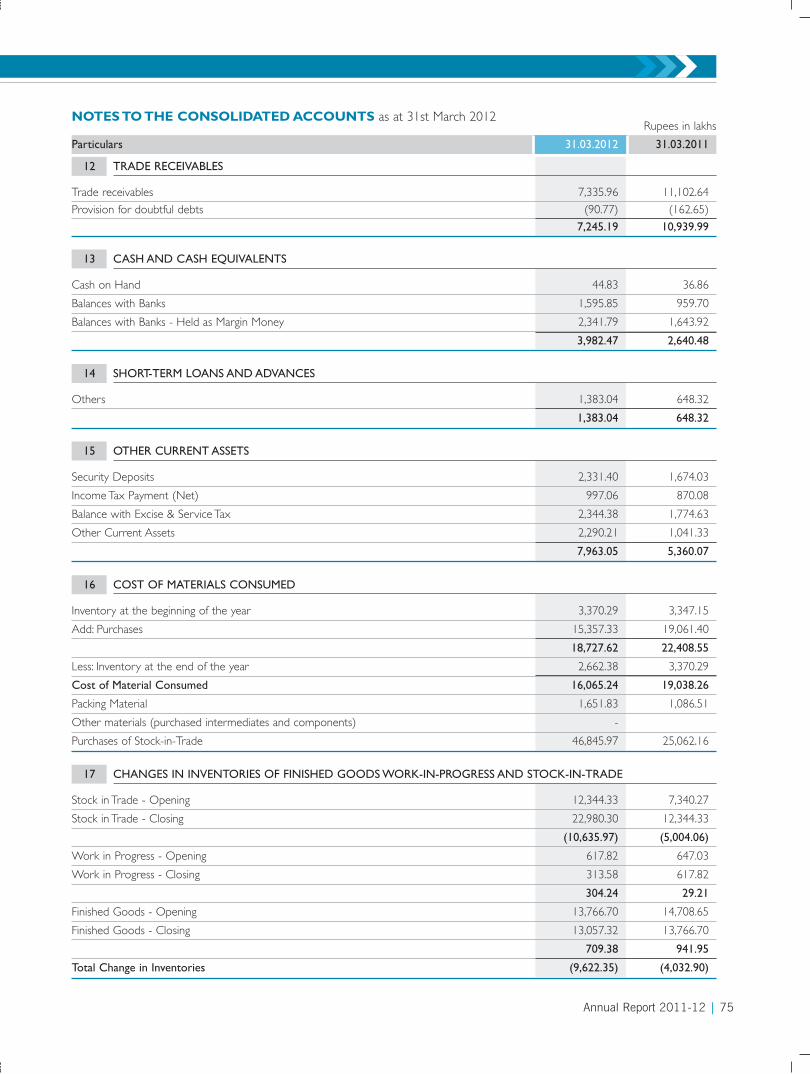
Annual Report 2011-12 | 75
Cash on Hand 44.83 36.86
Balances with Banks 1,595.85 959.70
Balances with Banks - Held as Margin Money 2,341.79 1,643.92
3,982.47 2,640.48
13 CASH AND CASH EQUIVALENTS
NOTES TO THE CONSOLIDATED ACCOUNTS as at 31st March 2012Rupees in lakhs
Particulars 31.03.2012 31.03.2011
Trade receivables 7,335.96 11,102.64
Provision for doubtful debts (90.77) (162.65)
7,245.19 10,939.99
12 TRADE RECEIVABLES
Security Deposits 2,331.40 1,674.03
Income Tax Payment (Net) 997.06 870.08
Balance with Excise & Service Tax 2,344.38 1,774.63
Other Current Assets 2,290.21 1,041.33
7,963.05 5,360.07
15 OTHER CURRENT ASSETS
Inventory at the beginning of the year 3,370.29 3,347.15
Add: Purchases 15,357.33 19,061.40
18,727.62 22,408.55
Less: Inventory at the end of the year 2,662.38 3,370.29
Cost of Material Consumed 16,065.24 19,038.26
Packing Material 1,651.83 1,086.51
Other materials (purchased intermediates and components) -
Purchases of Stock-in-Trade 46,845.97 25,062.16
16 COST OF MATERIALS CONSUMED
Others 1,383.04 648.32
1,383.04 648.32
14 SHORT-TERM LOANS AND ADVANCES
Stock in Trade - Opening 12,344.33 7,340.27
Stock in Trade - Closing 22,980.30 12,344.33
(10,635.97) (5,004.06)
Work in Progress - Opening 617.82 647.03
Work in Progress - Closing 313.58 617.82
304.24 29.21
Finished Goods - Opening 13,766.70 14,708.65
Finished Goods - Closing 13,057.32 13,766.70
709.38 941.95
Total Change in Inventories (9,622.35) (4,032.90)
17 CHANGES IN INVENTORIES OF FINISHED GOODS WORK-IN-PROGRESS AND STOCK-IN-TRADE
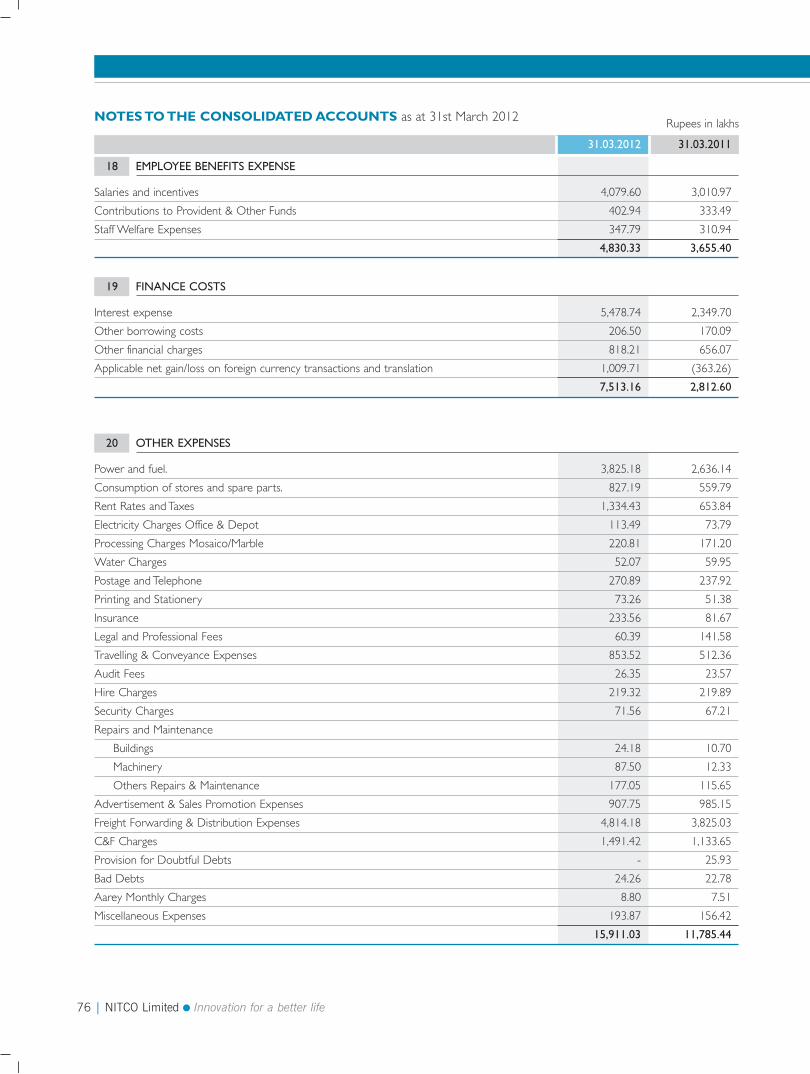
76 | NITCO Limited Innovation for a better life
NOTES TO THE CONSOLIDATED ACCOUNTS as at 31st March 2012 Rupees in lakhs
31.03.2012 31.03.2011
Salaries and incentives 4,079.60 3,010.97
Contributions to Provident & Other Funds 402.94 333.49
Staff Welfare Expenses 347.79 310.94
4,830.33 3,655.40
18 EMPLOYEE BENEFITS EXPENSE
Interest expense 5,478.74 2,349.70
Other borrowing costs 206.50 170.09
Other financial charges 818.21 656.07
Applicable net gain/loss on foreign currency transactions and translation 1,009.71 (363.26)
7,513.16 2,812.60
19 FINANCE COSTS
Power and fuel. 3,825.18 2,636.14
Consumption of stores and spare parts. 827.19 559.79
Rent Rates and Taxes 1,334.43 653.84
Electricity Charges Office & Depot 113.49 73.79
Processing Charges Mosaico/Marble 220.81 171.20
Water Charges 52.07 59.95
Postage and Telephone 270.89 237.92
Printing and Stationery 73.26 51.38
Insurance 233.56 81.67
Legal and Professional Fees 60.39 141.58
Travelling & Conveyance Expenses 853.52 512.36
Audit Fees 26.35 23.57
Hire Charges 219.32 219.89
Security Charges 71.56 67.21
Repairs and Maintenance
Buildings 24.18 10.70
Machinery 87.50 12.33
Others Repairs & Maintenance 177.05 115.65
Advertisement & Sales Promotion Expenses 907.75 985.15
Freight Forwarding & Distribution Expenses 4,814.18 3,825.03
C&F Charges 1,491.42 1,133.65
Provision for Doubtful Debts - 25.93
Bad Debts 24.26 22.78
Aarey Monthly Charges 8.80 7.51
Miscellaneous Expenses 193.87 156.42
15,911.03 11,785.44
20 OTHER EXPENSES
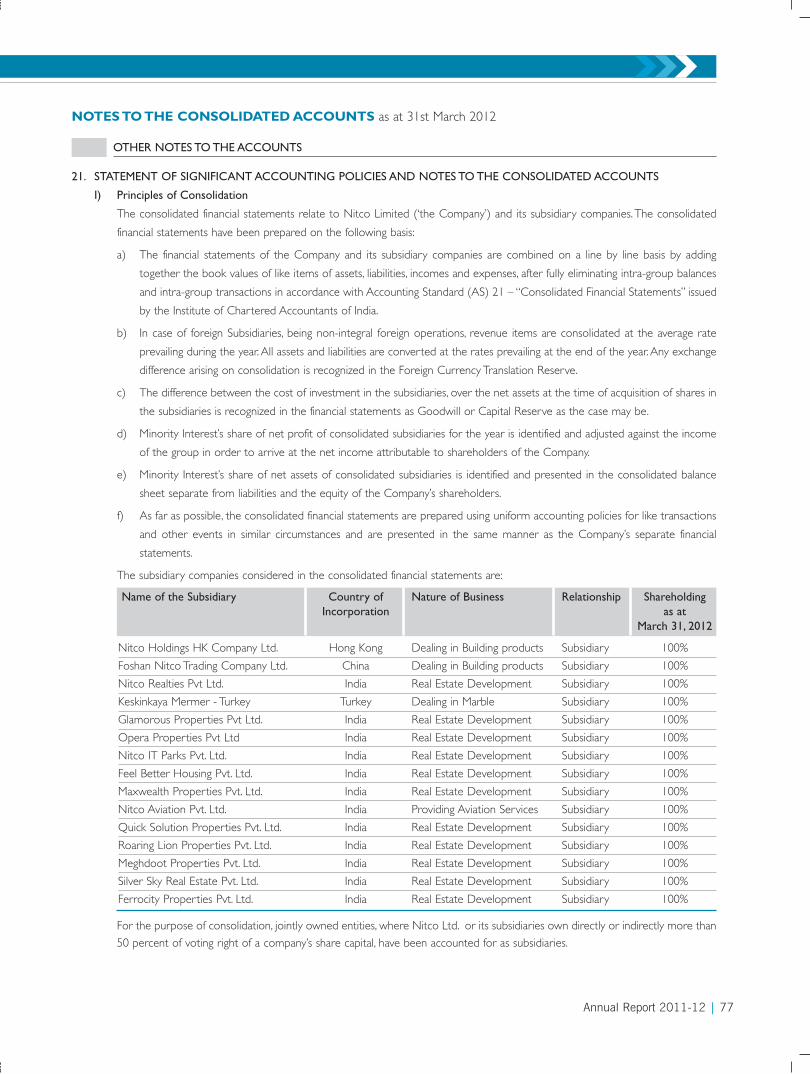
Annual Report 2011-12 | 77
NOTES TO THE CONSOLIDATED ACCOUNTS as at 31st March 2012
21. STATEMENT OF SIGNIFICANT ACCOUNTING POLICIES AND NOTES TO THE CONSOLIDATED ACCOUNTS
I) Principles of Consolidation
The consolidated financial statements relate to Nitco Limited (‘the Company’) and its subsidiary companies. The consolidated
financial statements have been prepared on the following basis:
a) The financial statements of the Company and its subsidiary companies are combined on a line by line basis by adding
together the book values of like items of assets, liabilities, incomes and expenses, after fully eliminating intra-group balances
and intra-group transactions in accordance with Accounting Standard (AS) 21 – “Consolidated Financial Statements” issued
by the Institute of Chartered Accountants of India.
b) In case of foreign Subsidiaries, being non-integral foreign operations, revenue items are consolidated at the average rate
prevailing during the year. All assets and liabilities are converted at the rates prevailing at the end of the year. Any exchange
difference arising on consolidation is recognized in the Foreign Currency Translation Reserve.
c) The difference between the cost of investment in the subsidiaries, over the net assets at the time of acquisition of shares in
the subsidiaries is recognized in the financial statements as Goodwill or Capital Reserve as the case may be.
d) Minority Interest’s share of net profit of consolidated subsidiaries for the year is identified and adjusted against the income
of the group in order to arrive at the net income attributable to shareholders of the Company.
e) Minority Interest’s share of net assets of consolidated subsidiaries is identified and presented in the consolidated balance
sheet separate from liabilities and the equity of the Company’s shareholders.
f) As far as possible, the consolidated financial statements are prepared using uniform accounting policies for like transactions
and other events in similar circumstances and are presented in the same manner as the Company’s separate financial
statements.
The subsidiary companies considered in the consolidated financial statements are:
OTHER NOTES TO THE ACCOUNTS
Name of the Subsidiary Country of Nature of Business Relationship ShareholdingIncorporation as at
March 31, 2012
Nitco Holdings HK Company Ltd. Hong Kong Dealing in Building products Subsidiary 100%
Foshan Nitco Trading Company Ltd. China Dealing in Building products Subsidiary 100%
Nitco Realties Pvt Ltd. India Real Estate Development Subsidiary 100%
Keskinkaya Mermer - Turkey Turkey Dealing in Marble Subsidiary 100%
Glamorous Properties Pvt Ltd. India Real Estate Development Subsidiary 100%
Opera Properties Pvt Ltd India Real Estate Development Subsidiary 100%
Nitco IT Parks Pvt. Ltd. India Real Estate Development Subsidiary 100%
Feel Better Housing Pvt. Ltd. India Real Estate Development Subsidiary 100%
Maxwealth Properties Pvt. Ltd. India Real Estate Development Subsidiary 100%
Nitco Aviation Pvt. Ltd. India Providing Aviation Services Subsidiary 100%
Quick Solution Properties Pvt. Ltd. India Real Estate Development Subsidiary 100%
Roaring Lion Properties Pvt. Ltd. India Real Estate Development Subsidiary 100%
Meghdoot Properties Pvt. Ltd. India Real Estate Development Subsidiary 100%
Silver Sky Real Estate Pvt. Ltd. India Real Estate Development Subsidiary 100%
Ferrocity Properties Pvt. Ltd. India Real Estate Development Subsidiary 100%
For the purpose of consolidation, jointly owned entities, where Nitco Ltd. or its subsidiaries own directly or indirectly more than
50 percent of voting right of a company’s share capital, have been accounted for as subsidiaries.
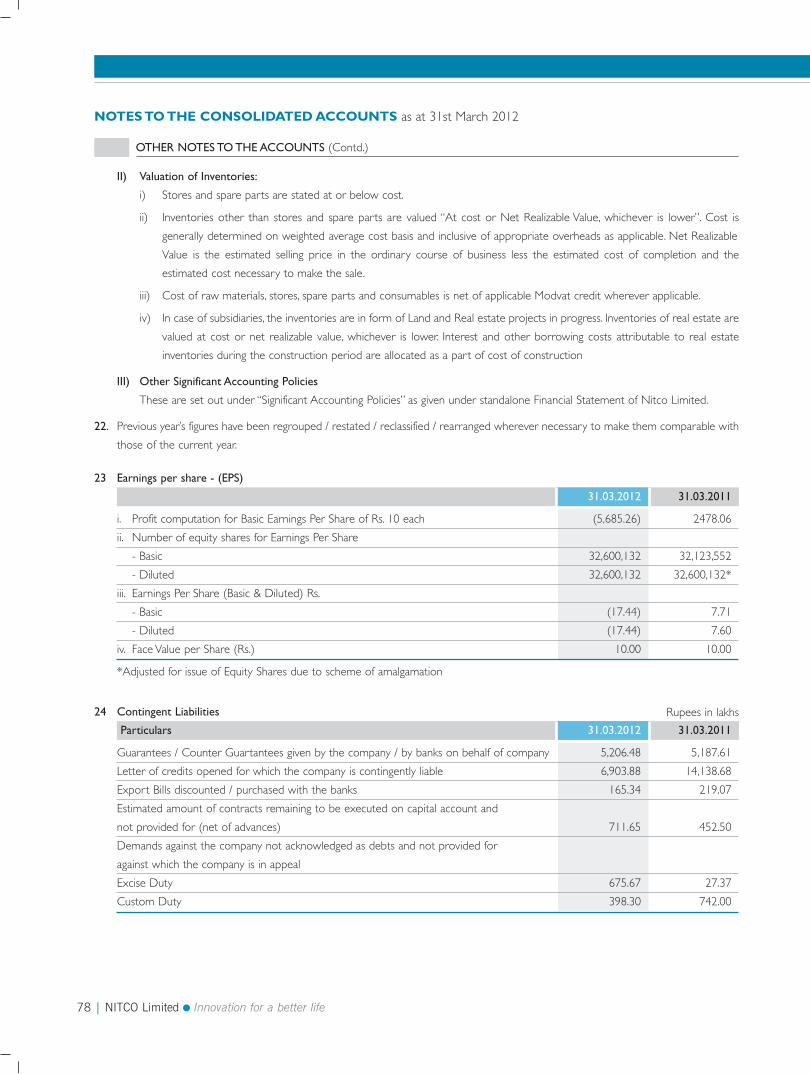
78 | NITCO Limited Innovation for a better life
NOTES TO THE CONSOLIDATED ACCOUNTS as at 31st March 2012
II) Valuation of Inventories:
i) Stores and spare parts are stated at or below cost.
ii) Inventories other than stores and spare parts are valued “At cost or Net Realizable Value, whichever is lower”. Cost is
generally determined on weighted average cost basis and inclusive of appropriate overheads as applicable. Net Realizable
Value is the estimated selling price in the ordinary course of business less the estimated cost of completion and the
estimated cost necessary to make the sale.
iii) Cost of raw materials, stores, spare parts and consumables is net of applicable Modvat credit wherever applicable.
iv) In case of subsidiaries, the inventories are in form of Land and Real estate projects in progress. Inventories of real estate are
valued at cost or net realizable value, whichever is lower. Interest and other borrowing costs attributable to real estate
inventories during the construction period are allocated as a part of cost of construction
III) Other Significant Accounting Policies
These are set out under “Significant Accounting Policies” as given under standalone Financial Statement of Nitco Limited.
22. Previous year’s figures have been regrouped / restated / reclassified / rearranged wherever necessary to make them comparable with
those of the current year.
OTHER NOTES TO THE ACCOUNTS (Contd.)
23 Earnings per share - (EPS)
31.03.2012 31.03.2011
i. Profit computation for Basic Earnings Per Share of Rs. 10 each (5,685.26) 2478.06
ii. Number of equity shares for Earnings Per Share
- Basic 32,600,132 32,123,552
- Diluted 32,600,132 32,600,132*
iii. Earnings Per Share (Basic & Diluted) Rs.
- Basic (17.44) 7.71
- Diluted (17.44) 7.60
iv. Face Value per Share (Rs.) 10.00 10.00
*Adjusted for issue of Equity Shares due to scheme of amalgamation
24 Contingent Liabilities Rupees in lakhs
Particulars 31.03.2012 31.03.2011
Guarantees / Counter Guartantees given by the company / by banks on behalf of company 5,206.48 5,187.61
Letter of credits opened for which the company is contingently liable 6,903.88 14,138.68
Export Bills discounted / purchased with the banks 165.34 219.07
Estimated amount of contracts remaining to be executed on capital account and
not provided for (net of advances) 711.65 452.50
Demands against the company not acknowledged as debts and not provided for
against which the company is in appeal
Excise Duty 675.67 27.37
Custom Duty 398.30 742.00
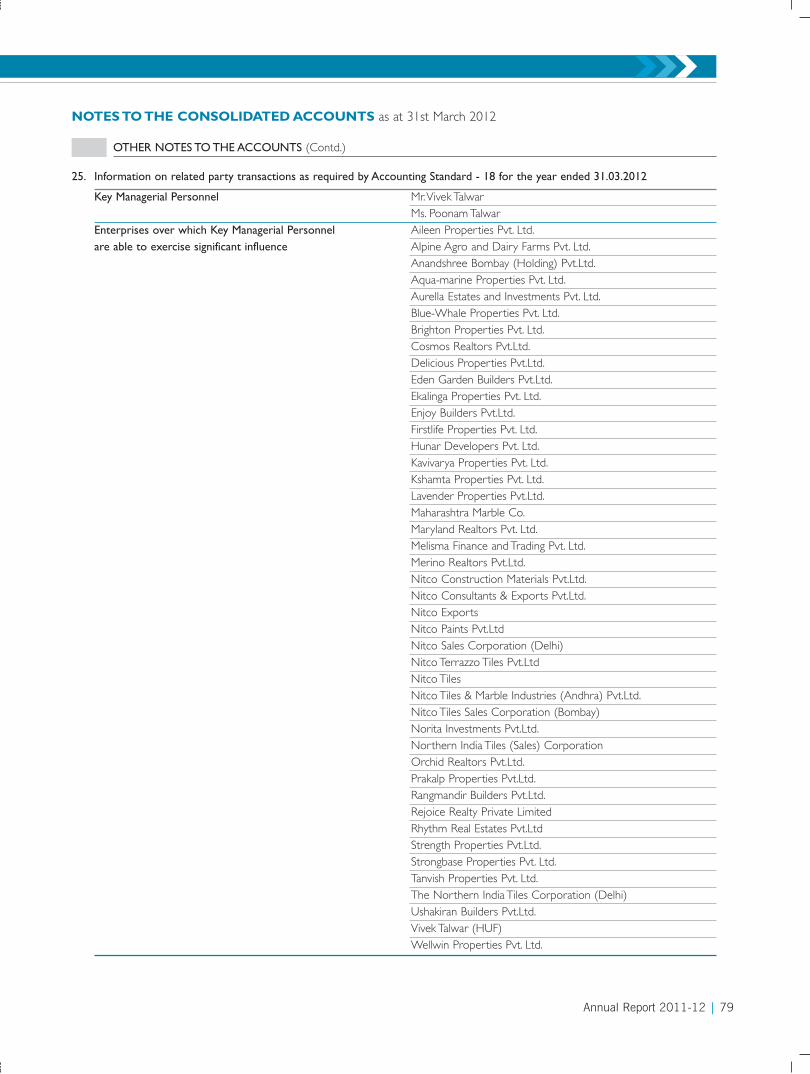
Annual Report 2011-12 | 79
NOTES TO THE CONSOLIDATED ACCOUNTS as at 31st March 2012
OTHER NOTES TO THE ACCOUNTS (Contd.)
25. Information on related party transactions as required by Accounting Standard - 18 for the year ended 31.03.2012
Key Managerial Personnel Mr. Vivek TalwarMs. Poonam Talwar
Enterprises over which Key Managerial Personnel Aileen Properties Pvt. Ltd.are able to exercise significant influence Alpine Agro and Dairy Farms Pvt. Ltd.
Anandshree Bombay (Holding) Pvt.Ltd.Aqua-marine Properties Pvt. Ltd.Aurella Estates and Investments Pvt. Ltd.Blue-Whale Properties Pvt. Ltd.Brighton Properties Pvt. Ltd.Cosmos Realtors Pvt.Ltd.Delicious Properties Pvt.Ltd.Eden Garden Builders Pvt.Ltd.Ekalinga Properties Pvt. Ltd.Enjoy Builders Pvt.Ltd.Firstlife Properties Pvt. Ltd.Hunar Developers Pvt. Ltd.Kavivarya Properties Pvt. Ltd.Kshamta Properties Pvt. Ltd.Lavender Properties Pvt.Ltd.Maharashtra Marble Co.Maryland Realtors Pvt. Ltd.Melisma Finance and Trading Pvt. Ltd.Merino Realtors Pvt.Ltd.Nitco Construction Materials Pvt.Ltd.Nitco Consultants & Exports Pvt.Ltd.Nitco ExportsNitco Paints Pvt.LtdNitco Sales Corporation (Delhi)Nitco Terrazzo Tiles Pvt.LtdNitco TilesNitco Tiles & Marble Industries (Andhra) Pvt.Ltd.Nitco Tiles Sales Corporation (Bombay)Norita Investments Pvt.Ltd.Northern India Tiles (Sales) CorporationOrchid Realtors Pvt.Ltd.Prakalp Properties Pvt.Ltd.Rangmandir Builders Pvt.Ltd.Rejoice Realty Private LimitedRhythm Real Estates Pvt.LtdStrength Properties Pvt.Ltd.Strongbase Properties Pvt. Ltd.Tanvish Properties Pvt. Ltd.The Northern India Tiles Corporation (Delhi)Ushakiran Builders Pvt.Ltd.Vivek Talwar (HUF)Wellwin Properties Pvt. Ltd.

80 | NITCO Limited Innovation for a better life
NOTES TO THE CONSOLIDATED ACCOUNTS as at 31st March 2012
OTHER NOTES TO THE ACCOUNTS (Contd.)
26. Segment Reporting for the year ended March 31, 2012.
Sr. No. Particulars 31.03.2012 31.03.2011
1 Net Sales / Income from Operations (Audited) (Audited)
- Tiles & Other related products 82,925.97 62,257.45 - Real Estate 1,304.95 2,129.05 Total Revenue 84,230.92 64,386.50
2 Segment Results
- Tiles & Other related products 1,579.15 5,049.81 - Real Estate 252.35 448.90 Total Segment Profit before Interest & Tax 1,831.50 5,498.71
Less : Interest & Other financial charges 6,503.45 3,175.86 Foreign Exchange Loss/(Gain) 1,009.71 (363.26)
Profit Before Tax (5,681.66) 2,686.11
3 Capital Employed
(Segment assets - Segment liabilities)- Tiles & Other related products 81,151.78 82,490.50 - Real Estate 35,665.02 33,224.24 - Unallocated/ Corporate 1,973.27 571.52 Total Capital Employed 118,790.07 116,286.26
Year ended
Key Managerial Personnel Others
Rent Paid 25.55 Remuneration / Sitting Fees 81.61Rent Deposit 1,000.00
Related Party Transactions for FY 2011-12 Rupees in lakhs
Rupees in lakhs
1) Rent paid include Eden Garden Builders Pvt. Ltd. Rs. 3.18 Lacs (previous year Rs. 3.18 lacs), Enjoy Builders Pvt. Ltd. Rs. 4.37 Lacs(previous year Rs. 4.37 Lacs), Lavender Properties Pvt. Ltd. Rs. 3.16 Lacs (previous year Rs. 3.16 Lacs), Nitco Tiles and MarbleIndustries Pvt. Ltd. Rs. 4.49 Lacs (previous year Rs. 17.80 Lacs), Prakalp Properties Pvt. Ltd. Rs. 3.02 Lacs (previous year Rs. 3.02lacs), Rang Mandir Builders Pvt. Ltd. Rs. 4.18 Lacs (precious year Rs. 4.18 Lacs) and Usha Kiran Builders Pvt. Ltd. Rs. 3.16 Lacs(previous year Rs. 3.16 lacs ).
2) Rent Deposit includes Eden Garden Builders Pvt. Ltd. Rs. 150 Lacs (previous year Rs. 150 Lacs), Enjoy Builders Pvt. Ltd. Rs. 205lacs (previous year Rs. 205 lacs), Prakalp Properties Pvt. Ltd. Rs. 145 Lacs (previous year Rs. 145 Lacs), Rang Mandir Builders Pvt.Ltd. Rs. 200 lacs (previous year Rs. 200 Lacs), Usha Kiran Builders Pvt. Ltd. Rs. 150 Lacs (previous year Rs. 150 lacs) and LavenderProperties Pvt. Ltd. Rs. 150 Lacs (previous year Rs. 150 lacs).
3) Remuneration / sitting fees include remuneration to Mr. Vivek Talwar Rs. 58.28 lacs (previous year Rs. 87.65 Lacs), remunerationto Ms. Poonam Talwar Rs. 20.29 Lacs (previous year Rs. 20.18 lacs), sitting fees to Mr. S.K. Bhardwaj Rs. 1.30 Lacs (previous yearRs. 1.73 Lacs) and sitting fees to Mr. Atul Sud Rs. 1.74 Lacs (previous year Rs. 0.89 lacs).
As Per our report attached For and on Behalf of the Board
For A. Husein Noumanali & Co.Chartered Accountants
Firm Registration No. 107173W
A. Husein Noumanali Vivek Talwar Atul Sud Reena RajeProprietor Managing Director Director Company Secretary
Membership No. 14757
Mumbai,
May 3, 2012
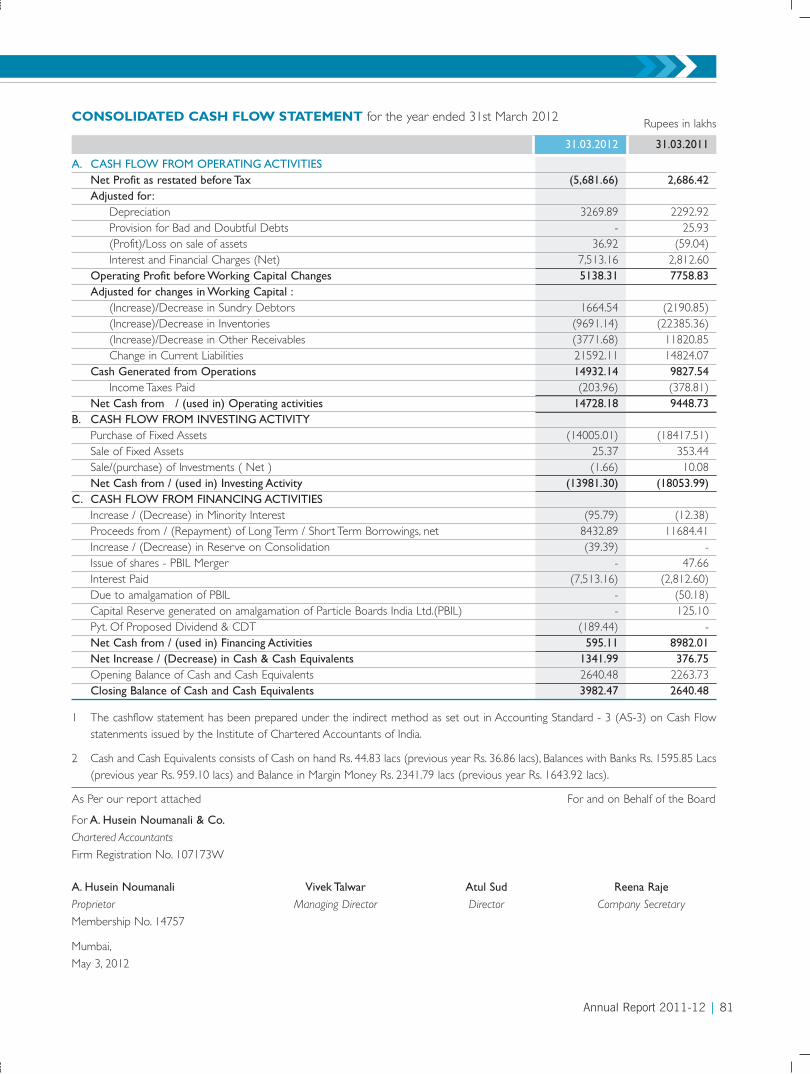
As Per our report attached For and on Behalf of the Board
For A. Husein Noumanali & Co.Chartered Accountants
Firm Registration No. 107173W
A. Husein Noumanali Vivek Talwar Atul Sud Reena RajeProprietor Managing Director Director Company Secretary
Membership No. 14757
Mumbai,
May 3, 2012
CONSOLIDATED CASH FLOW STATEMENT for the year ended 31st March 2012 Rupees in lakhs
31.03.2012 31.03.2011
A. CASH FLOW FROM OPERATING ACTIVITIESNet Profit as restated before Tax (5,681.66) 2,686.42
Adjusted for:
Depreciation 3269.89 2292.92 Provision for Bad and Doubtful Debts - 25.93 (Profit)/Loss on sale of assets 36.92 (59.04)Interest and Financial Charges (Net) 7,513.16 2,812.60
Operating Profit before Working Capital Changes 5138.31 7758.83
Adjusted for changes in Working Capital :
(Increase)/Decrease in Sundry Debtors 1664.54 (2190.85)(Increase)/Decrease in Inventories (9691.14) (22385.36)(Increase)/Decrease in Other Receivables (3771.68) 11820.85 Change in Current Liabilities 21592.11 14824.07
Cash Generated from Operations 14932.14 9827.54
Income Taxes Paid (203.96) (378.81)Net Cash from / (used in) Operating activities 14728.18 9448.73
B. CASH FLOW FROM INVESTING ACTIVITY
Purchase of Fixed Assets (14005.01) (18417.51)Sale of Fixed Assets 25.37 353.44Sale/(purchase) of Investments ( Net ) (1.66) 10.08 Net Cash from / (used in) Investing Activity (13981.30) (18053.99)
C. CASH FLOW FROM FINANCING ACTIVITIES
Increase / (Decrease) in Minority Interest (95.79) (12.38)Proceeds from / (Repayment) of Long Term / Short Term Borrowings, net 8432.89 11684.41 Increase / (Decrease) in Reserve on Consolidation (39.39) - Issue of shares - PBIL Merger - 47.66 Interest Paid (7,513.16) (2,812.60)Due to amalgamation of PBIL - (50.18)Capital Reserve generated on amalgamation of Particle Boards India Ltd.(PBIL) - 125.10 Pyt. Of Proposed Dividend & CDT (189.44) - Net Cash from / (used in) Financing Activities 595.11 8982.01 Net Increase / (Decrease) in Cash & Cash Equivalents 1341.99 376.75 Opening Balance of Cash and Cash Equivalents 2640.48 2263.73 Closing Balance of Cash and Cash Equivalents 3982.47 2640.48
1 The cashflow statement has been prepared under the indirect method as set out in Accounting Standard - 3 (AS-3) on Cash Flowstatenments issued by the Institute of Chartered Accountants of India.
2 Cash and Cash Equivalents consists of Cash on hand Rs. 44.83 lacs (previous year Rs. 36.86 lacs), Balances with Banks Rs. 1595.85 Lacs(previous year Rs. 959.10 lacs) and Balance in Margin Money Rs. 2341.79 lacs (previous year Rs. 1643.92 lacs).
Annual Report 2011-12 | 81
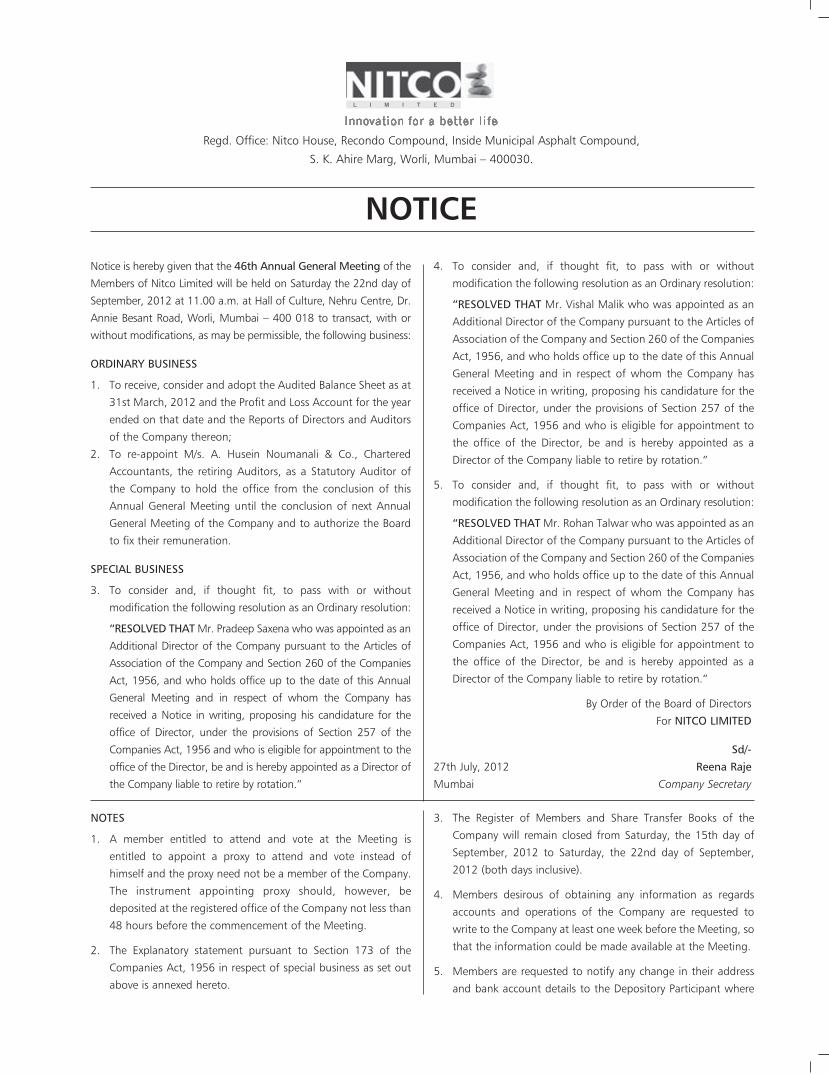
Notice is hereby given that the 46th Annual General Meeting of the
Members of Nitco Limited will be held on Saturday the 22nd day of
September, 2012 at 11.00 a.m. at Hall of Culture, Nehru Centre, Dr.
Annie Besant Road, Worli, Mumbai – 400 018 to transact, with or
without modifications, as may be permissible, the following business:
ORDINARY BUSINESS
1. To receive, consider and adopt the Audited Balance Sheet as at
31st March, 2012 and the Profit and Loss Account for the year
ended on that date and the Reports of Directors and Auditors
of the Company thereon;
2. To re-appoint M/s. A. Husein Noumanali & Co., Chartered
Accountants, the retiring Auditors, as a Statutory Auditor of
the Company to hold the office from the conclusion of this
Annual General Meeting until the conclusion of next Annual
General Meeting of the Company and to authorize the Board
to fix their remuneration.
SPECIAL BUSINESS
3. To consider and, if thought fit, to pass with or without
modification the following resolution as an Ordinary resolution:
“RESOLVED THAT Mr. Pradeep Saxena who was appointed as an
Additional Director of the Company pursuant to the Articles of
Association of the Company and Section 260 of the Companies
Act, 1956, and who holds office up to the date of this Annual
General Meeting and in respect of whom the Company has
received a Notice in writing, proposing his candidature for the
office of Director, under the provisions of Section 257 of the
Companies Act, 1956 and who is eligible for appointment to the
office of the Director, be and is hereby appointed as a Director of
the Company liable to retire by rotation.”
4. To consider and, if thought fit, to pass with or without
modification the following resolution as an Ordinary resolution:
“RESOLVED THAT Mr. Vishal Malik who was appointed as an
Additional Director of the Company pursuant to the Articles of
Association of the Company and Section 260 of the Companies
Act, 1956, and who holds office up to the date of this Annual
General Meeting and in respect of whom the Company has
received a Notice in writing, proposing his candidature for the
office of Director, under the provisions of Section 257 of the
Companies Act, 1956 and who is eligible for appointment to
the office of the Director, be and is hereby appointed as a
Director of the Company liable to retire by rotation.”
5. To consider and, if thought fit, to pass with or without
modification the following resolution as an Ordinary resolution:
“RESOLVED THAT Mr. Rohan Talwar who was appointed as an
Additional Director of the Company pursuant to the Articles of
Association of the Company and Section 260 of the Companies
Act, 1956, and who holds office up to the date of this Annual
General Meeting and in respect of whom the Company has
received a Notice in writing, proposing his candidature for the
office of Director, under the provisions of Section 257 of the
Companies Act, 1956 and who is eligible for appointment to
the office of the Director, be and is hereby appointed as a
Director of the Company liable to retire by rotation.”
By Order of the Board of Directors
For NITCO LIMITED
Sd/-
27th July, 2012 Reena Raje
Mumbai Company Secretary
Regd. Office: Nitco House, Recondo Compound, Inside Municipal Asphalt Compound,
S. K. Ahire Marg, Worli, Mumbai – 400030.
NOTICE
NOTES
1. A member entitled to attend and vote at the Meeting is
entitled to appoint a proxy to attend and vote instead of
himself and the proxy need not be a member of the Company.
The instrument appointing proxy should, however, be
deposited at the registered office of the Company not less than
48 hours before the commencement of the Meeting.
2. The Explanatory statement pursuant to Section 173 of the
Companies Act, 1956 in respect of special business as set out
above is annexed hereto.
3. The Register of Members and Share Transfer Books of the
Company will remain closed from Saturday, the 15th day of
September, 2012 to Saturday, the 22nd day of September,
2012 (both days inclusive).
4. Members desirous of obtaining any information as regards
accounts and operations of the Company are requested to
write to the Company at least one week before the Meeting, so
that the information could be made available at the Meeting.
5. Members are requested to notify any change in their address
and bank account details to the Depository Participant where
2 > NITCO Limited
they maintain their Demat account.
6. Members are advised to get their shares demated by sending
Dematerialization Request Form (DRF) alongwith Share
Certificates through their Depository Participant (DP) to
Company’s Registrar Link Intime India Private Limited (Link
Intime).
7. Particulars of Directors seeking appointment: Relevant
particulars of Mr. Pradeep Saxena, Mr. Vishal Malik and Mr.
Rohan Talwar are given in the report on Corporate
Governance.
8. Members wishing to claim dividends, which remain unclaimed,
are requested to approach the Company Secretary at its
registered office address and/or Link Intime. Members are
requested to note that the Dividends not encashed or claimed
within seven years from the date of transfer to the Company’s
Unpaid Dividend Account, will, as per section 205A of the
Companies Act, 1956, be transferred to the Investor Education
and Protection Fund.
9. Corporate Members intending to send their authorised
representatives are requested to send a certified copy of the
Board Resolution/Power of Attorney authorizing their
representatives to attend and vote on their behalf at the
Meeting.
10. As a measure of economy, members are requested to bring
copy of the Annual Report to the Meeting. Member / proxy
holders shall hand over the attendance slips, duly filled in all
respect, at the entrance for attending the Meeting.
Item No. 3
Mr. Pradeep Saxena was co-opted as an Additional Director of the
Company at the Board meeting held on 3rd May, 2012 and holds
office upto the date of this Annual General Meeting. As required
by the provisions of section 257 of the Companies Act, 1956, a
notice has been received from a member signifying his intention to
propose the appointment of Mr. Saxena as a Director of the
Company, along with the prescribed deposit of Rs.500/-. His profile
and other relevant details have been mentioned in the “Report on
Corporate Governance”.
Considering the wide range of experience of Mr. Pradeep Saxena,
in equity and finance field, his appointment on the Board will be
beneficial to the Company.
The Board recommends the resolution set out in Item No.3 of the
Notice for approval of the Members.
None of the directors of the company other than Mr. Saxena is in
any way concerned or interested in this resolution.
Item No. 4
Mr. Vishal Malik was co-opted as an Additional Director of the
Company at the Board meeting held on 3rd May, 2012 and holds
office upto the date of this Annual General Meeting. As required
by the provisions of section 257 of the Companies Act, 1956, a
notice has been received from a member signifying his intention to
propose the appointment of Mr. Malik as a Director of the
Company, along with the prescribed deposit of Rs.500/-. His profile
and other relevant details have been mentioned in the “Report on
Corporate Governance”.
Considering the wide range of experience of Mr. Vishal Malik, in
investment banking, his appointment on the Board will be
beneficial to the Company.
The Board recommends the resolution set out in Item No.4 of the
Notice for approval of the Members.
None of the directors of the company other than Mr. Malik is in
any way concerned or interested in this resolution.
Item No. 5
Mr. Rohan Talwar son of Mr. Vivek Talwar, Managing Director, was
co-opted as an Additional Director of the Company at the Board
meeting held on 3rd May, 2012 and holds office upto the date of
this Annual General Meeting. As required by the provisions of
section 257 of the Companies Act, 1956, a notice has been
received from a member signifying his intention to propose the
appointment of Mr. Rohan Talwar as a Director of the Company,
along with the prescribed deposit of Rs.500/-. His profile and other
relevant details have been mentioned in the “Report on Corporate
Governance”. Mr. Rohan Talwar has experience in the hospitality
sector.
The Board recommends the resolution set out in Item No.5 of the
Notice for approval of the Members.
None of the directors of the company other than Mr. Vivek Talwar
and Mr. Rohan Talwar are in any way concerned or interested in
this resolution.
By Order of the Board of Directors
For NITCO LIMITED
Sd/-
27th July, 2012 Reena Raje
Mumbai Company Secretary
EXPLANATORY STATEMENT PURSUANT TO SECTION 173 (2) OF THE COMPANIES ACT, 1956
DP & Client ID no.: ...................................................................................... No. of Shares:..............................................
Regd. Folio No.: ..........................................................................................
I / We.....................................................................................of......................................................................................in the district
of..................................................................................... being a Member / Members of the above named company hereby appoint
.................................................................................................. of .......................................................................... in the district of
................................................... or failing him / her............................................................. of ........................................................
in the district of............................................. as my/our Proxy to vote for me / us on my/our behalf at the Annual General Meeting
of the Company to be held on Saturday September 22, 2012 at 11.00 a.m. and at any adjournment thereof.
Signed this ....................................................... day of ........................................ 2012.
1. The Instrument of proxy duly stamped, signed and completed, must be deposited at the Registered Office of the Company not
later than 48 hours before the commencement of the meeting.
2. The Proxy need not be a member of the Company
Regd. Office: Nitco House, Recondo Compound, Inside Municipal Asphalt Compound, S. K. Ahire Marg, Worli, Mumbai – 400030
.......................................................Signature of Member
Affix Revenue Stamp
PROXY FORM
DP & Client ID no.: ...................................................................................... No. of Shares:................................................
Regd. Folio No.: ..........................................................................................
Full Name of the Member: ..................................................................................................................................................................
Full Name of the Proxy : ..................................................................................................................................................................
I hereby record my presence at the Annual General Meeting of the Company being held on Saturday September 22, 2012 at
11.00 a.m. at Hall of Culture, Nehru Centre, Dr. Annie Besant Road, Worli, Mumbai - 400018.
........................................................................... .......................................................................
Signature of Member/ Authorized Representative Signature of Proxy
Notes: A Member / Proxy attending the meeting must complete this Attendance slip in legible writing and hand it over at the entrance.
Sign at appropriate place as applicable to you.
Regd. Office: Nitco House, Recondo Compound, Inside Municipal Asphalt Compound, S. K. Ahire Marg, Worli, Mumbai – 400030
ATTENDANCE SLIP
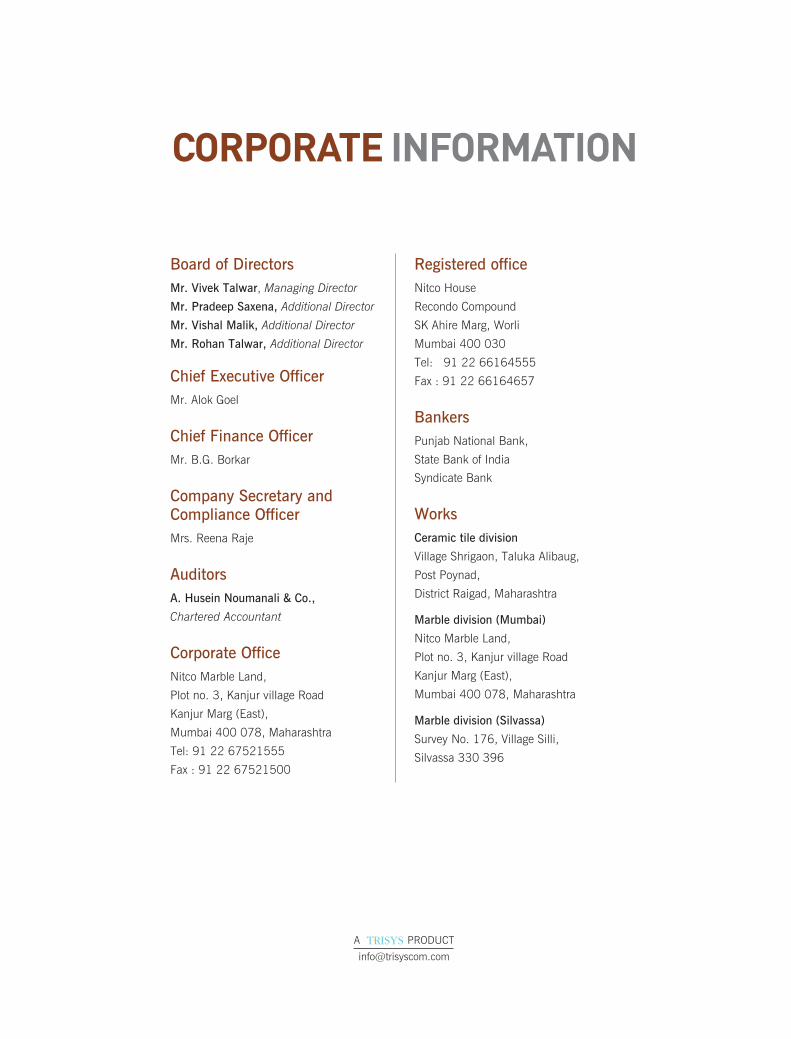
Statements in this report that describe
the Company’s objectives, projections,
estimates, expectations or predictions of
the future may be ‘forward-looking
statements’ within the meaning of the
applicable securities laws and
regulations. The Company cautions that
such statements involve risks and
uncertainty and that actual results could
differ materially from those expressed or
implied. Important factors that could
cause differences include raw materials’
cost or availability, cyclical demand and
pricing in the Company’s principal
markets, changes in government
regulations, economic developments
within the countries in which the
Company conducts business, and other
factors relating to the Company’s
operations, such as litigation, labour
negotiations and fiscal regimes.
Forward-looking statement
A PRODUCT
CORPORATE INFORMATION
Board of DirectorsMr. Vivek Talwar, Managing Director
Mr. Pradeep Saxena, Additional Director
Mr. Vishal Malik, Additional Director
Mr. Rohan Talwar, Additional Director
Chief Executive OfficerMr. Alok Goel
Chief Finance OfficerMr. B.G. Borkar
Company Secretary andCompliance OfficerMrs. Reena Raje
AuditorsA. Husein Noumanali & Co.,
Chartered Accountant
Corporate OfficeNitco Marble Land,
Plot no. 3, Kanjur village Road
Kanjur Marg (East),
Mumbai 400 078, Maharashtra
Tel: 91 22 67521555
Fax : 91 22 67521500
Registered office Nitco House
Recondo Compound
SK Ahire Marg, Worli
Mumbai 400 030
Tel: 91 22 66164555
Fax : 91 22 66164657
Bankers Punjab National Bank,
State Bank of India
Syndicate Bank
Works Ceramic tile division
Village Shrigaon, Taluka Alibaug,
Post Poynad,
District Raigad, Maharashtra
Marble division (Mumbai)
Nitco Marble Land,
Plot no. 3, Kanjur village Road
Kanjur Marg (East),
Mumbai 400 078, Maharashtra
Marble division (Silvassa)
Survey No. 176, Village Silli,
Silvassa 330 396
CONTENTS
Corporate identity 2Highlights, 2011-12 4CEO’s review 10Strengths 12Management discussion and analysis 14Financial statement analysis 24Risk management 26Five-year financials 28Directors’ report 30Report on corporate governance 36Financial section 49
Visit us at www.nitcotiles.com