Embed Size (px)
Citation preview
BUILDING SUSTAINABLE, INCLUSIVE COMMUNITIES:
How America can pursue smart growth and reunite our metropolitan communities
By David Rusk
Published by
About the Author
David Rusk is president of the Metropolitan Area Research Corporation (MARC), a founding member ofBuilding One America. As an urban policy consultant, he has consulted in over 120 metropolitan areas inthe USA as well as in Canada, England, Germany, South Africa, and The Netherlands where he was a visit-ing professor of urban planning at the University of Amsterdam in 2000-01. He is author of Cities withoutSuburbs (3rd edition: 2003), Baltimore Unbound (1995), Inside Game/Outside Game (1999) and Creatinga Greater Wheeling: a Citizen’s Guide to City-County Unification (2007).
The views expressed in this report are solely those of the author’s; and although the commentaries arebased on a set of recommendations adopted by Building One America (see Appendix A), the members ofthe Building One America network have not specifically approved each of the commentaries and analysescontained in this report.
Photo Credits: Andy Cook (cover large photo, p.10), David Rusk (pp. 22,27,30), Barbara Samuels (cover small pho-tos). Layout/Design: mary pettigrew, ampersand graphic design.
BUILDING SUSTAINABLE, INCLUSIVE COMMUNITIES:
How America can pursue smart growth and reunite our metropolitan communities
By David Rusk
May 2010
Published by
“. . . you can't have a truly sustainable community if you promote segregated developmentpatterns and concentrated poverty.”
–HUD Secretary Shaun Donovan at the 9th Annual“New Partners for Smart Growth: Building Safe, Healthyand Livable Communities” Conference, Feb. 4, 2010(prepared remarks)
Building Sustainable, Inclusive Communities 1
PrefaceOn June 16, 2009, in joint testimony to Congress by three Cabinet Secretaries, the ObamaAdministration announced an innovative new interagency collaboration among the Department ofTransportation, the Department of Housing and Urban Development, and the EnvironmentalProtection Agency. The initiative, called the “Partnership for Sustainable Communities” was aneffort to “coordinate federal transportation, environmental protection, and housing investments”around principles of smart growth. The Partnership for Sustainable Communities established sixlivability principles that were embodied in an agency partnership agreement.1
The interagency Partnership Agreement was soon followed by the appropriation of $150 millionto HUD for the first phase of a new “Sustainable Communities Initiative,” a competitive planninggrant program intended to merge housing and transportation planning, and the introduction of amajor bill in the Senate, S.B. 1619, known as the “Livable Communities Act,” which would com-mit up to $1.75 billion by FY2013 to link housing and transportation planning and developmentefforts. In its proposed 2011 Budget, HUD requested $150 million for a second phase of theSustainable Communities Initiative, and HUD also requested input on the contents of its initialcompetitive funding announcement for the program.
This report originated in comments prepared by David Rusk and submitted to HUD by ourorganizations and coalition partners on the proposed first phase of the Sustainable CommunitiesInitiative,2 but the principles apply equally to the future direction of the Senate’s LivableCommunities Act, the next phase of the Sustainable Communities Initiative, and ultimately, theSurface Transportation Reauthorization Act. As Rusk explains in detail in the chapters that follow,without a strong vision of social inclusion, it will be difficult to maintain a sustainable developmentfuture for our metropolitan areas.
Philip Tegeler, Poverty & Race Research Action Council
1 The Partnership principles included: 1. Provide more transportation choices - Develop safe, reliable and eco-nomical transportation choices to decrease household transportation costs, reduce our nation’s dependenceon foreign oil, improve air quality, reduce greenhouse gas emissions and promote public health; 2. Promoteequitable, affordable housing - Expand location- and energy-efficient housing choices for people of all ages,incomes, races and ethnicities to increase mobility and lower the combined cost of housing and transporta-tion; 3. Enhance economic competitiveness - Improve economic competitiveness through reliable and timelyaccess to employment centers, educational opportunities, services and other basic needs by workers as well asexpanded business access to markets; 4. Support existing communities - Target federal funding toward exist-ing communities – through such strategies as transit-oriented, mixed-use development and land recycling – toincrease community revitalization, improve the efficiency of public works investments, and safeguard rurallandscapes; 5. Coordinate policies and leverage investment - Align federal policies and funding to remove bar-riers to collaboration, leverage funding and increase the accountability and effectiveness of all levels of govern-ment to plan for future growth, including making smart energy choices such as locally generated renewableenergy; 6. Value communities and neighborhoods - Enhance the unique characteristics of all communities byinvesting in healthy, safe and walkable neighborhoods – rural, urban or suburban.
2 The ten chapters that make up this report were prepared by David Rusk, president of the Metropolitan AreaResearch Corporation, one of the founding organizations of Building One America. Unlike the official letter ofrecommendations transmitted to HUD and signed by 24 members of Building One America and its allies (seeAppendix A), these commentaries were not reviewed and formally adopted by the Building One America PolicyCommittee. However, they fairly convey the policy positions of Building One America and add a depth ofanalysis that aids their implementation.
Introduction: Ten Principles for Building Sustainable, Inclusive CommunitiesHUD’s new “Sustainable Communities Initiative” (SCI) represents the best of the new adminis-tration – looking forward creatively towards a new metropolitan future, and crossing bureaucraticsilos to engage transportation policy, environmental policy, and housing policy in the same pro-gram. However, the SCI program also demonstrates the potential pitfalls of trying to move pro-gressive policies without engaging the real continuing divisions of race and class in our society. Webelieve that the SCI program has the potential to advance the goal of racially and economicallyintegrated and environmentally sustainable regions. However, to achieve this goal, the programneeds to take these issues on explicitly.
We are encouraged by recent comments made by HUD Secretary Shaun Donovan, DOTSecretary Ray LaHood, and EPA Administrator Lisa Jackson, who all stated, in effect, that “sus-tainable must be equitable” at the New Partners for Smart Growth Conference on February 2010.That commitment was memorably reinforced by HUD Deputy Secretary Ron Sims in his inspiringremarks to conclude the conference.
HUD and its partners, DOT and EPA, have been provided with very broad latitude in designingthe SCI planning grant program through the very general explanatory language of theConsolidated Appropriations Act of December 16, 2009; thus, in terms of developing nationalmodels for achieving both greater social justice and enhanced environmental sustainability, HUD-DOT-EPA must set the bar very high for the pilot planning grant program – and must take intoaccount their mutual obligation to affirmatively further fair housing in any federal program affect-ing housing and urban development.
Our recommendations, focusing on regional opportunity goals, are set out below, and will beelaborated on in subsequent chapters. These recommendations were also submitted to HUD byBuilding One America and its coalition partners:
1. Sustainable Communities planning must be genuinely regional in scope, covering the jurisdic-tions that comprise a metropolitan or micropolitan area, or, at least those jurisdictions formingthe urbanized area of such, including the principal city or cities and first suburbs.
2. The recipient of an SCI planning grant must be a governmental unit (such as a county for single-county regions), or consortium of governmental units (such as a Metropolitan PlanningOrganization or Council of Governments) or, in the absence of interested local governments,a state agency – in short, public bodies that control development policy (land use, commercialand industrial development, housing, transportation and other infrastructure, etc.) within aregion.
3. There must be proportional representation on a Sustainable Communities grant recipient’sgoverning body of the residents of principal cities and first suburbs (where minorities and low-income households are typically concentrated); or,
failing that test, an SCI grant recipient must establish a decision-making substructure thatachieves proportional representation.
1.
2.
3.
2 POVERTY & RACE RESEARCH ACTION COUNCIL
4. Sustainable Communities Grants must include a plan for meaningful citizen involvement in the planning process, including the involvement of regional opportunity advocacy organizations.
5. A primary goal of Sustainable Communities planning must be the reduction of racial and economic residential segregation and school segregation and concentrations of poverty on aregional basis with aggressively affirmatively furthering fair housing as a fundamental policy; a method must be specified to document progress in achieving greater racial and economic integration.
6. Using one of several methodologies provided by the Office of Sustainable Housing andCommunities, grant recipients must conduct a regional opportunity assessment that measuresrelative opportunity (jobs, schools, local services, safety) by municipality or census tract.
7. Sustainable Communities planning must include policies and programs that give low-incomeresidents of low opportunity communities realistic options to move to high opportunity com-munities as well as policies and programs to upgrade the quality of life in low opportunitycommunities.
8. To the maximum extent, Sustainable Communities planning must result in new housingdevelopment and redevelopment providing affordable shelter for low-, very low-, andextremely-low income families within mixed income, market rate developments in higheropportunity communities.
9. Upon review and certification of the compliance of a regional comprehensive plan with thegoal of promoting more sustainable and inclusive regional communities, HUD, DOT, andEPA (and such other federal agencies as the President or Congress may designate) must makeall applicable grants-in-aid (such as transportation infrastructure, housing and communitydevelopment, and water and sewer infrastructure funds) in accordance with the provisions ofthe plan.
The recipients of all infrastructure grants-in-aid made in compliance with a regional compre-hensive plan must implement policies and programs to increase the training and employmentof women and minority group members on such infrastructure projects.
We are hopeful that these principles will guide HUD in its implementation of the SustainableCommunities Initiative in 2010, 2011, and in the years to come. These principles can also guideHUD, the Department of Transportation, and the EPA in their ongoing Partnership. They shouldbe incorporated in the Livable Communities Act currently pending in Congress, and in theupcoming debate on the Surface Transportation Reauthorization Act. In the next ten chapters, wewill explore the research and the values behind each of these principles, and why our divided met-ropolitan areas need to be reunited to ensure a sustainable future.
4.
5.
6.
7.
8.
9.
10.
Building Sustainable, Inclusive Communities 3
COMMENTARY NO.1 Regional Scope
Sustainable Communities planning must be genuinely regional in scope,
covering the jurisdictions that comprise a metropolitan or micropolitan area,
or, at least those jurisdictions forming the urbanized area of such,
including the principal city or cities and first suburbs.
“Job sprawl”
Steady employment at good wages is the foundation of most families’ well-being … and fordecades jobs have been moving steadily away from regional core communities where most minori-ties and low income families live.
A recent report highlights this relentless trend.3 In the 98 largest metro areas, in just the eightyears from 1998 to 2006,
■ the proportion of jobs located within the downtown area and adjacent city neighborhoods4
decreased from 23.3% to 21.3%; and
■ the proportion of jobs located within outlying city neighborhoods and inner suburbs5
decreased from 34.2% to 33.6%; whereas,
■ by contrast, the proportion of jobs located in the outer suburbs6 increased from 42.5% to45.1%.
■ Jobs decentralized in 95 of 98 metro areas and for 17 of 18 industry classifications.
Moreover, this Brookings Institution survey ended before the onset of the current recession thatwiped out 8.4 million jobs between December 2007 and January 2010. That job loss probablycancelled out most of the 7.2 million job gain registered in the 98 largest metro areas from 1998to 2006. With most of those job losses hitting cities and inner suburbs, a new survey would proba-bly show that over half of all jobs are now located in the outer suburban ring.
Any federal program focused on effectively increasing economic opportunity for low-income fami-lies (as SCI does) must recognize that labor markets are regional. Housing markets, of course, arealso regional. The transportation grid is regional. Privately-owned electric, gas, and telephoneservices are regionally provided as are some publicly-owned water and sewer utilities. Watershedsand airsheds are regional. All but the poorest residents lead their daily lives regionally.
3 Elizabeth Kneebone, “Job Sprawl Revisited: the Changing Geography of Metropolitan Employment,” Metro-politan Policy Program, The Brookings Institution (April 2009)
4 Defined as within three miles of the regional core (downtown business district)
5 Defined as from three to ten miles from the regional core
6 Defined as from 10 miles to 35 miles from the regional core
4 POVERTY & RACE RESEARCH ACTION COUNCIL
As Building One America’s opportunity maps show, higher opportunities are disproportionatelyconcentrated in certain areas of most regions. Creating improved employment opportunities formost poor minority residents and transformational education opportunities for most of their chil-dren requires opening up access to high opportunity communities on a regional scale.
Metropolitan area coverage: For decades, federal policy has recognized the reality of inter-dependence among jurisdictions on a regional basis through the designation of metropolitan areas.Metropolitan areas are defined by where jobs are located and home-to-work commuting patterns.Metropolitan areas are labor market areas and should be the presumptive “regions” for SustainableCommunities planning.
In the USA there are now 348 free-standing Metropolitan Statistical Areas and 29 MetropolitanDivisions within 11 mega-Metropolitan Statistical Areas – in practicality, a total of 377 metropoli-tan areas. In addition, in 2003 the federal Office of Management and Budget created the new cat-egory of Micropolitan Statistical Areas, which now number 574. Eighty-four (84) percent of theUSA’s population lives within the 377 metropolitan areas with another 10 percent living in the574 micropolitan areas.
Yet few federal grant-in-aid programs are organized on a regional basis. Political pressures con-stantly favor focusing on smaller and smaller target areas. Governors discourage bi-stateprograms.7 Mayors lobby for programs (under their direct control)just for their cities. Neighborhood leaders demand programs(under the control of community non-profit boards) just for theirneighborhoods. With few exceptions, federal programs have prac-ticed anti-regionalism for four decades.
The Livable Communities Act of 2009, sponsored by SenatorChris Dodd, leaves the door open to the possibility of manygrantees being sub-regional in scope by defining the geographicscope of a “livable community” as a “metropolitan area, urban,suburban, rural, or neighborhood community.” The politics oflocalism (right down to the neighborhood level) have constantly diverted federal programs from aregional focus to a much narrower geographic focus (e.g. a city, a suburban county, a city neigh-borhood or set of neighborhoods, etc.). Such has been true particularly of HUD programs.
Alternative of urbanized area coverage: By definition, Metropolitan Statistical Areas (MSAs) arecomposed of entire counties linked by commuter patterns. MSAs can be substantially larger thanthe urbanized areas (UZAs) within them and can contain large rural areas. For example, in 2000,the Minneapolis-St Paul urbanized area covered 894 sq. mi. with 2,388,593 residents, whereas theMinneapolis-St. Paul MN-WI Metropolitan Statistical Area covered eleven counties with2,968,806 residents living within 6,064 sq. mi. The jurisdiction of the Metropolitan Council(which is also the region’s Metropolitan Planning Organization) covered seven counties with2,642,056 residents in their 2,813 sq. mi. In practical effect, though not truly “metropolitan” inscope, the Metropolitan Council’s jurisdiction embraced the entire urbanized area. Urbanizedareas are effectively the regional framework for “the geography of opportunity.”
7 There are 48 bi-state or multi-state Metropolitan Statistical Areas and Metropolitan Divisions.
With few exceptions, federal
programs havepracticed
anti-regionalismfor four decades.
Building Sustainable, Inclusive Communities 5
Urbanized areas are acceptable alternative regions for Sustainable Communities planning. Indeed,for some regions, urbanized areas may be more suitable than metropolitan areas since multi-juris-dictional bodies organized on a metropolitan-wide basis may give disproportionate weight to exur-ban communities with only tenuous ties to the region to the detriment of fair representation ofcore communities.
Mandatory inclusion of principal city and first suburbs: Programs clearly calling for multi-municipal or “regional” planning can operate to the exclusion of central cities. In Pennsylvania, forexample, 10,000 Friends of Pennsylvania surveyed 88 instances of voluntary multi-municipal landuse planning encouraged by state law. Analyzing their data base, we found that8
■ No suburban municipalities are planning jointly with their central city in the six largest metro-politan areas. In fact, out of Pennsylvania’s 15 metropolitan areas, the only place where cen-tral city-suburban joint land use planning is being implemented is (not surprisingly) StateCollege, where State College borough and five adjacent townships have adopted a regionalcomprehensive plan.
■ There is little or no joint planning involving both outer-suburbs and inner-ring boroughs andmore “built-out” inner townships.
■ Joint planning seems to be the exclusive practice of outer-ring and rural townships and the bor-oughs they enclose.
■ With few exceptions – and in sharp contrast to their central cities – the residents of joint plan-ning municipalities are almost exclusively non-Hispanic whites. Of the 36 joint planning areas,32 are 92 percent to 99 percent non-Hispanic white.
■ With the exception of Pittsburgh’s suburbs (and some of Erie’s suburbs), all joint planningcommunities have much higher average incomes and much lower poverty rates than their centralcities.
A second survey of Pennsylvania’s multi-municipal land use planning grants (in the same reportcited above) found the same pattern and concluded that
■ Among the eight major metro areas, there are no instances of suburban municipalities planning jointly with their central cities nor, it appears, with inner-ring suburbs.
■ Though, by definition, county comprehensive plans would cover central cities and inner-ringsuburbs, in 10,000 Friends’ phrase, county plans “are advisory only and much ignored.”
■ In short, at best, collaborative land use planning in Pennsylvania is the province of suburban-izing townships interested primarily in “greenfields” development with an element of farm-land and open space preservation added in some regions with a strong environmentalconcern. There is little counterbalancing commitment to “brownfields” redevelopmentamong those engaged in multi-municipal planning because the “brownfields” communitiesare not part of the multi-municipal consortia.
8 David Rusk, “ ‘Little Boxes,’ Limited Horizons: a Study of Fragmented Local Governance in Pennsylvania: ItsScope, Consequences, and Reforms,” The Brookings Institution (December 2003)
6 POVERTY & RACE RESEARCH ACTION COUNCIL
Many local governments will be far more attracted to SCI’s environmental goals than SCI’s socialopportunity goals. To avoid such exclusionary practices as cited above, any non-rural action areamust be required to cover all of a region’s urbanized area, including its central city (now called“principal city” by the federal OMB) and immediate suburbs.
HUD’s initial request for comment on the Sustainable Communities program assumed that plan-ning grants awarded will be regional in scope without ever defining “what is a region?” This willbe one of the more critical decisions HUD, DOT, and EPA face in shaping the new initiative. Weurge the three Partners for Sustainable Communities to resist pressures to collapse the program toless than regional scale – that is, demand metropolitan, micropolitan, or urbanized area coveragewith full inclusion of principal cities and first suburbs.
Sustainable Communities planning must embrace both a region’s high opportunity areas and itslow opportunity areas. To assist high opportunity areas alone (as Pennsylvania’s multi-municipalplanning incentives did) is to perpetuate opportunity without diversity. To target low opportunityareas alone (as so many federal community development programs have) is to perpetuate diversitywithout opportunity.
Building Sustainable, Inclusive Communities 7
COMMENTARY NO.2 Eligible Grantees
The recipient of an SCI Planning Grant must be a governmental unit (such as
a county for single-county regions), or consortium of governmental units
(such as a Metropolitan Planning Organization or Council of Governments) or,
in the absence of interested local governments, a state agency – in short, public
bodies that control development policy (land use, commercial and industrial
development, housing, transportation and other infrastructure, etc.)
within a region.
“Public policy dictates where development occurs.” That blunt statement by the NationalAssociation of Home Builders (surely no fans of governmental regulation) emphasizes the factthat, exercising planning and zoning authority delegated to them by state law, it is local govern-ments that lay down the template for the “geography of opportunity.”
The initial notice for the SCI program9 suggested that “HUD is considering as an eligible entity amulti-jurisdictional and multi-sector partnership consisting of a consortium of units of general localgovernment and all governmental, civic, philanthropic and business entities with a responsibility forimplementing a Regional Plan for Sustainable Development [emphasis added].”
That sounds like the classic formula for the typical community visioning exercise that, in our expe-rience, results in pap and mush.
SCI is a pilot program whose grants should strengthen a limited number of local governments orconsortia of local governments that are cutting-edge practitioners of effective regional planning.SCI planning grants must result in tangible public policies and actions that reflect hard choicesbeing made by public officials about what gets built where for whose benefit. They must furtherdevelop best practices that, hopefully, result in their steady (if slow) adoption by other state andlocal governments and, equally hopefully, their speedier adoption by the Congress and federalagencies as conditions for federal grants-in-aid.
Certainly, there are important roles for “civic, philanthropic and business entities” in achievingSCI’s goals. Civic groups, particularly regional grassroots coalitions, pressure governmental agen-cies into enacting progressive social justice and environmental plans and policies. Philanthropicfoundations often provide seed money for innovative initiatives but, more importantly, financiallysupport private, non-profit advocacy organizations. “Business,” of course, is the source of com-mercial, industrial, and residential investment (though “business” acts through myriad individualbusinesses; business organizations themselves, such as chambers of commerce, rarely commandsignificant financial resources).
9 “Sustainable Communities Planning Grant Program Advance Notice and Request for Comment [Docket No.FR-5396-N-01]”
8 POVERTY & RACE RESEARCH ACTION COUNCIL
But, in our experience, to vest direct responsibility for SCI planning grants in ad hoc, amorphous,amalgamations of public and private groups is to diffuse governmental accountability and dilutethe final product. Our guiding principle is that a region’s local elected officials should be clearlyaccountable for integrated regional planning for transportation, housing and community develop-ment, and environmental protection. Local governments, or consortia of local governments,that substantially cover metropolitan, micropolitan, or urbanized areas should be the eligi-ble grantees.
Realistically, the Office of Sustainable Housing and Communities can make only 30 to 40 plan-ning grants with its initial $100 million appropriation. The selection criterion must be to developpilot programs that can be replicated much more widely. What types of governmental grantees arefeasible alternatives at different regional scales and levels of complexity?
Metropolitan Planning Organizations: Though specialized regional infrastructure-based agen-cies are common (e.g. airport authorities, water utilities, etc.), there are almost no general, multi-purpose structures for regional governance. “Metropolitan Planning Organizations (MPOs)” arethe notable exception.
Since 1962, federal law has required that transportation planning processes be organized anddirected for all urbanized areas10 by MPOs. In 1991, ISTEA substantially increased the role oflocal governments in MPOs and provided them with more flexibility in allocating federal trans-portation funds (a process that has continued under TEA-21 in 1997 and SAFETEA-LU in2005). MPOs are established for a “metropolitan planning area” that must contain, at a mini-mum, the Census Bureau defined “urbanized area” (UZA) and the area expected to becomeurbanized in the next 20 years. The metropolitan planning area may extend to the Office ofManagement and Budget (OMB) defined metropolitan statistical area (MSA).11 There are cur-rently 342 designated MPOs for 484 UZAs (based on Census 2000) which cover just over 2% ofthe nation’s land area.
MPOs should be the presumptive recipients of pilot SCI grants as they are the only extantregional governance institutions in most metropolitan regions. Moreover, desirably, MPOsshould play a central role in planning for the use of a wide range of federal grant programsfrom multiple federal agencies.
10 A UZA is a compact area that is entirely urban in character, defined as a contiguous area with more than50,000 people and with a population density greater than 1,000 persons per square mile. The area that meetsthe density definition is included in the boundary of the UZA, regardless of political boundaries. The “buildingblock” of a UZA is the census block group, which can be as small as one acre. Because the level of analysis isso small, UZAs are often irregular in shape. Further, UZAs pay no attention to political boundaries. Two UZAscannot share a border, because such a condition would result in a single contiguous geographic unit.
11 Counties serve as the building blocks of MSAs. In order to be designated an MSA, the region must have atleast one UZA to serve as the core of the MSA. The county that contains the UZA is called the “core county”of the MSA. Additional “outlying counties” that have high degrees of economic or social integration with thecore are added to the MSA. Outlying counties qualify for inclusion in the MSA if a) more than 25% of the em-ployed residents commute to the core county; or b) more than 25% of the jobs in the outlying county are heldby residents of the core county. The boundary of an MSA is coterminous with the county boundaries that qual-ify for inclusion. Therefore, it is common for land area that is rural in appearance and character to be includedin the MSA.
Building Sustainable, Inclusive Communities 9
However, there are two principal drawbacks to such reliance on MPOs. First, on many MPO gov-erning boards, cities and first suburbs are significantly under-represented. (This is addressed byrecommendation #3.) Second, almost half of MPOs are exclusively transportation planning agen-cies.12 In some cases, MPOs are basically bureaucratic extensions of state highway departments.Moreover, even within many regional organizations with broader missions (e.g. councils of gov-ernments, regional planning commissions, etc.), with the largesse provided by USDOT, trans-portation planning overwhelms other activities.
In such circumstances, it may be difficult to integrate transportation, housing/land use, and envi-ronmental planning within a “highway engineer’s culture.” In some cases, better integration oftransportation, housing/land use and environmental planning may be facilitated by awarding SCIplanning grants to general purpose governments, such as county governments in single-countyregions, or dominant, “elastic” city governments where such cities represent more than three-
quarters of the urbanized area’s popula-tion (and when they can continue toexpand through annexation). We’ll exam-ine these alternatives at different regionalscales.
Very large scale regions of 1,000,000or more populations: In 2008 therewere 64 metropolitan areas (either MSAsor metropolitan districts) of 1,000,000or more residents; eight were single-county MSAs where their county govern-ments could conceivably serve as SCIplanning grant recipients.13 In 2000,within these 64 MSAs were nestled 37
urbanized areas of 1,000,000 or more residents; to the eight listed above, Phoenix/MaricopaCounty and San Jose/Santa Clara County can be added as urbanized areas completely containedwithin a single county. In these 37 large urbanized areas only one principal city (San Antonio) rep-resents over three-quarters of its urbanized area.
Thus, for such very large regions, with the possible exception of the county governments and theCity of San Antonio (or Bexar County) in these eleven Western regions, MPOs are the only feasi-ble grantees for SCI planning grants.
■ Large regions of 500,000 to 1,000,000: The alternatives are somewhat more diverse at thisscale. Thirteen (13) of 54 metro areas are single county- regions while out of 34 urbanizedareas four “elastic cities” dominate their regions.
12 At least, based on their organizational names, 160 out of 342 MPOs are either designated as “MPO,” “Trans-portation Planning Council,” “Area Transportation Study,” “Transportation Council,” or similar transportation-linked nomenclature.
13 Los Angeles, San Diego, Anaheim-Santa Ana/Orange County, Miami-Dade, Fort Lauderdale/Broward County ,(West) Palm Beach County, Tucson/Pima County, and Las Vegas/Clark County.
10 POVERTY & RACE RESEARCH ACTION COUNCIL
■ Medium regions of 250,000 to 500,000: As regional population size decreases, the domi-nance of “Big Box” government increases. Twenty-seven (27) of 75 metro areas are single-county, while in the 53 medium-size urbanized areas of this population range six (6) elasticcities are dominant.
■ Small regions of 100,000 to 250,000: Almost half of the metro areas (82 of 166) are single-county regions at this population scale, while more than one-fifth of core cities (25)dominate the 119 urbanized areas.
■ Very small regions of 50,000 to 100,000: Almost three-quarters of these regions (17 of25) are single-county areas, while one-third of urbanized areas on this scale (55 of 168) havedominant “elastic” cities.
■ Micropolitan areas (less than 50,000): Micropolitan area designation is a new creation ofthe federal government. Micropolitan areas are too small to qualify for urbanized area desig-nation or to be required to have an MPO (though some undoubtedly have regional planningbodies). However, of the 574 micropolitan areas, ninety percent (517) are single-countyregions.14
Achieving a balance mix of SCI planning grants: HUD-DOT-EPA should seek to achieve amix of grantees with an eye to the size of each model grantee’s potential universe of similarregions for replication.
For very large regions (with few potential alternatives as noted), MPOs should be the presumptivegrantees – for example, the Delaware Valley Regional Planning Commission (Philadelphia-Camden PA-NJ), a bi-state region (of which there are 48), and the Capitol Region Council ofGovernments (Hartford CT), a state where county government does not exist (characteristic ofNew England). Portland Metro (OR) is the USA’s leader in combining effective transportationand land use planning and has the nation’s only directly elected regional government, (therebymeeting our test of proportional representation for city and first suburb residents).
By contrast, we anticipate that the Baltimore Metropolitan Council (BMC), though the region’sMPO, may not be a suitable lead applicant; its board, composed of seven mayors and county executives/commission chairs, have adopted a policy that the BMC will not engage in anything“controversial.” By its very nature, an SCI grant must involve the organization in controversialplans and policies. Building One America and BRIDGE have proposed that the MarylandDepartment of Planning and the Maryland Department of Housing take the lead in submitting an SCI application in Maryland.
Having a state agency perform such functions is hardly unprecedented. The Twin CitiesMetropolitan Council has a 17-member board appointed solely by the governor and confirmed bythe state senate; though the Met Council has strong local roots, it is, ultimately, a state agency.15
14 Forty-one (41) micropolitan regions share two counties, 14 have three counties, and there are two four-countyregions.
15 It is important to emphasize that, if culturally, local governments are creatures of the people, constitutionallylocal governments are creatures of state government. Increasingly, many states are asserted their ultimate au-thority in matters of land use planning, environmental protection, and housing policy.
Building Sustainable, Inclusive Communities 11
County government becomes a more feasible alternative grantee as regions become progressivelysmaller. County governments vary greatly in their powers, particularly depending on whether theyare located in a “little boxes” state or a “Big Box” state.16 However, Lancaster County PA (whoseplanning commission is the region’s MPO) is an outstanding example of a county that has demon-strated great leadership with regard to its 60 constituent municipalities even in a “little boxes”state with limited formal county powers over land use planning. Under Washington State’sGrowth Management Act, King County has provided effective leadership in regional land useplanning within a “Big Box” state.
Large “elastic” cities often shape development patterns even beyond their formal borders. TheCity of Albuquerque and Bernalillo County (New Mexico) have adopted a comprehensive landuse plan and a methodology for the city to exercise extraterritorial planning jurisdiction. The Cityof Springfield and Clarke County (Ohio) would be another excellent example of joint city-countycollaboration. Short of formal city-county consolidation, the City of Charlotte-MecklenburgCounty represents the ultimate in collaborative planning, having not only a jointly adopted com-prehensive plan and a joint planning department but a jointly appointed planning commission forthe two governments.
Thus, the three federal Partners for Sustainable Communities have many governmental alterna-tives that can serve as regional bodies to integrate transportation, housing, and environmental protection planning.
16 In “little boxes” regions (Northeast and Midwest) multiple municipal governments (cities; boroughs and vil-lages; towns and townships) completely divide up each state. In most “little boxes”states cities have not an-nexed new land for decades. (These are “inelastic cities.”) County governments are typically comparativelyweak or even non-existent (Connecticut and Rhode Island). County governments have no zoning powerswhatsoever throughout New England, New Jersey, New York, and Pennsylvania. In the Midwest, county zon-ing powers range from essentially non-existent (e.g. Ohio and Michigan) to substantial (Indiana).
In “Big Box” regions (South and West), towns and townships have never existed. Municipalities are onlyformed where more intensive urbanization occurs. Surrounded by unincorporated land, cities typically annexnew development. (These are “elastic cities.”) County government is the general purpose local governmentfor all unincorporated areas (which can have substantial populations). County governments can have extensiveland use planning and zoning powers (though some states have been very limiting in their delegation of au-thority to county governments).
12 POVERTY & RACE RESEARCH ACTION COUNCIL
COMMENTARY NO.3 MPO Reform
There must be proportional representation on a Sustainable Communities
grant recipient’s governing body of the residents of principal cities and first
suburbs (where minorities and low-income households are typically
concentrated); or failing that test, an SCI grant recipient must establish
a decision-making substructure that achieves proportional representation.
As explained in the prior chapter, MPOs are inescapably the presumptive SCI planning grantrecipients for most very large and large metropolitan areas. However, few MPOs now meet threebasic democratic standards: 1) proportional representation of the people to be served, 2) demo-cratic accountability, and 3) sufficient power to not only develop but to enforce implementation of integrated regional transportation, housing and community development, and environmentalprotection plans.
To fully achieve the Sustainable Community Initiative’s goals, many MPOs must be reformed.The best analysis and recommendations for reforming MPOs has been developed by the Instituteon Race and Poverty, a founding member of Building One America.17
Reforming the nation’s 384 MPOs will be primarily the task of the Surface TransportationReauthorization Act. However, as a joint pilot program of HUD, DOT, and EPA, the federalpartnership should maximize SCI’s inducements with the goal of nurturing the evolution ofbroadly-empowered institutions of effective regional governance.
There is only one MPO for a multi-county region that meets our criteria for effective regional gov-ernance: Portland Metro, the USA’s only directly-elected regional government.18
The product of almost four decades of creative experimentation by the citizenry of the Portlandarea and the Oregon state legislature, Portland Metro’s jurisdiction covers the entire 400-sq. mi.Oregon portion of the Portland-Vancouver OR-WA urbanized area with more than 1.5 millionpeople living in three counties and 25 cities. It is governed by the Metro Council which consists ofa president who is elected region-wide and six councilors who are elected by district every fouryears in nonpartisan races. (Because the 1.5 million person region is divided into six co-equal districts of roughly 250,000 residents each, all residents are proportionately represented.)
The Metro Council provides leadership from a regional perspective, having been elected not as offi-cials of individual municipalities but as metro councilors. Their broader perspective complements
17 Myron Orfield and Baris Gumus-Dawes. MPO Reform: A National Agenda for Reforming Metropolitan Governance. Institute on Race and Poverty at the University of Minnesota (2009)[www.irpumn.org/uls/resources/projects/MPO_Reform_A_National_Agenda.pdf ]
18 Almost. The authority of Portland Metro does not extend to the Vancouver WA portion of the region althoughthe Washington Growth Management Act closely parallels Oregon land use law.
Building Sustainable, Inclusive Communities 13
Metro’s broad powers for integrating land use, housing, transportation, and environmental plan-ning (conferred both under federal and state law and by its citizen-approved home rule charter.)19
Citizens clearly know who is responsible for the major decisions shaping the Portland region’sgrowth and quality of life (Metro council members) and how they come to occupy such key roles
(We the People elect them). Candidates for the Metro Councilmust campaign on land use and transportation planning issues. Asa result, in our experience, the quality of informed public debateand the level of citizen engagement in Smart Growth issues are atleast an order of magnitude greater in metro Portland than in anyother region in the country.
Another notable and successful institution of multi-county regionalgovernance is the Metropolitan Council of the Twin Cities region,covering seven counties and 188 municipalities. The “MetCouncil” (the region’s MPO) meets only two of our three criteria:
■ It meets the test of proportional representation. Established bythe Minnesota legislature in 1967, the Met Council is composedof a chairman and 16 members representing 16 districts of roughlyequal population into which the region is divided; thus, it meetsthe test of proportional representation.
■ It has sufficient regional powers. The Met Council develops, incooperation with local communities, a Regional Development Framework that is a set of poli-cies to guide the efficient growth of the region, including plans for regional systems (trans-portation, airports, regional parks, and water resources). Beyond its planning powers(including ordinance making), with its $750 million annual budget, it manages major systemsthat assure that its plans will be implemented.20 Finally, though substantially self-executing byterms of its legislative authorization, the USA’s most significant regional tax base sharing planis monitored by the Met Council.
■ However, the Met Council does not meet the test of democratic accountability. The MetCouncil members, including the chair, are appointed by the governor and confirmed by thestate senate. Ultimately, Met Council members are accountable to the governor and not tothe citizens; Met Council members reflect that governor’s politics and philosophy towardsregional governance.21 In effect, the Met Council is a state agency – a fact recognized by an
19 Metro also operates two regional garbage and recycling centers and the several regional facilities: the OregonZoo, the Oregon Convention Center, the Portland Center for the Performing Arts and the Portland Metropoli-tan Exposition Center.
20 Examples are the regional transit system (providing 250,000 bus and rail rides daily), the regional wastewatersystem (collecting and treating 250 million gallons of wastewater daily), the regional system of parks and trails(54,000 acres in all), and region-wide allocation of affordable housing (6,600 units).
21 In 1999, as a Minnesota State Representative, Myron Orfield successfully passed a bill to convert the MetCouncil from a governor-appointed body to a regional governing board directly elected by the citizens of theseven-county region. However, the bill was vetoed by Governor Arne Carlson.
the quality of informed public debate and thelevel of citizen engagement inSmart Growth is-sues are at least anorder of magnitudegreater in metroPortland than inany other region…
14 POVERTY & RACE RESEARCH ACTION COUNCIL
entry on its webpage that notes “Along with 22 other Cabinet-level departments [emphasisadded], the Council was asked by the Governor to identify its priority goals and develop per-formance indicators to measure progress toward achieving these goals.”
The impact of effective regional governance can be clearly seen. Both the Portland andMinneapolis-St Paul regions experience:
■ less sprawl (growth of urbanized land vs. urbanized population from 1970 to 2000);
■ less racial segregation (dissimilarity indices in 2000);
■ greater employment growth (from 1990 to 2006); and
■ lower intra-municipal fiscal disparities (Gini coefficient in 2001)
than other large metropolitan areas with comparable degrees of municipal-level governmentalfragmentation – but regions without the overlay of Portland and the Twin Cities’ regional gover-nance institutions.
Achieving proportional representation will require substantial revision of current MPO governingbodies. State transportation and other state agency officials will have to assume purely advisoryroles. New municipal level members may need to be added to achieve proportional representation.County officials might exercise proportional voting powers for balance-of-county populationswithout municipal representatives.
Indeed, experimenting with selected county governments as SCI planning grant sponsors andbringing the current MPO structure formally within the county government structure (if inde-pendent of county government) may be the most promising way to integrate transportation, landuse, and environmental planning in the long run – at least in many mid-sized and smaller regions.
While only one-fifth (21 of 118) of metro areas of more than 500,000 people are single-countymetro areas, almost half (126 of 266) of smaller metro areas are single-county regions – as are 90percent (517 of 574) of micropolitan areas.
That means that in over two-thirds of the USA’s urban regions (664 of 958) there is already inplace a form of regional government – county government – that is proportionally representa-tive,22 democratically accountable, and, in many cases (but far from all cases), sufficiently empow-ered to be the unifying mechanism for effective regional transportation, land use, andenvironmental planning.23
22 The size of county governing bodies ranges from the widely-typical three-member commission to, for example,Oneida County, NY, whose board of legislators numbers 29. There is a slow but steady trend towards adoptingthe elected county executive/multi-member county legislature model as being more representative in grow-ingly diverse counties.
23 Under the laws of 50 states, county government powers range from zero (Connecticut and Rhode Island,where county government has been abolished) to Maryland (where county government is the local govern-ment for over 90 percent of the state’s population).
Building Sustainable, Inclusive Communities 15
In 1950 (that is, prior to the Interstate Highway System), there were 169 metropolitan areas,including 117 single-county metro areas. Collectively, the 169 metropolitan areas covered 300counties.
By 2000, those same 117 erstwhile single-county metropolitan areas collectively covered not 117counties but 369 counties. The full list of 169 metropolitan areas (ca. 1950) covered not 300counties but 732 counties. And, of course, the nation’s growth has brought into being another215 metropolitan areas.
Over the past sixty years, what if regional transportation planning had been driven not by statehighway departments and the Federal Highway Administration but by urban county governments(sometimes, under joint powers agreements with dominant central cities)? Is it not possible thatthe nation’s growth would have been accommodated in a less sprawling, less segregated fashion?
To meet the challenges of the 21st Century, Sustainable Communities planning needs to explorefully the role of county government in integrating regional transportation, land use, and environ-mental planning at appropriate regional scales.
16 POVERTY & RACE RESEARCH ACTION COUNCIL
COMMENTARY NO.4 Community Participation
Sustainable Communities Grants must include a plan for
meaningful citizen involvement in the planning process, including
the involvement of regional opportunity advocacy organizations.
Overcoming entrenched traditions of excessive localism, laissez faire property rights, and the carculture to achieve Smart Growth is tough.
Overcoming deep seated fears and stereotypes embedded in America’s racial and class divisions toachieve Fair Growth is even tougher.
Truly “changing the rules of the game” requires a combination of visionary and courageous lead-ership by key elected officials serving as a reform’s champions and a strong, focused, mobilizedgrassroots constituency in order to broaden public understanding, recruit additional supportamong other elected officials, and strengthen reform champions’ resolve at critical junctures. Andthen to keep defending “victory” after it has been “won.”
The story is told of President Franklin Delano Roosevelt meeting with his New Deal brain trustaround some contentious issue. “All right,” FDR finally said. “I’m convinced. Now go out andpublicly force me to do it.”
That is precisely the challenge the Sustainable Communities Initiative faces if it is to avoid fallingfar short of its vision. What is lacking is not sufficient “best practices” policy tools. What is lackingis the political will to use them.
Building One America and its partners have advocated that independent funding be providedgrassroots organizing and advocacy groups that are committed to inclusive regional housingopportunity and smart growth in parallel with the award of SCI Planning Grants to governmentalsponsors. Such funds should not flow through the governmental planning grant recipients them-selves because advocacy organizations have a dual role: to rally support for progressive policies andto serve as “watchbirds.”
Instead, there are three alternatives that would preserve the grassroots advocacy groups’ independ-ence while providing essential support:
■ Direct advocacy grants issued by the Office of Sustainable Housing and Communities (withsignoff from DOT and EPA); or
■ Grants made by a consortium of philanthropic foundations recruited by the federalPartnership for Sustainable Communities; or
■ Grants made by the foundation consortium with their own funds matched by funds from theOffice of Sustainable Housing and Communities.
Building Sustainable, Inclusive Communities 17
To illustrate the concept, two Building One America members, New Jersey Regional Coalition(NJRC) and Southeast Pennsylvania First Suburbs Project (SEPA-FSP) have worked closely withthe Delaware Valley Regional Planning Commission (DVRPC), the MPO for the Philadelphia-Camden PA-NJ region. DVRPC has a forward thinking professional staff and a large board ofdirectors (both members and alternates) composed of seven transportation agency professionals(PennDOT and NJDOT); six other state government officials and gubernatorial appointees; andan elected county commissioner or freeholder and the planning directors from five Pennsylvaniacounties and four New Jersey counties.
From experience, NJRC and SEPA-FSP knows that both state officials and county officials have tobe “encouraged” to adopt region-serving policies when tempted by other, more selfish policiesthat may appear to maximize advantages and opportunities for their state or county as contrastedwith the proposed regional solutions. (Fair share housing is a classic example.)
Thus, achieving the most effective regional comprehensive plan meeting both social opportunityand environmental goals would be greatly aided by companion grants to NJRC and PlanSmartNJ(close allies) and SEPA-FSP and 10,000 Friends of Pennsylvania (also close allies) if the DelawareValley Regional Planning Commission were to be a SCI grantee.
In other regions, if a grassroots regional opportunity coalition is not available, pairing an environ-mental organization with a Fair Housing advocacy group would help assure meeting the essentialbalance between Smart Growth and Fair Growth by the SCI planning grantee.
18 POVERTY & RACE RESEARCH ACTION COUNCIL
COMMENTARY NO.5 Reducing Segregation
A primary goal of Sustainable Communities planning must be the reduction
of racial and economic residential segregation and school segregation and
concentrations of poverty on a regional basis with aggressively affirmatively
furthering fair housing as a fundamental policy; a method must be specified
to document progress in achieving greater racial and economic integration.
Among developed nations the USA has one of the greatest income disparities24 and the highestlevels of racial and economic neighborhood segregation.
The greater “color” problem of new suburban and exurban development is not that it is not greenenough but that it is still too white. The fundamental test of creating livable communities must be“are we going to live together?”
Creating stable communities that are racially, ethnically, and economically integrated must be apriority for the Sustainable Communities Initiative, the Livable Communities Act, and the SurfaceTransportation Reauthorization Act – a goal which the three Cabinet Secretaries have publicly supported.
It is imperative that the Sustainable Communities Initiative explicitly require developing inclusivecommunities particularly in light of the fact that for decades federal policies were primary tools for segregating America’s housing markets. Indeed, it is a moral imperative that any HUD-ledprogram must adopt racial, ethnic, and economic inclusion as its primary goal in light of its disgraceful history of racially exclusionary mortgage policies, racially-motivated location of publichousing projects, etc. for decades.25
Even so, assessing the Sustainable Communities Initiative on the basis of only its environmentalgoals, its “green” goals cannot be substantially achieved without addressing the racial, ethnic, and eco-nomic segregation of our regional housing markets.
One of the Congressional findings set forth in the Livable Communities Act of 2009 is that“During the period between 1980 and 2000, the growth of the largest 99 metropolitan areas inthe continental United States consumed 16,000,000 acres of rural land, or about 1 acre for everynew household [Sec. 2(4)].”
24 Of the thirty member nations of the Organization for Economic Cooperation and Development, only Turkeyand Mexico have higher levels of income disparity; of 126 nations, the United States is tied for the 71st worstincome disparity with Ghana and Turkmenistan.
25 See generally, The Future of Fair Housing: Report of the National Commission on Fair Housing and Equal Opportunity (December 2008) (www.prrac.org/projects/fair_housing_commission/The_Future_of_Fair_Housing.pdf)
Building Sustainable, Inclusive Communities 19
However, we have found that, in the most segregated metro areas, almost twice as much acreagewas consumed per new household as in the least segregated metro areas.”26 “Smart Growth” mustalso be “Fair Growth.”
As best said by Jack Lurie, president of the Michigan Farm Bureau, “To save our farms we mustsave our cities.”
A primary strategy for creating more inclusive communities must be an aggressive and proactiveapproach to “affirmatively furthering fair housing” – a long-standing federal policy that has been“more honour’d in the breech than the observance” by past administrations.27
The next two chapters will address strategies for achieving racially, ethnically, and economicallyintegrated neighborhoods and schools and reduce concentrations of poverty. The balance of thischapter will address how metro areas should measure progress in achieving both more sustainableand racially and economically inclusive communities.
In his report on MPO reform,28 Myron Orfield suggests five measures by which progress can bemeasured:
1) “The effectiveness and sustainability of land use policies – measured by a sprawl index that cal-culates the increase in urbanized land in relation to urbanized population growth;
2) “The fairness of affordable housing distribution in a region – measured by the percentage ofaffordable housing in moderate– and high-opportunity communities;
26 Dividing the largest 99 metro areas into quintiles, from 1980-2000 the most segregated metro areas (Chicago,Cleveland, Hartford, Detroit, Philadelphia, New York-Newark, New Haven, Providence, Springfield (MA),Boston, Rochester (NY), Birmingham, and Houston – averaged 1.35 acres added per new household. Thatcompares with only 0.71 acres added per new household in the least segregated metropolitan areas (Stockton,Raleigh-Durham, Mobile, Columbia, Riverside-San Bernardino, Las Vegas, Knoxville, Greenville-Spartanburg,Charleston, El Paso, Portland (OR), Seattle-Tacoma, Albuquerque, and Honolulu.
Three other highly segregated metro areas actually lost urbanized population, but gained urbanized land –Buffalo-Niagara Falls (plus 101 sq. mi, or 38 percent); Youngstown-Warren (plus 59 sq. mi, or 35 percent); andPittsburgh (plus 139 sq. mi. or 19 percent).
Finally, a dozen metro areas were recorded as having lost urbanized land area – an impossibility since land,once urbanized, never reverts back to its former rural status. However, this data anomaly reflects the CensusBureau’s inconsistent approach to classifying land as urbanized in earlier decades; in many cases, if a munici-pality was partially urbanized, it was tabulated as completely urbanized despite the fact that some centralcities (e.g. Jacksonville, Oklahoma City) had annexed vast, as-yet-undeveloped areas; others had enclosed un-buildable areas within their city limits but they were tabulated as urbanized (e.g. portions of Lake Pontchar-train within New Orleans’ city limits, portions of the Great Dismal Swamp within Virginia City’s) and for othermetro areas the complete jurisdiction of partially urbanized semi-rural townships were counted (e.g. Milwau-kee and Minneapolis-St. Paul). Such distortions were corrected by Census 2000.
The reality is that data collection regarding urbanized areas was very inconsistent in past decades.
27 Recommendations to improve HUD’s performance in affirmatively furthering fair housing were submitted byPRRAC and 22 fair housing and civil rights allies in a statement in July 2009. [www.prrac.org/pdf/AffirmativelyFurtheringFairHousing7-29-09comments.pdf]
28 Previously cited in footnote 14.
20 POVERTY & RACE RESEARCH ACTION COUNCIL
3) “The extent to which a region is racially and economically segregated – measured by tradi-tional measures such as the dissimilarity indices or percentages of low-income people (students) and people (students) of color in segregated neighborhood (school) settings;
4) “The extent to which job growth is clustered to promote multi-modal transportation optionsand transit-oriented development – measured by the percentage of jobs in high-density jobcenters; and
5) “The extent of fiscal inequality in a region – measured by the Gini coefficient for local tax-base.”
Too many indicators often have the shortcoming of being able to be calculated only on the basisof decennial census reports; this is true of measures based on census tracts (that is, neighborhood-level) or in regions with multiple municipalities (many of which are very small) where data are col-lected only every ten years.
This proposed set of indicators, however, draws upon data sources that can be re-calculated peri-odically or even annually to establish trend lines.
1) “Sprawl index” – officially, the Census Bureau tabulates “urbanized land” and “urbanizedpopulation” only every decennial census; however, any MPO or county planning departmentworth its salt maintains GIS systems that track trends in developed land, housing units, etc.Using the urbanized land/urbanized population from Census 2010 (available in mid-2011) asa base level and average persons per new housing unit, an SCI grantee will be able to updatethe “sprawl index” annually;
2) “Opportunity-based housing index” – using a methodology such as discussed in our com-mentary on recommendation #6, an SCI grantee should be required to establish a regionalopportunity map, dividing municipalities (in “little boxes” regions) or census tracts (within“Big Box” regions) into different opportunity levels (jobs, schools, safety, etc.); Census 2010will establish the relative affordability of housing units within each municipality or censustract, and annual residential building permit data will allow the inventory to be updated;
3) “Segregation index” – Though for even the smallest municipalities, the Census Bureau providesannual population estimates, it does not break down its population estimates by race and ethnic-ity; thus, measures such as census tract-based racial and economic residential segregation indices(i.e. dissimilarity indices) can only be updated every ten years. However, public elementary schoolenrollment data can be used not only to calculate annual school segregation indices but can serve asa reasonable proxy for residential segregation trends. Public elementary school enrollment dataclassifies pupils by six racial/ethnic categories and into two or three economic classifications (i.e.those qualifying for fully subsidized meals, those qualifying for partially subsidized meals, andthose not qualifying for subsidized meals29). Except where federal courts or school boards volun-
29 Family income standards for Free And Reduced-price Meals (FARM) are uniform nationally and are based onthe annual poverty threshold ($22,050 for a four-person family in 2009-10). To qualify for fully subsidizedschool meals, up to 130 percent of the federal poverty level (or up to $28,665 in 2009-10); to qualify for par-tially subsidized school meals, up to 185 percent (or $40,793). Since FARM income standards do not vary ac-cording to differences in regional cost-of-living, FARM is understated in high average income (but high livingcost) regions and overstated in low income (but also low living cost) regions. Thus, for example, in 2009-10the FARM eligibility cutoff represented only 40 percent of the San Jose CA Area Median Income ($102,500),the USA’s highest income metro area, but was 127 percent of the McAllen-Edinburgh-Mission TX Area MedianIncome ($32,000), the USA’s lowest income metro area. But real incomes in San Jose were not three timesgreater than in McAllen, because in 2000 the difference in housing costs was so much greater (median home
Building Sustainable, Inclusive Communities 21
tarily have implemented racial or economic desegregation plans, schoolsegregation indices track residentialsegregation indices quite well.30
4) “Job clustering index” – Moststate labor departments provideannual information about joblocation by municipality; if not,the Census Bureau’s CountyBusiness Patterns does so annuallyby ZIP code that can serve as areasonable (if less geographicallyprecise) measure of job distribu-tion. Such information can beused to measure comparativetrends in job clustering and jobdispersion.
5) “Fiscal disparities index” – Thegoal is to determine the assessedvaluation of property per capita bylocal governmental unit (munici-pality or county) and measure rela-tive disparities in property taxresources available (on which localgovernments rely in many states astheir primary revenue source).
State government websites provides assessed valuation for all governmental jurisdictions annu-ally; the Census Bureau updates annual population estimates for every local jurisdiction. AGini index is a measure of the average degree of departure from an absolutely equal distribu-tion of assessed valuation per capita among local governments. A Gini index value of 1 wouldmean that one jurisdiction contains all a region’s property wealth while an index value of 0would mean that property tax wealth is evenly distributed among all jurisdictions.31
There are certainly other available metrics to measure an SCI planning grant region’s progresstowards becoming a more sustainable, inclusive region. However, we commend these measures tothe Partnership for Sustainable Communities.
value: San Jose $446,400 v. McAllen $52,400 – more than eight times higher – and median gross monthlyrent: San Jose $1,185 v McAllen $401 – almost three times higher).
30 For example, in Census 2000, the Detroit PMSA’s black-white segregation index (all age groups) was 84.7, theUSA’s highest (100 = total apartheid); for 18 and under, 85.7 (worst); and for elementary schools, 88.5 (worst).The economic residential segregation index was 44.8 (6th worst) and the economic school segregation indexwas 64.2 (5th worst). Nationwide, 89 percent of all elementary school age children are enrolled in public ele-mentary schools with very little variation from the national average among metropolitan areas.
31 In 2001 the Fiscal Disparities index for metro Cincinnati, the USA’s worst among the 25 largest metro areas,was 45. With its regional tax base sharing program, the Twin Cities region’s index was 17 (one third below aprojected value of 26 based on the region’s level of municipal fragmentation). With its effective regional landuse and transportation planning, metro Portland’s index was 11 (half of its projected level of 22), the USA’sbest along with metro San Diego, the 2nd most governmentally unified among the 25 largest regions.
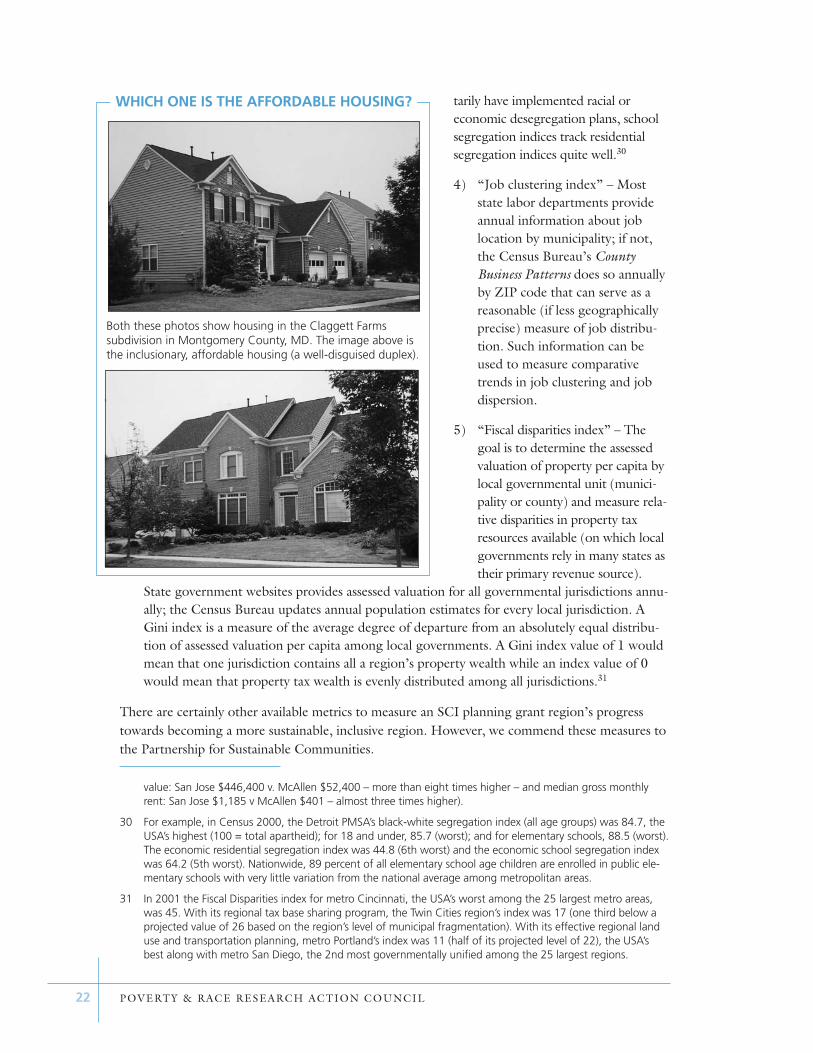
WHICH ONE IS THE AFFORDABLE HOUSING?
Both these photos show housing in the Claggett Farms subdivision in Montgomery County, MD. The image above isthe inclusionary, affordable housing (a well-disguised duplex).
22 POVERTY & RACE RESEARCH ACTION COUNCIL
COMMENTARY NO.6 Regional Opportunity Mapping
Using one of several methodologies provided by the Office of Sustainable
Housing and Communities, grant recipients must conduct a regional
opportunity assessment that measures relative opportunity (jobs, schools,
local services, safety) by municipality or census tract.
For decades the primary goal of federal housing policy has been simply providing affordable shelter.Far too often, federal housing programs have consigned low-income families, particularly Black andLatino families, to low-opportunity ghettoes and barrios from which few emerge to lead better lives.
During those same decades, federal transportation policies have greatly subsidized suburbansprawl, resulting in what former Rochester mayor Bill Johnson, former Urban League executive,memorably described as “relentlessly re-locating true opportunity beyond our reach.”
SCI must embrace an “opportunity-based housing strategy.” Opportunity-based housing empha-sizes locating low-income families from low-opportunity communities into affordable housing inhigh-opportunity communities providing
■ access to a growing supply of good jobs;
■ access to high-performance schools; and
■ access to high quality local government services
that are within safe, low-crime neighborhoods that are not racially, ethnically nor economicallysegregated from mainstream society.
To implement such a strategy requires developing regional opportunity maps. The KirwanInstitute has pioneered such mapping for metro Baltimore and at least half a dozen states.32 TheUrban Institute and the Furman Center for Real Estate and Urban Policy at New York Universityhave done so for metro Seattle and metro New York. The mapping exercises reflect somewhat dif-ferent methodologies. In New Jersey, the New Jersey Regional Coalition, Fair Share HousingCenter, and the Innovative Housing Institute collaborated on a similar statewide report.
For the Baltimore, Seattle and New York studies, the Kirwan Institute and the Urban Institute/NYUadopted census tracts as the analytic unit. This is certainly appropriate for “Big Box” regions likeSeattle and, especially Baltimore. However, it is important to utilize data sources that can be keptcurrent rather than rely on decennial census data so that year-to-year trends can be measured.33
32 See The Geography of Opportunity: Review of Opportunity Mapping Initiatives (Kirwan Institute, July 2008).
33 The Urban Institute/NYU study utilized annual reports on percentage FARM pupils and percentage passingstate reading and math proficiency exams to measure educational opportunity; annual FBI crime index reportsto measure neighborhood safety; numbers of jobs at AA degree level within 5 miles from periodic Census ZIPbusiness patterns and BLS occupational training surveys to measure economic opportunity; and periodic datafrom the EPA Toxic Release Inventory and National Air Toxics Assessment to measure environmental quality.
Building Sustainable, Inclusive Communities 23
For “little boxes” regions, municipalities are the appropriate scale. For each of the state’s 566municipalities, the New Jersey Municipal Opportunity Index (MOI), for example, tabulates
■ job opportunity as measured by total jobs located in that municipality and growth of jobs overthe past decade;
■ school opportunity as measured by percentage of students qualifying for Free And Reduced-price Meals (FARM) in each municipality’s school district;34
■ quality of municipal services as measured by assessed property valuation per capita;
■ neighborhood safety as measured by the FBI index of overall crimes and of violent crimes per1,000 residents; and
■ a community’s socio-economic status as measured by median family income and familypoverty rate from the most recent census.
For each factor a municipality is ranked against its peers within the appropriate region, as delin-eated by the New Jersey Council on Affordable Housing (COAH). For example, in the three-county Camden region, there are 100 suburban municipalities plus Camden as the central city;thus, the top ranked municipality in terms of total jobs would be ranked #101 and the lowestranked #1. Relatively rankings are then averaged across all five categories to establish an overallMunicipal Opportunity Index within that region.
Finally, ranked from 101 to 1 (for the Camden region)35, the suburban municipalities are dividedinto five groups as nearly co-equal in cumulative population as possible. The groups are then des-ignated as maximum opportunity, high opportunity, medium opportunity, low opportunity, andminimal opportunity plus the central city as a separate category.36
It is important to note that the presence or absence of affordable housing is not one of the factors.Affordable housing is a means to higher opportunity and not an end in itself. Inclusion of afford-able housing as a factor would skew the Municipal Opportunity Index back towards low-opportu-nity municipalities.
This methodology has yielded a very accurate picture of the “geography of opportunity” in NewJersey. The Municipal Opportunity Index should guide implementation of all HUD programswithin New Jersey.
Opportunity mapping must be a central feature of an SCI Planning Grant and housing policiesmust be shaped to expand access of low-income families to high opportunity communities.
34 FARM serves as a highly reliable proxy for school quality because of the very high correlation between FARMand standardized test scores (typically, 0.75 or greater).
35 The number of municipalities in COAH’s six regions range from 68 in Region 6 (Atlantic City) to 122 in Region1 (Jersey City).
36 All New Jersey’s central cities (except rapidly gentrifying Hoboken) would otherwise rank as minimal opportu-nity towns.
24 POVERTY & RACE RESEARCH ACTION COUNCIL
COMMENTARY NO.7 Opportunity-Based Housing
Sustainable Communities planning must include policies and programs
that give low-income residents of low opportunity communities
realistic options to move to high opportunity communities
as well as policies and programs to upgrade the quality of life
in low opportunity communities.
“If the County Council had approved the mandatory inclusionary zoning law,” Howard County(MD) County Executive Charles Ecker37 said, “I would have signed it. I support inclusionary zon-ing. It’s the right thing to do.” (The Howard County Council had recently rejected a proposedmandatory inclusionary zoning ordinance by 3-2 vote.)
Ecker grinned mischievously. “Of course, politically, I would prefer that state or federal law man-date inclusionary zoning. Then I could explain that ‘the Devil made me do it.’”
Through its requirements for an SCI planning grant program and subsequent conforming grants-in-aid (see recommendation #9), the federal Partnership for Sustainable Communities (HUD,DOT, and EPA) must be “the Devil to make them do it.”
This is particularly true with regard to creating racially and economically integrated communities.The color-coded nature of the “geography of opportunity” in met-ropolitan America is no accident. In the post-Civil RightsRevolution era, racial segregation slowly but steadily declinedeverywhere, but economic segregation increased in most regions.Exclusionary zoning became almost synonymous with new subur-ban development. Large lot zoning, costly additional requirementsfor (or even an outright ban on) apartments, and high impact feesgave the appearance of being race neutral but the result was not. Space, not race, has become thenew way of creating the “segregation of opportunity” (john powell). Jim Crow by income replacesJim Crow by race.
In our commentary on recommendation #3 (MPO reform), we noted that Portland Metro is theonly MPO that meets Building One America’s three criteria of proportional representation, demo-cratic accountability, and sufficient powers.
However, we are reminded that even those three conditions are no guarantee that regional gov-ernment will embrace development policies that are both environmentally sustainable and raciallyand economically inclusive. Many elected officials reflect all too well the fears and prejudices oftheir constituents. In much of America there is no more combustible fuel for constituent backlashthan the convergence of race and class.
37 Charles I. Ecker served two terms as county executive (1990-98), the only Republican elected to that post sincethe county executive/county council form of government was adopted in 1969.
Jim Crow by income replaces
Jim Crow by race.
Building Sustainable, Inclusive Communities 25
Inclusionary zoning (IZ) is the antidote for exclusionary zoning. It is an essential strategy for cre-ating a more affordable housing supply in high opportunity communities. Opening up high-opportunity communities requires two conditions. First, there must be suitably priced, availablehousing. Second, there must be a regional mobility counseling program to help low-incomehouseholds move from low-income areas into the opportunity-based housing.
IZ helps meets the first requirement. IZ produces a modest proportion of low-income housingwithout depending on public subsidies; a properly designed IZ law uses density bonuses to coverthe cost of below market-rate, inclusionary housing production.
Though no state has mandated IZ state-wide as yet, over 400 cities and counties have enactedmandatory IZ laws. Some 39 million people – about 13 percent of the nation’s population – livein communities that mandate mixed income development.
Significantly, though, all IZ laws have been enacted in relatively unaffordable housing marketsconcentrated in California, Florida and the East Coast from Washington, DC to Boston, and theDenver and Chicago regions. City councils and county commissions are not motivated to enact IZlaws primarily by concern for social justice and opportunity for the poor; they are moved to actwhen middle class workers/voters encounter increasing difficulty in locating affordable housing.
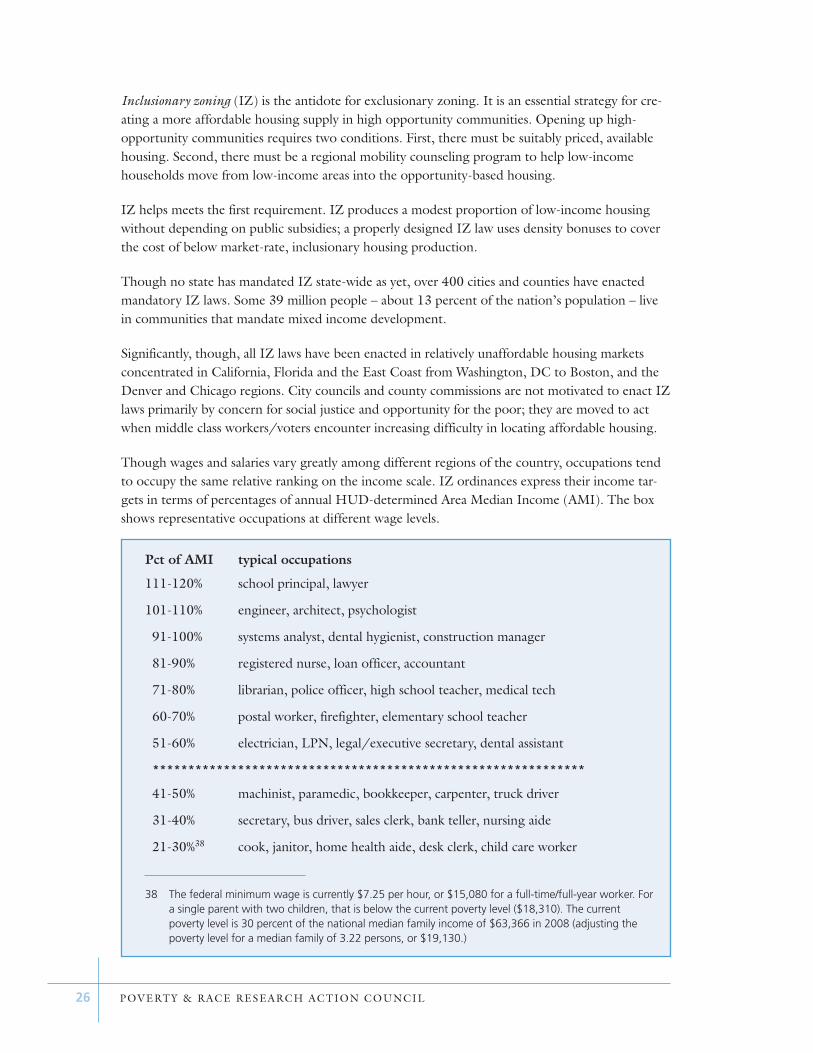
Though wages and salaries vary greatly among different regions of the country, occupations tendto occupy the same relative ranking on the income scale. IZ ordinances express their income tar-gets in terms of percentages of annual HUD-determined Area Median Income (AMI). The boxshows representative occupations at different wage levels.
Pct of AMI typical occupations
111-120% school principal, lawyer
101-110% engineer, architect, psychologist
91-100% systems analyst, dental hygienist, construction manager
81-90% registered nurse, loan officer, accountant
71-80% librarian, police officer, high school teacher, medical tech
60-70% postal worker, firefighter, elementary school teacher
51-60% electrician, LPN, legal/executive secretary, dental assistant
*************************************************************
41-50% machinist, paramedic, bookkeeper, carpenter, truck driver
31-40% secretary, bus driver, sales clerk, bank teller, nursing aide
21-30%38 cook, janitor, home health aide, desk clerk, child care worker
38 The federal minimum wage is currently $7.25 per hour, or $15,080 for a full-time/full-year worker. Fora single parent with two children, that is below the current poverty level ($18,310). The currentpoverty level is 30 percent of the national median family income of $63,366 in 2008 (adjusting thepoverty level for a median family of 3.22 persons, or $19,130.)
26 POVERTY & RACE RESEARCH ACTION COUNCIL
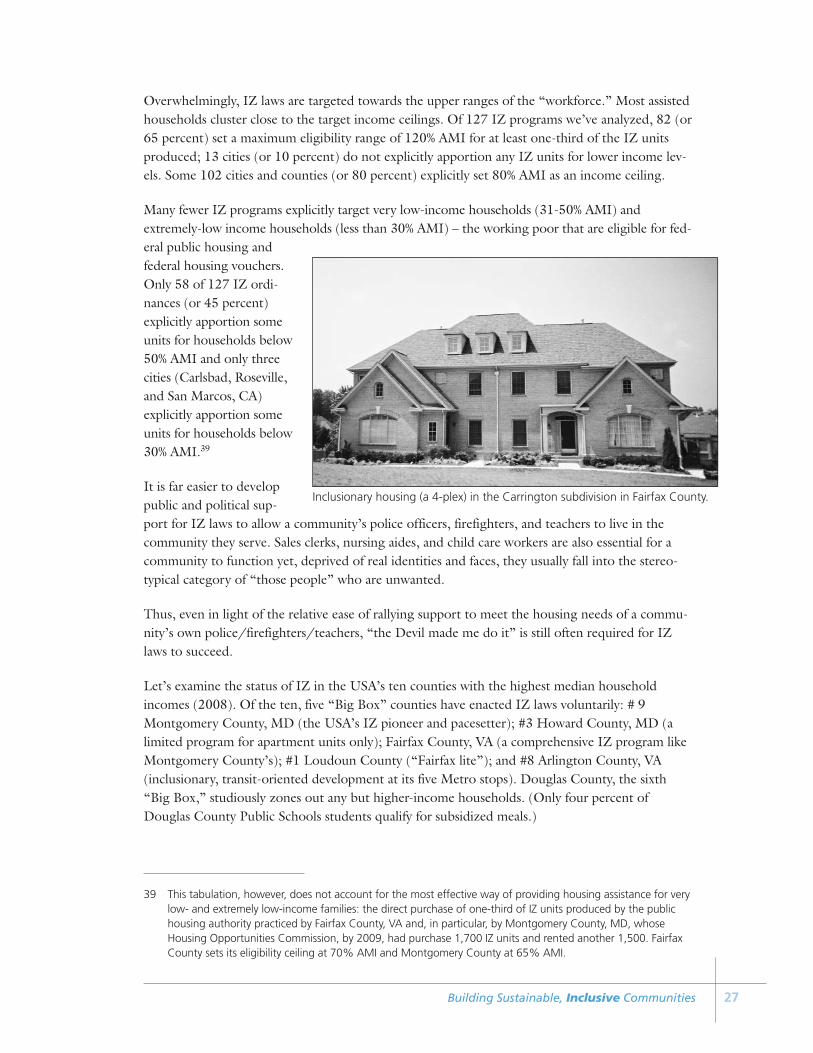
Overwhelmingly, IZ laws are targeted towards the upper ranges of the “workforce.” Most assistedhouseholds cluster close to the target income ceilings. Of 127 IZ programs we’ve analyzed, 82 (or65 percent) set a maximum eligibility range of 120% AMI for at least one-third of the IZ unitsproduced; 13 cities (or 10 percent) do not explicitly apportion any IZ units for lower income lev-els. Some 102 cities and counties (or 80 percent) explicitly set 80% AMI as an income ceiling.
Many fewer IZ programs explicitly target very low-income households (31-50% AMI) andextremely-low income households (less than 30% AMI) – the working poor that are eligible for fed-eral public housing andfederal housing vouchers.Only 58 of 127 IZ ordi-nances (or 45 percent)explicitly apportion someunits for households below50% AMI and only threecities (Carlsbad, Roseville,and San Marcos, CA)explicitly apportion someunits for households below30% AMI.39
It is far easier to developpublic and political sup-port for IZ laws to allow a community’s police officers, firefighters, and teachers to live in thecommunity they serve. Sales clerks, nursing aides, and child care workers are also essential for acommunity to function yet, deprived of real identities and faces, they usually fall into the stereo-typical category of “those people” who are unwanted.
Thus, even in light of the relative ease of rallying support to meet the housing needs of a commu-nity’s own police/firefighters/teachers, “the Devil made me do it” is still often required for IZlaws to succeed.
Let’s examine the status of IZ in the USA’s ten counties with the highest median householdincomes (2008). Of the ten, five “Big Box” counties have enacted IZ laws voluntarily: # 9Montgomery County, MD (the USA’s IZ pioneer and pacesetter); #3 Howard County, MD (alimited program for apartment units only); Fairfax County, VA (a comprehensive IZ program likeMontgomery County’s); #1 Loudoun County (“Fairfax lite”); and #8 Arlington County, VA(inclusionary, transit-oriented development at its five Metro stops). Douglas County, the sixth“Big Box,” studiously zones out any but higher-income households. (Only four percent ofDouglas County Public Schools students qualify for subsidized meals.)
39 This tabulation, however, does not account for the most effective way of providing housing assistance for verylow- and extremely low-income families: the direct purchase of one-third of IZ units produced by the publichousing authority practiced by Fairfax County, VA and, in particular, by Montgomery County, MD, whoseHousing Opportunities Commission, by 2009, had purchase 1,700 IZ units and rented another 1,500. FairfaxCounty sets its eligibility ceiling at 70% AMI and Montgomery County at 65% AMI.
Inclusionary housing (a 4-plex) in the Carrington subdivision in Fairfax County.
Building Sustainable, Inclusive Communities 27
In the four “little boxes” counties, all zoning power is exercised by municipal government; countygovernment has no zoning power. However, in #4 Hunterdon County, #5 Somerset County and#6 Morris County, through its famous Mt Laurel ruling (1975) the New Jersey Supreme Courtordered local governments to build affordable housing to meet their “fair share” of regional hous-ing needs. Many cities, boroughs, and townships have adopted IZ or mixed-income housing poli-cies as part of their (often begrudging) Mt Laurel compliance (12 of 26 municipalities inHunterdon County, 15 of 21 municipalities in Somerset County, and 30 of 34 municipalities in
Morris County).
Finally, fed up with inaction by Long Island’s “little boxes” thatcreated such a workforce housing crisis that it threatened to craterthe Long Island economy, through the Long Island WorkforceHousing Act of 2008, the New York State Legislature mandatedthat all 69 municipalities in #10 Nassau County and all 40 munici-palities in #24 Suffolk County enact state-prescribed IZ ordinances– though the state’s mandated income ceiling is 130% AMI and thelaw clearly targets young professionals and middle-managers (andnot the working poor).
There is a lesson embedded just in this brief review. “Big Box” governments, such as counties with broad land use powers andlarge cities with many diverse neighborhoods, can overcome local-ized NIMBY-ism and enact IZ laws that benefit the larger commu-nity. “Little boxes” governments are typically immobilized by theperceived self-interest of their narrower constituencies.
The federal government, of course, is the biggest “Big Box” thereis – but constitutionally the federal government has no direct regulatory powers over land use planning and zoning; that is a
power reserved to the states (which they, in turn, delegate to local governments – with or withoutSmart Growth-type guidelines and standards).
But the federal government can exercise decisive leverage in fostering sustainable and inclusivecommunities through requirements that could be attached to
a) grants-in aid to state and local governments ($145 billion by HUD, DOT, and EPA in 200940);
b) federally-guaranteed mortgages ($700 billion by FHA in 2009);
c) federal “tax expenditures” (an estimated $214 billion in tax credits for home owners andapartment developers by 201141); and
40 These are on-going grant-in-aid programs and do not include $12.7 billion for HUD, $45.2 billion for DOT, and$6 billion for EPA under the American Recovery and Reinvestment Act of 2009 (the “stimulus” program).
41 This does not include $6.6 billion in first-time homebuyer tax credits and $4.3 billion in tax credits for home-owner energy saving investments under the stimulus program.
“Big Box” govern-ments can over-come localizedNIMBY-ism andenact IZ laws thatbenefit the largercommunity. “Little boxes” gov-ernments are typi-cally immobilizedby the perceivedself-interest of their narrower constituencies.
28 POVERTY & RACE RESEARCH ACTION COUNCIL
d) Fannie Mae42 and Freddie Mac’s43 immense mortgage portfolios.
The Sustainable Communities Initiative should be a laboratory for developing and testing policiesthat would ultimately be attached as conditions to such federal programs that would far exceed thedirect impact of SCI’s $150 million appropriation.
Some of the policies that would create more opportunity-based housing would include:
■ Inclusionary zoning;
■ State or local legislation banning source of income discrimination;44
■ State policies allocating Low Income Housing Tax Credits to family projects in high opportu-nity communities;
■ State policies setting minimum requirements for affordable housing for all local jurisdictionsand establishing a state mechanism for overriding local disapproval of affordable housingdevelopments;45
■ State and local policies providing subsidies for low-income housing as components of mixed-income, predominately market-rate developments, including direct purchase of IZ units bypublic housing authorities; and
■ State and local policies that provide funds for purchasing foreclosed homes in high opportu-nity communities for placement of low-, very low-, and extremely low-income families aseither owners or renters.
Such policies should be part of the assessment of applications for SCI planning or implementationgrants. (A point system should be developed for grading applications.)
Creating an affordable housing supply for low-, very low-, and extremely low-income families inhigh opportunity communities is only half the task. The other half is to create a regional mobilitycounseling and placement program that can help such families to transition successfully from lowopportunity to high opportunity communities.
There are many examples of such programs but one of the best is the Baltimore Housing MobilityProgram. Under the provisions of a partial settlement of Thompson v. HUD, over 1,500 client
42 Fannie Mae recently reported that “Our mortgage credit book of business was $3.23 trillion as of December31, 2009 …. New business acquisitions were $823.6 billion for all of 2009, which included financing for ap-proximately 3,125,000 conventional single-family loans and approximately 372,000 multifamily units. Our esti-mated market share of new single-family mortgage-related securities issuance was 38.9 percent in the fourthquarter of 2009.”
43 In December 2009, Freddie Mac reported a $1.9 trillion mortgage portfolio, and that in that year it had pro-vided $548.4 billion of liquidity to the mortgage market, helping finance approximately 2.2 million conformingsingle-family loans (“one out of four”) and approximately 253,000 units of multifamily rental housing.
44 Source of income discrimination is currently banned by state law in California, Connecticut, Maine, Massachu-setts, Minnesota, New Jersey, North Dakota, Oklahoma, Oregon, Utah, Vermont, Wisconsin and the District ofColumbia and by local ordinance in 37 cities and counties (see www.prrac.org/pdf/AppendixB-Feb2010.pdf forthe latest PRRAC-updated list).
45 Examples would be the Connecticut Affordable Housing Land Use Appeals Act, the Massachusetts 40(B) program (the “Anti-Snob Zoning Act”), the Illinois Affordable Housing Planning and Appeal Act, and New Jersey’s post-Mt Laurel ruling Fair Housing Act.
Building Sustainable, Inclusive Communities 29

families of the Housing Authority of Baltimore City have been aided in moving from low oppor-tunity to high opportunity neighborhoods (89 percent into the city’s suburban counties).46
The program works so well because it includeskey policy enhancements that are not yet partof the regular Section 8 program:
■ A large dedicated pool of federal housingvouchers reserved for the mobility pro-gram’s clients.
■ Race- and poverty-based geographic targeting of eligible neighborhoods toensure that families are moving toneighborhoods with the true potentialto change lives.
■ Regional voucher administration withhigher exception-payment standards, sothat participants can overcome Section8 barriers to true mobility and actuallymove to units in opportunity neighborhoods.
■ Financial literacy, credit repair and life counseling to create competitive rental applicants andsuccessful tenants. The program can take up to two years to get participants “voucher ready,”which includes raising credit scores and saving money for a security deposit.
■ Housing search assistance and outreach to both “mom and pop” landlords and apartment man-agement companies, stressing the timely voucher payments, ongoing counseling, and otherpositive and unique aspects of the program which make it a good business proposition forproperty owners.
■ Monitored placements with data and maps to avoid over-concentration in any one neighbor-hood or building, and thus to preserve residential diversity, stability of housing and neighbor-hood receptiveness.
■ Two-plus years of post-move counseling to help families adjust to and attach to their new com-munities and sustain successful tenancy.
■ Second-move counseling to encourage residential and school stability and minimize unwantedmoves out of opportunity neighborhoods due to market barriers.
■ Security deposit assistance for eligible families.
■ Employment and transportation assistance to help families access the rich employment resourcesof suburban areas despite the sometimes weaker public transit systems of those areas.
A regional housing mobility program should be a required element of any SustainableCommunities planning or implementation grant. These provisions should be essential elementsof such a regional mobility program.
Inclusionary housing (a duplex) in McLean Courts in FairfaxCounty
46 See Lora Engdahl, New Homes, New Neighborhoods, New Schools: a Report on the Baltimore Housing Mobility Program [www.prrac.org/pdf/BaltimoreMobilityReport.pdf]
30 POVERTY & RACE RESEARCH ACTION COUNCIL
COMMENTARY NO.8 Mixed-Income Housing’s Bottom Line
To the maximum extent, Sustainable Communities planning must result in
new housing development and redevelopment providing affordable shelter
for low-, very low-, and extremely-low income families within mixed income,
market rate developments in higher opportunity communities.
“Housing policy is school policy”Where a child lives largely determines the quality of the child’s educational opportunities – notbasically because of how much money the local school board spends per student but because ofwho the child’s classmates are.
The impact of the socioeconomic background of schoolchildren’s families on academic outcomeswas first documented by James Coleman in Equality of Educational Opportunity (1966).Sponsored by the then-US Office of Education, Coleman and his research team examined pupil,family, and school characteristics for over a million public school children in search of factors thatwere associated with academic success.
The Coleman Report concluded that the socioeconomic characteristics of a child and of the child’sclassmates (measured principally by family income and parental education) were the overwhelmingfactors that accounted for academic success. Nothing else – expenditures per pupil, pupil-teacherratios, teacher experience, instructional materials, age of school buildings, etc. – came close.
“The educational resources provided by a child’s fellow students,” Coleman summarized, “are moreimportant for his achievement than are the resources provided by the school board.” So important arefellow students, the report found, that “the social composition of the student body is more highly relatedto achievement, independent of the student’s own social background, than is any school factor.”47
For over three decades, educational researchers, including Coleman, have revisited, refined, anddebated Coleman’s original findings. There has been no more consistent finding of educationalresearch that the paramount importance of a school’s socioeconomic makeup on academicachievement:48 in effect, poor children learn best in middle-class schools.49
47 Quoted in Richard D. Kahlenberg. All Together Now: Creating Middle-Class Schools through Public School Choice.Brookings Institution Press: Washington, DC. (2001), page 28. Kahlenberg’s 33 pages of footnotes to chapters 3and 4 catalogue most major studies to that date on the effects of racial and economic school integration.
48 The author has done 16 such region-wide studies, ranging from examining the relationship between SES andtest scores for 1,108 individual low-income pupils (Albuquerque) to elementary school level results for Denver(391 schools), Connecticut (516), Gainesville FL (22), Peoria IL (51), Baltimore MD (373), Montgomery CountyMD (125), Southwestern Michigan (483), Toledo OH (110), Lancaster PA (82), York PA (43), Green Bay WI (43),and Madison WI (60) to school district level results in Atlanta GA (28 districts), Gary IN (16), WestchesterCounty NY (40) and the five largest metro areas in Texas (189). Among other articles, my research is summa-rized in “Housing Policy Is School Policy,” a chapter in David K. Hamilton and Patricia S. Atkins, eds. Urban andRegional Policies for Metropolitan Livability. M. E. Sharpe: Armonk, NY and London, UK (2008), pp. 204-231.
49 To our knowledge, the definitive proof of the fact that poor children learn best in middle-class schools is “Do
Building Sustainable, Inclusive Communities 31
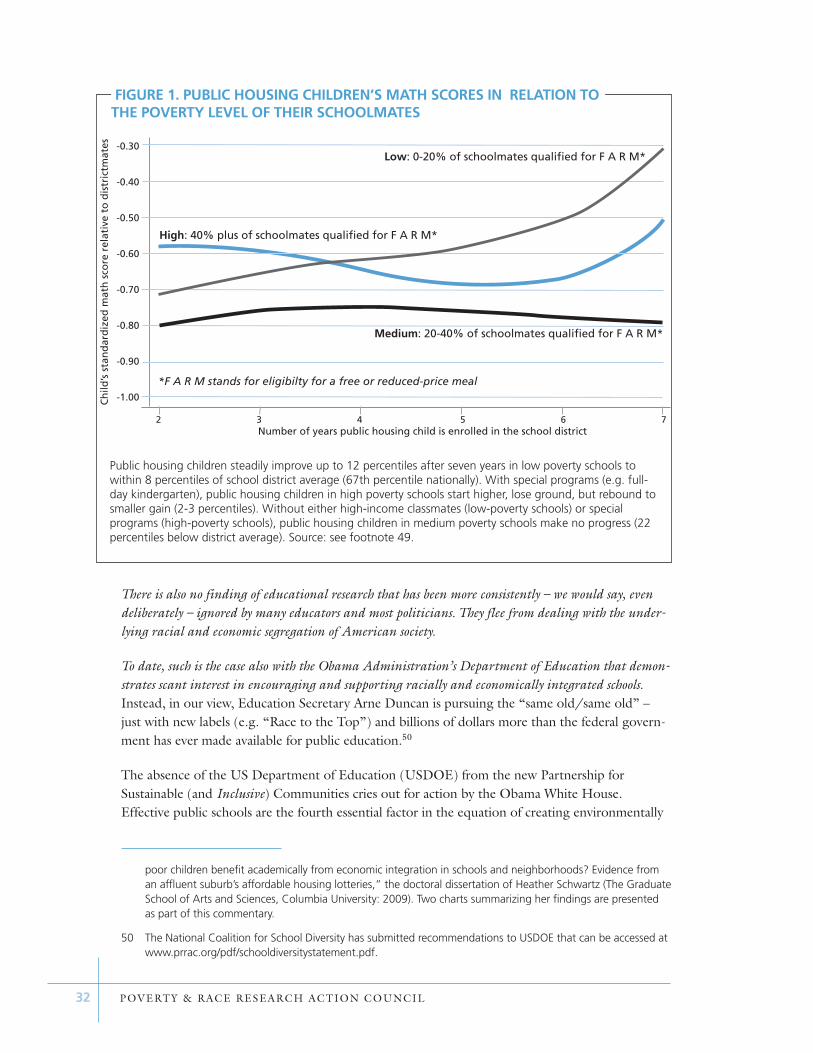
There is also no finding of educational research that has been more consistently – we would say, evendeliberately – ignored by many educators and most politicians. They flee from dealing with the under-lying racial and economic segregation of American society.
To date, such is the case also with the Obama Administration’s Department of Education that demon-strates scant interest in encouraging and supporting racially and economically integrated schools.Instead, in our view, Education Secretary Arne Duncan is pursuing the “same old/same old” –just with new labels (e.g. “Race to the Top”) and billions of dollars more than the federal govern-ment has ever made available for public education.50
The absence of the US Department of Education (USDOE) from the new Partnership forSustainable (and Inclusive) Communities cries out for action by the Obama White House.Effective public schools are the fourth essential factor in the equation of creating environmentally
poor children benefit academically from economic integration in schools and neighborhoods? Evidence froman affluent suburb’s affordable housing lotteries,” the doctoral dissertation of Heather Schwartz (The GraduateSchool of Arts and Sciences, Columbia University: 2009). Two charts summarizing her findings are presentedas part of this commentary.
50 The National Coalition for School Diversity has submitted recommendations to USDOE that can be accessed atwww.prrac.org/pdf/schooldiversitystatement.pdf.
-0.30
-0.40
-0.50
-0.60
-0.70
-0.80
-0.90
-1.00
High: 40% plus of schoolmates qualified for F A R M*
Medium: 20-40% of schoolmates qualified for F A R M*
Low: 0-20% of schoolmates qualified for F A R M*
Number of years public housing child is enrolled in the school district
*F A R M stands for eligibilty for a free or reduced-price meal
2 3 4 5 6 7
Ch
ild’s
sta
nd
ard
ized
mat
h s
core
rel
ativ
e to
dis
tric
tmat
es
Public housing children steadily improve up to 12 percentiles after seven years in low poverty schools towithin 8 percentiles of school district average (67th percentile nationally). With special programs (e.g. full-day kindergarten), public housing children in high poverty schools start higher, lose ground, but rebound tosmaller gain (2-3 percentiles). Without either high-income classmates (low-poverty schools) or special programs (high-poverty schools), public housing children in medium poverty schools make no progress (22percentiles below district average). Source: see footnote 49.
FIGURE 1. PUBLIC HOUSING CHILDREN’S MATH SCORES IN RELATION TOTHE POVERTY LEVEL OF THEIR SCHOOLMATES
32 POVERTY & RACE RESEARCH ACTION COUNCIL
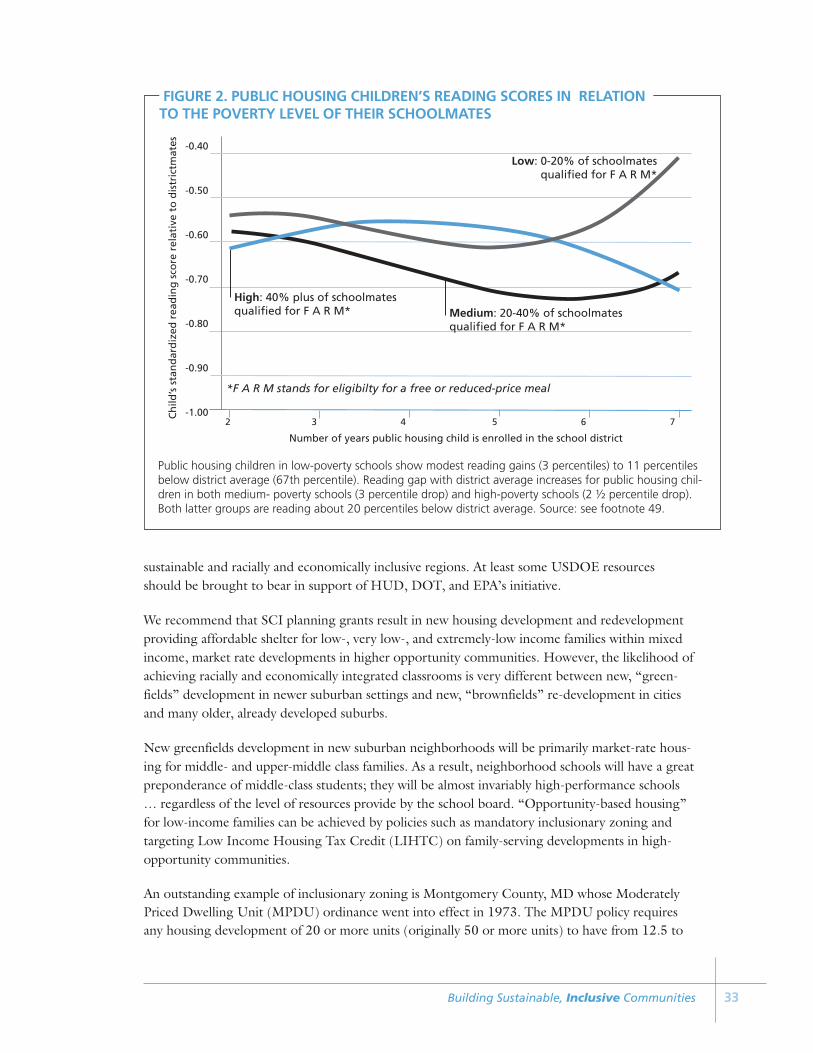
sustainable and racially and economically inclusive regions. At least some USDOE resourcesshould be brought to bear in support of HUD, DOT, and EPA’s initiative.
We recommend that SCI planning grants result in new housing development and redevelopmentproviding affordable shelter for low-, very low-, and extremely-low income families within mixedincome, market rate developments in higher opportunity communities. However, the likelihood ofachieving racially and economically integrated classrooms is very different between new, “green-fields” development in newer suburban settings and new, “brownfields” re-development in citiesand many older, already developed suburbs.
New greenfields development in new suburban neighborhoods will be primarily market-rate hous-ing for middle- and upper-middle class families. As a result, neighborhood schools will have a greatpreponderance of middle-class students; they will be almost invariably high-performance schools… regardless of the level of resources provide by the school board. “Opportunity-based housing”for low-income families can be achieved by policies such as mandatory inclusionary zoning andtargeting Low Income Housing Tax Credit (LIHTC) on family-serving developments in high-opportunity communities.
An outstanding example of inclusionary zoning is Montgomery County, MD whose ModeratelyPriced Dwelling Unit (MPDU) ordinance went into effect in 1973. The MPDU policy requiresany housing development of 20 or more units (originally 50 or more units) to have from 12.5 to
-0.40
-0.50
-0.60
-0.70
-0.80
-0.90
-1.00Ch
ild’s
sta
nd
ard
ized
rea
din
g s
core
rel
ativ
e to
dis
tric
tmat
es
High: 40% plus of schoolmates qualified for F A R M* Medium: 20-40% of schoolmates
qualified for F A R M*
Low: 0-20% of schoolmates qualified for F A R M*
Number of years public housing child is enrolled in the school district
*F A R M stands for eligibilty for a free or reduced-price meal
2 3 4 5 6 7
Public housing children in low-poverty schools show modest reading gains (3 percentiles) to 11 percentilesbelow district average (67th percentile). Reading gap with district average increases for public housing chil-dren in both medium- poverty schools (3 percentile drop) and high-poverty schools (2 ½ percentile drop).Both latter groups are reading about 20 percentiles below district average. Source: see footnote 49.
FIGURE 2. PUBLIC HOUSING CHILDREN’S READING SCORES IN RELATIONTO THE POVERTY LEVEL OF THEIR SCHOOLMATES
Building Sustainable, Inclusive Communities 33
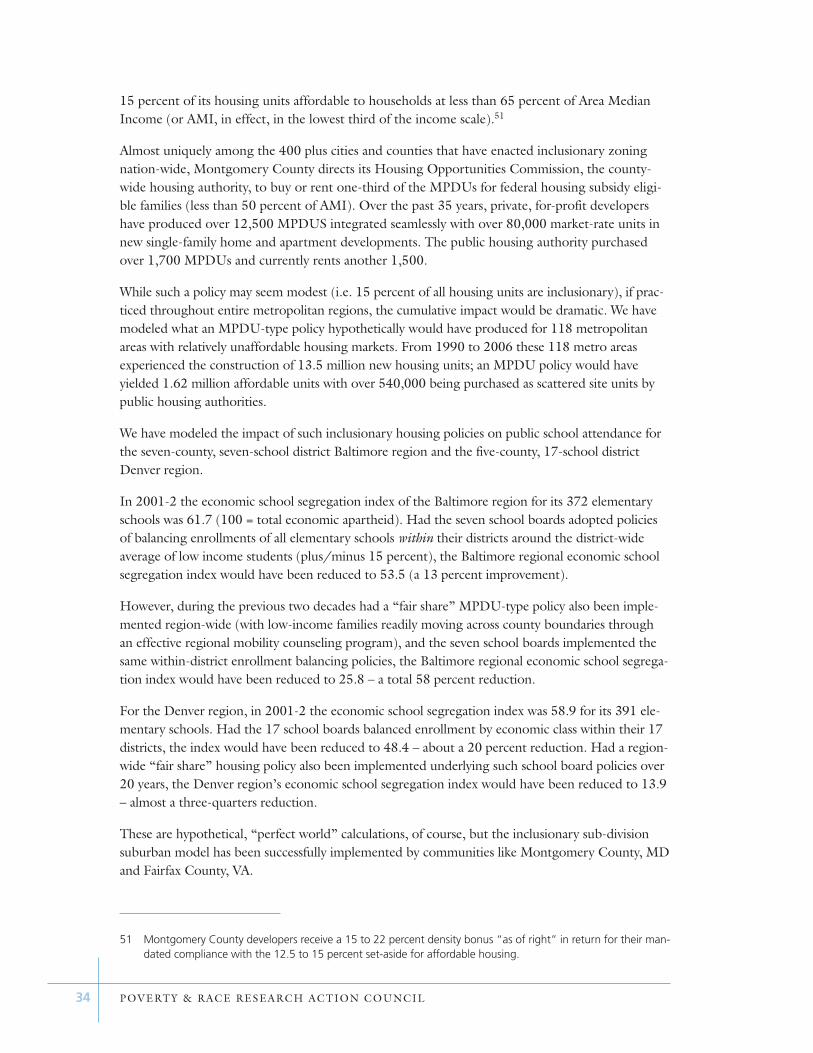
15 percent of its housing units affordable to households at less than 65 percent of Area MedianIncome (or AMI, in effect, in the lowest third of the income scale).51
Almost uniquely among the 400 plus cities and counties that have enacted inclusionary zoningnation-wide, Montgomery County directs its Housing Opportunities Commission, the county-wide housing authority, to buy or rent one-third of the MPDUs for federal housing subsidy eligi-ble families (less than 50 percent of AMI). Over the past 35 years, private, for-profit developershave produced over 12,500 MPDUS integrated seamlessly with over 80,000 market-rate units innew single-family home and apartment developments. The public housing authority purchasedover 1,700 MPDUs and currently rents another 1,500.
While such a policy may seem modest (i.e. 15 percent of all housing units are inclusionary), if prac-ticed throughout entire metropolitan regions, the cumulative impact would be dramatic. We havemodeled what an MPDU-type policy hypothetically would have produced for 118 metropolitanareas with relatively unaffordable housing markets. From 1990 to 2006 these 118 metro areasexperienced the construction of 13.5 million new housing units; an MPDU policy would haveyielded 1.62 million affordable units with over 540,000 being purchased as scattered site units bypublic housing authorities.
We have modeled the impact of such inclusionary housing policies on public school attendance forthe seven-county, seven-school district Baltimore region and the five-county, 17-school districtDenver region.
In 2001-2 the economic school segregation index of the Baltimore region for its 372 elementaryschools was 61.7 (100 = total economic apartheid). Had the seven school boards adopted policiesof balancing enrollments of all elementary schools within their districts around the district-wideaverage of low income students (plus/minus 15 percent), the Baltimore regional economic schoolsegregation index would have been reduced to 53.5 (a 13 percent improvement).
However, during the previous two decades had a “fair share” MPDU-type policy also been imple-mented region-wide (with low-income families readily moving across county boundaries throughan effective regional mobility counseling program), and the seven school boards implemented thesame within-district enrollment balancing policies, the Baltimore regional economic school segrega-tion index would have been reduced to 25.8 – a total 58 percent reduction.
For the Denver region, in 2001-2 the economic school segregation index was 58.9 for its 391 ele-mentary schools. Had the 17 school boards balanced enrollment by economic class within their 17districts, the index would have been reduced to 48.4 – about a 20 percent reduction. Had a region-wide “fair share” housing policy also been implemented underlying such school board policies over20 years, the Denver region’s economic school segregation index would have been reduced to 13.9– almost a three-quarters reduction.
These are hypothetical, “perfect world” calculations, of course, but the inclusionary sub-divisionsuburban model has been successfully implemented by communities like Montgomery County, MDand Fairfax County, VA.
51 Montgomery County developers receive a 15 to 22 percent density bonus “as of right” in return for their man-dated compliance with the 12.5 to 15 percent set-aside for affordable housing.
34 POVERTY & RACE RESEARCH ACTION COUNCIL
The hypothetical calculations also assumed, however, that low-income children leaving high-poverty schools in urban districts would be replaced by an equal number of middle-class children inthose same urban schools. Realistically, that has not happened. Neither market-driven gentrificationnor deliberate, mixed-income redevelopment have resulted in the re-enrollment of middle-classchildren in city school districts. New residents have been either singles, mingles, gays, or emptynesters – that is, households without school age children – or, faced with the daunting prospect ofsending their own child to a high-poverty, low-performance neighborhood school, middle-class par-ents opt for parochial or private schools.
One strategy for rebuilding middle-class enrollment in urban districts would take advantage of oneof most cities’ most valuable assets – city-based but regional, high quality institutional employerssuch as college and university campuses, major hospitals, major governmental agencies, and concen-trations of employees located in downtown office cores. Their employees often must commute longdistances to reach their city-based jobs.
Family structure is changing. The number of single-parent families increases steadily. Also, in mosttwo-parent families, both parents work. Both types of families face “latchkey” problems: how do Iassure that my child is all right when the school day ends around 2:30 pm and I must still be at work?
In Albuquerque in the mid-1980s, two neighborhood advocacy groups (Martineztown/SantaBarbara Neighborhood Association and Downtown Neighborhoods, Inc.), Albuquerque PublicSchools, and the City of Albuquerque collaborated to create a very innovative solution. The schooldistrict committed to install a high quality, magnet-style curriculum in Longfellow and Lew WallaceElementary Schools that were located in once very desirable, now poverty-impacted neighborhoodssurrounding downtown Albuquerque. City government paid the school district to extend theschool day from 8 a.m. to 6 p.m. The enrollment policy was set that no more than half the seatswould be filled by neighborhood children (overwhelmingly poor); the other half were reserved forchildren of downtown office workers.
The program was wildly popular with downtown office workers – many of whom preferred to drivetheir child to a school just a few blocks from their office, know that their child was in a high-educational quality, adult-supervised environment for the full day, and then pick their child up againat day’s end.
The neighborhood children benefited academically with the infusion of higher income classmatesinto their classrooms. (Their academic progress tended to erode when the neighborhood childrenmoved on to middle- and high schools that lacked a similar infusion of higher SES classmates, how-ever.) And, with a neighborhood school situation that they could “deal with,” young, professionalfamilies were encouraged to buy into the neighborhoods.
These are the kinds of school-based strategies that are essential if redevelopment in cities andstressed older suburbs is to result in stable, environmentally sustainable and racially and economi-cally inclusive neighborhoods.
In the long run what HUD Secretary Shaun Donovan is doing could have far more positive impacton educational opportunities for America’s low-income children than what Education SecretaryArne Duncan is currently doing.
It is essential that the US Department of Education add its resources and join the Partnership forSustainable Communities.
Building Sustainable, Inclusive Communities 35
Conforming Federal GrantsUpon review and certification of the compliance of a regional comprehensive
plan with the goal of promoting more sustainable and inclusive regional
communities, HUD, DOT, and EPA (and such other federal agencies as the
President or Congress may designate) must make all applicable grants-in-aid
in accordance with the provisions of the plan.
The FY 2010 HUD appropriations act provided $150 million as start-up funds for the SustainableCommunities Initiative and another $150 million has been requested for FY 2011. Of each annualamount, $100 million is for “Regional Planning Grants to support the linking of transportationand land use planning; and $40 million is for “Metropolitan Challenge Grants to foster reformand reduce barriers to achieve affordable, economically vital, and sustainable communities.”
The Livable Communities Act, sponsored by Senator Chris Dodd, would further authorize$750 million for FY 2011, $1.25 billion for FY 2012, and $1.75 billion for FY 2012 for HUDto issue follow-up “Sustainability Challenge Grants.” Such grants would be limited to $15 million for a small metro area or micropolitan area, $35 million for a mid-sized metro area, and$100 million for a large metro area.
Such grants are not small change, but hardly transformative.52 However, once the current economic crisis has past, the imperative for the Obama Administration and the Congress will be to bring the federal deficit under control. Such appropriations for new initiatives will be problematic.
Moreover, even $100 million would be dwarfed by the cumulative total of federal grants fromHUD, DOT, EPA, Education, Labor, Commerce, and other domestic federal agencies.53
Thus, the real impact of the Sustainable Communities Initiative would come from requiring thaton-going federal grants-in-aid must be made by the different federal agencies in conformance withthe regional comprehensive plan. Indeed, the executive director of the Capitol Region Council ofGovernments, the Hartford region’s MPO, has likened such an SCI as “an A-95 with teeth”,
COMMENTARY NO.9
52 In 1994 the Clinton Administration gave up $100 million (plus $200 million in tax credits for job creation) toBaltimore, Philadelphia-Camden, Detroit, Cleveland, Chicago, Atlanta, Los Angeles, and New York (Harlemand the Bronx) as “Empowerment Zone Communities.” Such funds hardly had the transformative impact anticipated by the Administration and Congress even on the limited neighborhood target areas selected.
53 For FY 2010, grants-in-aid from HUD, DOT, and EPA will total $145 billion (not including tens of billions of dollars more from the American Recovery and Reinvestment Act).
36 POVERTY & RACE RESEARCH ACTION COUNCIL
54 The A-95 review process was summarized in the Final Report of the National Commission on Fair Housing asfollows: “In 1968, the federal law governing “Section 701” grants to regional planning agencies wasamended to require a “housing element” to assess regional housing needs. This led to the development of“fair share housing plans” in many metropolitan regions. In 1969, this requirement was enhanced by the creation of the so-called “A-95 Review” process which empowered regional planning agencies to review andsign off on federal grants to municipalities for their conformance with the regional plan. This system, whichsuccessfully engaged many metropolitan regions in a coordinated fair housing planning process, effectivelyended with the Nixon Administration’s housing moratorium in 1973 and the subsequent passage of the Hous-ing and Community Development Act of 1974, which weakened federal oversight of block grants to cities andtowns.” See Marc Smith, Developing A Fair Share Housing Policy for Florida, 12 J. of Land Use & Environmen-tal L. 63, 74, 75 (Fall, 1996); see also Myron Orfield, Land Use And Housing Policies To Reduce ConcentratedPoverty And Racial Segregation, 33 Fordham Urb. L.J. 877 (Mar. 2006)
recalling the past authority that regional planning agencies had to review and comment on all federal grants-in-aid.54
The three federal partners must require a common sense balance between environmental sustain-ability and regional socio-economic opportunity. Several months ago, the Urban Institute andNYU unveiled a methodology for balancing the two goals in which sustainability was determinedby a combination of population density and access to public transportation. High-density, high-transit central cities and built-up suburbs ranked high on the sustainability scale, but low on thesocio-economic opportunity scale. Low density, low-transit outer suburbs ranked low on the sustainability scale, but with their growing job centers and low-poverty, high-performance schoolsranked high on the socio-economic opportunity scale.
A plan that emphasized sustainability would result in directing HUD to locate more subsidizedhousing in high sustainability communities (cities and built-up first suburbs) and prevent HUDfrom locating subsidized housing in low sustainability communities (outer suburbs). That isexactly the opposite of where subsidized “opportunity-based housing” should be located and simply mirrors HUD’s traditional location decisions, substituting “sustainability” criteria for“need” criteria (that is, more subsidized housing should be built where poor people already live –in high poverty, therefore “high need” communities).
Instead, the SCI-driven pattern should be
■ in cities and first suburbs, new subsidized housing should be built only as a part of mixed-income, predominantly market-rate developments whose addition to a lower-income communitywill result in raising that community’s average income andreduce the family poverty rate; and
■ in outer suburbs, inclusionary zoning should result in mixed-income, market rate developments where HUD subsidies shouldbe utilized to lower the housing cost to affordable ranges forlow-income families (including direct purchase of units by aregional public housing authority) so that more low-incomefamilies can move from low-opportunity cities and first suburbsinto high-opportunity outer suburbs (thereby increasing theirdensity and potential demand for public transportation).
In sum, regional opportunity must not be sacrificed on the altar of regional sustainability.
…regional oppor-tunity must not be
sacrificed on thealtar of regional
sustainability.
Building Sustainable, Inclusive Communities 37
Workforce DevelopmentThe recipients of all infrastructure grants-in-aid
made in compliance with a regional comprehensive plan
must implement policies and programs to increase the training and
employment of women and minorities on such infrastructure projects.
Over past decades the major impact of the Federal Highway Administration on economic oppor-tunity for African America men and women has been “job sprawl” – the constant re-location ofjobs farther and farther away from cities and first suburbs where most African Americans live. By2006, 45 percent of jobs in the 98 largest metropolitan areas were located more than 10 milesfrom downtown (a number that may well exceed 50 percent today with the current recession’s joblosses concentrated in the cities and older suburbs).
Job sprawl’s negative impact on the black community is magnified by the historic exclusion ofAfrican Americans from highway construction trades. Despite progress since the Civil Rights Actof 1964, African Americans are still significantly underrepresented on highway construction jobs.A study of the 25 largest metropolitan areas for the Transportation Equity Network (TEN)55
found that “if blacks were employed in construction at the same rate that they are employed in theoverall workforce in 2006, we estimate that 137,044 more blacks would be employed….”
Furthermore, the TEN report found that “women held only between 1 and 9 percent of con-struction jobs” against a target of 25 percent (as deemed a reasonable level for women in the con-struction trades by the US Labor Department).
Finally, the report found that in all but three metro areas (Cleveland, Boston, and Pittsburgh)Hispanics were a higher percentage of the construction workforce than of the general workforce(and even in those three regions, the “gap” was tiny). However, job quality rather than job quan-tity was the issue. Hispanics tended to be concentrated in the lowest wage and often more haz-ardous occupations and often received few or no employment benefits.
Among TEN’s recommendations for improvement in training and employment of women andminority group members in the construction trades are
■ Federal transportation law (23 USC 140) allows states to utilize up to ½ of 1% of SurfaceTransportation Program (federal highway) funds for workforce development. This provisionshould be made mandatory and extended to all federal transportation projects, including public transit.
COMMENTARY NO.10
55 Todd Swanstrom. The Road to Good Jobs: Patterns of Employment in the Construction Industry. Public PolicyResearch Center, University of Missouri: St Louis (September 30, 2008).http://www.transportationequity.org/images/stories/Road2GoodJobs-Final.pdf
38 POVERTY & RACE RESEARCH ACTION COUNCIL
■ SAFETEA-LU included a “Sense of Congress” (Section 1920) that called for state DOTs to“facilitate and encourage” collaboration to “leverage scarce training and community resourcesand to help ensure local participation in the building of transportation projects.” Section 1920should be made mandatory and extended to all large federal construction projects, includingprojects by the Department of Housing and Urban Development (HUD), the NationalAeronautics and Space Administration (NASA), and the U.S. Corps of Engineers.Implementation of this provision would mean that 30 percent of the work hours on large fed-erally funded construction projects would be reserved for low-income people, ex-offenders,women and minorities.
■ State Departments of Transportation (DOTs) should reserve 30% of the work hours on high-way and transit projects for low-income people, ex-offenders, minorities and women. StateDOTs should encourage the development of local task forces to publicize opportunities inconstruction and should work with community-based organizations to develop apprenticeshipprograms to prepare underrepresented groups for employment in the construction industry.
■ Local governments should pass ordinances requiring local workforce development on all largepublicly funded construction projects.
All of these provisions should be included in the pending Surface Transportation AuthorizationAct. Regardless of the status of that legislation, the Partnership for Sustainable Communitiesshould adopt these policies, and they should incorporated as requirements for SustainableCommunities planning and implementation grants, obligations of state and local grant recipients,and conditions for all subsequent grants-in-aid for construction projects made in the future byHUD, DOT, and EPA in conformance with regional comprehensive plans.
Building Sustainable, Inclusive Communities 39
Appendix AMarch 11, 2010
Ms. Shelley PotichaDirectorOffice of Sustainable Housing and CommunitiesDepartment of Housing and Urban Development451 7th Street, S.W. Room 10180 Washington, DC 20410
RE: Comments on Sustainable Communities Initiative Planning Grants
Dear Ms. Poticha:
We are writing on behalf of the Building One America coalition and other civil rights and housingorganizations that share Building One America’s commitment to building a nation of racially andeconomically integrated and environmentally sustainable regions. We are most enthusiasticabout the potential of the Sustainable Communities Initiative to significantly advance that goal,particularly in light of the commitments made by HUD Secretary Shaun Donovan, DOT SecretaryRay LaHood, and EPA Administrator Lisa Jackson, who all stated, in effect, that “sustainable mustbe equitable” at the New Partners for Smart Growth Conference on February 4 in Seattle. Thatcommitment was memorably reinforced by HUD Deputy Secretary Ron Sims in his inspiring re-marks to conclude the conference. We are committed to helping him and you make the Sustain-able Communities Initiative a transformational chapter in the quest for social justice and regionalopportunity.
In responding to the Sustainable Communities Planning Grant Program Advance Notice and Re-quest for Comment [Docket No. FR-5396-N-01], we are guided by two parameters:
a) HUD and its partners, DOT and EPA, have been provided with very broad latitude in design-ing the SCI Planning Grant Program through the very general explanatory language of theConsolidated Appropriations ACT of December 16, 2009; thus, in terms of developing na-tional models for achieving both greater social justice and enhanced environmental sustain-ability HUD-DOT-EPA must set the bar very high for the pilot planning grant program; and
b) Significant, measurable progress in eliminating racial and economic segregation and concen-trations of poverty must be an explicit, required, and central element of any regional plan andof all grants-in-aid provided by HUD, DOT, and EPA to implement such a plan.
Our recommendations, focusing on regional opportunity goals, will be summarized in this letterand expanded upon and documented in attachments. We offer ten primary recommendations.
1. An SCI Planning Grant must be genuinely regional in scope, covering the jurisdictions thatcomprise a metropolitan or micropolitan area, or, at least those jurisdictions forming the ur-banized area of such, including the principal city or cities and first suburbs.
2. The recipient of an SCI Planning Grant must be a governmental unit (such as a county forsingle-county regions), or consortium of governmental units (such as a Metropolitan PlanningOrganization or Council of Governments) or, in the absence of interested local governments,a state agency – in short, public bodies that control development policy (land use, commer-cial and industrial development, housing, transportation and other infrastructure, etc.) within aregion.
40 POVERTY & RACE RESEARCH ACTION COUNCIL
3. There must be proportional representation on an SCI Planning Grant recipient’s governingbody of the residents of principal cities and first suburbs (where minorities and low-incomehouseholds are typically concentrated); or, failing that test, an SCI grant recipient must estab-lish a decision-making substructure that achieves proportional representation.
4. An SCI Planning Grant applicant must set forth a plan for meaningful citizen involvement inthe planning process, including the involvement of regional opportunity advocacy organiza-tions.
5. A primary goal of an SCI Planning Grant must be the reduction of racial and economic resi-dential segregation and school segregation and concentrations of poverty on a regional basiswith aggressively affirmatively furthering fair housing as a fundamental policy; a method mustbe specified to document progress in achieving greater racial and economic integration.
6. Using one of several methodologies provided by the Office of Sustainable Housing and Com-munities, an SCI Planning Grant recipient must conduct a regional opportunity assessmentthat measures relative opportunity (jobs, schools, local services, safety) by municipality orcensus tract.
7. A mandatory element of an SCI Planning Grant must be policies and programs that result inlow-income residents of low opportunity communities having realistic options of moving tohigh opportunity communities as well as policies and programs to upgrade the quality of life inlow opportunity communities.
8. To the maximum extent, an SCI Planning Grant must result in new housing development andredevelopment providing affordable shelter for low-, very low-, and extremely-low incomefamilies within mixed income, market rate developments in higher opportunity communities.
9. Upon review and certification of the compliance of a regional comprehensive plan with thegoal of promoting more sustainable and inclusive regional communities, HUD, DOT, and EPA(and such other federal agencies as the President or Congress may designate) must make allapplicable grants-in-aid (such as transportation infrastructure, housing and community devel-opment, and water and sewer infrastructure funds) in accordance with the provisions of theplan.
10. The recipients of all infrastructure grants-in-aid made in compliance with a regional compre-hensive plan must implement policies and programs to increase the training and employmentof women and minority group members on such infrastructure projects.
The regional members and national allies of the Building One America coalition look forward tomeeting with you to discuss these recommendations at the earliest possible time.
Sincerely,
Mike KruglikExecutive Director,Building One America
Building Sustainable, Inclusive Communities 41
Rev. R. Lenton Buffalo, ChairNew Jersey Regional Coalition
William Montgomery, Co-ChairJacquelynn Puriefoy-Brinkley, Co-ChairSoutheastern Pennsylvania First
Suburbs Project
Rev. Dr. Hoffman Brown, Co-ChairRev. Alan Traher, Co-ChairRev. Dr. Diane Dixon-Proctor, Federal LiaisonBaltimore Regional Initiative Developing
Genuine Equality, Inc (BRIDGE)
David HatchIllinois-Indiana Regional Organizing
Network (IIRON)Chicago, IL
Gail HarrisonLakeshore Ethnic Diversity Alliance Holland, MI
Philip TegelerPoverty & Race Research Action Council,Washington, DC
David RuskMetropolitan Area Research CorporationWashington, DC
john powellKirwan Institute for the Study of
Race and Ethnicity Ohio State University Columbus, OH
Myron OrfieldInstitute on Race and PovertyMinneapolis, MN
Patrick MaierInnovative Housing InstituteBaltimore, MD
Rob BreymaierChicago Area Fair Housing AllianceChicago, IL
Adam GrossBusiness and Professional People
for the Public InterestChicago, IL
* * * * * * * * * * * * * * * * * * *
Lisa Rice National Fair Housing AllianceWashington, DC
Joseph RichLawyers’ Committee for Civil Rights Under LawWashington, DC
Elizabeth Julian and Demetria McCainInclusive Communities ProjectDallas, TX
Erin BoggsConnecticut Fair Housing CenterHartford, CT
Peter HarveyFair Housing Partnership of Greater PittsburghPittsburgh, PA
Jim McCarthyMiami Valley Fair Housing CenterDayton, OH
Kori Schneider PeragineMetropolitan Milwaukee Fair Housing CouncilMilwaukee, WI
Susan GoeringACLU of MarylandBaltimore, MD
Judith LibenMassachusetts Law Reform InstituteBoston, MA
Glenn RobinsonBaltimore Region Environmental Justice inTransportation Project
and Transportation Equity CooperativeResearch Program at Morgan State University
Ellen JohnsonHousing Land AdvocatesPortland, OR
Heather KemperLegal Aid Services of OregonPortland, OR
Building One America members and additional supporting organizations:
42 POVERTY & RACE RESEARCH ACTION COUNCIL
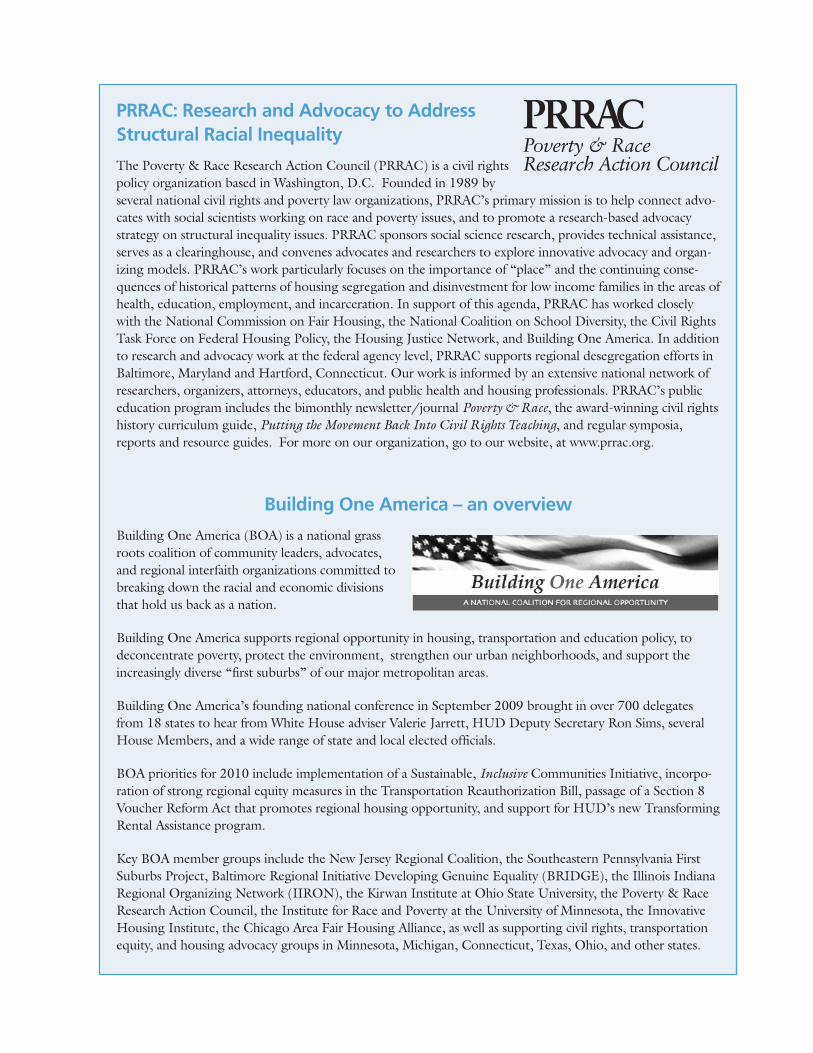
PRRAC: Research and Advocacy to Address Structural Racial Inequality
The Poverty & Race Research Action Council (PRRAC) is a civil rightspolicy organization based in Washington, D.C. Founded in 1989 by several national civil rights and poverty law organizations, PRRAC’s primary mission is to help connect advo-cates with social scientists working on race and poverty issues, and to promote a research-based advocacystrategy on structural inequality issues. PRRAC sponsors social science research, provides technical assistance,serves as a clearinghouse, and convenes advocates and researchers to explore innovative advocacy and organ-izing models. PRRAC’s work particularly focuses on the importance of “place” and the continuing conse-quences of historical patterns of housing segregation and disinvestment for low income families in the areas ofhealth, education, employment, and incarceration. In support of this agenda, PRRAC has worked closelywith the National Commission on Fair Housing, the National Coalition on School Diversity, the Civil RightsTask Force on Federal Housing Policy, the Housing Justice Network, and Building One America. In additionto research and advocacy work at the federal agency level, PRRAC supports regional desegregation efforts inBaltimore, Maryland and Hartford, Connecticut. Our work is informed by an extensive national network ofresearchers, organizers, attorneys, educators, and public health and housing professionals. PRRAC’s publiceducation program includes the bimonthly newsletter/journal Poverty & Race, the award-winning civil rightshistory curriculum guide, Putting the Movement Back Into Civil Rights Teaching, and regular symposia,reports and resource guides. For more on our organization, go to our website, at www.prrac.org.
Building One America – an overview
Building One America (BOA) is a national grassroots coalition of community leaders, advocates,and regional interfaith organizations committed tobreaking down the racial and economic divisionsthat hold us back as a nation.
Building One America supports regional opportunity in housing, transportation and education policy, todeconcentrate poverty, protect the environment, strengthen our urban neighborhoods, and support theincreasingly diverse “first suburbs” of our major metropolitan areas.
Building One America’s founding national conference in September 2009 brought in over 700 delegatesfrom 18 states to hear from White House adviser Valerie Jarrett, HUD Deputy Secretary Ron Sims, severalHouse Members, and a wide range of state and local elected officials.
BOA priorities for 2010 include implementation of a Sustainable, Inclusive Communities Initiative, incorpo-ration of strong regional equity measures in the Transportation Reauthorization Bill, passage of a Section 8Voucher Reform Act that promotes regional housing opportunity, and support for HUD’s new TransformingRental Assistance program.
Key BOA member groups include the New Jersey Regional Coalition, the Southeastern Pennsylvania FirstSuburbs Project, Baltimore Regional Initiative Developing Genuine Equality (BRIDGE), the Illinois IndianaRegional Organizing Network (IIRON), the Kirwan Institute at Ohio State University, the Poverty & RaceResearch Action Council, the Institute for Race and Poverty at the University of Minnesota, the InnovativeHousing Institute, the Chicago Area Fair Housing Alliance, as well as supporting civil rights, transportationequity, and housing advocacy groups in Minnesota, Michigan, Connecticut, Texas, Ohio, and other states.

POVERTY & RACE RESEARCH ACTION COUNCIL1200 18th St. NW #200 Washington, DC 20036
202/906-8023 Fax 202/842-2885www.prrac.org