Embed Size (px)
Citation preview
U.S. Department of JusticeOffice of Justice ProgramsBureau of Justice Statistics
Bureau of Justice Statistics
June 2010, NCJ 230113
Statistical Tables
For a list of publications in this series, go to http://bjs.ojp.usdoj.gov/index.cfm?ty=pbse&sid=38
1,250,000
1,300,000
1,350,000
1,400,000
1,450,000
1,500,000
1,550,000
1,600,000
1,650,000Number of prisoners
-0.5
0.0
0.5
1.0
1.5
2.5
3.0
2.0
Percent change
Percent change
Dec. Dec.Jun. Dec.Jun. Dec.Jun. Dec.Jun. Dec.Jun. Dec.Jun. Dec.Jun. Dec.Jun.Jun. Jun.2009200720052004 20062003200220012000 2008
Heather C. West, Ph.D.BJS Statistician
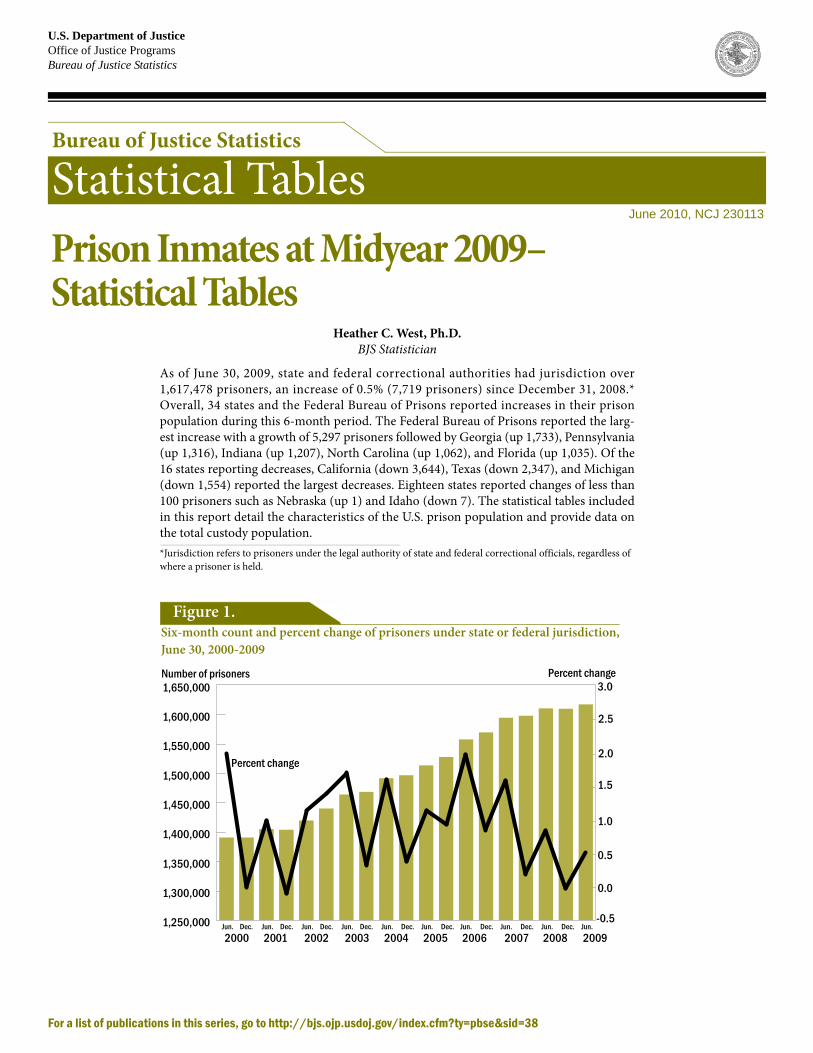
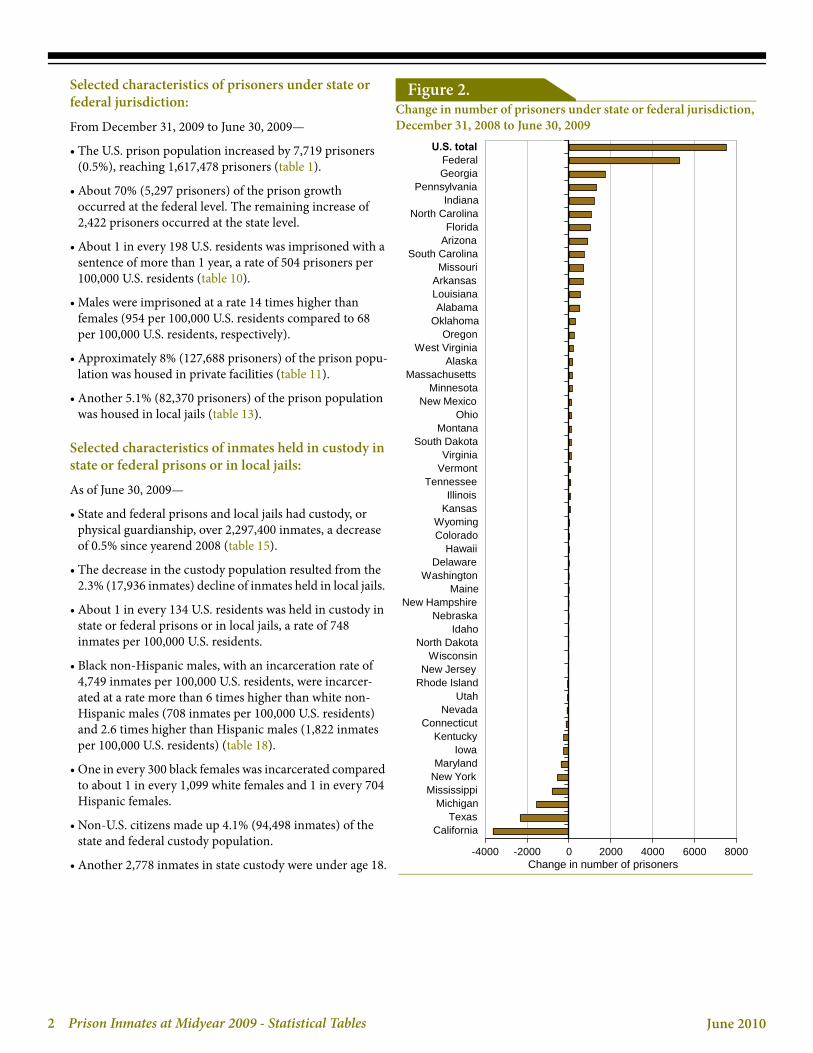
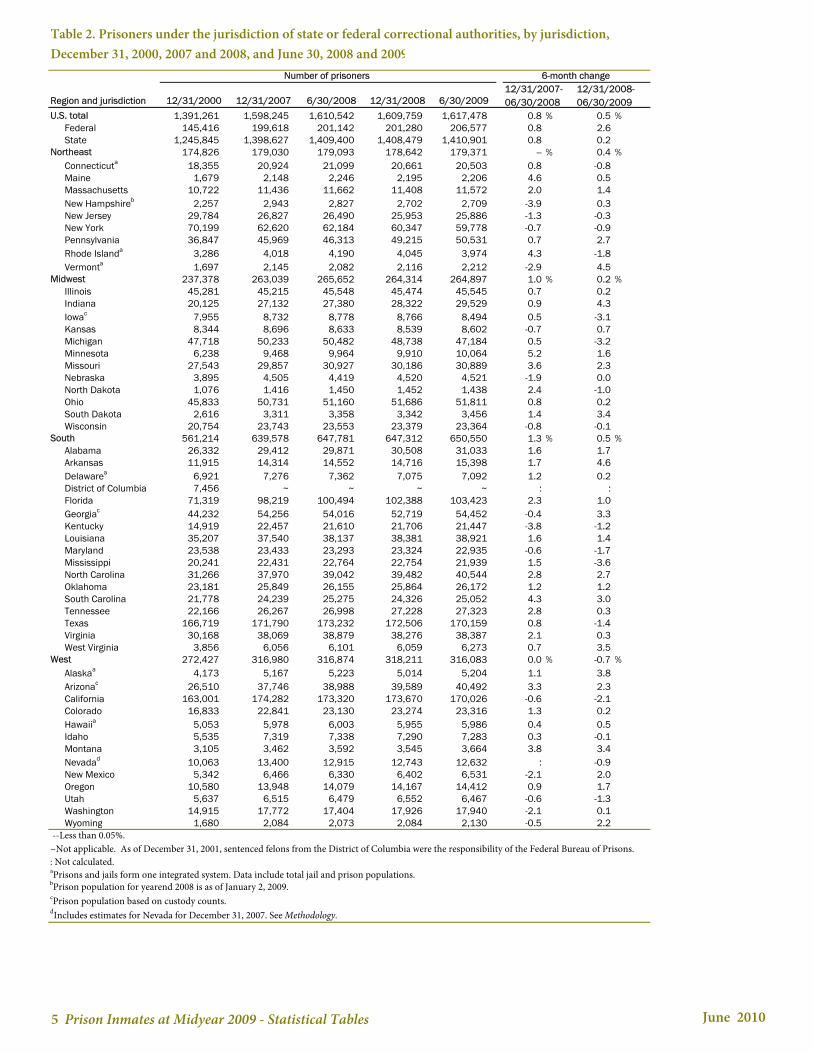
As of June 30, 2009, state and federal correctional authorities had jurisdiction over1,617,478 prisoners, an increase of 0.5% (7,719 prisoners) since December 31, 2008.*Overall, 34 states and the Federal Bureau of Prisons reported increases in their prisonpopulation during this 6-month period. The Federal Bureau of Prisons reported the larg-est increase with a growth of 5,297 prisoners followed by Georgia (up 1,733), Pennsylvania(up 1,316), Indiana (up 1,207), North Carolina (up 1,062), and Florida (up 1,035). Of the16 states reporting decreases, California (down 3,644), Texas (down 2,347), and Michigan(down 1,554) reported the largest decreases. Eighteen states reported changes of less than100 prisoners such as Nebraska (up 1) and Idaho (down 7). The statistical tables includedin this report detail the characteristics of the U.S. prison population and provide data onthe total custody population.*Jurisdiction refers to prisoners under the legal authority of state and federal correctional officials, regardless of where a prisoner is held.
Prison Inmates at Midyear 2009– Statistical Tables
Figure 1. Six-month count and percent change of prisoners under state or federal jurisdiction, June 30, 2000-2009
Selected characteristics of prisoners under state or federal jurisdiction:From December 31, 2009 to June 30, 2009—
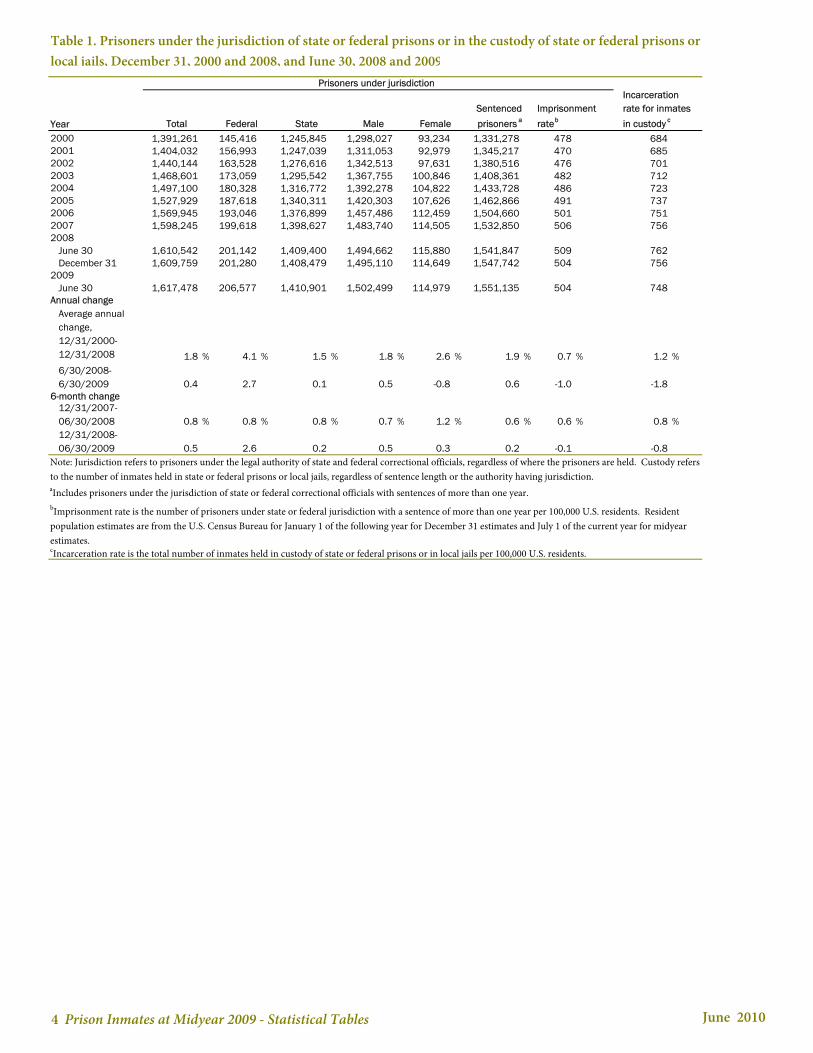
• The U.S. prison population increased by 7,719 prisoners (0.5%), reaching 1,617,478 prisoners (table 1).
• About 70% (5,297 prisoners) of the prison growth occurred at the federal level. The remaining increase of 2,422 prisoners occurred at the state level.
• About 1 in every 198 U.S. residents was imprisoned with a sentence of more than 1 year, a rate of 504 prisoners per 100,000 U.S. residents (table 10).
• Males were imprisoned at a rate 14 times higher than females (954 per 100,000 U.S. residents compared to 68 per 100,000 U.S. residents, respectively).
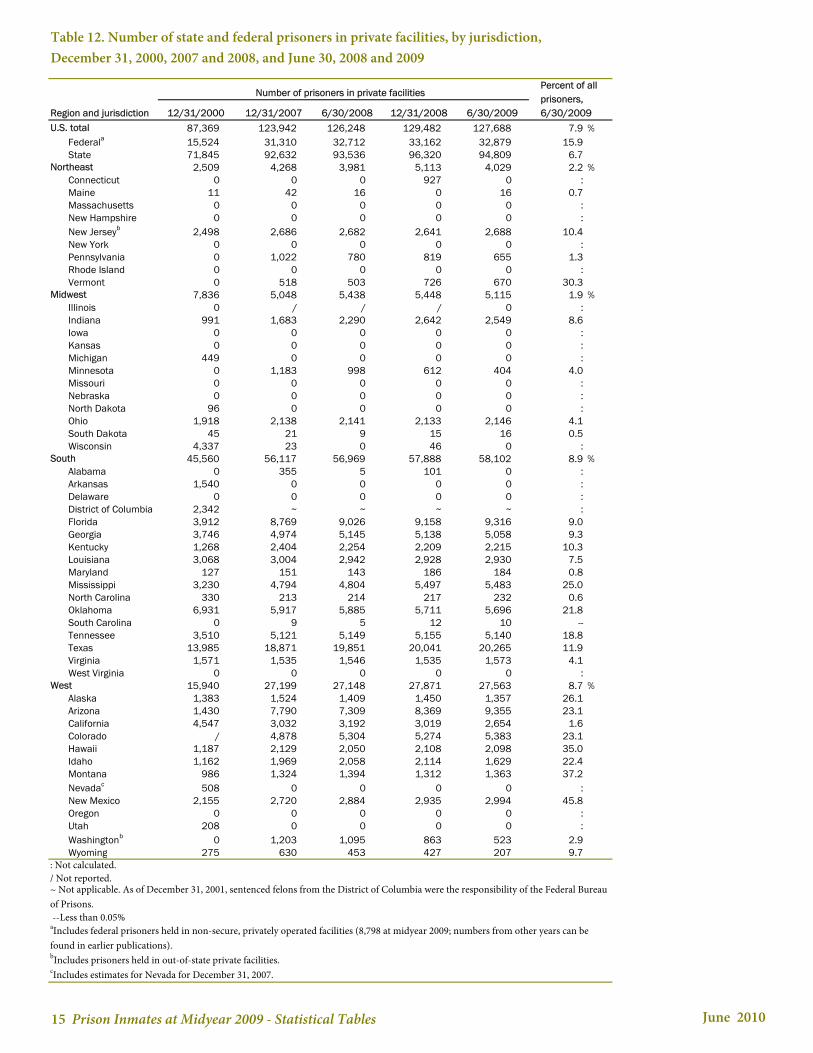
• Approximately 8% (127,688 prisoners) of the prison popu-lation was housed in private facilities (table 11).
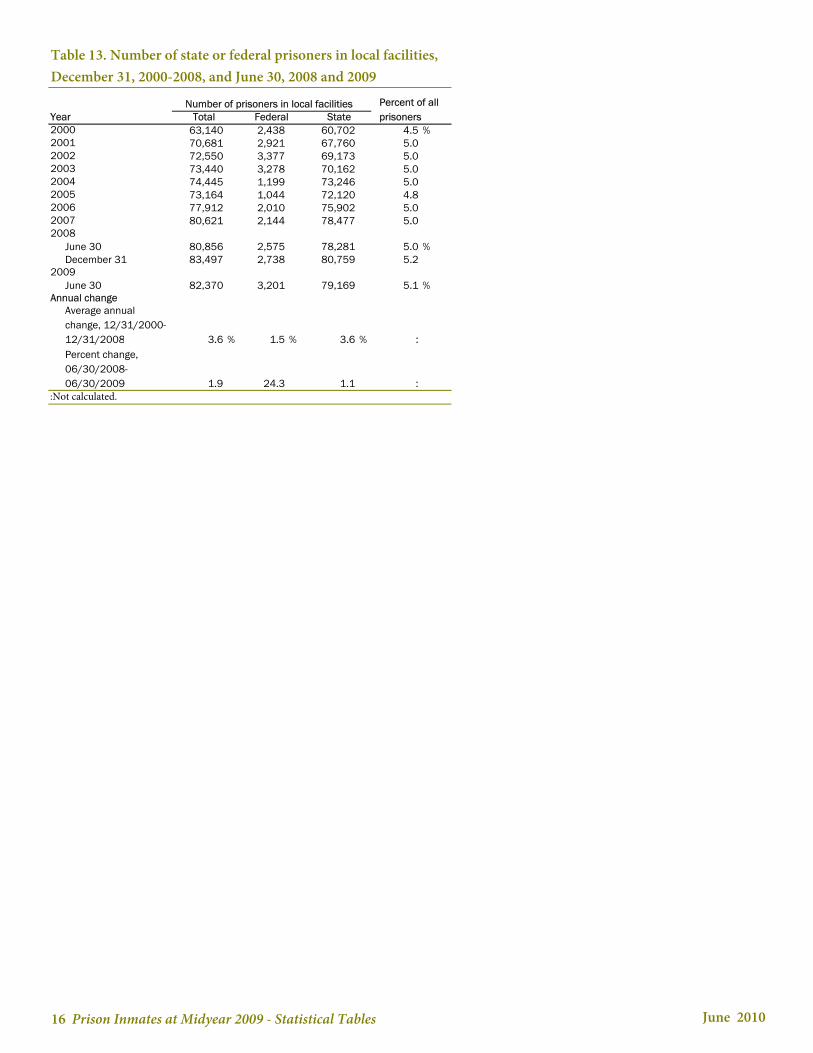
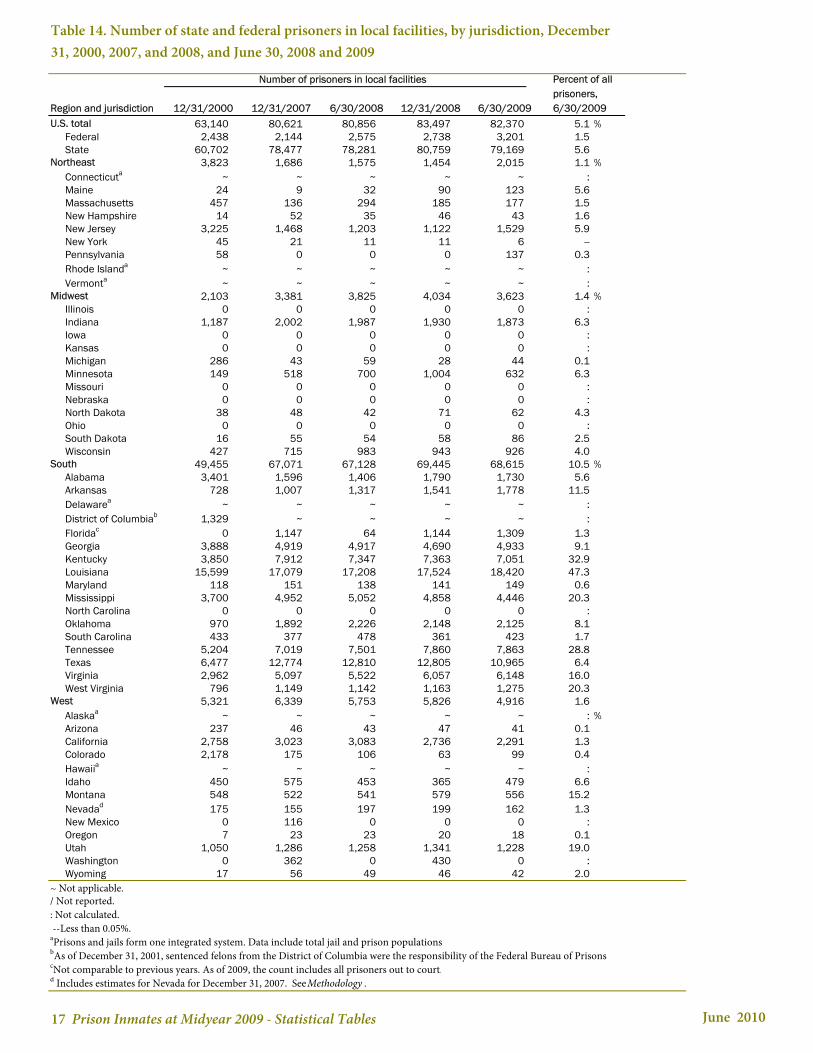
• Another 5.1% (82,370 prisoners) of the prison population was housed in local jails (table 13).
Selected characteristics of inmates held in custody in state or federal prisons or in local jails:As of June 30, 2009—
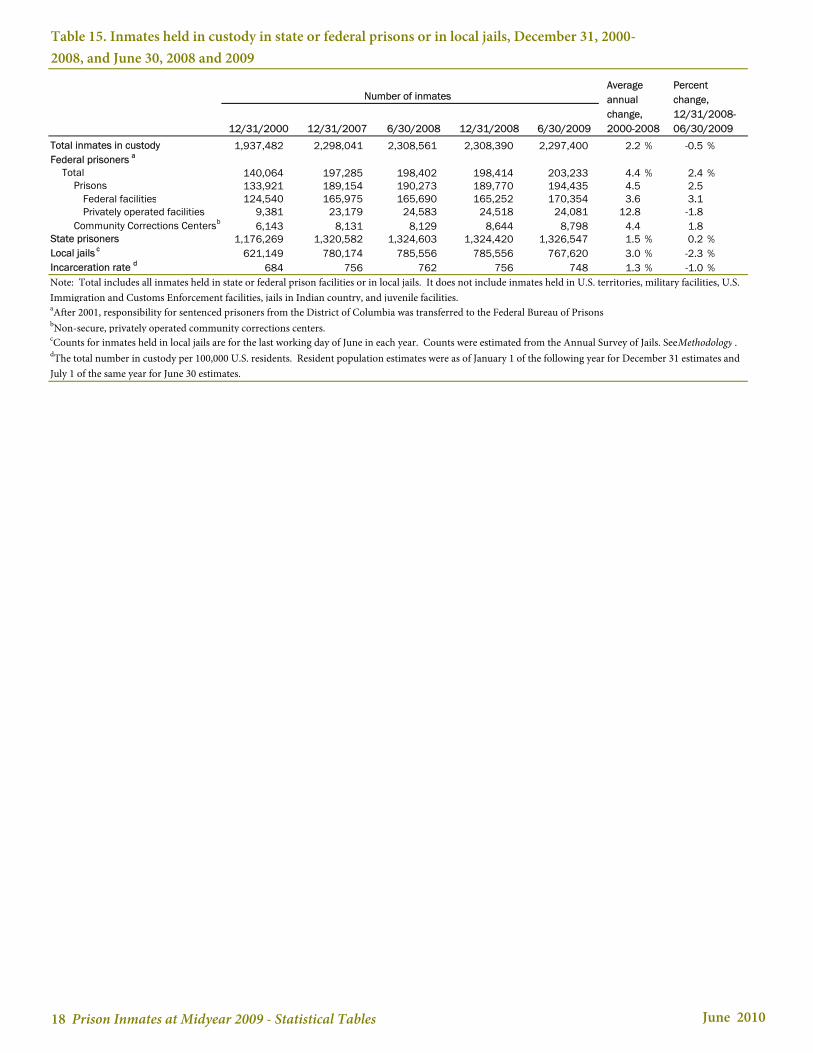
• State and federal prisons and local jails had custody, or physical guardianship, over 2,297,400 inmates, a decrease of 0.5% since yearend 2008 (table 15).
• The decrease in the custody population resulted from the 2.3% (17,936 inmates) decline of inmates held in local jails.
• About 1 in every 134 U.S. residents was held in custody in state or federal prisons or in local jails, a rate of 748 inmates per 100,000 U.S. residents.
• Black non-Hispanic males, with an incarceration rate of 4,749 inmates per 100,000 U.S. residents, were incarcer-ated at a rate more than 6 times higher than white non-Hispanic males (708 inmates per 100,000 U.S. residents) and 2.6 times higher than Hispanic males (1,822 inmates per 100,000 U.S. residents) (table 18).
• One in every 300 black females was incarcerated compared to about 1 in every 1,099 white females and 1 in every 704 Hispanic females.
• Non-U.S. citizens made up 4.1% (94,498 inmates) of the state and federal custody population.
• Another 2,778 inmates in state custody were under age 18.
Figure 2. Change in number of prisoners under state or federal jurisdiction, December 31, 2008 to June 30, 2009
CaliforniaTexas
MichiganMississippiNew YorkMaryland
IowaKentucky
ConnecticutNevada
UtahRhode IslandNew Jersey
WisconsinNorth Dakota
IdahoNebraska
New HampshireMaine
WashingtonDelaware
HawaiiColoradoWyoming
KansasIllinois
TennesseeVermontVirginia
South DakotaMontana
OhioNew Mexico
MinnesotaMassachusetts
AlaskaWest Virginia
OregonOklahomaAlabama
LouisianaArkansasMissouri
South CarolinaArizonaFlorida
North CarolinaIndiana
PennsylvaniaGeorgiaFederal
U.S. total
-4000 -2000 0 2000 4000 6000 8000Change in number of prisoners
June 2010Prison Inmates at Midyear 2009 - Statistical Tables2

2009 Statistical TablesTable 1. Prisoners under the jurisdiction of state or federalprisons or in the custody of state or federal prisons or inlocal jails, December 31, 2000-2008, and June 30, 2008 and2009
Table 2. Prisoners under the jurisdiction of state or federal correctional authorities, by jurisdiction, December 31, 2000, 2007, and 2008, and June 30, 2008 and 2009
Table 3. Male prisoners under the jurisdiction of state or federal correctional authorities, by jurisdiction, December 31, 2000, 2007, and 2008, and June 30, 2008 and 2009
Table 4. Female prisoners under the jurisdiction of state or federal correctional authorities, by jurisdiction, December 31, 2000, 2007, and 2008, and June 30, 2008 and 2009
Table 5. Sentenced prisoners under the jurisdiction of state or federal correctional authorities, by jurisdiction, December 31, 2000, 2007, and 2008, and June 30, 2008 and 2009
Table 6. Number of sentenced male prisoners under the jurisdiction of state and federal correctional authorities, December 31, 2000-2008, and June 30, 2008 and 2009
Table 7. Sentenced male prisoners under the jurisdiction of state or federal correctional authorities, by jurisdiction, December 31, 2000, 2007, and 2008, and June 30, 2008 and 2009
Table 8. Number of sentenced female prisoners under the jurisdiction of state or federal correctional authorities, December 31, 2000-2008, and June 30 2008 and 2009
Table 9. Sentenced female prisoners under the jurisdiction of state or federal correctional authorities, by jurisdiction, December 31, 2000, 2007, and 2008, and June 30 2008 and 2009
Table 10. Imprisonment rates of sentenced prisoners under jurisdiction of state and federal correctional author-ities, by sex and jurisdiction, June 30, 2009
Table 11. Number of state or federal prisoners in private facilities, December 31, 2000-2008, and June 30, 2008 and 2009
Table 12. Number of state and federal prisoners in private facilities, by jurisdiction, December 31, 2000, 2007, and 2008, and June 30, 2008 and 2009
Table 13. Number of state or federal prisoners in local facilities, December 31, 2000-2008, and June 30, 2008 and 2009
Table 14. Number of state and federal prisoners in local facilities, by jurisdiction, December 31, 2000, 2007, and 2008, and June 30, 2008 and 2009
Table 15. Inmates held in custody in state or federal pris-ons or in local jails, December 31, 2000-2008, and June 30, 2008 and 2009
Table 16. Estimated number of inmates held in custody in state or federal prison or in local jails, by sex, race, and Hispanic origin, June 30, 2000-2009
Table 17. Estimated number of inmates held in custody in state or federal prisons or in local jails, by sex, race, His-panic origin, and age, June 30, 2009
Table 18. Estimated number of inmates held in custody in state or federal prisons or in local jails per 100,000 U.S. residents, by sex, race, and Hispanic origin, June 30, 2000-2009
Table 19. Estimated number of inmates held in custody in state or federal prison, or in local jails per 100,000 U.S. res-idents, by sex, race, Hispanic origin, and age, June 30, 2009
Table 20. Reported number of non-U.S. citizens held in custody in state or federal prisons, by sex, region, and jurisdiction, June 30, 2008 and 2009
Table 21. Reported number of inmates under age 18 held in custody in state prisons, by sex, region, and jurisdiction, June 30, 2008 and 2009
June 2010Prison Inmates at Midyear 2009 - Statistical Tables3
Year1,391,261 145,416 1,245,845 1,298,027 93,234 1,331,278 478 6841,404,032 156,993 1,247,039 1,311,053 92,979 1,345,217 470 6851,440,144 163,528 1,276,616 1,342,513 97,631 1,380,516 476 7011,468,601 173,059 1,295,542 1,367,755 100,846 1,408,361 482 7121,497,100 180,328 1,316,772 1,392,278 104,822 1,433,728 486 7231,527,929 187,618 1,340,311 1,420,303 107,626 1,462,866 491 7371,569,945 193,046 1,376,899 1,457,486 112,459 1,504,660 501 7511,598,245 199,618 1,398,627 1,483,740 114,505 1,532,850 506 756
June 30 1,610,542 201,142 1,409,400 1,494,662 115,880 1,541,847 509 762December 31 1,609,759 201,280 1,408,479 1,495,110 114,649 1,547,742 504 756
June 30 1,617,478 206,577 1,410,901 1,502,499 114,979 1,551,135 504 748
Average annual change, 12/31/2000-12/31/2008 1.8 % 4.1 % 1.5 % 1.8 % 2.6 % 1.9 % 0.7 % 1.2 %6/30/2008-6/30/2009 0.4 2.7 0.1 0.5 -0.8 0.6 -1.0 -1.8
12/31/2007-06/30/2008 0.8 % 0.8 % 0.8 % 0.7 % 1.2 % 0.6 % 0.6 % 0.8 %12/31/2008-06/30/2009 0.5 2.6 0.2 0.5 0.3 0.2 -0.1 -0.8
Table 1. Prisoners under the jurisdiction of state or federal prisons or in the custody of state or federal prisons or local jails, December 31, 2000 and 2008, and June 30, 2008 and 2009
2005200620072008
2009
20002001200220032004
Male Female
Imprisonment
rateb
Prisoners under jurisdiction
Total Federal State
Sentenced
prisoners a
Incarceration rate for inmates
in custody c
Note: Jurisdiction refers to prisoners under the legal authority of state and federal correctional officials, regardless of where the prisoners are held. Custody refers to the number of inmates held in state or federal prisons or local jails, regardless of sentence length or the authority having jurisdiction.aIncludes prisoners under the jurisdiction of state or federal correctional officials with sentences of more than one year.bImprisonment rate is the number of prisoners under state or federal jurisdiction with a sentence of more than one year per 100,000 U.S. residents. Resident population estimates are from the U.S. Census Bureau for January 1 of the following year for December 31 estimates and July 1 of the current year for midyear estimates. cIncarceration rate is the total number of inmates held in custody of state or federal prisons or in local jails per 100,000 U.S. residents.
Annual change
6-month change
4 Prison Inmates at Midyear 2009 - Statistical Tables June 2010
1,391,261 1,598,245 1,610,542 1,609,759 1,617,478 0.8 % 0.5 %Federal 145,416 199,618 201,142 201,280 206,577 0.8 2.6State 1,245,845 1,398,627 1,409,400 1,408,479 1,410,901 0.8 0.2
174,826 179,030 179,093 178,642 179,371 -- % 0.4 %Connecticuta 18,355 20,924 21,099 20,661 20,503 0.8 -0.8Maine 1,679 2,148 2,246 2,195 2,206 4.6 0.5Massachusetts 10,722 11,436 11,662 11,408 11,572 2.0 1.4New Hampshireb 2,257 2,943 2,827 2,702 2,709 -3.9 0.3New Jersey 29,784 26,827 26,490 25,953 25,886 -1.3 -0.3New York 70,199 62,620 62,184 60,347 59,778 -0.7 -0.9Pennsylvania 36,847 45,969 46,313 49,215 50,531 0.7 2.7Rhode Islanda 3,286 4,018 4,190 4,045 3,974 4.3 -1.8Vermonta 1,697 2,145 2,082 2,116 2,212 -2.9 4.5
237,378 263,039 265,652 264,314 264,897 1.0 % 0.2 %Illinois 45,281 45,215 45,548 45,474 45,545 0.7 0.2Indiana 20,125 27,132 27,380 28,322 29,529 0.9 4.3Iowac 7,955 8,732 8,778 8,766 8,494 0.5 -3.1Kansas 8,344 8,696 8,633 8,539 8,602 -0.7 0.7Michigan 47,718 50,233 50,482 48,738 47,184 0.5 -3.2Minnesota 6,238 9,468 9,964 9,910 10,064 5.2 1.6Missouri 27,543 29,857 30,927 30,186 30,889 3.6 2.3Nebraska 3,895 4,505 4,419 4,520 4,521 -1.9 0.0North Dakota 1,076 1,416 1,450 1,452 1,438 2.4 -1.0Ohio 45,833 50,731 51,160 51,686 51,811 0.8 0.2South Dakota 2,616 3,311 3,358 3,342 3,456 1.4 3.4Wisconsin 20,754 23,743 23,553 23,379 23,364 -0.8 -0.1
561,214 639,578 647,781 647,312 650,550 1.3 % 0.5 %Alabama 26,332 29,412 29,871 30,508 31,033 1.6 1.7Arkansas 11,915 14,314 14,552 14,716 15,398 1.7 4.6Delawarea 6,921 7,276 7,362 7,075 7,092 1.2 0.2District of Columbia 7,456 ~ ~ ~ ~ : :Florida 71,319 98,219 100,494 102,388 103,423 2.3 1.0Georgiac 44,232 54,256 54,016 52,719 54,452 -0.4 3.3Kentucky 14,919 22,457 21,610 21,706 21,447 -3.8 -1.2Louisiana 35,207 37,540 38,137 38,381 38,921 1.6 1.4Maryland 23,538 23,433 23,293 23,324 22,935 -0.6 -1.7Mississippi 20,241 22,431 22,764 22,754 21,939 1.5 -3.6North Carolina 31,266 37,970 39,042 39,482 40,544 2.8 2.7Oklahoma 23,181 25,849 26,155 25,864 26,172 1.2 1.2South Carolina 21,778 24,239 25,275 24,326 25,052 4.3 3.0Tennessee 22,166 26,267 26,998 27,228 27,323 2.8 0.3Texas 166,719 171,790 173,232 172,506 170,159 0.8 -1.4Virginia 30,168 38,069 38,879 38,276 38,387 2.1 0.3West Virginia 3,856 6,056 6,101 6,059 6,273 0.7 3.5
272,427 316,980 316,874 318,211 316,083 0.0 % -0.7 %Alaskaa 4,173 5,167 5,223 5,014 5,204 1.1 3.8Arizonac 26,510 37,746 38,988 39,589 40,492 3.3 2.3California 163,001 174,282 173,320 173,670 170,026 -0.6 -2.1Colorado 16,833 22,841 23,130 23,274 23,316 1.3 0.2Hawaiia 5,053 5,978 6,003 5,955 5,986 0.4 0.5Idaho 5,535 7,319 7,338 7,290 7,283 0.3 -0.1Montana 3,105 3,462 3,592 3,545 3,664 3.8 3.4Nevadad 10,063 13,400 12,915 12,743 12,632 : -0.9New Mexico 5,342 6,466 6,330 6,402 6,531 -2.1 2.0Oregon 10,580 13,948 14,079 14,167 14,412 0.9 1.7Utah 5,637 6,515 6,479 6,552 6,467 -0.6 -1.3Washington 14,915 17,772 17,404 17,926 17,940 -2.1 0.1Wyoming 1,680 2,084 2,073 2,084 2,130 -0.5 2.2
dIncludes estimates for Nevada for December 31, 2007. See Methodology.
West
Table 2. Prisoners under the jurisdiction of state or federal correctional authorities, by jurisdiction, December 31, 2000, 2007 and 2008, and June 30, 2008 and 2009
~Not applicable. As of December 31, 2001, sentenced felons from the District of Columbia were the responsibility of the Federal Bureau of Prisons.: Not calculated.aPrisons and jails form one integrated system. Data include total jail and prison populations.
Region and jurisdiction
U.S. total
Northeast
Midwest
South
12/31/2000 12/31/2007 6/30/2008 12/31/2008
bPrison population for yearend 2008 is as of January 2, 2009.
12/31/2007-06/30/2008
12/31/2008-06/30/2009
6-month change
cPrison population based on custody counts.
--Less than 0.05%.
6/30/2009
Number of prisoners
5 Prison Inmates at Midyear 2009 - Statistical Tables June 2010

1,298,027 1,483,740 1,494,662 1,495,110 1,502,499 -0.7 % 0.5 %Federal 135,171 186,280 187,660 188,007 192,831 -0.7 2.6State 1,162,856 1,297,460 1,307,002 1,307,103 1,309,668 -0.7 0.2
165,744 169,336 169,173 169,041 169,738 0.1 % 0.4 %Connecticuta 16,949 19,428 19,521 19,159 19,027 -0.5 -0.7Maine 1,613 2,009 2,078 2,039 2,048 -3.3 0.4Massachusetts 10,059 10,646 10,812 10,657 10,796 -1.5 1.3New Hampshireb 2,137 2,741 2,619 2,521 2,531 4.7 0.4New Jersey 28,134 25,417 25,113 24,654 24,590 1.2 -0.3New York 66,919 59,866 59,493 57,760 57,177 0.6 -1.0Pennsylvania 35,268 43,506 43,721 46,451 47,756 -0.5 2.8Rhode Islanda 3,048 3,736 3,885 3,802 3,738 -3.8 -1.7Vermonta 1,617 1,987 1,931 1,998 2,075 2.9 3.9
222,780 245,110 247,663 246,531 247,143 -1.0 % 0.2 %Illinois 42,432 42,391 42,722 42,753 42,933 -0.8 0.4Indiana 18,673 24,837 25,048 25,829 26,906 -0.8 4.2Iowac 7,363 8,015 8,021 8,017 7,822 -0.1 -2.4Kansas 7,840 8,071 8,051 7,970 8,023 0.2 0.7Michigan 45,587 48,153 48,384 46,781 45,384 -0.5 -3.0Minnesota 5,870 8,866 9,298 9,240 9,351 -4.6 1.2Missouri 25,550 27,335 28,428 27,737 28,402 -3.8 2.4Nebraska 3,629 4,106 4,038 4,130 4,146 1.7 0.4North Dakota 1,008 1,269 1,289 1,292 1,270 -1.6 -1.7Ohio 43,025 46,909 47,255 47,773 47,853 -0.7 0.2South Dakota 2,416 2,942 3,012 2,987 3,060 -2.3 2.4Wisconsin 19,387 22,216 22,117 22,022 21,993 0.4 -0.1
521,562 591,075 598,182 598,262 601,563 -1.2 % 0.6 %Alabama 24,506 27,254 27,704 28,277 28,670 -1.6 1.4Arkansas 11,143 13,248 13,484 13,656 14,321 -1.8 4.9Delawarea 6,324 6,699 6,757 6,518 6,530 -0.9 0.2District of Columbia 7,100 ~ ~ ~ ~ : :Florida 67,214 91,365 93,529 95,237 96,074 -2.3 0.9Georgiac 41,474 50,711 50,457 49,027 50,690 0.5 3.4Kentucky 13,858 20,016 19,284 19,436 19,177 3.8 -1.3Louisiana 32,988 35,082 35,601 35,865 36,364 -1.5 1.4Maryland 22,319 22,249 22,144 22,264 21,978 0.5 -1.3Mississippi 18,572 20,469 20,763 20,773 20,140 -1.4 -3.0North Carolina 29,363 35,344 36,248 36,704 37,635 -2.5 2.5Oklahoma 20,787 23,242 23,539 23,340 23,583 -1.3 1.0South Carolina 20,358 22,635 23,515 22,693 23,400 -3.7 3.1Tennessee 20,797 24,344 24,884 25,099 25,207 -2.2 0.4Texas 153,097 157,859 158,950 158,653 156,760 -0.7 -1.2Virginia 28,109 35,136 35,855 35,309 35,421 -2.0 0.3West Virginia 3,553 5,422 5,468 5,411 5,613 -0.8 3.7
252,770 291,939 291,984 293,269 291,224 -- % -0.7 %Alaskaa 3,889 4,603 4,617 4,511 4,599 -0.3 2.0Arizonac 24,546 34,286 35,343 35,823 36,668 -3.0 2.4California 151,840 162,654 161,713 162,050 158,793 0.6 -2.0Colorado 15,500 20,506 20,842 20,980 21,060 -1.6 0.4Hawaiia 4,492 5,232 5,245 5,227 5,243 -0.2 0.3Idaho 5,042 6,519 6,541 6,532 6,509 -0.3 -0.4Montana 2,799 3,161 3,256 3,184 3,272 -2.9 2.8Nevadad 9,217 12,221 11,940 11,761 11,643 : -1.0New Mexico 4,831 5,890 5,754 5,833 5,916 2.4 1.4Oregon 9,984 12,888 12,982 13,058 13,286 -0.7 1.7Utah 5,256 5,883 5,873 5,912 5,865 0.2 -0.8Washington 13,850 16,258 16,041 16,522 16,457 1.4 -0.4Wyoming 1,524 1,838 1,837 1,876 1,913 0.1 2.0
12/31/2008-06/30/2009
12/31/2007-06/30/2008
6-month change
Table 3. Male prisoners under the jurisdiction of state or federal correctional authorities, by jurisdiction, December 31, 2000, 2007, and 2008, and June 30, 2008 and 2009
Number of male prisonersRegion and jurisdiction 12/31/2000 12/31/2007 6/30/2008 12/31/2008 6/30/2009U.S. total
Northeast
Midwest
South
West
~Not applicable. As of December 31, 2001, sentenced felons from the District of Columbia were the responsbility of the Federal Bureau of Prisons.:Not calculated.
aPrisons and jails form one integrated system. Data include total jail and prison populations.
cPrison population based on custody counts. dIncludes estimates for Nevada for December 31, 2007. See Methodology.
--Less than 0.05%
bJurisdiction count of yearend 2008 is as of January 2, 2009.
6 Prison Inmates at Midyear 2009 - Statistical Tables June 2010
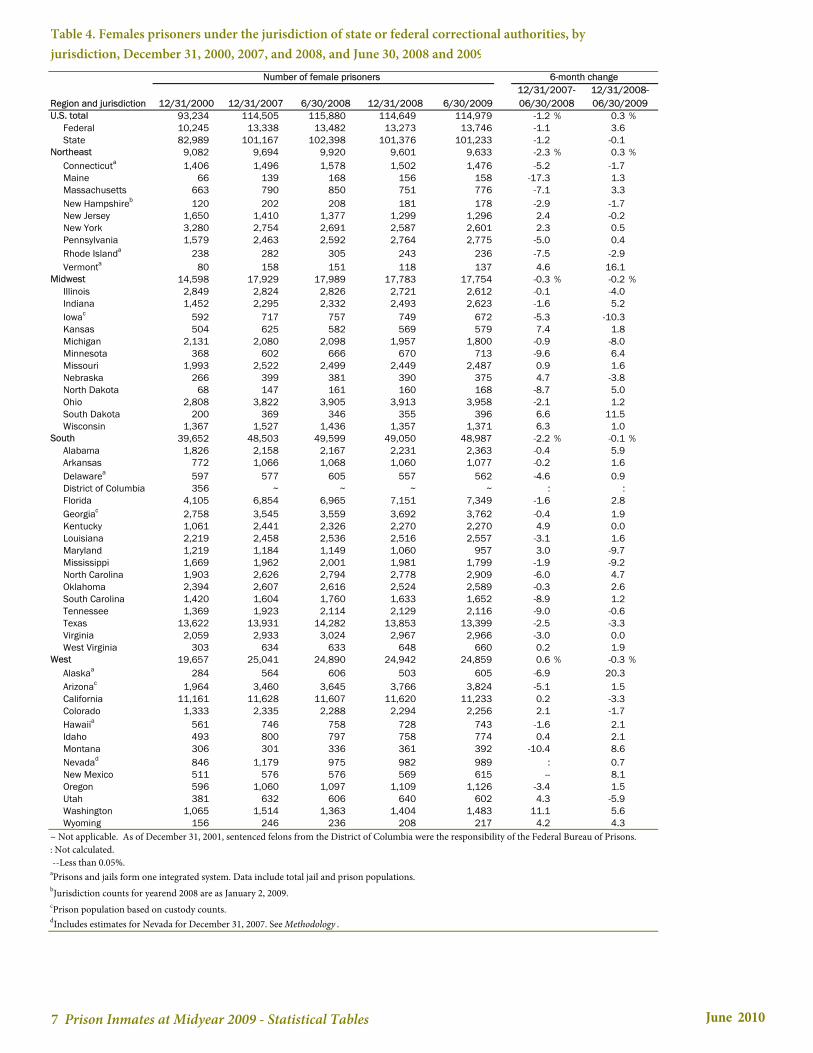
93,234 114,505 115,880 114,649 114,979 -1.2 % 0.3 %Federal 10,245 13,338 13,482 13,273 13,746 -1.1 3.6State 82,989 101,167 102,398 101,376 101,233 -1.2 -0.1
9,082 9,694 9,920 9,601 9,633 -2.3 % 0.3 %Connecticuta 1,406 1,496 1,578 1,502 1,476 -5.2 -1.7Maine 66 139 168 156 158 -17.3 1.3Massachusetts 663 790 850 751 776 -7.1 3.3New Hampshireb 120 202 208 181 178 -2.9 -1.7New Jersey 1,650 1,410 1,377 1,299 1,296 2.4 -0.2New York 3,280 2,754 2,691 2,587 2,601 2.3 0.5Pennsylvania 1,579 2,463 2,592 2,764 2,775 -5.0 0.4Rhode Islanda 238 282 305 243 236 -7.5 -2.9Vermonta 80 158 151 118 137 4.6 16.1
14,598 17,929 17,989 17,783 17,754 -0.3 % -0.2 %Illinois 2,849 2,824 2,826 2,721 2,612 -0.1 -4.0Indiana 1,452 2,295 2,332 2,493 2,623 -1.6 5.2Iowac 592 717 757 749 672 -5.3 -10.3Kansas 504 625 582 569 579 7.4 1.8Michigan 2,131 2,080 2,098 1,957 1,800 -0.9 -8.0Minnesota 368 602 666 670 713 -9.6 6.4Missouri 1,993 2,522 2,499 2,449 2,487 0.9 1.6Nebraska 266 399 381 390 375 4.7 -3.8North Dakota 68 147 161 160 168 -8.7 5.0Ohio 2,808 3,822 3,905 3,913 3,958 -2.1 1.2South Dakota 200 369 346 355 396 6.6 11.5Wisconsin 1,367 1,527 1,436 1,357 1,371 6.3 1.0
39,652 48,503 49,599 49,050 48,987 -2.2 % -0.1 %Alabama 1,826 2,158 2,167 2,231 2,363 -0.4 5.9Arkansas 772 1,066 1,068 1,060 1,077 -0.2 1.6Delawarea 597 577 605 557 562 -4.6 0.9District of Columbia 356 ~ ~ ~ ~ : :Florida 4,105 6,854 6,965 7,151 7,349 -1.6 2.8Georgiac 2,758 3,545 3,559 3,692 3,762 -0.4 1.9Kentucky 1,061 2,441 2,326 2,270 2,270 4.9 0.0Louisiana 2,219 2,458 2,536 2,516 2,557 -3.1 1.6Maryland 1,219 1,184 1,149 1,060 957 3.0 -9.7Mississippi 1,669 1,962 2,001 1,981 1,799 -1.9 -9.2North Carolina 1,903 2,626 2,794 2,778 2,909 -6.0 4.7Oklahoma 2,394 2,607 2,616 2,524 2,589 -0.3 2.6South Carolina 1,420 1,604 1,760 1,633 1,652 -8.9 1.2Tennessee 1,369 1,923 2,114 2,129 2,116 -9.0 -0.6Texas 13,622 13,931 14,282 13,853 13,399 -2.5 -3.3Virginia 2,059 2,933 3,024 2,967 2,966 -3.0 0.0West Virginia 303 634 633 648 660 0.2 1.9
19,657 25,041 24,890 24,942 24,859 0.6 % -0.3 %Alaskaa 284 564 606 503 605 -6.9 20.3Arizonac 1,964 3,460 3,645 3,766 3,824 -5.1 1.5California 11,161 11,628 11,607 11,620 11,233 0.2 -3.3Colorado 1,333 2,335 2,288 2,294 2,256 2.1 -1.7Hawaiia 561 746 758 728 743 -1.6 2.1Idaho 493 800 797 758 774 0.4 2.1Montana 306 301 336 361 392 -10.4 8.6Nevadad 846 1,179 975 982 989 : 0.7New Mexico 511 576 576 569 615 -- 8.1Oregon 596 1,060 1,097 1,109 1,126 -3.4 1.5Utah 381 632 606 640 602 4.3 -5.9Washington 1,065 1,514 1,363 1,404 1,483 11.1 5.6Wyoming 156 246 236 208 217 4.2 4.3
: Not calculated.
aPrisons and jails form one integrated system. Data include total jail and prison populations.
cPrison population based on custody counts.dIncludes estimates for Nevada for December 31, 2007. See Methodology .
U.S. total
Northeast
Midwest
South
West
~ Not applicable. As of December 31, 2001, sentenced felons from the District of Columbia were the responsibility of the Federal Bureau of Prisons.
--Less than 0.05%.
bJurisdiction counts for yearend 2008 are as January 2, 2009.
12/31/2007-06/30/2008
12/31/2008-06/30/2009
Number of female prisoners 6-month change
Region and jurisdiction 12/31/2000 12/31/2007 6/30/2008 12/31/2008 6/30/2009
Table 4. Females prisoners under the jurisdiction of state or federal correctional authorities, by jurisdiction, December 31, 2000, 2007, and 2008, and June 30, 2008 and 2009
7 Prison Inmates at Midyear 2009 - Statistical Tables June 2010
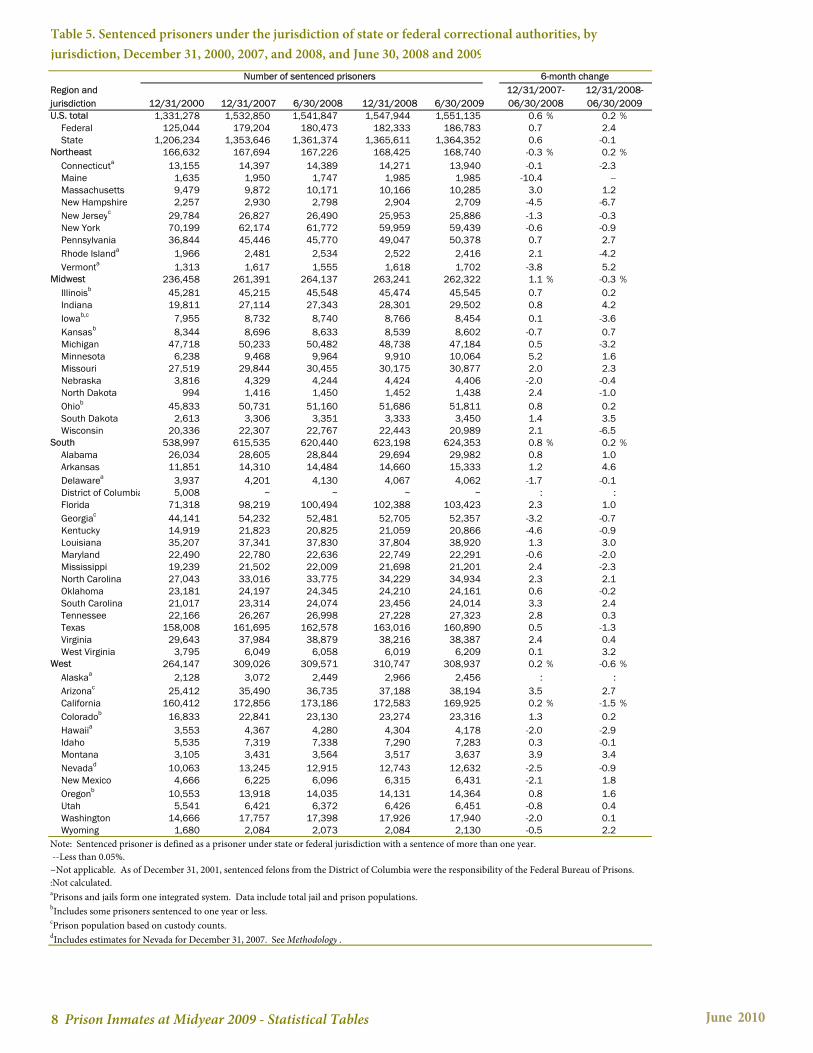
1,331,278 1,532,850 1,541,847 1,547,944 1,551,135 0.6 % 0.2 %Federal 125,044 179,204 180,473 182,333 186,783 0.7 2.4State 1,206,234 1,353,646 1,361,374 1,365,611 1,364,352 0.6 -0.1
166,632 167,694 167,226 168,425 168,740 -0.3 % 0.2 %Connecticuta 13,155 14,397 14,389 14,271 13,940 -0.1 -2.3Maine 1,635 1,950 1,747 1,985 1,985 -10.4 --Massachusetts 9,479 9,872 10,171 10,166 10,285 3.0 1.2New Hampshire 2,257 2,930 2,798 2,904 2,709 -4.5 -6.7New Jerseyc 29,784 26,827 26,490 25,953 25,886 -1.3 -0.3New York 70,199 62,174 61,772 59,959 59,439 -0.6 -0.9Pennsylvania 36,844 45,446 45,770 49,047 50,378 0.7 2.7Rhode Islanda 1,966 2,481 2,534 2,522 2,416 2.1 -4.2Vermonta 1,313 1,617 1,555 1,618 1,702 -3.8 5.2
236,458 261,391 264,137 263,241 262,322 1.1 % -0.3 %Illinoisb 45,281 45,215 45,548 45,474 45,545 0.7 0.2Indiana 19,811 27,114 27,343 28,301 29,502 0.8 4.2Iowab,c 7,955 8,732 8,740 8,766 8,454 0.1 -3.6Kansasb 8,344 8,696 8,633 8,539 8,602 -0.7 0.7Michigan 47,718 50,233 50,482 48,738 47,184 0.5 -3.2Minnesota 6,238 9,468 9,964 9,910 10,064 5.2 1.6Missouri 27,519 29,844 30,455 30,175 30,877 2.0 2.3Nebraska 3,816 4,329 4,244 4,424 4,406 -2.0 -0.4North Dakota 994 1,416 1,450 1,452 1,438 2.4 -1.0Ohiob 45,833 50,731 51,160 51,686 51,811 0.8 0.2South Dakota 2,613 3,306 3,351 3,333 3,450 1.4 3.5Wisconsin 20,336 22,307 22,767 22,443 20,989 2.1 -6.5
538,997 615,535 620,440 623,198 624,353 0.8 % 0.2 %Alabama 26,034 28,605 28,844 29,694 29,982 0.8 1.0Arkansas 11,851 14,310 14,484 14,660 15,333 1.2 4.6Delawarea 3,937 4,201 4,130 4,067 4,062 -1.7 -0.1District of Columbia 5,008 ~ ~ ~ ~ : :Florida 71,318 98,219 100,494 102,388 103,423 2.3 1.0Georgiac 44,141 54,232 52,481 52,705 52,357 -3.2 -0.7Kentucky 14,919 21,823 20,825 21,059 20,866 -4.6 -0.9Louisiana 35,207 37,341 37,830 37,804 38,920 1.3 3.0Maryland 22,490 22,780 22,636 22,749 22,291 -0.6 -2.0Mississippi 19,239 21,502 22,009 21,698 21,201 2.4 -2.3North Carolina 27,043 33,016 33,775 34,229 34,934 2.3 2.1Oklahoma 23,181 24,197 24,345 24,210 24,161 0.6 -0.2South Carolina 21,017 23,314 24,074 23,456 24,014 3.3 2.4Tennessee 22,166 26,267 26,998 27,228 27,323 2.8 0.3Texas 158,008 161,695 162,578 163,016 160,890 0.5 -1.3Virginia 29,643 37,984 38,879 38,216 38,387 2.4 0.4West Virginia 3,795 6,049 6,058 6,019 6,209 0.1 3.2
264,147 309,026 309,571 310,747 308,937 0.2 % -0.6 %Alaskaa 2,128 3,072 2,449 2,966 2,456 : :Arizonac 25,412 35,490 36,735 37,188 38,194 3.5 2.7California 160,412 172,856 173,186 172,583 169,925 0.2 % -1.5 %Coloradob 16,833 22,841 23,130 23,274 23,316 1.3 0.2Hawaiia 3,553 4,367 4,280 4,304 4,178 -2.0 -2.9Idaho 5,535 7,319 7,338 7,290 7,283 0.3 -0.1Montana 3,105 3,431 3,564 3,517 3,637 3.9 3.4Nevadad 10,063 13,245 12,915 12,743 12,632 -2.5 -0.9New Mexico 4,666 6,225 6,096 6,315 6,431 -2.1 1.8Oregonb 10,553 13,918 14,035 14,131 14,364 0.8 1.6Utah 5,541 6,421 6,372 6,426 6,451 -0.8 0.4Washington 14,666 17,757 17,398 17,926 17,940 -2.0 0.1Wyoming 1,680 2,084 2,073 2,084 2,130 -0.5 2.2
bIncludes some prisoners sentenced to one year or less. cPrison population based on custody counts. dIncludes estimates for Nevada for December 31, 2007. See Methodology .
West
Note: Sentenced prisoner is defined as a prisoner under state or federal jurisdiction with a sentence of more than one year.
~Not applicable. As of December 31, 2001, sentenced felons from the District of Columbia were the responsibility of the Federal Bureau of Prisons. :Not calculated.aPrisons and jails form one integrated system. Data include total jail and prison populations.
--Less than 0.05%.
12/31/2008-06/30/2009
Number of sentenced prisoners 6-month changeRegion and jurisdiction
Table 5. Sentenced prisoners under the jurisdiction of state or federal correctional authorities, by jurisdiction, December 31, 2000, 2007, and 2008, and June 30, 2008 and 2009
12/31/2000 12/31/2007 6/30/2008 12/31/2008 6/30/2009U.S. total
Northeast
Midwest
South
12/31/2007-06/30/2008
8 Prison Inmates at Midyear 2009 - Statistical Tables June 2010
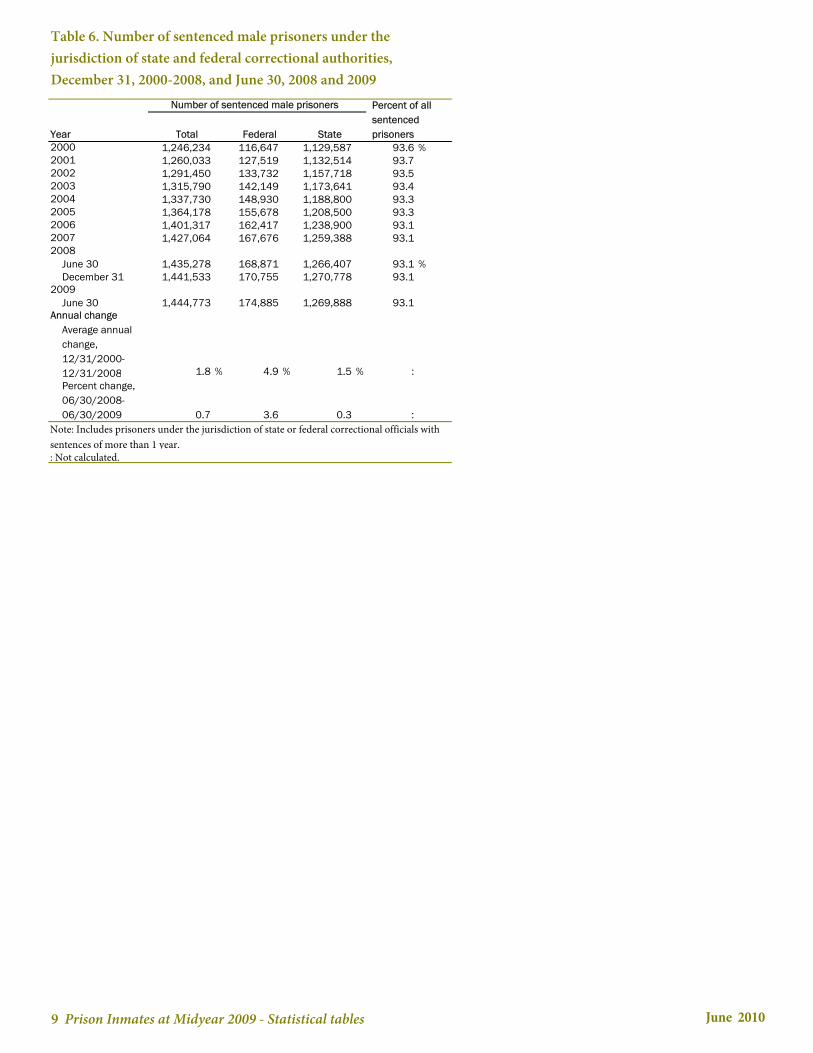
1,246,234 116,647 1,129,587 93.6 %1,260,033 127,519 1,132,514 93.71,291,450 133,732 1,157,718 93.51,315,790 142,149 1,173,641 93.41,337,730 148,930 1,188,800 93.31,364,178 155,678 1,208,500 93.31,401,317 162,417 1,238,900 93.11,427,064 167,676 1,259,388 93.1
June 30 1,435,278 168,871 1,266,407 93.1 %December 31 1,441,533 170,755 1,270,778 93.1
June 30 1,444,773 174,885 1,269,888 93.1
Average annual change, 12/31/2000-12/31/2008 1.8 % 4.9 % 1.5 % :Percent change, 06/30/2008-06/30/2009 0.7 3.6 0.3 :
2008
2009
Annual change
Note: Includes prisoners under the jurisdiction of state or federal correctional officials with sentences of more than 1 year.: Not calculated.
20032004200520062007
Table 6. Number of sentenced male prisoners under the jurisdiction of state and federal correctional authorities, December 31, 2000-2008, and June 30, 2008 and 2009
Year200020012002
Federal State
Number of sentenced male prisoners
Total
Percent of all sentenced prisoners
9 Prison Inmates at Midyear 2009 - Statistical tables June 2010
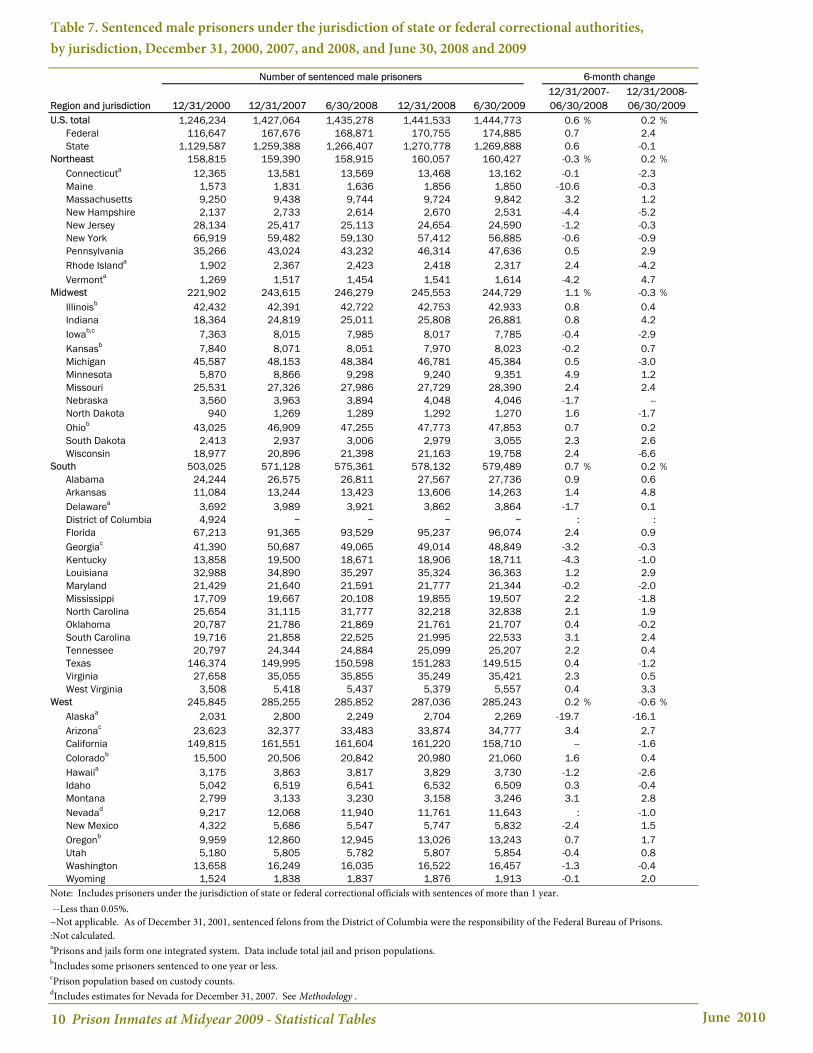
1,246,234 1,427,064 1,435,278 1,441,533 1,444,773 0.6 % 0.2 %Federal 116,647 167,676 168,871 170,755 174,885 0.7 2.4State 1,129,587 1,259,388 1,266,407 1,270,778 1,269,888 0.6 -0.1
158,815 159,390 158,915 160,057 160,427 -0.3 % 0.2 %Connecticuta 12,365 13,581 13,569 13,468 13,162 -0.1 -2.3Maine 1,573 1,831 1,636 1,856 1,850 -10.6 -0.3Massachusetts 9,250 9,438 9,744 9,724 9,842 3.2 1.2New Hampshire 2,137 2,733 2,614 2,670 2,531 -4.4 -5.2New Jersey 28,134 25,417 25,113 24,654 24,590 -1.2 -0.3New York 66,919 59,482 59,130 57,412 56,885 -0.6 -0.9Pennsylvania 35,266 43,024 43,232 46,314 47,636 0.5 2.9Rhode Islanda 1,902 2,367 2,423 2,418 2,317 2.4 -4.2Vermonta 1,269 1,517 1,454 1,541 1,614 -4.2 4.7
221,902 243,615 246,279 245,553 244,729 1.1 % -0.3 %Illinoisb 42,432 42,391 42,722 42,753 42,933 0.8 0.4Indiana 18,364 24,819 25,011 25,808 26,881 0.8 4.2Iowab,c 7,363 8,015 7,985 8,017 7,785 -0.4 -2.9Kansasb 7,840 8,071 8,051 7,970 8,023 -0.2 0.7Michigan 45,587 48,153 48,384 46,781 45,384 0.5 -3.0Minnesota 5,870 8,866 9,298 9,240 9,351 4.9 1.2Missouri 25,531 27,326 27,986 27,729 28,390 2.4 2.4Nebraska 3,560 3,963 3,894 4,048 4,046 -1.7 --North Dakota 940 1,269 1,289 1,292 1,270 1.6 -1.7Ohiob 43,025 46,909 47,255 47,773 47,853 0.7 0.2South Dakota 2,413 2,937 3,006 2,979 3,055 2.3 2.6Wisconsin 18,977 20,896 21,398 21,163 19,758 2.4 -6.6
503,025 571,128 575,361 578,132 579,489 0.7 % 0.2 %Alabama 24,244 26,575 26,811 27,567 27,736 0.9 0.6Arkansas 11,084 13,244 13,423 13,606 14,263 1.4 4.8Delawarea 3,692 3,989 3,921 3,862 3,864 -1.7 0.1District of Columbia 4,924 ~ ~ ~ ~ : :Florida 67,213 91,365 93,529 95,237 96,074 2.4 0.9Georgiac 41,390 50,687 49,065 49,014 48,849 -3.2 -0.3Kentucky 13,858 19,500 18,671 18,906 18,711 -4.3 -1.0Louisiana 32,988 34,890 35,297 35,324 36,363 1.2 2.9Maryland 21,429 21,640 21,591 21,777 21,344 -0.2 -2.0Mississippi 17,709 19,667 20,108 19,855 19,507 2.2 -1.8North Carolina 25,654 31,115 31,777 32,218 32,838 2.1 1.9Oklahoma 20,787 21,786 21,869 21,761 21,707 0.4 -0.2South Carolina 19,716 21,858 22,525 21,995 22,533 3.1 2.4Tennessee 20,797 24,344 24,884 25,099 25,207 2.2 0.4Texas 146,374 149,995 150,598 151,283 149,515 0.4 -1.2Virginia 27,658 35,055 35,855 35,249 35,421 2.3 0.5West Virginia 3,508 5,418 5,437 5,379 5,557 0.4 3.3
245,845 285,255 285,852 287,036 285,243 0.2 % -0.6 %Alaskaa 2,031 2,800 2,249 2,704 2,269 -19.7 -16.1Arizonac 23,623 32,377 33,483 33,874 34,777 3.4 2.7California 149,815 161,551 161,604 161,220 158,710 -- -1.6Coloradob 15,500 20,506 20,842 20,980 21,060 1.6 0.4Hawaiia 3,175 3,863 3,817 3,829 3,730 -1.2 -2.6Idaho 5,042 6,519 6,541 6,532 6,509 0.3 -0.4Montana 2,799 3,133 3,230 3,158 3,246 3.1 2.8Nevadad 9,217 12,068 11,940 11,761 11,643 : -1.0New Mexico 4,322 5,686 5,547 5,747 5,832 -2.4 1.5Oregonb 9,959 12,860 12,945 13,026 13,243 0.7 1.7Utah 5,180 5,805 5,782 5,807 5,854 -0.4 0.8Washington 13,658 16,249 16,035 16,522 16,457 -1.3 -0.4Wyoming 1,524 1,838 1,837 1,876 1,913 -0.1 2.0
Table 7. Sentenced male prisoners under the jurisdiction of state or federal correctional authorities, by jurisdiction, December 31, 2000, 2007, and 2008, and June 30, 2008 and 2009
U.S. total
Northeast
Midwest
South
12/31/2007-06/30/2008
12/31/2008-06/30/2009
6-month changeNumber of sentenced male prisoners
Region and jurisdiction 12/31/2000 12/31/2007 6/30/2008 12/31/2008 6/30/2009
West
cPrison population based on custody counts. dIncludes estimates for Nevada for December 31, 2007. See Methodology .
Note: Includes prisoners under the jurisdiction of state or federal correctional officials with sentences of more than 1 year.
~Not applicable. As of December 31, 2001, sentenced felons from the District of Columbia were the responsibility of the Federal Bureau of Prisons. :Not calculated.aPrisons and jails form one integrated system. Data include total jail and prison populations. bIncludes some prisoners sentenced to one year or less.
--Less than 0.05%.
10 Prison Inmates at Midyear 2009 - Statistical Tables June 2010
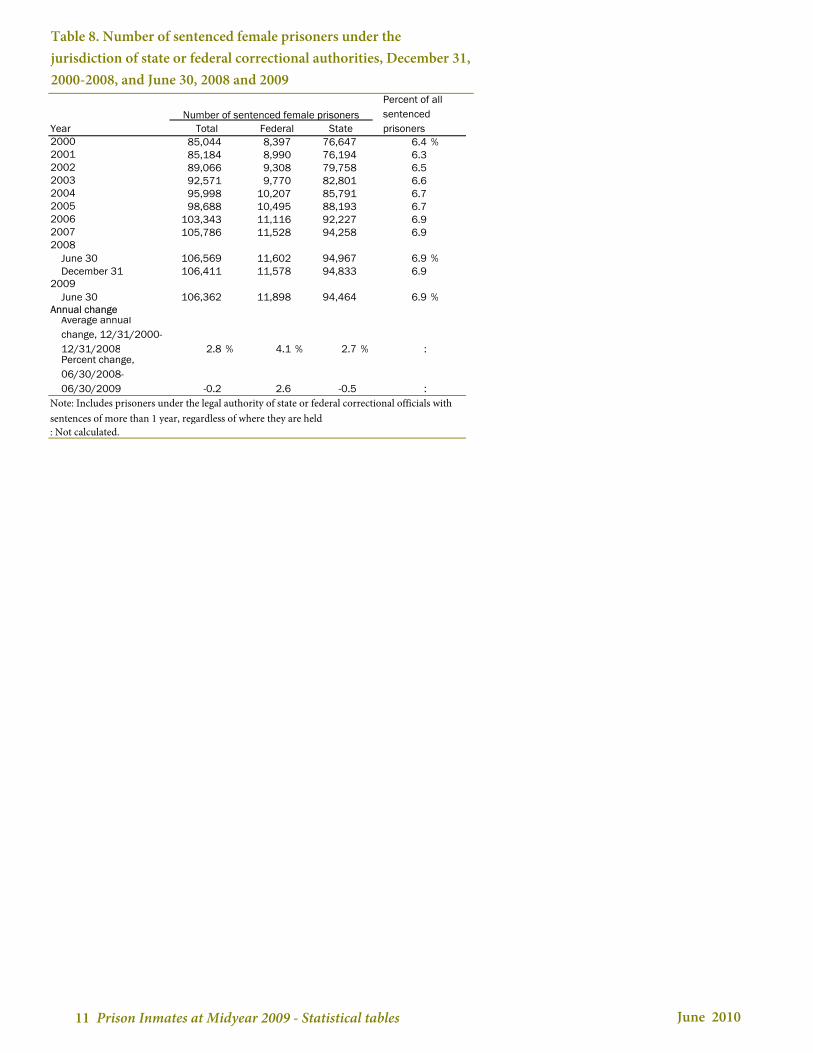
85,044 8,397 76,647 6.4 %85,184 8,990 76,194 6.389,066 9,308 79,758 6.592,571 9,770 82,801 6.695,998 10,207 85,791 6.798,688 10,495 88,193 6.7
103,343 11,116 92,227 6.9105,786 11,528 94,258 6.9
June 30 106,569 11,602 94,967 6.9 %December 31 106,411 11,578 94,833 6.9
June 30 106,362 11,898 94,464 6.9 %
Average annual change, 12/31/2000-12/31/2008 2.8 % 4.1 % 2.7 % :Percent change, 06/30/2008-06/30/2009 -0.2 2.6 -0.5 :
Year
2009
Annual change
Note: Includes prisoners under the legal authority of state or federal correctional officials with sentences of more than 1 year, regardless of where they are held.: Not calculated.
Table 8. Number of sentenced female prisoners under the jurisdiction of state or federal correctional authorities, December 31, 2000-2008, and June 30, 2008 and 2009
Percent of all sentenced prisoners
20042005200620072008
200020012002
Federal
2003
StateNumber of sentenced female prisoners
Total
11 Prison Inmates at Midyear 2009 - Statistical tables June 2010
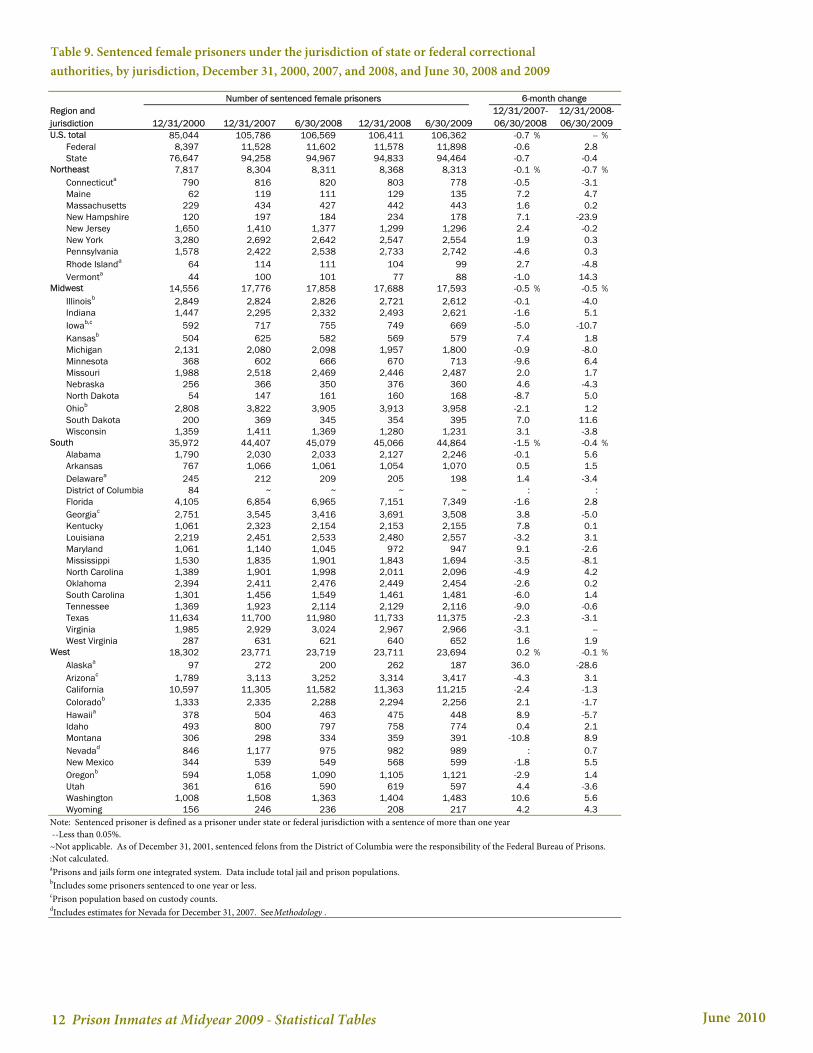
85,044 105,786 106,569 106,411 106,362 -0.7 % -- %Federal 8,397 11,528 11,602 11,578 11,898 -0.6 2.8State 76,647 94,258 94,967 94,833 94,464 -0.7 -0.4
7,817 8,304 8,311 8,368 8,313 -0.1 % -0.7 %Connecticuta 790 816 820 803 778 -0.5 -3.1Maine 62 119 111 129 135 7.2 4.7Massachusetts 229 434 427 442 443 1.6 0.2New Hampshire 120 197 184 234 178 7.1 -23.9New Jersey 1,650 1,410 1,377 1,299 1,296 2.4 -0.2New York 3,280 2,692 2,642 2,547 2,554 1.9 0.3Pennsylvania 1,578 2,422 2,538 2,733 2,742 -4.6 0.3Rhode Islanda 64 114 111 104 99 2.7 -4.8Vermonta 44 100 101 77 88 -1.0 14.3
14,556 17,776 17,858 17,688 17,593 -0.5 % -0.5 %Illinoisb 2,849 2,824 2,826 2,721 2,612 -0.1 -4.0Indiana 1,447 2,295 2,332 2,493 2,621 -1.6 5.1Iowab,c 592 717 755 749 669 -5.0 -10.7Kansasb 504 625 582 569 579 7.4 1.8Michigan 2,131 2,080 2,098 1,957 1,800 -0.9 -8.0Minnesota 368 602 666 670 713 -9.6 6.4Missouri 1,988 2,518 2,469 2,446 2,487 2.0 1.7Nebraska 256 366 350 376 360 4.6 -4.3North Dakota 54 147 161 160 168 -8.7 5.0Ohiob 2,808 3,822 3,905 3,913 3,958 -2.1 1.2South Dakota 200 369 345 354 395 7.0 11.6Wisconsin 1,359 1,411 1,369 1,280 1,231 3.1 -3.8
35,972 44,407 45,079 45,066 44,864 -1.5 % -0.4 %Alabama 1,790 2,030 2,033 2,127 2,246 -0.1 5.6Arkansas 767 1,066 1,061 1,054 1,070 0.5 1.5Delawarea 245 212 209 205 198 1.4 -3.4District of Columbia 84 ~ ~ ~ ~ : :Florida 4,105 6,854 6,965 7,151 7,349 -1.6 2.8Georgiac 2,751 3,545 3,416 3,691 3,508 3.8 -5.0Kentucky 1,061 2,323 2,154 2,153 2,155 7.8 0.1Louisiana 2,219 2,451 2,533 2,480 2,557 -3.2 3.1Maryland 1,061 1,140 1,045 972 947 9.1 -2.6Mississippi 1,530 1,835 1,901 1,843 1,694 -3.5 -8.1North Carolina 1,389 1,901 1,998 2,011 2,096 -4.9 4.2Oklahoma 2,394 2,411 2,476 2,449 2,454 -2.6 0.2South Carolina 1,301 1,456 1,549 1,461 1,481 -6.0 1.4Tennessee 1,369 1,923 2,114 2,129 2,116 -9.0 -0.6Texas 11,634 11,700 11,980 11,733 11,375 -2.3 -3.1Virginia 1,985 2,929 3,024 2,967 2,966 -3.1 --West Virginia 287 631 621 640 652 1.6 1.9
18,302 23,771 23,719 23,711 23,694 0.2 % -0.1 %Alaskaa 97 272 200 262 187 36.0 -28.6Arizonac 1,789 3,113 3,252 3,314 3,417 -4.3 3.1California 10,597 11,305 11,582 11,363 11,215 -2.4 -1.3Coloradob 1,333 2,335 2,288 2,294 2,256 2.1 -1.7Hawaiia 378 504 463 475 448 8.9 -5.7Idaho 493 800 797 758 774 0.4 2.1Montana 306 298 334 359 391 -10.8 8.9Nevadad 846 1,177 975 982 989 : 0.7New Mexico 344 539 549 568 599 -1.8 5.5Oregonb 594 1,058 1,090 1,105 1,121 -2.9 1.4Utah 361 616 590 619 597 4.4 -3.6Washington 1,008 1,508 1,363 1,404 1,483 10.6 5.6Wyoming 156 246 236 208 217 4.2 4.3
cPrison population based on custody counts. dIncludes estimates for Nevada for December 31, 2007. See Methodology .
Note: Sentenced prisoner is defined as a prisoner under state or federal jurisdiction with a sentence of more than one year
~Not applicable. As of December 31, 2001, sentenced felons from the District of Columbia were the responsibility of the Federal Bureau of Prisons.:Not calculated.aPrisons and jails form one integrated system. Data include total jail and prison populations. bIncludes some prisoners sentenced to one year or less.
--Less than 0.05%.
U.S. total
Northeast
Midwest
South
West
Table 9. Sentenced female prisoners under the jurisdiction of state or federal correctional authorities, by jurisdiction, December 31, 2000, 2007, and 2008, and June 30, 2008 and 2009
12/31/2007-06/30/2008
12/31/2008-06/30/2009
Number of sentenced female prisoners 6-month changeRegion and jurisdiction 12/31/2000 12/31/2007 6/30/2008 12/31/2008 6/30/2009
12 Prison Inmates at Midyear 2009 - Statistical Tables June 2010
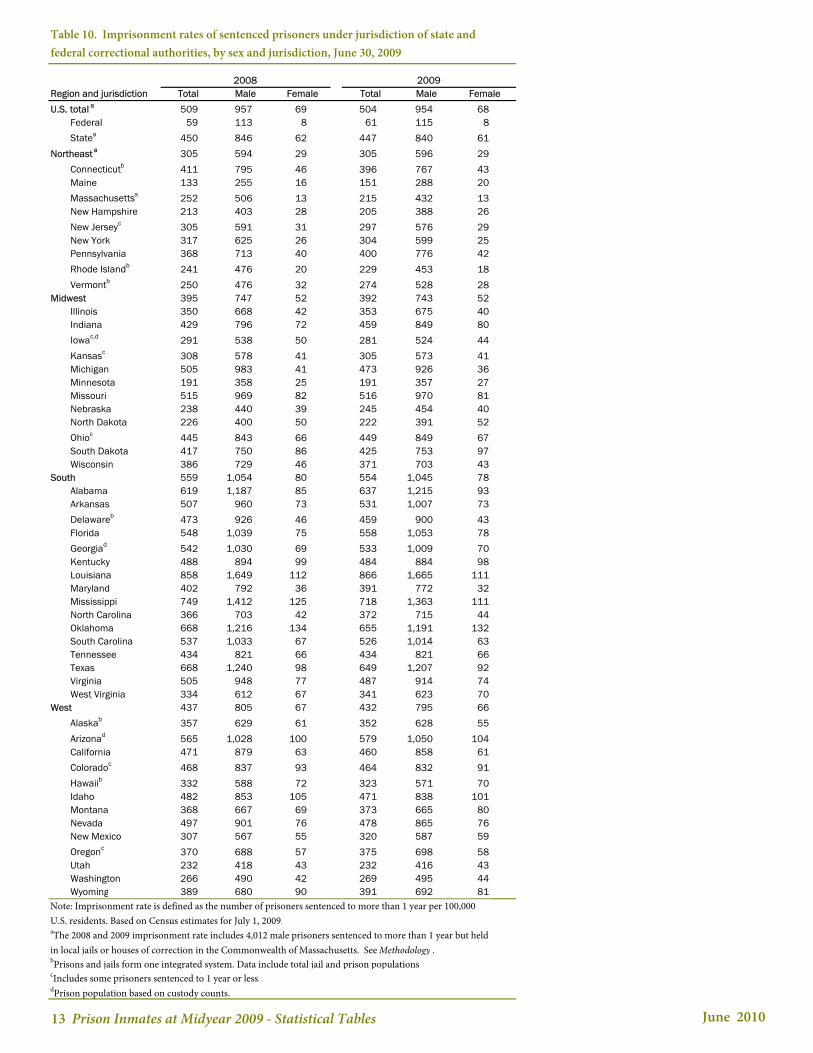
509 957 69 504 954 68Federal 59 113 8 61 115 8
Statea 450 846 62 447 840 61
305 594 29 305 596 29
Connecticutb 411 795 46 396 767 43Maine 133 255 16 151 288 20
Massachusettsa 252 506 13 215 432 13New Hampshire 213 403 28 205 388 26
New Jerseyc 305 591 31 297 576 29New York 317 625 26 304 599 25Pennsylvania 368 713 40 400 776 42
Rhode Islandb 241 476 20 229 453 18
Vermontb 250 476 32 274 528 28395 747 52 392 743 52
Illinois 350 668 42 353 675 40Indiana 429 796 72 459 849 80
Iowac,d 291 538 50 281 524 44
Kansasc 308 578 41 305 573 41Michigan 505 983 41 473 926 36Minnesota 191 358 25 191 357 27Missouri 515 969 82 516 970 81Nebraska 238 440 39 245 454 40North Dakota 226 400 50 222 391 52
Ohioc 445 843 66 449 849 67South Dakota 417 750 86 425 753 97Wisconsin 386 729 46 371 703 43
559 1,054 80 554 1,045 78Alabama 619 1,187 85 637 1,215 93Arkansas 507 960 73 531 1,007 73
Delawareb 473 926 46 459 900 43Florida 548 1,039 75 558 1,053 78
Georgiad 542 1,030 69 533 1,009 70Kentucky 488 894 99 484 884 98Louisiana 858 1,649 112 866 1,665 111Maryland 402 792 36 391 772 32Mississippi 749 1,412 125 718 1,363 111North Carolina 366 703 42 372 715 44Oklahoma 668 1,216 134 655 1,191 132South Carolina 537 1,033 67 526 1,014 63Tennessee 434 821 66 434 821 66Texas 668 1,240 98 649 1,207 92Virginia 505 948 77 487 914 74West Virginia 334 612 67 341 623 70
437 805 67 432 795 66
Alaskab 357 629 61 352 628 55
Arizonad 565 1,028 100 579 1,050 104California 471 879 63 460 858 61
Coloradoc 468 837 93 464 832 91
Hawaiib 332 588 72 323 571 70Idaho 482 853 105 471 838 101Montana 368 667 69 373 665 80Nevada 497 901 76 478 865 76New Mexico 307 567 55 320 587 59
Oregonc 370 688 57 375 698 58Utah 232 418 43 232 416 43Washington 266 490 42 269 495 44Wyoming 389 680 90 391 692 81
aThe 2008 and 2009 imprisonment rate includes 4,012 male prisoners sentenced to more than 1 year but held in local jails or houses of correction in the Commonwealth of Massachusetts. See Methodology .bPrisons and jails form one integrated system. Data include total jail and prison populations.cIncludes some prisoners sentenced to 1 year or less.dPrison population based on custody counts.
Northeast a
Midwest
South
West
Note: Imprisonment rate is defined as the number of prisoners sentenced to more than 1 year per 100,000 U.S. residents. Based on Census estimates for July 1, 2009.
Table 10. Imprisonment rates of sentenced prisoners under jurisdiction of state and federal correctional authorities, by sex and jurisdiction, June 30, 2009
U.S. total a
Region and jurisdiction Total Male Female2008
Total Male Female2009
13 Prison Inmates at Midyear 2009 - Statistical Tables June 2010
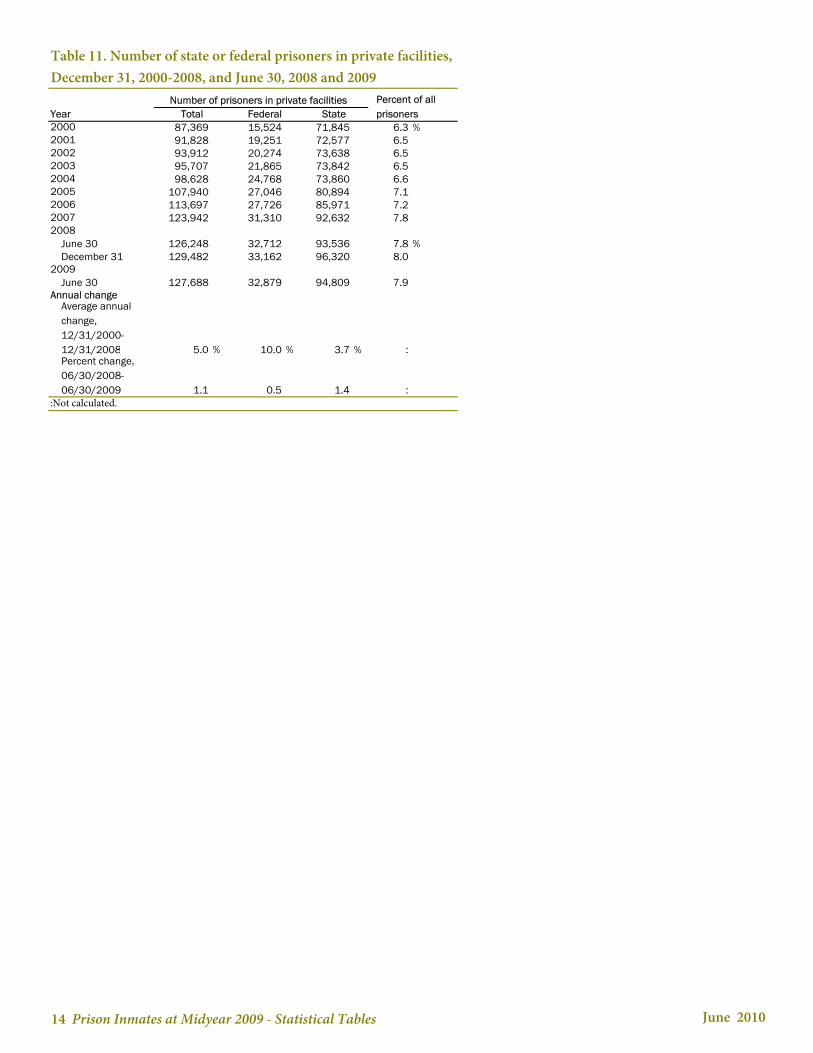
87,369 15,524 71,845 6.3 %91,828 19,251 72,577 6.593,912 20,274 73,638 6.595,707 21,865 73,842 6.598,628 24,768 73,860 6.6
107,940 27,046 80,894 7.1113,697 27,726 85,971 7.2123,942 31,310 92,632 7.8
June 30 126,248 32,712 93,536 7.8 %December 31 129,482 33,162 96,320 8.0
June 30 127,688 32,879 94,809 7.9
Average annual change, 12/31/2000-12/31/2008 5.0 % 10.0 % 3.7 % :Percent change, 06/30/2008-06/30/2009 1.1 0.5 1.4 :
Table 11. Number of state or federal prisoners in private facilities, December 31, 2000-2008, and June 30, 2008 and 2009
Year200020012002
Number of prisoners in private facilitiesTotal Federal State
:Not calculated.
Percent of all prisoners
2008
2009
Annual change
20032004200520062007
14 Prison Inmates at Midyear 2009 - Statistical Tables June 2010
87,369 123,942 126,248 129,482 127,688 7.9 %Federala 15,524 31,310 32,712 33,162 32,879 15.9State 71,845 92,632 93,536 96,320 94,809 6.7
2,509 4,268 3,981 5,113 4,029 2.2 %Connecticut 0 0 0 927 0 :Maine 11 42 16 0 16 0.7Massachusetts 0 0 0 0 0 :New Hampshire 0 0 0 0 0 :New Jerseyb 2,498 2,686 2,682 2,641 2,688 10.4New York 0 0 0 0 0 :Pennsylvania 0 1,022 780 819 655 1.3Rhode Island 0 0 0 0 0 :Vermont 0 518 503 726 670 30.3
7,836 5,048 5,438 5,448 5,115 1.9 %Illinois 0 / / / 0 :Indiana 991 1,683 2,290 2,642 2,549 8.6Iowa 0 0 0 0 0 :Kansas 0 0 0 0 0 :Michigan 449 0 0 0 0 :Minnesota 0 1,183 998 612 404 4.0Missouri 0 0 0 0 0 :Nebraska 0 0 0 0 0 :North Dakota 96 0 0 0 0 :Ohio 1,918 2,138 2,141 2,133 2,146 4.1South Dakota 45 21 9 15 16 0.5Wisconsin 4,337 23 0 46 0 :
45,560 56,117 56,969 57,888 58,102 8.9 %Alabama 0 355 5 101 0 :Arkansas 1,540 0 0 0 0 :Delaware 0 0 0 0 0 :District of Columbia 2,342 ~ ~ ~ ~ :Florida 3,912 8,769 9,026 9,158 9,316 9.0Georgia 3,746 4,974 5,145 5,138 5,058 9.3Kentucky 1,268 2,404 2,254 2,209 2,215 10.3Louisiana 3,068 3,004 2,942 2,928 2,930 7.5Maryland 127 151 143 186 184 0.8Mississippi 3,230 4,794 4,804 5,497 5,483 25.0North Carolina 330 213 214 217 232 0.6Oklahoma 6,931 5,917 5,885 5,711 5,696 21.8South Carolina 0 9 5 12 10 --Tennessee 3,510 5,121 5,149 5,155 5,140 18.8Texas 13,985 18,871 19,851 20,041 20,265 11.9Virginia 1,571 1,535 1,546 1,535 1,573 4.1West Virginia 0 0 0 0 0 :
15,940 27,199 27,148 27,871 27,563 8.7 %Alaska 1,383 1,524 1,409 1,450 1,357 26.1Arizona 1,430 7,790 7,309 8,369 9,355 23.1California 4,547 3,032 3,192 3,019 2,654 1.6Colorado / 4,878 5,304 5,274 5,383 23.1Hawaii 1,187 2,129 2,050 2,108 2,098 35.0Idaho 1,162 1,969 2,058 2,114 1,629 22.4Montana 986 1,324 1,394 1,312 1,363 37.2Nevadac 508 0 0 0 0 :New Mexico 2,155 2,720 2,884 2,935 2,994 45.8Oregon 0 0 0 0 0 :Utah 208 0 0 0 0 :Washingtonb 0 1,203 1,095 863 523 2.9Wyoming 275 630 453 427 207 9.7
bIncludes prisoners held in out-of-state private facilities.cIncludes estimates for Nevada for December 31, 2007.
--Less than 0.05%
West
: Not calculated./ Not reported.~ Not applicable. As of December 31, 2001, sentenced felons from the District of Columbia were the responsibility of the Federal Bureau of Prisons.
aIncludes federal prisoners held in non-secure, privately operated facilities (8,798 at midyear 2009; numbers from other years can be found in earlier publications).
Table 12. Number of state and federal prisoners in private facilities, by jurisdiction, December 31, 2000, 2007 and 2008, and June 30, 2008 and 2009
Number of prisoners in private facilities
Northeast
Midwest
South
U.S. total
Percent of all prisoners, 6/30/2009Region and jurisdiction 12/31/2000 12/31/2007 6/30/2008 12/31/2008 6/30/2009
15 Prison Inmates at Midyear 2009 - Statistical Tables June 2010
63,140 2,438 60,702 4.5 %70,681 2,921 67,760 5.072,550 3,377 69,173 5.073,440 3,278 70,162 5.074,445 1,199 73,246 5.073,164 1,044 72,120 4.877,912 2,010 75,902 5.080,621 2,144 78,477 5.0
June 30 80,856 2,575 78,281 5.0 %December 31 83,497 2,738 80,759 5.2
June 30 82,370 3,201 79,169 5.1 %
Average annual change, 12/31/2000-12/31/2008 3.6 % 1.5 % 3.6 % :Percent change, 06/30/2008-06/30/2009 1.9 24.3 1.1 :
:Not calculated.
Percent of all prisoners
2008
2009
Annual change
20032004200520062007
Table 13. Number of state or federal prisoners in local facilities, December 31, 2000-2008, and June 30, 2008 and 2009
Year200020012002
Number of prisoners in local facilitiesTotal Federal State
16 Prison Inmates at Midyear 2009 - Statistical Tables June 2010
63,140 80,621 80,856 83,497 82,370 5.1 %Federal 2,438 2,144 2,575 2,738 3,201 1.5State 60,702 78,477 78,281 80,759 79,169 5.6
3,823 1,686 1,575 1,454 2,015 1.1 %Connecticuta ~ ~ ~ ~ ~ :Maine 24 9 32 90 123 5.6Massachusetts 457 136 294 185 177 1.5New Hampshire 14 52 35 46 43 1.6New Jersey 3,225 1,468 1,203 1,122 1,529 5.9New York 45 21 11 11 6 --Pennsylvania 58 0 0 0 137 0.3Rhode Islanda ~ ~ ~ ~ ~ :Vermonta ~ ~ ~ ~ ~ :
2,103 3,381 3,825 4,034 3,623 1.4 %Illinois 0 0 0 0 0 :Indiana 1,187 2,002 1,987 1,930 1,873 6.3Iowa 0 0 0 0 0 :Kansas 0 0 0 0 0 :Michigan 286 43 59 28 44 0.1Minnesota 149 518 700 1,004 632 6.3Missouri 0 0 0 0 0 :Nebraska 0 0 0 0 0 :North Dakota 38 48 42 71 62 4.3Ohio 0 0 0 0 0 :South Dakota 16 55 54 58 86 2.5Wisconsin 427 715 983 943 926 4.0
49,455 67,071 67,128 69,445 68,615 10.5 %Alabama 3,401 1,596 1,406 1,790 1,730 5.6Arkansas 728 1,007 1,317 1,541 1,778 11.5Delawarea ~ ~ ~ ~ ~ :District of Columbiab 1,329 ~ ~ ~ ~ :Floridac 0 1,147 64 1,144 1,309 1.3Georgia 3,888 4,919 4,917 4,690 4,933 9.1Kentucky 3,850 7,912 7,347 7,363 7,051 32.9Louisiana 15,599 17,079 17,208 17,524 18,420 47.3Maryland 118 151 138 141 149 0.6Mississippi 3,700 4,952 5,052 4,858 4,446 20.3North Carolina 0 0 0 0 0 :Oklahoma 970 1,892 2,226 2,148 2,125 8.1South Carolina 433 377 478 361 423 1.7Tennessee 5,204 7,019 7,501 7,860 7,863 28.8Texas 6,477 12,774 12,810 12,805 10,965 6.4Virginia 2,962 5,097 5,522 6,057 6,148 16.0West Virginia 796 1,149 1,142 1,163 1,275 20.3
5,321 6,339 5,753 5,826 4,916 1.6Alaskaa ~ ~ ~ ~ ~ : %Arizona 237 46 43 47 41 0.1California 2,758 3,023 3,083 2,736 2,291 1.3Colorado 2,178 175 106 63 99 0.4Hawaiia ~ ~ ~ ~ ~ :Idaho 450 575 453 365 479 6.6Montana 548 522 541 579 556 15.2Nevadad 175 155 197 199 162 1.3New Mexico 0 116 0 0 0 :Oregon 7 23 23 20 18 0.1Utah 1,050 1,286 1,258 1,341 1,228 19.0Washington 0 362 0 430 0 :Wyoming 17 56 49 46 42 2.0
/ Not reported.: Not calculated.
aPrisons and jails form one integrated system. Data include total jail and prison populations.
cNot comparable to previous years. As of 2009, the count includes all prisoners out to court.d Includes estimates for Nevada for December 31, 2007. See Methodology .
--Less than 0.05%.
bAs of December 31, 2001, sentenced felons from the District of Columbia were the responsibility of the Federal Bureau of Prisons
Northeast
Midwest
South
West
~ Not applicable.
Number of prisoners in local facilities
Table 14. Number of state and federal prisoners in local facilities, by jurisdiction, December 31, 2000, 2007, and 2008, and June 30, 2008 and 2009
Region and jurisdictionU.S. total
Percent of all prisoners, 6/30/200912/31/2000 12/31/2007 6/30/2008 12/31/2008 6/30/2009
17 Prison Inmates at Midyear 2009 - Statistical Tables June 2010
1,937,482 2,298,041 2,308,561 2,308,390 2,297,400 2.2 % -0.5 %
140,064 197,285 198,402 198,414 203,233 4.4 % 2.4 %133,921 189,154 190,273 189,770 194,435 4.5 2.5
Federal facilities 124,540 165,975 165,690 165,252 170,354 3.6 3.1Privately operated facilities 9,381 23,179 24,583 24,518 24,081 12.8 -1.8
6,143 8,131 8,129 8,644 8,798 4.4 1.81,176,269 1,320,582 1,324,603 1,324,420 1,326,547 1.5 % 0.2 %
621,149 780,174 785,556 785,556 767,620 3.0 % -2.3 %684 756 762 756 748 1.3 % -1.0 %
Community Corrections Centersb
State prisoners
bNon-secure, privately operated community corrections centers. cCounts for inmates held in local jails are for the last working day of June in each year. Counts were estimated from the Annual Survey of Jails. See Methodology . dThe total number in custody per 100,000 U.S. residents. Resident population estimates were as of January 1 of the following year for December 31 estimates and July 1 of the same year for June 30 estimates.
Local jails c
Incarceration rate d
Note: Total includes all inmates held in state or federal prison facilities or in local jails. It does not include inmates held in U.S. territories, military facilities, U.S. Immigration and Customs Enforcement facilities, jails in Indian country, and juvenile facilities. aAfter 2001, responsibility for sentenced prisoners from the District of Columbia was transferred to the Federal Bureau of Prisons.
Percent change, 12/31/2008-06/30/2009
Average annual change, 2000-2008
Federal prisoners a
TotalPrisons
Total inmates in custody
Table 15. Inmates held in custody in state or federal prisons or in local jails, December 31, 2000-2008, and June 30, 2008 and 2009
12/31/2000 12/31/2007 6/30/2008 12/31/2008 6/30/2009
Number of inmates
18 Prison Inmates at Midyear 2009 - Statistical Tables June 2010
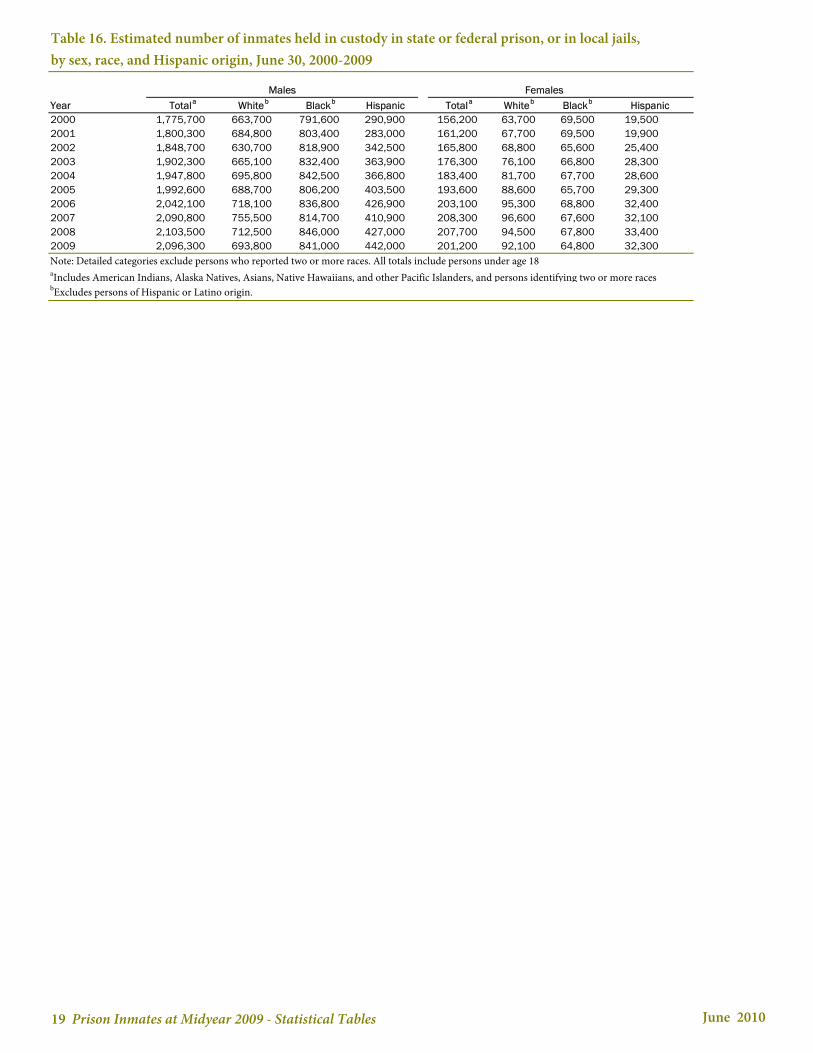
Year2000 1,775,700 663,700 791,600 290,900 156,200 63,700 69,500 19,5002001 1,800,300 684,800 803,400 283,000 161,200 67,700 69,500 19,9002002 1,848,700 630,700 818,900 342,500 165,800 68,800 65,600 25,4002003 1,902,300 665,100 832,400 363,900 176,300 76,100 66,800 28,3002004 1,947,800 695,800 842,500 366,800 183,400 81,700 67,700 28,6002005 1,992,600 688,700 806,200 403,500 193,600 88,600 65,700 29,3002006 2,042,100 718,100 836,800 426,900 203,100 95,300 68,800 32,4002007 2,090,800 755,500 814,700 410,900 208,300 96,600 67,600 32,1002008 2,103,500 712,500 846,000 427,000 207,700 94,500 67,800 33,4002009 2,096,300 693,800 841,000 442,000 201,200 92,100 64,800 32,300
bExcludes persons of Hispanic or Latino origin.
Females
Table 16. Estimated number of inmates held in custody in state or federal prison, or in local jails, by sex, race, and Hispanic origin, June 30, 2000-2009
Note: Detailed categories exclude persons who reported two or more races. All totals include persons under age 18
Totala Whiteb Blackb HispanicMales
Totala Whiteb Blackb Hispanic
aIncludes American Indians, Alaska Natives, Asians, Native Hawaiians, and other Pacific Islanders, and persons identifying two or more races
19 Prison Inmates at Midyear 2009 - Statistical Tables June 2010
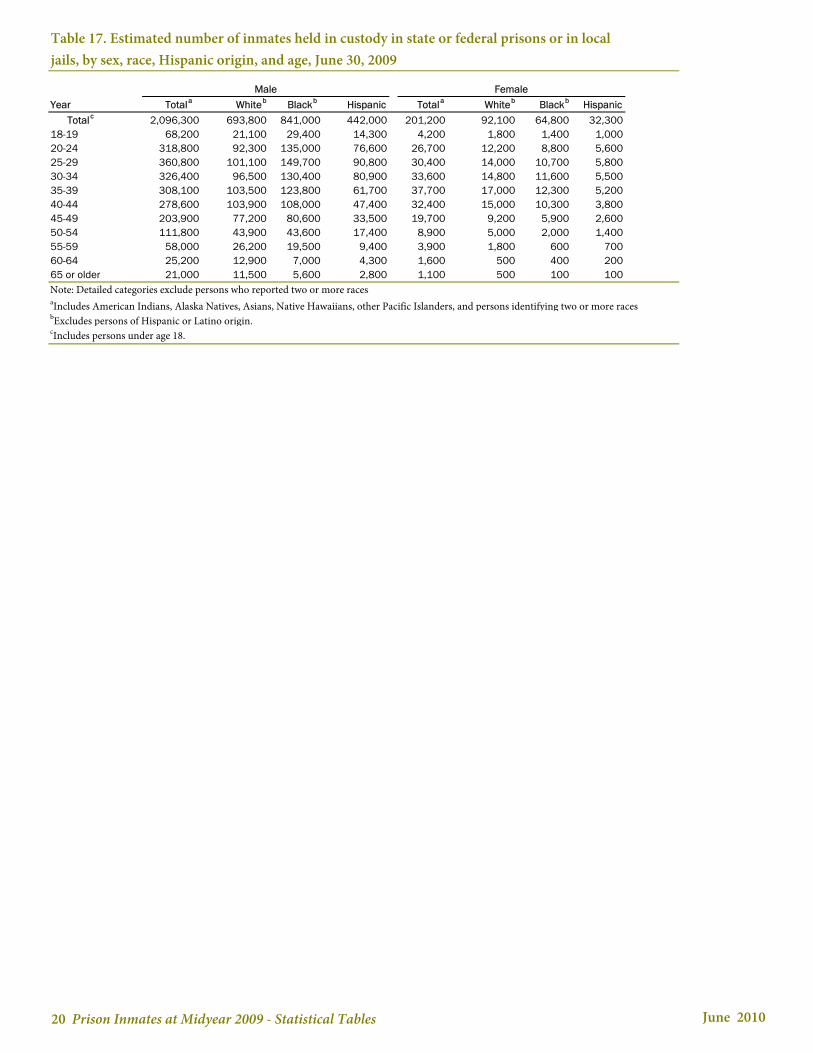
Year Whiteb Hispanic Whiteb Blackb HispanicTotalc 2,096,300 693,800 841,000 442,000 201,200 92,100 64,800 32,300
18-19 68,200 21,100 29,400 14,300 4,200 1,800 1,400 1,00020-24 318,800 92,300 135,000 76,600 26,700 12,200 8,800 5,60025-29 360,800 101,100 149,700 90,800 30,400 14,000 10,700 5,80030-34 326,400 96,500 130,400 80,900 33,600 14,800 11,600 5,50035-39 308,100 103,500 123,800 61,700 37,700 17,000 12,300 5,20040-44 278,600 103,900 108,000 47,400 32,400 15,000 10,300 3,80045-49 203,900 77,200 80,600 33,500 19,700 9,200 5,900 2,60050-54 111,800 43,900 43,600 17,400 8,900 5,000 2,000 1,40055-59 58,000 26,200 19,500 9,400 3,900 1,800 600 70060-64 25,200 12,900 7,000 4,300 1,600 500 400 20065 or older 21,000 11,500 5,600 2,800 1,100 500 100 100
bExcludes persons of Hispanic or Latino origin.cIncludes persons under age 18.
Male Female
Table 17. Estimated number of inmates held in custody in state or federal prisons or in local jails, by sex, race, Hispanic origin, and age, June 30, 2009
Note: Detailed categories exclude persons who reported two or more races.
Totala Blackb Totala
aIncludes American Indians, Alaska Natives, Asians, Native Hawaiians, other Pacific Islanders, and persons identifying two or more races.
20 Prison Inmates at Midyear 2009 - Statistical Tables June 2010
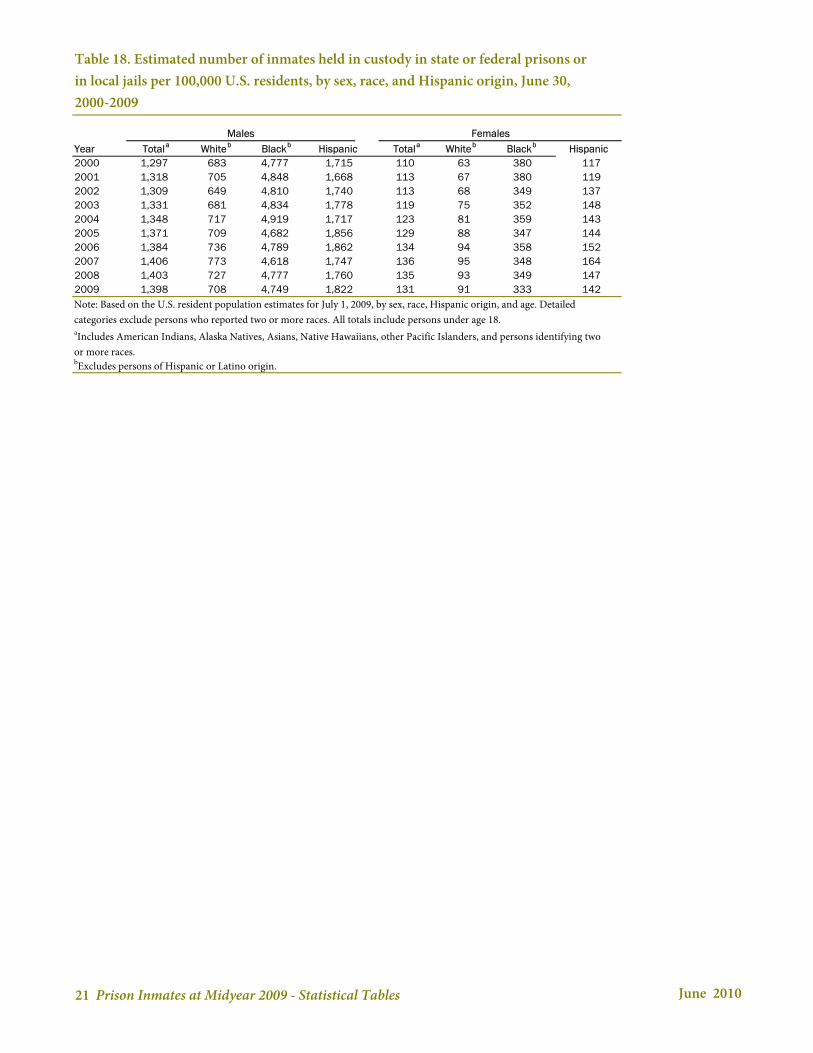
Year2000 1,297 683 4,777 1,715 110 63 380 1172001 1,318 705 4,848 1,668 113 67 380 1192002 1,309 649 4,810 1,740 113 68 349 1372003 1,331 681 4,834 1,778 119 75 352 1482004 1,348 717 4,919 1,717 123 81 359 1432005 1,371 709 4,682 1,856 129 88 347 1442006 1,384 736 4,789 1,862 134 94 358 1522007 1,406 773 4,618 1,747 136 95 348 1642008 1,403 727 4,777 1,760 135 93 349 1472009 1,398 708 4,749 1,822 131 91 333 142
bExcludes persons of Hispanic or Latino origin.
Males Females
Table 18. Estimated number of inmates held in custody in state or federal prisons or in local jails per 100,000 U.S. residents, by sex, race, and Hispanic origin, June 30, 2000-2009
Note: Based on the U.S. resident population estimates for July 1, 2009, by sex, race, Hispanic origin, and age. Detailed categories exclude persons who reported two or more races. All totals include persons under age 18.aIncludes American Indians, Alaska Natives, Asians, Native Hawaiians, other Pacific Islanders, and persons identifying two or more races.
Whiteb Blackb HispanicTotala Totala Whiteb Blackb Hispanic
21 Prison Inmates at Midyear 2009 - Statistical Tables June 2010
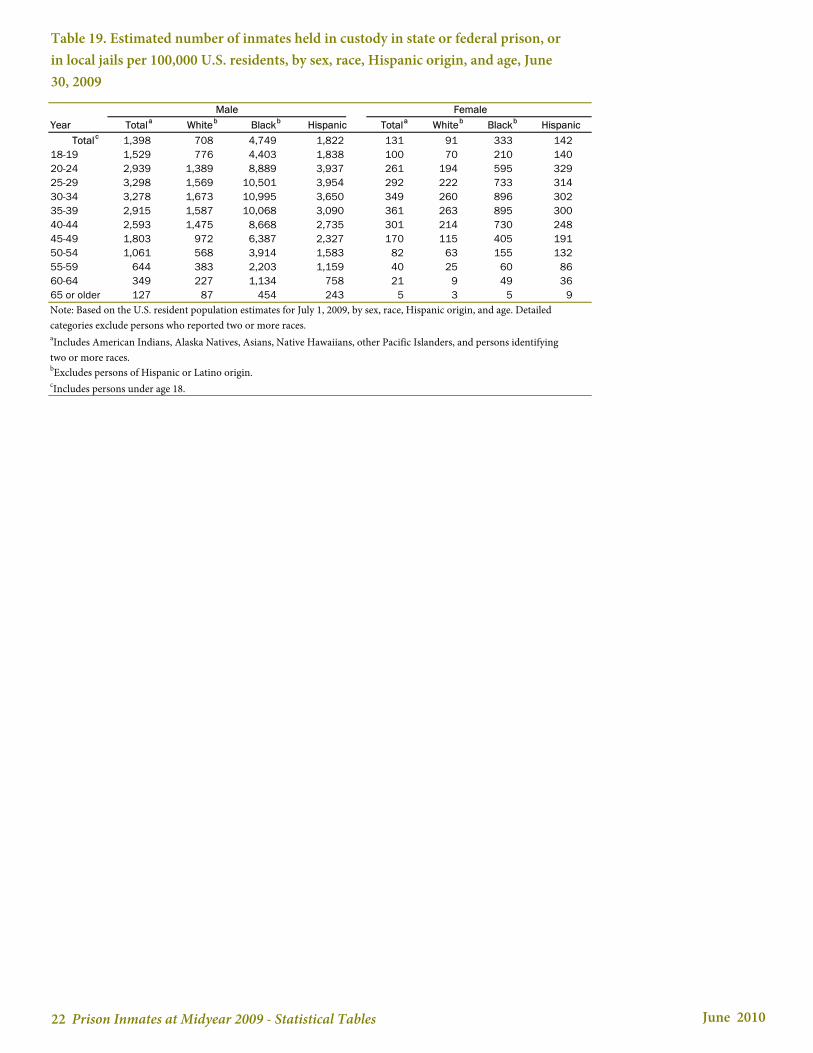
YearTotalc 1,398 708 4,749 1,822 131 91 333 142
18-19 1,529 776 4,403 1,838 100 70 210 14020-24 2,939 1,389 8,889 3,937 261 194 595 32925-29 3,298 1,569 10,501 3,954 292 222 733 31430-34 3,278 1,673 10,995 3,650 349 260 896 30235-39 2,915 1,587 10,068 3,090 361 263 895 30040-44 2,593 1,475 8,668 2,735 301 214 730 24845-49 1,803 972 6,387 2,327 170 115 405 19150-54 1,061 568 3,914 1,583 82 63 155 13255-59 644 383 2,203 1,159 40 25 60 8660-64 349 227 1,134 758 21 9 49 3665 or older 127 87 454 243 5 3 5 9
cIncludes persons under age 18.
Table 19. Estimated number of inmates held in custody in state or federal prison, or in local jails per 100,000 U.S. residents, by sex, race, Hispanic origin, and age, June 30, 2009
Male Female
Note: Based on the U.S. resident population estimates for July 1, 2009, by sex, race, Hispanic origin, and age. Detailed categories exclude persons who reported two or more races. aIncludes American Indians, Alaska Natives, Asians, Native Hawaiians, other Pacific Islanders, and persons identifying two or more races.bExcludes persons of Hispanic or Latino origin.
Totala Whiteb Blackb Hispanic Totala Whiteb Blackb Hispanic
22 Prison Inmates at Midyear 2009 - Statistical Tables June 2010
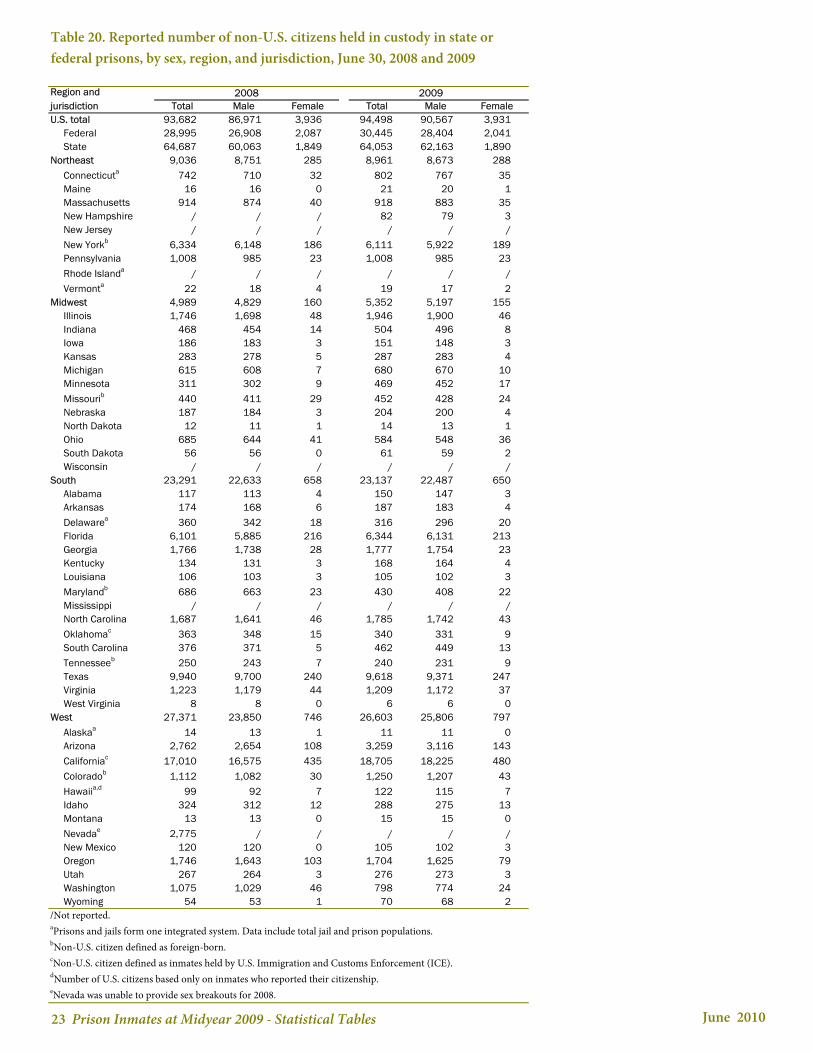
93,682 86,971 3,936 94,498 90,567 3,931Federal 28,995 26,908 2,087 30,445 28,404 2,041State 64,687 60,063 1,849 64,053 62,163 1,890
9,036 8,751 285 8,961 8,673 288
Connecticuta 742 710 32 802 767 35Maine 16 16 0 21 20 1Massachusetts 914 874 40 918 883 35New Hampshire / / / 82 79 3New Jersey / / / / / /
New Yorkb 6,334 6,148 186 6,111 5,922 189Pennsylvania 1,008 985 23 1,008 985 23
Rhode Islanda / / / / / /
Vermonta 22 18 4 19 17 24,989 4,829 160 5,352 5,197 155
Illinois 1,746 1,698 48 1,946 1,900 46Indiana 468 454 14 504 496 8Iowa 186 183 3 151 148 3Kansas 283 278 5 287 283 4Michigan 615 608 7 680 670 10Minnesota 311 302 9 469 452 17
Missourib 440 411 29 452 428 24Nebraska 187 184 3 204 200 4North Dakota 12 11 1 14 13 1Ohio 685 644 41 584 548 36South Dakota 56 56 0 61 59 2Wisconsin / / / / / /
23,291 22,633 658 23,137 22,487 650Alabama 117 113 4 150 147 3Arkansas 174 168 6 187 183 4
Delawarea 360 342 18 316 296 20Florida 6,101 5,885 216 6,344 6,131 213Georgia 1,766 1,738 28 1,777 1,754 23Kentucky 134 131 3 168 164 4Louisiana 106 103 3 105 102 3
Marylandb 686 663 23 430 408 22Mississippi / / / / / /North Carolina 1,687 1,641 46 1,785 1,742 43
Oklahomac 363 348 15 340 331 9South Carolina 376 371 5 462 449 13
Tennesseeb 250 243 7 240 231 9Texas 9,940 9,700 240 9,618 9,371 247Virginia 1,223 1,179 44 1,209 1,172 37West Virginia 8 8 0 6 6 0
27,371 23,850 746 26,603 25,806 797
Alaskaa 14 13 1 11 11 0Arizona 2,762 2,654 108 3,259 3,116 143
Californiac 17,010 16,575 435 18,705 18,225 480
Coloradob 1,112 1,082 30 1,250 1,207 43
Hawaiia,d 99 92 7 122 115 7Idaho 324 312 12 288 275 13Montana 13 13 0 15 15 0
Nevadae 2,775 / / / / /New Mexico 120 120 0 105 102 3Oregon 1,746 1,643 103 1,704 1,625 79Utah 267 264 3 276 273 3Washington 1,075 1,029 46 798 774 24Wyoming 54 53 1 70 68 2
Table 20. Reported number of non-U.S. citizens held in custody in state or federal prisons, by sex, region, and jurisdiction, June 30, 2008 and 2009
2009
U.S. total
Region and jurisdiction Total Male Female
2008Total Male Female
Northeast
Midwest
South
West
/Not reported. aPrisons and jails form one integrated system. Data include total jail and prison populations.bNon-U.S. citizen defined as foreign-born.cNon-U.S. citizen defined as inmates held by U.S. Immigration and Customs Enforcement (ICE).dNumber of U.S. citizens based only on inmates who reported their citizenship.eNevada was unable to provide sex breakouts for 2008.
23 Prison Inmates at Midyear 2009 - Statistical Tables June 2010

State 2,717 2,626 91 2,778 2,644 134676 643 33 617 584 33
Connecticuta 375 349 26 332 310 22Maine 0 0 0 0 0 0Massachusetts 3 2 1 8 5 3New Hampshire 0 0 0 0 0 0New Jerseyb 19 19 0 21 21 0New York 206 202 4 190 184 6Pennsylvania 55 53 2 61 59 2Rhode Islanda 10 10 0 1 1 0Vermonta 8 8 0 4 4 0
476 458 18 499 488 11Illinois 77 74 3 106 105 1Indiana 63 62 1 54 54 0Iowa 16 16 0 13 13 0Kansas 4 3 1 5 5 0Michigan 140 137 3 132 129 3Minnesota 13 13 0 13 11 2Missouri 26 25 1 31 30 1Nebraska 15 15 0 21 19 2North Dakota 0 0 0 0 0 0Ohio 75 73 2 86 84 2South Dakotab 0 0 0 1 1 0Wisconsin 47 40 7 37 37 0
1,215 1,183 32 1,273 1,234 39Alabama 123 123 0 118 114 4Arkansas 17 17 0 17 17 0Delawarea 25 25 0 28 28 0Florida 301 295 6 393 384 9Georgia 118 113 5 99 94 5Kentucky 0 0 0 0 0 0Louisianab 26 25 1 15 14 1Maryland 61 60 1 58 57 1Mississippi 39 38 1 28 27 1North Carolinab 186 178 8 215 206 9Oklahoma 7 7 0 19 17 2South Carolina 96 93 3 89 88 1Tennessee 14 13 1 22 20 2Texas 157 151 6 156 152 4Virginia 45 45 0 16 16 0West Virginia 0 0 0 0 0 0
350 342 8 389 338 51Alaskaa 10 9 1 7 7 0Arizona 156 154 2 157 149 8Californiab 0 0 0 0 0 0Colorado 37 36 1 79 43 36Hawaiia 0 0 0 2 2 0Idaho 0 0 0 0 0 0Montana 8 7 1 1 1 0Nevada 118 115 3 118 115 3New Mexico 1 1 0 3 3 0Oregon 8 8 0 13 9 4Utah 5 5 0 6 6 0Washingtonb 3 3 0 2 2 0Wyoming 4 4 0 1 1 0
Table 21. Reported number of inmates under age 18 held in custody in state prisons, by sex, region, and jurisdiction, June 30, 2008 and 2009
2008 2009
Northeast
Region and jurisdiction Total Male Female Total Male Female
Midwest
South
West
aPrisons and jails form one integrated system. Data include total jail and prison populations.bCounts include those held in privately-operated facilities.
24 Prison Inmates at Midyear 2009 - Statistical Tables June 2010
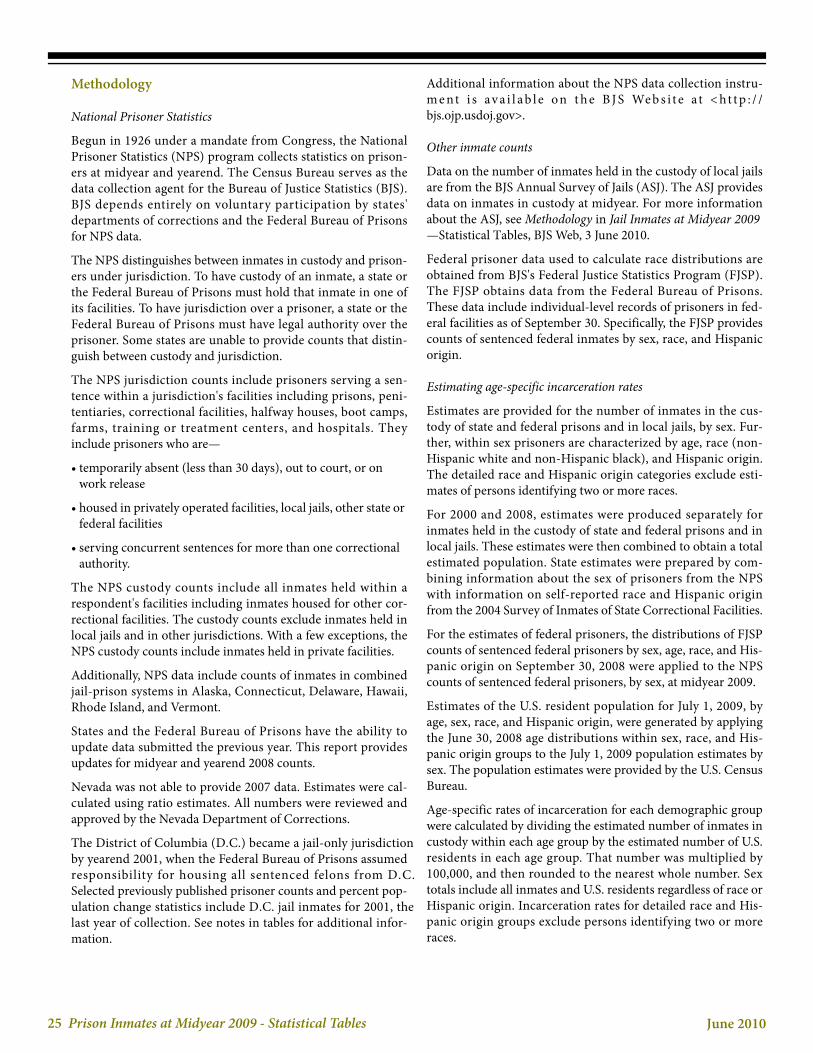
Methodology
National Prisoner Statistics
Begun in 1926 under a mandate from Congress, the NationalPrisoner Statistics (NPS) program collects statistics on prison-ers at midyear and yearend. The Census Bureau serves as thedata collection agent for the Bureau of Justice Statistics (BJS).BJS depends entirely on voluntary participation by states'departments of corrections and the Federal Bureau of Prisonsfor NPS data.
The NPS distinguishes between inmates in custody and prison-ers under jurisdiction. To have custody of an inmate, a state orthe Federal Bureau of Prisons must hold that inmate in one ofits facilities. To have jurisdiction over a prisoner, a state or theFederal Bureau of Prisons must have legal authority over theprisoner. Some states are unable to provide counts that distin-guish between custody and jurisdiction.
The NPS jurisdiction counts include prisoners serving a sen-tence within a jurisdiction's facilities including prisons, peni-tentiaries, correctional facilities, halfway houses, boot camps,farms, training or treatment centers, and hospitals. Theyinclude prisoners who are—
• temporarily absent (less than 30 days), out to court, or on work release
• housed in privately operated facilities, local jails, other state or federal facilities
• serving concurrent sentences for more than one correctional authority.
The NPS custody counts include all inmates held within arespondent's facilities including inmates housed for other cor-rectional facilities. The custody counts exclude inmates held inlocal jails and in other jurisdictions. With a few exceptions, theNPS custody counts include inmates held in private facilities.
Additionally, NPS data include counts of inmates in combinedjail-prison systems in Alaska, Connecticut, Delaware, Hawaii,Rhode Island, and Vermont.
States and the Federal Bureau of Prisons have the ability toupdate data submitted the previous year. This report providesupdates for midyear and yearend 2008 counts.
Nevada was not able to provide 2007 data. Estimates were cal-culated using ratio estimates. All numbers were reviewed andapproved by the Nevada Department of Corrections.
The District of Columbia (D.C.) became a jail-only jurisdictionby yearend 2001, when the Federal Bureau of Prisons assumedresponsibility for housing all sentenced felons from D.C.Selected previously published prisoner counts and percent pop-ulation change statistics include D.C. jail inmates for 2001, thelast year of collection. See notes in tables for additional infor-mation.
Additional information about the NPS data collection instru-m e nt i s av a i l a b l e on t h e B J S We b s i t e a t < ht t p : / /bjs.ojp.usdoj.gov>.
Other inmate counts
Data on the number of inmates held in the custody of local jailsare from the BJS Annual Survey of Jails (ASJ). The ASJ providesdata on inmates in custody at midyear. For more informationabout the ASJ, see Methodology in Jail Inmates at Midyear 2009—Statistical Tables, BJS Web, 3 June 2010.
Federal prisoner data used to calculate race distributions areobtained from BJS's Federal Justice Statistics Program (FJSP).The FJSP obtains data from the Federal Bureau of Prisons.These data include individual-level records of prisoners in fed-eral facilities as of September 30. Specifically, the FJSP providescounts of sentenced federal inmates by sex, race, and Hispanicorigin.
Estimating age-specific incarceration rates
Estimates are provided for the number of inmates in the cus-tody of state and federal prisons and in local jails, by sex. Fur-ther, within sex prisoners are characterized by age, race (non-Hispanic white and non-Hispanic black), and Hispanic origin.The detailed race and Hispanic origin categories exclude esti-mates of persons identifying two or more races.
For 2000 and 2008, estimates were produced separately forinmates held in the custody of state and federal prisons and inlocal jails. These estimates were then combined to obtain a totalestimated population. State estimates were prepared by com-bining information about the sex of prisoners from the NPSwith information on self-reported race and Hispanic originfrom the 2004 Survey of Inmates of State Correctional Facilities.
For the estimates of federal prisoners, the distributions of FJSPcounts of sentenced federal prisoners by sex, age, race, and His-panic origin on September 30, 2008 were applied to the NPScounts of sentenced federal prisoners, by sex, at midyear 2009.
Estimates of the U.S. resident population for July 1, 2009, byage, sex, race, and Hispanic origin, were generated by applyingthe June 30, 2008 age distributions within sex, race, and His-panic origin groups to the July 1, 2009 population estimates bysex. The population estimates were provided by the U.S. CensusBureau.
Age-specific rates of incarceration for each demographic groupwere calculated by dividing the estimated number of inmates incustody within each age group by the estimated number of U.S.residents in each age group. That number was multiplied by100,000, and then rounded to the nearest whole number. Sextotals include all inmates and U.S. residents regardless of race orHispanic origin. Incarceration rates for detailed race and His-panic origin groups exclude persons identifying two or moreraces.
June 2010Prison Inmates at Midyear 2009 - Statistical Tables25
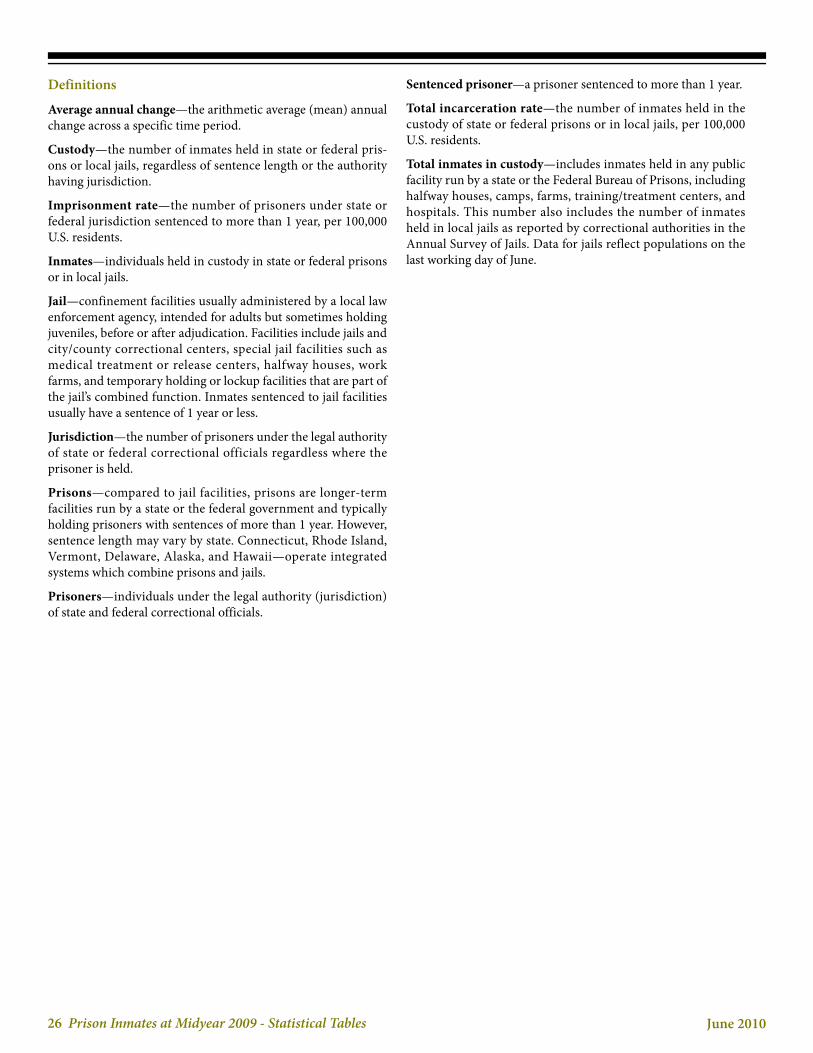
DefinitionsAverage annual change—the arithmetic average (mean) annualchange across a specific time period.
Custody—the number of inmates held in state or federal pris-ons or local jails, regardless of sentence length or the authorityhaving jurisdiction.
Imprisonment rate—the number of prisoners under state orfederal jurisdiction sentenced to more than 1 year, per 100,000U.S. residents.
Inmates—individuals held in custody in state or federal prisonsor in local jails.
Jail—confinement facilities usually administered by a local lawenforcement agency, intended for adults but sometimes holdingjuveniles, before or after adjudication. Facilities include jails andcity/county correctional centers, special jail facilities such asmedical treatment or release centers, halfway houses, workfarms, and temporary holding or lockup facilities that are part ofthe jail’s combined function. Inmates sentenced to jail facilitiesusually have a sentence of 1 year or less.
Jurisdiction—the number of prisoners under the legal authorityof state or federal correctional officials regardless where theprisoner is held.
Prisons—compared to jail facilities, prisons are longer-termfacilities run by a state or the federal government and typicallyholding prisoners with sentences of more than 1 year. However,sentence length may vary by state. Connecticut, Rhode Island,Vermont, Delaware, Alaska, and Hawaii—operate integratedsystems which combine prisons and jails.
Prisoners—individuals under the legal authority (jurisdiction)of state and federal correctional officials.
Sentenced prisoner—a prisoner sentenced to more than 1 year.
Total incarceration rate—the number of inmates held in thecustody of state or federal prisons or in local jails, per 100,000U.S. residents.
Total inmates in custody—includes inmates held in any publicfacility run by a state or the Federal Bureau of Prisons, includinghalfway houses, camps, farms, training/treatment centers, andhospitals. This number also includes the number of inmatesheld in local jails as reported by correctional authorities in theAnnual Survey of Jails. Data for jails reflect populations on thelast working day of June.
June 2010Prison Inmates at Midyear 2009 - Statistical Tables26
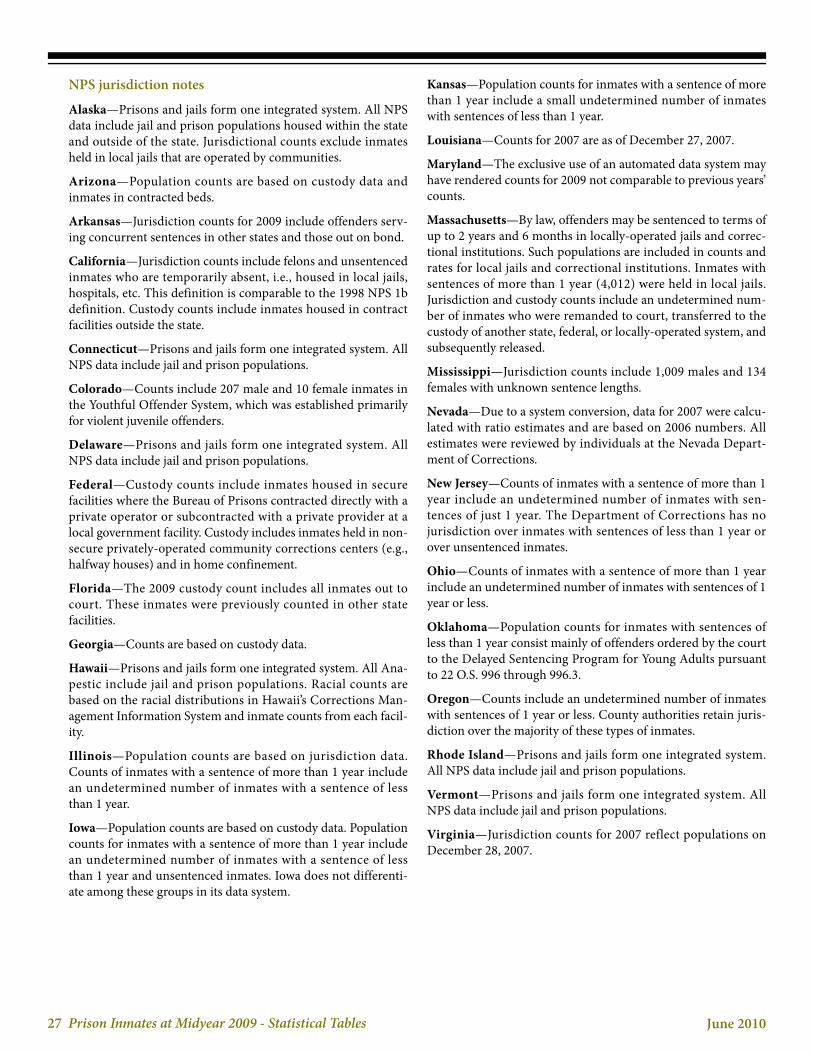
NPS jurisdiction notesAlaska—Prisons and jails form one integrated system. All NPSdata include jail and prison populations housed within the stateand outside of the state. Jurisdictional counts exclude inmatesheld in local jails that are operated by communities.
Arizona—Population counts are based on custody data andinmates in contracted beds.
Arkansas—Jurisdiction counts for 2009 include offenders serv-ing concurrent sentences in other states and those out on bond.
California—Jurisdiction counts include felons and unsentencedinmates who are temporarily absent, i.e., housed in local jails,hospitals, etc. This definition is comparable to the 1998 NPS 1bdefinition. Custody counts include inmates housed in contractfacilities outside the state.
Connecticut—Prisons and jails form one integrated system. AllNPS data include jail and prison populations.
Colorado—Counts include 207 male and 10 female inmates inthe Youthful Offender System, which was established primarilyfor violent juvenile offenders.
Delaware—Prisons and jails form one integrated system. AllNPS data include jail and prison populations.
Federal—Custody counts include inmates housed in securefacilities where the Bureau of Prisons contracted directly with aprivate operator or subcontracted with a private provider at alocal government facility. Custody includes inmates held in non-secure privately-operated community corrections centers (e.g.,halfway houses) and in home confinement.
Florida—The 2009 custody count includes all inmates out tocourt. These inmates were previously counted in other statefacilities.
Georgia—Counts are based on custody data.
Hawaii—Prisons and jails form one integrated system. All Ana-pestic include jail and prison populations. Racial counts arebased on the racial distributions in Hawaii’s Corrections Man-agement Information System and inmate counts from each facil-ity.
Illinois—Population counts are based on jurisdiction data.Counts of inmates with a sentence of more than 1 year includean undetermined number of inmates with a sentence of lessthan 1 year.
Iowa—Population counts are based on custody data. Populationcounts for inmates with a sentence of more than 1 year includean undetermined number of inmates with a sentence of lessthan 1 year and unsentenced inmates. Iowa does not differenti-ate among these groups in its data system.
Kansas—Population counts for inmates with a sentence of morethan 1 year include a small undetermined number of inmateswith sentences of less than 1 year.
Louisiana—Counts for 2007 are as of December 27, 2007.
Maryland—The exclusive use of an automated data system mayhave rendered counts for 2009 not comparable to previous years’counts.
Massachusetts—By law, offenders may be sentenced to terms ofup to 2 years and 6 months in locally-operated jails and correc-tional institutions. Such populations are included in counts andrates for local jails and correctional institutions. Inmates withsentences of more than 1 year (4,012) were held in local jails.Jurisdiction and custody counts include an undetermined num-ber of inmates who were remanded to court, transferred to thecustody of another state, federal, or locally-operated system, andsubsequently released.
Mississippi—Jurisdiction counts include 1,009 males and 134females with unknown sentence lengths.
Nevada—Due to a system conversion, data for 2007 were calcu-lated with ratio estimates and are based on 2006 numbers. Allestimates were reviewed by individuals at the Nevada Depart-ment of Corrections.
New Jersey—Counts of inmates with a sentence of more than 1year include an undetermined number of inmates with sen-tences of just 1 year. The Department of Corrections has nojurisdiction over inmates with sentences of less than 1 year orover unsentenced inmates.
Ohio—Counts of inmates with a sentence of more than 1 yearinclude an undetermined number of inmates with sentences of 1year or less.
Oklahoma—Population counts for inmates with sentences ofless than 1 year consist mainly of offenders ordered by the courtto the Delayed Sentencing Program for Young Adults pursuantto 22 O.S. 996 through 996.3.
Oregon—Counts include an undetermined number of inmateswith sentences of 1 year or less. County authorities retain juris-diction over the majority of these types of inmates.
Rhode Island—Prisons and jails form one integrated system.All NPS data include jail and prison populations.
Vermont—Prisons and jails form one integrated system. AllNPS data include jail and prison populations.
Virginia—Jurisdiction counts for 2007 reflect populations onDecember 28, 2007.
June 2010Prison Inmates at Midyear 2009 - Statistical Tables27
U.S. Department of JusticeOffice of Justice ProgramsBureau of Justice Statistics
Washington, DC 20531
Official BusinessPenalty for Private Use $300
PRESORTED STANDARDPOSTAGE & FEES PAID
DOJ/BJSPermit No. G-91
*NCJ~230113*
The Bureau of Justice Statistics is the statistical agency of theU.S. Department of Justice. Michael D. Sinclair is actingdirector.
These Statistical Tables present the first release of findingsfrom permanent data collection programs. Heather C. West,Ph.D. wrote this report. William J. Sabol, P.h.D., SheriSimmons, and Tracy Snell verified the report.
Joshua Giunta carried out the data collection and processing under the supervision of Steve Simoncini, Governments Division, Census Bureau, U.S. Department of Commerce.
Catherine Bird and Jill Duncan edited the report, TinaDorsey produced the report, and Jayne Robinson preparedthe report for final printing under the supervision of Doris J.James.
June 2010, NCJ 230113
This report in portable document format and in ASCII andits related statistical data and tables are available at the BJSWorld Wide Web Internet site: <http://bjs.ojp.usdoj.gov/index.cfm?ty=pbdetail&iid=2200>.
Office of Justice ProgramsInnovation • Partnerships • Safer Neighborhoodshttp://www.ojp.usdoj.gov
June 2010Prison Inmates at Midyear 2009 - Statistical Tables28