Embed Size (px)
Citation preview
International Journal of Education and Research Vol. 1 No. 10 October 2013
1
BURNOUT AS A TOOL FOR SELF-REFLECTION
Ivana Cimermanová Department of English Language and Literature
Institute of American and British Studies Faculty of Arts, University of Presov
[email protected] Abstract: „More than one in four new teachers are suffering from ''emotional exhaustion'' and almost burnt out soon after starting their careers, according to a Monash University study.” (Marshall, 2013). This alarming information appeared online in October 2013. The present study presents the results of the research realised in Slovakia bringing similar results. Although it is generally believed that teachers are tired and exhausted, the effective tools how to reduce stress and increase motivation are being introduced very slowly. The article shortly suggests the permanent self-reflection of teacher’s performance as a tool that can lead and have a positive effect on lowering the burnout syndrome. Key words: burnout syndrome, portfolio, feedback, statistics Introduction
Many people claim that teachers can be recognised from afar. It sounds humiliating, degrading and embarrassing. Nevertheless, it might be true that they (we) are sacrificing too much in their (our) work and this is its cost. Physical and mental exhaustion and fatigue, demotivation, loss of motivation to work – these are all the symptoms of burnout. This frustration and apathy is usually preceded by two other phases, namely enthusiasm, stagnation and resignation (phases according to Hennig, Keller, 1996, p. 17)1. 1 Stress and Burnout Syndrome
Stress syndrome (not the one dealing with teaching profession) was described by Herbert Freudenberger in 1975. Burnout is a result of the imbalance between the professional expectations and professional reality, between ideals and reality (Syndróm vyhorenia, 2007). In burnout treatment mostly the existential analysis, logotherapy and daseinsanalysis are used (ibid).
How to prevent burnout syndrome? Various authors suggest different strategies to prevent stress, and how to cope with it, as the stress is one of the causes of burnout.
1 Herbert Freudenberger and Gail North have divided the process of burning out into 12 phases: a compulsion to prove oneself, working harder, neglecting their needs, displacement of conflicts, revision of values, denial of emerging problems, withdrawal, obvious behavioral changes, depersonalisation, inner emptiness, depression, burnout syndrome. (Kraft, 2006)
ISSN: 2201-6333 (Print) ISSN: 2201-6740 (Online) www.ijern.com
2
“Stress is defined as the emotional and physical strain caused by a person’s response to pressure from the outside world. It occurs when there is a mismatch between what the people aspire to do what they are capable of doing. In other words, stress results when the pressure to perform a certain task is greater than the resources available to perform it.“ (Handbook on Stress Management Skills, n.a.)
Kyriacou (1996) defines the following stressors present in the educational environment: teaching pupils who lack motivation maintaining discipline time pressures and workload coping with change being evaluated by others dealing with colleagues self-esteem and status administration and management role conflict and ambiguity poor working conditions.
Magnusson, Gooding (1997, in: Syndróm vyhorenia) present the following symptoms of stress and burnout syndrome that make the different:
Stress Burnout Syndrome Fatigue chronic exhaustion Anxiety feel of absence of society appreciation Dissatisfaction boredom or cynism lack of freedom social withdrawal, neglecting emotions mood swings impatience, irritability feeling guilty depression difficulty concentrating forgetfulness physiological disorders psychosomatic problems
C. Hennig a G. Keller, structured the symptoms of burnout syndrome into 4 categories (1996, p.18):
Psychological aspect (negative image or perception of own abilities; loss of self-confidence; negative and cynic attitude towards learners or their parents; loss of motivation or interest in professional development; concentration problems; escape from reality).
Emotional aspect (irritability, short temper and impulsive behaviour; nervousness a feeling tense; emotional deprivation; depression, helplessness feeling; self-piteousness, feeling of despair; feeling of absence of social appreciation).
Physical aspect (tiredness, vegetative problems; headaches; sleeping problems (insomnia, nightmares, disturbing dreams or sleeping too much); high blood pressure; muscle tension (neck ache, back pain, muscle spasms); dizziness a nausea; increased or decreased appetite).
International Journal of Education and Research Vol. 1 No. 10 October 2013
3
Social aspects (reduced contact with colleagues and friends; problems in a family and a private life; loss interest in hobbies)
2 Research 2.1 Aim of research
We wanted to investigate burnout syndrome among teachers experience. It also aimed at finding how teachers cope with stress and to present teacher portfolio as a possible tool to reduce stress. We also wanted to find the answer whether there is a relationship between the level of burnout and the gender, type of school where the teacher works, the length of teaching practice, age. We also got data to answer the question how many of them write their lesson plans, and how many teachers ask students for feedback. These data were also used for statistical analysis to find out the correlation between the level of burnout and these factors.
We were also interested in what teachers perceive as the most intensive stressor and how do they perceive the possibility to use teacher portfolio as a tool to record and reflect their teaching.
2.2 Procedure and sample
The experimental group consisted of 24 English Language teachers chosen among elementary school, secondary schools, university and working in non-formal education teachers (we do realise that it is a small and not-representative sample even though we applied statistics we do not consider the research valid, however, it gives a certain image about the status quo. The variables we measured were: the presence of burnout (emotional exhaustion depersonalisation and lack of personal accomplishment). We considered three different questionnaires/ inventories to answer our research question - Potterová 1997; Henning and Keller 1996 (mentioned already above) that assess burnouts syndrome regarding four different aspects – cognitive, emotional, physical and social; Maslach and Jackson 1981, that consists of three subscales emotional exhaustion depersonalisation and lack of personal accomplishment.
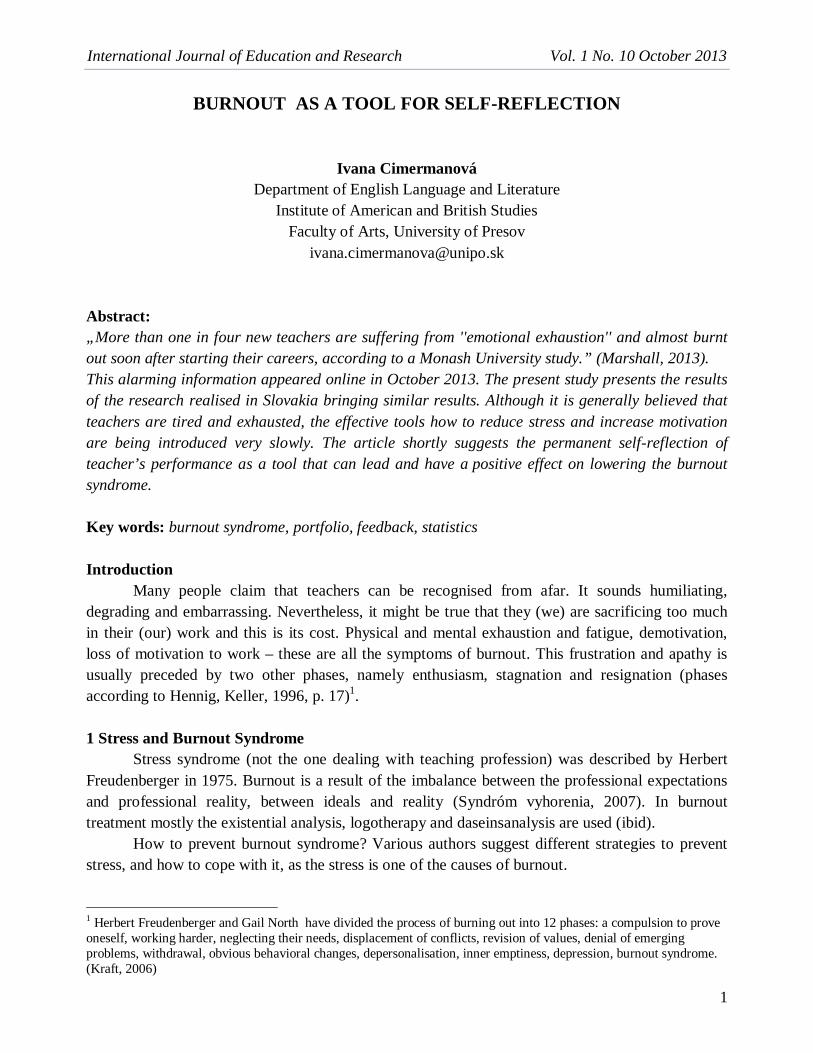
We applied the last one – Maslach Burnout Inventory (Maslach, Jackson), which consists of 22 ordinally scaled (0-6) items. The seven point likert scale ranging from “never” to “always” is used to rate the frequency and intensity of burnout symptoms. The Slovak version of this scale was used. The MBI results in three separate subscale scores as well as it measures single construct. The MBI was administered to teachers (19 female and 5 male respondents, different age categories and different teaching practice) and the compiled data were analysed using the statistical package Statistica. 2.3 Statistical analysis – quantitative data An average values of the frequency of the emotional exhaustion is 16,79 what is medium level. An average level of the intensity of emotional exhaustion is higher - 21,70 what can also be evaluated as medium level (low 0-16; medium17-26; high, burnout 27 and more).
ISSN: 2201-6333 (Print) ISSN: 2201-6740 (Online) www.ijern.com
4
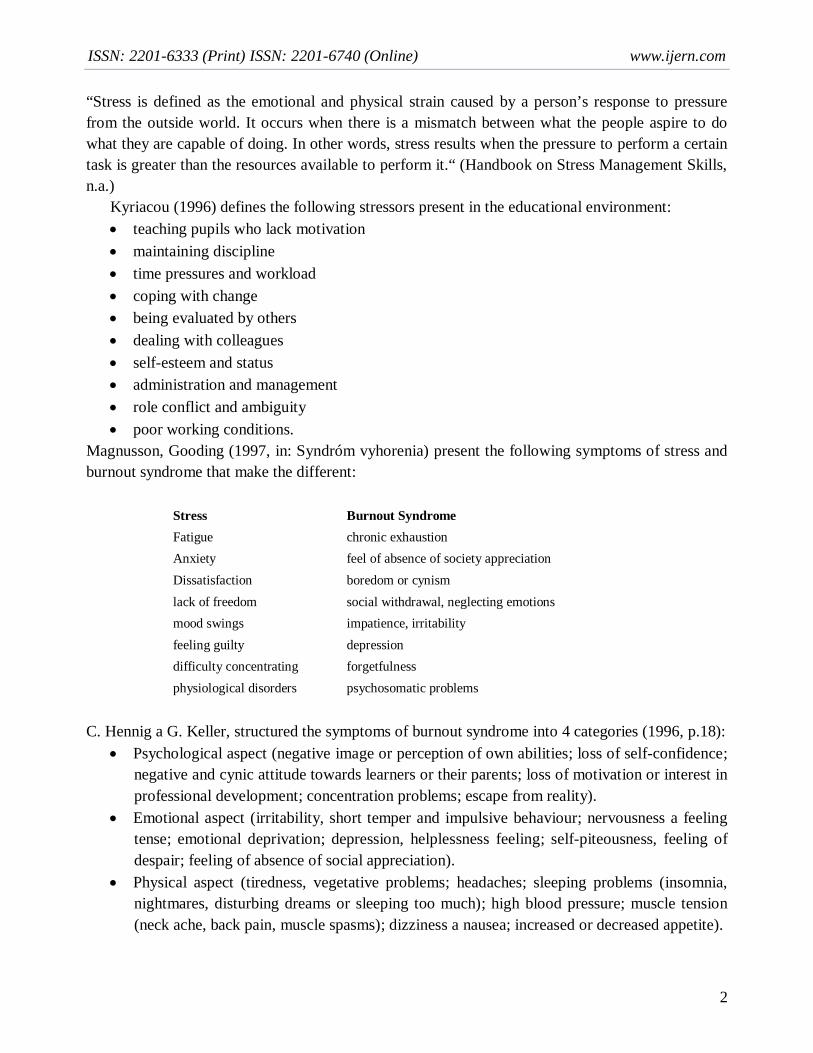
(The values displayed at x axis are values measured per individual respondents, value 25 is their average value). As it can be seen in the graphs there are 2 respondents who reached the values of high level of emotional exhaustion. Compared to intensity this number is lower, as many as 8 people (what is one third) reached the high level of emotional exhaustion. (The value in number 19 is not recorded, as the respondent did not answered all question and it was not included in an average calculation). We can state that one third (33,3%) of our respondents are emotionally exhausted. Analysing those two aspects individually, the values would be 12% and 34,78%. In both measurements the respondents number 11 is exhausted. It is a man (age 31-35 years, teaching practice 7-15 years) working at the elementary school. An average value of the frequency of depersonalisation is 6,17 what is at the border between low and medium level of depersonalisation. An average value of the intensity of depersonalisation is 6,79 what is the border of low and medium level of depersonalisation (low 0-6; medium 7-12; high, burnout 13 and more). As it can be seen in the graphs the level the level of depersonalisation is not so high as it was recorded in the category of emotional exhaustion. Out of 24 respondents there are only 2 respondents who reached the level of high depersonalisation (as to the frequency). Concerning the

International Journal of Education and Research Vol. 1 No. 10 October 2013
5
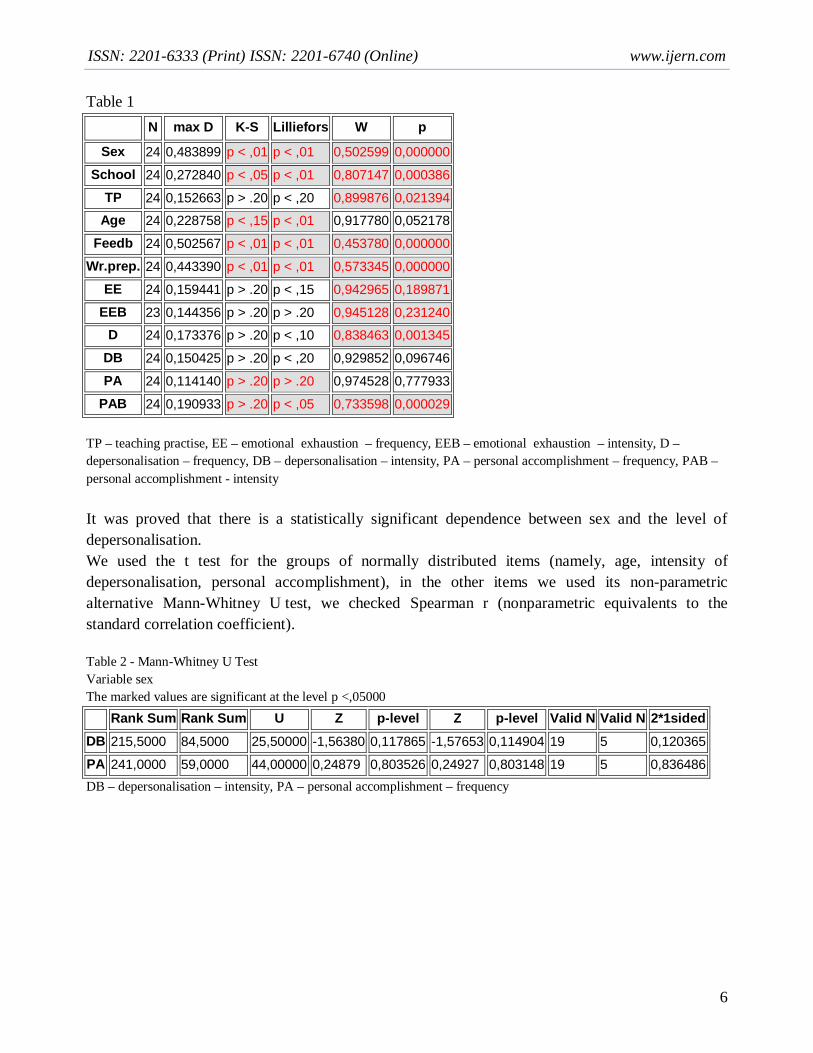
intensity of depersonalisation here are 4 (out of 23) respondents in the scale of the depersonalisation, what is 17,39%. In interesting result was recorded in case of the respondent number 23 where in both aspect (frequency and intensity) was the value zero (0). As it might be a quite surprising fact we consider it to be important to mention that it was a female respondent (age group 51-55 years, length of practice 31-35 years), who spent a year outside the educational system (free-lance work and holiday abroad) and thus the result might have been influenced by this factor. The fact why it is mentioned here, is the comparison with e.g. US where the status of sabbatical is introduced. Teacher has the right to go for sabbatical after the particular period of time (e.g. 5 years of teaching practice) and its paid. Some institutions offer the full salary per semester, or 50% salary per 2 semesters. Many teachers use it for their professional development or gaining the experience in different school abroad. The third measured scale in Maslach Burnout Inventory is the level of personal accomplishment. The average value of the frequency of personal accomplishment is 31, what is at the border between burnout and medium level of personal accomplishment. The average level of the intensity of PA is similar - 31,67. Almost one half of the respondents (11 out of 24) reached the level of personal accomplishment at the level of burnout, what is 45,83%. The graph 6showas that 8 respondents (out of 23) reached the low level of personal appreciation, i.e. high level of stress; what is slightly more than one third - 34,78. The aim of our research was to identify the relationship between the gender, type of school where the teacher works, the length of teaching practice, age; written preparations, getting feedback and the level of burnout. Before running the tests we verified the normal distribution of data that is presented in the Table 1.
ISSN: 2201-6333 (Print) ISSN: 2201-6740 (Online) www.ijern.com
6
Table 1 N max D K-S Lilliefors W p
Sex 24 0,483899 p < ,01 p < ,01 0,502599 0,000000 School 24 0,272840 p < ,05 p < ,01 0,807147 0,000386
TP 24 0,152663 p > .20 p < ,20 0,899876 0,021394 Age 24 0,228758 p < ,15 p < ,01 0,917780 0,052178
Feedb 24 0,502567 p < ,01 p < ,01 0,453780 0,000000 Wr.prep. 24 0,443390 p < ,01 p < ,01 0,573345 0,000000
EE 24 0,159441 p > .20 p < ,15 0,942965 0,189871 EEB 23 0,144356 p > .20 p > .20 0,945128 0,231240
D 24 0,173376 p > .20 p < ,10 0,838463 0,001345 DB 24 0,150425 p > .20 p < ,20 0,929852 0,096746 PA 24 0,114140 p > .20 p > .20 0,974528 0,777933
PAB 24 0,190933 p > .20 p < ,05 0,733598 0,000029 TP – teaching practise, EE – emotional exhaustion – frequency, EEB – emotional exhaustion – intensity, D – depersonalisation – frequency, DB – depersonalisation – intensity, PA – personal accomplishment – frequency, PAB – personal accomplishment - intensity It was proved that there is a statistically significant dependence between sex and the level of depersonalisation. We used the t test for the groups of normally distributed items (namely, age, intensity of depersonalisation, personal accomplishment), in the other items we used its non-parametric alternative Mann-Whitney U test, we checked Spearman r (nonparametric equivalents to the standard correlation coefficient). Table 2 - Mann-Whitney U Test Variable sex The marked values are significant at the level p <,05000
Rank Sum Rank Sum U Z p-level Z p-level Valid N Valid N 2*1sided
DB 215,5000 84,5000 25,50000 -1,56380 0,117865 -1,57653 0,114904 19 5 0,120365
PA 241,0000 59,0000 44,00000 0,24879 0,803526 0,24927 0,803148 19 5 0,836486 DB – depersonalisation – intensity, PA – personal accomplishment – frequency
International Journal of Education and Research Vol. 1 No. 10 October 2013
7
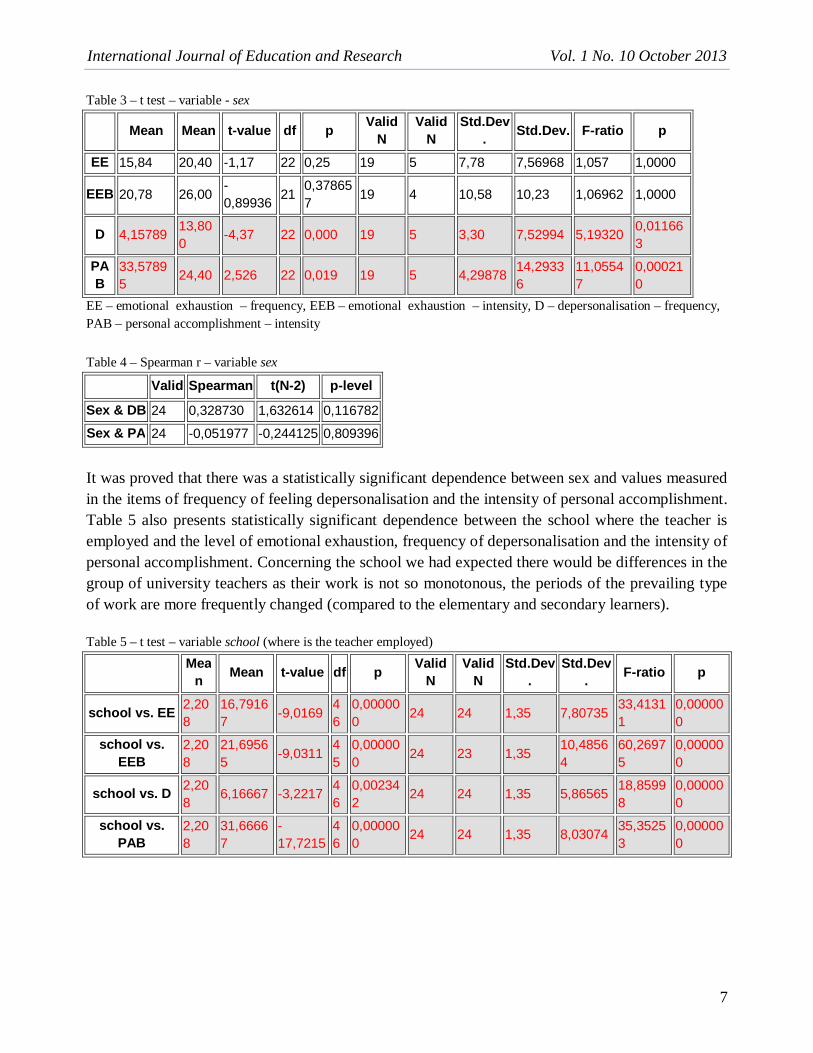
Table 3 – t test – variable - sex
Mean Mean t-value df p Valid
N Valid
N Std.Dev
. Std.Dev. F-ratio p
EE 15,84 20,40 -1,17 22 0,25 19 5 7,78 7,56968 1,057 1,0000
EEB 20,78 26,00 -0,89936 21
0,378657 19 4 10,58 10,23 1,06962 1,0000
D 4,15789 13,800
-4,37 22 0,000 19 5 3,30 7,52994 5,19320 0,011663
PAB
33,57895
24,40 2,526 22 0,019 19 5 4,29878 14,29336
11,05547
0,000210
EE – emotional exhaustion – frequency, EEB – emotional exhaustion – intensity, D – depersonalisation – frequency, PAB – personal accomplishment – intensity Table 4 – Spearman r – variable sex
Valid Spearman t(N-2) p-level Sex & DB 24 0,328730 1,632614 0,116782 Sex & PA 24 -0,051977 -0,244125 0,809396 It was proved that there was a statistically significant dependence between sex and values measured in the items of frequency of feeling depersonalisation and the intensity of personal accomplishment. Table 5 also presents statistically significant dependence between the school where the teacher is employed and the level of emotional exhaustion, frequency of depersonalisation and the intensity of personal accomplishment. Concerning the school we had expected there would be differences in the group of university teachers as their work is not so monotonous, the periods of the prevailing type of work are more frequently changed (compared to the elementary and secondary learners). Table 5 – t test – variable school (where is the teacher employed)
Mean Mean t-value df p Valid
N Valid
N Std.Dev
. Std.Dev
. F-ratio p
school vs. EE 2,208
16,79167 -9,0169
46
0,000000 24 24 1,35 7,80735
33,41311
0,000000
school vs. EEB
2,208
21,69565 -9,0311
45
0,000000 24 23 1,35
10,48564
60,26975
0,000000
school vs. D 2,208
6,16667 -3,2217 46
0,002342
24 24 1,35 5,86565 18,85998
0,000000
school vs. PAB
2,208
31,66667
-17,7215
46
0,000000
24 24 1,35 8,03074 35,35253
0,000000
ISSN: 2201-6333 (Print) ISSN: 2201-6740 (Online) www.ijern.com
8
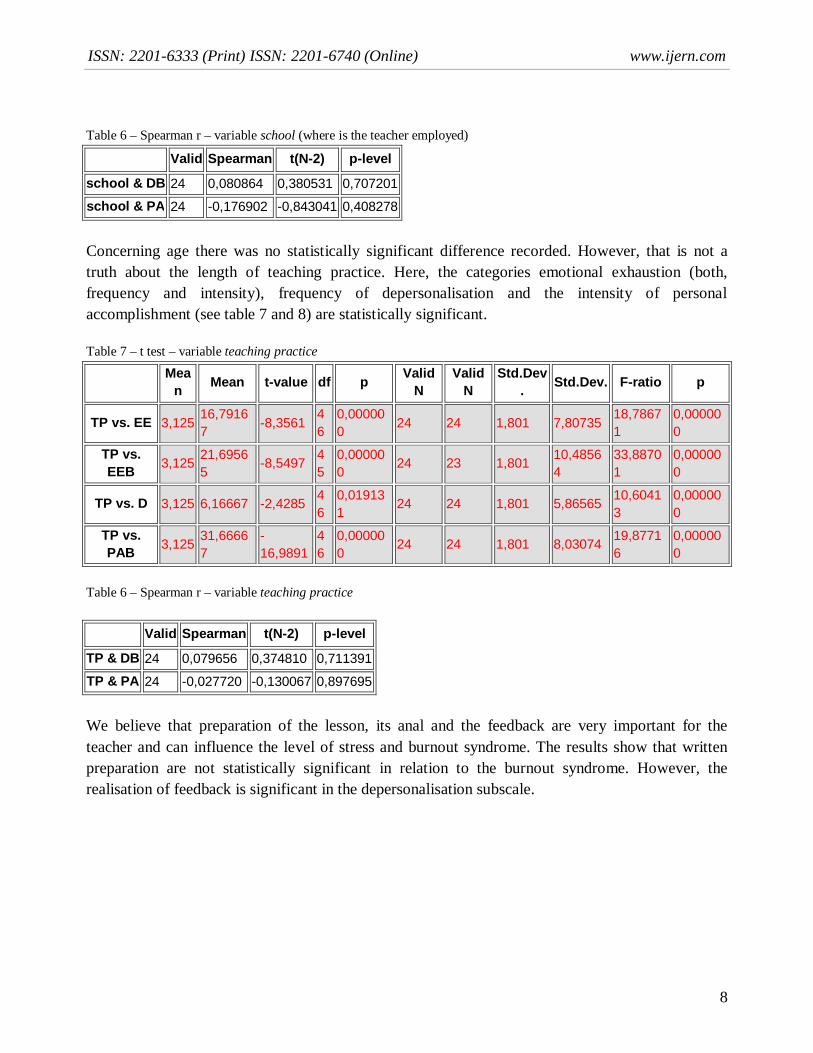
Table 6 – Spearman r – variable school (where is the teacher employed)
Valid Spearman t(N-2) p-level school & DB 24 0,080864 0,380531 0,707201 school & PA 24 -0,176902 -0,843041 0,408278 Concerning age there was no statistically significant difference recorded. However, that is not a truth about the length of teaching practice. Here, the categories emotional exhaustion (both, frequency and intensity), frequency of depersonalisation and the intensity of personal accomplishment (see table 7 and 8) are statistically significant. Table 7 – t test – variable teaching practice
Mean Mean t-value df p Valid
N Valid
N Std.Dev
. Std.Dev. F-ratio p
TP vs. EE 3,125 16,79167 -8,3561
46
0,000000 24 24 1,801 7,80735
18,78671
0,000000
TP vs. EEB 3,125 21,6956
5 -8,5497 4
5 0,000000
24 23 1,801 10,48564
33,88701
0,000000
TP vs. D 3,125 6,16667 -2,4285 46
0,019131
24 24 1,801 5,86565 10,60413
0,000000
TP vs. PAB 3,125 31,6666
7 -16,9891
46
0,000000
24 24 1,801 8,03074 19,87716
0,000000
Table 6 – Spearman r – variable teaching practice
Valid Spearman t(N-2) p-level TP & DB 24 0,079656 0,374810 0,711391 TP & PA 24 -0,027720 -0,130067 0,897695 We believe that preparation of the lesson, its anal and the feedback are very important for the teacher and can influence the level of stress and burnout syndrome. The results show that written preparation are not statistically significant in relation to the burnout syndrome. However, the realisation of feedback is significant in the depersonalisation subscale.
International Journal of Education and Research Vol. 1 No. 10 October 2013
9
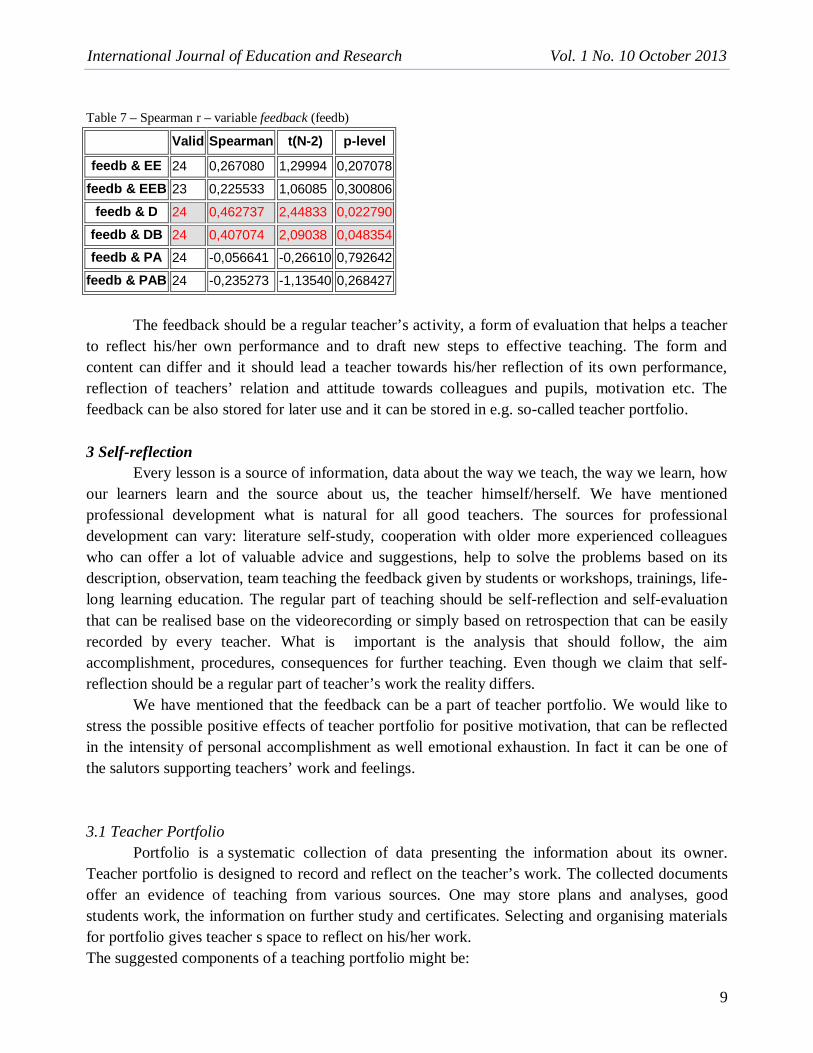
Table 7 – Spearman r – variable feedback (feedb)
Valid Spearman t(N-2) p-level feedb & EE 24 0,267080 1,29994 0,207078
feedb & EEB 23 0,225533 1,06085 0,300806 feedb & D 24 0,462737 2,44833 0,022790
feedb & DB 24 0,407074 2,09038 0,048354 feedb & PA 24 -0,056641 -0,26610 0,792642
feedb & PAB 24 -0,235273 -1,13540 0,268427
The feedback should be a regular teacher’s activity, a form of evaluation that helps a teacher to reflect his/her own performance and to draft new steps to effective teaching. The form and content can differ and it should lead a teacher towards his/her reflection of its own performance, reflection of teachers’ relation and attitude towards colleagues and pupils, motivation etc. The feedback can be also stored for later use and it can be stored in e.g. so-called teacher portfolio.
3 Self-reflection
Every lesson is a source of information, data about the way we teach, the way we learn, how our learners learn and the source about us, the teacher himself/herself. We have mentioned professional development what is natural for all good teachers. The sources for professional development can vary: literature self-study, cooperation with older more experienced colleagues who can offer a lot of valuable advice and suggestions, help to solve the problems based on its description, observation, team teaching the feedback given by students or workshops, trainings, life-long learning education. The regular part of teaching should be self-reflection and self-evaluation that can be realised base on the videorecording or simply based on retrospection that can be easily recorded by every teacher. What is important is the analysis that should follow, the aim accomplishment, procedures, consequences for further teaching. Even though we claim that self-reflection should be a regular part of teacher’s work the reality differs.
We have mentioned that the feedback can be a part of teacher portfolio. We would like to stress the possible positive effects of teacher portfolio for positive motivation, that can be reflected in the intensity of personal accomplishment as well emotional exhaustion. In fact it can be one of the salutors supporting teachers’ work and feelings.
3.1 Teacher Portfolio Portfolio is a systematic collection of data presenting the information about its owner.
Teacher portfolio is designed to record and reflect on the teacher’s work. The collected documents offer an evidence of teaching from various sources. One may store plans and analyses, good students work, the information on further study and certificates. Selecting and organising materials for portfolio gives teacher s space to reflect on his/her work. The suggested components of a teaching portfolio might be:
ISSN: 2201-6333 (Print) ISSN: 2201-6740 (Online) www.ijern.com
10
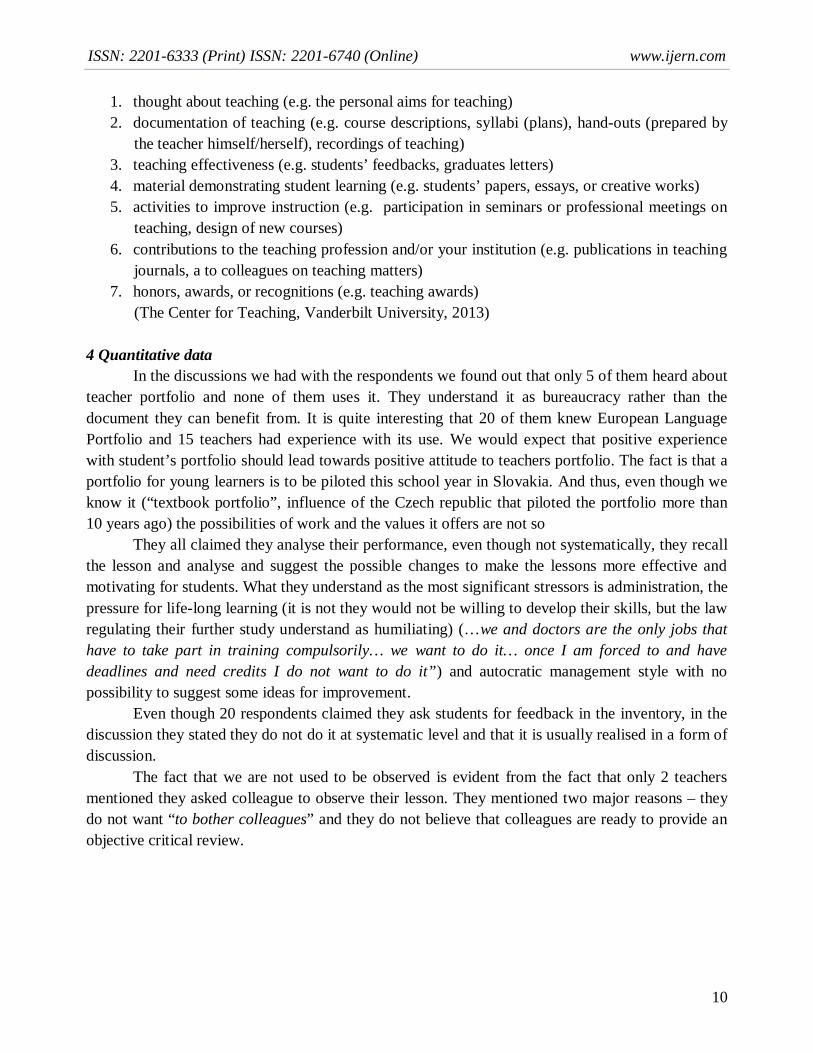
1. thought about teaching (e.g. the personal aims for teaching) 2. documentation of teaching (e.g. course descriptions, syllabi (plans), hand-outs (prepared by
the teacher himself/herself), recordings of teaching) 3. teaching effectiveness (e.g. students’ feedbacks, graduates letters) 4. material demonstrating student learning (e.g. students’ papers, essays, or creative works) 5. activities to improve instruction (e.g. participation in seminars or professional meetings on
teaching, design of new courses) 6. contributions to the teaching profession and/or your institution (e.g. publications in teaching
journals, a to colleagues on teaching matters) 7. honors, awards, or recognitions (e.g. teaching awards)
(The Center for Teaching, Vanderbilt University, 2013) 4 Quantitative data
In the discussions we had with the respondents we found out that only 5 of them heard about teacher portfolio and none of them uses it. They understand it as bureaucracy rather than the document they can benefit from. It is quite interesting that 20 of them knew European Language Portfolio and 15 teachers had experience with its use. We would expect that positive experience with student’s portfolio should lead towards positive attitude to teachers portfolio. The fact is that a portfolio for young learners is to be piloted this school year in Slovakia. And thus, even though we know it (“textbook portfolio”, influence of the Czech republic that piloted the portfolio more than 10 years ago) the possibilities of work and the values it offers are not so
They all claimed they analyse their performance, even though not systematically, they recall the lesson and analyse and suggest the possible changes to make the lessons more effective and motivating for students. What they understand as the most significant stressors is administration, the pressure for life-long learning (it is not they would not be willing to develop their skills, but the law regulating their further study understand as humiliating) (…we and doctors are the only jobs that have to take part in training compulsorily… we want to do it… once I am forced to and have deadlines and need credits I do not want to do it”) and autocratic management style with no possibility to suggest some ideas for improvement.
Even though 20 respondents claimed they ask students for feedback in the inventory, in the discussion they stated they do not do it at systematic level and that it is usually realised in a form of discussion.
The fact that we are not used to be observed is evident from the fact that only 2 teachers mentioned they asked colleague to observe their lesson. They mentioned two major reasons – they do not want “to bother colleagues” and they do not believe that colleagues are ready to provide an objective critical review.
International Journal of Education and Research Vol. 1 No. 10 October 2013
11
Conclusion
The research showed the presence of a medium level of burnout in the group of 24 teachers randomly selected. Individual scores and scores depend on the age and the length of teaching practice. In all three subscores there was recorded a statistically significant dependence – sex (D, PAB), teaching practice (EE, EEB, D, PAB), school (EE, EEB,D, PAB), feedback (D,DB).
Students feedback and reflection of own work can help to increase the level of personal accomplishment and emotional exhaustion. We also believe that appropriate style of management is important for creating the feeling of being accepted, supported in professional development, similarly as already mentioned sabbatical can help teachers to offer students relaxed and motivation atmosphere. It also offers space for further development followed by personal accomplishment (and perhaps financial appraisal).
ISSN: 2201-6333 (Print) ISSN: 2201-6740 (Online) www.ijern.com
12
LITERATURE
Handbook on Stress Managemnet Skills, Centre for Good governance, (u.a.), [online] Available:
http://www.cgg.gov.in/publicationdownloads2a/Stress%20Management%20Skill.pdf (September
30, 2013)
HENNING, C., KELLER, G.(1996). Antistresový program pro učitele. Praha: Portál
KRAFT, U. (2006), Burned Out. In: Scientific American Mind, June/July 2006, [Online] Available
http://www.jb-schnittstelle.de/wer/ulrich_kraft/Burned%20Out.pdf (September 4, 2013)
KYRIACOU, Ch. (1996). Klíčové dovednosti učitele. Portál, Praha
KYRIACOU, Ch. (2001). Essentials of Language Teaching. Nelson Thornes Ltd United Kingdom
Marshal, K. (2013), Burnout hits one in four teachers. [Online] Available:
http://www.theage.com.au/victoria/burnout-hits-one-in-four-teachers-20131005-2v13y.html
(October 06, 2013)
Syndróm vyhorenia. Wikipedia. (2007), [Online] Available:
http://sk.wikipedia.org/wiki/Syndr%C3%B3m_vyhorenia (January 1, 2004)
Syndróm vyhorenia. (u.a), [Online] Available: http://madaras.szm.sk/PaPZ/vyhorenie.doc (October
01, 2013)
The Center for Teaching, Vanderbilt University, (2013), Teaching Portfolios. [Online]. Available:
http://cft.vanderbilt.edu/teaching-guides/reflecting/teaching-portfolios/ (October 7, 2013)