Embed Size (px)
Citation preview
Bus passengers have their say
Trust, what to improve and using buses moreMarch 2016
IntroductionNearly two thirds of all journeys made using publictransport in Great Britain are by bus – making bus by far the most commonly used mode of public transport.Buses play a major part in getting people to work and to education as well as linking communities with shopsand essential services.
However, the bus industry is facing serious challenges.The number of passenger journeys in England (outsideLondon) continues to decline while spending pressureson local authorities have resulted in a significantreduction in local authority supported services1. Theintention of the Government’s proposed ‘Buses Bill’ is to increase bus passenger numbers. The Bill will give local authorities a range of partnership workingarrangements, including the option to franchise local bus services.
This makes it all the more important that services are built around the needs of passengers and that theirviews and aspirations are at the heart of decision-making.An essential part of this is to know what passengers think about existing services and what they want to see improved in the future.
This report is part of that process. It provides anumber of pointers for local authorities and the busindustry to both provide a better experience for currentpassengers and also attract new ones. These should beat the heart of whatever agreement they enter into. TheBill should provide the framework to enable this happen.
We asked over 4500 bus passengers in England(outside London) what they most wanted to seeimproved, and about their relationship with, and trust in, their bus company. We also asked 2400 lessfrequent and non-users users of bus services why they did not travel more by bus and what might makethem do so.
This report confirms the importance of providing agood ‘core product’ – a frequent, punctual and reliableservice that provides value for money. It also shows thatthere is real value in companies communicating andengaging with passengers and building up a relationship.Not only could this help in making better decisions butalso generate trust and goodwill towards the companywhen things go wrong.
Transport Focus also carries out the Bus PassengerSurvey (BPS2) which looks at how satisfied passengersare with their bus journey. Combining our work onsatisfaction with this report, on priorities and trust, means that we have gathered the views of just under45,000 people in the last year. This gives us a verycomprehensive and powerful understanding of whatpassengers experience, want and expect from the bus industry.
We urge bus operators, local transport authorities and central Government to take note of the researchfindings and work collaboratively to advance the cause of buses and make them better for passengers.
2
Bus passengers have their say Trust, what to improve and using buses more
1 Annual bus statistics: England 2014/15. Department for Transport2 BPS: http://www.transportfocus.org.uk/research/bus-passenger-survey
Research methodology
There were two phases of the research work. Thequalitative study (conducted by Illuminas) explored how passengers assess the trust they have in the buscompanies they use and the level of relationship theyhave with the company. We carried out 12 focusgroups, two each in: Maidstone, Sheffield, Bristol,Reading, Lincolnshire, and Manchester.
The quantitative study (conducted by Populus) asked over4500 passengers across England their levels of trust in thebus companies they use, and to rank their priorities forimprovement among 31 separate aspects of their journey. It also asked around 2400 infrequent/non-users about theirviews on buses and what might make them travel more.Further details on both research studies can be found at:
• Qualititative: www.transportfocus.org.uk/research/publications/bus-passengers-have-their-say-qualitative-report
• Quantitative: www.transportfocus.org.uk/research/publications/bus-passengers-have-their-say-quantitative-report
Bus passengers’ priorities for improvement simulator toolOur simulator tool allows you to choose different groups of passengers and see their priorities for improvement; for example you can select by passengers’ journey purpose,their age group, or their frequency of bus use.
The simulator tool, along with instructions on how to use it, can be found on our website: www.transportfocus.org.uk/research/publications/bus-passengers-have-their-say-priorities-for-improvement-simulator
3
3 Passengers’ relationship with the rail industry:http://www.transportfocus.org.uk/research/publications/passengers-relationship-with-the-rail-industry
Trust is an important concept in anybusiness as it can bring loyalty and repeatpurchase. Transport is no exception. Weknow from our work on rail that a morepositive relationship with the operator can help to move rail travel from being a ‘distress purchase’ (especially amongst
commuters) to more of a conventionalcustomer/supplier relationship. We wantedto mirror this ‘trust’ research with buspassengers.
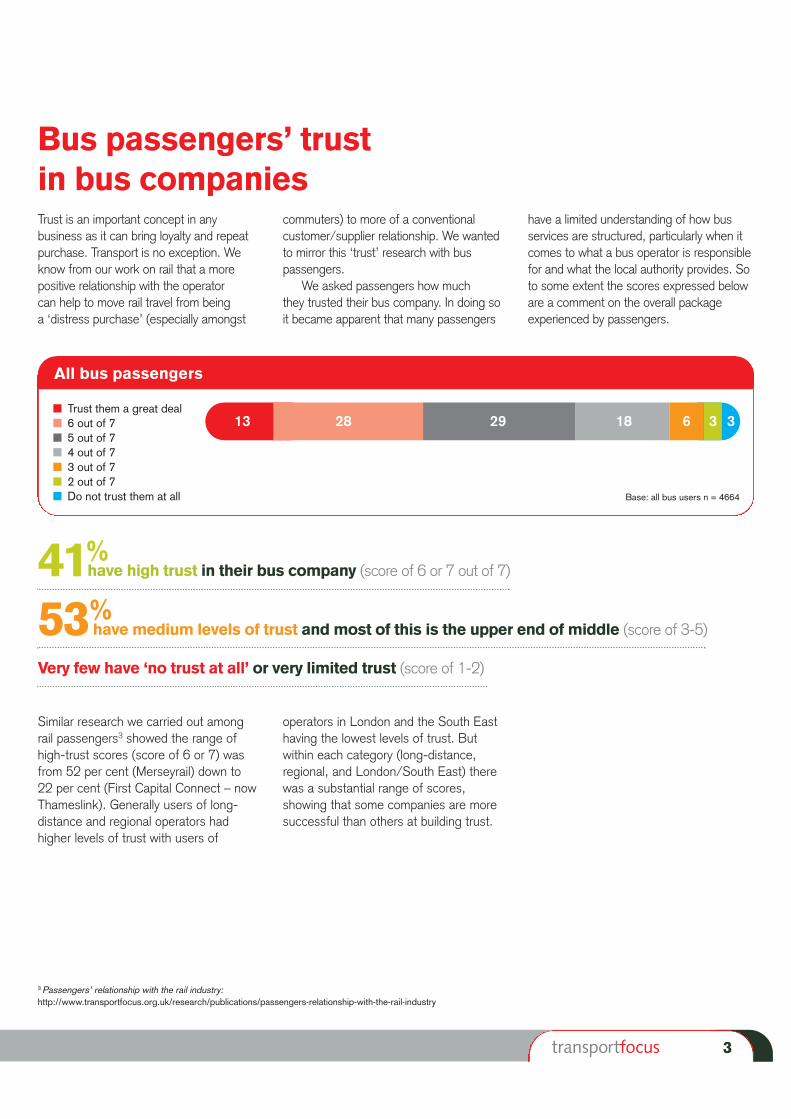
We asked passengers how much they trusted their bus company. In doing soit became apparent that many passengers
have a limited understanding of how busservices are structured, particularly when itcomes to what a bus operator is responsiblefor and what the local authority provides. Soto some extent the scores expressed beloware a comment on the overall packageexperienced by passengers.
Similar research we carried out among rail passengers3 showed the range ofhigh-trust scores (score of 6 or 7) wasfrom 52 per cent (Merseyrail) down to 22 per cent (First Capital Connect – nowThameslink). Generally users of long-distance and regional operators hadhigher levels of trust with users of
operators in London and the South Easthaving the lowest levels of trust. Butwithin each category (long-distance,regional, and London/South East) therewas a substantial range of scores,showing that some companies are moresuccessful than others at building trust.
Bus passengers’ trust in bus companies
All bus passengers
13 28 29 18 6 3 3
Base: all bus users n = 4664
41%have high trust in their bus company (score of 6 or 7 out of 7)
53%have medium levels of trust and most of this is the upper end of middle (score of 3-5)
Very few have ‘no trust at all’ or very limited trust (score of 1-2)
� Trust them a great deal� 6 out of 7� 5 out of 7� 4 out of 7� 3 out of 7� 2 out of 7� Do not trust them at all
4
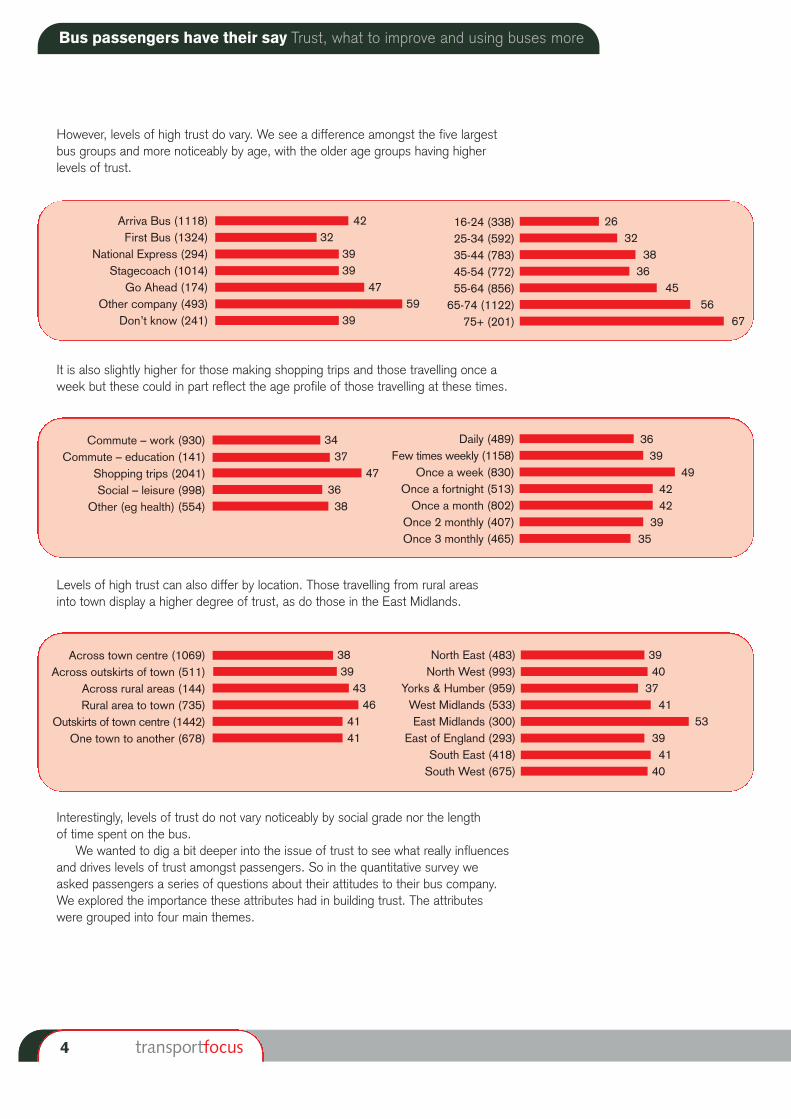
However, levels of high trust do vary. We see a difference amongst the five largest bus groups and more noticeably by age, with the older age groups having higher levels of trust.
Levels of high trust can also differ by location. Those travelling from rural areas into town display a higher degree of trust, as do those in the East Midlands.
Interestingly, levels of trust do not vary noticeably by social grade nor the length of time spent on the bus.
We wanted to dig a bit deeper into the issue of trust to see what really influencesand drives levels of trust amongst passengers. So in the quantitative survey we asked passengers a series of questions about their attitudes to their bus company. We explored the importance these attributes had in building trust. The attributes were grouped into four main themes.
It is also slightly higher for those making shopping trips and those travelling once aweek but these could in part reflect the age profile of those travelling at these times.
Arriva Bus (1118)First Bus (1324)
National Express (294)Stagecoach (1014)
Go Ahead (174)Other company (493)
Don’t know (241)
16-24 (338) 25-34 (592) 35-44 (783) 45-54 (772) 55-64 (856) 65-74 (1122)
75+ (201)
Commute – work (930) Commute – education (141)
Shopping trips (2041) Social – leisure (998)
Other (eg health) (554)
Across town centre (1069) Across outskirts of town (511)
Across rural areas (144) Rural area to town (735)
Outskirts of town centre (1442) One town to another (678)
North East (483) North West (993)
Yorks & Humber (959) West Midlands (533) East Midlands (300)
East of England (293) South East (418) South West (675)
Daily (489) Few times weekly (1158)
Once a week (830) Once a fortnight (513) Once a month (802)
Once 2 monthly (407) Once 3 monthly (465)
26 32
38 36
45 56
67
4232
3939
4759
39
34 37
47 36 38
38 39 43 46
41 41
39 40 3741
53 394140
36 39
494242
39 35
Bus passengers have their say Trust, what to improve and using buses more
5
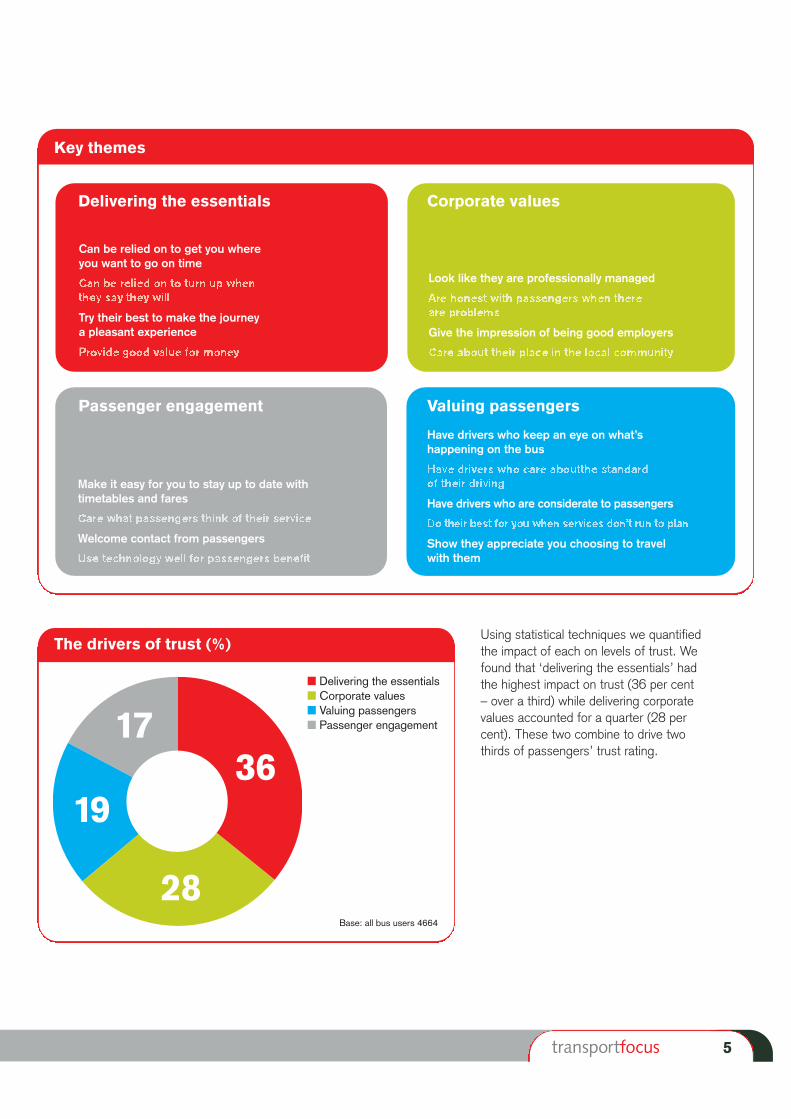
Using statistical techniques we quantifiedthe impact of each on levels of trust. Wefound that ‘delivering the essentials’ hadthe highest impact on trust (36 per cent – over a third) while delivering corporatevalues accounted for a quarter (28 percent). These two combine to drive twothirds of passengers’ trust rating.
The drivers of trust (%)
Base: all bus users 4664
� Delivering the essentials� Corporate values� Valuing passengers� Passenger engagement
362819
17
Key themes
28
Can be relied on to get you where you want to go on time
Try their best to make the journey a pleasant experience
Have drivers who keep an eye on what’s happening on the bus
Have drivers who are considerate to passengers
Show they appreciate you choosing to travel with them
Look like they are professionally managed
Give the impression of being good employers
Make it easy for you to stay up to date withtimetables and fares
Welcome contact from passengers
Delivering the essentials Corporate values
Passenger engagement Valuing passengers
6
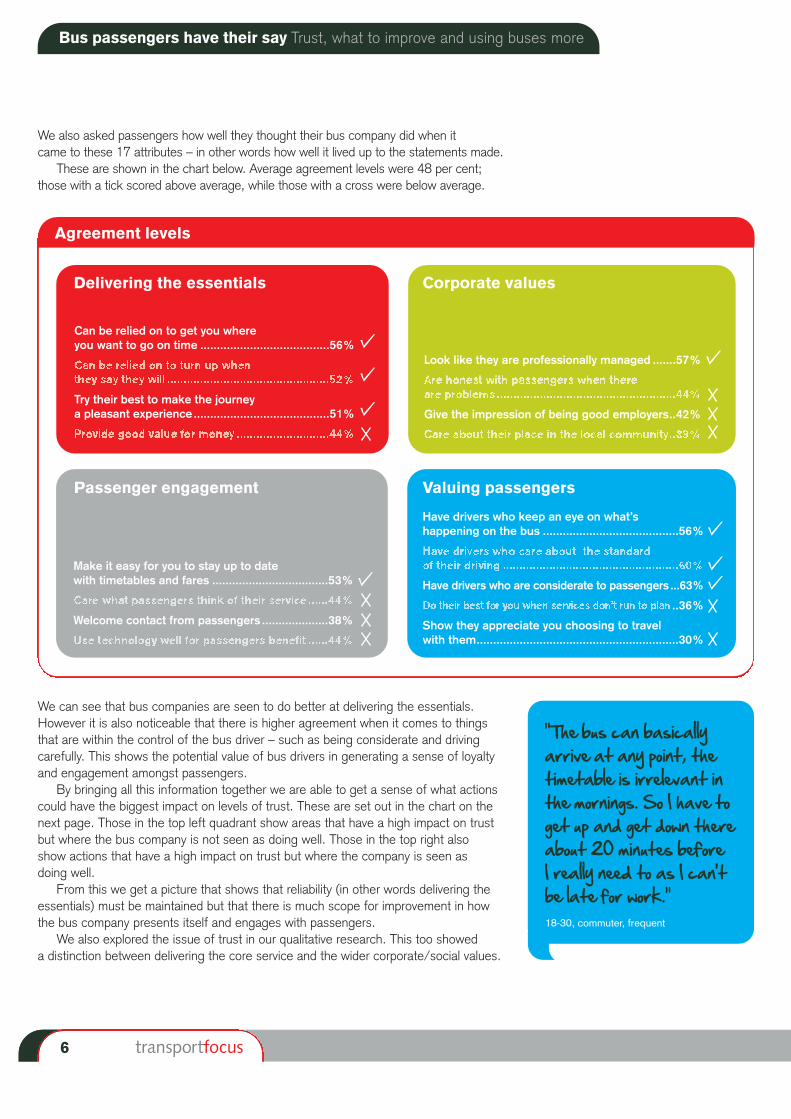
We also asked passengers how well they thought their bus company did when it came to these 17 attributes – in other words how well it lived up to the statements made.
These are shown in the chart below. Average agreement levels were 48 per cent;those with a tick scored above average, while those with a cross were below average.
We can see that bus companies are seen to do better at delivering the essentials.However it is also noticeable that there is higher agreement when it comes to thingsthat are within the control of the bus driver – such as being considerate and drivingcarefully. This shows the potential value of bus drivers in generating a sense of loyaltyand engagement amongst passengers.
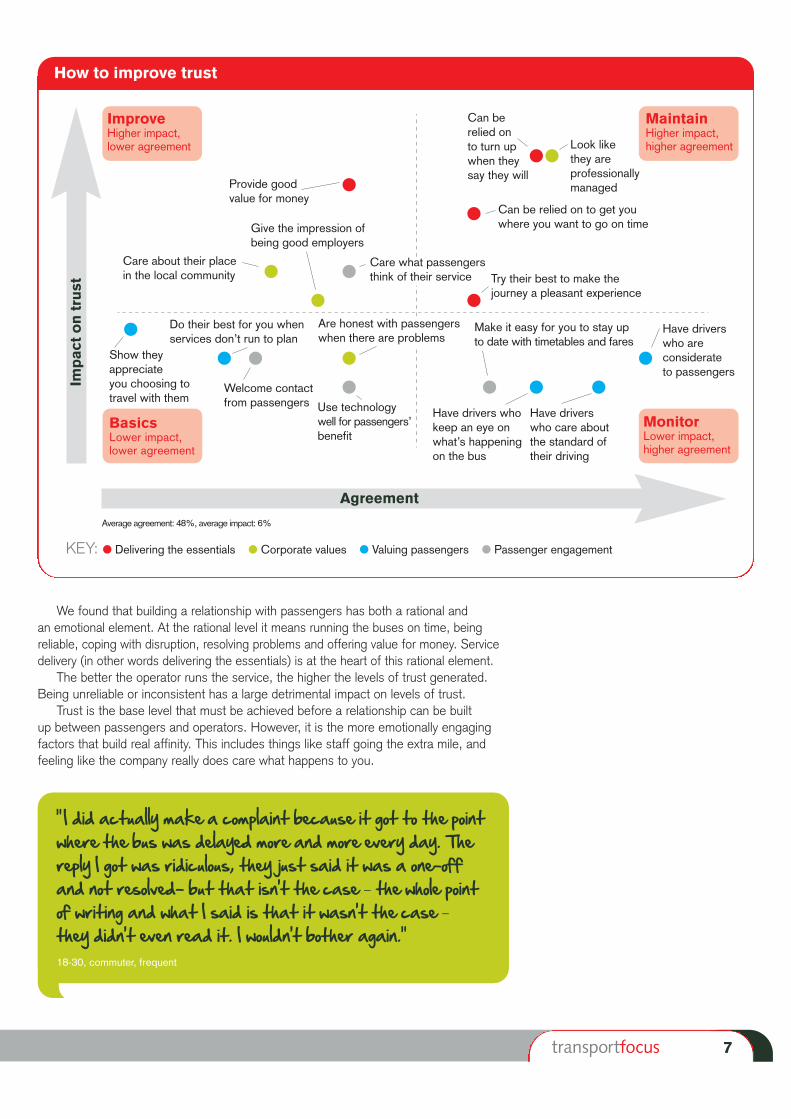
By bringing all this information together we are able to get a sense of what actionscould have the biggest impact on levels of trust. These are set out in the chart on thenext page. Those in the top left quadrant show areas that have a high impact on trustbut where the bus company is not seen as doing well. Those in the top right also show actions that have a high impact on trust but where the company is seen as doing well.
From this we get a picture that shows that reliability (in other words delivering theessentials) must be maintained but that there is much scope for improvement in howthe bus company presents itself and engages with passengers.
We also explored the issue of trust in our qualitative research. This too showed a distinction between delivering the core service and the wider corporate/social values.
“The bus can basicallyarrive at any point, thetimetable is irrelevant inthe mornings. So I have toget up and get down thereabout 20 minutes before I really need to as I can’tbe late for work.”18-30, commuter, frequent
Agreement levels
Bus passengers have their say Trust, what to improve and using buses more
Can be relied on to get you where you want to go on time .......................................56%
Try their best to make the journey a pleasant experience.........................................51%
Have drivers who keep an eye on what’s happening on the bus .........................................56%
Have drivers who are considerate to passengers ...63%
..36%
Show they appreciate you choosing to travel with them.............................................................30%
Look like they are professionally managed .......57%
Give the impression of being good employers..42%
Make it easy for you to stay up to date with timetables and fares ...................................53%
Welcome contact from passengers ....................38%
Delivering the essentials Corporate values
Passenger engagement Valuing passengers
7
“ I did actually make a complaint because it got to the pointwhere the bus was delayed more and more every day. Thereply I got was ridiculous, they just said it was a one-offand not resolved- but that isn’t the case – the whole pointof writing and what I said is that it wasn’t the case –they didn’t even read it. I wouldn’t bother again.”18-30, commuter, frequent
We found that building a relationship with passengers has both a rational and an emotional element. At the rational level it means running the buses on time, beingreliable, coping with disruption, resolving problems and offering value for money. Servicedelivery (in other words delivering the essentials) is at the heart of this rational element.
The better the operator runs the service, the higher the levels of trust generated.Being unreliable or inconsistent has a large detrimental impact on levels of trust.
Trust is the base level that must be achieved before a relationship can be built up between passengers and operators. However, it is the more emotionally engagingfactors that build real affinity. This includes things like staff going the extra mile, andfeeling like the company really does care what happens to you.
How to improve trust
Can be relied on to turn up when they say they will
Can be relied on to get you where you want to go on time
Have driverswho care aboutthe standard oftheir driving
Try their best to make the journey a pleasant experience
Have driverswho are considerate to passengers
Do their best for you when services don’t run to plan
Have drivers whokeep an eye onwhat’s happeningon the bus
Make it easy for you to stay upto date with timetables and fares
Care what passengersthink of their service
Welcome contactfrom passengers
Are honest with passengerswhen there are problems
Show they appreciate you choosing totravel with them
Use technology well for passengers’ benefit
ImproveHigher impact,lower agreement
BasicsLower impact,lower agreement
Impac
t on tru
st
Average agreement: 48%, average impact: 6%
Care about their place in the local community
Provide good value for money
KEY: � Delivering the essentials � Corporate values � Valuing passengers � Passenger engagement
Give the impression of being good employers
Agreement
MaintainHigher impact,higher agreement
MonitorLower impact,higher agreement
Look like they are professionallymanaged
8
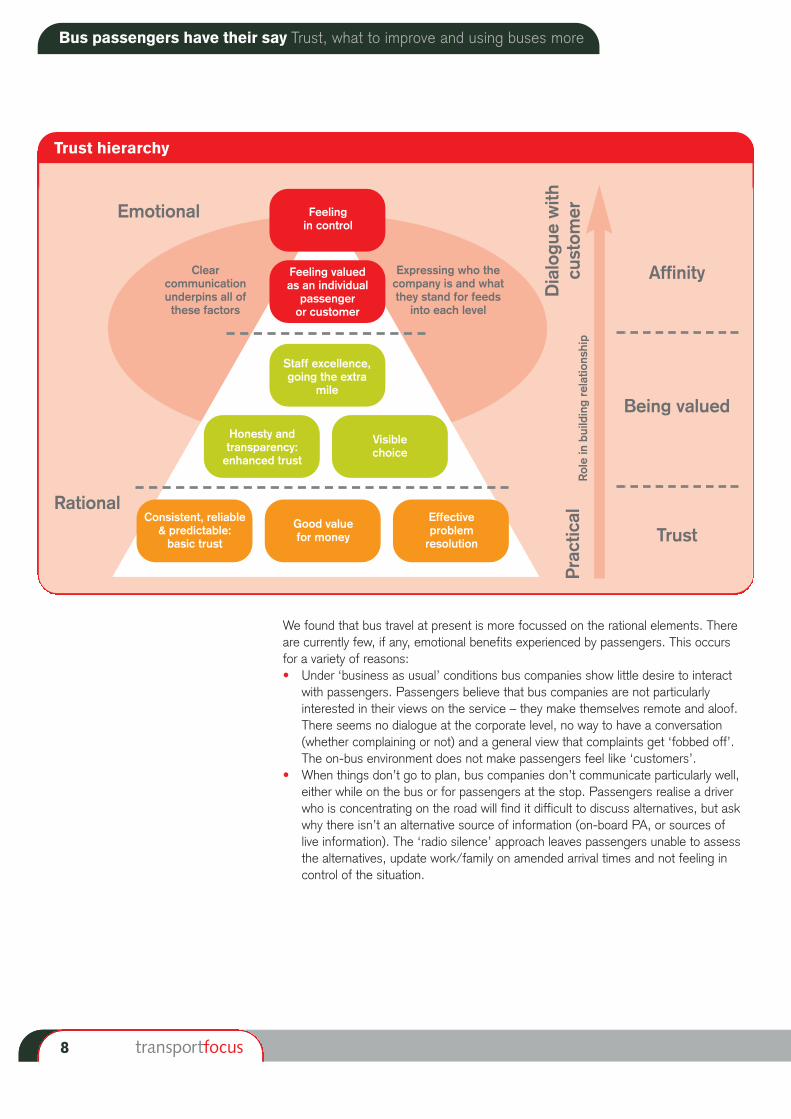
Trust hierarchy
We found that bus travel at present is more focussed on the rational elements. Thereare currently few, if any, emotional benefits experienced by passengers. This occurs for a variety of reasons:• Under ‘business as usual’ conditions bus companies show little desire to interact
with passengers. Passengers believe that bus companies are not particularlyinterested in their views on the service – they make themselves remote and aloof.There seems no dialogue at the corporate level, no way to have a conversation(whether complaining or not) and a general view that complaints get ‘fobbed off’.The on-bus environment does not make passengers feel like ‘customers’.
• When things don’t go to plan, bus companies don’t communicate particularly well,either while on the bus or for passengers at the stop. Passengers realise a driverwho is concentrating on the road will find it difficult to discuss alternatives, but askwhy there isn’t an alternative source of information (on-board PA, or sources of live information). The ‘radio silence’ approach leaves passengers unable to assessthe alternatives, update work/family on amended arrival times and not feeling incontrol of the situation.
Bus passengers have their say Trust, what to improve and using buses more
Feeling in control
Affinity
Emotional
Rational
Being valued
Trust
Feeling valued as an individual
passengeror customer
Expressing who thecompany is and whatthey stand for feeds
into each level
Role in building relatio
nship
Clear communicationunderpins all of these factors
Staff excellence,going the extra
mile
Honesty andtransparency:enhanced trust
Consistent, reliable & predictable: basic trust
Good value for money
Effective problem resolution
Visible choice
Practical
Dialogu
e with
custom
er
9
• Passengers speak of variable experiences from drivers, even from the same driveron different occasions. Many passengers feel there isn’t a welcoming exchangewhen boarding the bus, or appreciation of their custom. Where drivers showempathy with passengers these are seen as ‘magic moments’ – not just by thepassenger it relates to, but also by other people on the bus who see it too. Giventhe remoteness of the company, the bus driver is largely the only point of contactbetween the passenger and the operator.
• The value of the driver is also something that comes through our research on valuefor money (Bus passenger views on value for money, October 20134) where driversare seen as the main source of information on fares and ticketing. Our researchsuggests that smart ticketing offers opportunities to build trust, both in terms of itsability to offer a ‘best fare’ guarantee and by offering loyalty schemes that rewardpassengers. Smart ticketing could provide one of the ‘bridges’ between the rationaland emotional levels of trust.
Building trust is made more difficult by it not being clear to passengers who runs which parts of the bus network, why bus routes run where they do, and at what timeservices choose to run. This has far-reaching implications:• passengers don’t know who to complain to if there are systemic failings in a bus
service, which they find disempowering• passengers make assumptions on how buses are set up, believing it to be run by
a combination of an ‘over-regulated’ public sector with a ‘profit imperative’ privatesector – arguably the worst possible stereotypes
• one outcome of this knowledge gap is that passengers don’t know who they should be ‘being valued by’ if even they were to be valued. Any value felt is moreascribed to drivers acting as individuals rather than from the bus company itself.Whilst passengers don’t want ‘chapter and verse’ on organisation and structure,they do want clear lines of sight, accountability and sanctions when there isconsistent underperformance.
4 Bus passenger views on value for money, October 2013:http://www.transportfocus.org.uk/research/publications/bus-passenger-views-on-value-for-money
“The bus driver got outof his cabin and helpedthe disabled passengerinto the bus, personallyensuring that they hadenough space and werecomfortable. I justthought that was great!It really cheered me upand restored my faith in humanity.”30-50, commuter, frequent
“My local bus service is quite unreliable,sometimes I have no wayof telling when the nextbus will be and it’sstressful for me if Ineed to get to work.”18-30, commuter, less frequent
“You’re just a number, they don’t care what you think or if you’re OK. The driver sees my disabled pass and thenspeeds away without even checking I’ve got to my seat. I’ve fallen over before now, and I don’t even know who I wouldcomplain to about that. And drivers don’t even have anumber or anything to identify them even if I could!”50+, frequent, leisure user, disabled
10
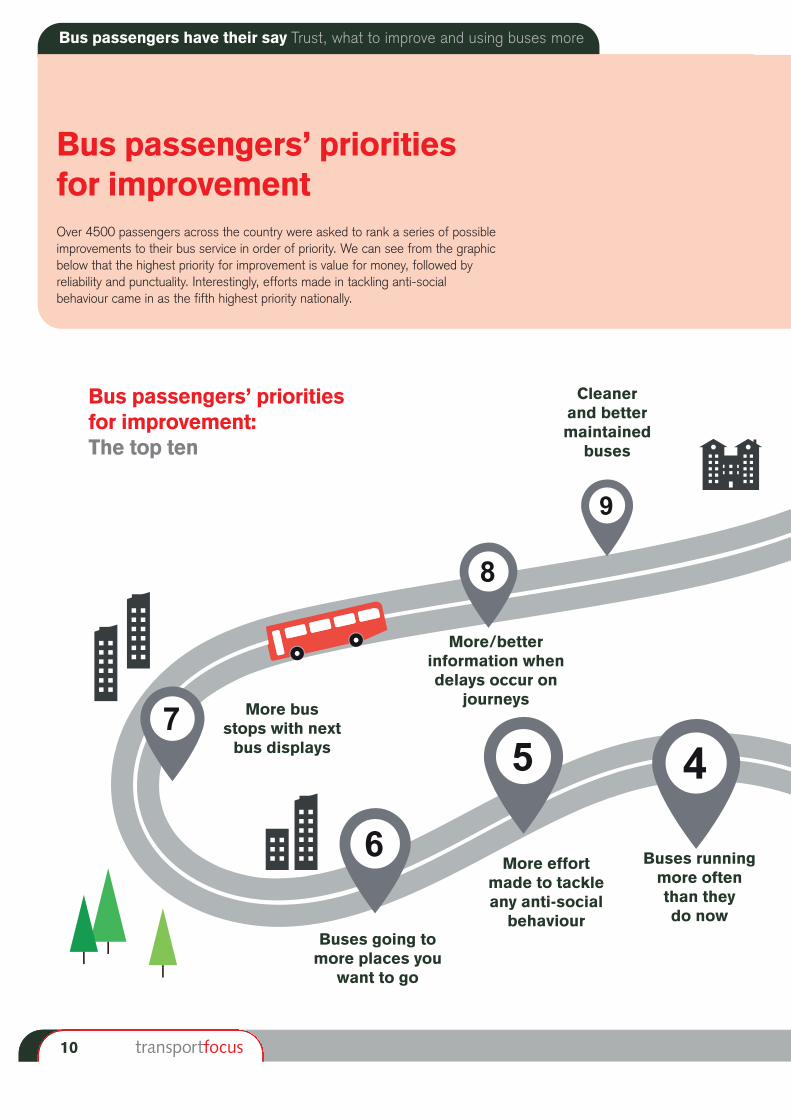
Bus passengers’ prioritiesfor improvementOver 4500 passengers across the country were asked to rank a series of possibleimprovements to their bus service in order of priority. We can see from the graphicbelow that the highest priority for improvement is value for money, followed by reliability and punctuality. Interestingly, efforts made in tackling anti-social behaviour came in as the fifth highest priority nationally.
45
6
7
8
9
Bus passengers’ priorities for improvement: The top ten
Buses runningmore often than they do now
More effort made to tackleany anti-social
behaviourBuses going to
more places youwant to go
More bus stops with nextbus displays
More/betterinformation whendelays occur on
journeys
Cleaner and bettermaintained
buses
Bus passengers have their say Trust, what to improve and using buses more
11
Top priorities for improvement – top ten priorities: all bus users
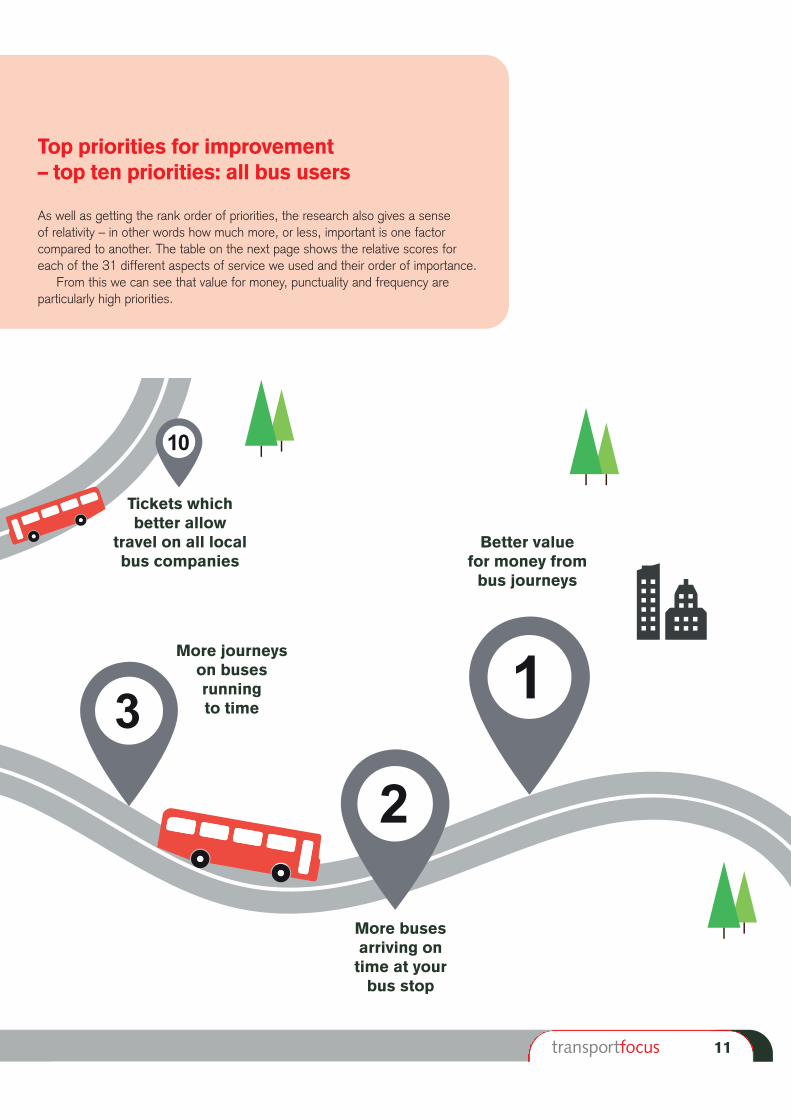
As well as getting the rank order of priorities, the research also gives a sense of relativity – in other words how much more, or less, important is one factor compared to another. The table on the next page shows the relative scores for each of the 31 different aspects of service we used and their order of importance.
From this we can see that value for money, punctuality and frequency areparticularly high priorities.
1
2
3
10
Better value for money from bus journeys
More busesarriving on time at your
bus stop
More journeys on buses running to time
Tickets whichbetter allow
travel on all localbus companies
12
Bus passenger priorities for improvement
What to improve Rank Index
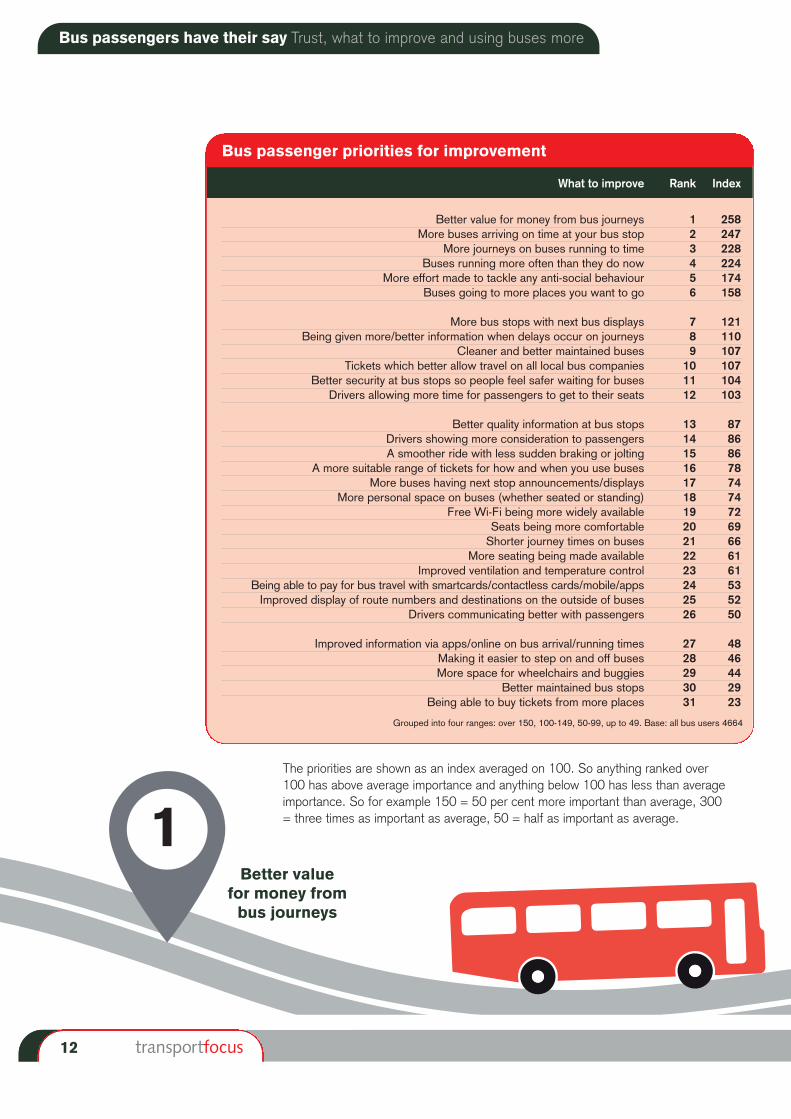
Better value for money from bus journeys 1 258More buses arriving on time at your bus stop 2 247
More journeys on buses running to time 3 228Buses running more often than they do now 4 224
More effort made to tackle any anti-social behaviour 5 174Buses going to more places you want to go 6 158
More bus stops with next bus displays 7 121Being given more/better information when delays occur on journeys 8 110
Cleaner and better maintained buses 9 107Tickets which better allow travel on all local bus companies 10 107
Better security at bus stops so people feel safer waiting for buses 11 104Drivers allowing more time for passengers to get to their seats 12 103
Better quality information at bus stops 13 87Drivers showing more consideration to passengers 14 86A smoother ride with less sudden braking or jolting 15 86
A more suitable range of tickets for how and when you use buses 16 78More buses having next stop announcements/displays 17 74
More personal space on buses (whether seated or standing) 18 74Free Wi-Fi being more widely available 19 72
Seats being more comfortable 20 69Shorter journey times on buses 21 66
More seating being made available 22 61Improved ventilation and temperature control 23 61
Being able to pay for bus travel with smartcards/contactless cards/mobile/apps 24 53Improved display of route numbers and destinations on the outside of buses 25 52
Drivers communicating better with passengers 26 50
Improved information via apps/online on bus arrival/running times 27 48Making it easier to step on and off buses 28 46More space for wheelchairs and buggies 29 44
Better maintained bus stops 30 29Being able to buy tickets from more places 31 23
Grouped into four ranges: over 150, 100-149, 50-99, up to 49. Base: all bus users 4664
The priorities are shown as an index averaged on 100. So anything ranked over 100 has above average importance and anything below 100 has less than averageimportance. So for example 150 = 50 per cent more important than average, 300 = three times as important as average, 50 = half as important as average.1
Better value for money from bus journeys
Bus passengers have their say Trust, what to improve and using buses more
13
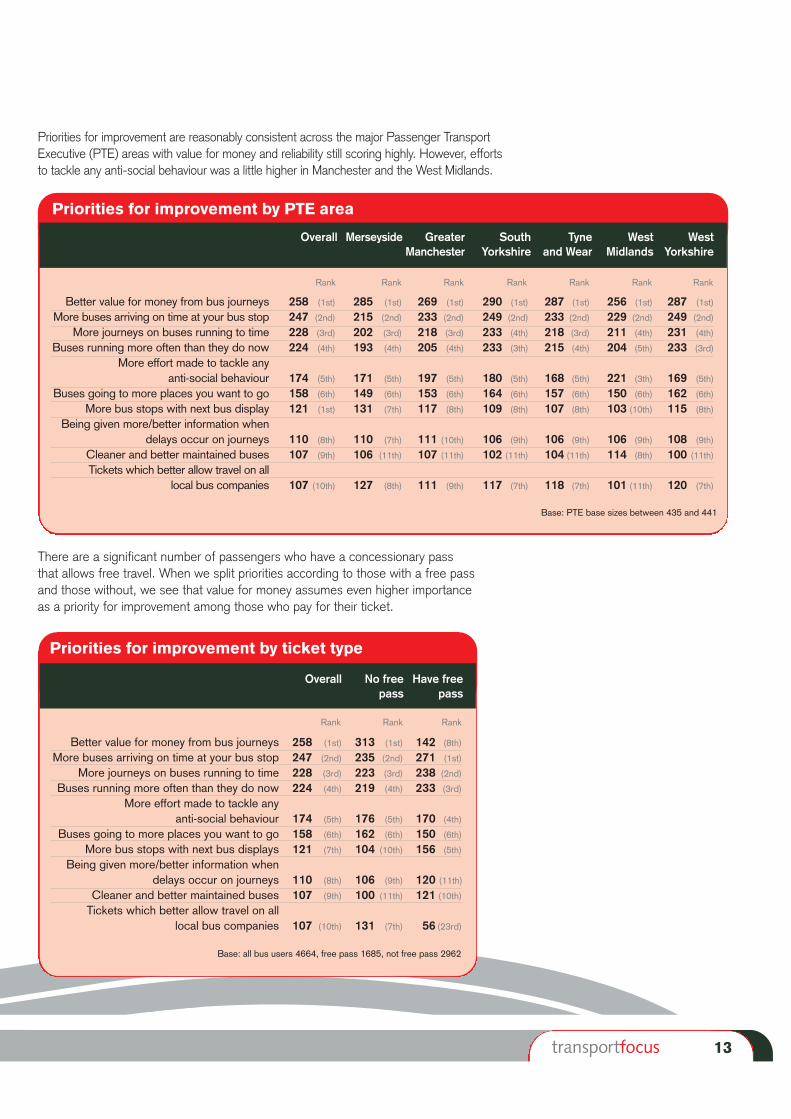
Priorities for improvement are reasonably consistent across the major Passenger TransportExecutive (PTE) areas with value for money and reliability still scoring highly. However, effortsto tackle any anti-social behaviour was a little higher in Manchester and the West Midlands.
Priorities for improvement by PTE area
Overall Merseyside Greater South Tyne West WestManchester Yorkshire and Wear Midlands Yorkshire
Better value for money from bus journeys 258 (1st) 285 (1st) 269 (1st) 290 (1st) 287 (1st) 256 (1st) 287 (1st)
More buses arriving on time at your bus stop 247 (2nd) 215 (2nd) 233 (2nd) 249 (2nd) 233 (2nd) 229 (2nd) 249 (2nd)
More journeys on buses running to time 228 (3rd) 202 (3rd) 218 (3rd) 233 (4th) 218 (3rd) 211 (4th) 231 (4th)
Buses running more often than they do now 224 (4th) 193 (4th) 205 (4th) 233 (3th) 215 (4th) 204 (5th) 233 (3rd)
More effort made to tackle any anti-social behaviour 174 (5th) 171 (5th) 197 (5th) 180 (5th) 168 (5th) 221 (3th) 169 (5th)
Buses going to more places you want to go 158 (6th) 149 (6th) 153 (6th) 164 (6th) 157 (6th) 150 (6th) 162 (6th)
More bus stops with next bus display 121 (1st) 131 (7th) 117 (8th) 109 (8th) 107 (8th) 103 (10th) 115 (8th)
Being given more/better information whendelays occur on journeys 110 (8th) 110 (7th) 111 (10th) 106 (9th) 106 (9th) 106 (9th) 108 (9th)
Cleaner and better maintained buses 107 (9th) 106 (11th) 107 (11th) 102 (11th) 104 (11th) 114 (8th) 100 (11th)
Tickets which better allow travel on all local bus companies 107 (10th) 127 (8th) 111 (9th) 117 (7th) 118 (7th) 101 (11th) 120 (7th)
Base: PTE base sizes between 435 and 441
Rank Rank Rank Rank Rank Rank Rank
There are a significant number of passengers who have a concessionary pass that allows free travel. When we split priorities according to those with a free passand those without, we see that value for money assumes even higher importance as a priority for improvement among those who pay for their ticket.
Base: all bus users 4664, free pass 1685, not free pass 2962
Priorities for improvement by ticket type
Overall No free Have free pass pass
Better value for money from bus journeys 258 (1st) 313 (1st) 142 (8th)
More buses arriving on time at your bus stop 247 (2nd) 235 (2nd) 271 (1st)
More journeys on buses running to time 228 (3rd) 223 (3rd) 238 (2nd)
Buses running more often than they do now 224 (4th) 219 (4th) 233 (3rd)
More effort made to tackle any anti-social behaviour 174 (5th) 176 (5th) 170 (4th)
Buses going to more places you want to go 158 (6th) 162 (6th) 150 (6th)
More bus stops with next bus displays 121 (7th) 104 (10th) 156 (5th)
Being given more/better information when delays occur on journeys 110 (8th) 106 (9th) 120 (11th)
Cleaner and better maintained buses 107 (9th) 100 (11th) 121 (10th)
Tickets which better allow travel on all local bus companies 107 (10th) 131 (7th) 56 (23rd)
Rank Rank Rank
14
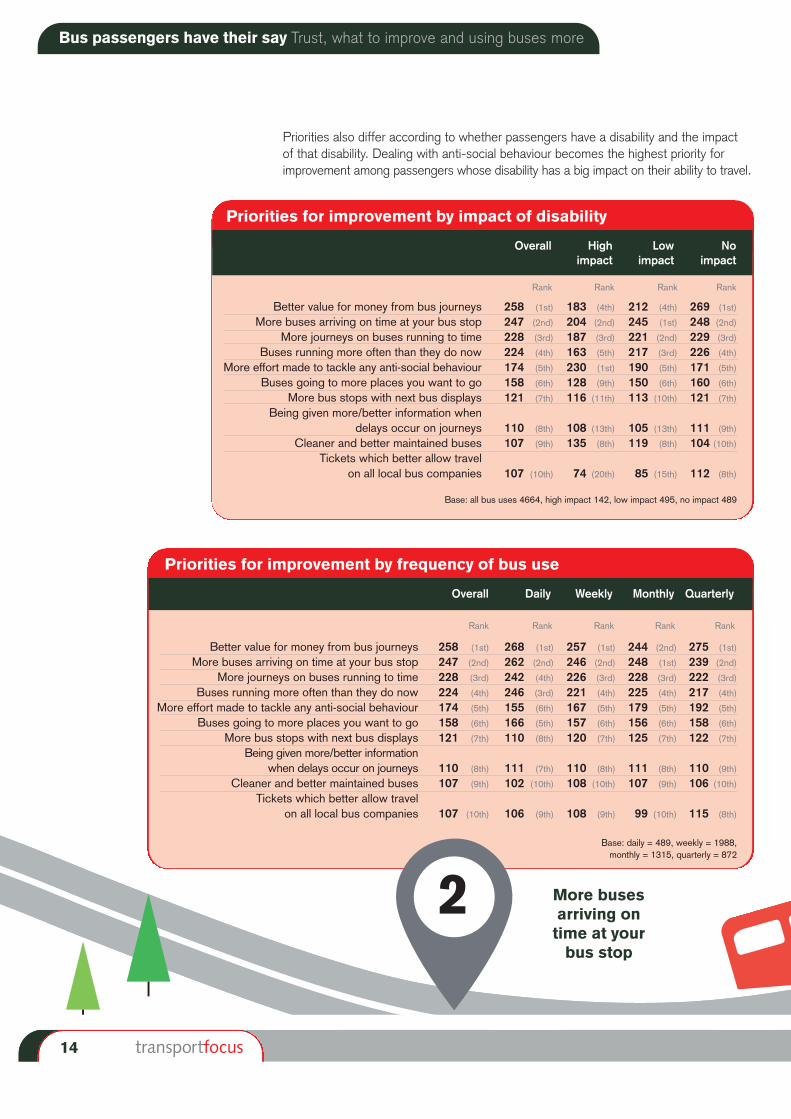
Priorities also differ according to whether passengers have a disability and the impact of that disability. Dealing with anti-social behaviour becomes the highest priority forimprovement among passengers whose disability has a big impact on their ability to travel.
Priorities for improvement by impact of disability
Overall High Low No impact impact impact
Better value for money from bus journeys 258 (1st) 183 (4th) 212 (4th) 269 (1st)
More buses arriving on time at your bus stop 247 (2nd) 204 (2nd) 245 (1st) 248 (2nd)
More journeys on buses running to time 228 (3rd) 187 (3rd) 221 (2nd) 229 (3rd)
Buses running more often than they do now 224 (4th) 163 (5th) 217 (3rd) 226 (4th)
More effort made to tackle any anti-social behaviour 174 (5th) 230 (1st) 190 (5th) 171 (5th)
Buses going to more places you want to go 158 (6th) 128 (9th) 150 (6th) 160 (6th)
More bus stops with next bus displays 121 (7th) 116 (11th) 113 (10th) 121 (7th)
Being given more/better information when delays occur on journeys 110 (8th) 108 (13th) 105 (13th) 111 (9th)
Cleaner and better maintained buses 107 (9th) 135 (8th) 119 (8th) 104 (10th)
Tickets which better allow travel on all local bus companies 107 (10th) 74 (20th) 85 (15th) 112 (8th)
Base: all bus uses 4664, high impact 142, low impact 495, no impact 489
Priorities for improvement by frequency of bus use
Overall Daily Weekly Monthly Quarterly
Better value for money from bus journeys 258 (1st) 268 (1st) 257 (1st) 244 (2nd) 275 (1st)
More buses arriving on time at your bus stop 247 (2nd) 262 (2nd) 246 (2nd) 248 (1st) 239 (2nd)
More journeys on buses running to time 228 (3rd) 242 (4th) 226 (3rd) 228 (3rd) 222 (3rd)
Buses running more often than they do now 224 (4th) 246 (3rd) 221 (4th) 225 (4th) 217 (4th)
More effort made to tackle any anti-social behaviour 174 (5th) 155 (6th) 167 (5th) 179 (5th) 192 (5th)
Buses going to more places you want to go 158 (6th) 166 (5th) 157 (6th) 156 (6th) 158 (6th)
More bus stops with next bus displays 121 (7th) 110 (8th) 120 (7th) 125 (7th) 122 (7th)
Being given more/better information when delays occur on journeys 110 (8th) 111 (7th) 110 (8th) 111 (8th) 110 (9th)
Cleaner and better maintained buses 107 (9th) 102 (10th) 108 (10th) 107 (9th) 106 (10th)
Tickets which better allow travel on all local bus companies 107 (10th) 106 (9th) 108 (9th) 99 (10th) 115 (8th)
Rank Rank Rank Rank Rank
Rank Rank Rank Rank
2 More busesarriving on time at your
bus stop
Base: daily = 489, weekly = 1988, monthly = 1315, quarterly = 872
Bus passengers have their say Trust, what to improve and using buses more
15
More journeys on buses running to time
Rank Rank Rank
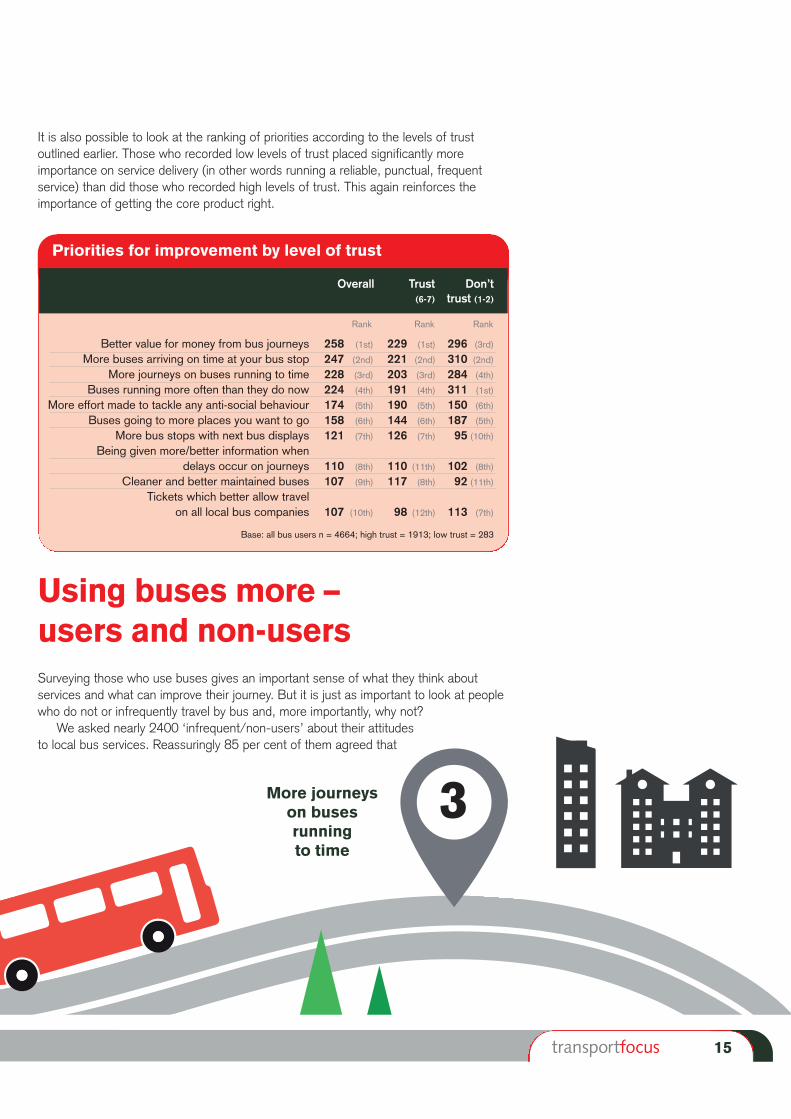
It is also possible to look at the ranking of priorities according to the levels of trustoutlined earlier. Those who recorded low levels of trust placed significantly moreimportance on service delivery (in other words running a reliable, punctual, frequentservice) than did those who recorded high levels of trust. This again reinforces theimportance of getting the core product right.
Using buses more – users and non-usersSurveying those who use buses gives an important sense of what they think aboutservices and what can improve their journey. But it is just as important to look at peoplewho do not or infrequently travel by bus and, more importantly, why not?
We asked nearly 2400 ‘infrequent/non-users’ about their attitudes to local bus services. Reassuringly 85 per cent of them agreed that
Priorities for improvement by level of trust
Overall Trust Don’t (6-7) trust (1-2)
Better value for money from bus journeys 258 (1st) 229 (1st) 296 (3rd)
More buses arriving on time at your bus stop 247 (2nd) 221 (2nd) 310 (2nd)
More journeys on buses running to time 228 (3rd) 203 (3rd) 284 (4th)
Buses running more often than they do now 224 (4th) 191 (4th) 311 (1st)
More effort made to tackle any anti-social behaviour 174 (5th) 190 (5th) 150 (6th)
Buses going to more places you want to go 158 (6th) 144 (6th) 187 (5th)
More bus stops with next bus displays 121 (7th) 126 (7th) 95 (10th)
Being given more/better information when delays occur on journeys 110 (8th) 110 (11th) 102 (8th)
Cleaner and better maintained buses 107 (9th) 117 (8th) 92 (11th)
Tickets which better allow travel on all local bus companies 107 (10th) 98 (12th) 113 (7th)
Base: all bus users n = 4664; high trust = 1913; low trust = 283
3
16
having a good bus network is important to the local area, and nearly half (45 per cent)that travelling by bus is a good way to get about. The research also helps to dispel theperception of bus travel being looked down upon – only a quarter of infrequent/non-users (26 per cent) agreed with the statement that ‘people like me do not use buses’.So the value of, and need for, bus services is acknowledged by users and infrequent/non-users alike.
This support for buses does not always translate into a willingness to actually usethem. 72 per cent of infrequent/non-users in our survey would not consider makingmore journeys by bus. However, this still leaves 28 per cent who would and, whencoupled with existing bus users who said that they wouldn’t mind making more journeys by bus (54 per cent), suggests a reasonable market for growth exists.
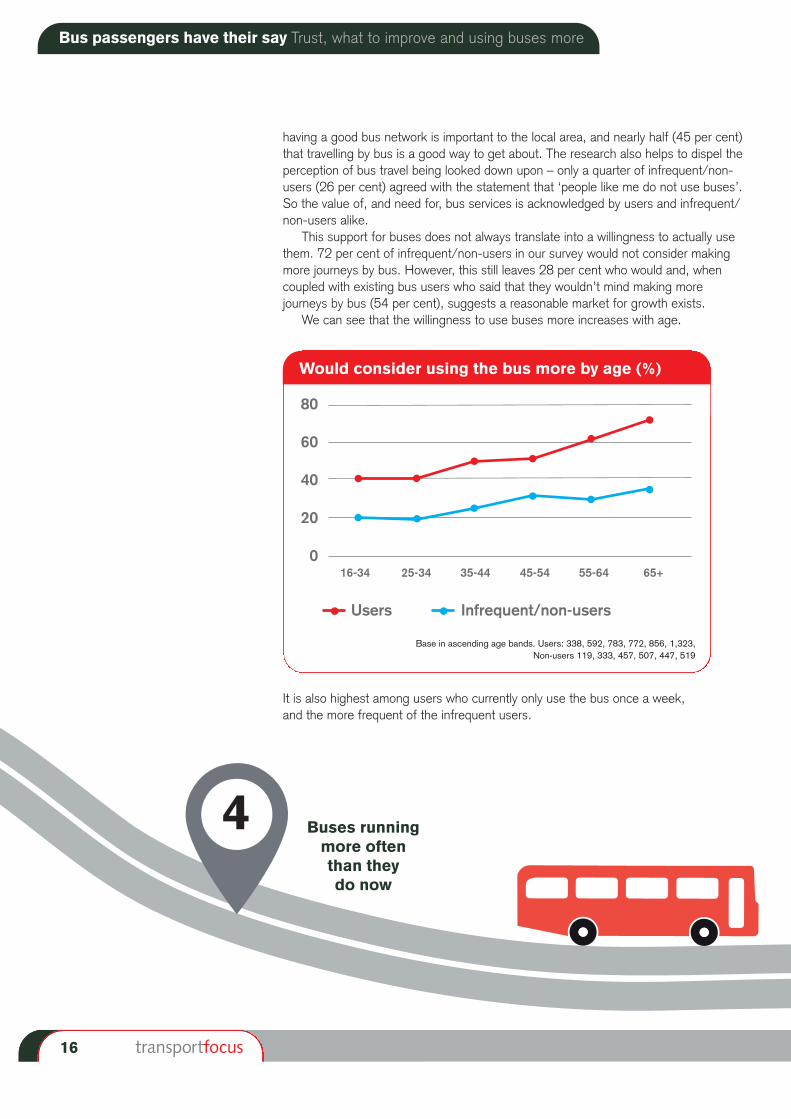
We can see that the willingness to use buses more increases with age.
Would consider using the bus more by age (%)
It is also highest among users who currently only use the bus once a week, and the more frequent of the infrequent users.
4 Buses runningmore often than they do now
Bus passengers have their say Trust, what to improve and using buses more
80
60
40
20
016-34 25-34 35-44 45-54 55-64 65+
Users Infrequent/non-users
Base in ascending age bands. Users: 338, 592, 783, 772, 856, 1,323, Non-users 119, 333, 457, 507, 447, 519
17
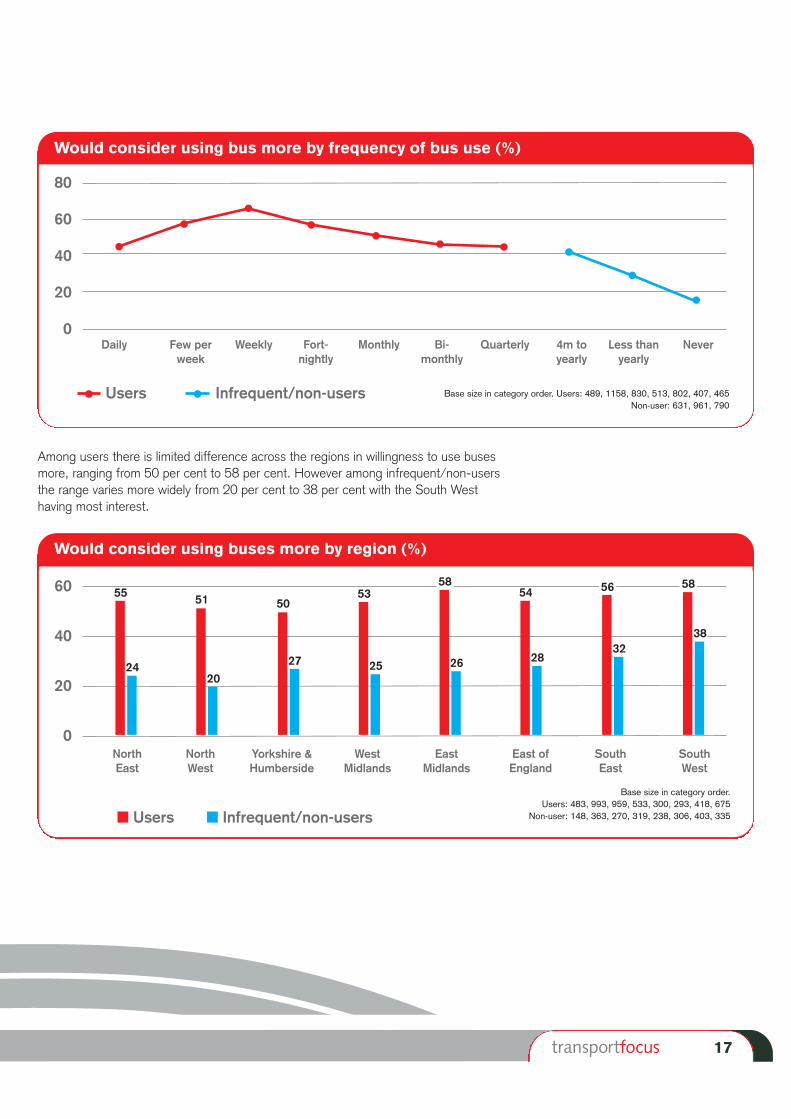
Among users there is limited difference across the regions in willingness to use busesmore, ranging from 50 per cent to 58 per cent. However among infrequent/non-usersthe range varies more widely from 20 per cent to 38 per cent with the South Westhaving most interest.
Would consider using bus more by frequency of bus use (%)
Would consider using buses more by region (%)
Base size in category order. Users: 483, 993, 959, 533, 300, 293, 418, 675
Non-user: 148, 363, 270, 319, 238, 306, 403, 335
60
40
20
0North North Yorkshire & West East East of South South East West Humberside Midlands Midlands England East West
� Users � Infrequent/non-users
80
60
40
20
0Daily Few per Weekly Fort- Monthly Bi- Quarterly 4m to Less than Never
week nightly monthly yearly yearly
Users Infrequent/non-users Base size in category order. Users: 489, 1158, 830, 513, 802, 407, 465 Non-user: 631, 961, 790
55
24
51
20
50
27
53
25
58
26
54
28
56
32
58
38
18
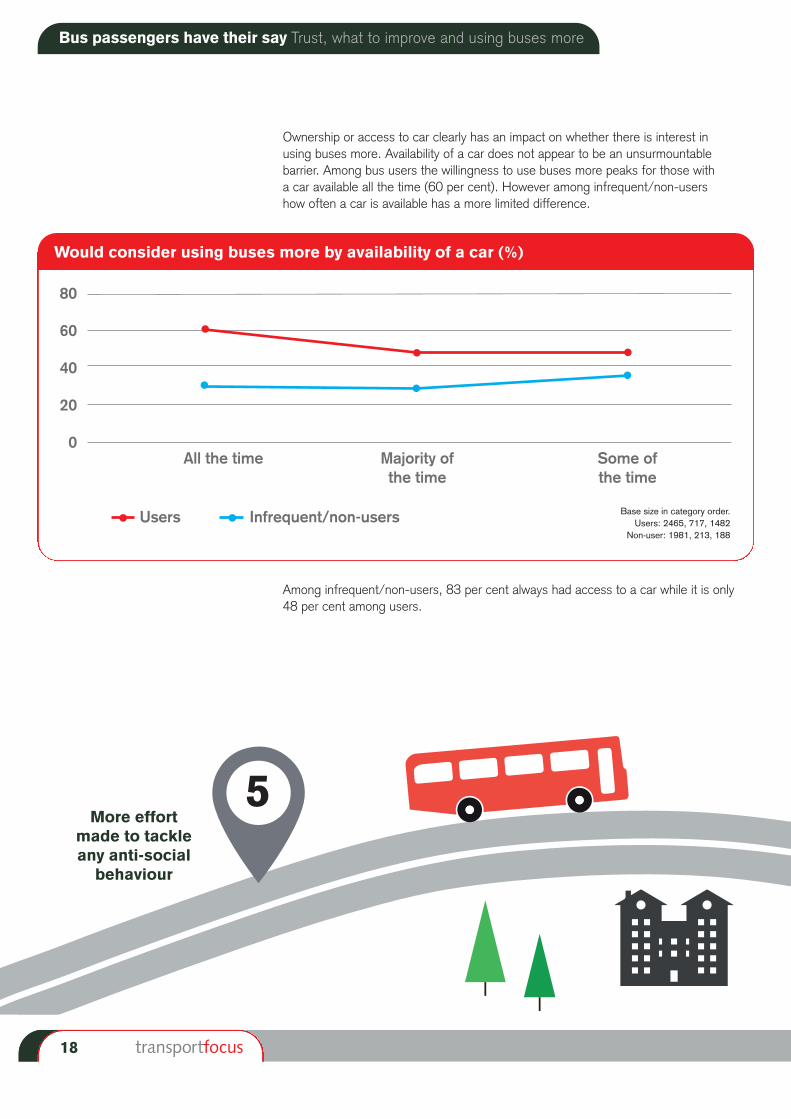
Ownership or access to car clearly has an impact on whether there is interest in using buses more. Availability of a car does not appear to be an unsurmountable barrier. Among bus users the willingness to use buses more peaks for those with a car available all the time (60 per cent). However among infrequent/non-users how often a car is available has a more limited difference.
Among infrequent/non-users, 83 per cent always had access to a car while it is only 48 per cent among users.
Would consider using buses more by availability of a car (%)
5More effort
made to tackleany anti-social
behaviour
Base size in category order. Users: 2465, 717, 1482
Non-user: 1981, 213, 188
80
60
40
20
0All the time Majority of Some of
the time the time
Users Infrequent/non-users
Bus passengers have their say Trust, what to improve and using buses more
19
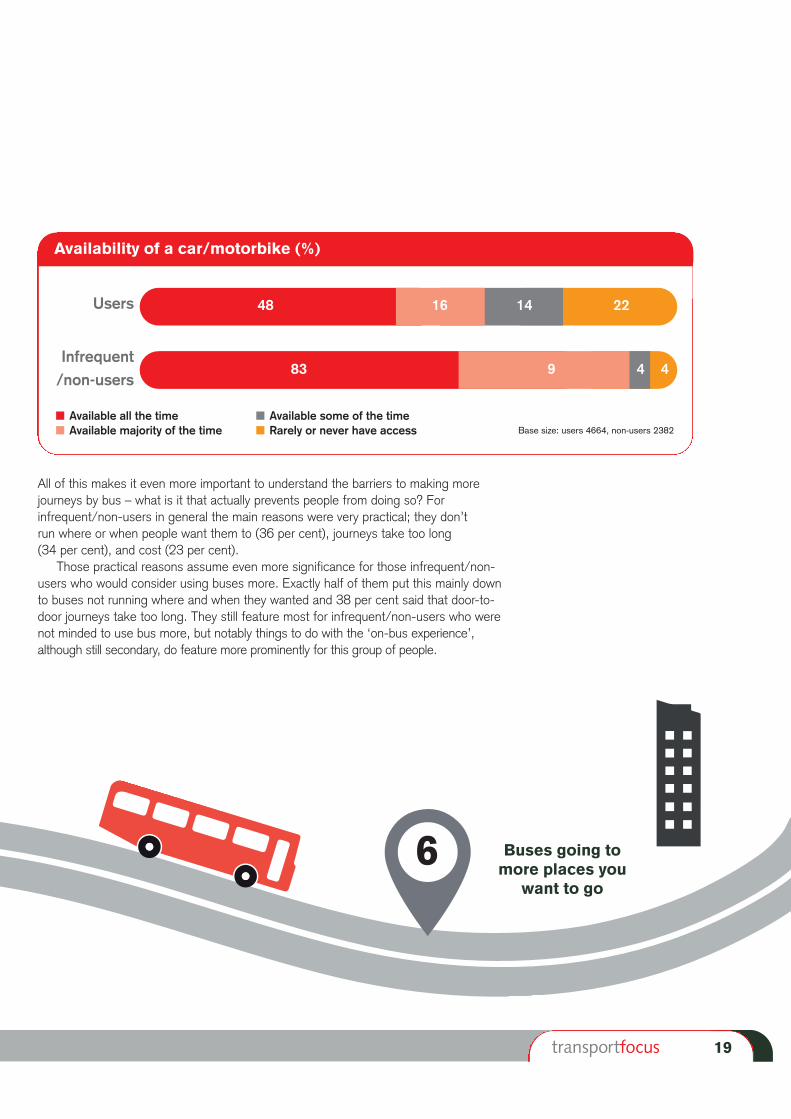
All of this makes it even more important to understand the barriers to making morejourneys by bus – what is it that actually prevents people from doing so? Forinfrequent/non-users in general the main reasons were very practical; they don’t run where or when people want them to (36 per cent), journeys take too long (34 per cent), and cost (23 per cent).
Those practical reasons assume even more significance for those infrequent/non-users who would consider using buses more. Exactly half of them put this mainly downto buses not running where and when they wanted and 38 per cent said that door-to-door journeys take too long. They still feature most for infrequent/non-users who werenot minded to use bus more, but notably things to do with the ‘on-bus experience’,although still secondary, do feature more prominently for this group of people.
Availability of a car/motorbike (%)
6 Buses going tomore places you
want to go
Users
Infrequent/non-users
� Available all the time� Available majority of the time Base size: users 4664, non-users 2382
48 16 14 22
83 9 4 4
� Available some of the time� Rarely or never have access
20
So what does all this mean and what needs to happen?This research sets out what bus passengers want to see improved and how they would like to be treated. This sends a very clear message to bus companies and local authorities when determining local services. It is also highly relevant to theGovernment as it develops its Buses Bill – it is essential that passengers’ needs are at the heart of this legislation.
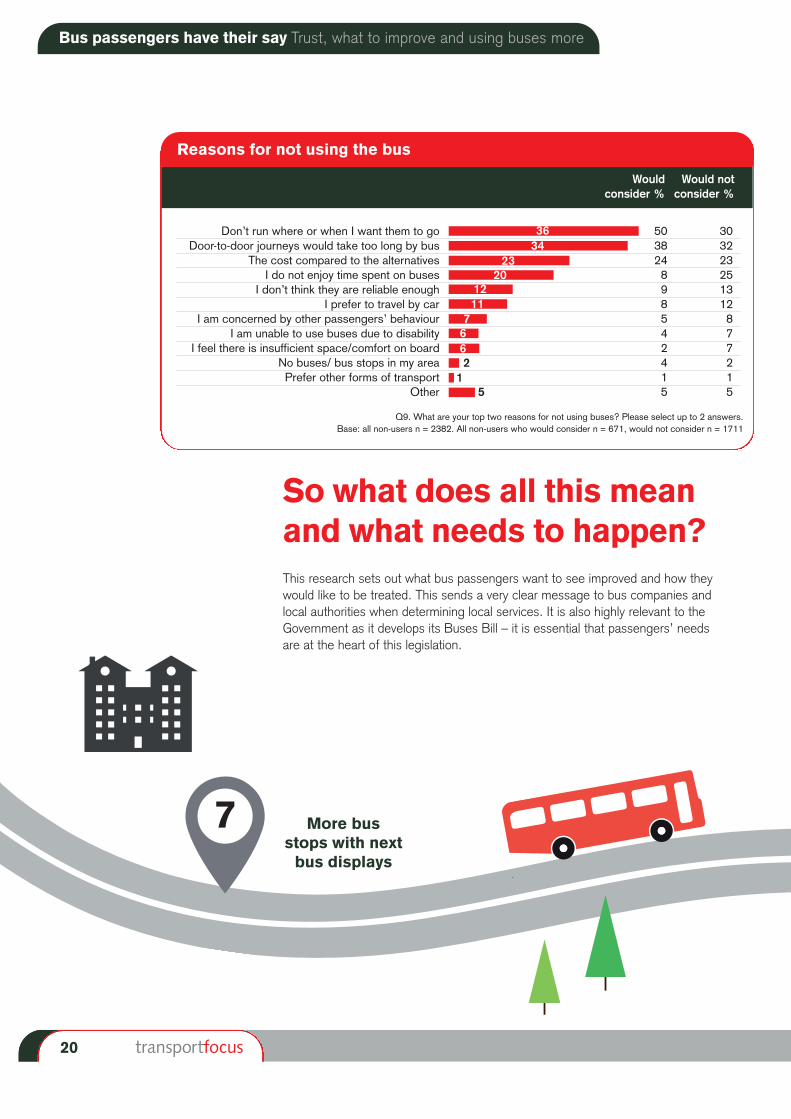
Reasons for not using the bus
Would Would notconsider % consider %
Don’t run where or when I want them to go 50 30Door-to-door journeys would take too long by bus 38 32
The cost compared to the alternatives 24 23I do not enjoy time spent on buses 8 25
I don’t think they are reliable enough 9 13I prefer to travel by car 8 12
I am concerned by other passengers’ behaviour 5 8I am unable to use buses due to disability 4 7
I feel there is insufficient space/comfort on board 2 7No buses/ bus stops in my area 4 2Prefer other forms of transport 1 1
Other 5 5
3634
2320
1211
7662
15
Q9. What are your top two reasons for not using buses? Please select up to 2 answers.Base: all non-users n = 2382. All non-users who would consider n = 671, would not consider n = 1711
7 More bus stops with nextbus displays
Bus passengers have their say Trust, what to improve and using buses more
21
We have four key recommendations:
1 Deliver the essentials, and do soconsistently and professionally
Performance (frequency, reliability and punctuality) is a core requirement.This research shows that it is a high priority for improvement in its own right but is also the bedrock of trust. Passengers trust bus services when there is consistency indelivering the essentials; inconsistent service delivery adversely impacts trust ratings.
Our previous research (What’s the holdup? Exploring bus service punctuality,December 20145) looked at when, where and why buses are delayed and what can be done to help them run on time. It identified systemic reasons for lateness (adversetraffic patterns, unhelpful parking, unrealistic timetables, driver-changeover times being too tight to be reliable) and variable issues (coping with driver absences,scheduling road works, coping with vehicles going out of service).
We believe there is real benefit in bus operators listening to passengers and, in particular, to drivers, to help identify specific causes of delay. We also want to see better and more consistent use of performance data to identify problem areas.
Value for money is the highest priority for improvement. Cost is also somethingthat represents a barrier to use for infrequent/non-users. This is also something that we have looked at in previous research (Bus passenger views on value for money, October 2013).
While better performance will naturally improve perceptions of value for money we found that much more could be done to improve passengers’ awareness of fares.Passengers didn’t realise what ticket types existed, how they could buy them or wherethey could find out the information they needed. They relied mainly on word of mouthand the bus driver for information and risked missing out on the best deal. It also begsthe question of how much business is lost because potential passengers simply don’tknow how to use the bus or because people can’t find the ideal ticket for their needs.
Our research also shows that smart ticketing can be an enabler of trust. The abilityto cap fares helps passengers trust that they have been sold the correct, best-value fare available. It also provides a mechanism on which to bolt some form of loyaltyscheme that recognises and rewards passengers for travelling.
5 What’s the holdup? Exploring bus service punctuality, December 2014:http://www.transportfocus.org.uk/research/publications/whats-the-holdup-exploring-bus-service-punctuality
8More/better
information whendelays occur on
journeys
22
Tackling anti-social behaviour was the fifth highest priority for improvement overall,and even higher among those with a disability. It is also something that features in ourBus Passenger Survey which measures satisfaction with bus journeys. This is a complexissue and something that is a wider social issue rather than just a ‘bus problem’.
Our initial analysis shows that staff (including drivers) and technology can helpprovide reassurance but it is something that we hope to investigate further in thecoming year.
2 Treat me like a customer
Passengers want providers to be more ‘open to a conversation’. It means not beingkept in the dark when services don’t run to plan (on-bus or before boarding). They want operators to listen to their experiences, they want someone to be accessible for general queries, and they want to know who to complain to. Our research showsthat this is a key part to building a good relationship with customers.
Our research (Bus passengers’ experience of delays and disruption, April 20136)showed that technology was part of the solution. For example fitting public addresssystems on buses, providing live bus information or even live-chat facilities forpassengers to ask questions in the moment.
But it also showed that there is a cultural issue; for example recognising that thereare real benefits to the business from engaging with customers. In particular this meansmaking it much clearer and easier to contact the company, either to ask a question or to make a formal complaint, and then to handle that complaint well.
9Cleaner
and bettermaintained
buses
Bus passengers have their say Trust, what to improve and using buses more
23
3 Unlock the potential of the driver
Drivers are the face of the bus company. Our research (Bus driver training – Whatworks? What next?, July 20157) describes how drivers were seen by passengers as the chief source of information on delays and disruption, as well as the main source of information on the range and price of tickets available. In short, they do much morethan just drive the bus.
This new research confirms this feeling. Passengers value drivers who areconsiderate to passengers and who care about the way they drive. Drivers are alsoseen as having the potential to provide ‘magic moments’ – examples of great customerservice that passengers notice and which can change attitudes. All of which means that driver recruitment, training and retention assumes even more significance.
4 Boosting demand
This research suggests that there is potential to gain extra business by encouragingoccasional users to travel more often by bus. The report also identifies the barriers tothis – the need for more buses to more places at the time that passengers want to travel.
We do not underestimate the difficulties in doing this – such services have to bepaid for and commercial operators will need to demonstrate a business case, while localauthority budgets are also stretched. Nonetheless it is something that bus companiesand local authorities must bear in mind when reviewing services.
Tickets whichbetter allow
travel on all localbus companies
10
6 Bus passengers’ experience of delays and disruption, April 2013:http://www.transportfocus.org.uk/research/publications/bus-passengers-experience-of-delays-and-disruption-research-report-april-20137 Bus driver training – What works? What next? July 2015:http://www.transportfocus.org.uk/research/publications/bus-driver-training-what-works-what-next
Contact Transport Focus
Any enquiries regarding this research should be addressed to:
Murray LeaderSenior Insight AdvisorTransport Focust 0300 123 0843e [email protected] www.transportfocus.org.uk
Fleetbank House 2-6 Salisbury Square London EC4Y 8JX
Transport Focus is the operatingname of the Passengers’ Council
Published in March 2016© 2016 Transport Focus
Design and Print by TU ink www.tuink.co.uk


![Bus Services Bill - publications.parliament.uk · BUS SERVICES BILL [HL] EXPLANATORY ... facilities, measures and standards ... bus passengers, making it easier for them to access](https://img.pdfslide.net/doc/110x75/5b3e63277f8b9a9a098c71b0/bus-services-bill-bus-services-bill-hl-explanatory-facilities-measures.jpg)