Embed Size (px)
Citation preview
UNIVERSITY OF CALIFORNIA
Bus Rapid Transit (BRT): An Efficient and Competitive Mode of Public Transport
Working Paper 2013-01
Robert CerveroAugust 2013
0
Report prepared for European Automobile
Manufacturers Association
1
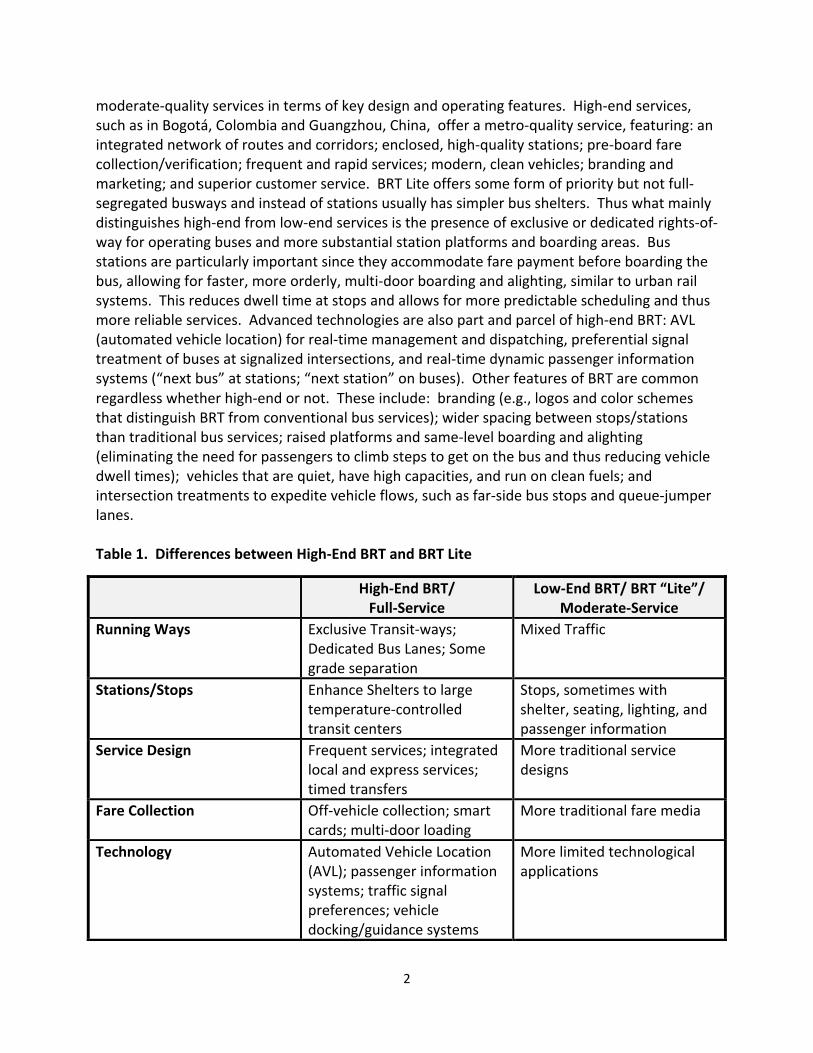
1. Introduction: Rationale and Main Objectives Bus Rapid Transit (BRT) systems have gained popularity worldwide as a cost-‐effective alternative to far more expensive urban rail investments. High-‐quality bus-‐based systems also better serve the low-‐density settlement patterns of many suburban markets and small-‐to-‐medium size cities due to the inherent flexibility advantages of rubber-‐tire systems – the same vehicle that provides speedy line-‐haul services on a dedicated bus lane or busway can morph into a feeder vehicle, collecting and distributing customers on local streets. This report reviews experiences with designing and implementing BRT systems worldwide. BRT is first defined across a spectrum of service qualities and costs. Global trends are next reviewed, highlighting cities and regions of the world with the most extensive and advanced systems. Relationships between urban densities and BRT cost-‐effectiveness are noted. System designs and operations – in terms of running ways, rolling stock, route configurations, stations, fare collections, and the like – are then reviewed. This is followed by a comparison of BRT’s cost and performance relative to urban rail transit systems. Information on the cost-‐effectiveness of heavy-‐rail, light-‐rail, and BRT systems relative to urban densities are also compared. The report then turns to efforts among a handful to cities to proactively promote transit oriented development (TOD) near BRT stations and along corridors. This is followed by discussions on the institutional arrangements that have been introduced to effectively manage BRT services. The report closes with discussions on BRT’s likely future given global growth projections and other pressing policy agendas in the foreseeable future. 2. BRT: A Suite of High-‐Quality, Bus-‐Based Mobility Options Dozens of definitions can be found on BRT however they all frame BRT as a bus-‐based system that mimics the high-‐capacity, high-‐performance characteristics of urban rail systems at a much lower price. Curitiba, Brazil is credited with pioneering BRT and its mayor at the time, Jaime Lerner, referred to the city’s BRT system as a “surface metro” – a high-‐quality bus service with similar performance of a subway but at a fraction of the cost (Cervero, 1998). In terms of service quality and costs, then, BRT is often thought of as occupying the middle ground between urban rail and traditional bus systems. In ways, it offers the best of both worlds: the speed and reliability of rail and the operating flexibility and lower cost of a conventional bus (Deng and Nelson, 2011). New York-‐based Institute of Transportation & Development Policy (ITDP), which has emerged as one of the technology’s strongest proponents, defines BRT as “a high-‐quality bus-‐based transit system that delivers fast, comfortable and cost-‐effective urban mobility through the provision of segregated right-‐of-‐way infrastructure, rapid and frequent operations, and excellence in marketing and customer service” (Wright and Hook, 2007). It is the element of a separate right-‐of-‐way that distinguishes “high-‐end” BRT from lower quality services, which some have called “BRT Lite”. Table 1 distinguishes high-‐end, full-‐service BRT from low-‐end to
2
moderate-‐quality services in terms of key design and operating features. High-‐end services, such as in Bogotá, Colombia and Guangzhou, China, offer a metro-‐quality service, featuring: an integrated network of routes and corridors; enclosed, high-‐quality stations; pre-‐board fare collection/verification; frequent and rapid services; modern, clean vehicles; branding and marketing; and superior customer service. BRT Lite offers some form of priority but not full-‐segregated busways and instead of stations usually has simpler bus shelters. Thus what mainly distinguishes high-‐end from low-‐end services is the presence of exclusive or dedicated rights-‐of-‐way for operating buses and more substantial station platforms and boarding areas. Bus stations are particularly important since they accommodate fare payment before boarding the bus, allowing for faster, more orderly, multi-‐door boarding and alighting, similar to urban rail systems. This reduces dwell time at stops and allows for more predictable scheduling and thus more reliable services. Advanced technologies are also part and parcel of high-‐end BRT: AVL (automated vehicle location) for real-‐time management and dispatching, preferential signal treatment of buses at signalized intersections, and real-‐time dynamic passenger information systems (“next bus” at stations; “next station” on buses). Other features of BRT are common regardless whether high-‐end or not. These include: branding (e.g., logos and color schemes that distinguish BRT from conventional bus services); wider spacing between stops/stations than traditional bus services; raised platforms and same-‐level boarding and alighting (eliminating the need for passengers to climb steps to get on the bus and thus reducing vehicle dwell times); vehicles that are quiet, have high capacities, and run on clean fuels; and intersection treatments to expedite vehicle flows, such as far-‐side bus stops and queue-‐jumper lanes. Table 1. Differences between High-‐End BRT and BRT Lite
High-‐End BRT/ Full-‐Service
Low-‐End BRT/ BRT “Lite”/ Moderate-‐Service
Running Ways Exclusive Transit-‐ways; Dedicated Bus Lanes; Some grade separation
Mixed Traffic
Stations/Stops Enhance Shelters to large temperature-‐controlled transit centers
Stops, sometimes with shelter, seating, lighting, and passenger information
Service Design Frequent services; integrated local and express services; timed transfers
More traditional service designs
Fare Collection Off-‐vehicle collection; smart cards; multi-‐door loading
More traditional fare media
Technology Automated Vehicle Location (AVL); passenger information systems; traffic signal preferences; vehicle docking/guidance systems
More limited technological applications
3
For BRT to truly represent a mode that is time-‐competitive with urban rail systems and private automobiles, exclusive, dedicated right-‐of-‐way is an essential feature. A new terminology has been introduced in recent years, adopting the Olympic medals of Gold, Silver, and Bronze, to rate BRT in terms of service quality. In The BRT Standard 2013, a collection of pro-‐BRT organizations led by ITDP, five essential elements needed to “keep the ‘R’ in Bus Rapid Transit” and thus achieve a Gold Standard are:
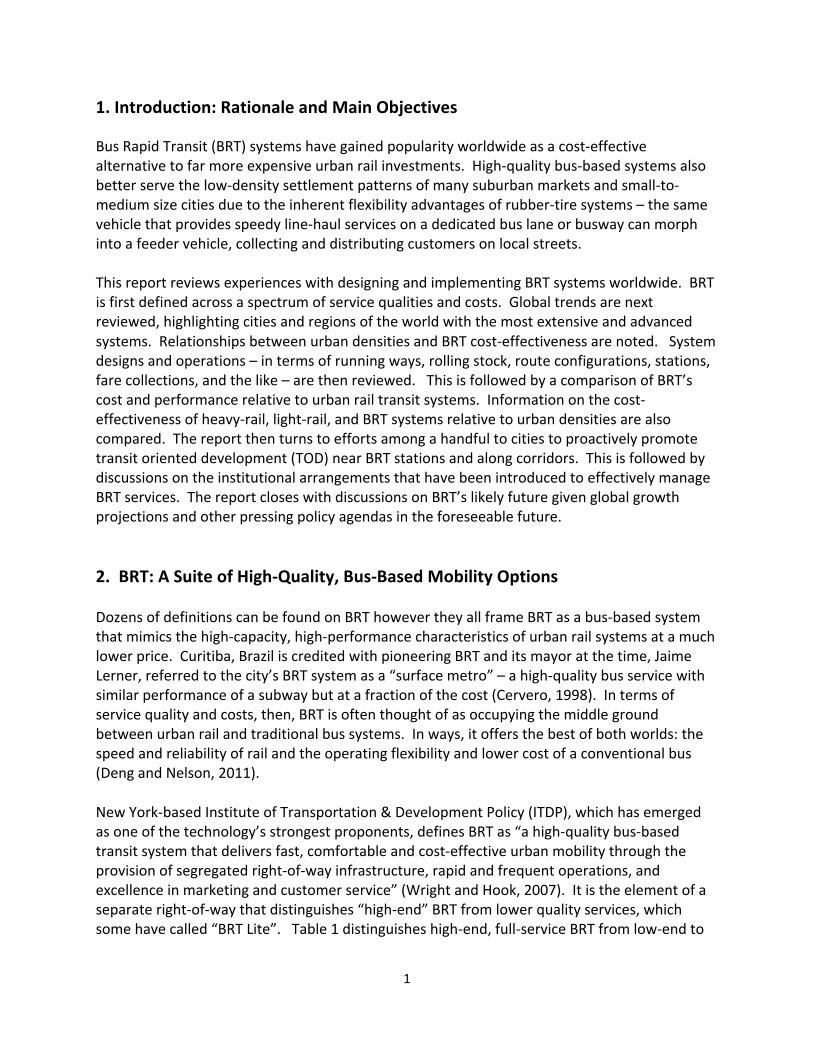
• Busway alignment: median-‐location of a busway or bus-‐only corridor that minimizes conflicts with turning vehicles, delivery vehicles, and other potential obstructions (Figure 1);
• Dedicated right-‐of-‐way: physical segregation and full enforcement; • Off-‐board fare collection: barrier-‐controlled turnstiles that verify off-‐board ticket
payment; • Intersection treatments: turn prohibitions across busway and sign priorities; and • Platform-‐level boarding: elimination of steps and shrinkage of gaps between vehicles
and platforms through bus guidance, raised platforms, and boarding bridges.
Lower-‐quality BRT exists where elements deviate from this (according these services Silver or Bronze standards), such as the use of delineators or colorized pavement in lieu of physical separators along the dedicated right-‐of-‐way or barrier-‐free, proof-‐of-‐payment schemes instead of turnstile controls with verified ticketing for passenger entry. The three BRT systems that have been awarded the Gold Standard – Bogotá, Guangzhou, and Lima, Peru – to date have also added elements that safeguard or improve the speed, reliability, and comfort of services. These include full-‐service control centers that GPS-‐monitor bus locations (to respond to incidents, avoid bunching, and recording demand patterns for future service adjustments) and passing lanes at stations. 2. Global Trends To date, more than 150 cities have implemented some form of BRT system worldwide, carrying around estimated 28 million passengers each weekeday. At present, BRT systems worldwide comprised 280 corridors, 4,300km of routes, 6,700 stations, and 30,000 buses (BRTDATA.ORG). BRT systems are currently being added at a geometric rate, gaining particular favor in the developing world, following on the heels of widely publicized BRT successes in Curitiba, Bogotá, Mexico City, Istanbul, Ahmedabad, and Guangzhou. These developing cities show that high-‐performance BRT systems that yield appreciable mobility and environmental benefits can be built at an affordable price. Metrorail systems, studies show, can cost 10 times as much a BRT system of similar length (Suzuki et al., 2013). Light Rail Transit (LRT) can be more than four times as expensive. Besides cost-‐savings, highly congested mega-‐cities of the world, like
4
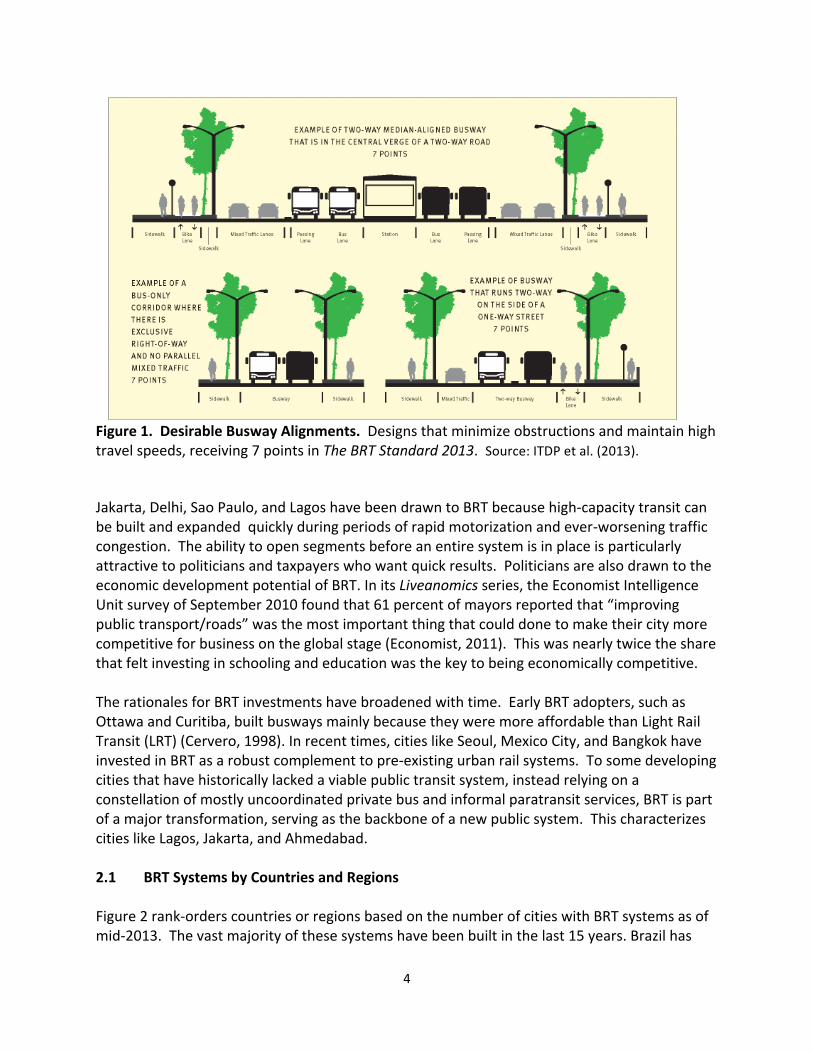
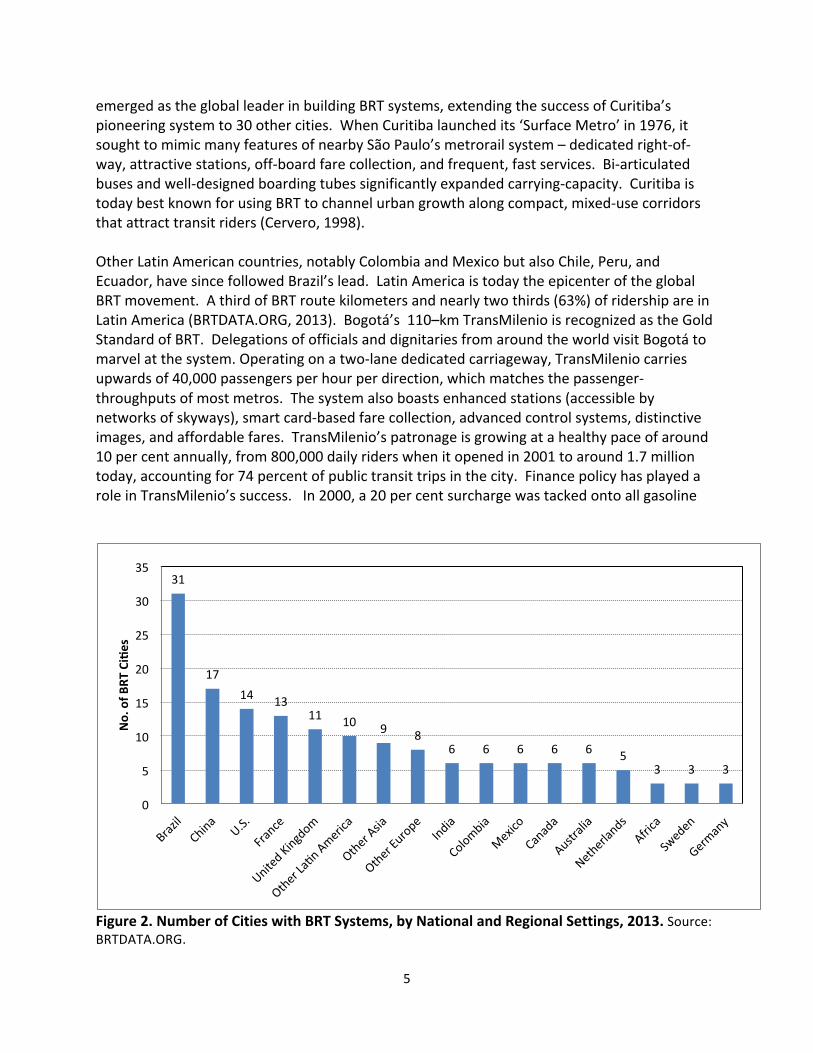
Figure 1. Desirable Busway Alignments. Designs that minimize obstructions and maintain high travel speeds, receiving 7 points in The BRT Standard 2013. Source: ITDP et al. (2013). Jakarta, Delhi, Sao Paulo, and Lagos have been drawn to BRT because high-‐capacity transit can be built and expanded quickly during periods of rapid motorization and ever-‐worsening traffic congestion. The ability to open segments before an entire system is in place is particularly attractive to politicians and taxpayers who want quick results. Politicians are also drawn to the economic development potential of BRT. In its Liveanomics series, the Economist Intelligence Unit survey of September 2010 found that 61 percent of mayors reported that “improving public transport/roads” was the most important thing that could done to make their city more competitive for business on the global stage (Economist, 2011). This was nearly twice the share that felt investing in schooling and education was the key to being economically competitive. The rationales for BRT investments have broadened with time. Early BRT adopters, such as Ottawa and Curitiba, built busways mainly because they were more affordable than Light Rail Transit (LRT) (Cervero, 1998). In recent times, cities like Seoul, Mexico City, and Bangkok have invested in BRT as a robust complement to pre-‐existing urban rail systems. To some developing cities that have historically lacked a viable public transit system, instead relying on a constellation of mostly uncoordinated private bus and informal paratransit services, BRT is part of a major transformation, serving as the backbone of a new public system. This characterizes cities like Lagos, Jakarta, and Ahmedabad. 2.1 BRT Systems by Countries and Regions Figure 2 rank-‐orders countries or regions based on the number of cities with BRT systems as of mid-‐2013. The vast majority of these systems have been built in the last 15 years. Brazil has
5
emerged as the global leader in building BRT systems, extending the success of Curitiba’s pioneering system to 30 other cities. When Curitiba launched its ‘Surface Metro’ in 1976, it sought to mimic many features of nearby São Paulo’s metrorail system – dedicated right-‐of-‐way, attractive stations, off-‐board fare collection, and frequent, fast services. Bi-‐articulated buses and well-‐designed boarding tubes significantly expanded carrying-‐capacity. Curitiba is today best known for using BRT to channel urban growth along compact, mixed-‐use corridors that attract transit riders (Cervero, 1998). Other Latin American countries, notably Colombia and Mexico but also Chile, Peru, and Ecuador, have since followed Brazil’s lead. Latin America is today the epicenter of the global BRT movement. A third of BRT route kilometers and nearly two thirds (63%) of ridership are in Latin America (BRTDATA.ORG, 2013). Bogotá’s 110–km TransMilenio is recognized as the Gold Standard of BRT. Delegations of officials and dignitaries from around the world visit Bogotá to marvel at the system. Operating on a two-‐lane dedicated carriageway, TransMilenio carries upwards of 40,000 passengers per hour per direction, which matches the passenger-‐throughputs of most metros. The system also boasts enhanced stations (accessible by networks of skyways), smart card-‐based fare collection, advanced control systems, distinctive images, and affordable fares. TransMilenio’s patronage is growing at a healthy pace of around 10 per cent annually, from 800,000 daily riders when it opened in 2001 to around 1.7 million today, accounting for 74 percent of public transit trips in the city. Finance policy has played a role in TransMilenio’s success. In 2000, a 20 per cent surcharge was tacked onto all gasoline
Figure 2. Number of Cities with BRT Systems, by National and Regional Settings, 2013. Source: BRTDATA.ORG.
31
17 14 13
11 10 9 8 6 6 6 6 6 5
3 3 3
0
5
10
15
20
25
30
35
No. of B
RT CiUes
6
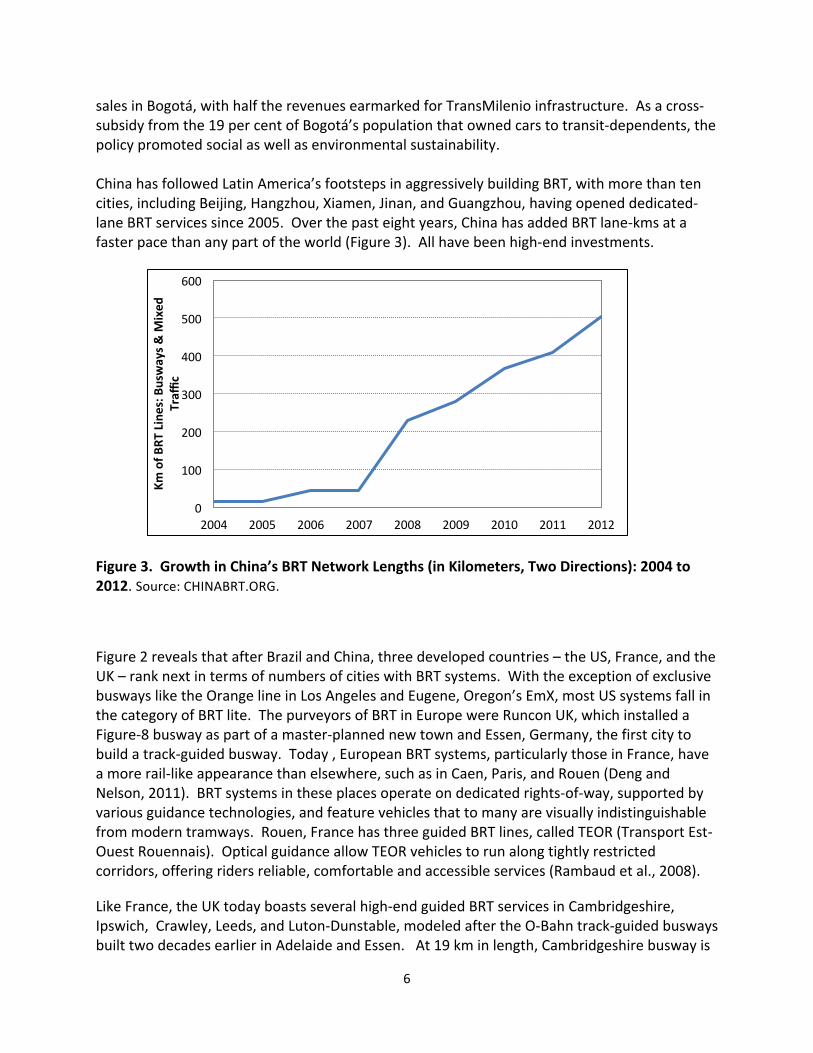
sales in Bogotá, with half the revenues earmarked for TransMilenio infrastructure. As a cross-‐subsidy from the 19 per cent of Bogotá’s population that owned cars to transit-‐dependents, the policy promoted social as well as environmental sustainability. China has followed Latin America’s footsteps in aggressively building BRT, with more than ten cities, including Beijing, Hangzhou, Xiamen, Jinan, and Guangzhou, having opened dedicated-‐lane BRT services since 2005. Over the past eight years, China has added BRT lane-‐kms at a faster pace than any part of the world (Figure 3). All have been high-‐end investments.
Figure 3. Growth in China’s BRT Network Lengths (in Kilometers, Two Directions): 2004 to 2012. Source: CHINABRT.ORG.
Figure 2 reveals that after Brazil and China, three developed countries – the US, France, and the UK – rank next in terms of numbers of cities with BRT systems. With the exception of exclusive busways like the Orange line in Los Angeles and Eugene, Oregon’s EmX, most US systems fall in the category of BRT lite. The purveyors of BRT in Europe were Runcon UK, which installed a Figure-‐8 busway as part of a master-‐planned new town and Essen, Germany, the first city to build a track-‐guided busway. Today , European BRT systems, particularly those in France, have a more rail-‐like appearance than elsewhere, such as in Caen, Paris, and Rouen (Deng and Nelson, 2011). BRT systems in these places operate on dedicated rights-‐of-‐way, supported by various guidance technologies, and feature vehicles that to many are visually indistinguishable from modern tramways. Rouen, France has three guided BRT lines, called TEOR (Transport Est-‐Ouest Rouennais). Optical guidance allow TEOR vehicles to run along tightly restricted corridors, offering riders reliable, comfortable and accessible services (Rambaud et al., 2008).
Like France, the UK today boasts several high-‐end guided BRT services in Cambridgeshire, Ipswich, Crawley, Leeds, and Luton-‐Dunstable, modeled after the O-‐Bahn track-‐guided busways built two decades earlier in Adelaide and Essen. At 19 km in length, Cambridgeshire busway is
0
100
200
300
400
500
600
2004 2005 2006 2007 2008 2009 2010 2011 2012
Km of B
RT Lines: B
usways &
Mixed
Traffi
c
7
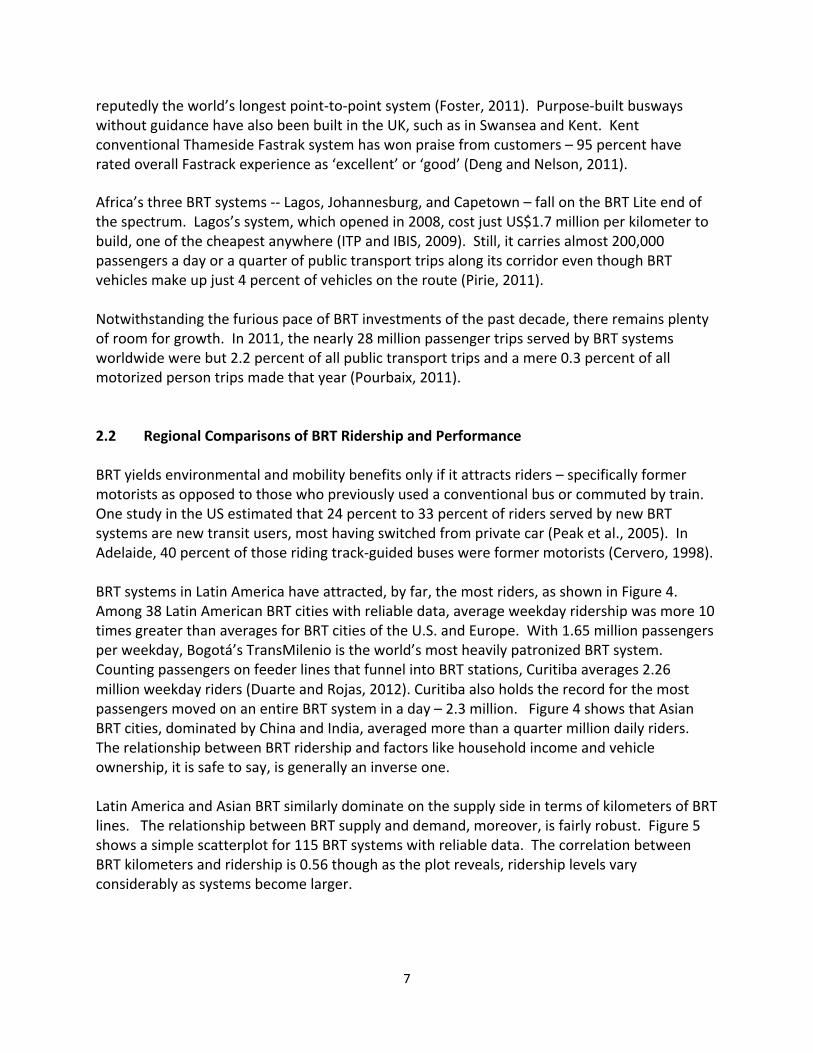
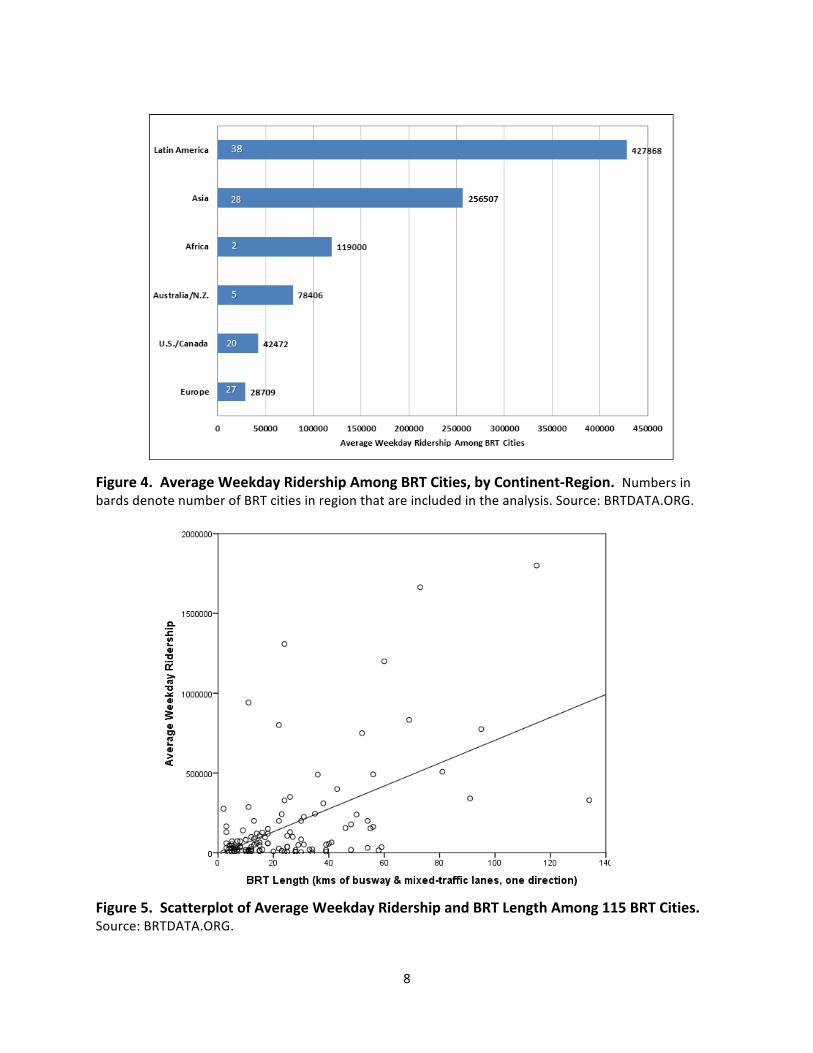
reputedly the world’s longest point-‐to-‐point system (Foster, 2011). Purpose-‐built busways without guidance have also been built in the UK, such as in Swansea and Kent. Kent conventional Thameside Fastrak system has won praise from customers – 95 percent have rated overall Fastrack experience as ‘excellent’ or ‘good’ (Deng and Nelson, 2011). Africa’s three BRT systems -‐-‐ Lagos, Johannesburg, and Capetown – fall on the BRT Lite end of the spectrum. Lagos’s system, which opened in 2008, cost just US$1.7 million per kilometer to build, one of the cheapest anywhere (ITP and IBIS, 2009). Still, it carries almost 200,000 passengers a day or a quarter of public transport trips along its corridor even though BRT vehicles make up just 4 percent of vehicles on the route (Pirie, 2011). Notwithstanding the furious pace of BRT investments of the past decade, there remains plenty of room for growth. In 2011, the nearly 28 million passenger trips served by BRT systems worldwide were but 2.2 percent of all public transport trips and a mere 0.3 percent of all motorized person trips made that year (Pourbaix, 2011). 2.2 Regional Comparisons of BRT Ridership and Performance BRT yields environmental and mobility benefits only if it attracts riders – specifically former motorists as opposed to those who previously used a conventional bus or commuted by train. One study in the US estimated that 24 percent to 33 percent of riders served by new BRT systems are new transit users, most having switched from private car (Peak et al., 2005). In Adelaide, 40 percent of those riding track-‐guided buses were former motorists (Cervero, 1998). BRT systems in Latin America have attracted, by far, the most riders, as shown in Figure 4. Among 38 Latin American BRT cities with reliable data, average weekday ridership was more 10 times greater than averages for BRT cities of the U.S. and Europe. With 1.65 million passengers per weekday, Bogotá’s TransMilenio is the world’s most heavily patronized BRT system. Counting passengers on feeder lines that funnel into BRT stations, Curitiba averages 2.26 million weekday riders (Duarte and Rojas, 2012). Curitiba also holds the record for the most passengers moved on an entire BRT system in a day – 2.3 million. Figure 4 shows that Asian BRT cities, dominated by China and India, averaged more than a quarter million daily riders. The relationship between BRT ridership and factors like household income and vehicle ownership, it is safe to say, is generally an inverse one. Latin America and Asian BRT similarly dominate on the supply side in terms of kilometers of BRT lines. The relationship between BRT supply and demand, moreover, is fairly robust. Figure 5 shows a simple scatterplot for 115 BRT systems with reliable data. The correlation between BRT kilometers and ridership is 0.56 though as the plot reveals, ridership levels vary considerably as systems become larger.
8
Figure 4. Average Weekday Ridership Among BRT Cities, by Continent-‐Region. Numbers in bards denote number of BRT cities in region that are included in the analysis. Source: BRTDATA.ORG.
Figure 5. Scatterplot of Average Weekday Ridership and BRT Length Among 115 BRT Cities. Source: BRTDATA.ORG.
9
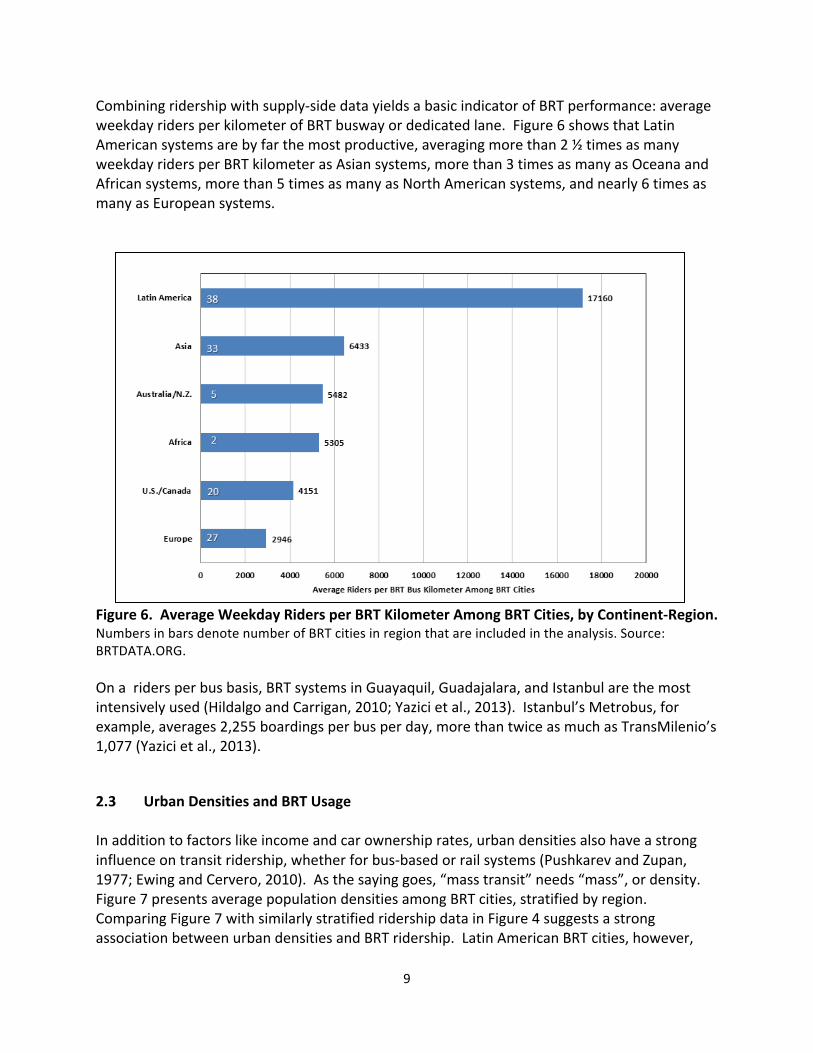
Combining ridership with supply-‐side data yields a basic indicator of BRT performance: average weekday riders per kilometer of BRT busway or dedicated lane. Figure 6 shows that Latin American systems are by far the most productive, averaging more than 2 ½ times as many weekday riders per BRT kilometer as Asian systems, more than 3 times as many as Oceana and African systems, more than 5 times as many as North American systems, and nearly 6 times as many as European systems.
Figure 6. Average Weekday Riders per BRT Kilometer Among BRT Cities, by Continent-‐Region. Numbers in bars denote number of BRT cities in region that are included in the analysis. Source: BRTDATA.ORG. On a riders per bus basis, BRT systems in Guayaquil, Guadajalara, and Istanbul are the most intensively used (Hildalgo and Carrigan, 2010; Yazici et al., 2013). Istanbul’s Metrobus, for example, averages 2,255 boardings per bus per day, more than twice as much as TransMilenio’s 1,077 (Yazici et al., 2013). 2.3 Urban Densities and BRT Usage In addition to factors like income and car ownership rates, urban densities also have a strong influence on transit ridership, whether for bus-‐based or rail systems (Pushkarev and Zupan, 1977; Ewing and Cervero, 2010). As the saying goes, “mass transit” needs “mass”, or density. Figure 7 presents average population densities among BRT cities, stratified by region. Comparing Figure 7 with similarly stratified ridership data in Figure 4 suggests a strong association between urban densities and BRT ridership. Latin American BRT cities, however,
10
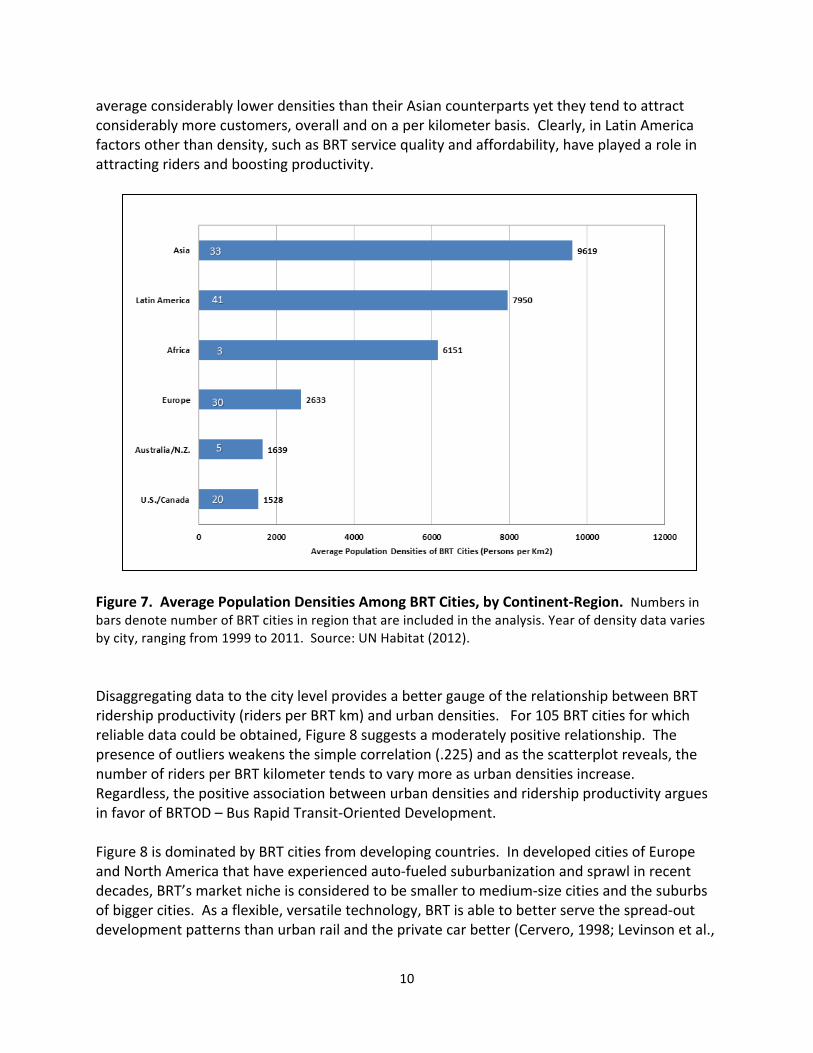
average considerably lower densities than their Asian counterparts yet they tend to attract considerably more customers, overall and on a per kilometer basis. Clearly, in Latin America factors other than density, such as BRT service quality and affordability, have played a role in attracting riders and boosting productivity.
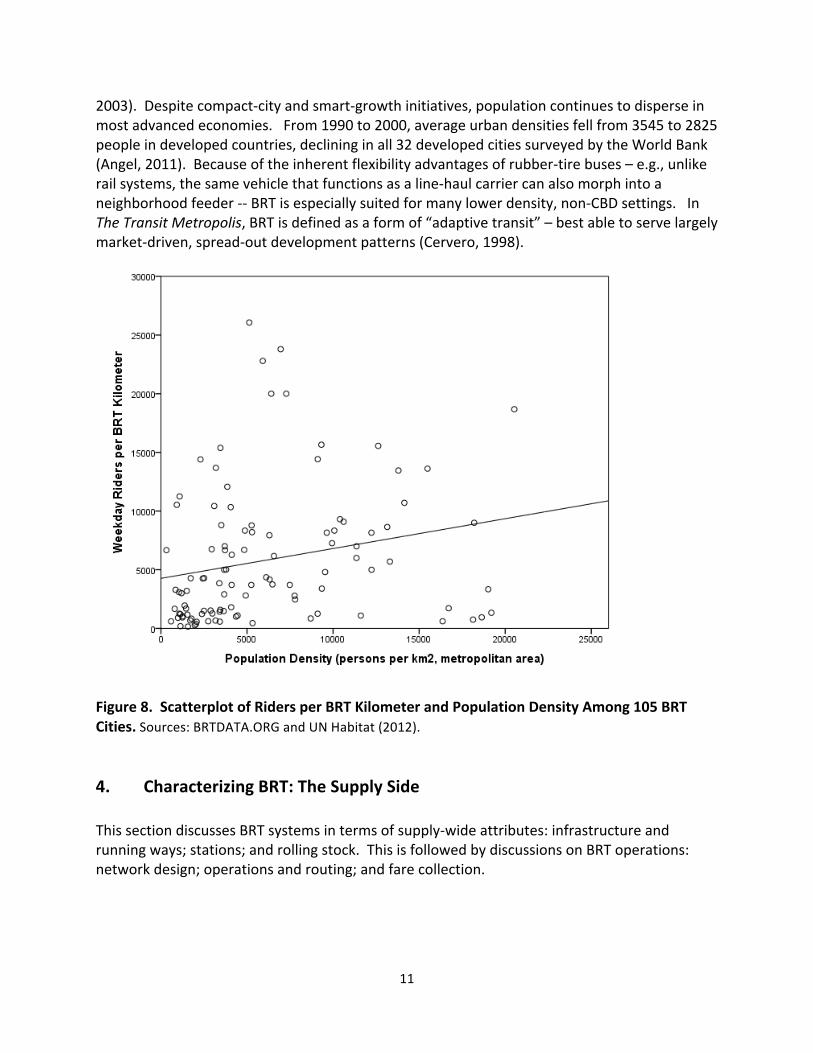
Figure 7. Average Population Densities Among BRT Cities, by Continent-‐Region. Numbers in bars denote number of BRT cities in region that are included in the analysis. Year of density data varies by city, ranging from 1999 to 2011. Source: UN Habitat (2012). Disaggregating data to the city level provides a better gauge of the relationship between BRT ridership productivity (riders per BRT km) and urban densities. For 105 BRT cities for which reliable data could be obtained, Figure 8 suggests a moderately positive relationship. The presence of outliers weakens the simple correlation (.225) and as the scatterplot reveals, the number of riders per BRT kilometer tends to vary more as urban densities increase. Regardless, the positive association between urban densities and ridership productivity argues in favor of BRTOD – Bus Rapid Transit-‐Oriented Development. Figure 8 is dominated by BRT cities from developing countries. In developed cities of Europe and North America that have experienced auto-‐fueled suburbanization and sprawl in recent decades, BRT’s market niche is considered to be smaller to medium-‐size cities and the suburbs of bigger cities. As a flexible, versatile technology, BRT is able to better serve the spread-‐out development patterns than urban rail and the private car better (Cervero, 1998; Levinson et al.,
11
2003). Despite compact-‐city and smart-‐growth initiatives, population continues to disperse in most advanced economies. From 1990 to 2000, average urban densities fell from 3545 to 2825 people in developed countries, declining in all 32 developed cities surveyed by the World Bank (Angel, 2011). Because of the inherent flexibility advantages of rubber-‐tire buses – e.g., unlike rail systems, the same vehicle that functions as a line-‐haul carrier can also morph into a neighborhood feeder -‐-‐ BRT is especially suited for many lower density, non-‐CBD settings. In The Transit Metropolis, BRT is defined as a form of “adaptive transit” – best able to serve largely market-‐driven, spread-‐out development patterns (Cervero, 1998).
Figure 8. Scatterplot of Riders per BRT Kilometer and Population Density Among 105 BRT Cities. Sources: BRTDATA.ORG and UN Habitat (2012). 4. Characterizing BRT: The Supply Side This section discusses BRT systems in terms of supply-‐wide attributes: infrastructure and running ways; stations; and rolling stock. This is followed by discussions on BRT operations: network design; operations and routing; and fare collection.
12
4.1 Infrastructure and Running-‐ways The speed and time-‐competitive of BRT (vis-‐à-‐vis private car or metrorail) depends significantly on the rights-‐of-‐way provided. As noted earlier, high-‐end BRTs have mostly protected, exclusive rights-‐of-‐way whereas low-‐end systems do not. BRT services operate across four different lane configurations: (1) running in mixed traffic (sometimes with signal priority at intersections); (2) operating in dedicated shoulder or curb lanes; (3) running in dedicated median lanes; and (4) using exclusive bus lanes, also called busways (Levinson et al., 2003; Wright, 2011). Mixed-‐traffic systems are the slowest. Those using dedicated shoulders or curb lanes typically rely on markers and physical barriers to separate regular traffic from BRT buses. For BRT systems with dedicate median lanes or exclusive bus lanes, buses operate in four ways :
• Along railroad alignments (e.g., Ottawa, Miami, Los Angeles, Amsterdam) • In arterial medians or freeways (e.g., Cleveland, Vancouver, Bogotá, Nantes, Seoul,
Beijing) • In tunnels (e.g., Seattle, Boston) • On elevated structures (e.g., Nagoya, Adelaide, Xiamen)
The overwhelming majority of busways operate in the center of an arterial street or freeway. Systems with their own dedicated roadway, whether on a former railroad alignment or alongside motorways (e.g., Brisbane), are far more the exception than the rule. If at-‐surface BRT lines are to become time-‐competitive with metrorail systems, some degree of grade-‐separation is necessary at busy intersections. Only 14 exclusive-‐lane BRT systems offer some degree of grade separation; most rely on signal prioritization schemes (BRTDATA.ORG). Xiamen’s 49km busway, the world’s sixth longest, features several tunnels and a very long bridge to avoid disruptions at key junctures. Jakarta today boasts the largest network of dedicated BRT lanes. With 134 km of protected, dedicated buslanes, TransJakarta was designed to mimic TransMilenio. ITDP opened a branch office in Jakarta and staffed it with professionals from Colombia to design TransJakarta according to TransMilenio specifications. With 105 kms of busway, Bogotá has the second longest system, followed by Mexico City (81.5 km) and Curitiba (70 km). Among 36 global BRT systems with dedicated busways, the median length system is 28km. Several cities have experimented with track-‐guided buses (e.g., Nagoya, Leeds, Adelaide, Mannhaim, Nantes). Track systems are typically built in areas with restricted rights-‐of-‐way, such as along narrow freeway medians. Nestled between tracks and steered by guide wheels and horizatonal stabilizers, riders enjoy a smooth and often scenic ride however these systems tend to be considerably more expensive than other BRT running environments.
13
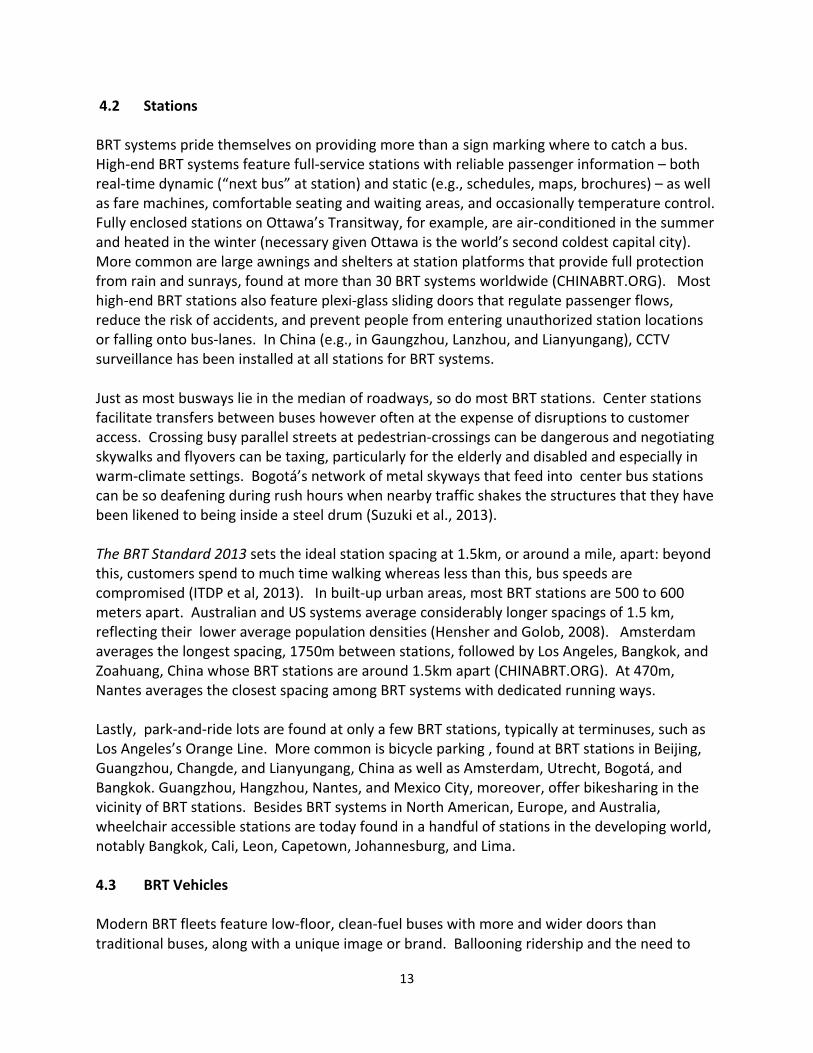
4.2 Stations BRT systems pride themselves on providing more than a sign marking where to catch a bus. High-‐end BRT systems feature full-‐service stations with reliable passenger information – both real-‐time dynamic (“next bus” at station) and static (e.g., schedules, maps, brochures) – as well as fare machines, comfortable seating and waiting areas, and occasionally temperature control. Fully enclosed stations on Ottawa’s Transitway, for example, are air-‐conditioned in the summer and heated in the winter (necessary given Ottawa is the world’s second coldest capital city). More common are large awnings and shelters at station platforms that provide full protection from rain and sunrays, found at more than 30 BRT systems worldwide (CHINABRT.ORG). Most high-‐end BRT stations also feature plexi-‐glass sliding doors that regulate passenger flows, reduce the risk of accidents, and prevent people from entering unauthorized station locations or falling onto bus-‐lanes. In China (e.g., in Gaungzhou, Lanzhou, and Lianyungang), CCTV surveillance has been installed at all stations for BRT systems. Just as most busways lie in the median of roadways, so do most BRT stations. Center stations facilitate transfers between buses however often at the expense of disruptions to customer access. Crossing busy parallel streets at pedestrian-‐crossings can be dangerous and negotiating skywalks and flyovers can be taxing, particularly for the elderly and disabled and especially in warm-‐climate settings. Bogotá’s network of metal skyways that feed into center bus stations can be so deafening during rush hours when nearby traffic shakes the structures that they have been likened to being inside a steel drum (Suzuki et al., 2013). The BRT Standard 2013 sets the ideal station spacing at 1.5km, or around a mile, apart: beyond this, customers spend to much time walking whereas less than this, bus speeds are compromised (ITDP et al, 2013). In built-‐up urban areas, most BRT stations are 500 to 600 meters apart. Australian and US systems average considerably longer spacings of 1.5 km, reflecting their lower average population densities (Hensher and Golob, 2008). Amsterdam averages the longest spacing, 1750m between stations, followed by Los Angeles, Bangkok, and Zoahuang, China whose BRT stations are around 1.5km apart (CHINABRT.ORG). At 470m, Nantes averages the closest spacing among BRT systems with dedicated running ways. Lastly, park-‐and-‐ride lots are found at only a few BRT stations, typically at terminuses, such as Los Angeles’s Orange Line. More common is bicycle parking , found at BRT stations in Beijing, Guangzhou, Changde, and Lianyungang, China as well as Amsterdam, Utrecht, Bogotá, and Bangkok. Guangzhou, Hangzhou, Nantes, and Mexico City, moreover, offer bikesharing in the vicinity of BRT stations. Besides BRT systems in North American, Europe, and Australia, wheelchair accessible stations are today found in a handful of stations in the developing world, notably Bangkok, Cali, Leon, Capetown, Johannesburg, and Lima. 4.3 BRT Vehicles Modern BRT fleets feature low-‐floor, clean-‐fuel buses with more and wider doors than traditional buses, along with a unique image or brand. Ballooning ridership and the need to
14
accommodate swift, large-‐volume loading has meant articulated and bi-‐articulated buses with multiple doors are common (Levinson et al., 2003; Hildalgo and Gutiérrez, 2013). ITDP et al. (2013) calls for a minimum of three doors for articulated buses and two for regular buses. Along busy corridors, double-‐ and triple-‐section articulated vehicles can carry more than 150 passengers. Curitiba’s 24m bi-‐articulated buses have a crunch load capacity of 270 passengers. Istanbul’s 4-‐door Mercedes CapaCity buses can carry upwards of 200 passengers. During peak periods, far more people stand than sit. Wide aisles provide space to move around. Numerous manufacturers are today producing BRT buses. Large systems such as Bogotá and Mexico City operate BRT buses from multiple manufacturers, in their cases Volvo, Mercedes, and Scania. Curitiba’s special bi-‐articulated buses and left-‐side boarding Ligeirinho, or Speedy, buses are made by Volvo, whose South American bus manufacturing plant is located in Curitiba. China’s BRT buses are often made by Chinese manufactures or joint ventures (e.g., MAN and Huanghai makes buses for Dalian) and in India, Tata has mostly cornered the BRT market. Chinese manufacturers such as Xiamen-‐based Kinglong are branching out, designing and building buses not only for Xiamen’s high-‐end BRT system but also for Guangzhou, Lianyungang, Zaozhuang, and Lima, Peru. Worldwide, most BRT buses today run on clean diesel fuels that meet Euro-‐III and Euro-‐IV emission standards. Due its natural resource base, all BRT buses in Australian cities run on CNG. Because natural gas burns more cleanly than liquid fossil fuels, does not emit diesel particulates, and generates much lower levels of nitrogen oxides and sulfur oxides, the combination of fast moving vehicles on busways (as in Brisbane, Adelaide, and Sydney) running on clean fuels has meant Australian BRT services are the world’s eco-‐friendliest. Outside of Australia, Jakarta, Lima, Nantes, Los Angeles, and several Chinese cities also run CNG buses. LNG is used by Beijing’s and Guangzhou’s fleets. Some of Curitiba’s buses are propelled by biofuels. In Istanbul, Hefei, Zheng, and Seattle, diesel-‐hybrid buses are operated. Istanbul’s ATC Phileas buses, 26 meters in length that accommodate up to 230 passengers, run on clean diesel along high-‐speed busway and electric batteries in idling and slow-‐speed mode. Electric traction allows lighter vehicles, faster acceleration, and the ability to feed energy back into batteries or the power grid through regenerative brakes. In tunnels, Seattle uses diesel-‐electric hybrid buses, which operate similar to hybrid cars outside the tunnel and in a low-‐noise, low-‐emissions “hush mode” (in which the diesel engine does not exceed idle speed) when underground. Branding is another distinguishing feature of BRT buses. Logos, color schemes, and other visual element are used to convey BRT’s unique identify, distinguishing them from regular buses. Las Vegas’s BRT buses and stations, for example, feature old casino signs that reflect the city’s iconic identify and history. BRT Lite buses often have a low-‐floor or kneeling configuration, allowing same-‐level boarding and alighting at simple curbside stations. Higher-‐end buses that stop at raised platforms or full-‐service stations, such in Quito and Bogotá, deploy ramps to expedite passenger flows. Some
15
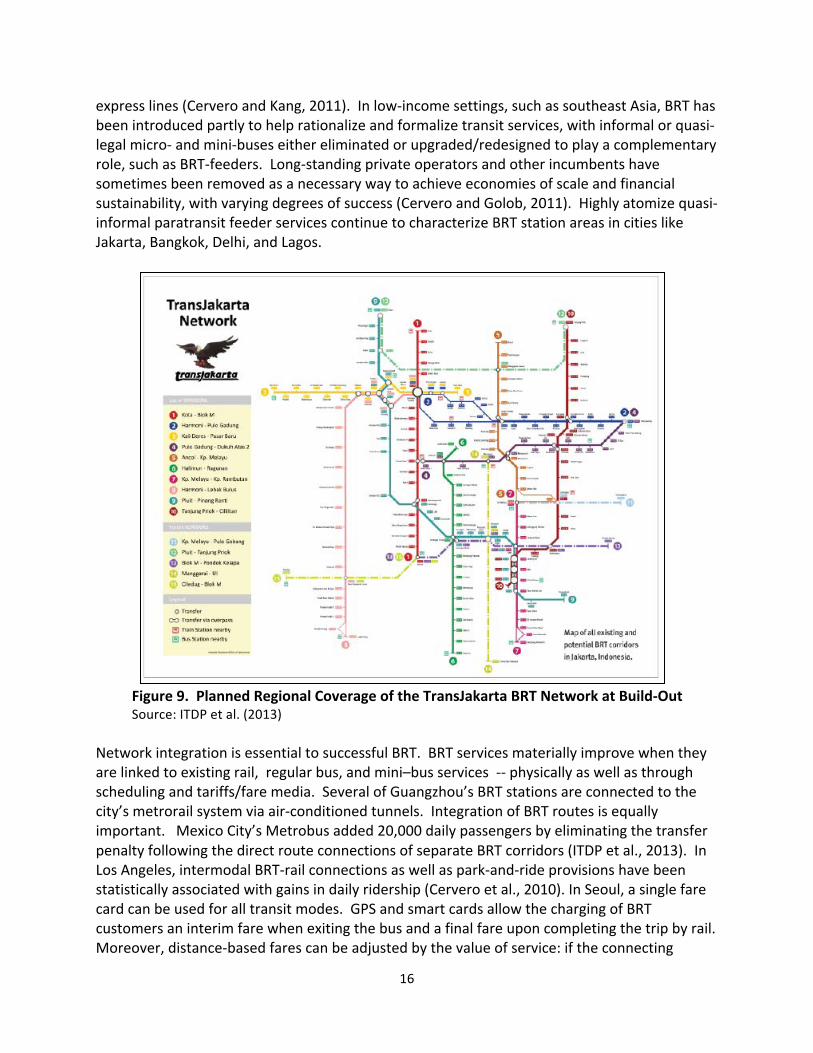
systems, such as in Beijing and Hangzhou, combine low-‐floor buses with slightly raised station platforms (Kantor et al., 2006). In Europe and particularly France, the distinction between BRT and rail is becoming increasingly blurred. Sensitive to the need to project a modern, rail-‐like image, French cities like Caen, Clermont-‐Ferrand, Lyon, Nancy, and Rouen have purchased Civis by Irisbus and TVR (Transport sur Voie Reservée) by Bombardier that feature rounded bodies and covered wheels. Rouen’s Civis feature hybrid diesel-‐electric articulated vehicles with train-‐like appearance, including four doors, optical guidance, and wide aisle. Tram-‐like Van Hool vehicles are used in Metz. Rubber-‐tired TVR vehicles in Caen and Nancy operate both on and off a dedicated runway. Caen’s Twisto system is the hardest to label, running on rubber tires as well as a central rail that keeps it on course. Twisto vehicles are propelled by overhead electrical wires in town but can run on diesel in the suburbs. Steering further distinguishes some European BRT systems. Civis buses in Rouen and Clermont-‐Ferrand have been using optical guidance since 2001. Eindhoven’s Phileas vehicles have electromagnetic-‐guided steering. These system are far more advanced than the first-‐generation mechanical guidance introduced with the original O’Bahn systems of Adelaide and Essen (i.e., guide-‐wheels nestled along horizontal tracks/stabilizers). In the UK, improved versions of mechanical curb-‐guided buses have been introduced in Ipswich, Leeds, Bradford, Sussex, Edinburgh, Luton, and Cambridge-‐St. Ives. 4.4 Network Designs BRT networks often follow urban form. They also reflect service philosophies. Early Latin America BRT cities like Curitiba and Bogotá have distinct radial city forms and accordingly radial BRT systems. Most trips are distributed along high-‐density corridors. In contrast, Chinese cities tend to have high, fairly uniformly distributed urban densities (Yang et al., 2012). Their spread-‐out, planar urban form calls for more flexible, multi-‐directional systems, such as in Guangzhou. Rather than radial or hub-‐and-‐spoke systems with transfer points, Chinese cities tend to have branching networks and flexible route designs that minimize transfers. Ideally, a BRT network mimics the spatial coverage and connectivity of other regional transportation facilities, notably regional freeway and motorway networks. If bus-‐based transit systems are to be time-‐competitive with the private automobile, it is imperative that they deliver the same degree of regional access. TransJakarta’s proposed network at build out aims to do just that, stretching in all direction across the city of 14-‐million inhabitant’s sprawling landscape (Figure 9). BRT network designs also reflect cities’ public transport histories and broader policy agendas. In Seoul, BRT was introduced as part of a radical service reform. There, BRT functions as high-‐capacity trunklines and most other routes have been reconfigured to serve as feeders, to cater to non-‐BRT markets, or provide nice-‐market services like downtown circulators or cross-‐town
16
express lines (Cervero and Kang, 2011). In low-‐income settings, such as southeast Asia, BRT has been introduced partly to help rationalize and formalize transit services, with informal or quasi-‐legal micro-‐ and mini-‐buses either eliminated or upgraded/redesigned to play a complementary role, such as BRT-‐feeders. Long-‐standing private operators and other incumbents have sometimes been removed as a necessary way to achieve economies of scale and financial sustainability, with varying degrees of success (Cervero and Golob, 2011). Highly atomize quasi-‐informal paratransit feeder services continue to characterize BRT station areas in cities like Jakarta, Bangkok, Delhi, and Lagos.
Figure 9. Planned Regional Coverage of the TransJakarta BRT Network at Build-‐Out Source: ITDP et al. (2013) Network integration is essential to successful BRT. BRT services materially improve when they are linked to existing rail, regular bus, and mini–bus services -‐-‐ physically as well as through scheduling and tariffs/fare media. Several of Guangzhou’s BRT stations are connected to the city’s metrorail system via air-‐conditioned tunnels. Integration of BRT routes is equally important. Mexico City’s Metrobus added 20,000 daily passengers by eliminating the transfer penalty following the direct route connections of separate BRT corridors (ITDP et al., 2013). In Los Angeles, intermodal BRT-‐rail connections as well as park-‐and-‐ride provisions have been statistically associated with gains in daily ridership (Cervero et al., 2010). In Seoul, a single fare card can be used for all transit modes. GPS and smart cards allow the charging of BRT customers an interim fare when exiting the bus and a final fare upon completing the trip by rail. Moreover, distance-‐based fares can be adjusted by the value of service: if the connecting
17
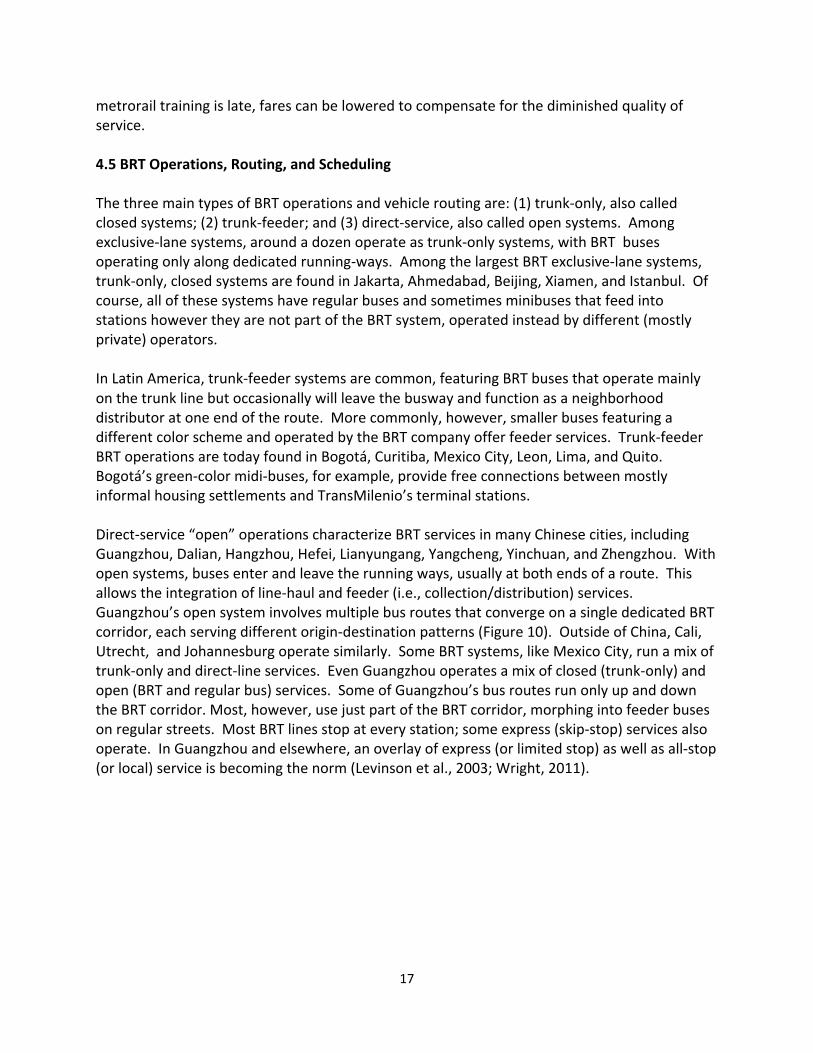
metrorail training is late, fares can be lowered to compensate for the diminished quality of service. 4.5 BRT Operations, Routing, and Scheduling The three main types of BRT operations and vehicle routing are: (1) trunk-‐only, also called closed systems; (2) trunk-‐feeder; and (3) direct-‐service, also called open systems. Among exclusive-‐lane systems, around a dozen operate as trunk-‐only systems, with BRT buses operating only along dedicated running-‐ways. Among the largest BRT exclusive-‐lane systems, trunk-‐only, closed systems are found in Jakarta, Ahmedabad, Beijing, Xiamen, and Istanbul. Of course, all of these systems have regular buses and sometimes minibuses that feed into stations however they are not part of the BRT system, operated instead by different (mostly private) operators. In Latin America, trunk-‐feeder systems are common, featuring BRT buses that operate mainly on the trunk line but occasionally will leave the busway and function as a neighborhood distributor at one end of the route. More commonly, however, smaller buses featuring a different color scheme and operated by the BRT company offer feeder services. Trunk-‐feeder BRT operations are today found in Bogotá, Curitiba, Mexico City, Leon, Lima, and Quito. Bogotá’s green-‐color midi-‐buses, for example, provide free connections between mostly informal housing settlements and TransMilenio’s terminal stations. Direct-‐service “open” operations characterize BRT services in many Chinese cities, including Guangzhou, Dalian, Hangzhou, Hefei, Lianyungang, Yangcheng, Yinchuan, and Zhengzhou. With open systems, buses enter and leave the running ways, usually at both ends of a route. This allows the integration of line-‐haul and feeder (i.e., collection/distribution) services. Guangzhou’s open system involves multiple bus routes that converge on a single dedicated BRT corridor, each serving different origin-‐destination patterns (Figure 10). Outside of China, Cali, Utrecht, and Johannesburg operate similarly. Some BRT systems, like Mexico City, run a mix of trunk-‐only and direct-‐line services. Even Guangzhou operates a mix of closed (trunk-‐only) and open (BRT and regular bus) services. Some of Guangzhou’s bus routes run only up and down the BRT corridor. Most, however, use just part of the BRT corridor, morphing into feeder buses on regular streets. Most BRT lines stop at every station; some express (skip-‐stop) services also operate. In Guangzhou and elsewhere, an overlay of express (or limited stop) as well as all-‐stop (or local) service is becoming the norm (Levinson et al., 2003; Wright, 2011).
18
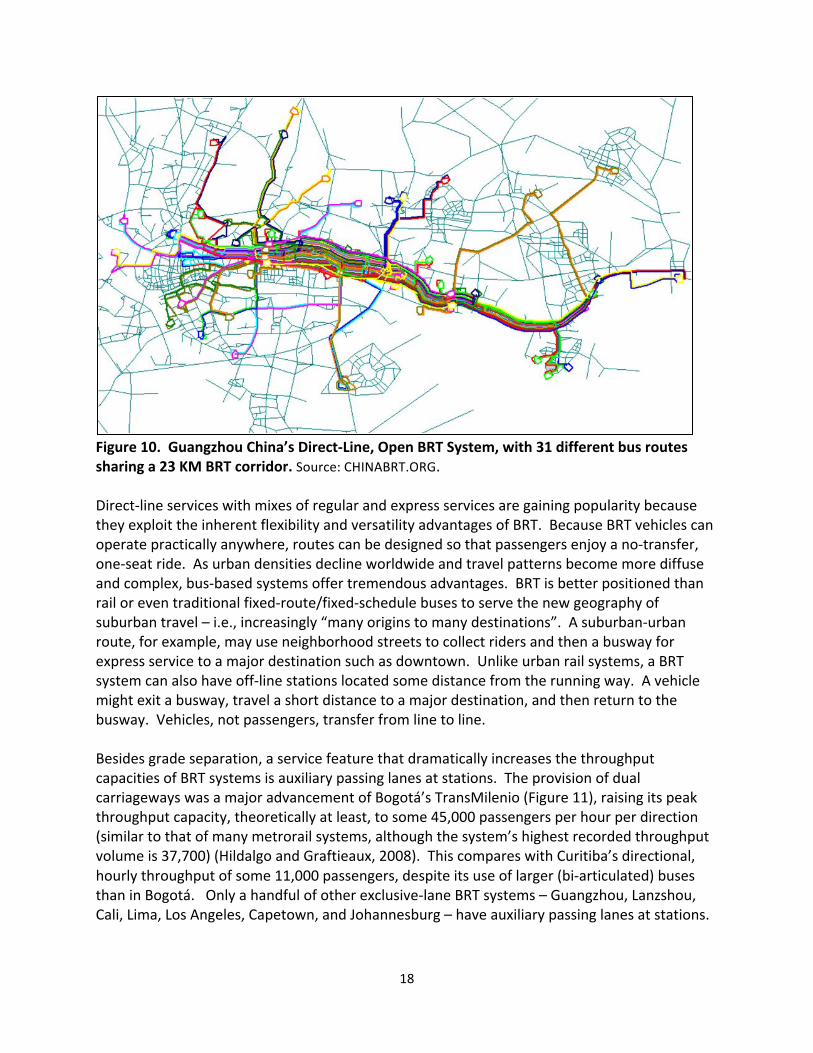
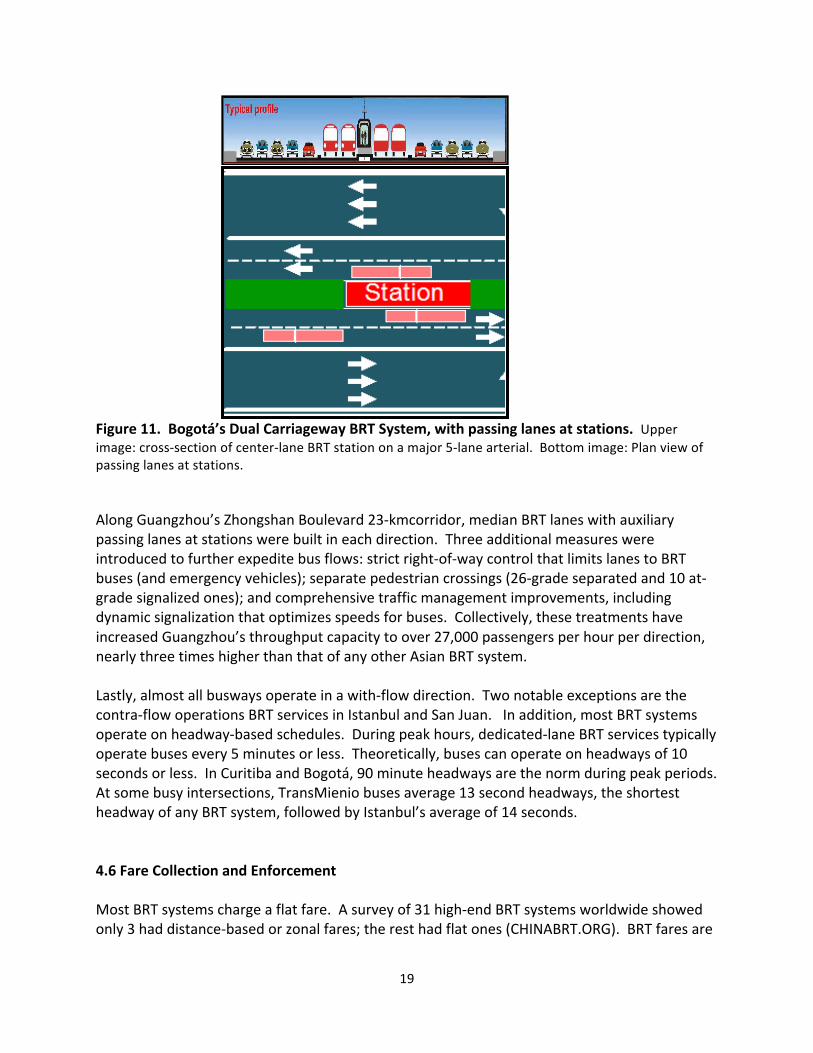
Figure 10. Guangzhou China’s Direct-‐Line, Open BRT System, with 31 different bus routes sharing a 23 KM BRT corridor. Source: CHINABRT.ORG. Direct-‐line services with mixes of regular and express services are gaining popularity because they exploit the inherent flexibility and versatility advantages of BRT. Because BRT vehicles can operate practically anywhere, routes can be designed so that passengers enjoy a no-‐transfer, one-‐seat ride. As urban densities decline worldwide and travel patterns become more diffuse and complex, bus-‐based systems offer tremendous advantages. BRT is better positioned than rail or even traditional fixed-‐route/fixed-‐schedule buses to serve the new geography of suburban travel – i.e., increasingly “many origins to many destinations”. A suburban-‐urban route, for example, may use neighborhood streets to collect riders and then a busway for express service to a major destination such as downtown. Unlike urban rail systems, a BRT system can also have off-‐line stations located some distance from the running way. A vehicle might exit a busway, travel a short distance to a major destination, and then return to the busway. Vehicles, not passengers, transfer from line to line. Besides grade separation, a service feature that dramatically increases the throughput capacities of BRT systems is auxiliary passing lanes at stations. The provision of dual carriageways was a major advancement of Bogotá’s TransMilenio (Figure 11), raising its peak throughput capacity, theoretically at least, to some 45,000 passengers per hour per direction (similar to that of many metrorail systems, although the system’s highest recorded throughput volume is 37,700) (Hildalgo and Graftieaux, 2008). This compares with Curitiba’s directional, hourly throughput of some 11,000 passengers, despite its use of larger (bi-‐articulated) buses than in Bogotá. Only a handful of other exclusive-‐lane BRT systems – Guangzhou, Lanzshou, Cali, Lima, Los Angeles, Capetown, and Johannesburg – have auxiliary passing lanes at stations.
19
Figure 11. Bogotá’s Dual Carriageway BRT System, with passing lanes at stations. Upper image: cross-‐section of center-‐lane BRT station on a major 5-‐lane arterial. Bottom image: Plan view of passing lanes at stations. Along Guangzhou’s Zhongshan Boulevard 23-‐kmcorridor, median BRT lanes with auxiliary passing lanes at stations were built in each direction. Three additional measures were introduced to further expedite bus flows: strict right-‐of-‐way control that limits lanes to BRT buses (and emergency vehicles); separate pedestrian crossings (26-‐grade separated and 10 at-‐grade signalized ones); and comprehensive traffic management improvements, including dynamic signalization that optimizes speeds for buses. Collectively, these treatments have increased Guangzhou’s throughput capacity to over 27,000 passengers per hour per direction, nearly three times higher than that of any other Asian BRT system. Lastly, almost all busways operate in a with-‐flow direction. Two notable exceptions are the contra-‐flow operations BRT services in Istanbul and San Juan. In addition, most BRT systems operate on headway-‐based schedules. During peak hours, dedicated-‐lane BRT services typically operate buses every 5 minutes or less. Theoretically, buses can operate on headways of 10 seconds or less. In Curitiba and Bogotá, 90 minute headways are the norm during peak periods. At some busy intersections, TransMienio buses average 13 second headways, the shortest headway of any BRT system, followed by Istanbul’s average of 14 seconds. 4.6 Fare Collection and Enforcement Most BRT systems charge a flat fare. A survey of 31 high-‐end BRT systems worldwide showed only 3 had distance-‐based or zonal fares; the rest had flat ones (CHINABRT.ORG). BRT fares are
20
often more affordable than what informal or quasi-‐private operators charge (Cervero and Golob, 2011). Bogotá’s fare of around one US dollar is good for an entire day. Despite fairly affordable fares, Latin American BRT systems are least dependent on operating subsidies (Hensher and Golob, 2008). Their higher ridership productivity levels, discussed earlier, likely accounts combination of affordable fares and low subsidies. Pre-‐board fare collection and fare verification is most widely found among BRT systems in Latin America, Asia, and France. US and European BRT systems rely predominantly on pre-‐paid ticketing with barrier-‐free, proof-‐of-‐purchase inspection. Due to the large clientele of low-‐income, transit-‐dependent users, fare evasion remains a problem with many BRT systems in developing cities. Santiago’s BRT system, Transantiago, averages a fare evasion rate of 27.7 percent (Torres-‐Montoya, 2013). The switch from a highly atomized privately operated system of mostly run-‐down minibuses and converted lorries to a formal public system organized designed as a hybrid of mixed-‐traffic and dedicated-‐lane BRT in 2007, was followed by a steady deterioration of services. In fear of contractors abandoning services, Chile’s government opted to pay operators on the basis of expected, rather than actual, demand. With revenues guaranteed, operators shrank their fleets and sometimes even ignored waiting passengers. By mid-‐2007, the system was running a deficit of over 35 percent even though it was suppose to incur none. Services cuts led to even more service declines. Many Santiaguinos associate bad BRT service with the right to avoid fare payment. Rampant fare evasion has been a main contributor to the system’s growing deficit (Torres-‐Montoya, 2013). 5. BRT System Performance In this section, global experiences with BRT systems are reviewed with regard to several key performance measures: operating speed, levels of comfort, safety, environmental impacts, and social equity. 5.1 Operating Speeds As a rule, the higher the quality of BRT services, the faster the average operating speed, and correspondingly the more time-‐competitive BRT becomes to the private car and metrorail services. Hildalgo and Graftieaux (2008) reviewed BRT systems in 11 cities in Latin America and Asia, finding that average speeds increased by between 15 kph and 26 kph following the conversion from regular to BRT services, depending on the quality of the busway. The fastest systems have not only separate rights-‐of-‐way but also grade-‐separation – e.g., track-‐guided buses of Adelaide (80 kph) and high-‐end busways of Brisbane (58 kph), Miami (45 kph), and Pittsburgh (East Busway, at 41 kph). Buses on Adelaide’s Northeast corridor can reach speeds as high as 100 kph (Currie, 2006). Guide-‐roller attached to the front axle of buses function as horizontal stabilizers, allowing speeds akin to rail on a guideway. Continuous and precisely
21
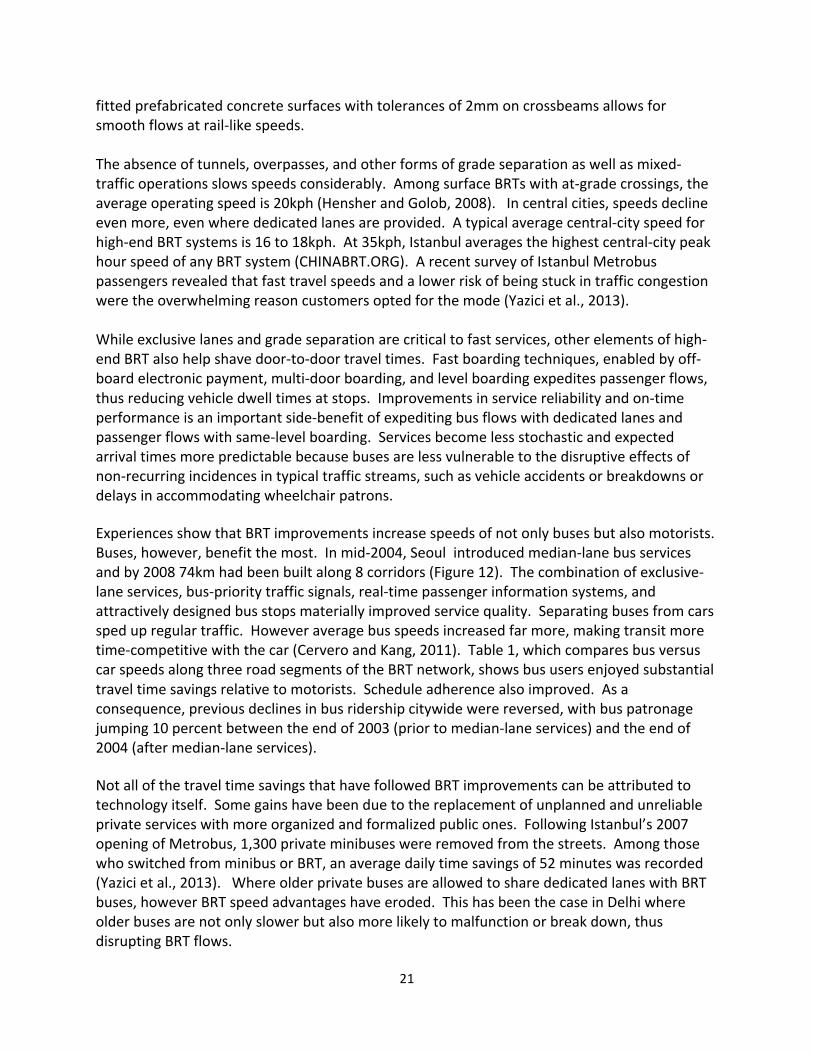
fitted prefabricated concrete surfaces with tolerances of 2mm on crossbeams allows for smooth flows at rail-‐like speeds. The absence of tunnels, overpasses, and other forms of grade separation as well as mixed-‐traffic operations slows speeds considerably. Among surface BRTs with at-‐grade crossings, the average operating speed is 20kph (Hensher and Golob, 2008). In central cities, speeds decline even more, even where dedicated lanes are provided. A typical average central-‐city speed for high-‐end BRT systems is 16 to 18kph. At 35kph, Istanbul averages the highest central-‐city peak hour speed of any BRT system (CHINABRT.ORG). A recent survey of Istanbul Metrobus passengers revealed that fast travel speeds and a lower risk of being stuck in traffic congestion were the overwhelming reason customers opted for the mode (Yazici et al., 2013). While exclusive lanes and grade separation are critical to fast services, other elements of high-‐end BRT also help shave door-‐to-‐door travel times. Fast boarding techniques, enabled by off-‐board electronic payment, multi-‐door boarding, and level boarding expedites passenger flows, thus reducing vehicle dwell times at stops. Improvements in service reliability and on-‐time performance is an important side-‐benefit of expediting bus flows with dedicated lanes and passenger flows with same-‐level boarding. Services become less stochastic and expected arrival times more predictable because buses are less vulnerable to the disruptive effects of non-‐recurring incidences in typical traffic streams, such as vehicle accidents or breakdowns or delays in accommodating wheelchair patrons. Experiences show that BRT improvements increase speeds of not only buses but also motorists. Buses, however, benefit the most. In mid-‐2004, Seoul introduced median-‐lane bus services and by 2008 74km had been built along 8 corridors (Figure 12). The combination of exclusive-‐lane services, bus-‐priority traffic signals, real-‐time passenger information systems, and attractively designed bus stops materially improved service quality. Separating buses from cars sped up regular traffic. However average bus speeds increased far more, making transit more time-‐competitive with the car (Cervero and Kang, 2011). Table 1, which compares bus versus car speeds along three road segments of the BRT network, shows bus users enjoyed substantial travel time savings relative to motorists. Schedule adherence also improved. As a consequence, previous declines in bus ridership citywide were reversed, with bus patronage jumping 10 percent between the end of 2003 (prior to median-‐lane services) and the end of 2004 (after median-‐lane services). Not all of the travel time savings that have followed BRT improvements can be attributed to technology itself. Some gains have been due to the replacement of unplanned and unreliable private services with more organized and formalized public ones. Following Istanbul’s 2007 opening of Metrobus, 1,300 private minibuses were removed from the streets. Among those who switched from minibus or BRT, an average daily time savings of 52 minutes was recorded (Yazici et al., 2013). Where older private buses are allowed to share dedicated lanes with BRT buses, however BRT speed advantages have eroded. This has been the case in Delhi where older buses are not only slower but also more likely to malfunction or break down, thus disrupting BRT flows.
22
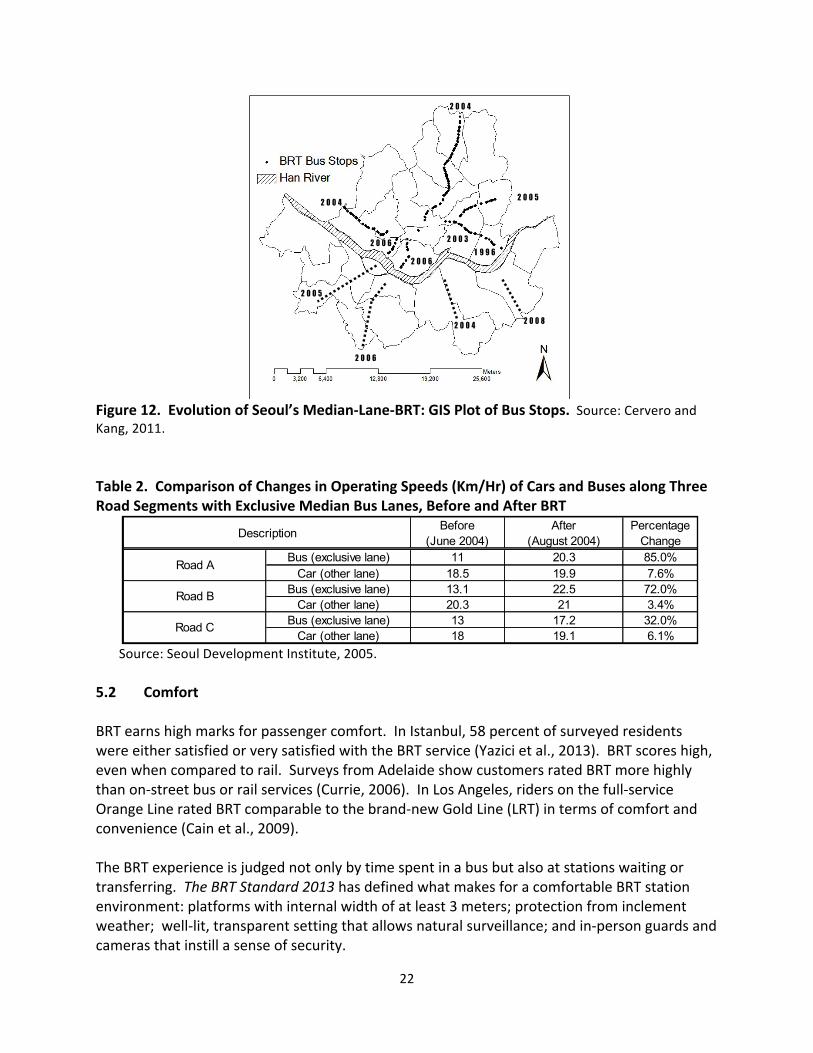
Figure 12. Evolution of Seoul’s Median-‐Lane-‐BRT: GIS Plot of Bus Stops. Source: Cervero and Kang, 2011. Table 2. Comparison of Changes in Operating Speeds (Km/Hr) of Cars and Buses along Three Road Segments with Exclusive Median Bus Lanes, Before and After BRT
Source: Seoul Development Institute, 2005. 5.2 Comfort BRT earns high marks for passenger comfort. In Istanbul, 58 percent of surveyed residents were either satisfied or very satisfied with the BRT service (Yazici et al., 2013). BRT scores high, even when compared to rail. Surveys from Adelaide show customers rated BRT more highly than on-‐street bus or rail services (Currie, 2006). In Los Angeles, riders on the full-‐service Orange Line rated BRT comparable to the brand-‐new Gold Line (LRT) in terms of comfort and convenience (Cain et al., 2009). The BRT experience is judged not only by time spent in a bus but also at stations waiting or transferring. The BRT Standard 2013 has defined what makes for a comfortable BRT station environment: platforms with internal width of at least 3 meters; protection from inclement weather; well-‐lit, transparent setting that allows natural surveillance; and in-‐person guards and cameras that instill a sense of security.
2 0 0 4
2 0 0 8
2 0 0 5
2 0 0 3
1 9 9 6
2 0 0 4
2 0 0 4
2 0 0 5
2 0 0 6
2 0 0 6
2 0 0 6
Bus (exclusive lane) 11 20.3 85.0%Car (other lane) 18.5 19.9 7.6%
Bus (exclusive lane) 13.1 22.5 72.0%Car (other lane) 20.3 21 3.4%
Bus (exclusive lane) 13 17.2 32.0%Car (other lane) 18 19.1 6.1%
Road C
Description Before(June 2004)
After(August 2004)
PercentageChange
Road A
Road B
23
5.3 Safety Studies show center-‐lane configurations, left-‐turn prohibitions, and signalized mid-‐block pedestrian crossings with refuge islands significantly improve safety on corridors where BRT operates (Duduta et al., 2013). Safety precautions have a modest effect on reducing BRT bus speeds thus the safety benefits are viewed as more than offsetting slight declines in service quality. Road safety improvements implemented in concert with BRT deployment in Bogotá have been credited with an 88 percent reduction in traffic fatalities on TransMilenio corridors (Hidalgo and Yepes, 2005; Hidalgo et al., 2012; Echeverry et al., 2005). Most of the decline was in pedestrian deaths. In Istanbul, the removal of minibuses and regular bus routes and the deployment of new buses in dedicated lanes was followed by a 64 percent reduction in bus accidents in one year (Yazici et al., 2013). 5.4 Environmental Impacts Urban buses emit relatively high levels of particulate matter (PM) and nitrogen oxides (NOx), a precursor to photochemical smog. As noted earlier, the widespread use of clean-‐diesel and other low-‐emission fuels have moderated the air-‐quality impacts of BRT. Accounting for indirect impacts, the net air quality impacts of BRT are likely positive. By removing cars from city streets and replacing slow-‐moving buses in mixed traffic and stop-‐and-‐go conditions with smoother-‐flowing, dedicated-‐lane services, BRT improves air quality relative to the status quo. Where BRT formalizes transit services, such in Latin American where BRT systems have replaced older, poorly maintained, high-‐emission minibuses and microbuses, air quality has improved. One study found that commuters’ exposure to air pollutants in Mexico City fell after the implementation of the Metro-‐bus BRT systems (Wöhrnshimmel et al., 2008). Hildalgo et al. (2013) estimated heath-‐cost savings from reduced emissions following TransMilenio’s first two phases totaled US$114 million over a 20-‐year period. Because old buses displaced by TransMilenio moved to the urban edge and smaller surrounding townships, Echeverry et al. (2005) caution that these benefits could be mostly redistributive, marked by emission increases in non-‐BRT-‐served areas. With regard to “global pollution”, i.e., greenhouse gas (GHG) emissions, BRT likely again confers net benefits. BRT generally emits less carbon dioxide than LRT vehicles due to the use of cleaner fuels as well as its lower cost which allows more services to be deployed for a given budget (Vincent and Jerram, 2006). Attracting former motorists to BRT can significantly reduce VKT (vehicle kilometers traveled) and thus GHG emissions (Cervero and Murakami, 2010). It is for this reason that the International Energy Agency (2013) has called for a mass deployment of BRT services worldwide, as much as 25,000km of new exclusive-‐lane services in total, to help limit the global temperature rise to no more than 2 degrees. In terms of noise impacts, well-‐patronized buses that come by every few minutes are certainly quieter than steady streams of single-‐occupant cars carrying similar numbers of people. They are also generally quieter than steel-‐wheels-‐on-‐steel rail. BRT corridors could emit more noise around stations due to the concentration of accelerating buses however this is likely offset by
24
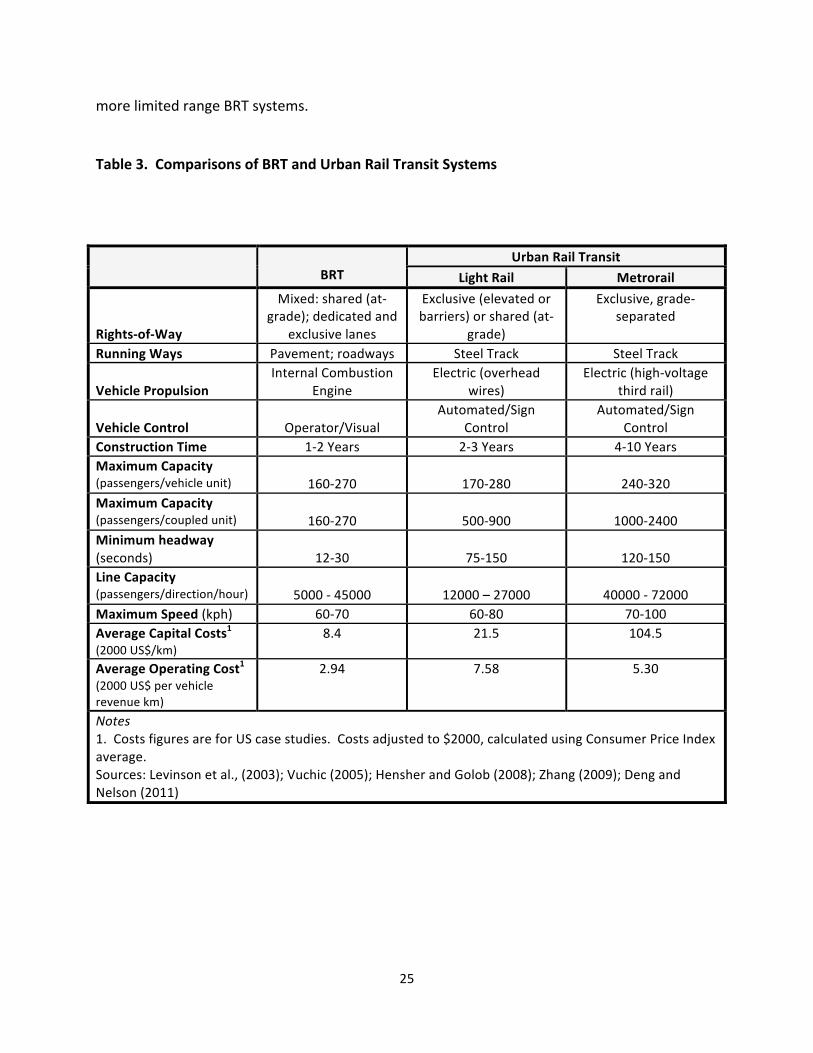
quieter operations along smoother flowing corridors. Soundwalls can mitigate noise impacts at busy stations, though at the expense of station-‐area aesthetics. 5.5 Social Equity BRT investments are pro-‐poor. Bogotá’s decision to investment in BRT vis-‐a-‐visa metrorail was driven in part by a desire to deliver a lower cost, more affordable mobility option that serves outlying informal settlements as much as downtown financial districts and other commercial clusters typically served by rail (Penalosa, 2002). Hildalgo and Yepes (2005) estimated that the first phase of TransMilenio produced more travel times savings for the poor (18 minutes per trip) than for the middle-‐class (10 minutes). Savings accrued from faster in-‐vehicle travel times; adding times for access to stations, waiting, and transferring, however, translated into an increase in door-‐to-‐door trip durations for poor and non-‐poor alike (Lleras, 2003). More substantial have been savings in average bus fares, which have been recorded in Jakarta (Wright and Hook, 2007), Bogotá (Hildalgo and Yepes, 2005; Cervero, 2005), and Lagos (ITP and IBIS, 2009). The replacement of loosely regulated private buses with government-‐sponsored BRT has usually translated into lower shares of daily earnings devoted to travel for the very poor (Cervero, 2011). Studies of Bogotá (Cervero, 2005) and Cali (Jaramillo et al., 2012) also show that BRT can substantially improve access of the poor to low-‐skill job opportunities. Another analysis revealed that Mexico City’s Metrobus Line 3 BRT yielded the most benefits to the lowest three income quintiles (Delgado and Uniman, 2011). In contrast, Johannesburg’s 26-‐km BRT line (Rea Vaya) has failed to improve the livelihoods of the poor due to its pricing scheme and focus on middle-‐income markets (Venter et al., 2013). 6. BRT Versus Urban Rail: Cost and Service Comparisons Apple-‐to-‐apple comparisons of BRT versus urban rail systems are difficult because of their contrasting designs, carrying capacities, impacts on urban development, and the like (Table 3). By most accounts, however, BRT is a cost-‐effective alternative to light or heavy rail (i.e., metrorail) systems. The more economical use of rights-‐of-‐way and roadway operations lowers the cost of BRT relative to rail systems, though at the expense of generally lower passenger carrying capacities and slower speeds. Comparisons of passenger capacities are made difficult by wide variations among BRT systems – as high as 45,000 passengers per direction per hour (ppdph) in the case of Bogotá however one tenth this amount for other busway systems (and even lower peak hourly throughputs of 1000 passengers in Capetown, Amsterdam, and Changde). These are theoretical numbers. In practice, BRT’s carrying capacities are lower. Hensher and Golob (2008) found the crunch-‐load ridership of many BRT systems to range from 2000 to 8000 ppdph. Thus the line capacities of BRT relative to urban rail, and thus its relative cost-‐effectiveness, in Table 3 could be exaggerated. Any cost-‐effectiveness edge of BRT is also curbed to the degree that large-‐scale rail networks provide greater connectivity and accessibility at faster travel speeds in addition to having stronger city-‐shaping impacts than
25
more limited range BRT systems. Table 3. Comparisons of BRT and Urban Rail Transit Systems
BRT
Urban Rail Transit Light Rail Metrorail
Rights-‐of-‐Way
Mixed: shared (at-‐grade); dedicated and
exclusive lanes
Exclusive (elevated or barriers) or shared (at-‐
grade)
Exclusive, grade-‐separated
Running Ways Pavement; roadways Steel Track Steel Track Vehicle Propulsion
Internal Combustion Engine
Electric (overhead wires)
Electric (high-‐voltage third rail)
Vehicle Control
Operator/Visual
Automated/Sign Control
Automated/Sign Control
Construction Time 1-‐2 Years 2-‐3 Years 4-‐10 Years Maximum Capacity (passengers/vehicle unit)
160-‐270
170-‐280
240-‐320
Maximum Capacity (passengers/coupled unit)
160-‐270
500-‐900
1000-‐2400
Minimum headway (seconds)
12-‐30
75-‐150
120-‐150
Line Capacity (passengers/direction/hour)
5000 -‐ 45000
12000 – 27000
40000 -‐ 72000
Maximum Speed (kph) 60-‐70 60-‐80 70-‐100 Average Capital Costs1 (2000 US$/km)
8.4 21.5 104.5
Average Operating Cost1 (2000 US$ per vehicle revenue km)
2.94 7.58 5.30
Notes 1. Costs figures are for US case studies. Costs adjusted to $2000, calculated using Consumer Price Index average. Sources: Levinson et al., (2003); Vuchic (2005); Hensher and Golob (2008); Zhang (2009); Deng and Nelson (2011)
26
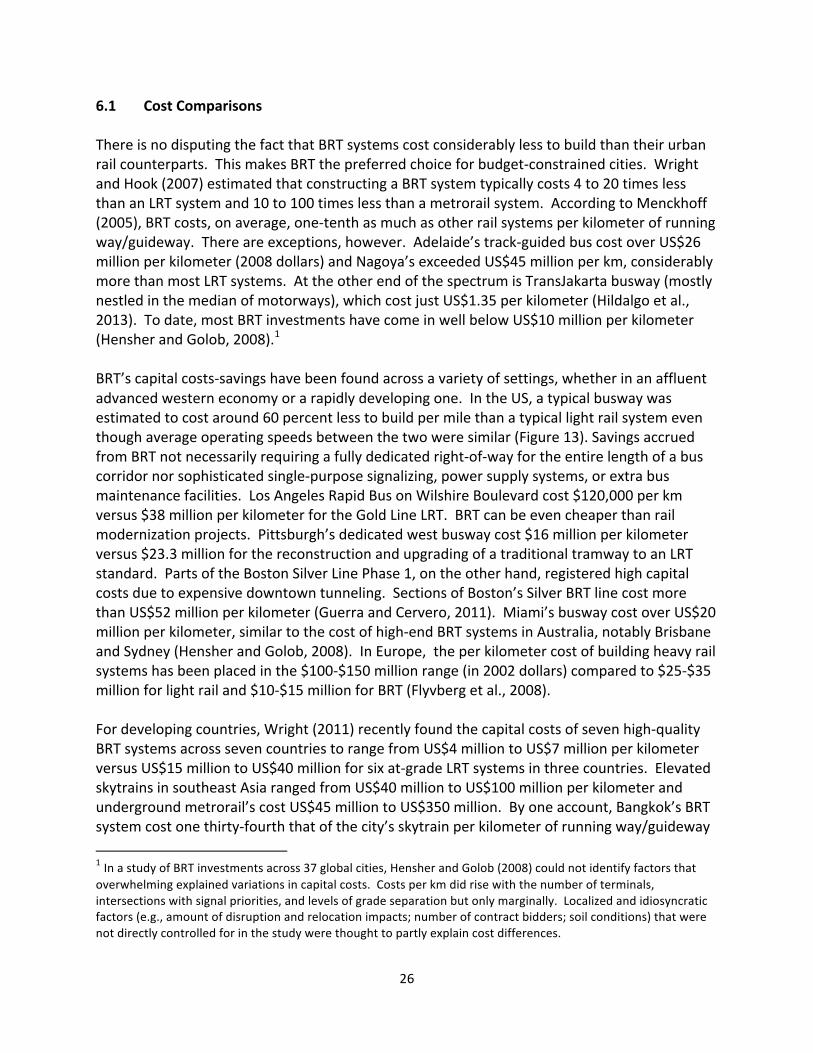
6.1 Cost Comparisons There is no disputing the fact that BRT systems cost considerably less to build than their urban rail counterparts. This makes BRT the preferred choice for budget-‐constrained cities. Wright and Hook (2007) estimated that constructing a BRT system typically costs 4 to 20 times less than an LRT system and 10 to 100 times less than a metrorail system. According to Menckhoff (2005), BRT costs, on average, one-‐tenth as much as other rail systems per kilometer of running way/guideway. There are exceptions, however. Adelaide’s track-‐guided bus cost over US$26 million per kilometer (2008 dollars) and Nagoya’s exceeded US$45 million per km, considerably more than most LRT systems. At the other end of the spectrum is TransJakarta busway (mostly nestled in the median of motorways), which cost just US$1.35 per kilometer (Hildalgo et al., 2013). To date, most BRT investments have come in well below US$10 million per kilometer (Hensher and Golob, 2008).1 BRT’s capital costs-‐savings have been found across a variety of settings, whether in an affluent advanced western economy or a rapidly developing one. In the US, a typical busway was estimated to cost around 60 percent less to build per mile than a typical light rail system even though average operating speeds between the two were similar (Figure 13). Savings accrued from BRT not necessarily requiring a fully dedicated right-‐of-‐way for the entire length of a bus corridor nor sophisticated single-‐purpose signalizing, power supply systems, or extra bus maintenance facilities. Los Angeles Rapid Bus on Wilshire Boulevard cost $120,000 per km versus $38 million per kilometer for the Gold Line LRT. BRT can be even cheaper than rail modernization projects. Pittsburgh’s dedicated west busway cost $16 million per kilometer versus $23.3 million for the reconstruction and upgrading of a traditional tramway to an LRT standard. Parts of the Boston Silver Line Phase 1, on the other hand, registered high capital costs due to expensive downtown tunneling. Sections of Boston’s Silver BRT line cost more than US$52 million per kilometer (Guerra and Cervero, 2011). Miami’s busway cost over US$20 million per kilometer, similar to the cost of high-‐end BRT systems in Australia, notably Brisbane and Sydney (Hensher and Golob, 2008). In Europe, the per kilometer cost of building heavy rail systems has been placed in the $100-‐$150 million range (in 2002 dollars) compared to $25-‐$35 million for light rail and $10-‐$15 million for BRT (Flyvberg et al., 2008). For developing countries, Wright (2011) recently found the capital costs of seven high-‐quality BRT systems across seven countries to range from US$4 million to US$7 million per kilometer versus US$15 million to US$40 million for six at-‐grade LRT systems in three countries. Elevated skytrains in southeast Asia ranged from US$40 million to US$100 million per kilometer and underground metrorail’s cost US$45 million to US$350 million. By one account, Bangkok’s BRT system cost one thirty-‐fourth that of the city’s skytrain per kilometer of running way/guideway 1 In a study of BRT investments across 37 global cities, Hensher and Golob (2008) could not identify factors that overwhelming explained variations in capital costs. Costs per km did rise with the number of terminals, intersections with signal priorities, and levels of grade separation but only marginally. Localized and idiosyncratic factors (e.g., amount of disruption and relocation impacts; number of contract bidders; soil conditions) that were not directly controlled for in the study were thought to partly explain cost differences.
27
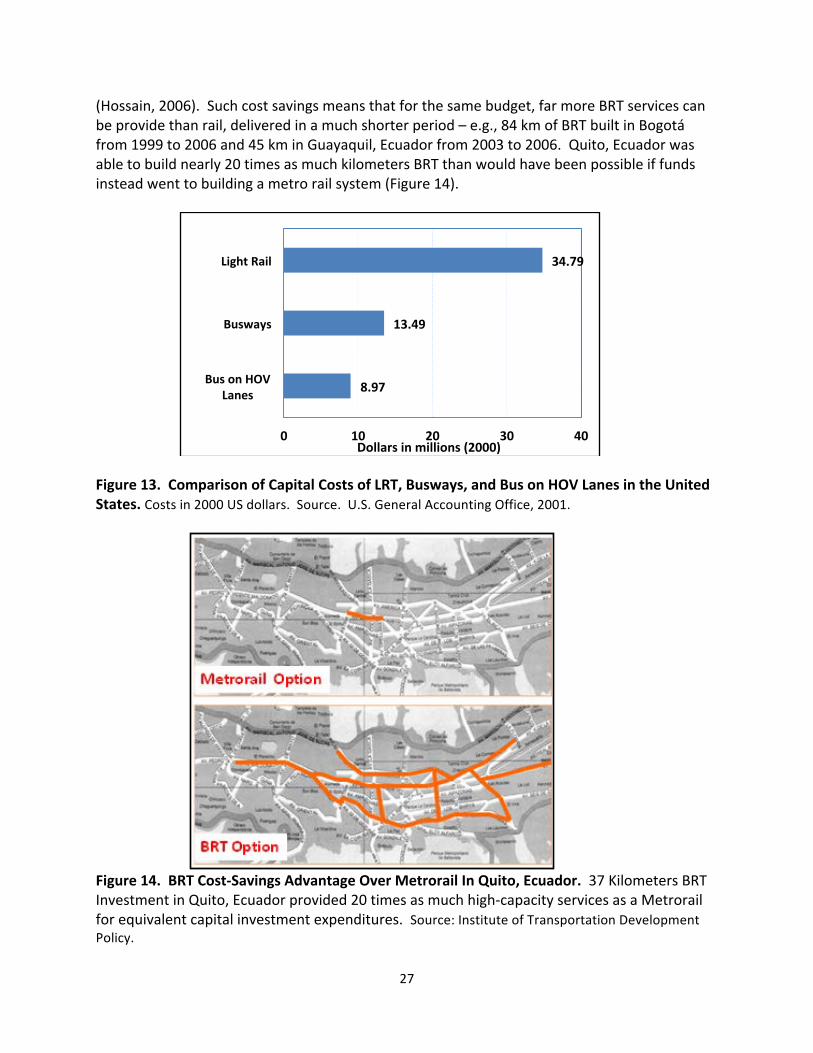
(Hossain, 2006). Such cost savings means that for the same budget, far more BRT services can be provide than rail, delivered in a much shorter period – e.g., 84 km of BRT built in Bogotá from 1999 to 2006 and 45 km in Guayaquil, Ecuador from 2003 to 2006. Quito, Ecuador was able to build nearly 20 times as much kilometers BRT than would have been possible if funds instead went to building a metro rail system (Figure 14).
Figure 13. Comparison of Capital Costs of LRT, Busways, and Bus on HOV Lanes in the United States. Costs in 2000 US dollars. Source. U.S. General Accounting Office, 2001.
Figure 14. BRT Cost-‐Savings Advantage Over Metrorail In Quito, Ecuador. 37 Kilometers BRT Investment in Quito, Ecuador provided 20 times as much high-‐capacity services as a Metrorail for equivalent capital investment expenditures. Source: Institute of Transportation Development Policy.
8.97
13.49
34.79
0 10 20 30 40
Bus on HOV Lanes
Busways
Light Rail
Dollars in millions (2000)
28
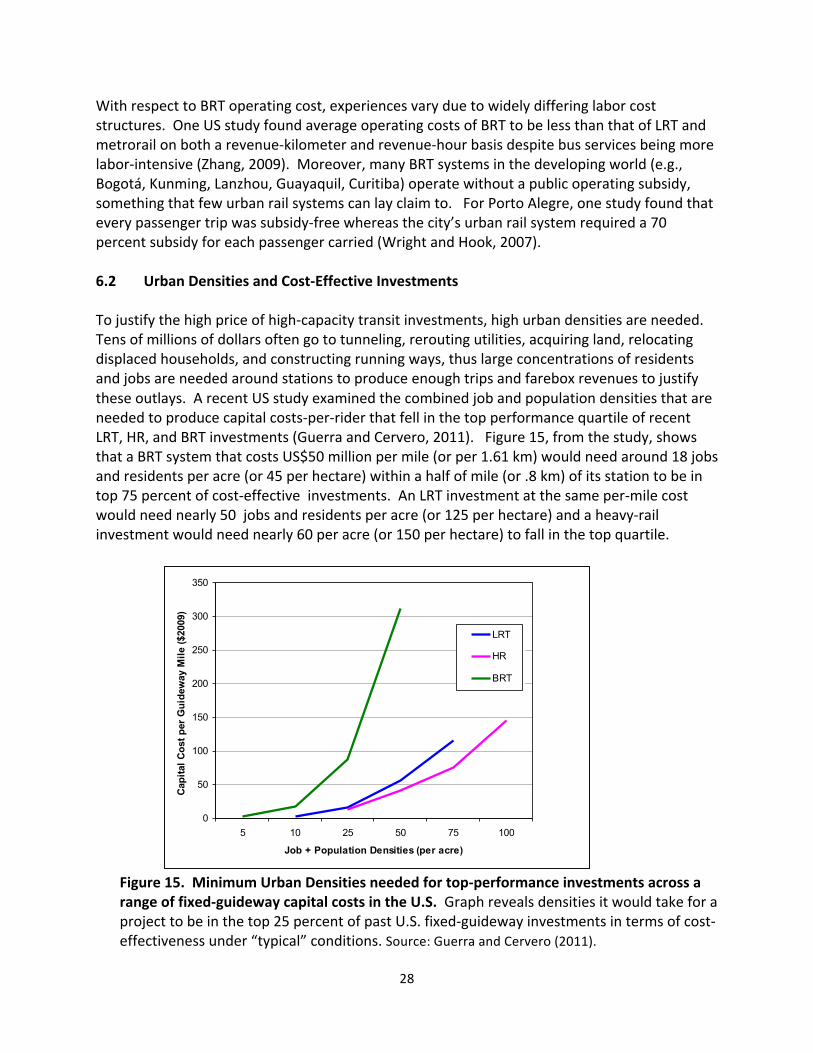
With respect to BRT operating cost, experiences vary due to widely differing labor cost structures. One US study found average operating costs of BRT to be less than that of LRT and metrorail on both a revenue-‐kilometer and revenue-‐hour basis despite bus services being more labor-‐intensive (Zhang, 2009). Moreover, many BRT systems in the developing world (e.g., Bogotá, Kunming, Lanzhou, Guayaquil, Curitiba) operate without a public operating subsidy, something that few urban rail systems can lay claim to. For Porto Alegre, one study found that every passenger trip was subsidy-‐free whereas the city’s urban rail system required a 70 percent subsidy for each passenger carried (Wright and Hook, 2007). 6.2 Urban Densities and Cost-‐Effective Investments To justify the high price of high-‐capacity transit investments, high urban densities are needed. Tens of millions of dollars often go to tunneling, rerouting utilities, acquiring land, relocating displaced households, and constructing running ways, thus large concentrations of residents and jobs are needed around stations to produce enough trips and farebox revenues to justify these outlays. A recent US study examined the combined job and population densities that are needed to produce capital costs-‐per-‐rider that fell in the top performance quartile of recent LRT, HR, and BRT investments (Guerra and Cervero, 2011). Figure 15, from the study, shows that a BRT system that costs US$50 million per mile (or per 1.61 km) would need around 18 jobs and residents per acre (or 45 per hectare) within a half of mile (or .8 km) of its station to be in top 75 percent of cost-‐effective investments. An LRT investment at the same per-‐mile cost would need nearly 50 jobs and residents per acre (or 125 per hectare) and a heavy-‐rail investment would need nearly 60 per acre (or 150 per hectare) to fall in the top quartile.
Figure 15. Minimum Urban Densities needed for top-‐performance investments across a range of fixed-‐guideway capital costs in the U.S. Graph reveals densities it would take for a project to be in the top 25 percent of past U.S. fixed-‐guideway investments in terms of cost-‐effectiveness under “typical” conditions. Source: Guerra and Cervero (2011).
0
50
100
150
200
250
300
350
5 10 25 50 75 100
Job + Population Densities (per acre)
Capi
tal C
ost p
er G
uide
way
Mile
($20
09)
LRT
HR
BRT
29
6.3 The Limits of BRT Relative to Urban Rail While BRT generally wins out over urban rail systems in terms of investment and operating costs per passenger carried, it must be remembered that it does not always match up well in terms of service quality (e.g., average speeds) and regional coverage. BRT particularly suffers in dense, built-‐up areas where buses operate on surface streets. As discussed in the next section, BRT’s ability to shape urban growth and leverage TOD is also questioned by some. In some instances, BRT systems have been a victim of their own success, suffering the effects of being too popular relative to their capacities. Veritable elephant trains of overcrowded buses are a sure-‐fire way of chasing away choice travelers who own a car, which has been the case in both Bogotá and Curitiba. From 2005 to 2010, TransMilenio’s fleet grew just 2.2 percent whereas daily demand rose from 1.2 to 1.7 million (30 percent). Sardine-‐like conditions and problems of groping and pickpocketing have resulted, chasing away middle-‐class riders in droves (Gilbert, 2008; Suzuki et al., 2013). During peak hours, TransMilenio average 6.5 passengers per square meter of bus (EMBARQ, 2009). The inability of buses to load more passengers and thus leave customers stranded at stations during peak periods has sparked riots and blemished TransMilenio’s reputation. Curitiba has also begun to experience the limits of rubber-‐tire technologies. With buses operating on 30 second intervals on main routes during the peak hour, bunching problems have disrupted and slowed services. Successions of closely spaced buses have increased operating costs and precluded the kinds of economies of scale enjoyed by trains operated by a single driver. Extreme overcrowding has prompted many former bus rides to buy cars and switch to driving. In the words of one urban planner: “Many Curitibanos view (BRT) as noisy, crowded and unsafe. Undermining the thinking behind the master plan, even those who live alongside the high-‐density rapid-‐bus corridors are buying cars“ (Lubow, 2007, p. M8). A long-‐discussed light rail line, to replace overcrowded buses, has yet to gain momentum due to cost concerns and political inertia (Duarte and Ultramari, 2012). Many earlier BRT systems were designed (in terms of overhead clearances, station platforms, track geometries) to allow conversion to electric rail services if and when market demand justified the change-‐over. This was so for Ottawa and Curitiba. Institutional and political impediments, however, have stood in the way of bus-‐to-‐rail conversions. Once bus-‐based organizations and institutions are in place, a status-‐quo mindset takes hold, obstructing technological conversions. 6.4 Net Welfare Impacts To pass judgments on the economic merits of BRT versus urban rail, the approach long used by economists is to conduct a benefit-‐cost analysis (BCA). Few credible BCAs studies of BRT versus rail have been conducted to date. A recent study by Hildalgo et al. (2013) tried to assign a net rate of return for Bogotá’s TransMilenio investment. The authors estimated that TransMilenio’s first two phases yielded sizable net economic benefits in terms of travel-‐time
30
times savings, reduced vehicle operating costs, fewer accidents, and health benefits from cleaner air. A benefit-‐cost ratio of 2.5 and a social internal rate of return of 24.2 percent were estimated. Accounting for redistributive effects (e.g., displacing old, loosely regulated buses to the urban periphery), Echeverry et al. (2005) estimated the net economic benefits of TransMilenio’s first two phases to be considerably less. Welfare economics aside, one unassailable advantage of BRT systems is that they can be introduced incrementally as different segments of a project are finished. This is because buses have the options of using regular streets until gaps in the system are completed. Fast implementation builds political support and public goodwill since elected officials and taxpayers alike quickly see benefits on the ground. 7. BRT and Urban Development One only has to look at the skylines of cities with world-‐class rail systems like New York City and Hong Kong to appreciate the powerful city-‐shaping influences of rail investments. Agglomerations of 200,000 or more workers in central business districts (CBDs) are impossible without rail systems for the simple reason that roadways are incapable of funneling this many people to jobs in concentrated areas during rush hours (Pushkarev and Zupan, 1977; Cervero, 1998). Some question the city-‐shaping potential of BRT, in part due to a belief it delivers fewer regional accessibility benefits than rail but also the social stigma some assign to bus-‐based forms of mass mobility. Doubt remains in the minds of some as to whether BRT can induce less car-‐dependent, more sustainable patterns of urban growth in rapidly motorizing and suburbanizing cities. While BRT is often conceived as being better suited to lower density, more outlying settings, under the right conditions, experiences show that BRT can also be every bit as influential as metrorail systems in inducing urban redevelopment and shaping urban growth in more sustainable formats. Bus-‐based systems are thought to have weaker city-‐shaping effects partly because they confer fewer regional accessibility benefits relative to faster, more geographically extensive rail operations (Vuchic, 2007). The absence of a fixed guideway or high-‐profile infrastructure is also thought to dilute bus-‐transit’s development potential in minds of real-‐estate developers, who never can be sure of the service features of future bus operations. Factors like the spewing of diesel emissions and the social stigma attached to transit-‐dependent (and thus often lower income) users also detract from bus-‐transit’s image. High-‐end BRT systems with exclusive lanes and clean-‐fuel buses, however, begins to mimic the service features of metrorail systems and correspondingly hold the potential to exert comparable impacts on urban form. Whether BRT can promote transit oriented development (TOD) —compact, mixed-‐use, pedestrian-‐friendly development organized around a transit station – on a significant scale, at
31
least comparable to what is found around some metrorail stations, remains an open question. TOD is widely viewed as an inherently efficient and sustainable urban form (Curtis et al., 2009). Experiences show that well-‐designed TOD not only increases ridership but also serves as a hub for organizing community development and revitalizing long-‐distressed urban districts (Bernick and Cervero 1997; Cervero 1998). Transit-‐oriented growth lies on a spectrum of built forms, with BRT well-‐positioned to occupy low-‐to-‐moderate density market niche of TOD (Dittmar and Poticha, 2003; Chen, 2010).
Empirical evidence on BRT’s city-‐shaping impacts is limited. Levinson et al. (2002) reported significant development activities around BRT stops in Pittsburgh, Ottawa, and Adelaide, however the absence of control or comparison sites confounded the ability to associate this growth to the presence of improved transit services. Land-‐price capitalization benefits of BRT investments have also be reported in Brisbane (Levinson et al., 2002), Los Angeles (Cervero, 2006), Pittsburgh (Perk and Catala, 2009), Boston (Kittelson & Associates and Levinson, 2007), Bogotá (Rodriquez and Targa, 2004; Rodriquez and Mojica, 2008; Munoz-‐Raskin, 2010), and Seoul (Cervero and Kang, 2011). In Los Angeles, land value impacts were very small and accrued only for commercial parcels (Cervero, 2006). A recent study in Beijing similarly found no appreciable capitalization benefits conferred on residential properties by the city’s BRT system; properties near the city’s metrorail system, on the other hand, averaged a price premium of 5 percent (Ma et al., 2013). In contrast, studies of the more substantial BRT system in Bogotá, Colombia have found appreciable land-‐value benefits (Rodriquez and Targa, 2004; Rodriquez and Mojica, 2008; Munoz-‐Raskin, 2010). There, multi-‐family housing units close to Bogotá’s TransMilenio BRT rented for more per square meter than units located farther away (Rodriguez and Targa, 2004). There is also some evidence that creating pedestrian-‐friendly environments near BRT bus stops can further increase land-‐value benefits (Estupinan and Rodriguez, 2008). Adding new BRT lines, moreover, benefitted properties on older corridors by improving regional access by BRT (Rodriquez and Mojica, 2008).
Ottawa and Curitiba are perhaps the best two global examples of “BRT TOD”. As BRT pioneers, city leaders carved visions early on in the planning of both systems to use BRT to channel growth along well-‐defined linear corridors (Cervero, 1998). In both instances, BRT was envisaged as not only a mobility investment but also an opportunity to shape urban growth in a more sustainable, transit-‐oriented format (Suzuki et al., 2013). Local governments proactively leveraged TOD through zoning reforms, pro-‐development tax policies, assistance with land assemblage, and supportive infrastructure investments (Cervero, 1998). In Curitiba, local government mandated that all medium-‐ and large-‐scale urban development be sited along a BRT corridor. Orchestrating regional growth has been the Institute for Research and Urban Planning (IPPUC), an independent entity charged with ensuring integration of all elements of urban growth.
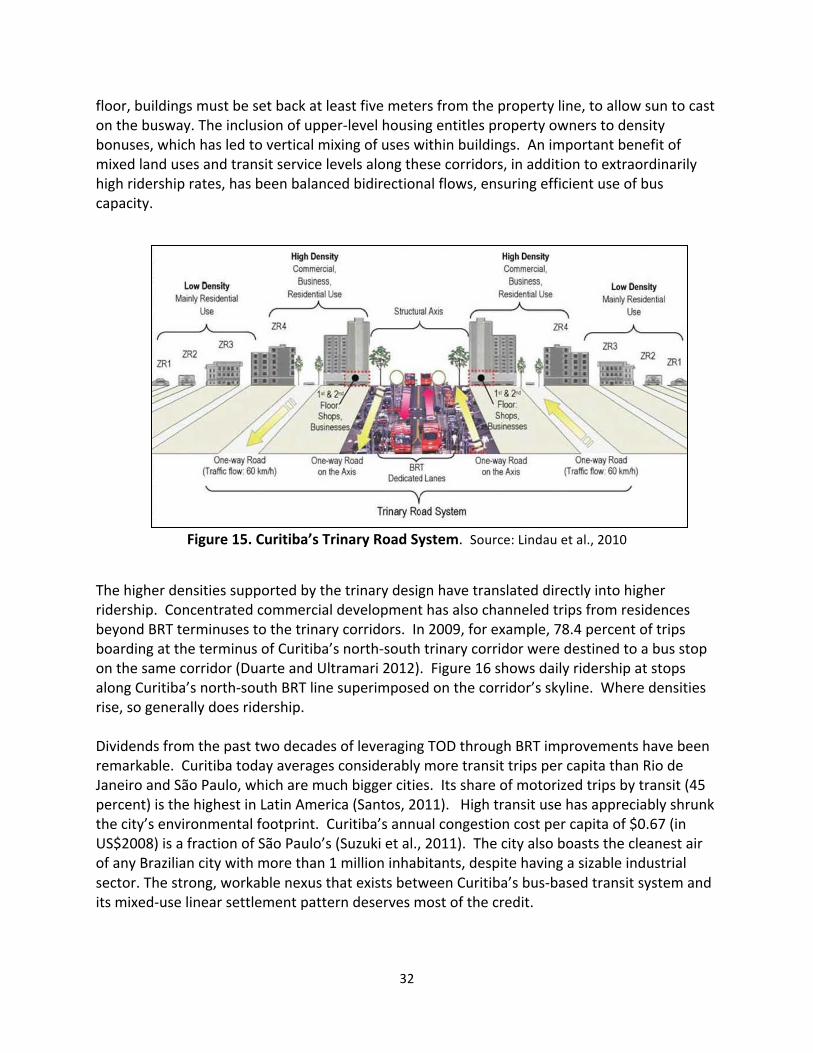
A design element used to enhance transit accessibility in Curitiba was the “trinary” (Figure 15) —three parallel roadways with compatible land uses and building heights that taper with distance from the BRT corridor. The first two floors of the busway, which do not count against permissible plot ratios (building height/land area), are slated for retail uses. Above the second
32
floor, buildings must be set back at least five meters from the property line, to allow sun to cast on the busway. The inclusion of upper-‐level housing entitles property owners to density bonuses, which has led to vertical mixing of uses within buildings. An important benefit of mixed land uses and transit service levels along these corridors, in addition to extraordinarily high ridership rates, has been balanced bidirectional flows, ensuring efficient use of bus capacity.
Figure 15. Curitiba’s Trinary Road System. Source: Lindau et al., 2010
The higher densities supported by the trinary design have translated directly into higher ridership. Concentrated commercial development has also channeled trips from residences beyond BRT terminuses to the trinary corridors. In 2009, for example, 78.4 percent of trips boarding at the terminus of Curitiba’s north-‐south trinary corridor were destined to a bus stop on the same corridor (Duarte and Ultramari 2012). Figure 16 shows daily ridership at stops along Curitiba’s north-‐south BRT line superimposed on the corridor’s skyline. Where densities rise, so generally does ridership. Dividends from the past two decades of leveraging TOD through BRT improvements have been remarkable. Curitiba today averages considerably more transit trips per capita than Rio de Janeiro and São Paulo, which are much bigger cities. Its share of motorized trips by transit (45 percent) is the highest in Latin America (Santos, 2011). High transit use has appreciably shrunk the city’s environmental footprint. Curitiba’s annual congestion cost per capita of $0.67 (in US$2008) is a fraction of São Paulo’s (Suzuki et al., 2011). The city also boasts the cleanest air of any Brazilian city with more than 1 million inhabitants, despite having a sizable industrial sector. The strong, workable nexus that exists between Curitiba’s bus-‐based transit system and its mixed-‐use linear settlement pattern deserves most of the credit.
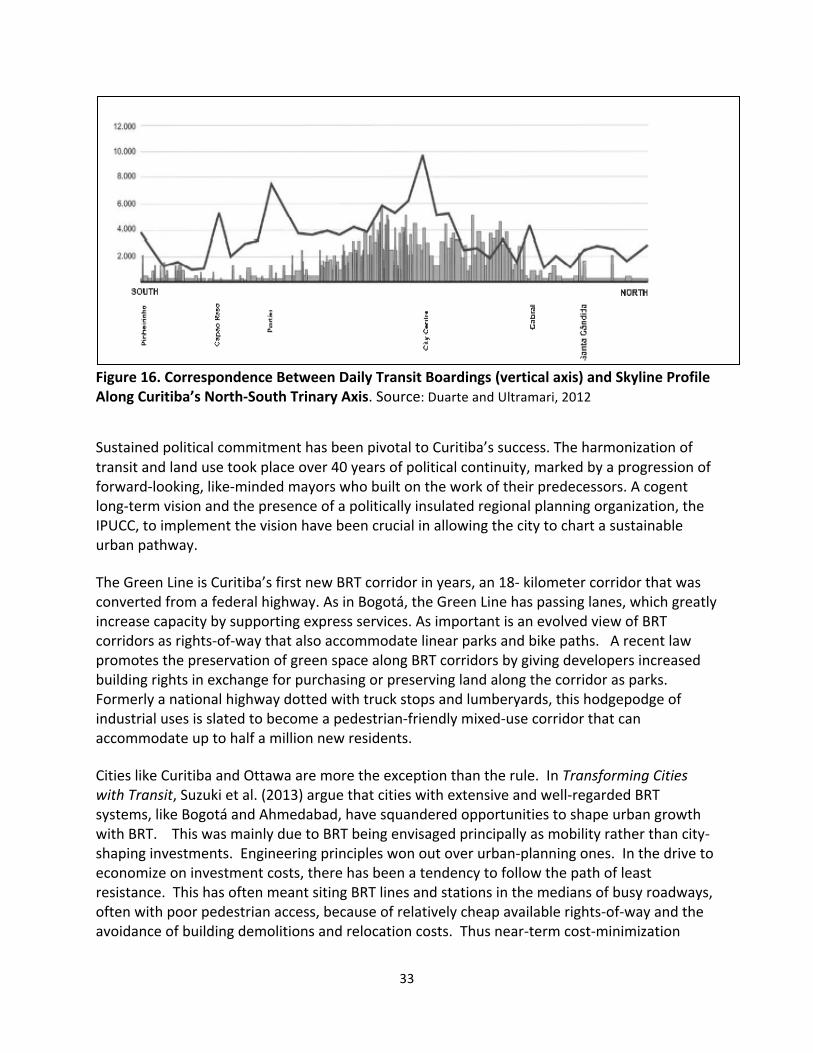
33
Figure 16. Correspondence Between Daily Transit Boardings (vertical axis) and Skyline Profile Along Curitiba’s North-‐South Trinary Axis. Source: Duarte and Ultramari, 2012
Sustained political commitment has been pivotal to Curitiba’s success. The harmonization of transit and land use took place over 40 years of political continuity, marked by a progression of forward-‐looking, like-‐minded mayors who built on the work of their predecessors. A cogent long-‐term vision and the presence of a politically insulated regional planning organization, the IPUCC, to implement the vision have been crucial in allowing the city to chart a sustainable urban pathway. The Green Line is Curitiba’s first new BRT corridor in years, an 18-‐ kilometer corridor that was converted from a federal highway. As in Bogotá, the Green Line has passing lanes, which greatly increase capacity by supporting express services. As important is an evolved view of BRT corridors as rights-‐of-‐way that also accommodate linear parks and bike paths. A recent law promotes the preservation of green space along BRT corridors by giving developers increased building rights in exchange for purchasing or preserving land along the corridor as parks. Formerly a national highway dotted with truck stops and lumberyards, this hodgepodge of industrial uses is slated to become a pedestrian-‐friendly mixed-‐use corridor that can accommodate up to half a million new residents. Cities like Curitiba and Ottawa are more the exception than the rule. In Transforming Cities with Transit, Suzuki et al. (2013) argue that cities with extensive and well-‐regarded BRT systems, like Bogotá and Ahmedabad, have squandered opportunities to shape urban growth with BRT. This was mainly due to BRT being envisaged principally as mobility rather than city-‐shaping investments. Engineering principles won out over urban-‐planning ones. In the drive to economize on investment costs, there has been a tendency to follow the path of least resistance. This has often meant siting BRT lines and stations in the medians of busy roadways, often with poor pedestrian access, because of relatively cheap available rights-‐of-‐way and the avoidance of building demolitions and relocation costs. Thus near-‐term cost-‐minimization
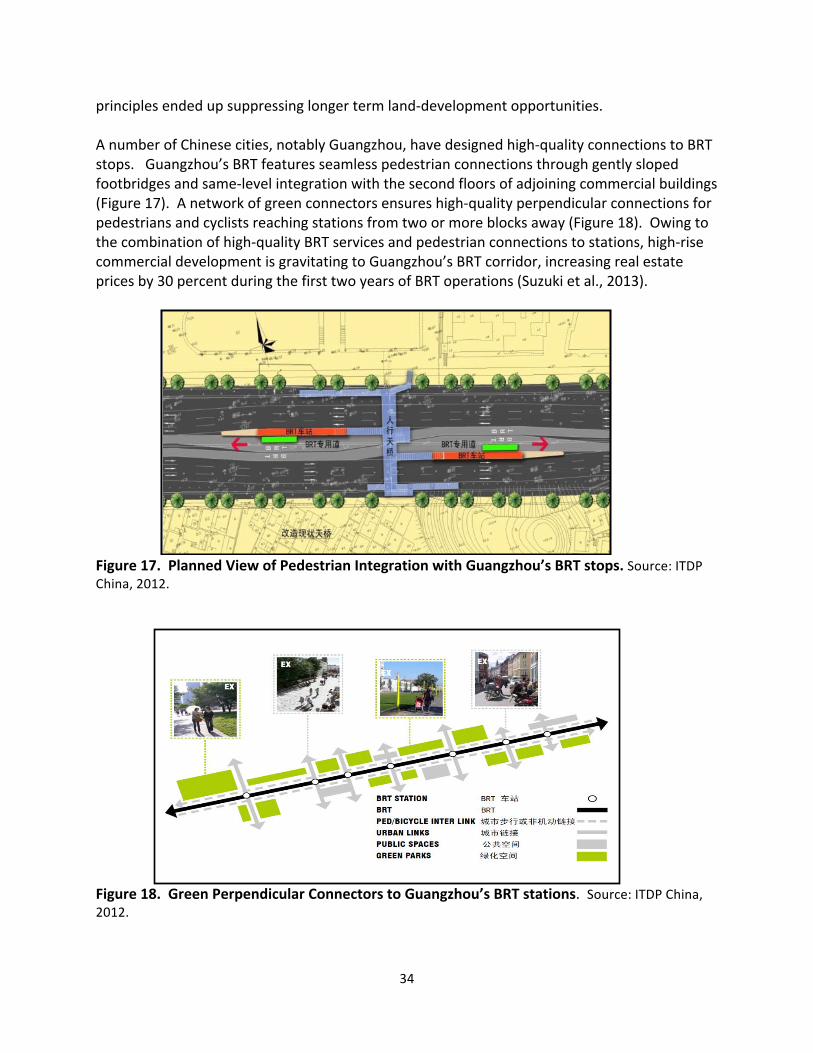
34
principles ended up suppressing longer term land-‐development opportunities. A number of Chinese cities, notably Guangzhou, have designed high-‐quality connections to BRT stops. Guangzhou’s BRT features seamless pedestrian connections through gently sloped footbridges and same-‐level integration with the second floors of adjoining commercial buildings (Figure 17). A network of green connectors ensures high-‐quality perpendicular connections for pedestrians and cyclists reaching stations from two or more blocks away (Figure 18). Owing to the combination of high-‐quality BRT services and pedestrian connections to stations, high-‐rise commercial development is gravitating to Guangzhou’s BRT corridor, increasing real estate prices by 30 percent during the first two years of BRT operations (Suzuki et al., 2013).
Figure 17. Planned View of Pedestrian Integration with Guangzhou’s BRT stops. Source: ITDP China, 2012.
Figure 18. Green Perpendicular Connectors to Guangzhou’s BRT stations. Source: ITDP China, 2012.
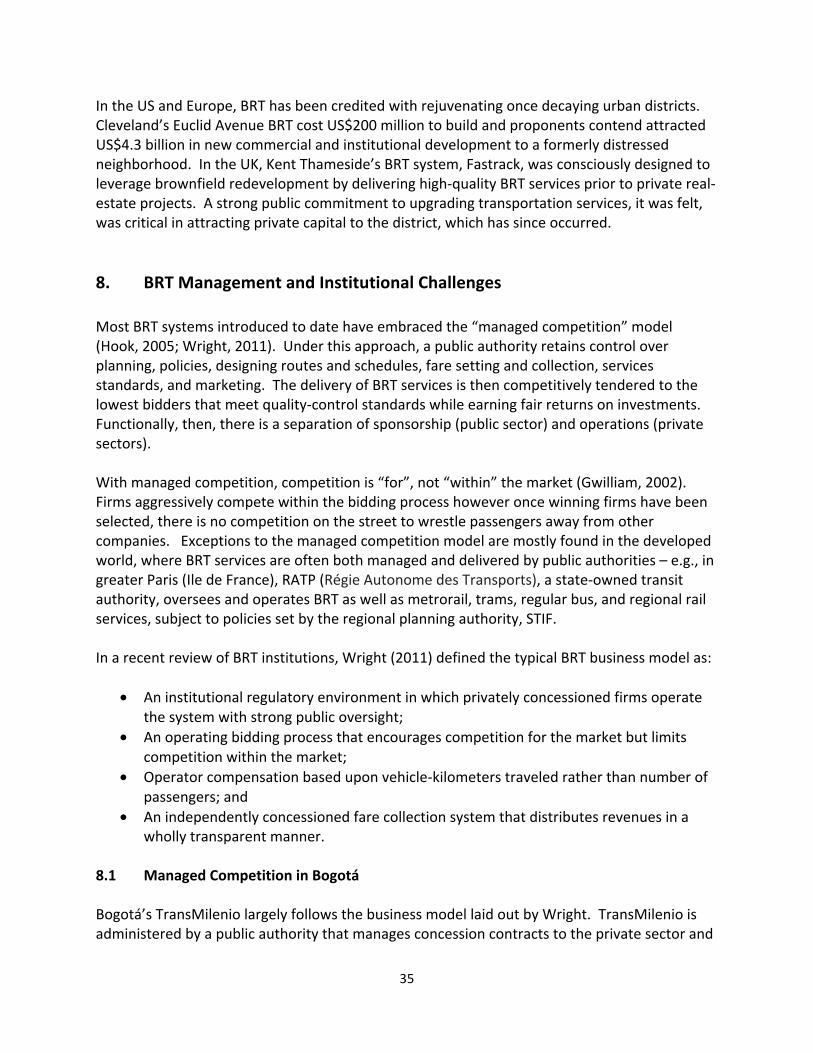
35
In the US and Europe, BRT has been credited with rejuvenating once decaying urban districts. Cleveland’s Euclid Avenue BRT cost US$200 million to build and proponents contend attracted US$4.3 billion in new commercial and institutional development to a formerly distressed neighborhood. In the UK, Kent Thameside’s BRT system, Fastrack, was consciously designed to leverage brownfield redevelopment by delivering high-‐quality BRT services prior to private real-‐estate projects. A strong public commitment to upgrading transportation services, it was felt, was critical in attracting private capital to the district, which has since occurred. 8. BRT Management and Institutional Challenges Most BRT systems introduced to date have embraced the “managed competition” model (Hook, 2005; Wright, 2011). Under this approach, a public authority retains control over planning, policies, designing routes and schedules, fare setting and collection, services standards, and marketing. The delivery of BRT services is then competitively tendered to the lowest bidders that meet quality-‐control standards while earning fair returns on investments. Functionally, then, there is a separation of sponsorship (public sector) and operations (private sectors). With managed competition, competition is “for”, not “within” the market (Gwilliam, 2002). Firms aggressively compete within the bidding process however once winning firms have been selected, there is no competition on the street to wrestle passengers away from other companies. Exceptions to the managed competition model are mostly found in the developed world, where BRT services are often both managed and delivered by public authorities – e.g., in greater Paris (Ile de France), RATP (Régie Autonome des Transports), a state-‐owned transit authority, oversees and operates BRT as well as metrorail, trams, regular bus, and regional rail services, subject to policies set by the regional planning authority, STIF. In a recent review of BRT institutions, Wright (2011) defined the typical BRT business model as:
• An institutional regulatory environment in which privately concessioned firms operate the system with strong public oversight;
• An operating bidding process that encourages competition for the market but limits competition within the market;
• Operator compensation based upon vehicle-‐kilometers traveled rather than number of passengers; and
• An independently concessioned fare collection system that distributes revenues in a wholly transparent manner.
8.1 Managed Competition in Bogotá Bogotá’s TransMilenio largely follows the business model laid out by Wright. TransMilenio is administered by a public authority that manages concession contracts to the private sector and
36
oversees service quality. A series of concessions and standard contracts establish the relationship with each private-‐sector party, which includes construction firms, an independent fare collection company, and bus operators. Institutionally, then, facility construction, fare administration, and operations are functionally separated. In reality, some competition within the BRT marketplace exists even in Bogotá. TransMilenio has as many as four different operators providing services on the same BRT route. From the customer’s perspective, all vehicles and services look the same. A control center monitors vehicles to ensure suitable headways and frequencies. Fare transaction information is relayed to computers at both public companies and private operators, creating fully transparent sharing of revenue information.
The bidding process is a critical part of successful managed competition. Bogotá uses a point system that incentivizes firms to be cost-‐effective, invest prudently, and operate clean vehicles. This has helped modernize the city’s bus fleet. In phase II of TransMilenio, firms scrapped 9 older vehicles for every new articulated bus introduced (Wright 2011). TransMilenio has also managed to assuage private operators who were reticent to join their ranks. Including existing small operators in a bid, for example, gains firms additional points. This avoids alienating and creating ill-‐will among incumbent operators, and ensures their experience with operating in the streets of Bogotá is not wasted.
Tying income to service deployed rather than numbers of passenger carried has also curbed the kind of aggressive competition that plagues informal transit services throughout the developing world (Cervero and Golob, 2011). Paying operators based on kilometers of service deployed in conjunction with performance-‐based incentives (e.g., on-‐time services) shifts the focus to service quality. There are also strictly enforced sanctions. In Bogotá, operators are fined as much as 10 percent of their monthly income for failing to meet service standards. This is done by reducing future kilometers of services for operators guilty of infractions. For example, picking up passengers at stops other than stations or alteration of the GPS communications system costs TransMilenio operators 250 kilometers. As a double incentive, the best-‐performing companies are awarded the vehicle-‐kilometers surrendered by the penalized firms. This service-‐based penalty-‐reward system has allowed TransMilenio to be one of the most cost-‐effective BRT operators worldwide (Hildalgo et al., 2013). Other BRT cities that similarly pay private firms by bus kilometers rather than passengers include Curitiba, Jakarta, Johannesburg, Guangzhou, and Leon. 8.2 Other BRT Institutional Experiences Other large-‐scale BRT systems that have adopted Bogotá’s institutional approach – i.e., a BRT authority responsible for planning and control of the system and competitively tendered operations and concessions -‐-‐ include Ahmedabad, Guangzhou, Jakarta, Mexico City, and Cali. Ahmedabad launched its Janmarg (People’s Way) system in 2009 according to both design and organization specifications of TransMilenio, with a few twists. The Ahmedabad Municipal Corporation (AMC) developed the initial proposal for BRT and remains the chief authority for
37
the system, responsible for setting policies, rules, and regulations, and correspondingly ensuring the system’s financial solvency. System design and implementation is led by an independent entity -‐-‐ CEPT University in Ahmedabad – whose charge was to build a safe, efficient, and cost-‐effective system. State and national departments served on a steering committee to oversee the project development and provide financial support. The Ahmedabad Janmarg Limited (AJL) was created by local and state as a special-‐purpose and independent agency with operating authority, responsible for overseeing operations, achieving performance standards, and maintaining financial sustainability. Other functions have been strategically outsourced to maximize efficiency. Bus operations and fare collection are competitively bid on a gross-‐cost per kilometer basis over a seven-‐year contract period. Incentives and penalties have been set and are enforced regarding fleet maintenance, vehicle fitness, and cleanliness (Rizvi, 2011; Tiwari and Jain, 2010). One notable institutional failure is the Transantiago BRT project in the Chilean capital. Prior to Transantiago’s opening in 2007, transit was controlled by a cartel of small private operators that worked in a mostly unregulated market (Boncompte and Galilea, 2013). To incentivize incumbent operators to join the BRT system, public authorizes minimized risks, guaranteeing up to 90 percent of operators’ income. In one day, Transantiago changed from a helter-‐skelter mix of private minibus operators to a publicly sponsored trunk-‐feeder system with completely new services, routes, and often buses, with virtually no risk to former private operators. Because of guaranteed subsidies, however, the market discipline to deliver high-‐quality services disappeared. A series of problems immediately surfaced: insufficient supply of buses, poor route definition, unfinished infrastructure, breach of contracts, and failure of vehicle-‐control and payment systems. Service quality rapidly deteriorated – long waits, excessive numbers of transfers, severe overcrowding, and inability to get to desired destinations. Regulators eventually reduced income guarantees and began imposing fines and sanctions. A give-‐and-‐take series of intense negotiations has over time allowed a reasonably workable mix of risk-‐sharing and accountability among private and public interests to take form. Transantiago service quality and reliability has since improved. According to Jiron (2011), problems as in Santiago can be traced to such institutional shortcomings as a weak transportation authority, poor management and accountability, and insufficient fiscal resources to mount and sustain services. Another case where the jury is still out about managed competition is Quito, Ecuador. Quito’s BRT system was given over to a consortium of private operators that run buses and handle fares. BRT buses share corridors with incumbent private operators, creating in-‐market competition and redundancies. Local government provides loans to the private consortium to acquire new buses, contingent on repayment once the system achieves financial stability and profitability (Boncompte and Galilea, 2013). With the consortium handling all fare transactions, authorities are unable to assess the system’s financial status. Operators claim they have yet to achieve profits thus so far, government loans have not been repaid. In close, managed competition of BRT has for the most part allowed cost-‐effective services to be delivered. Bogotá as well as a handful of other BRT cities (Curitiba, Guayaquil, Lanzhou)
38
require no government operating subsidies partly as a result. A side-‐benefit of a wholesale switch to BRT services is that it allows for an institutional shake-‐up. While traditional bus services are difficult to reform because of incumbent operators resist efforts to increase competition, inauguration of a wholly new type of transit, BRT, provides the political opportunity to introduce meaningful institutional reforms (Wright, 2011). 9. Conclusion The future for BRT is bright. Rapid motorization and ever-‐worsening traffic conditions in many rapidly emerging economies and fast-‐growing cities make investments in high-‐capacity, high-‐performance transit systems more imperative than ever. Mounting concerns over the long-‐term environmental and fiscal impacts of car-‐dependent sprawl combined with global initiatives to dramatically curb carbon emissions further favor a world of expanded transit services. The bulk of future population growth throughout the 21st century will be in settings conducive to BRT. According to UN Habitat (2011), most of the 2 billion new urban dwellers between now and 2030 will be in cities with populations of 100,000 to 500,000. In these places, less-‐expensive BRT networks are likely to be more cost-‐effective than metros or LRT systems. Even in more mature, advanced economies, budget constraints along with continuing growth on the urban fringes favors BRT over urban rail. For large metropolitan areas, the choice between BRT and urban rail is fortunately not either-‐or. In cities as diverse as Beijing, Los Angeles, Teheran, Delhi, Seoul, and Mexico City, BRT and metrorail systems nicely co-‐exist. BRT can be both a complement to and a substitute for rail. As cities, households structures, neighborhood designs, societal values, and lifestyle choices continue to diversify, a more plural transportation landscape – one that provides a rich set of mobility options at a range of price points – is needed. BRT stands poised to add to the mix of mobility choices over a wide range of urban contexts throughout the 21st century. Rail versus bus is increasingly a false dichotomy. Less important than the physical apparatus – whether rubber-‐tires on pavement or steel-‐wheel-‐on-‐steel-‐rail – is the quality of service delivered. In this regard, BRT gets high marks. Its versatility at linking feeder and line-‐haul services in the same vehicle, and thus eliminating transfers, makes it particularly well suited for lower-‐density settings. As existing BRT systems expand, moreover, mobility and environmental benefits can be expected to accelerate due to network effects. Each new BRT line benefits not only those living, working, and traveling to the newly served corridor but also to residents and workers on existing corridors that can now reach new destinations. As an industry, BRT is hardly static. As the BRT matures, new trends are emerging. These include: service and tariff integration of BRT with citywide transit services, better ways of eliciting private participation in operations, increased funding support from national governments, BRT-‐oriented land development, and the growth of bus manufacturers and technology-‐providers from Brazil, India, Indonesia, and China (Suzuki et al., 2013; Hidago and Gutiérrez, 2013).
39
One thing that successful BRT cities like Bogotá, Curitiba, and Seoul share in common is a legacy of strong and visionary political leadership. Cities that have failed to deliver the high-‐quality BRT services originally envisaged, such as Jakarta, Lagos, and Santiago, fell short mainly because of political pressures to retain the status quo. In Jakarta’s first phase, the lack of integration between trunk and feeder vehicles and unwillingness to prevent incumbent operators to run alongside BRT buses, undermined service quality (Wright, 2011). “Ultimately, the obstacles to BRT development are more likely to be political than financial or technical. However, for the few political leaders who take the chance to redefine their cities with full BRT, the rewards are clear” (Wright, 2011, p. 454). References Angel, S. 2011. Making room for a planet of cities. Cambridge, Massachusetts: Lincoln Institute of Land Policy. Bernick, M. and Cervero, R. 1997. Transit villages for the 21st century. New York: Mc-‐Graw Hill. Boncompte, J. and Galilea, P. 2013. Identification of key factors in the design and implementation of BRT systems in developing countries. Paper presented at the13th World Conference on Transportation Research, Rio de Janeiro, Brazil, July. BRTDATA.ORG. Accessed July 24-‐25, 2013. Cain, A., Flynn, J., McCourt, M., and Reyes, T. 2009. Quantifying the importance of image and perception to Bus Rapid Transit. Washington, DC: Federal Transit Administration, US Department of Transportation, Demonstration and Innovations. Cervero, R. 1998. The transit metropolis: a global inquiry. Washington, D.C.: Island Press. Cervero, R. 2005. Progressive transport and the poor: Bogotá's bold steps forward. Access, No. 27, pp. 24-‐30. Cervero, R. 2006. The property value case for transit. Developing Around Transit: Strategies and Solutions That Work, R. Dunphy et al., eds. Washington, DC: Urban Land Institute. Cervero, R. 2011. State roles in providing affordable mass transport services for Low-‐Income Residents. Paris: Organization for Economic Development/International Transport Forum, Discussion Paper 2011-‐17.
Cervero, R. and Murakami, J. 2010. Effects of built Environments on vehicle miles traveled: evidence from 370 U.S. metropolitan areas, Environment and Planning A, Vol. 42, pp. 400-‐418.
40
Cervero, R., Murakami, J., and Miller, M. 2010. Direct ridership model of bus rapid transit in Los Angeles county, Transportation Research Record, Vol. 2145, pp. 1-‐7.
Cervero, R. and Golob, A. 2011. Informal public transport: a global perspective. In: Urban Transport in the Developing World: A Handbook of Policy and Practice, H. Dimitriou and R. Gakenheimer, eds. Cheltenham UK: Edward Elgar, pp. 488-‐518. Cervero, R. and Kang, C. 2011. Bus rapid transit impacts on land uses and land values in Seoul, Korea. Transport Policy, Vol. 18, pp. 102-‐116. Chen, X. 2010. Prospect of the transit-‐oriented development in China, Management Research and Practice, Vol. 2, No. 1, pp. 83-‐983. CHINABRT.ORG. ITDP China, Institute for Transportation & Development Policy, Guangzhou, China. Accessed data July 24-‐25, 2013. Currie, G. 2006. Bus transit oriented development: strengths and weaknesses relative to rail. Journal of Public Tranpsortation, Vol. 9, No. 4, pp. 1-‐21. Curtis, C., Renne, J., and Bertolini, L. 2009. Transit oriented development: making it happen. Surrey, UK: Ashgat. Delgado, H. and Uniman, D. 2011. Analysis de distribucion de impacts: costs y beneficios – application Metrobus – Line 3, Centro de Transporte Sustentable de Mesico. Presented at the VII Sustainable Transport Congress, Mexico City. Deng, T. and Nelson, J. 2011. Recent developments in bus rapid yransit: a review of the literature. Transport Reviews, Vol. 31, No. 1, pp. 69-‐96. Dittmar, H. and Ohland, G. 2003. The new transit town: best practices in transit-‐oriented development. Washington, DC: Island Press. Duarte, F. and Ultramari, C. 2012. Making public transport and housing match: accomplishments and failures of Curitiba's BRT, Journal of Urban Planning and Development, Vol. 138, No. 2, pp. 183-‐194. Duarte, F. and Rojas, F. 2012. Intermodal connectivity to BRT: a comparative analysis of Bogotá and Curitiba. Journal of Public Transportation, vol. 15, no. 2, pp. 1-‐18. Duduta, N., Adriazola-‐Steli, C., Hildalgo, D., Lindau, L; and Santos, P. 2013. The relationship between safety, capacity, and operating speed on bus rapid transit. Paper presented at the13th World Conference on Transportation Research, Rio de Janeiro, Brazil, July.
41
Echeverry, J., Ibáñex, A., Myoa, A. and Hillón, J. 2005. The economics of TransMilenio: a mass transit system for Bogotá. Economia, Spring. EMBARQ. 2009. Evaluación ex-‐post sistema de transport masivo de Bogotá: Fases I y I. Washington, D.C. Estupinan, N. and Rodriquez, D. 2008. The relationship between urban form and station boardings for Bogota’s BRT’, Transportation Research A, Vol. 42, pp. 296-‐306. Ewing, R. and Cervero, R. 2010. Travel and the built environment: a meta-‐analysis, Journal of the American Planning Association, Vol. 76, No. 3, pp. 265-‐294. Foster, A. 2011. Waiting is finally over for the longest busway in the world. Bus Rapid Transit Has Arrived: A Review of Key Developments 2011/2012, Landor Links, BRTuk, pp. 23-‐24. Flyvbjerg, B., N. Bruzelius, and B. van Wee (2008) Comparison of capital costs per route-‐kilometre in urban rail. European Journal of Transportation and Infrastructure Research, vol. 8, no. 1, pp.17-‐30. Gilbert, A. 2008. Bus rapid transit: Is Transmilenio a miracle cure? Transport Reviews, Vol. 28, No. 4, pp. 439-‐467. Guerra, E. and R. Cervero. 201. Cost of a ride: the effects of densities on fixed-‐guideway transit ridership and costs, Journal of the American Planning Association vol. 77, no. 3, pp. 27-‐290. Gwilliam, K. 2002. Cities on the move. Washington, D.C.: The International Bank for Reconstruction and Development/The World Bank, A World Bank Transport Strategy Review. Hensher, D. and Golob, T. 2008. Bus rapid transit systems: a comparative assessment. Transportation Vol. 35, No. 4, pp. 501-‐518. Hildalgo, D. and Yepes, T. 2005. Are bus rapid transit systems effective in poverty reduction? Economist Intelligent Unit. 2010. Liveanomics: urban liveability and economic growth. http://www.managementthinking.eiu.com/liveanomics.html. Accessed June 25, 2013. Hildalgo, D. and Graftieaux, P. 2008. Bus rapid transit systems in Latin America and Asia: results and difficulties in 11 cities. Transportation Research Record, Vol. 2072, pp. 77-‐88. Hildalgo, F. and Carrigan, A. 2010. BRT in Latin America: high capacity and performance, rapid iImplementation and low cost. Built Environment, Vol. 36, No. 3, pp. 283-‐297. Hidago, D. and Gutiérrez, L. 2013. BRT and BHLS around the world: explosive growth, large positive impacts and many issues outstanding. Research in Transportation Economics, Vol. 39, N0. 1, pp. 8-‐13.
42
Hildalgo, D., Pereira, L., Estupiñán, N., and Jiménez, P. 2013. TransMilenio BRT system in Bogotá: high-‐performance and positive impacts; main results of an ex-‐post evaluation. Research in Transportation Economics, Vol. 39, No. 1, pp. 133-‐138. Hook, W. 2005. Institutional and regulatory options for BRT in developing countries: lessons from international experiences. Transportation Research Record 1939, pp. 184-‐191. Hossain, M. 2006. The issues and realities of BRT planning initiatives in developing Asian cities. Journal of Public Transportation, Vol 9, No. 4, pp. 69-‐87. IEA (International Energy Agency). 2013. Global land transport infrastructure requirement: estimating road and railway infrastructure capacity and costs to 2050. Paris: OECD/IEA. ITDB (Institute for Transportation & Development Policy), ClimateWorks Foundation, Deutsche Gesellschaft für Internationale Zusammenarbeit (GIZ), International Council on Clean Transportation, and Rockefeller Foundation. 2013. The BRT standard 2013. New York. ITP (Integrated Transport Planning Ltd) and IBIS Transport Consultants Ltd. 2009. Lagos BRT-‐Lite: Africa’s first Bus Rapid Transit scheme: scheme evaluation and summary report. Jaramillo, C., Lizárraga, C., and Grindlay, A. 2012. Spatial disparity in transport social needs and public transport provision in Santiago de Cali, Colombia. Journal of Transport Geography, Vol. 2, pp. 340-‐357. Jiron, P. 2011. Sustainable urban mobility in Latin America and the Caribbean. Nairobi: UN Habitat, Nairobi. http://www.unhabitat.org/grhs/2013. Kantor, D., Moscoe, G. , and Henke, C. 2006. Issues and technologies in level boarding strategies for BRT. Journal of Public Transportation, Vol. 9, No. 3, pp. 89-‐101. Kittelson & Associations, Inc. and Levinson, H. 2007. Bus Rapid Transit Practitioner’s Guide. Washington, DC: Transportation Research Board, TCRP Report 118. Levinson, H., Zimmerman, S., Clinger, J., and Gast, J. 2003. Bus Rapid Transit: Synthesis of case studies. Transportation Research Record 1841, pp. 1-‐11. Lleras, G. Bus Rapid Transit: Impacts on travel behavior in Bogotá. Cambridge, Massachusetts: Massachusetts Institute of Technology, Department of Urban Studies and Planning, master’s thesis. Lindau, L., Hildalgo, D. and Facchin, D. 2010. Bus Rapid Transit in Curitiba, Brazil: a look at the outcome after 35 Years of bus-‐oriented development. Transportation Research Record, Vol. 2193, pp. 17-‐27.
43
Lubow, A. 2007. The road to Curitiba. New York Times Magazine, May 20, pp. 4-‐6. Ma, L , Ye, R., Titheridge, H. 2013. Capitalization effects of rail transit and BRT on residential property values in a booming economy: evidence from Beijing. Paper presented at the13th World Conference on Transportation Research, Rio de Janeiro, Brazil, July. Menckhoff, G. 2005. Latin American experience with bus rapid transit. Melbourne: paper presented at World Bank Annual Meeting, Institute of Transportation Engineers. Available at: http://www.gobrt.org/Latin_American_Experience_with_Bus_Rapid_Transit.pdf. Munoz-‐Raskin, R. 2010. Walking accessibility to Bus Rapid Transit: does it affect property values? Transport Policy, Vol. 17, pp. 72-‐84. Peak, M., Henke, C., and Wnuk, L. 2005. Bus rapid transit ridership analysis. Washington, D.C.: U.S. Department of Transportation, Federal Transit Administration, Report FTA-‐CA-‐26-‐7068-‐2004.1. Penalosa, E. 2002. Urban transport and urban development: a different model. Berkeley: The Center for Latin American Studies, University of California, Berkeley. Perk, V. and Catala, M. 2009. Land use impacts of bus rapid transit: effects of BRT station proximity on property values along the Pittsburgh Martin Luther King, Jr. East Busway. Washington, DC: Federal Transit Administration, US Department of Transportation. Pirie, G. 2011. Sustainable urban mobility in ‘Anglophone’ Sub-‐Saharan Africa. Nairobi: UN Habitat, Nairobi. http://www.unhabitat.org/grhs/2013. Pourbaix, J. 2011. Towards a smart future for cities: urban transport scenarios for 2025’ Public Transport International, Vol., 3, pp. 8-‐10. Pushkarev, B. and Zupan, J. 1977. Public transportation and land use policy. Bloomington: Indiana University Press. Rambaud, F., Rabuel, S., and Crest, T. 2008. BHLS: The French BRT approach. Paris: Centre on Transport and Urbanism (Centru). Rizvi, A. 2011. Alternative approaches to economically sustainable mobility in India: comparing Ahmedabad Bus Rapid Transit and Dehli Metro Systems. Nairobi: UN-‐Habitat, case study prepared for sustainable urban mobility: global report on human settlements 2013; available from: www.unhabitat.org/grhs/2013. Rodriquez, D. and Targa, F. 2004. Value of accessibility to Bogota’s Bus Rapid Transit system, Transport Reviews, Vol. 24, No. 5, pp. 587-‐610.
44
Rodriquez, D. and Mojica, C. 2009. Capitalization of BRT network expansion effects into prices of non-‐expansion areas. Transportation Research A Vol. 43, pp. 560-‐571. Santos, E. 2011. Pioneer in BRT and urban pPlanning. Saarbrücken, Germany: Lambert Academic Press. Seoul Development Institute. 2005a. Toward better public transport. Seoul, Korea: Seoul Development Institute, Seoul Metropolitan Government. Suzuki, H., Dastur, A., Moffatt, S., Yabjuk, N. and Maryyama, H. 2010. Eco2 cities: ecological cities as economic cities. Washington, D.C.: The World Bank. Suzuki, H., Cervero, R. and Iuchi, K. 2013. Transforming cities with transit: transit and land-‐use integration for sustainable urban development. Washington, DC: World Bank. Tiwari, G. and Jain, D. 2010. Bus rapid transit projects in India cities: a status report. Built Environment, vol. 36, no. 3, pp. 353-‐362. Torres-‐Montoya, M. 2013. Tackling fare evasion in Transantiago: an integrated approach. Paper prepared for presentation at the 93rd annual meeting of the Transportation Research Board, Washington, DC, scheduled for January 2014. UN Habitat. 2011. Global report on human settlements 2011: Cities and Climate Change. Nairobi: UN Habitat. UN Habitat. 2012. Database on urban densities among global cities. Nairobi: UN Habitat. Proprietary data provided to the author. United States General Accounting Office. 2001 Bus Rapid Transit shows promise. Washington, DC: U.S. Congress, General Accounting Office, Report GAO-‐01-‐984. Venter, C., Hildalgo, D., Pineda, A. 2013. Assessing the equity impacts of bus rapid transit: emerging frameworks and evidence. Paper presented at the13th World Conference on Transportation Research, Rio de Janeiro, Brazil, July. Vincent, W. and Jerram, L. 2006. The potential for Bus Rapid Transit to reduce transportation-‐related CO2 emissions. Journal of Public Transportation, Vol. 9, No. 3, pp. 219-‐237. Vuchic, V. 2007. Urban transit systems and technology. New York: John Wiley. Wöhrnschimmel, J., Zuk, M, Martinez-‐Villa, G., Cerón, Cárdenas, B., and Rojas-‐Brancho. 2008. The impact of a bus rapid transit system on commuters’ exposure to benzene, CO, PM2.5, and
45
PM10 in Mexico City. Atmospheric Environment, Vol. 42, pp. 8194-‐8203. Wright, L. 2011. Bus rapid transit: a review of recent advances. Urban transport in the developing world: a handbook of policy and practice, H. Dimitriou and R. Gakenheimer, eds. Cheltenham, U.K.: Edgar Elgard, pp. 421-‐455. Wright, L. and Hook, W. 2007. Bus rapid transit planning guide. New York: Institute of Transportation & Development. Yang, J., Shen, A., Shen, J., and He, C. Transport impacts of clustered development in Beijing: Compact development versus overconcentration, Urban Studies, Vol. 49, No. 6, pp. 1315-‐1331. Yazici, M., Levinson, H., Ilicali, M., Camkesen, N., Kamga, C. 2013. A bus rapid transit line case study: Istanbul’s Metrobus system. Journal of Public Transportation, Vol. 16, No. 1, pp. 153-‐177. Zhang, M. 2009. Bus versus rail: meta-‐analysis of cost characteristics, carrying capacities, and land use impacts. Transportation Research Record, Vol. 2110, pp. 87-‐95.