Embed Size (px)
Citation preview
Bus Transit Operations Control: Review and an Experiment Involving Tri-Met’s
Automated Bus Dispatching System
James G. Strathman Thomas J. Kimpel Kenneth J. Dueker
Center for Urban Studies College of Urban and Public Affairs
Portland State University Portland, OR 97207
(503) 725-4069
Richard L. Gerhart Kenneth Turner David Griffin Steve Callas
Tri-Met 4012 S.E. 17th Ave. Portland, OR 97202
(503) 962-3000
Introduction
An operations plan contains information on the provision of transit service, including
intended service levels, vehicle availability, and driver schedules. Agency resources would be
utilized efficiently if the operations plan could be executed without disruptions in service. When
service disruptions occur, the aim of operations control is to optimize system performance given
the current state of the system (Wilson et al., 1992). This typically involves actions intended to
either return service to schedule or restore headways separating vehicles. Disruptions in service
impose costs on transit providers in the form of reduced productivity and on passengers in the
form of increased in-vehicle travel time, longer waiting time at stops, and greater uncertainty.
This paper has two overall purposes. First, it provides a review of operations control
principles and practices reported in the literature. Second, it reports the results of an operations
control experiment whose objective was to maintain headways, or the time separation between
buses on a route. The experiment was developed to explore a possible application of the
automated Bus Dispatching System (BDS) recently implemented by Tri-Met, the transit provider
for the Portland, Oregon, metropolitan region. The main components of Tri-Met’s BDS are as
follows:
• Automatic vehicle location (AVL) based upon global positioning system (GPS)
technology, supplemented by dead reckoning sensors;
• Voice and data communication within a pre-existing mobile radio system;
• On-board computer and a control head displaying schedule adherence to operators,
detection and reporting of schedule and route deviations to dispatchers, and two-way,
pre-programmed messaging between operators and dispatchers;
• Automatic passenger counter (APC) technology;
1
• Computer-aided dispatch (CAD) center.
The BDS recovers very detailed operating information in real-time, and thus enables the
use of a variety of control actions that would potentially yield substantial improvements in
service reliability. The growing deployment of BDS technology in the transit industry is timely,
given that worsening traffic congestion in most urban areas has made schedule adherence
increasingly difficult.
Operations Control Research
Overview
In order to understand how operations control can be effective in reducing variability in
system performance, it is first necessary to discuss the causes of unreliable service. Woodhull
(1987) classifies the causes of unreliable service according to whether they are internal
(endogenous) or external (exogenous) to the system. Exogenous causes include such factors as
traffic congestion and incidents, traffic signalization, and interference with on-street parking.
Endogenous causes include such factors as driver behavior, improper scheduling, route
configuration, variable passenger demand, and inter-bus effects. Turnquist and Blume (1980)
make a distinction between service planning and real-time control strategies. Service planning
strategies can address problems of a persistent nature through route restructuring and schedule
modification. This is in contrast to real-time control strategies, which focus on immediate
responses to sporadic service problems. Abkowitz (1978) suggests that there are three basic
methods to improve transit service reliability, categorized as priority, control, and operational.
2
Priority methods involve the special treatment of transit vehicles apart from general vehicular
traffic. Examples of this type of strategy are exclusive bus lanes and traffic signal prioritization.
Operational methods take place over a longer period of time and include such strategies as
schedule modification, route restructuring, and driver training. Control methods take place in
real-time and include vehicle holding, short-turning, stop skipping, and speed modification.
It is important to distinguish between low and high frequency service when discussing
operations control strategies. For routes characterized by long headways, schedule adherence is
the most important operations objective. Passengers will attempt to time their arrivals with that
of the bus based upon a given probability of missing the departure (Turnquist, 1978; Bowman
and Turnquist, 1981). In these circumstances average wait times are less than one-half of the
scheduled headway. Schedule adherence is also an important objective at timed transfer
locations. Alternatively, for routes that operate at headways of 10 minutes or less, headway
maintenance is the most important operations objective. This is because passengers do not find it
advantageous to time their arrivals with that of the schedule, and are thus assumed to arrive at
stops randomly. The aggregate wait time of passengers is minimized when buses are evenly
spaced on routes operating at high frequencies.
First Generation Operations Control Research
Early research on operations control involved the design and evaluation of vehicle
holding strategies. Most of the studies relied on either analytical or simulation techniques in the
absence of data on actual transit operations. A common thread in many of these early studies is
that the models were based upon rather restrictive assumptions. Osuna and Newell (1972)
developed a model to determine the amount of time needed to hold a bus in order to improve
3
service regularity. A hypothetical route was analyzed consisting of one stop and either one or
two vehicles. The objective of the model was to minimize the average wait time of passengers.
The authors concluded that control should be implemented following service deterioration rather
than in anticipation of a potential problem, and that control should be applied sparingly to
prevent service deterioration beyond a tolerable limit. Barnett and Kleitman (1973) developed a
model building on the research of Osuna and Newell. Their analysis involved a hypothetical bus
route with one vehicle and several stops. Vehicle holding was allowed at one of two possible
control points. The study sought to devise a holding strategy that would minimize the average
wait times of passengers. The authors concluded that holding was most effective when trips
returned unusually early, and that the location of the control point proved crucial. Barnett (1974)
later developed a more detailed model that analyzed a hypothetical multi-stop route with one
control point. The objective of the model was to determine the optimal interval at which
vehicles should be dispatched from a control point. The problem attempted to minimize
aggregate passenger wait time relative to holding costs imposed on passengers already on board
the vehicle. The optimal strategy was dependent upon the mean and variance of the headway
distribution, the ratio of passengers on board the bus at the control point to those waiting
downstream, and the correlation between successive vehicle arrival times at the control point.
Bly and Jackson (1974) designed a simulation model that looked at the effects of holding buses
at a control point until a threshold headway was reached. Under a threshold-based holding
strategy, an early bus is held until the preceding headway reaches a prescribed value. The results
of the study showed that holding resulted in reduced passenger wait times at the expense of
longer running times. Koffman (1978) developed a simulation model analyzing four different
control strategies for a simplified bus route. The strategies consisted of holding, stop skipping,
4
priority signalization, and reducing dispatching uncertainty. The model is noteworthy in that it
took into account traffic signalization, different boarding and alighting rates, acceleration/
deceleration delay, and variable passenger demand. Similar to the finding by Bly and Jackson,
Koffman concluded that holding produced very small improvements in wait times at the expense
of longer passenger travel times. Turnquist and Blume (1980) developed a set of equations
seeking to determine upper and lower bounds on the expected benefits of threshold-based
holding. They showed that the optimal control point along a route is located where relatively
few passengers are on board the vehicle and many are waiting at subsequent stops. The authors
point out that control should be implemented as early along the route as possible because
headway variability tends to increase with running time. An important result of the study was
that the authors discovered cases where headway control was unlikely to produce benefits and
could actually prove detrimental to transit operations.
The general contribution of the first generation of operations control studies can be
summarized as follows:
• Holding imposes costs on passengers already on board vehicles in the form of increased
travel time.
• Holding imposes costs on transit providers in the form of increased running time.
• The selection of an appropriate control point is crucial for minimizing aggregate wait
times.
• Headway control is most effective when passenger loads at the control point are light and
demand immediately following the control point is heavy.
• Holding is most effective at reducing wait times at stops immediately following the
control point.
5
• Headway variability begins to increase again following control.
• Holding may prove detrimental to transit operations in some situations.
Second Generation Operations Control Research
The primary distinction between first and second generation operations control studies is
that the latter are empirically validated with data on actual transit operations. Turnquist and
Bowman (1980) developed a model using data from a bus route in Evanston, Illinois to address
schedule-based holding. Under a schedule-based holding, early vehicles are held to their
scheduled departure time. The authors found that schedule-based holding was an appropriate
control strategy for routes characterized by large headways. A study by Abkowitz and
Engelstein (1984) analyzed headway-based holding strategies in detail. The study employed a
simulation using data from Cincinnati, Ohio, with the results later validated with data from Los
Angeles, California. An algorithm was developed to identify the locations where the greatest
reductions in passenger wait times would occur for specific threshold headways. The authors
found that the optimal control point is sensitive to the ratio of passengers on board the bus to
those waiting downstream and that the main benefits of control are realized by passengers
immediately downstream from the control point. A later study by Abkowitz, Eiger, and
Engelstein (1986) found that headway variation does not increase linearly along a route, but
instead increases sharply at low values of running time variation, then tapers off once bunching
occurs.
Both schedule-based and headway-based holding were analyzed by Turnquist (1982) in a
report focusing on strategies to improve transit service reliability. The study was based on a
simulation later validated with data from Evanston, Illinois and Cincinnati, Ohio. The author
6
analyzed two types of headway control strategies. The "Single Headway" strategy requires
information about the current headway only and consists of holding a vehicle to the until the
scheduled headway is reached. The "Prefol" strategy, consists of holding a vehicle until the
preceding headway is as close as possible to the following headway. The Prefol strategy requires
more information than the Single Headway strategy in that prediction of the arrival time of
following vehicle is necessary. Turnquist found that the Single Headway strategy performs less
well than the Prefol strategy when vehicle arrivals are largely independent from one another. As
headways become more correlated, the effectiveness of the Single Headway strategy begins to
approach that of the Prefol strategy.
According to Turnquist (1982), the headway control strategy that would maximize wait
time savings would require that all headways be known in advance. Both the Single Headway
and Prefol strategies are near-optimal solutions in that they neglect to consider the effects of
holding on other vehicles serving the route. Turnquist found that the various holding strategies
are sensitive to three characteristics of the control point: 1) the current level of unreliability; 2)
the amount of correlation between successive headways, and 3) knowledge of the percentage of
passengers on board the bus at the control point relative to those downstream.
A study analyzing the benefits of operations control was undertaken for the MBTA Green
Line in Boston, Massachusetts by Wilson et al. (1992). Their study considered four types of
control actions: 1) holding; 2) short-turning; 3) expressing, and 4) deadheading. The major
operational problem on the Green Line consisted of headway variation. Field supervisors
implemented control actions based upon direct observation, communication, and intuition. The
authors found that some control actions actually increased aggregate passenger wait times, while
others were not implemented when justified. The reason for such a wide variation in the
7
effectiveness of operations control was attributed to the lack of timely information available to
field supervisors (Wilson at al, 1992). One of the more interesting aspects of the research was
that the authors developed a set of location and condition-specific decision rules for control
actions.
The study by Wilson et al. (1992) addressed several types of control actions that have not
been extensively addressed in the literature. For example, stop skipping is a strategy that
involves skipping one or more stops as a vehicle moves along a segment. Stop skipping serves
to reduce running time on the vehicle of interest while shortening its headway. In essence, this
represents a transformation from regular to limited service in real time. The benefits of stop
skipping are reduced running time on the vehicle of interest, shorter wait times for passengers
already on board the vehicle, and lower wait times for downstream passengers. These benefits
are at the expense of increased wait time for persons at stops that have been passed by and
passengers who are forced to alight early and take the next vehicle. The ideal scenario for stop
skipping is to have a long preceding headway, a short following headway, and high passenger
demand beyond the segment where skipping is implemented (e.g., on the vehicle’s subsequent
trip). Only two studies have analyzed stop skipping in detail, with one viewing it as a reasonable
control action and the other recommending that it be avoided completely because of adverse
effects on certain passengers (Wilson et al, 1992; Lin et al, 1995). A less disruptive variant of
stop skipping that avoids forcing passengers to alight early is to limit stops to drop-offs of on-
board passengers.
Short-turning involves turning a vehicle around before it reaches the route terminus, with
the goal of reducing headway variance in the opposite direction by filling in a large gap in
service. The ideal scenario for short-turning is to select bus with a light passenger load, a low
8
preceding headway, a low following headway, and a high headway further up the route (i.e., the
large gap). Similar to stop skipping, short-turning adversely affects passengers on board the
vehicle who are forced to alight and transfer to the subsequent bus. Short-turning primarily
benefits passengers traveling in the opposite direction because of reduced headway variation.
Deadheading is similar to expressing except that no passengers remain on board the vehicle. The
ideal scenario is to deadhead a vehicle where there is a long preceding headway and a short
following headway. One of the drawbacks to deadheading is that all passengers are forced to
alight at the control point, including some passengers who would have benefited from an
expressed trip. The practices of stop skipping, deadheading, and short-turning are not viewed as
desirable control actions by many transit agencies because they force passengers to transfer to
other vehicles, and they also degrade service for persons who are passed up.
Abkowitz and Lepofsky (1988) analyzed headway-based reliability control on two bus
routes in Boston, Massachusetts. Control was exercised on both routes during the a.m. period in
the inbound direction and on one route during the p.m. period in the outbound direction. Of the
three experiments, only one was found to significantly reduce headway variance and run time
variability. This proved to be a radial through route that intersected downtown. The study was
hampered by manual data collection problems and the failure of field supervisors to adhere to
holding instructions consistently. For the two experiments where control proved to be
ineffective, it was discovered that field supervisors were only holding a portion of the buses
when action was justified (Abkowitz and Lepofsky, 1988). This again highlights the fact that
human factors can reduce the effectiveness of headway control strategies if they are not
implemented properly. Although the results of this study were mixed, it is important in that it
9
sets the stage for evaluating context-specific control experiments based upon the use of actual
operations data.
Signal priority is a mechanism for reducing delays to transit vehicles at signalized
intersections. A number of researchers have found that signalized intersections are an important
contributor to unreliable service (Welding, 1957; Abkowitz and Engelstein, 1983). Signal
priority typically involves changing the phase of a signal to green or extending the duration of
the green phase when a bus approaches an intersection. While it is not the intent of this paper to
discuss signal control strategies in detail, it is important to note why this strategy is finding favor
within the transit community. In contrast to holding, which always causes delay to some
passengers and also results in increased running time, signal prioritization reduces running times
and decreases delay for all passengers (Khasnabis et al., 1999). However, signal prioritization
also imposes additional costs on general motor vehicle traffic, and it may also adversely affect
operations on intersecting bus routes. An optimal signal timing control system would
incorporate real-time information on transit operations and general traffic conditions, and would
be able to respond to changing operating conditions while minimizing disruptions to traffic flow
(Lin et al, 1995).
The relevance of the second generation studies of operations control can be summarized as
follows:
• Holding is likely to be more effective at earlier points along a route.
• Human factors play an important role in the success or failure of operations control
practices.
• Decision rules should be developed to assist field supervisors in making choices to
implement control or not.
10

• Control actions should be analyzed using data from actual transit operations.
• Short-turning, stop-skipping, and deadheading are second best solutions because
passengers are forced to transfer to other vehicles.
• Signal prioritization does not impose adverse costs on passengers or transit operators, but
does impose costs on general motor vehicle traffic and may impose costs on intersecting
bus routes.
The Next Generation Of Operations Control Research
Two areas that need further study are the evaluation of passenger waiting time and the
incorporation of vehicle seating capacity in operations control models. Previous studies have
assumed that the utility function for wait time is linear, implying, for example, that the disutility
of one 5 minute delay is equivalent to five 1 minute delays. Additionally, in-vehicle and out-of-
vehicle times have often been treated equally in evaluating the benefits of control. Research has
shown that travelers value time spent waiting at stops much higher than time spent in motion
(Kemp, 1973; Lago and Mayworm, 1981; Mohring et al., 1987). Incorporating different weights
for wait time and in-vehicle time will likely influence the identification of the optimal control
point location.
Another important aspect of headway-based reliability control concerns seating
availability. Abkowitz and Tozzi (1987) found this to be an important omission in previous
studies. This is because limited seating availability results in pass-ups whereby passengers are
forced to wait for a subsequent bus. The main issue is that passenger benefits may be incorrectly
determined, resulting in incorrect control actions being applied. The MBTA study by Wilson et
al (1992) is the only known analysis to take seating capacity constraints into account.
11
Automatic Passenger Counter (APC) technology has not been fully exploited for operations
control. This is because APC systems in North America do not produce reliable passenger
counts in real-time (Levinson, 1991). APC data are typically subject to a considerable amount of
post-processing before they are considered reliable enough for service planning and scheduling.
The ability to generate accurate passenger load information in real-time would provide decision
makers with one of the key parameters needed for estimating the potential benefits of control. In
order to develop estimates of the number of passengers waiting at downstream locations,
archived APC and operations data can be used to construct boarding and alighting profiles at
specific stops for specific trips.
Pilot projects are underway in Chicago and Paris for AVL systems that generate real-time
information on vehicle headways. A display connected to an on-board computer shows drivers
the amount of headway delay from the preceding bus. This system allows drivers to make small
changes in driving behavior in order to keep bunches from forming or becoming progressively
worse. This is an example of a preemptive strategy in that it does not wait for system instability
to set in before control decisions have to be made. This idea is consistent with Welding (1957),
who argues for the need to identify the onset of irregularity and the need to restore service to
normal as soon as possible, and also with Turnquist (1982), who argues that one of the purposes
of operations control is to keep bunches from forming in the first place.
It is noteworthy that schedule adherence, rather that headway regularity, is the dominant
operational objective on high frequency transit routes. This is somewhat perplexing given that
average wait times would be minimized if headway regularity were maintained. Both Welding
(1957) and Hundenski (1997) note that, in principle, schedules are largely irrelevant for routes
that operate at high frequencies. At San Francisco MUNI, schedules on certain routes were
12
disregarded in favor of a policy of headway maintenance. This approach was originally
supported by both operators and patrons, but was later discarded because subsequent checks
revealed that headways were not being maintained and that bunching still posed a problem.
Hundenski (1997) claims that these two problems stem from MUNI's high level of missed
service rather than flaws in the basic concept. This idea will likely surface again in the future as
advancements in real-time technologies make headway maintenance more feasible. One of the
main arguments against headway maintenance policies is that timed transfers must be met.
While it is probable that schedule adherence, as opposed to headway maintenance, would
minimize wait time for passengers at timed transfer points, this it has never been empirically
tested on routes operating at high frequencies. For uncoordinated transfers, it is likely that the
average wait time of transferring passengers would be reduced if buses were evenly spaced.
Additional research is needed to determine which policy would be more appropriate for
minimizing passenger wait times at transfer locations under different service frequencies.
• The immediate future of operations control practices can be summarized as follows:
• Incorporating distinct values of wait and in-vehicle times will produce more realistic
evaluations of the costs and benefits of operations control actions.
• Vehicle capacity constraints need to be included in models in order to fully capture
passenger wait time costs.
• Real-time APC technology will provide valuable information to decision makers on the
number of passengers on board vehicles likely to adversely affected by holding.
• Archived APC and operations data can be used to construct boarding and alighting
profiles at various locations to estimate the number of persons likely to be waiting at
downstream locations.
13
• Providing drivers with real-time headway information will allow for a passive form of
headway maintenance. Real-time vehicle headway information will also prove useful to
decision makers in deciding whether or not control is justified.
• For high frequency routes, it may prove beneficial to disregard schedule adherence
policies in favor of headway maintenance.
• Additional research should be undertaken in order to determine whether schedule
adherence or headway maintenance results in less wait time for passengers at transfer
points on high frequency routes.
Operations Control at Tri-Met
Following the recent implementation of its BDS, operators at Tri-Met are now aware of
schedule deviations from the “minutes late” display on their vehicle control head. When
possible, drivers modify vehicle speeds to better adhere to schedule. Another form of control
that is emerging in the wake of the new system is the practice by some field supervisors of
requesting recent BDS data to identify schedule deviation patterns, or “trouble spots.” Finally,
although dispatchers have not taken on regular responsibility for operations control, the pre-
programmed messaging feature of the new system has been heavily utilized. Both operators and
dispatchers have thus become better informed about operating problems in real time, and this has
most likely improved both dispatching and operating performance. Collectively, these changes
following the implementation of the BDS have contributed to improvements in on-time
performance and reductions in passenger travel time and bus running time (Strathman et al.,
2000).
14
Headway Control: An Experiment
Despite the initial improvements in reliability, delay problems continue to threaten
service quality. These problems are most pronounced for out-bound trips in the afternoon peak
period, when service frequencies are increased by the addition of extra service buses (known as
“trippers”). Aside from the normal challenges of maintaining service in a high frequency, heavy
traffic environment, the coordination of trippers with regular service buses is complicated by
traffic problems that trippers encounter in traveling to their staging points, which is compounded
by the disruptions that regular service buses experience on their prior in-bound trips. In
combination these problems frequently result in bus-bunching on out-bound trips, which negates
effective utilization of the added capacity.
There are several possible solutions to this bus-bunching problem. The first would be to
re-write schedules to expand layover times for regular service buses and to add staging time for
trippers, which would make schedule maintenance more feasible. No control action would be
required with this approach. But unless delay problems are recurrent, these adjustments will
shift resources from revenue to non-revenue service and will not be cost effective. Schedule
writers tend to be responsive to passenger and operator complaints about delays and thus, in the
absence of active operations control, schedule adjustments can be considered a default solution.
Alternatively, headways can be maintained by holding buses at the departure point. This
would not bring service back to schedule, but in short headway situations passengers tend to
arrive at stops randomly and the main objective should be to keep service evenly distributed to
respond to that passenger flow. Thus, holding buses to maintain headways is the focus of the
experiment described below.
15
There are two additional features that guided the design of the holding experiment. First,
Tri-Met coordinates its downtown service along directional, access-limited transit malls. Thus a
number of routes share the same departure point and traverse the malls. A single dedicated field
supervisor is therefore capable of controlling departures for multiple routes. Second, with the
BDS, a dispatcher can identify delays on in-bound trips and communicate this information to the
field supervisor. Communicating these delays allows the supervisor to employ Turnquist’s
(1982) “Prefol” strategy, or holding given buses to the mid-point of the time separating their
leader and follower. As a final consideration, given the expectation by the dispatcher that a
tripper or regular service bus will be delayed by more than the scheduled headway, the
supervisor can be alerted to send the other in its place. Consideration of this “switching” action
had to be factored into the design of the experiment, because some consecutive trips terminate at
different locations (e.g., due to short-lining or routing permutations).
A list of the routes and scheduled trips involved in the headway experiment is given in
Table 1. Nineteen regular service blocks and eleven trippers (identified in bold type) were
selected for study. One consideration in the selection of the trippers was that they are dead-
headed (i.e., not in revenue service) to the route origin and could thus be more easily staged at
the downtown departure location.
[Table 1 about here]
One dispatcher and one field supervisor were responsible for making and implementing
the control actions. These two individuals remained in radio contact. In instances where it was
determined that the bus following the tripper was running less than one headway late the
supervisor instructed the tripper operator to maintain a headway that was half the combined
headway linking the lead and trailing bus. For example, if this difference was twenty minutes
16
and the tripper’s scheduled headway was eight minutes, the supervisor would instruct the tripper
operator to try and maintain a two minute delay on his or her vehicle control head.
Load checkers were also stationed at the maximum load points to recover passenger
counts. This was done because the subject buses were not all APC-equipped, and there was
some concern about the accuracy of the passenger counts recorded by this equipment. The
reliance on manual load checking did affect the time frame of the study. Given that the BDS
recovers actual headway and other operating data automatically, the baseline against which the
effects of the control experiment can be compared already exists. With loads being counted
manually, however, the baseline period was defined by the amount of time the load checkers
were deployed prior to the implementation of the control strategy. This period covered 10
weekdays, extending from October 18-29, 1999. This was followed by a “treatment” period that
covered 18 weekdays, extending from November 1-24, 1999.
Statistical Analysis
From a statistical standpoint, improvements in headway maintenance are represented by
reductions in headway variance. A reduction in load variation would also be expected to
correspond to a reduction in headway variability. As can be seen in Table 1, the scheduled
headways of the trips involved in the experiment vary both within and between routes. It is thus
necessary to standardize the headway measure to establish a consistent basis for comparison.
This is done by forming the ratio of observed to scheduled headway, as follows:
Headway Ratio = [(Observed Headway/Scheduled Headway)*100]
A similar ratio could be constructed for passenger loads, but it is not needed because bus seating
capacity does not vary.
17

Wonnacott and Wonnacott (1972: 180-182) explain the test for determining the
significance of a change in variance using a C2 statistic, which is a modified chi-square. Critical
values from the distribution of this statistic are used to construct confidence intervals around the
baseline and treatment sample variances to determine whether they can be significantly
distinguished from each other. For example, the 95% confidence interval at 120 degrees of
freedom is defined as follows:
Pr (s2/1.27 < σ2 < s2/.763) = 95%,
where s2 is the sample variance and σ 2 is the underlying population variance.
The BDS recovers headway data over the entire route. Thus it is possible to assess the
consequences of headway control actions at the point where the actions are taken and at
subsequent points on the route. This implies significance tests for three locational
configurations: 1) at the control point; 2) progressively, at time points extending from the origin,
and 3) over all time points. In the first case, the test would determine whether service regularity
improved at the location where the control actions occurred. In the second case, one could
determine how far an initial improvement (assuming that such an improvement occurred) was
sustained along the route. In the final case, one could determine whether an overall
improvement in service regularity was discernable.
Results
A summary of the control actions taken is provided in Table 2. Six actions were taken on
regular service buses, including three holds, one swap and two short turns. For trippers there
were sixteen actions taken, including seven holds and nine swaps. There were no opportunities
for short-turning tripper buses, given that they were deadheaded to the departure point. Control
18

actions were taken on twelve of the eighteen days during which the experiment was conducted
and were imposed relatively more frequently for trippers (9.6% of recorded trips) than for
regular service buses (3.2% of recorded trips). Overall, the decisions by the dispatcher and field
supervisor to implement controls can be characterized as conservative. This is not undesirable,
given the finding by Wilson et al. (1992) of instances where control decisions were actually
found to be counter-productive.
[Table 2 about here]
The impact of the control actions on headway ratio variances is reported in Table 3 for all
time points on the affected routes as well as for the control point at which the actions were taken.
Compared to their baseline values. headway ratio variances declined 3.8% overall and 15.8% at
the control point. Two noteworthy items related to this outcome are 1) the improvement in
headway regularity was substantially greater at the location of the control action, and 2)
headway regularity generally tend to be better in the initial stages of trips. The change in
headway variance was evaluated with the C2 statistic. Neither of the reductions reported in Table
3 were found to be statistically significant at the .05 level.
[Table 3 about here]
The pattern of headway ratio variances for the baseline and control periods was also
evaluated over the sequence of time points comprising the routes studied. These patterns are
shown in Figure 1. Overall, the figure shows a pattern of increasing variance over the routes’
time points in both the baseline and control periods, which is consistent with what has been
observed in earlier studies (e.g., Abkowitz and Tozzi, 1987). Also, the figure indicates that the
effect of the control actions (taken at time point one) in reducing headway ratio variation is
19
concentrated over the first three time points. The differences in headway ratio variance were
tested by time point using the C2 statistic, and none was found to be significant at the .05 level.
[Figure 1 about here]
Passenger loads were also evaluated to determine if their variation declined in
correspondence with the improvement in headway regularity. Analysis of passenger loads was
complicated by a number of missed assignments by load checkers. Fortunately, an effort was
made to assign buses equipped with Automatic Passenger Counters (APCs) to the study routes
during the control period, which provides a second source of passenger load data. However, it
may not be appropriate to simply combine the load counts of APCs and manual checkers, given
possible differences in way the two methods measure the same phenomenon. Wonnacott and
Wonnacott (1970) provide a means of testing for the relative effects of measurement error in
such cases. They suggest a regression of each variable on the other. If measurement error is
present in either variable, it will have the effect of biasing its parameter estimate downward
when it is specified as the independent variable.
These regressions were performed for the sample of 212 baseline and control period trips
for which passenger loads were recorded by both APCs and load checkers. The results of these
regressions are reported in Table 4. In the manual count regression, the APC passenger count
serves as the independent variable. A 95% confidence interval is constructed around its
parameter estimate of .932, and the result ranges from .85 to 1.01. We thus conclude that this
parameter estimate is not significantly different from one and that manual counts can be
estimated APC counts. Alternatively, in the APC count regression, manual counts serve as the
independent variable, with an associated parameter estimate of .779. The 95% confidence
interval around this estimate ranges from .71 to .84. Thus the parameter estimate is both
20
significantly less that one and it also falls below the range for the APC parameter estimate. The
conclusions that can be drawn from these results are two-fold; 1) passenger load counts from the
two sources should not be combined; 2) the manual count data is subject to a relatively greater
level of measurement error than is the APC count data. As a result, the following passenger load
analysis draws solely on APC data.
[Table 4 about here]
From the perspective of transit operations, improving headway maintenance should lead
to more balanced passenger loads. This issue is examined for both load variation and average
load levels in Table 5. In the baseline period the average load of regular service buses is 7.1
passengers greater than the average load for trippers, a difference that is significant at the .025
level, based on the student’s t test statistic. During the control period, however, the average load
of regular service buses declines by almost four passengers, while average tripper loads increase
by nearly one passenger. As a result, the difference in mean loads shrinks to 2.7 passengers
during the control period and is no longer significant. This outcome is consistent with an
improvement in the spacing between regular service and tripper buses.
[Table 5 about here]
Turning to load variance, the composite effect of the various control actions contributed
to a convergence of passenger load variability of regular service and tripper buses. The control
actions, particularly holding, likely contributed to the increase in load variance for tripper buses,
which were more than offset by the reduction in passenger load variance among regular service
buses. Over all buses the improvements in service regularity contributed to a 16% reduction in
passenger load variance. Although the differences in variances between tripper and regular
service buses and changes between the baseline and control period are substantial, C2 tests
21
indicate than none are statistically significant. This reflects the effects of the relatively small
sample size of APC trips.
In summary, the statistical analysis of headways and passenger loads provides mixed
evidence of the effects of the control experiment. Headway variation declined, but not
significantly, while there was a significant convergence (leveling) of passenger loads. Given that
the latter outcome relates to a principal motivation for engaging in operations control, we can
conclude that the actions taken produced the desired effect. The analysis also indicates that
small improvements in service regularity can potentially generate more substantial improvements
in passenger load maintenance.
Conclusions
Most of the research and field experience to date on operations control has focused on
headway-based holding. This reflects the fact that service regularity problems on high frequency
routes affect more passengers, and that corrective actions will a thus have larger effect on
reducing aggregate wait times. Headway control is most effective on high frequency routes
when passenger loads at the control point are light and demand immediately following the
control point is heavy. The same holds true for schedule-based holding. As a general rule,
control should be implemented as early along the route as possible because delay variation tends
to increase as buses proceed further downstream. The main drawback to holding is that it
imposes costs on passengers already on board buses.
A large body of useful information presently exists that can be used to design models
capable of directing when and where to implement control actions and what the expected savings
in wait time would be. The current trend is to implement and evaluate control actions using
22
actual operations data. Assuming that effective control points can be found, decision rules can
be developed to aid in decision making. Advances in communications and transportation
technologies such as real-time APC and AVL systems capable of displaying headway deviations
will serve to increase prediction accuracy in the future.
The organization of operations control in the new BDS environment is evolving and
somewhat uncertain. In the initial stage of BDS implementation it was thought that the role of
dispatchers might grow to include some operations control responsibility. There is not much
evidence that this has happened. Dispatchers say that they are paying attention to schedule
adherence and bus spacing, but operations control has traditionally been managed in the field.
Thus, greater improvements in operations control may occur from extending vehicle location and
monitoring technology into the field, thereby improving the quality of information available to
supervisors. The experiment reported in this paper represents an intermediate step, where
supervisors are still reliant on dispatchers for real time information.
Finally, discussions among the participants of the control study reported here also
indicate the need and opportunity for automating real time operations control actions. It was felt
that a simple decision support system could effectively deal with vehicle holding decisions. The
dispatcher in the control experiment noted that there was insufficient time to deal with some of
the problems that developed, and that an automated decision support system would have been
able to recognize and resolve such problems more effectively.
23
References
Abkowitz, M. D. 1978. Transit Service Reliability. Cambridge, MA: USDOT Transportation Systems Center and Multisystems, Inc. (NTIS No. UMTA/MA-06-0049-78-1).
Abkowitz, M. D., Eiger, A., and Engelstein, I. 1986. Optimal headway variation on transit
routes. Journal of Advanced Transportation, 20 (1), 47-65. Abkowitz, M. D., and Engelstein, I. 1982. Temporal and spatial dimensions of running time on
transit routes. Transportation Research Record 877, 64-67. Abkowitz, M. D., and Engelstein, I. 1983. Factors affecting running time on transit routes.
Transportation Research, 17A, (2), 107-113. Abkowitz, M. D., and Engelstein, I. 1984. Methods for maintaining transit service regularity.
Transportation Research Record 961, 1-8. Abkowitz, M. D., and Lepofsky, M. 1988. Implementing headway-based reliability controls on
transit routes.. Journal of Transportation Engineering, 116 (1), 49-63. Abkowitz, M.D. and Tozzi, J. 1987. Research contributions to managing transit service
reliability. Journal of Advanced Transportation, 21, 47-65. Barnett, A. I. 1974. On controlling randomness in transit operations. Transportation Science, 8
(2), 101-116. Barnett, A. I., and Kleitman, D. J. 1973. Optimal scheduling for some simple transportation
systems. Transportation Science, 7, 85-99. Bowman, L. A., and Turnquist, M. A. 1981. Service frequency, schedule reliability and
passenger wait times at transit stops. Transportation Research, 15A, 465-471. Bly, P. H., and Jackson, R. L. 1974. Evaluation of bus control strategies by simulation. TRRL
Laboratory Report No. 637, Crownthorne,: Great Britain. Chapman, R. A., and Michel, J. F. 1978. Modeling the tendency of buses to form pairs.
Transportation Science, 12 (2), 165-175. Hundenski, R. J. 1996. A matter of time: Cultural values and the "problem" of schedules.
Paper presented at the 76th Annual Meeting of the Transportation Research Board, Washington, D.C.
Khasnabis, S., Rudraraju, R.K., and Baig, M.F. 1999. Economic evaluation of signal
preemption projects. Journal of Transportation Engineering, 125 (2), 160-167. Kemp, M A. 1973. Some evidence of transit demand elasticities. Transportation, 2 (1), 25-51.
24
Koffman, D. 1978. A simulation study of alternative real-time bus headway control strategies.
Transportation Research Record 663, 41-46. Lago, A. M., and Mayworm, P. D. 1981. Transit service elasticities. Journal of Transport
Economics and Policy, 15 (2), 99-119. Levinson, H. S. 1991. Supervision strategies for improved reliability of bus routes. NCTRP
Synthesis of Transit Practice 15. Washington, DC: Transportation Research Board. Lin, G., Liang, P., Schonfeld, P., and Larson, R. 1995. Adaptive Control of Transit Operations.
College Park: University of Maryland. (NTIS No. MD-26-7002). Mohring, H., Schroeter, J., and Wiboonchutikula, P. 1987. The values of waiting time, travel
time, and a seat on the bus. Rand Journal of Economics, 18 (1), 40-56. Osuna, E. E., and Newell, G. F. 1972. Control strategies for an idealized public transportation
system. Transportation Science, 6, 52-72. Strathman, J.G., Dueker, K.J., Kimpel, T., Gerhart, R.L. Turner, K., Taylor, P., Callas, S., and
Griffin, D. 2000. Service reliability impacts of computer-aided dispatching and automatic vehicle location technology: A Tri-Met case study. Transportation Quarterly , 54, 85-102.
Turnquist, M. A. 1978. A model for investigating the effects of service frequency and reliability
on bus passenger waiting times. Transportation Research Record, 663, 70-73. Turnquist, M. A., and Blume, S. W. 1980. Evaluating potential effectiveness of headway
control strategies for transit systems. Transportation Research Record 746, 25-29. Turnquist, M. A., and Bowman, L. A. 1980. The effects of network structure on reliability of
transit service. Transportation Research, 14B, 79-86. Turnquist, M. A. 1982. Strategies for Improving Bus Transit Service Reliability. Evanston, IL:
Northwestern University. (NTIS Report No. DOT/RSPA/DPB-50-81-27). USDOT, Research and Special Programs Administration.
Welding, P. I. 1957. The instability of close interval service. Operational Research Quarterly,
8, 133-148. Wilson, N., Macchi, R. A., Fellows, R. E., and Deckoff, A. A. 1992. Improving service on the
MBTA Green Line through better operations control. Transportation Research Record 1361, 10-15.
Wonnacott, T.H. and Wonnacott, R.J. 1970. Econometrics, New York: John Wiley and Sons,
Inc.
25

Wonnacott, T.H. and Wonnacott, R.J. 1972. Introductory Statistics for Business and
Economics, New York: John Wiley and Sons, Inc. Woodhull, J. 1987. Issues in on-time performance of bus systems. Unpublished paper. Los
Angeles, CA: Southern California Rapid Transit District.
26
Author Bios James Strathman is the Director of the Center for Urban Studies and a Professor of Urban Studies and Planning at Portland State University. His research focuses on transit operations and planning, and travel behavior. Kenneth J. Dueker is the Director of the Transportation Studies Center and a Professor of Urban Studies and Planning at Portland State University. Over the past 35 years his research has dealt with transportation and land use issues. He has served as the chair of the TRB sub-committee on Geographic Information Systems in Transportation (GIS-T), and was recently recognized as an Emeritus Member of the Spatial Data and Information Sciences Committee of TRB. Thomas Kimpel is a Ph.D. Candidate in Urban Studies and Planning at Portland State University. His interests are in transit operations, performance, and demand analysis. Richard L. Gerhart, P.E., is the Director of Operations Planning and Analysis at Tri-Met, currently working on ITS applications for improving transit operations productivity. He holds a Master of Science in Transportation Engineering from The Ohio State University and a Bachelor of Science in Civil Engineering from Lehigh University, Bethlehem, PA. Ken Turner is Senior Manager of Operations Project Development at Tri-Met, where he is responsible for planning and development of ITS projects. His current focus is on developing Advanced Traveler Information Systems to benefit transit riders, and the integration of transit operations with regional ITS projects. Steve Callas is the Coordinator of Service and Performance Analysis at Tri-Met, in Portland, Oregon, where he is responsible for the Agency’s performance statistics. He has a Masters in Urban and Regional Planning from The University of Iowa and has work in the transportation planning field for more than 10 years. David Griffin has been contracting with Tri-Met as a data analyst since 1998. He holds a Bachelor of Science in Engineering and has worked in community college education and in upper stage telemetry for Boeing Aerospace.
27
Table 1
Routes and Scheduled Trips Selected for Headway Control
(“Trippers” identified in bold type)
Route-Block No.
Scheduled Departure Time
Scheduled Headway (min.)
12 Sandy Blvd. 1276 4:07 -- 1288 4:10 3:00 1285 4:20 10:00 1275 4:22 -- 1286 4:30 8:00 1277 4:37 7:00 1283 4:40 3:00 1294 4:50 10:00
14 Hawthorne 1409 4:57 -- 1417 5:02 5:00 1418 5:03 1:00 1407 5:08 5:00
96 Tualatin I5 9677 3:50 -- 9673 4:00 10:00 9679 4:08 8:00 9669 4:30 -- 9675 4:35 5:00 9676 4:45 10:00 9668 4:55 -- 9680 5:00 5:00 9671 5:05 5:00
4 Division 438 4:43 -- 459 4:50 7:00 436 4:57 7:00
9 Powell 935 5:01 -- 952 5:07 6:00 946 5:15 8:00
10 Harold 1035 4:55 -- 1046 5:02 7:00 1045 5:10 8:00
28
Table 2
Control Actions Taken
Action
Reg. Service Buses
Tripper Buses
Holds 3 7
Swaps 1 9
Short Turns 2 0
Total 6 16
29
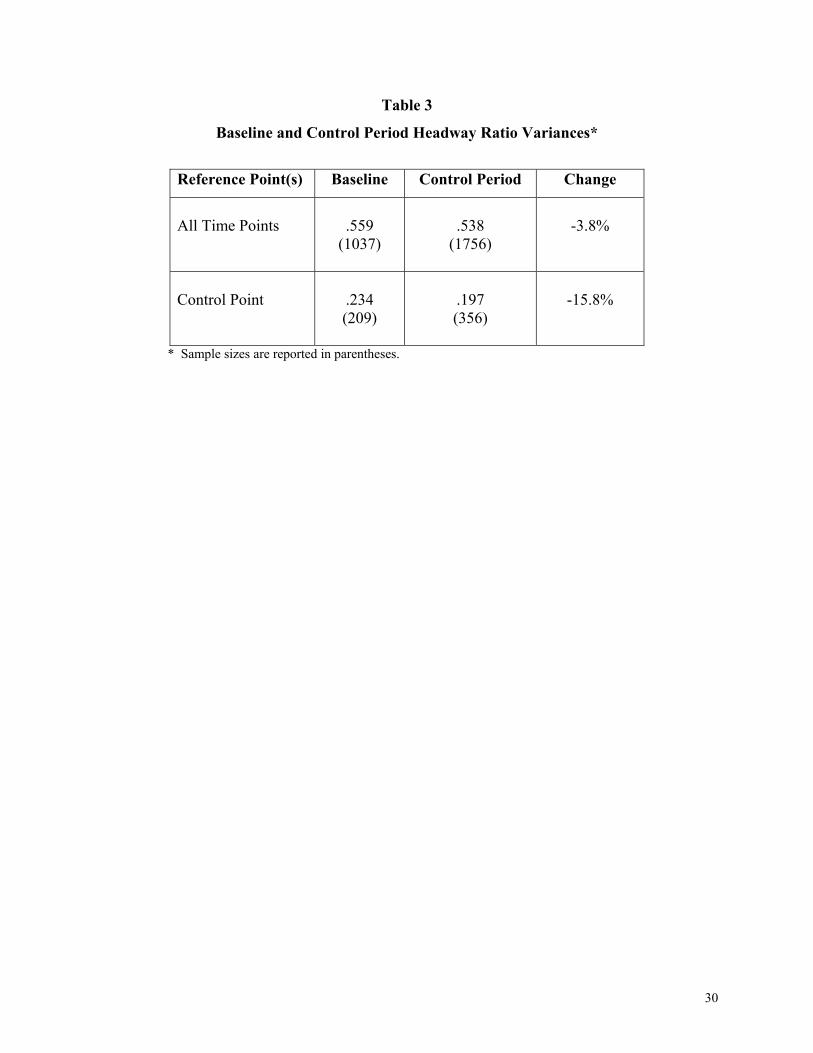
Table 3
Baseline and Control Period Headway Ratio Variances*
Reference Point(s) Baseline Control Period Change
All Time Points
.559
(1037)
.538
(1756)
-3.8%
Control Point
.234 (209)
.197 (356)
-15.8%
* Sample sizes are reported in parentheses.
30
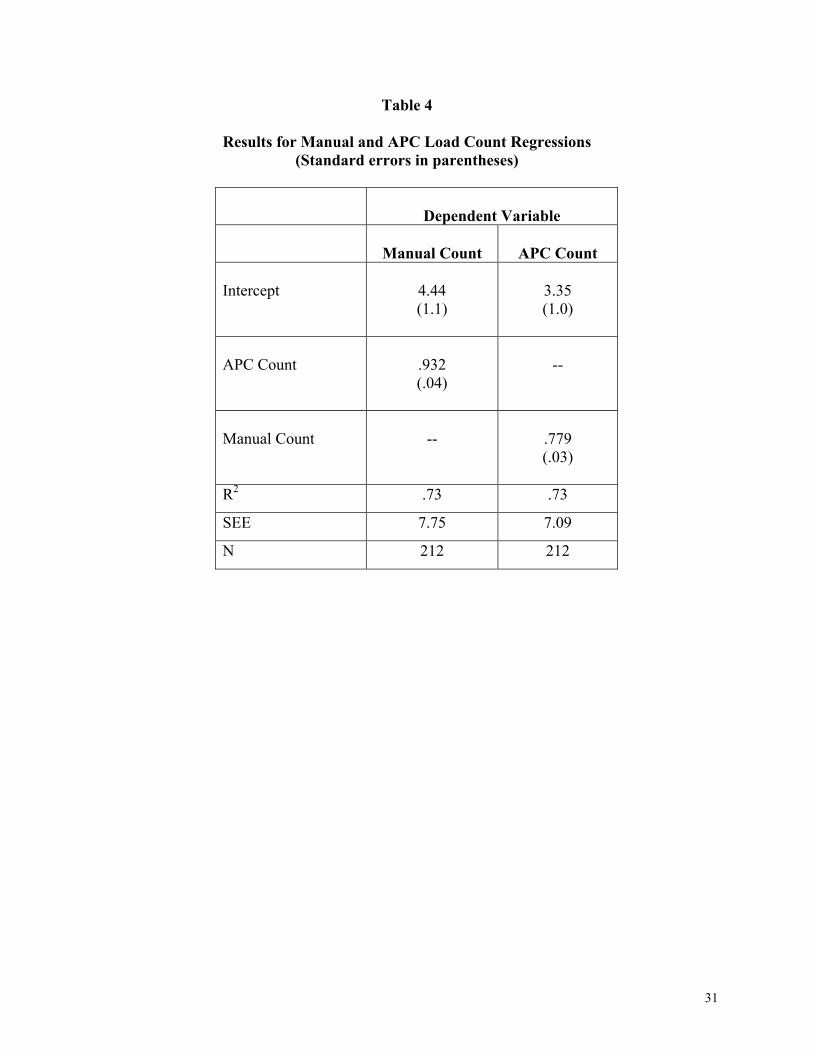
Table 4
Results for Manual and APC Load Count Regressions (Standard errors in parentheses)
Dependent Variable
Manual Count
APC Count Intercept
4.44 (1.1)
3.35 (1.0)
APC Count
.932 (.04)
--
Manual Count
--
.779 (.03)
R2 .73 .73
SEE 7.75 7.09
N 212 212
31
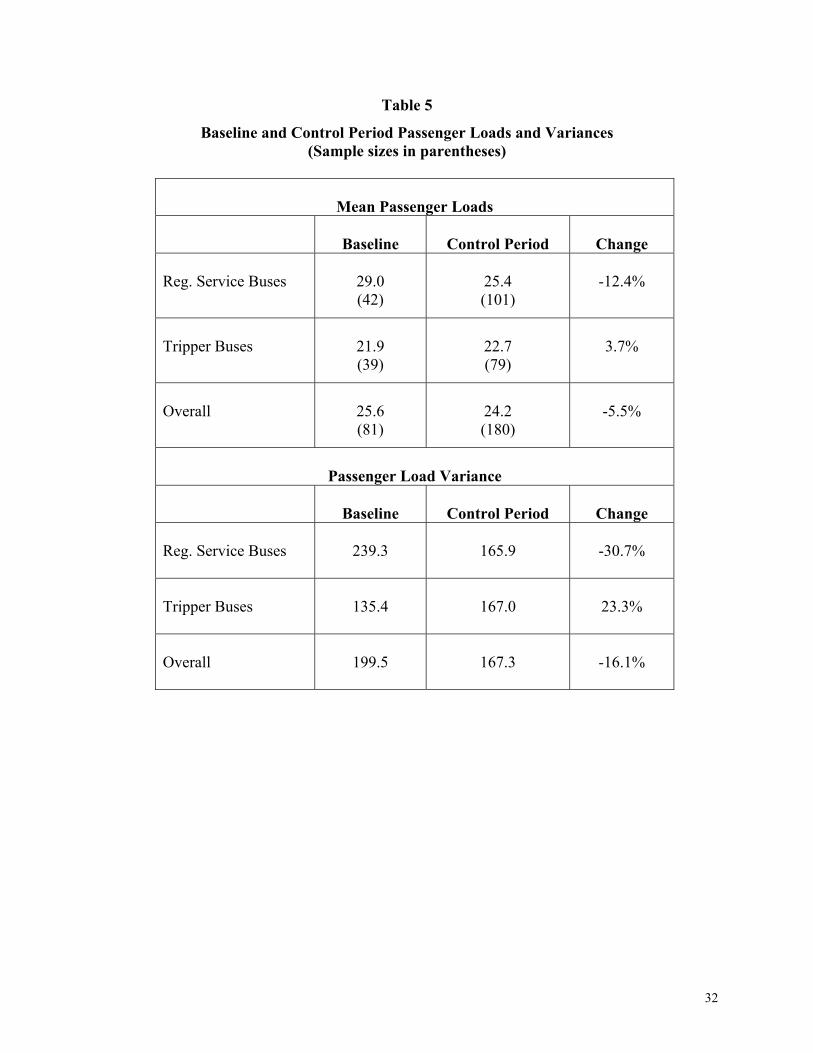
Table 5
Baseline and Control Period Passenger Loads and Variances (Sample sizes in parentheses)
Mean Passenger Loads
Baseline
Control Period
Change Reg. Service Buses
29.0 (42)
25.4 (101)
-12.4%
Tripper Buses
21.9 (39)
22.7 (79)
3.7%
Overall
25.6 (81)
24.2 (180)
-5.5%
Passenger Load Variance
Baseline
Control Period
Change
Reg. Service Buses
239.3
165.9
-30.7%
Tripper Buses
135.4
167.0
23.3%
Overall
199.5
167.3
-16.1%
32
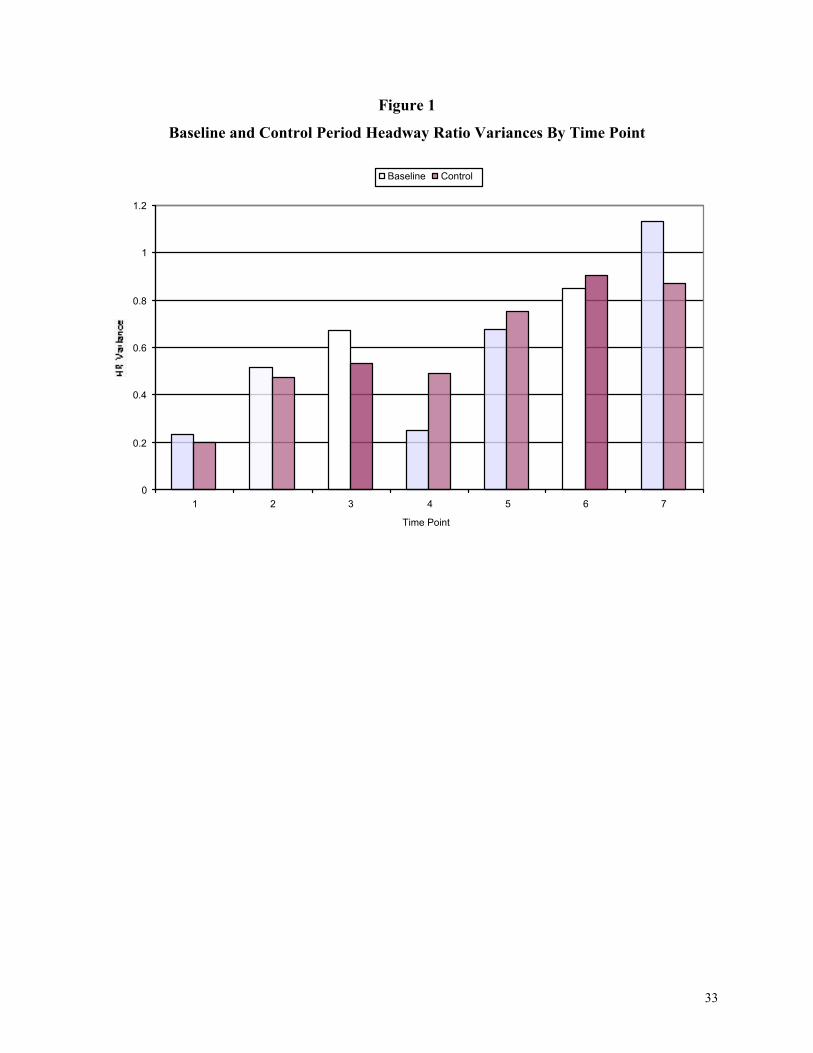
Figure 1
Baseline and Control Period Headway Ratio Variances By Time Point
0
0.2
0.4
0.6
0.8
1
1.2
1 2 3 4 5 6 7
Time Point
Baseline Control
33