Embed Size (px)
Citation preview

Experience the Power of Teradata on a MySQL BudgetLearn how the Kickfire data warehouse appliance delivers the world’s #1 price/performance.Download the white paper at www.kickfire.com/teradata
Business Intelligenceseptember 2009 bridging the gap between information and intelligence
business intelligence
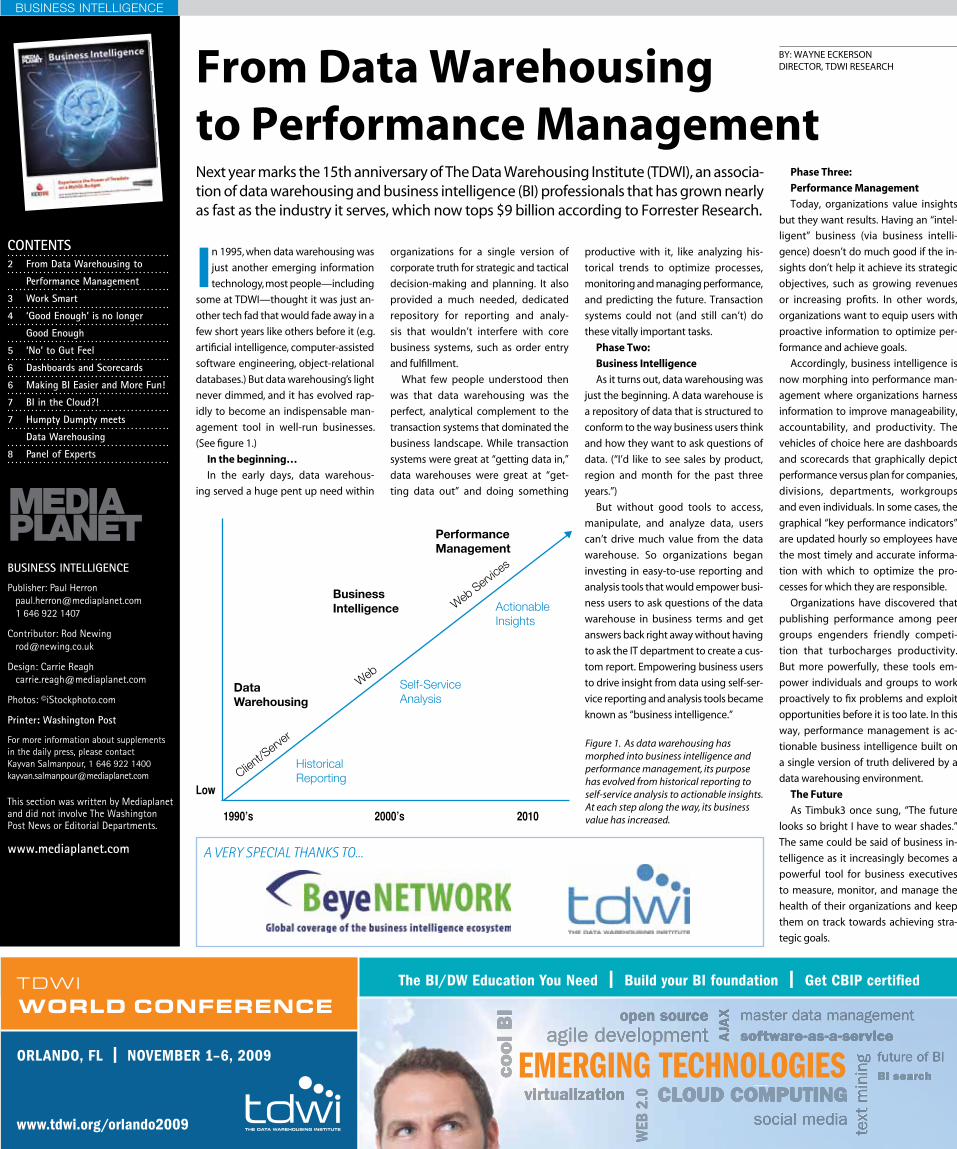
In 1995, when data warehousing was
just another emerging information
technology, most people—including
some at TDWI—thought it was just an-
other tech fad that would fade away in a
few short years like others before it (e.g.
artificial intelligence, computer-assisted
software engineering, object-relational
databases.) But data warehousing’s light
never dimmed, and it has evolved rap-
idly to become an indispensable man-
agement tool in well-run businesses.
(See figure 1.)
In the beginning…
In the early days, data warehous-
ing served a huge pent up need within
organizations for a single version of
corporate truth for strategic and tactical
decision-making and planning. It also
provided a much needed, dedicated
repository for reporting and analy-
sis that wouldn’t interfere with core
business systems, such as order entry
and fulfillment.
What few people understood then
was that data warehousing was the
perfect, analytical complement to the
transaction systems that dominated the
business landscape. While transaction
systems were great at “getting data in,”
data warehouses were great at “get-
ting data out” and doing something
productive with it, like analyzing his-
torical trends to optimize processes,
monitoring and managing performance,
and predicting the future. Transaction
systems could not (and still can’t) do
these vitally important tasks.
Phase Two:
Business Intelligence
As it turns out, data warehousing was
just the beginning. A data warehouse is
a repository of data that is structured to
conform to the way business users think
and how they want to ask questions of
data. (“I’d like to see sales by product,
region and month for the past three
years.”)
But without good tools to access,
manipulate, and analyze data, users
can’t drive much value from the data
warehouse. So organizations began
investing in easy-to-use reporting and
analysis tools that would empower busi-
ness users to ask questions of the data
warehouse in business terms and get
answers back right away without having
to ask the IT department to create a cus-
tom report. Empowering business users
to drive insight from data using self-ser-
vice reporting and analysis tools became
known as “business intelligence.”
Phase Three:
Performance Management
Today, organizations value insights
but they want results. Having an “intel-
ligent” business (via business intelli-
gence) doesn’t do much good if the in-
sights don’t help it achieve its strategic
objectives, such as growing revenues
or increasing profits. In other words,
organizations want to equip users with
proactive information to optimize per-
formance and achieve goals.
Accordingly, business intelligence is
now morphing into performance man-
agement where organizations harness
information to improve manageability,
accountability, and productivity. The
vehicles of choice here are dashboards
and scorecards that graphically depict
performance versus plan for companies,
divisions, departments, workgroups
and even individuals. In some cases, the
graphical “key performance indicators”
are updated hourly so employees have
the most timely and accurate informa-
tion with which to optimize the pro-
cesses for which they are responsible.
Organizations have discovered that
publishing performance among peer
groups engenders friendly competi-
tion that turbocharges productivity.
But more powerfully, these tools em-
power individuals and groups to work
proactively to fix problems and exploit
opportunities before it is too late. In this
way, performance management is ac-
tionable business intelligence built on
a single version of truth delivered by a
data warehousing environment.
The Future
As Timbuk3 once sung, “The future
looks so bright I have to wear shades.”
The same could be said of business in-
telligence as it increasingly becomes a
powerful tool for business executives
to measure, monitor, and manage the
health of their organizations and keep
them on track towards achieving stra-
tegic goals.
CONTENTS 2 From Data Warehousing to
Performance Management
3 Work Smart
4 ‘Good Enough’ is no longer
Good Enough
5 ‘No’ to Gut Feel
6 Dashboards and Scorecards
6 Making BI Easier and More Fun!
7 BI in the Cloud?!
7 Humpty Dumpty meets
Data Warehousing
8 Panel of Experts
BuSINESS INTEllIGENCE
Publisher: Paul Herron [email protected] 1 646 922 1407
Contributor: Rod Newing [email protected]
Design: Carrie Reagh [email protected]
Photos: ©iStockphoto.com
Printer: Washington Post
For more information about supplements in the daily press, please contact Kayvan Salmanpour, 1 646 922 1400 [email protected]
This section was written by Mediaplanet and did not involve The Washington Post News or Editorial Departments.
www.mediaplanet.com
TDWI WORLD CONFERENCE
Figure 1. As data warehousing has morphed into business intelligence and performance management, its purpose has evolved from historical reporting to self-service analysis to actionable insights. At each step along the way, its business value has increased.
Next year marks the 15th anniversary of The Data Warehousing Institute (TDWI), an associa-tion of data warehousing and business intelligence (BI) professionals that has grown nearly as fast as the industry it serves, which now tops $9 billion according to Forrester Research.
a very special thanks to...
1990’s 2000’s 2010
Data Warehousing
Historical Reporting
Business Intelligence
client/s
erver
Web
Web serv
ices
self-service Analysis
PerformanceManagement
Low
Actionable insights
By: WAyNE EckERSON DIREcTOR, TDWI RESEARcHFrom Data Warehousing
to Performance Management
business intelligence
news in brief
speed bumps on the corporate bi Roadmap
competitive opportunities such as ‘see-through-analytics’, the ‘business-of-
small’, and an ‘external-world-view’ are often overlooked by large corporations.
‘See-through-analytics’ drives holistic corporate planning. It occurs when
all data structures include master data so analyses can cross multiple orga-
nizational silos.
The ‘business-of-small’ is seldom done well. Even though small groups of
analytics experts generate significant value, they are often starved for re-
sources. This occurs even in organizations with mature methodologies for
large-scale application deployment and robust response to interruptions of
service.
The ability to have an ‘external-world-view’ is
often overlooked. Tagging databases with common
external elements like DMA regions, census tracts,
and industry standard codes allows companies
to integrate and report internal data
for comparison. Such integration
allows organizations to incorporate
geographic, governmental, or economic
data into predictive models.
Tim Pletcher is the director of applied
research at central Michigan University
Research corporation. [email protected];
www.cmurc.com/bi
TDWI WORLD CONFERENCE
From Data Warehousing to Performance Management
“In a rising market ‘good
enough’ will generally allow
you to get by,” says Richard
kellett, BI manager at SAS, an analyt-
ics software vendor. “However, in the
current global market, ‘good enough’
isn’t good enough anymore. you have
to get everything you can out of every
dollar spent. Just having some statisti-
cal reports and a bit of classic BI, with
multi-dimensional analysis of his-
torical information, is no longer good
enough.”
He says that organizations now use
predictive analytics as part of their BI
solution. This models what is likely to
happen and helps them to optimize
their business. It is used in areas like
pricing, marketing campaigns and
web site sales, to give them a compet-
itive advantage. “It is about optimize,
optimize, optimize,” he says.
Given that all businesses in a market
have access to similar data and analyti-
cal technology, competitive advan-
tage flows from better analysis. This
means being superior in extracting
insights from the data into areas like
trends and customer behavior, which
can be acted upon to increase sales.
kurt Schlegel, research vice president
at Gartner, the analyst, says that BI is
very good at identifying the weak sig-
nals of opportunities that are out there
and capitalising on them, as well as de-
fending against challenges.
“In the past, BI was about head-
quarter-based decisions,” says Ambuj
Goyal, general manager for IBM in-
formation management software. “It
should be called ‘intelligent business’,
which is about leveraging what we
know to create transactions that create
competitive advantage. Greg Todd,
global information management lead
at Accenture, says that many organiza-
tions are doing a second or third itera-
tion of their BI strategies as they move
BI towards widespread or broad-based
use of analytics.
“Everyone has information and
technology can only go so far,” he
says. “It is vital to understand how
information can provide insight into
markets and customer trends. What
makes the real difference is having the
human talent within the organization
to understand how to use information
for competitive advantage.”
Work Smart: Making better use of information than your competitors is key.Surviving in the recession has caused businesses that were already competing intensively to fight even harder for every sale—and we can be sure that they won’t ease off as the economy improves. Beating your competitors to a sale, while remaining profitable, is tough, but that is what BI has always been good at.
business intelligence
“The BI systems installed
in most companies are
too internally focused to
be great macro-economic indicators,”
says kurt Schlegel, research vice presi-
dent on the business intelligence team
at Gartner, the analyst. “Unless you
were in the financial services industry
and your BI system was about looking
at mortgage-backed securities, not
even the best BI system could have
predicted the meltdown in the mort-
gage security industry and the freeze
in the credit markets.”
Nevertheless, BI systems have
played a part in helping organizations
to survive through the recession. Jim
Davis, chief marketing officer at SAS,
a business analytics software ven-
dor, says that it enables businesses in
multiple industries to improve opera-
tions, enhance customer relationships,
streamline supply chains, detect and
fight fraud, leverage growing volumes
of data and do more with less.
“BI is critical to cutting costs in a
downturn,” says “Schlegel. “you don’t
want to cut too close to the bone and
BI helps you trim as much fat as possi-
ble without cutting into the meat. you
don’t want to make cuts that could af-
fect your most profitable customers.”
BI also helps organizations to con-
tribute to economic growth by identi-
fying new opportunities and improv-
ing performance. Greg Todd, global
information management lead at Ac-
centure, finds that despite the reces-
sion and the economic conditions BI is
still ‘top of mind’ for most executives.
“Organizations that are looking
to do more and spend less need im-
proved BI to understand how they
are performing and how to spend
their money most efficiently,” he says.
“BI helps to define optimisation ap-
proaches and performance improve-
ments throughout an organization.”
A well designed BI strategy aligns
all employees behind the organiza-
tion’s overall objectives and measures,
monitors and rewards their behavior.
Ambuj Goyal, general manager for IBM
information management software,
says that every time an industry has
become more efficient, the economy
has expanded. BI systems are now
assisting individuals who deal with
customers to make correct micro-
decisions within the context of board-
level macro-decisions.
“Organizations doing micro-deci-
sions see an inflexion point of effi-
ciency that improves their margins,”
he says. “This efficiency creates eco-
nomic expansion.”
The biggest contributors to our
economic recovery is the government
stimulus package under the Recovery
Act, which requires recipients to report
on the expenditure of those funds.
chris Boorman, chief marketing officer
of Informatica, a data integration soft-
ware provider, says that transparency
and visibility on that funding is a big BI
exercise, to pull the data from all types
of IT environments and analyze it to
understand what it has been used for.
“It is critical that the government
demonstrates that the value that
people expect from this massive com-
mitment has been created from every
dollar of that has been pumped into
the economy,” he says. “It will also
help to understand how the markets
are recovering.” Goyal adds that once
we have this 100% transparency, effi-
ciencies will follow.
Alys Woodward, program manager
for BI at IDc, the analyst, concludes
that although BI is not the most impor-
tant factor in economic recovery, it has
an important role to play in support-
ing it. “Best practices in data manage-
ment and information sharing lead to
improved decision making, which will
benefit the entire economy, “she says.
“Individual organizations that make
better use of information than their
competitors have the best opportu-
nity to turn the recession and recovery
to their advantage.”
‘Good Enough’ is no Longer Good Enough survival and recovery require clever bi systems.Not even the keenest advocates of business intelligence argue that BI alone can bring the global economy out of recession. However, it clearly has a role in seeing organizations through the recession and helping them back to growth, hence contributing to US economic recovery. It can also show how effectively the in-jection of government funds has been spent. However, most systems would not have spotted the recession in advance.
business intelligence
Aster Data provides a next-
generation data management and
analytics platform for frontline data
warehousing - providing deep in-
sights on data analyzed on clusters
of low-cost commodity hardware.
The Aster ncluster platform
powers rich analytic applications
for companies such as coremetrics,
MySpace, Akamai, Specific Media,
and ShareThis. Running on low-
cost off-the-shelf hardware, and
providing ‘hands-free’ administra-
tion, Aster enables enterprises to
meet their data warehousing needs
within their budget, and without
compromising scale, volume or
availability. Aster is headquartered
in San carlos, california and is
backed by Sequoia capital, JAFcO
Ventures, IVP, cambrian Ventures,
and First Round capital, as well
as industry visionaries including
David cheriton and Ron conway.
For more information please visit
http://www.asterdata.com.
ADVERTORIAl
However, ‘competing Through
Business Analytics’, an Accen-
ture survey, found that 40% of
important business decisions are not
based on analytics. The reasons given
were sufficient data not available
(61%); no past data for the decisions
and innovation they are addressing
(61%); and relying on qualitative and
subjective factors (55%).
40% say one of the biggest chal-
lenges they have is lack of standard
processes across the company for ana-
lyzed business data and 57% said they
don’t have a beneficial, consistently
updated enterprise-wide analytical ca-
pability. 72% are working to increase
their company’s business analytics
usage.
“With the amount of information
that is available, you want the orga-
nization to be working towards fact-
based decisions, but unfortunately
people revert back,” says Greg Todd,
global information management lead
at Accenture. “Improving the quality of
business decisions has a direct impact
on costs and revenue and 71% said
that BI helps them with their opera-
tional performance, which is a strong
indicator that the trust and value in BI
is there.” It plays a role in pricing strat-
egies (55%), asset management (54%),
customer retention (52%) and talent
management (33%).
“The complexity of most existing BI
tools often prevents users from access-
ing the data they need,” says kristina
kerr, lead BI product manager at Mi-
crosoft. “They require more than just
numbers, so a natural step in the deci-
sion-making process is to collaborate
with people to ensure that expertise,
insight and stakeholder opinions are
factored into each decision.”
kurt Schlegel, research vice presi-
dent at Gartner, the analyst, says that
whereas most BI deployments empha-
size information delivery and analysis
to support fact-based decision-mak-
ing, they fail to link them to the deci-
sion itself, to the outcome, to decision-
making best practices or to the related
collaboration and decision inputs. This
reduces the quality and transparency
of resulting decisions.
“Organizations must improve their
decision management capabilities by
capturing knowledge of how deci-
sions are made and their outcomes,”
says Alys Woodward, program man-
ager for business analytics at IDc, the
analyst. “They need to be able access
both structured data and unstructured
data to analyze and collaboratively
and automate repeatable, tactical
decisions,” she says. “However, the
key market growth in the BI space will
come from users moving away from
spreadsheet-based infrastructures,
built and maintained by business users
rather than IT.”
‘No’ to Gut FeelDecision-making must be based on collaboration and a wider range of data sources.Decisions are supposed to be based on facts, but are often made on the basis of experience and ‘gut feel’. Sadly, these take years to develop, may never be ac-quired and are subject to bias. The role of BI is to provide facts and insight to support better decisions.
It's about me you got connected.
• Join interes ng and relevant groups • Network with other members • Share your opinions about content • Gain access to leading industry experts
Visit the site today!www.BeyeCONNECT.com
Are you ready to be a part of the "in crowd" of business intelligence and data warehousing professionals?
Join the new social networking site built specifically for YOU.
business intelligence
■ Analyze the past ■ Monitor in real time ■ Predict the futureinformationbuilders.com/go/wapo
Can your business intelligence software:
Whereas a dashboard is fairly
simple to implement, a
scorecard is a far more sci-
entific and structured way at looking
at the state of the company, although
it can be reported as part of a dash-
board. The balanced scorecard was
devised by kaplan & Norton to view
an organization’s overall performance
to ensure sustained profitability. It
integrates financial measures; cus-
tomer perspectives; internal business
processes; and organizational growth,
learning and innovation.
“The complexity of managing an
organization today requires managers
to view performance in several areas
simultaneously,” say kaplan & Nor-
ton. “By forcing them to consider all
the important operational measures
together, the balanced scorecard can
let them see whether improvement in
one area may be achieved at the ex-
pense of another.”
It involves developing a cascading
series of kPI’s which are used to trans-
late the overall strategy into different
operational measures relevant to each
level that will contribute to the top
level.
“Most organizations have turned re-
ports into dashboards over the last few
years, which is easy,” says kurt Schlegel,
research vice president at Gartner, the
analyst. “Scorecards are much more
difficult to build and are much less
widely adopted. However, organiza-
tions that have tied dashboards to a
broader performance management
initiative have experienced success.
Tying BI to performance management
makes it more strategic, which has
been the single biggest factor in run-
ning a successful BI program over the
last few years.”
As we see in the foreword, the data
warehouse sits at the heart of an en-
tire BI architecture within the organi-
zation, providing a source of accurate,
complete and timely information. “Ul-
timately, BI about being able to access
data from a variety of places, integrate
it and make it trusted,” says chris Boor-
man, chief marketing officer of Infor-
matica, a data integration software
provider. “you can’t do BI without
trusted valuable data.”
The data warehouse is usually ac-
cessed direct by marketing and analy-
sis experts for complex applications,
like data mining. For most users, sum-
marized data is transferred into a se-
ries of smaller ‘data marts’ that provide
management information at corporate
and departmental level. Users access
these through a range of easy-to-use
software tools that allow then to work
interactively with the data.
Typical applications include que-
rying, modelling, planning/budget-
ing/forecasting, reporting, financial
consolidation, activity-based costing/
management, scorecards, dashboards,
portals, analysis, tax planning, treasury
planning and risk management.
kurt Schlegel, research vice presi-
dent at Gartner, the analyst, sees BI
software continuing to increase its
breadth of capabilities. Interactive vi-
sualization will make BI more fun and
easy by giving end users a wide variety
of interactive and intuitive graphics.
He also says that the big vendors are
investing heavily in integrated search.
This will make BI content accessible to
non-traditional BI users by indexing
structured and unstructured content
with a search engine.
“BI technologies empower end-us-
ers to make better, faster and more in-
telligent decisions,” says kristina kerr,
lead BI product manager at Microsoft.
“It helps users get better business in-
sight, while reducing dependence on
their IT departments. This eliminates
time spent on ad-hoc BI requests, en-
abling both IT professionals and users
to provide greater strategic value to
the business.”
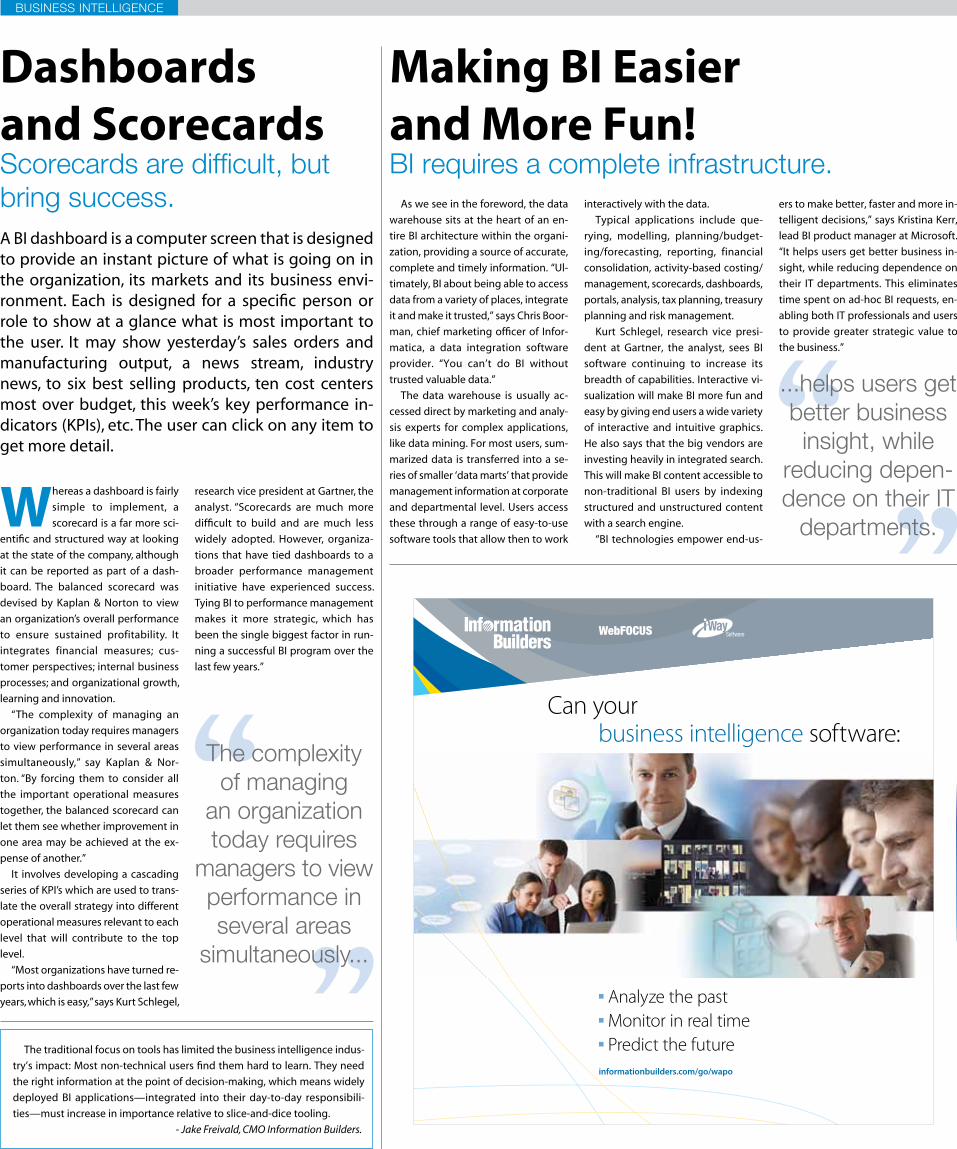
Dashboards and Scorecards Scorecards are difficult, but bring success.A BI dashboard is a computer screen that is designed to provide an instant picture of what is going on in the organization, its markets and its business envi-ronment. Each is designed for a specific person or role to show at a glance what is most important to the user. It may show yesterday’s sales orders and manufacturing output, a news stream, industry news, to six best selling products, ten cost centers most over budget, this week’s key performance in-dicators (kPIs), etc. The user can click on any item to get more detail.
Making BI Easier and More Fun!bi requires a complete infrastructure.
The traditional focus on tools has limited the business intelligence indus-
try’s impact: Most non-technical users find them hard to learn. They need
the right information at the point of decision-making, which means widely
deployed BI applications—integrated into their day-to-day responsibili-
ties—must increase in importance relative to slice-and-dice tooling.
- Jake Freivald, CMO Information Builders.
the complexity of managing
an organization today requires
managers to view performance in several areas
simultaneously...
...helps users get better business insight, while
reducing depen-dence on their it
departments.
business intelligence
BI software is operated by a ser-
vice provider on its own high
performance computing in-
frastructure. It is shared by a number
of different user organizations who
access the service over the internet
and pay on the basis of usage. It elimi-
nates the up-front costs of software
and hardware, is more reliable, more
flexible and offers powerful new ap-
plications.
“People find it much easier to bring
data inside than moving it outside,”
says Ambuj Goyal, general manager
at IBM information management soft-
ware. “However, time after time, we
are seeing that if organizations can
access a secure legally-private envi-
ronment, they do not want to build
their own analytical database. They
want somebody else to process their
data and send back the results of the
analysis.”
Many organizations are already
using business software hosted by
providers like NetSuite and Salesforce.
com, so it is very natural to extend to
use their integrated BI functionality.
It is also an attractive proposition for
mid-sized organizations that don’t
have in-house analysis skills.
Richard kellett, BI manager at SAS,
a business analytics software vendor,
says that putting an entire BI infra-
structure into the cloud can be dif-
ficult, with links to lots of operational
systems. However, individual BI ap-
plications work well in the cloud, es-
pecially if they are embedded into a
business application.
“BI in the cloud is good news,” con-
cludes Alys Woodward, business ana-
lytics program manager at IDc, the
analyst. “It will help one-off analytics
projects, existing systems struggling
to calculate quickly enough or new
user organizations that want to move
up to a more mature implementation.
It is not a panacea for all BI ills, but it
will remove some implementation ob-
stacles, reducing the significant chal-
lenge of succeeding with BI.”
Thousands of industry leaders rely on MicroStrategy business intelligence software for detailed insights into their businesses.
www.microstrategy.com
BI in the Cloud?!there is a solid reality behind this nebulous concept.The terms ‘business intelligence’ and ‘the cloud’ are much loved by marketing departments, are both meaningless and both distract from a very solid business reality. Gartner defines cloud computing as ‘a style of computing in which scalable and elastic IT-enabled capabilities are delivered as a service to external customers using internet technologies’. A
data warehouse reflects the
organization—the more frac-
tured and disintegrated the
organization, the harder it is to create
a robust, highly functional data ware-
house. These data repositories really
are a tool to reintegrate a fractured
enterprise and provide a holistic and
consistent view where none exists.
Most organizations are like Humpty
Dumpty teetering and tottering on
top of a big wall. With the slightest
gust of wind, Humpty crashes and
breaks into dozens of pieces. And data
warehousing teams are “all the king’s
horses and all the king’s men” who
are charged with putting Humpty
Dumpty back together again.
Today, most companies have frag-
mented into dozens or hundreds of
largely unconnected business units,
departments, and workgroups, each
with their own strategies, policies,
processes, applications, systems, IT
staffs, and data. It’s the job of the cEO
to bring order to this chaos. If the cEO
provides the business with a clear, co-
herent strategy, integrated processes
and systems, and standard definitions
and rules governing those processes,
then there is almost no need for a
data warehouse.
The king’s horses and men didn’t
cause Humpty Dumpty to fall, but
they often get blamed if they can’t
glue him back together again. Per-
haps poor Humpty Dumpty is cracked
beyond repair so that even the best
and brightest of the king’s men can’t
rehabilitate him.
The good news is that unlike our
fairy tale metaphor, many BI teams
do succeed in gluing their companies
back together, at least for awhile until
the next merger, acquisition, or other
organizational upheaval blasts every-
thing apart. But while it lasts, these
unsung heroes should be congratu-
lated and honored; not outsourced,
off shored, or reassigned to the IT-
equivalent of a Siberian gulag.
The moral of the story is this: don’t
blame the data warehousing team if
it can’t deliver a successful data ware-
house; blame the cEO. The data ware-
house is merely a messenger, a reflec-
tion of the state of organizational
dysfunction.
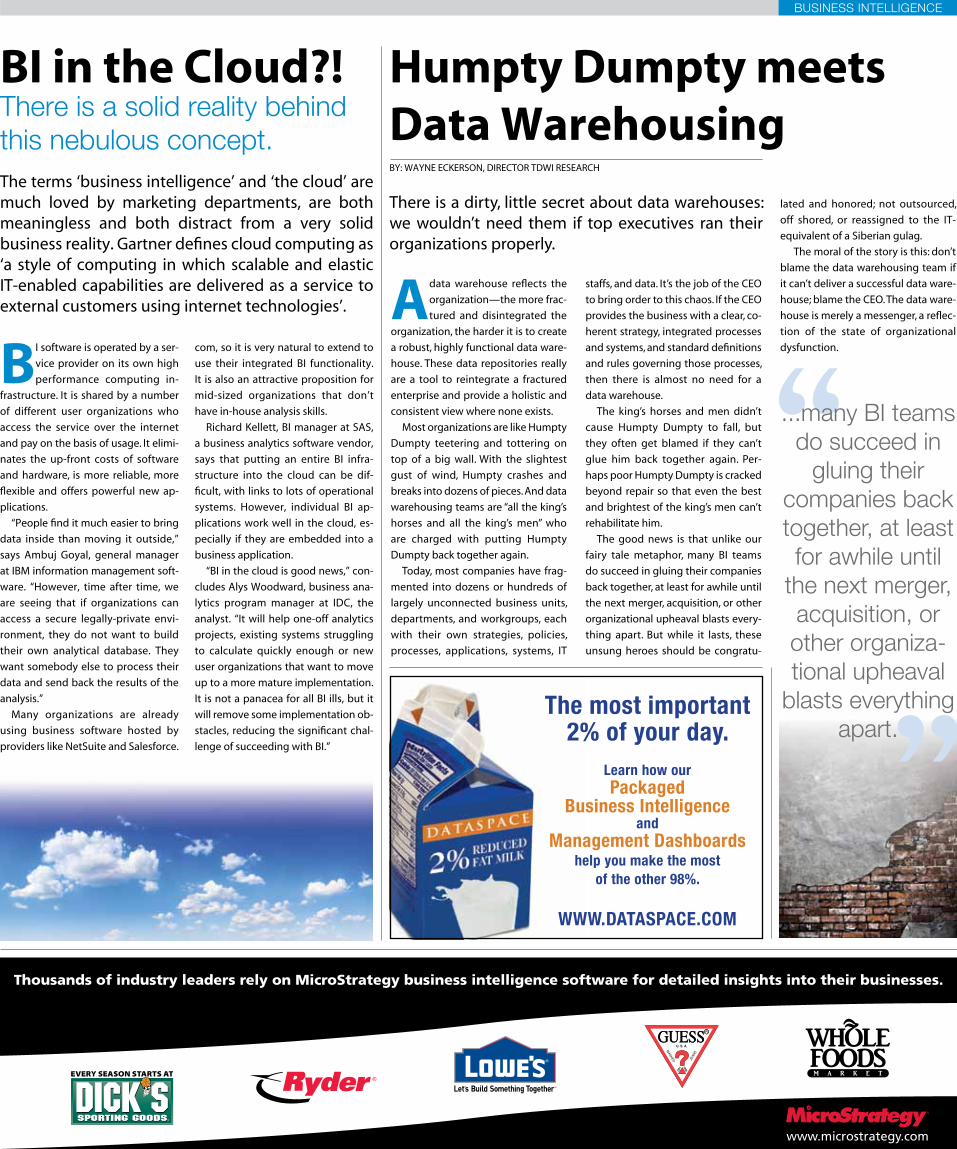
Humpty Dumpty meets Data Warehousing
There is a dirty, little secret about data warehouses: we wouldn’t need them if top executives ran their organizations properly.
By: WAyNE EckERSON, DIREcTOR TDWI RESEARcH
...many bi teams do succeed in
gluing their companies back together, at least for awhile until
the next merger, acquisition, or other organiza-tional upheaval
blasts everything apart.

business intelligence
Panel of Experts:
BI can play a huge role in
stimulating the global econ-
omy back to form. Organiza-
tions have invested billions of
dollars in operational business
systems, which are great for
running business processes,
but not for decision support.
BI pulls together detailed data
from multiple systems to give
managers the ability to capi-
talise on these investments by
quickly identifying problems
and opportunities.
It might only be used ten
minutes a day, but it will be crit-
ical in driving the business. It
quickly shows the user what is
going on and where the prob-
lems and the opportunities lie.
The rest of the day is spent act-
ing on the insight gathered.
Traditionally BI has been
used by large corporations,
but it must be democratised to
make it suitable for mid-sized
organizations. Packaged solu-
tions that run in the cloud allow
smaller companies to benefit
without a multi-million dollar
investment. Each organization
must navigate its own way out
of the slump, but effective use
of BI can chart the way.
Ben Taub, chief executive of
Dataspace, a BI software and
consulting firm.
This economic disaster was
largely caused by a catastrophic
lack of information about fi-
nancial instruments. Subse-
quent lack of information has
prolonged the downturn, as
people continue to fear the un-
known and simply wait. Organi-
zations that do not have timely
and accurate information will
continue to remain frozen.
BI eliminates unknowns and
is playing a pivotal role in re-
storing confidence by illumi-
nating the broader economic
landscape. Users understand
their business and have the
confidence to make invest-
ments, re-start operations and
expand their markets.
Information is the largest re-
newable economic resource in
the world and remains largely
untapped because of its sheer
size. The uses of information,
like the uses of electricity, are
limitless, driven by imagina-
tion and inventiveness. Mod-
ern enterprises must build the
information power plants and
power grids that will unleash
the inventiveness of their em-
ployees. knowledge is the key
to confidence, and confidence
is the key to economic recovery.
Michael Saylor, chief executive
officer at MicroStrategy, a BI soft-
ware vendor.
Business analysts’ desire to
put more and more data in
the warehouse is accelerating
in the current economic situ-
ation, as US organizations use
BI to cut costs. With BI data-
bases growing and managers
wanting more sophisticated
analysis, BI is getting harder.
Most database administrators
are either in pain or can see it
coming.
This will make it essential to
build a ‘shared nothing’ envi-
ronment, consisting of a large
number of cheap servers that
can be easily expanded as the
data grows. The data ware-
house must then store data in
columns, not rows, which is far
more efficient. It reads just the
columns it needs, where tra-
ditional systems have to read
every column in every row. It
is many times faster, simpler,
doesn’t store lots of header in-
formation, is easier to compress
and uses cache more efficiently.
This approach will com-
pletely take over the data ware-
house market within a decade.
This will help the US economy
through smarter BI and better
decisions.
Michael Stonebraker, founder
and chief technical officer at
Vertica, has pioneered database
technology research for more
than a quarter of a century.
In today’s global economy,
the record pace of change
leads to the need for quick de-
cisions on where to invest and
how to run the business that
impacts organizational success
or failure. BI provides organiza-
tions with the insight to make
timely decisions that are most
likely to provide the desired
outcomes.
The data that fuels the BI sys-
tems comes from a variety of
internal and external sources,
often very disparate and global.
BI takes this data and trans-
forms it into information that
is accurate, timely, and action-
able; often through hundreds
of processes including extrac-
tion, cleaning, transformation,
integration, loading, analysis,
etc. With its multitude of con-
nectors, global control, and
alerting, it is the role of enter-
prise scheduling to manage the
complex flow of data from var-
ied sources into the BI system
and ultimately deliver it out as
information to the appropriate
end users. In the hands of the
right leaders, this information is
what drives the success of the
enterprise.
Derek Evan solutions architect
for advanced services at Tidal
Software, a Cisco company that
provides application scheduling
and performance management
software.
Organizations that have de-
ployed BI successfully are not
only surviving the downturn,
but thriving. It has helped them
to manage inventories, cut
costs, better target promotions,
increase equipment utilization
and identify their most loyal
customers and their prefer-
ences. They have moved BI from
the back-office to the front line.
They no longer run the busi-
ness on gut-feel, but use fact-
based decision making.
Jack Welch once said that
when times are good you grow
and when times are bad you
build. Our most visionary clients
are investing in BI for the long-
haul. Although their IT budgets
have been cut, they know that
understanding their business
from both an operational and
strategic perspective could
mean the difference between
fast-follower and market leader.
We have seen them use
analytics to introduce new
products and services ahead
of their competitors, segment
their customers differently
and launch smart marketing
campaigns that have increased
overall revenues. They reap the
true benefits of BI by using it as
a strategic differentiator.
Jill Dyché is a partner with
Baseline Consulting, which pro-
vides business intelligence, data
governance and technology de-
livery services.
BEN TAUBcEO Dataspace
MIcHAEl SAylORchief Executive OfficerMicroStrategy
The web and BI are the most
important developments in
the global economy. The web
brings new opportunities
for organizations to interact
with their customers, but only
through an explosion of data.
Organizations that succeed
at the end of the recovery will
have harnessed the power of
the web and made sense of the
data to drive up revenue and
profitability of their customer
relationships.
The trend in BI is towards
lower costs and quicker wins,
causing resurgence in inde-
pendent data marts. These are
subject specific and fed directly
from operational systems,
rather than from an underly-
ing enterprise data warehouse.
They tend to contain sum-
marized data, making them
smaller and faster.
They are very specific to the
business manager’s problem
and give them access to the
data that matters to them most.
They are a lower cost, lower risk
way to get value out of the data
more quickly, speaking directly
to business managers who
need to increase revenue and
profits.
Bruce Armstrong, CEO and
Chairman of the Board brings 25
years of technology-specific de-
velopment, marketing and sales
experience to the his position at
Kickfire.
BRUcE ARMSTRONGchairman of the Boardand chief Executive Officerkickfire
MIcHAEl STONEBRAkERFounder and chief Technical OfficerVertica
DEREk EVANSolutions Architect for Advanced ServicesTidal Software
JIll DycHéPartnerBaseline consulting
How has business intelligence played a vital role into stimulating the global economy back to form?


![Business Intelligence [2]](https://img.pdfslide.net/doc/110x75/55cf91a3550346f57b8f276f/business-intelligence-2-560f1b762deb7.jpg)