Embed Size (px)
Citation preview
> Business performance in the first six months of 2014
Frankfurt, 24 July 2014
Dr Thorsten Reitmeyer, CEO
Holger Hohrein, CFO
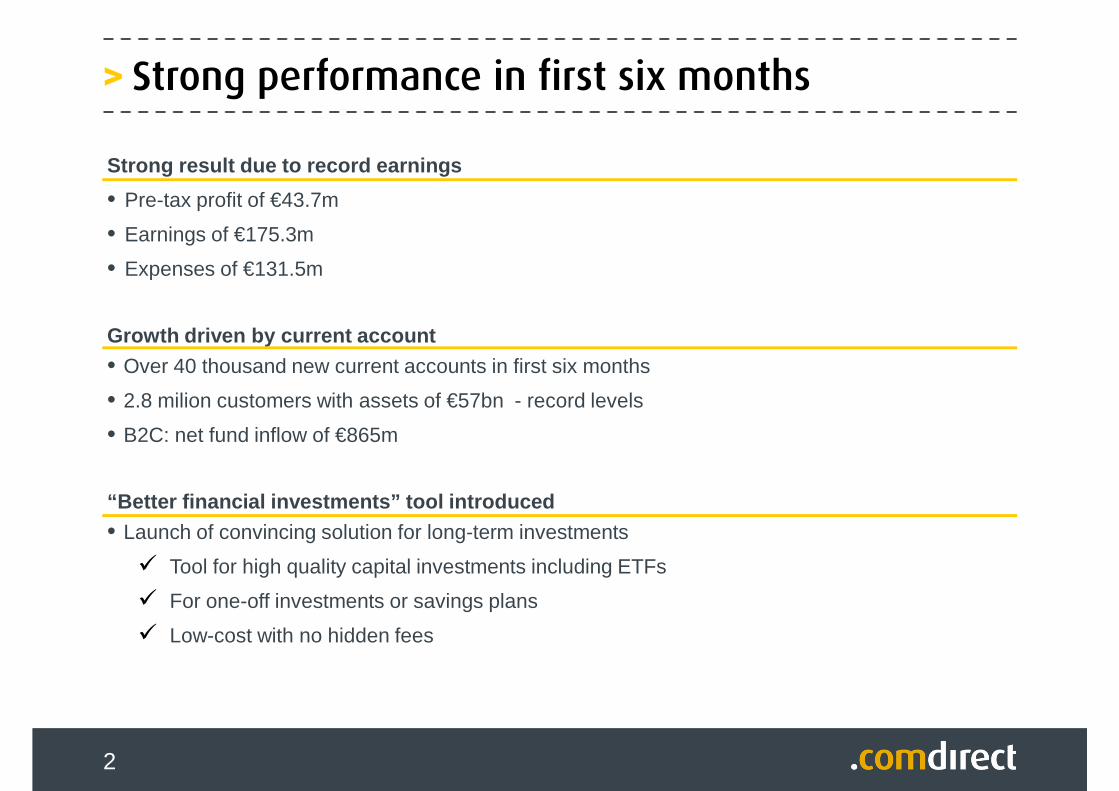
“Better financial investments” tool introduced• Launch of convincing solution for long-term investments
� Tool for high quality capital investments including ETFs
� For one-off investments or savings plans
� Low-cost with no hidden fees
2
> Strong performance in first six months
2
Strong result due to record earnings
• Pre-tax profit of €43.7m
• Earnings of €175.3m
• Expenses of €131.5m
Growth driven by current account• Over 40 thousand new current accounts in first six months
• 2.8 milion customers with assets of €57bn - record levels
• B2C: net fund inflow of €865m
3
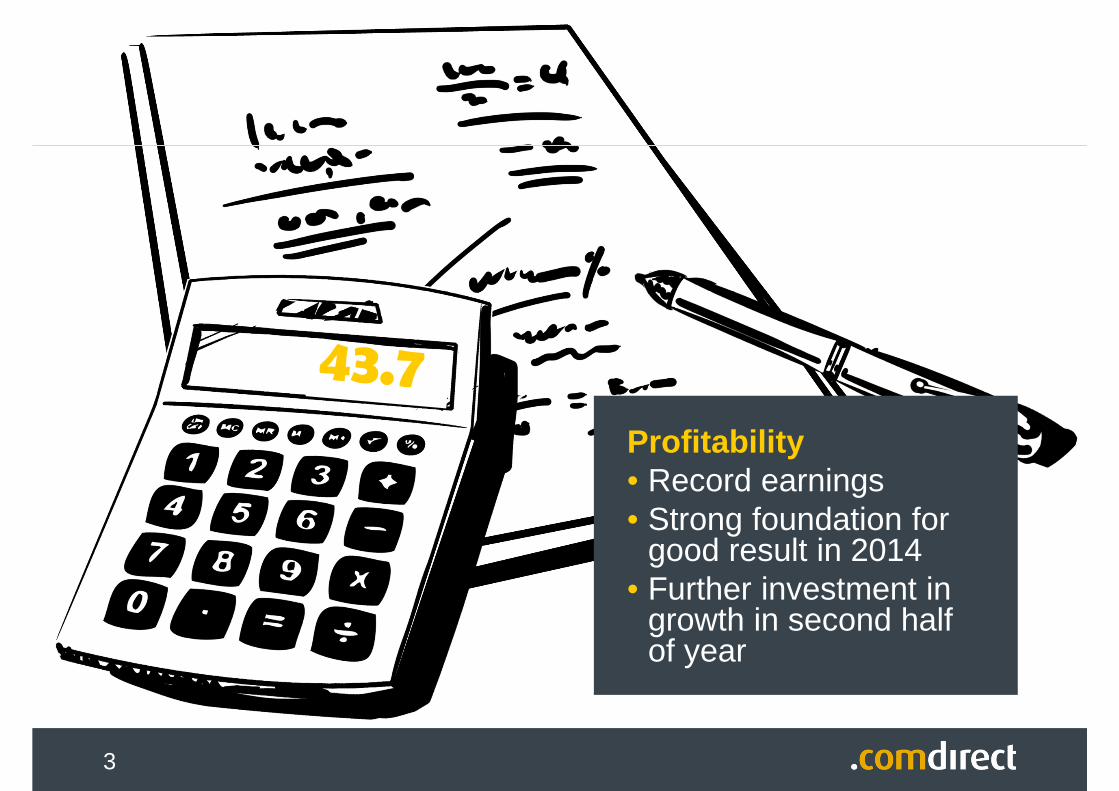
Profitability• Record earnings• Strong foundation for
good result in 2014• Further investment in
growth in second half of year
3
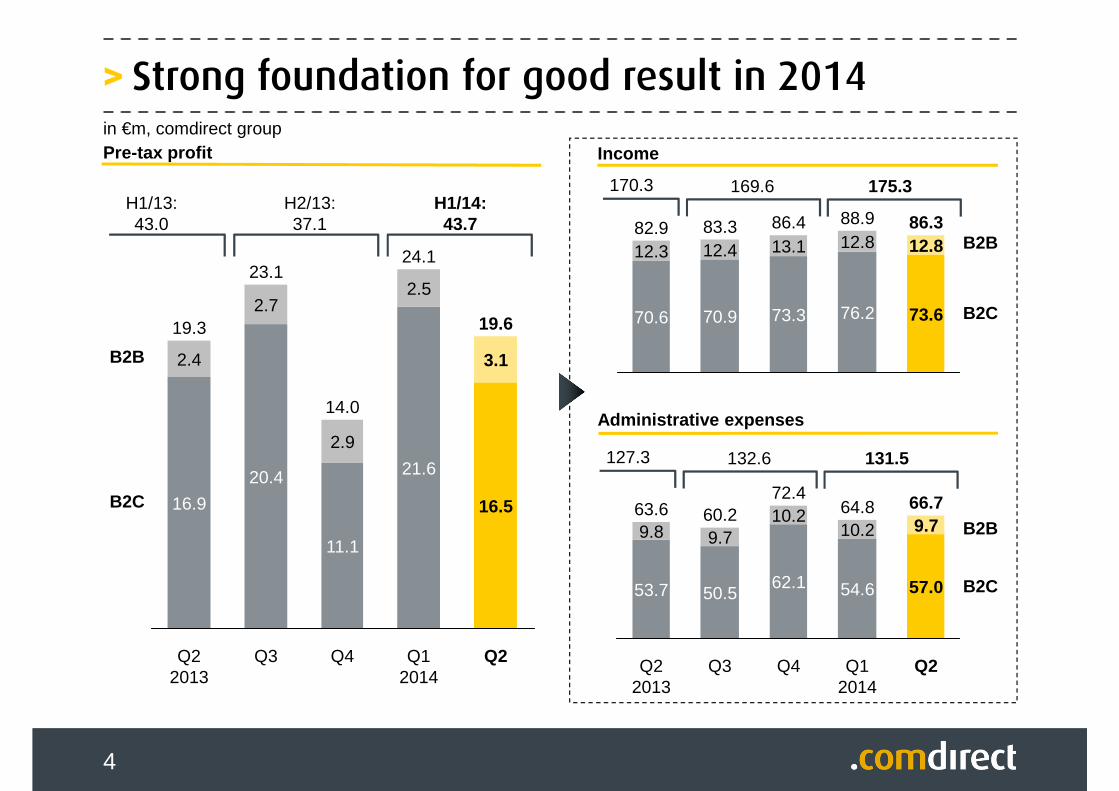
> Strong foundation for good result in 2014
4
Q2
66.7
57.0
9.7
Q12014
64.8
54.6
10.2
Q4
72.4
62.1
10.2
Q3
60.2
50.5
9.7
Q22013
63.6
53.7
9.8
86.3
73.6
12.8
88.9
76.2
12.886.4
73.3
13.183.3
70.9
12.482.9
70.6
12.3
Q2
19.6
Q4
16.5
3.1
Q12014
24.1
21.6
2.9
Q3
2.5
14.0
11.1
23.1
20.4
2.7
Q22013
19.3
16.9
2.4
Pre-tax profit Income
Administrative expenses
B2C
B2B
B2C
B2B
B2C
B2B
in €m, comdirect group
H2/13:37.1
H1/13:43.0
H1/14:43.7
175.3169.6170.3
131.5132.6127.3
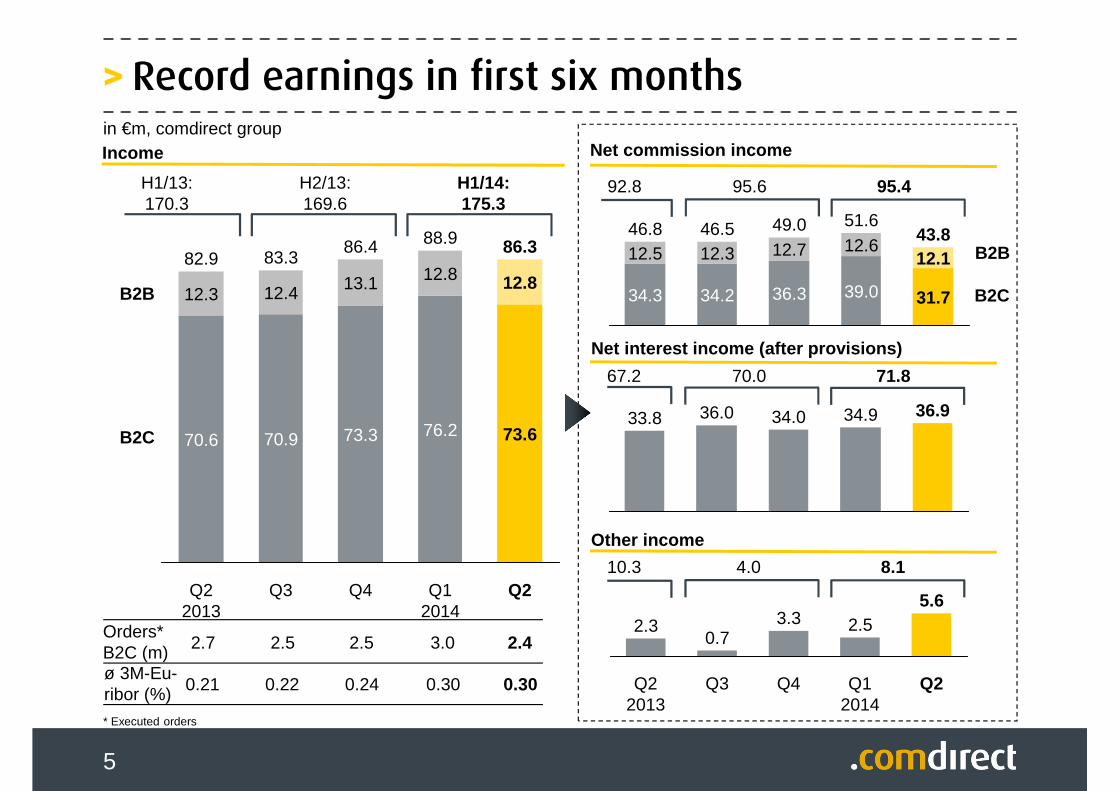
>Record earnings in first six months
5
Q2
86.3
73.6
12.8
Q12014
88.9
76.2
12.8
Q4
86.4
73.3
13.1
Q3
83.3
70.9
12.4
Q22013
82.9
70.6
12.3
Income
Other income
Net interest income (after provisions)
Net commission income
46.546.812.3
49.0
34.3 34.2 36.3
12.7 12.6
39.0
12.543.8
31.7
12.1
51.6
36.0 36.933.8 34.0 34.9
Q12014
2.55.6
Q4 Q2
3.3
Q3
0.7
Q22013
2.3
B2B
B2C
B2C
Orders*B2C (m)ø 3M-Eu-ribor (%)
B2B
2.7
0.21
2.5
0.22
in €m, comdirect group
2.5
0.24
* Executed orders
3.0
0.30
2.4
0.30
H1/14:175.3
H2/13:169.6
H1/13:170.3
95.495.692.8
71.870.067.2
8.14.010.3
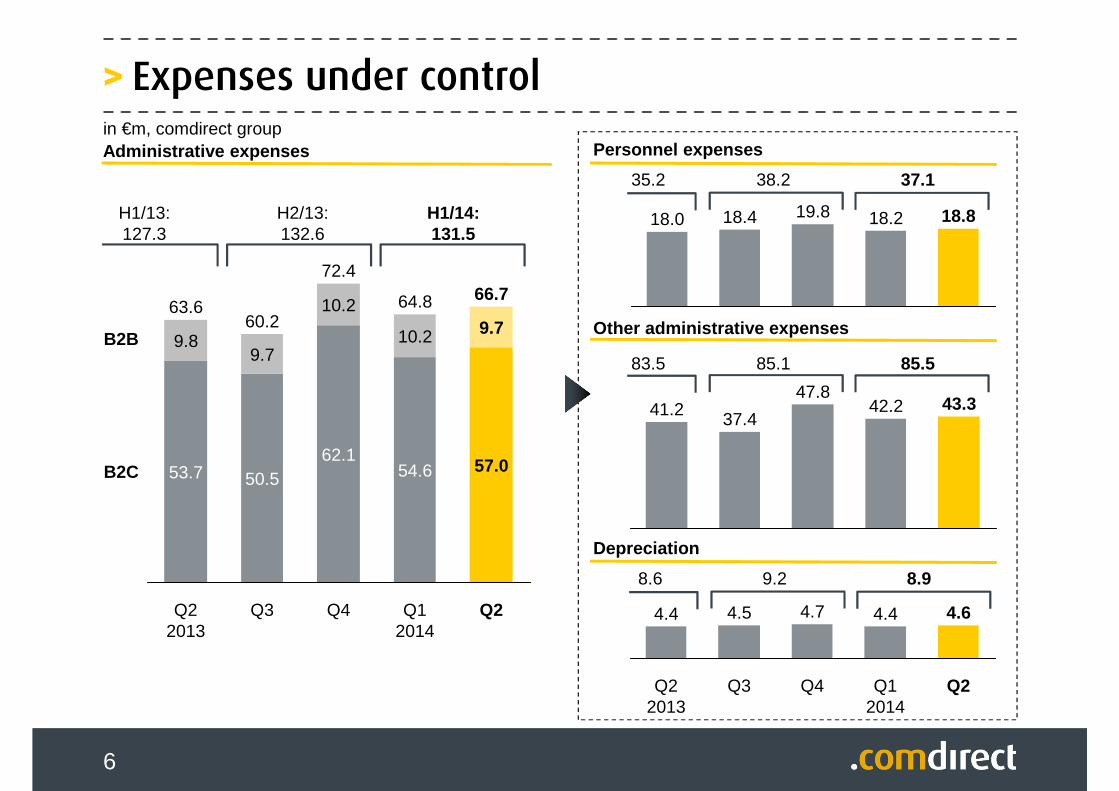
> Expenses under control
6
4.6
Q2
4.4
Q12014
Q4
4.7
Q3
4.5
Q22013
4.4
Depreciation
Other administrative expenses
Personnel expenses
47.843.342.2
37.441.2
18.818.219.818.418.0
57.0
Q2
50.5
9.7
Q22013
63.6
53.7
9.8
Q12014
64.8
54.6
10.2
Q4
72.4
62.1
9.710.2
Q3
60.2
66.7
Administrative expenses
B2B
B2C
in €m, comdirect group
H1/14:131.5
H2/13:132.6
H1/13:127.3
37.138.235.2
85.585.183.5
8.99.28.6
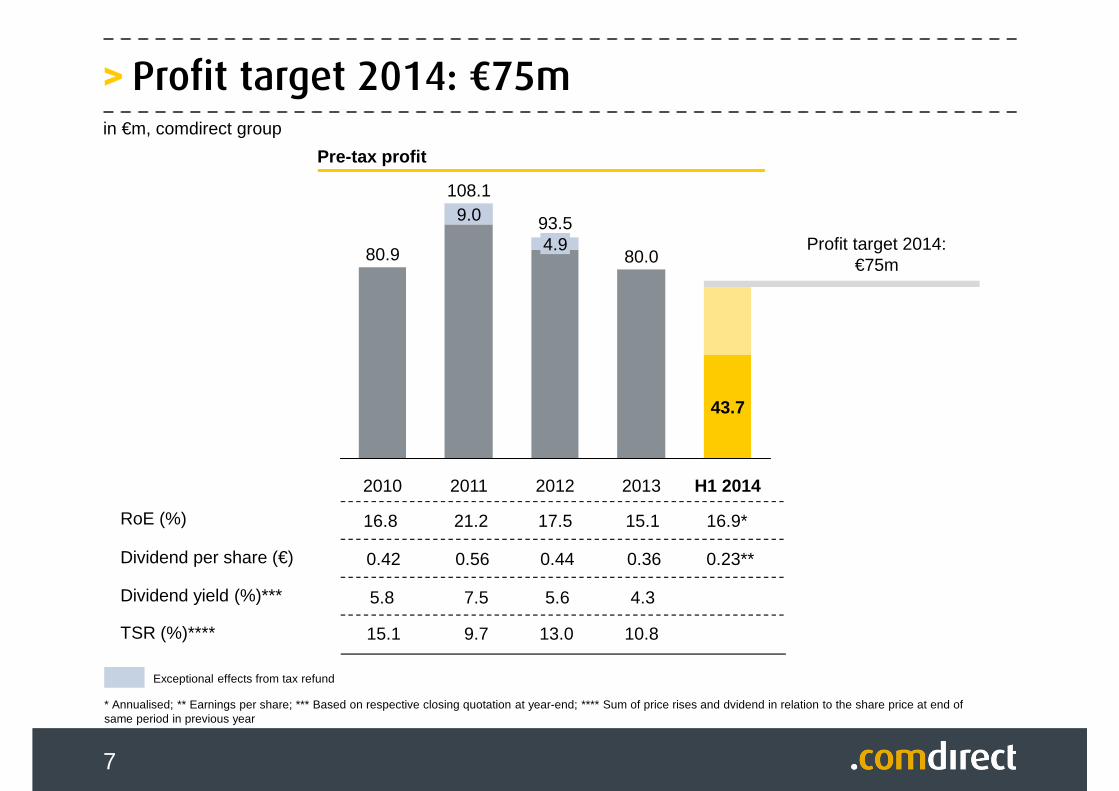
> Profit target 2014: €75m
7
Dividend per share (€)
Dividend yield (%)***
RoE (%)
2013
43.7
H1 2014
9.0
2010
80.9 80.0
2012
93.54.9
2011
108.1
16.8
0.42
5.8
21.2
0.56
7.5
TSR (%)**** 15.1 9.7
17.5
0.44
Pre-tax profit
in €m, comdirect group
5.6
13.0
15.1
0.36
4.3
10.8
Profit target 2014:€75m
* Annualised; ** Earnings per share; *** Based on respective closing quotation at year-end; **** Sum of price rises and dvidend in relation to the share price at end of same period in previous year
0.23**
16.9*
Exceptional effects from tax refund
8
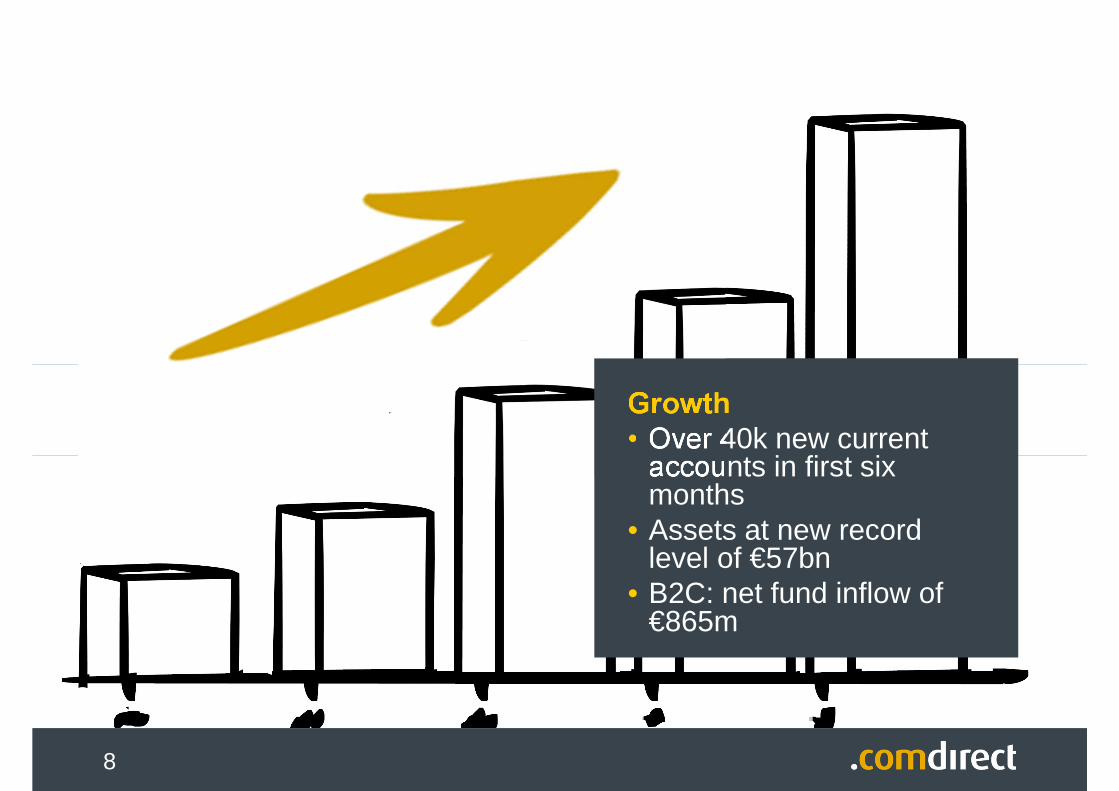
Growth• Over 40k new current
accounts in first six months
• Assets at new record level of €57bn
• B2C: net fund inflow of €865m
8
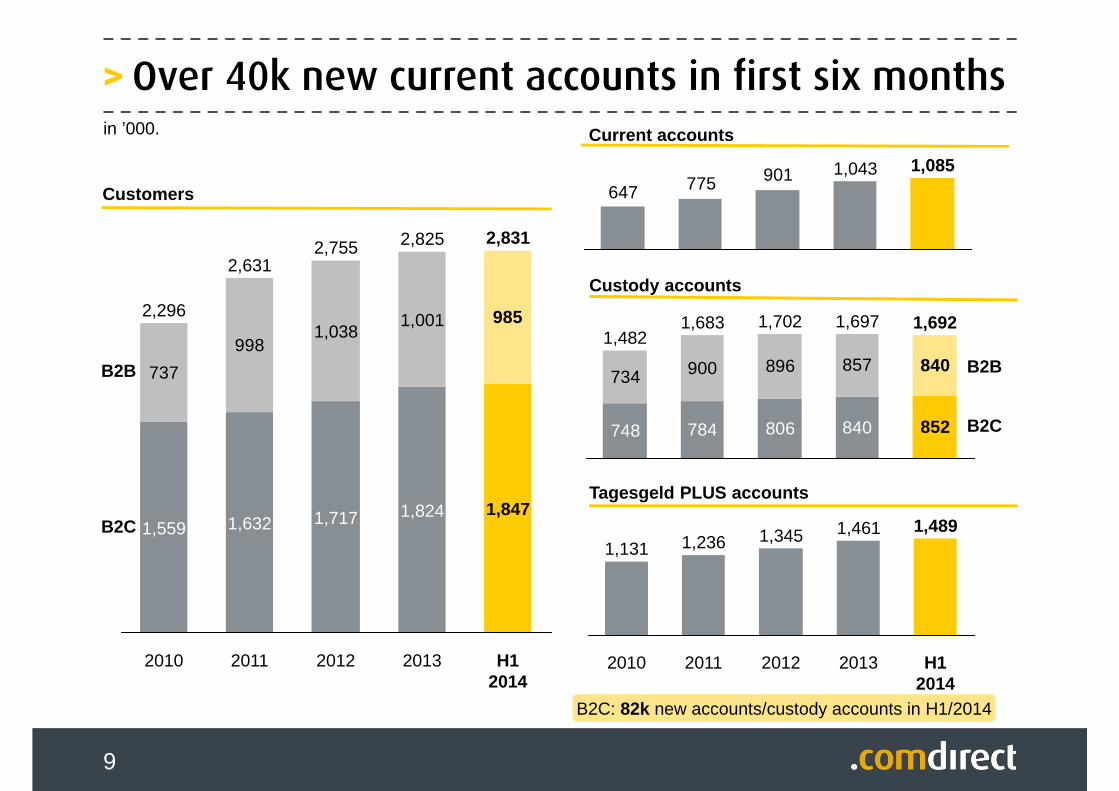
>Over 40k new current accounts in first six months
9
737
998
985
H12014
2,831
1,847
2010
2,296
1,559
2013
2,825
1,824
1,001
2012
2,755
1,717
1,038
2011
2,631
1,632
Customers
B2C
B2B
H12014
1,489
2010
1,131
2013
1,461
2012
1,345
2011
1,236
901775647
1,0851,043
B2C
B2B
Tagesgeld PLUS accounts
Custody accounts
784 806 840
734 900 896 857
852748
840
1,6831,482
1,697 1,6921,702
in ’000.
B2C: 82k new accounts/custody accounts in H1/2014
Current accounts
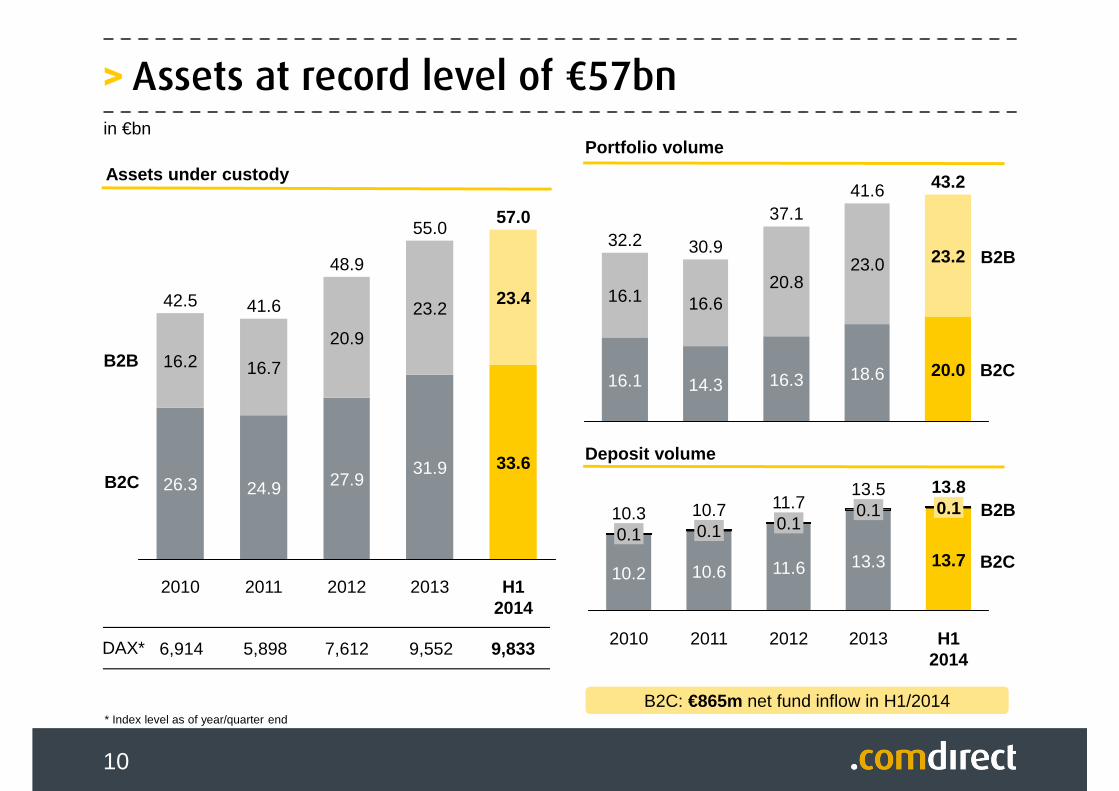
>Assets at record level of €57bn
10
* Index level as of year/quarter end
H12014
57.0
33.6
23.4
2013
55.0
31.9
23.2
2012
48.9
27.9
20.9
2011
41.6
24.9
16.7
2010
42.5
26.3
16.2
B2C
B2B
43.2
20.0
23.2
41.6
18.6
23.0
37.1
16.3
20.8
30.9
14.3
16.6
32.2
16.1
16.1
Portfolio volume
Deposit volume
B2B
B2C
Assets under custody
DAX* 5,8986,914 7,612
10.7
10.6
0.1
2010
10.3
10.2
0.1
H12014
13.7
0.1
2012
11.7
11.6
0.1
2011
13.80.1
2013
13.5
13.3
in €bn
B2B
B2C
9,552 9,833
B2C: €865m net fund inflow in H1/2014
1111
Strategy• Launch of convincing solution
for long-term investments• “Better financial investments”
tool for high quality capital investments including ETFs
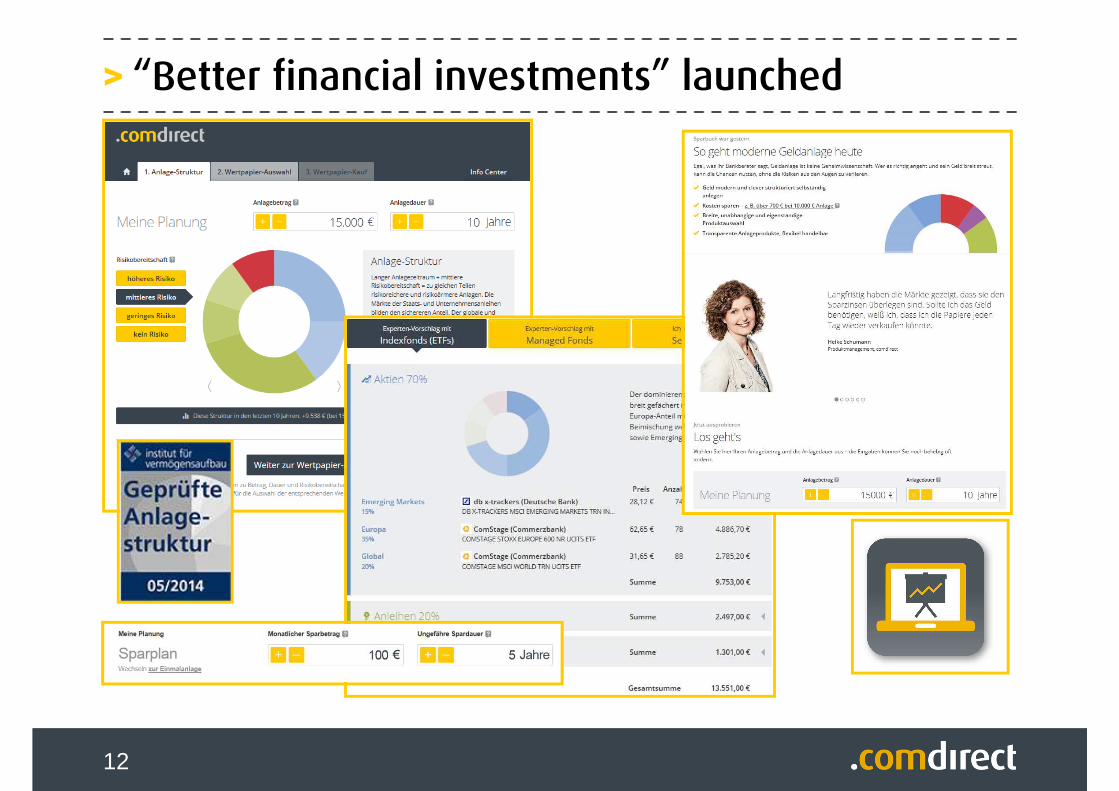
> “Better financial investments” launched
12
> Convincing first six months
13
• Strong pre-tax profit of €43.7m; profit target 2014: €75m
• Record earnings
• Current account as growth driver
• Launch of convincing solution for long-term investments

14
NOTES
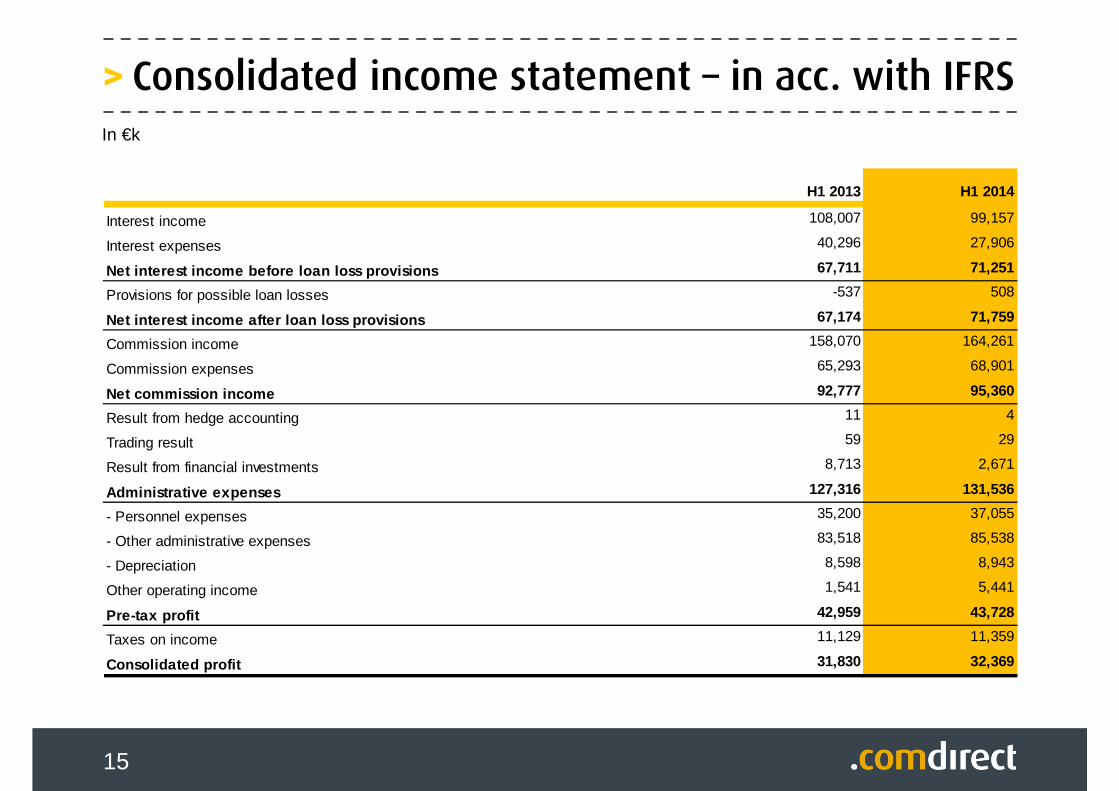
> Consolidated income statement – in acc. with IFRS
15
In €k
H1 2013 H1 2014
Interest income 108,007 99,157
Interest expenses 40,296 27,906
Net interest income before loan loss provisions 67,711 71,251
Provisions for possible loan losses -537 508
Net interest income after loan loss provisions 67,174 71,759
Commission income 158,070 164,261
Commission expenses 65,293 68,901
Net commission income 92,777 95,360
Result from hedge accounting 11 4
Trading result 59 29
Result from financial investments 8,713 2,671
Administrative expenses 127,316 131,536
- Personnel expenses 35,200 37,055
- Other administrative expenses 83,518 85,538
- Depreciation 8,598 8,943
Other operating income 1,541 5,441
Pre-tax profit 42,959 43,728
Taxes on income 11,129 11,359
Consolidated profit 31,830 32,369
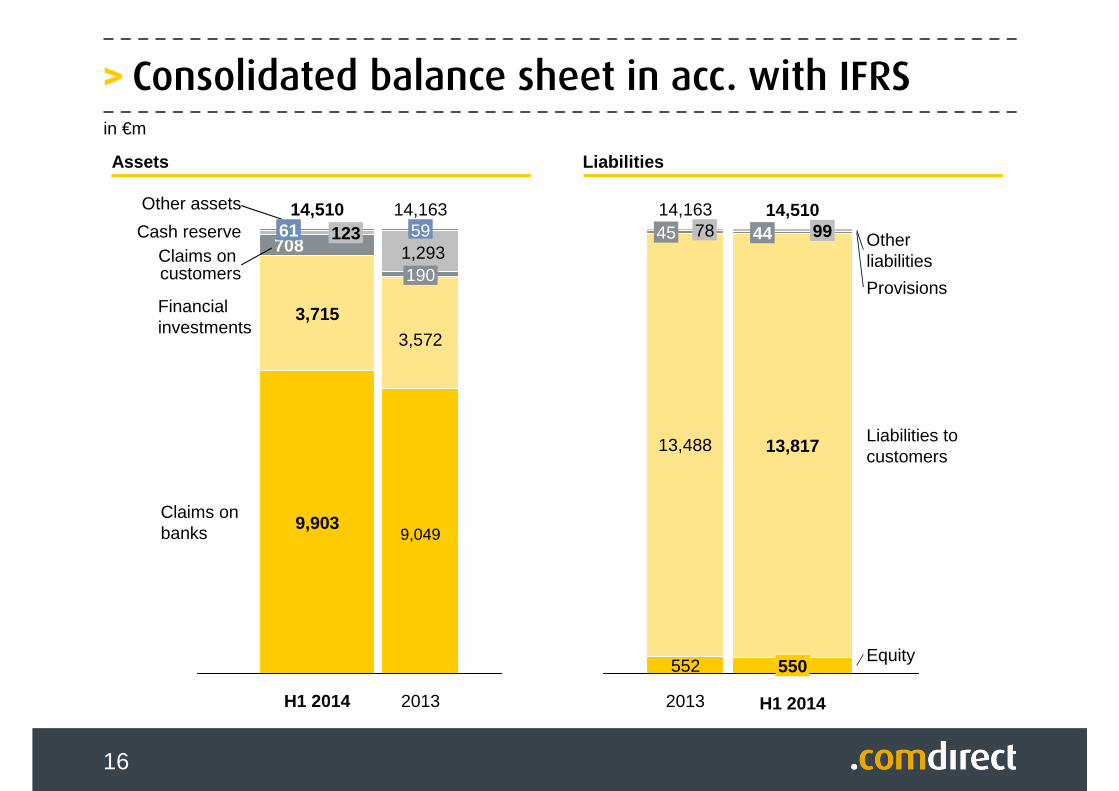
> Consolidated balance sheet in acc. with IFRS
16
in €m
2013
14,163
9.049
3.572
1901.293
59
Assets Liabilities
2013
14,163
552
13.488
45 78
Claims onbanks
Financial investments
Claims on customers
Cash reserve
Other assets
708
H1 2014
14,510
9,903
3,715
12361
Liabilities to customers
Equity
Provisions
Otherliabilities
H1 2014
14,510
550
13,817
44 99
9,049
3,572
1,293
13,488
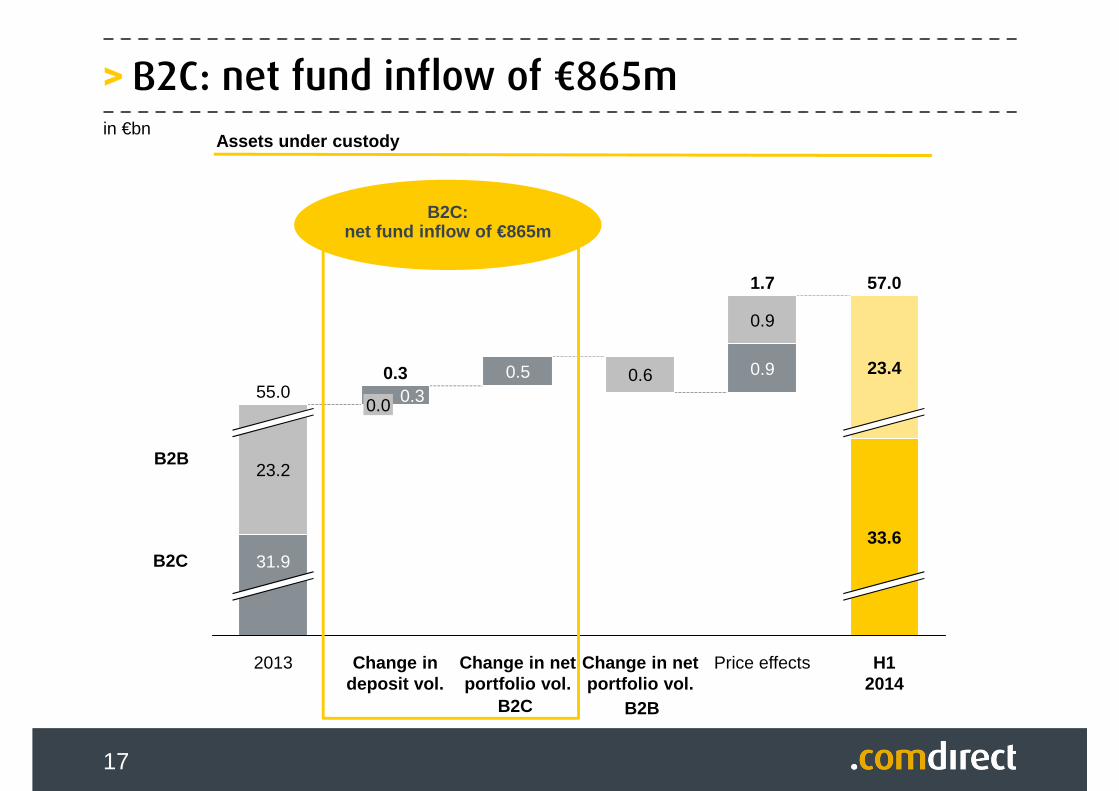
>B2C: net fund inflow of €865m
17
Assets under custodyin €bn
Change in net portfolio vol.
0.60.5
Change in deposit vol.
0.30.30.0
2013
55.0
31.9
23.2
H12014
57.0
33.6
23.4
Price effects
1.7
0.9
0.9
Change in net portfolio vol.
B2C
B2B
B2C:net fund inflow of €865m
B2BB2C
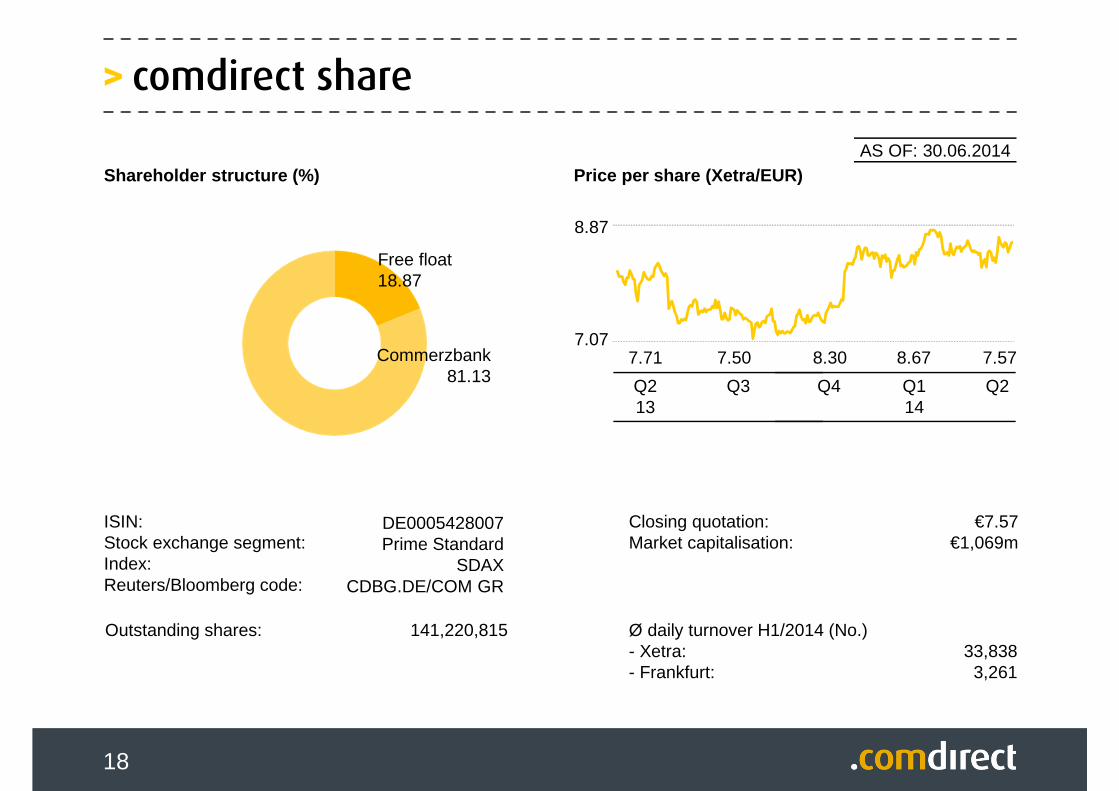
> comdirect share
18
AS OF: 30.06.2014
ISIN:Stock exchange segment:Index:Reuters/Bloomberg code:
141,220,815Outstanding shares:
Commerzbank81.13
Shareholder structure (%) Price per share (Xetra/EUR)
€7.57€1,069m
33,8383,261
Closing quotation:Market capitalisation:
Ø daily turnover H1/2014 (No.)- Xetra:- Frankfurt:
8.87
7.07
Q213
DE0005428007Prime Standard
SDAXCDBG.DE/COM GR
Free float18.87
Q3 Q4
7.71 7.50
Q2
8.30 8.67 7.57
Q114
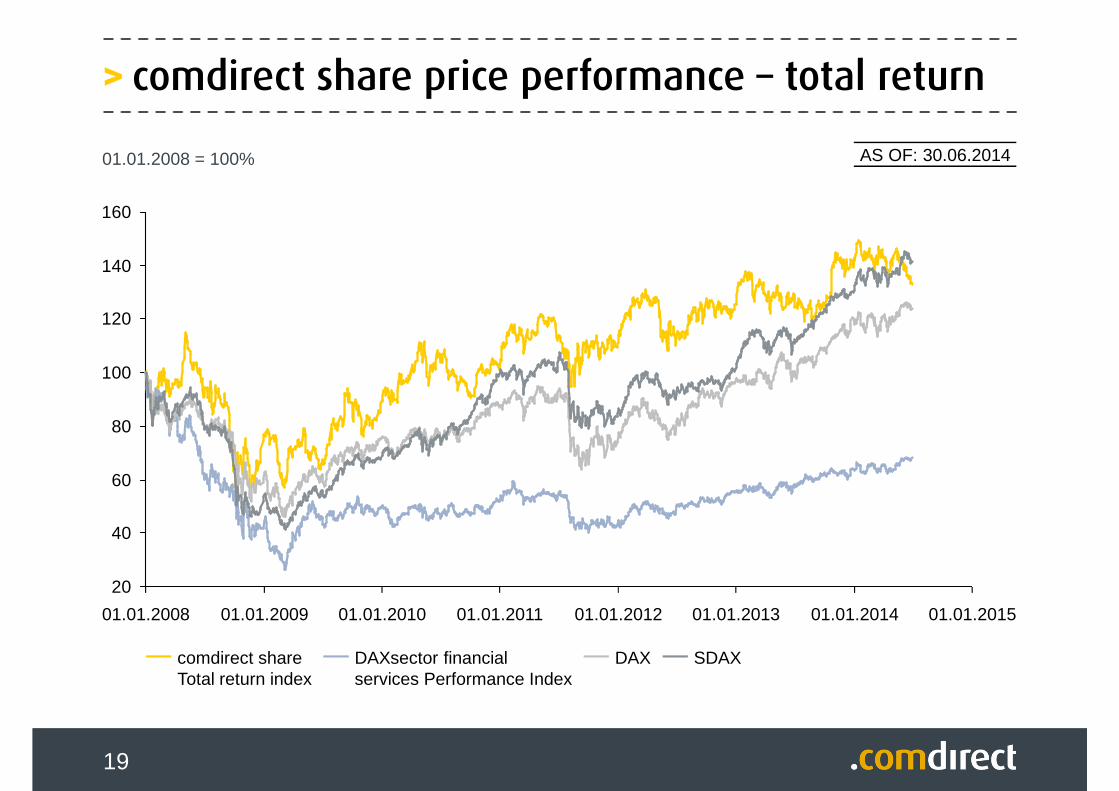
> comdirect share price performance – total return
19
20
40
60
80
100
120
140
160
01.01.2008 01.01.2009 01.01.2010 01.01.2011 01.01.2012 01.01.2013 01.01.2014 01.01.2015
SDAXDAXsector financialservices Performance Index
DAXcomdirect shareTotal return index
01.01.2008 = 100% AS OF: 30.06.2014
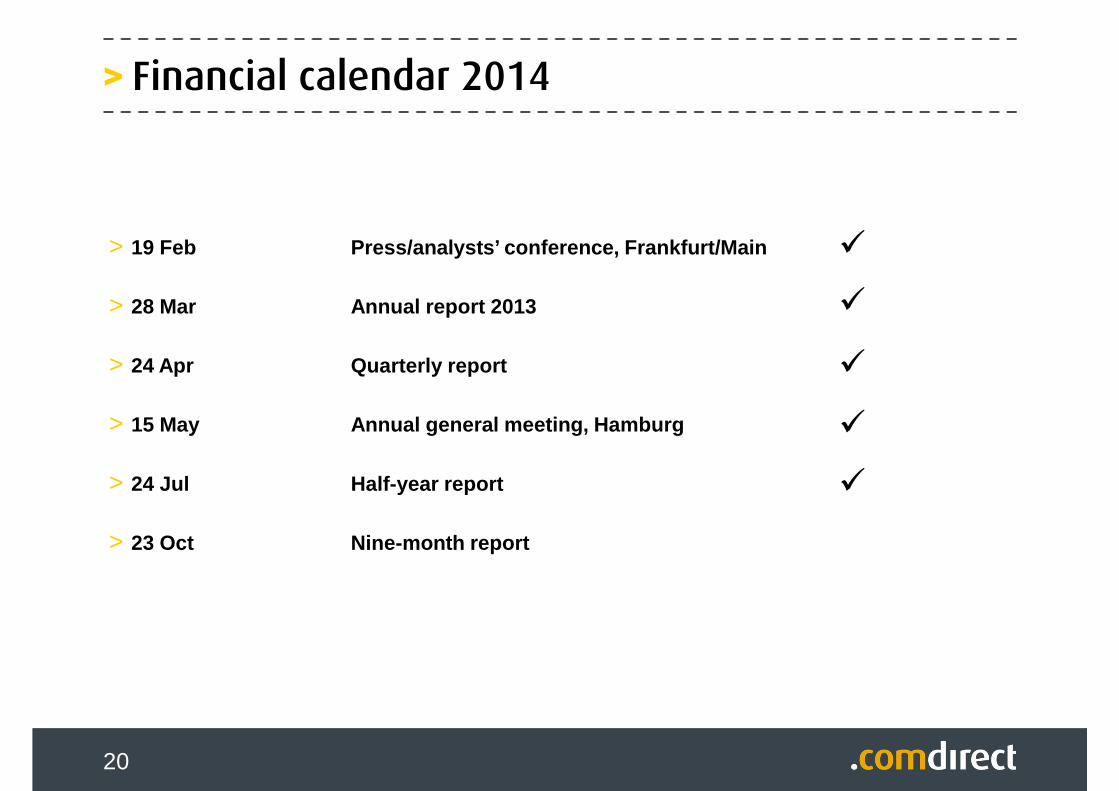
> Financial calendar 2014
20
> 19 Feb Press/analysts’ conference, Frankfurt/Main
> 28 Mar Annual report 2013
> 24 Apr Quarterly report
> 15 May Annual general meeting, Hamburg
> 24 Jul Half-year report
> 23 Oct Nine-month report
> Investor Relations
21
For further information, please contact:
Dr. André Martens
Tel +49 (0) 4106 / 704 1966
e-mail [email protected]
Tobias Vossberg
Tel +49 (0) 4106 / 704 1980
e-mail [email protected]
Stefanie Wallis
Tel +49 (0) 4106 / 704 1383
e-mail [email protected]


![[3Jst December 2014] Supplement to Official Gazette … Payment System... · [3Jst December 2014] Supplement to Official Gazette S.l. 115 of2014 NATIONAL PAYMENT SYSTEM ACT, 2014](https://img.pdfslide.net/doc/110x75/5b7cf51b7f8b9a717e8babce/3jst-december-2014-supplement-to-official-gazette-payment-system-3jst.jpg)

![Untitled-1 []...months months months months](https://img.pdfslide.net/doc/110x75/60cc6a9b3d3a423bd0058c49/-untitled-1-months-months-months-months.jpg)