Embed Size (px)
Citation preview
2017
women in leadership census
B Wa S a S o U t h a F r i c a n
With special thanks to:
Wrenelle Stander (Sasol Senior Vice President: Corporate Affairs), Charlotte Mokoena (Sasol Executive Vice President:
Human Resources and Corporate Affairs), Elsie Pule and Cynthia Khumalo (Eskom), Farzanah Mall (President – BWASA),
Matshepo Msibi (Executive Director – BWASA), Kgomotso Tshaka (Board Member – BWASA),
Kunyalala Maphisa (Brighton Wealth Subsaharan – Editor), Hannah Edinger and Kira McDonald (Deloitte – Research and Analysis),
Dr Namane Magau (Additional Research and Analysis), Kezneth Madongo and Greg Markachuk (Additional Research),
Clara Priester, Ornella Trinco (Lazuli Communications).
In partnership with
Supported by
Produced by
In association with
A Businesswomen’s Association Initiative
BWASA WOMEN IN LEADERSHIP CENSUS 2017 1
IntroductIon ....................................................................... 2
Editor’s Page – Kunyalala Maphisa .......................................................3
Foreword from the BWASA President – Farzanah Mall ............................4
Foreword from Sasol Senior Vice President: Corporate Affairs – Wrenelle Stander ................................................................................5
SEctIon onE: WoMEn in LEAdErShiP introduCtion .......... 6
Executive Summary .............................................................................8
SEctIon tWo: 2017 CEnSuS KEy FindingS ......................... 10
2017 Census results Summary ...........................................................11
top Performing Companies ................................................................20
Worst Performing Companies .............................................................31
SEctIon tHrEE: PriVAtE SECtor rESuLtS ............................... 34
JSE-listed Companies .........................................................................35
interview with dominic Sewela, Chief Executive, Barloworld ..................48
interview with Sandile Zungu, Chairperson, Eoh .................................50
Professional Services Firms .................................................................52
interview with Michael Katz, Chairperson, EnSafrica ............................58
Private Sector-led diversity Policies ......................................................60
SEctIon Four: PuBLiC SECtor rESuLtS ................................ 62
State-owned Enterprises ....................................................................63
interview with Elsie Pule, group Executive for hr, Eskom .......................68
interview with Siyabonga gama, group CEo, transnet ........................70
Public Service Workforce results .........................................................72
SEctIon FIVE: WoMEn in highEr EduCAtion .................... 76
higher Education in South Africa ........................................................77
SEctIon SIX: goVErnMEnt LEgiSLAtion ............................. 86
government Legislation in South Africa ................................................87
government Legislation in the rest of the World ....................................89
SEctIon SEVEn: EMErging MArKEtS & AFriCAn PEErS ....... 92
Women Leadership in Emerging Markets .............................................93
the imperative of Women Empowerment in Africa ................................96
SEctIon EIGHt: CALL to ACtion ........................................ 100
how the BWASA can Assist .............................................................101
BackGround & MEtHodoloGIES ..............................................102
appEndIX: cEnSuS data ..............................................................104
rEFErEncES ..................................................................................116
Contents
“What is not measured cannot be managed”
BWASA WOMEN IN LEADERSHIP CENSUS 20172
introduCtion
INTRODUCTION1
BWASA WOMEN IN LEADERSHIP CENSUS 2017 3
editor’s PAGe
INTRODUCTION 1
kunyalala MaphisaThe Brighton Foundation
that women empowerment is a socio-economic imperative is no longer a debate. it is accepted that the empowerment of women is critical not only for the societies we live in, but also for the economy. Further, and politically, it is understood that the inclusion of women in the political mainstream is critical for the diversity necessary of better decision-making.
More than 10 years after the first publication of this report by the Businesswomen’s Association of South Africa, the South African Women in Leadership Census continues to evolve to help us track and better understand the role of women in the South African economy.
this comes with the need to constantly evaluate where the Census comes from, whether or not it remains relevant and what changes are necessary to ensure that it remains informative and relevant in an ever-changing environment. this year’s South African Women in Leadership Census includes a few additions that are part of this ongoing process.
one of the significant changes includes the addition of women in leadership within the professional services environment including law firms and accounting firms. this is in an effort to expand the Census to include all entities which are significant drivers of the mainstream economy bearing in mind not only the size and number of
employees found in professional services firms, but also the significant impact and role these firms play in the country’s economy.
A particularly interesting change to this year’s Census is the inclusion of mainly male views and perspectives to the issue of women empowerment. this decision was made deliberately in an effort to understand the issue of women empowerment from a male perspective, as, in most cases, men still are the decision makers responsible for appointing women to senior positions or offering them the necessary opportunities.
Finally, and as part of a build up towards producing a report that looks at women empowerment in the mainstream economies of other African countries and in emerging markets, this Census introduces and explores women in leadership positions in listed firms in the BriCS countries and the imperative of women empowerment in the rest of the African continent.
With all these improvements to the Census year on year, we hope to get a more holistic view to both better understand the issues and dynamics around women empowerment, but more importantly to understand why change has been slow and how to improve what remains to be the status quo.
What is clear is that this conversation is far from over.
this is the 11th edition of the South African Women in Leadership Census and as the Businesswomen’s Association of South Africa once again celebrates this milestone, the central question is “Why are we still having this conversation?” and, also “will we ever stop having this conversation?”
Kunyalala Maphisathe Brighton Foundation
BWASA WOMEN IN LEADERSHIP CENSUS 20174
INTRODUCTION1
ForewordFarzanah Mall BwAsA President
King iV’s focus on outcomes based thinking, accountability and oversight places accountability on the governing body to attain the governance outcomes of an ethical culture, good performance and effective control within the organisation and legitimacy with stakeholders. this being noted, the challenges of poor performance, lack of competence, increased competition and high cost structures, puts immense pressure on leadership to get things right.
it is against this backdrop that the Businesswomen’s Association of South Africa (BWASA) is releasing the 2017 Women in Leadership Census publication. the Census over the years has become a valuable tool for both the public and private sector to measure their gender inclusivity and leadership practices.
As i reflect on the results of our research, i would like to share with you some key observations:
• Womenorforthatmatteranypersonshouldnot be promoted or advanced in their career purely for gender parity, transformation purposes or to “tick boxes”, but rather due to them having earned their positions through hard work and achievement of targets and being given the opportunity to demonstrate their capabilities in a work environment where the best talent, male or female, can flourish. As leaders we should not leave behind our value systems and integrity in the hope of positioning for power and self-gain.
• InordertooptimiseBoardroomparticipation,it is critical for leaders to spend time understanding cultural dynamics and differences. We have observed that in certain instances, there is an increase in the number of women appointed to Boards, without a corresponding increase in the quality of their participation, mainly due to women being ignored, overlooked or disregarded and therefore not being heard. to capitalise on diverse talent, insist that teams are integrated across cultures, and you will achieve phenomenal outcomes.
this is the decade of opportunity for entrepre-neurship, enhanced technology, progressive industrialisation, science and innovation. the ability to realise growth targets is dependent on accelerating the pace of empowerment faster than the pace of destruction. We need leaders with strong ethics, commitment, clarity and decisiveness in decision making.
i am pleased that based on our work at the BWASA, we have been able to break barriers, challenge pre-conceived perceptions, expose bias and train leaders on how to transcend their own limited thinking and capitalise on diversity.
We are most grateful to our headline sponsor Sasol and our other sponsors and partners. your ability to foresee the greatest needs of a society and country has the knock-on impact of improving the lives of millions of South Africans. together we can change the world.
the last decade has been characterised by disruption, contradiction and fundamental changes in both business and society. Many organisations (locally and internationally) are in crises with boardroom conflicts and disagreements on the rise, impacting governance and optimal functioning of leadership.
Farzanah MallPresident: Businesswomen’s Association of South Africa
BWASA WOMEN IN LEADERSHIP CENSUS 2017 5
word FroM sAsol
INTRODUCTION 1
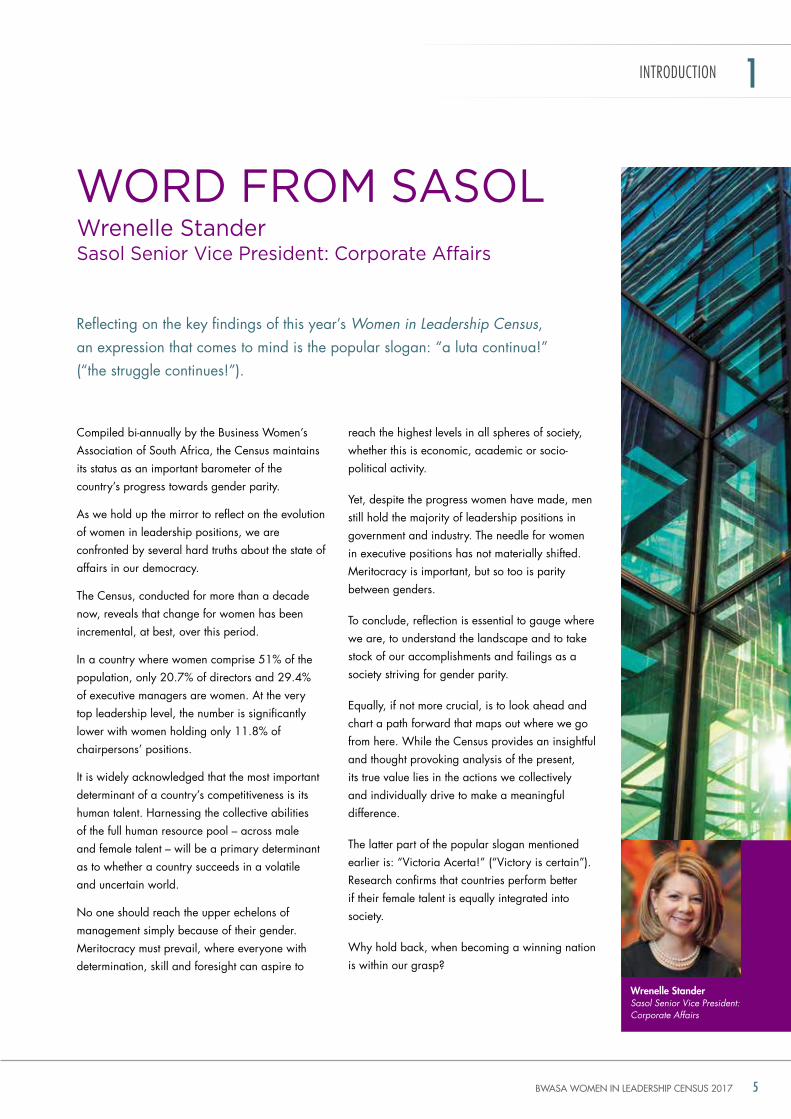
wrenelle stander sasol senior Vice President: Corporate Affairs
Compiled bi-annually by the Business Women’s Association of South Africa, the Census maintains its status as an important barometer of the country’s progress towards gender parity.
As we hold up the mirror to reflect on the evolution of women in leadership positions, we are confronted by several hard truths about the state of affairs in our democracy.
the Census, conducted for more than a decade now, reveals that change for women has been incremental, at best, over this period.
in a country where women comprise 51% of the population, only 20.7% of directors and 29.4% of executive managers are women. At the very top leadership level, the number is significantly lower with women holding only 11.8% of chairpersons’ positions.
it is widely acknowledged that the most important determinant of a country’s competitiveness is its human talent. harnessing the collective abilities of the full human resource pool – across male and female talent – will be a primary determinant as to whether a country succeeds in a volatile and uncertain world.
no one should reach the upper echelons of management simply because of their gender. Meritocracy must prevail, where everyone with determination, skill and foresight can aspire to
reach the highest levels in all spheres of society, whether this is economic, academic or socio-political activity.
yet, despite the progress women have made, men still hold the majority of leadership positions in government and industry. the needle for women in executive positions has not materially shifted. Meritocracy is important, but so too is parity between genders.
to conclude, reflection is essential to gauge where we are, to understand the landscape and to take stock of our accomplishments and failings as a society striving for gender parity.
Equally, if not more crucial, is to look ahead and chart a path forward that maps out where we go from here. While the Census provides an insightful and thought provoking analysis of the present, its true value lies in the actions we collectively and individually drive to make a meaningful difference.
the latter part of the popular slogan mentioned earlier is: “Victoria Acerta!” (“Victory is certain”). research confirms that countries perform better if their female talent is equally integrated into society.
Why hold back, when becoming a winning nation is within our grasp?
reflecting on the key findings of this year’s Women in Leadership Census, an expression that comes to mind is the popular slogan: “a luta continua!” (“the struggle continues!”).
Wrenelle StanderSasol Senior Vice President: Corporate Affairs
BWASA WOMEN IN LEADERSHIP CENSUS 20176
woMen in leAdershiP introduCtion
INTRODUCTION1
seCtion 1:
BWASA WOMEN IN LEADERSHIP CENSUS 2017 7
By having at least
3
INTRODUCTION 1
gender diversity has been key to this discourse. research suggests that having at least three women on boards constitutes a critical mass, allowing women to contribute more equally to the decision making of the group. By having at least three women on a board, women’s opinions and ideas are more likely to be heard, leading to substantial changes in the dynamics of the boardroom.2
the 2016 report by the Peterson institute for international Economics, Is Gender Diversity Profitable?, further makes the business case for having women represented at board level, showing that moving from no women board members to a 30% representation correlates to a profitability increase of 15%.3 Similarly, a report by MSCi has shown that gender-diverse boards can result in higher returns on equity, sometimes to as much as 36%.4
the lack of women in corporate leadership positions continues to be both a political and an economic issue. historically, corporate boardrooms have largely been dominated by men but this has been challenged in recent years as both companies and shareholders have come to see the value of having a more gender-balanced board. As more women are being offered seats at the boardroom table, companies are benefitting from their different perspectives and unique management style. Boards which are able to draw on a diversity of perspectives to overcome challenges are able to generate greater value for investors and other shareholders.
the international Corporate governance network (iCgn) in 2015 emphasised that “board diversity is as much about the culture within the boardroom and acceptance of a diversity of views, as it is about having diversity (of gender or otherwise) around the boardroom table.”5
Across geographies, although notable data gaps exist, women representation on boards remains below that of men. the 2016 Global Gender Gap Report indicates that, based on available data, the representation of women on boards across countries measured was only 14%. of the countries measured, only five countries managed to achieve a 30% or more participation threshold.6 the MSCi Women on Boards Report 2016 echoes this, with also only five countries achieving 30% or more representation.7 in both reports, the two nordic countries, iceland and norway, that perform the best have a legislated minimum 40% quota of women on boards of publicly listed companies.
one of the main objectives of the Women in
leadership census continues to be an improvement in the overall numbers and representation of women as corporate leaders in South Africa. While female representation at the board level remains unlegislated in South Africa, this edition of the Census aims to continue to track and influence decision makers to change the face of gender representation in corporate South Africa.
the King iV report on Corporate governance for South Africa 2016 (King iV)1 emphasises the need for the board of directors to be as diverse as possible in order to take advantage of the benefits and insights offered by a range of different viewpoints and experiences, allowing the board to discharge its governance role and responsibilities as objectively and effectively as possible. An optimal mix of skills, expertise and experience allows the board to guide both the business and the company’s strategy most effectively.
1 institute of directors Southern Africa, 2016
2 Kramer et al., 20063 Peterson institute for
international Economics, 2016
4 MSCi, 20155 international Corporate
governance network, 20156 WEF, 20167 MSCi, 2016
women on a board,
women’s opinions and
ideas are more likely to
be heard, leading to
substantial changes
in the dynamics of
the boardroom
BWASA WOMEN IN LEADERSHIP CENSUS 20178
exeCutiVe suMMAry
INTRODUCTION1
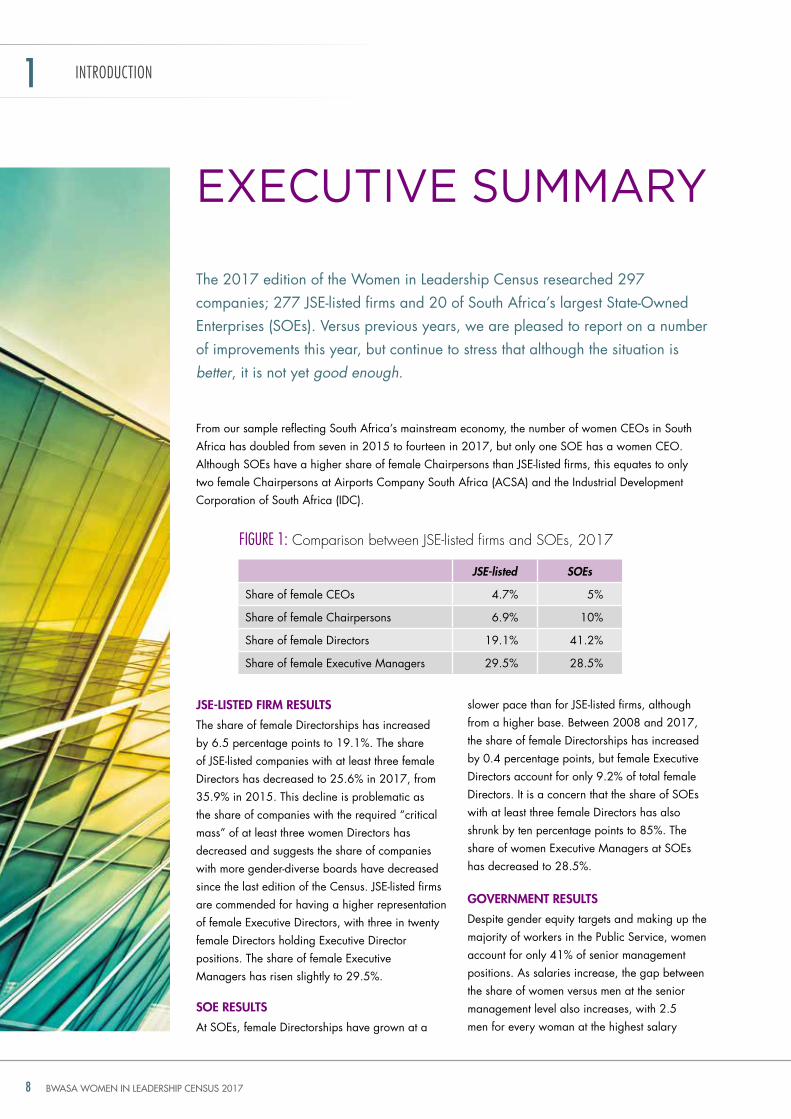
From our sample reflecting South Africa’s mainstream economy, the number of women CEos in South Africa has doubled from seven in 2015 to fourteen in 2017, but only one SoE has a women CEo. Although SoEs have a higher share of female Chairpersons than JSE-listed firms, this equates to only two female Chairpersons at Airports Company South Africa (ACSA) and the industrial development Corporation of South Africa (idC).
JSE-lIStEd FIrM rESultS
the share of female directorships has increased by 6.5 percentage points to 19.1%. the share of JSE-listed companies with at least three female directors has decreased to 25.6% in 2017, from 35.9% in 2015. this decline is problematic as the share of companies with the required “critical mass” of at least three women directors has decreased and suggests the share of companies with more gender-diverse boards have decreased since the last edition of the Census. JSE-listed firms are commended for having a higher representation of female Executive directors, with three in twenty female directors holding Executive director positions. the share of female Executive Managers has risen slightly to 29.5%.
SoE rESultS
At SoEs, female directorships have grown at a
FIgURe 1: comparison between Jse-listed firms and soes, 2017
JSE-listed SOEs
Share of female CEos 4.7% 5%
Share of female Chairpersons 6.9% 10%
Share of female directors 19.1% 41.2%
Share of female Executive Managers 29.5% 28.5%
the 2017 edition of the Women in Leadership Census researched 297 companies; 277 JSE-listed firms and 20 of South Africa’s largest State-owned Enterprises (SoEs). Versus previous years, we are pleased to report on a number of improvements this year, but continue to stress that although the situation is better, it is not yet good enough.
slower pace than for JSE-listed firms, although from a higher base. Between 2008 and 2017, the share of female directorships has increased by 0.4 percentage points, but female Executive directors account for only 9.2% of total female directors. it is a concern that the share of SoEs with at least three female directors has also shrunk by ten percentage points to 85%. the share of women Executive Managers at SoEs has decreased to 28.5%.
GoVErnMEnt rESultS
despite gender equity targets and making up the majority of workers in the Public Service, women account for only 41% of senior management positions. As salaries increase, the gap between the share of women versus men at the senior management level also increases, with 2.5 men for every woman at the highest salary
BWASA WOMEN IN LEADERSHIP CENSUS 2017 9
INTRODUCTION 1
band (level 16) within the Public Service sector. Encouragingly, African women as a share of senior management positions saw the most significant growth between 2015 and 2016, increasing by 7.3 percentage points.
HIGHEr EducatIon rESultS
there has been little improvement in the share of
women in leadership positions at South Africa’s
higher education institutions (hEis) since the
Census first examined the issue in 2015. Women
fill only 15% of decision-making Vice Chancellor
positions. Although women hold the majority of
Chancellor seats, this is a largely ceremonial
role with little decision-making power. only nine
women hold the position of dean in science,
technology, engineering and mathematics (StEM)
schools. Less than a third of Executive director and
Manager positions are held by women, offering
little opportunity for women to move from the
managerial level to top leadership positions.
on a positive note, more women than men
continue to enrol at universities and women attain
62% of total degrees. Although fewer women
than men enrol in StEM courses, the share of
women who graduate with a StEM degree
(21%) is higher than men (17%).
GoVErnMEnt lEGISlatIon rESultS
in South Africa, women in the workplace are protected by several laws enshrined in the Constitution. Legislation requiring gender representation in the workplace is not in place in South Africa, following the lapsing of the Women Empowerment and gender Equality (WEgE) Bill. Several countries have implemented diversity legislation and gender quotas, particularly with regards to the representation of women on boards of either public or private companies. in January 2017 the JSE included a requirement for all listed companies to disclose the targets they have set for gender representation at the board level
and the progress that has been made against achieving these. it is hoped that companies will be held accountable by investors and other stakeholders for meeting their self-imposed gender targets.
EMErGInG MarkEtS and aFrIca rESultS
Although directorships have been increasing at
the fastest rate in emerging markets, this has been
less through legislation, which has often been
the case in advanced economies. Amongst its
BriCS peers, South Africa stands out, but is
increasingly contested by india, who has doubled
the share of women on boards in two years. in
contrast to the emerging market trend, india’s
results have been achieved by amendments in
their Companies Act of 2013, which legislates
at least one women representative on company
boards. of listed companies with at least three
female board members, China has the largest
share of female CEos with 12.5%, followed by
india (8.3%) and then South Africa. russia is the
top performer when looking at women in Senior
Management positions (47% of Senior Managers
are women), followed by China (31%), and
South Africa.
While comparative indicators across many
African economies are yet to exist, several African
economies have acknowledged the imperative
of women empowerment, especially at a time
when the continent’s growth model needs a
revamp. Sustainably growing African economies
will increasingly depend on both developing
and including countries’ full human capital
resources. Progress is still lacking in this regard
given that out of 52 countries, only five relatively
small countries have parity (or women exceed
men) in labour force participation rates. As
developing human capital resources starts with
education; similarly, female tertiary enrolment
continues to lag that of males in most countries.
BWASA WOMEN IN LEADERSHIP CENSUS 201710
2017 Census Key FindinGs
seCtion 2:
2017 CeNsUs Key FINDINgs 2
BWASA WOMEN IN LEADERSHIP CENSUS 2017 11
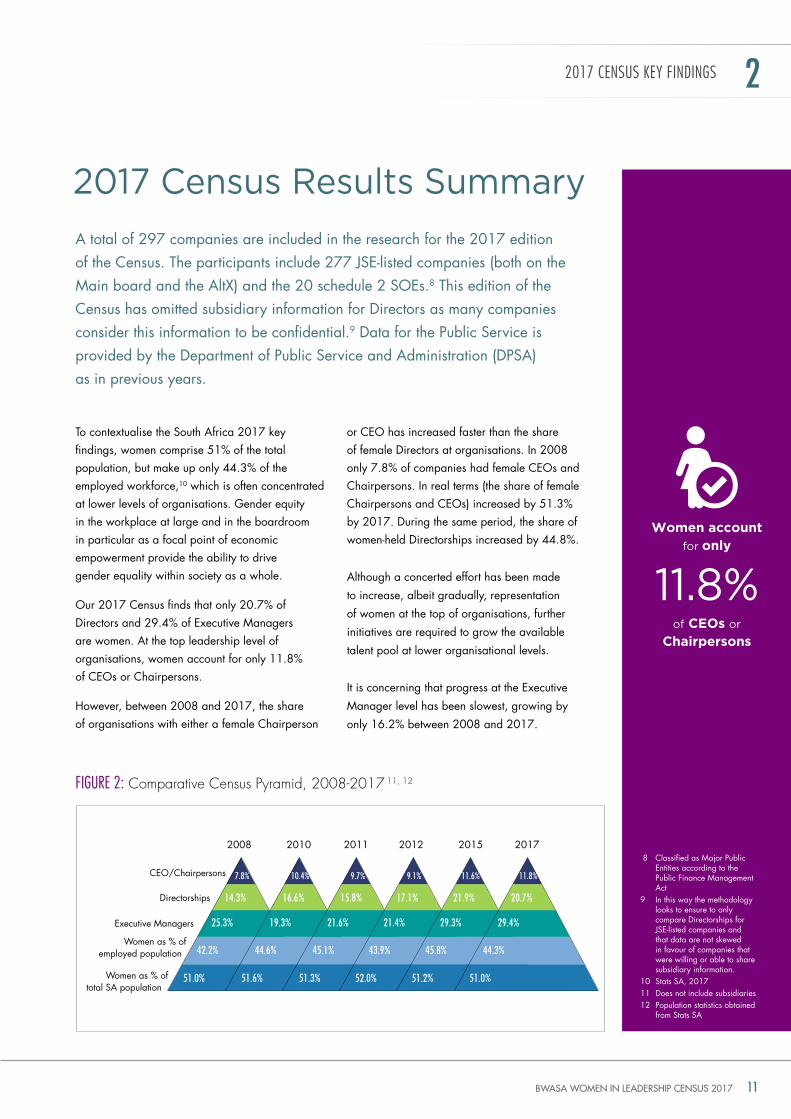
2017 Census results summary
2017 CeNsUs Key FINDINgs 2
to contextualise the South Africa 2017 key findings, women comprise 51% of the total population, but make up only 44.3% of the employed workforce,10 which is often concentrated at lower levels of organisations. gender equity in the workplace at large and in the boardroom in particular as a focal point of economic empowerment provide the ability to drive gender equality within society as a whole.
our 2017 Census finds that only 20.7% of directors and 29.4% of Executive Managers are women. At the top leadership level of organisations, women account for only 11.8% of CEos or Chairpersons.
however, between 2008 and 2017, the share of organisations with either a female Chairperson
or CEo has increased faster than the share of female directors at organisations. in 2008 only 7.8% of companies had female CEos and Chairpersons. in real terms (the share of female Chairpersons and CEos) increased by 51.3% by 2017. during the same period, the share of women-held directorships increased by 44.8%.
Although a concerted effort has been made
to increase, albeit gradually, representation
of women at the top of organisations, further
initiatives are required to grow the available
talent pool at lower organisational levels.
it is concerning that progress at the Executive
Manager level has been slowest, growing by
only 16.2% between 2008 and 2017.
A total of 297 companies are included in the research for the 2017 edition of the Census. the participants include 277 JSE-listed companies (both on the Main board and the AltX) and the 20 schedule 2 SoEs.8 this edition of the Census has omitted subsidiary information for directors as many companies consider this information to be confidential.9 data for the Public Service is provided by the department of Public Service and Administration (dPSA) as in previous years.
8 Classified as Major Public Entities according to the Public Finance Management Act
9 in this way the methodology looks to ensure to only compare directorships for JSE-listed companies and that data are not skewed in favour of companies that were willing or able to share subsidiary information.
10 Stats SA, 201711 does not include subsidiaries12 Population statistics obtained
from Stats SA
FIgURe 2: comparative census Pyramid, 2008-2017 11, 12
2008
CEo/Chairpersons
directorships
Executive Managers
Women as % of employed population
Women as % of total SA population
2010 2011 2012 2015 2017
7.8% 10.4%
14.3% 16.6%
25.3% 19.3%
42.2% 44.6%
51.0% 51.6%
9.7% 9.1% 11.6% 11.8%
15.8% 17.1% 21.9% 20.7%
21.6% 21.4% 29.3% 29.4%
45.1% 43.9% 45.8% 44.3%
51.3% 52.0% 51.2% 51.0%
Women account for only
of CEOs or Chairpersons
11.8%
BWASA WOMEN IN LEADERSHIP CENSUS 201712
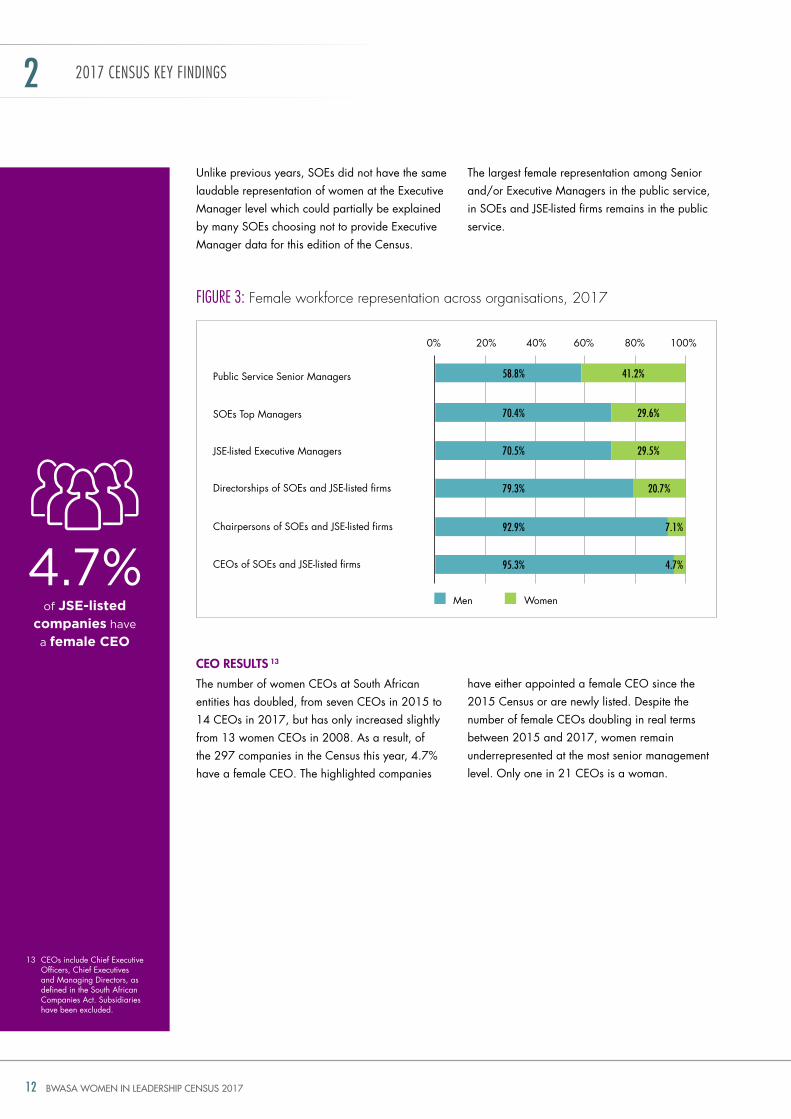
unlike previous years, SoEs did not have the same laudable representation of women at the Executive Manager level which could partially be explained by many SoEs choosing not to provide Executive Manager data for this edition of the Census.
cEo rESultS 13
the number of women CEos at South African entities has doubled, from seven CEos in 2015 to 14 CEos in 2017, but has only increased slightly from 13 women CEos in 2008. As a result, of the 297 companies in the Census this year, 4.7% have a female CEo. the highlighted companies
FIgURe 3: Female workforce representation across organisations, 2017
the largest female representation among Senior and/or Executive Managers in the public service, in SoEs and JSE-listed firms remains in the public service.
have either appointed a female CEo since the 2015 Census or are newly listed. despite the number of female CEos doubling in real terms between 2015 and 2017, women remain underrepresented at the most senior management level. only one in 21 CEos is a woman.
2017 CeNsUs Key FINDINgs 2
of JSE-listed companies have
a female CEO
4.7%
13 CEos include Chief Executive officers, Chief Executives and Managing directors, as defined in the South African Companies Act. Subsidiaries have been excluded.
Public Service Senior Managers
20%0%
58.8%
70.4%
70.5%
79.3%
92.9%
95.3%
Men Women
41.2%
29.6%
29.5%
20.7%
7.1%
4.7%
40% 60% 80% 100%
SoEs top Managers
JSE-listed Executive Managers
directorships of SoEs and JSE-listed firms
Chairpersons of SoEs and JSE-listed firms
CEos of SoEs and JSE-listed firms
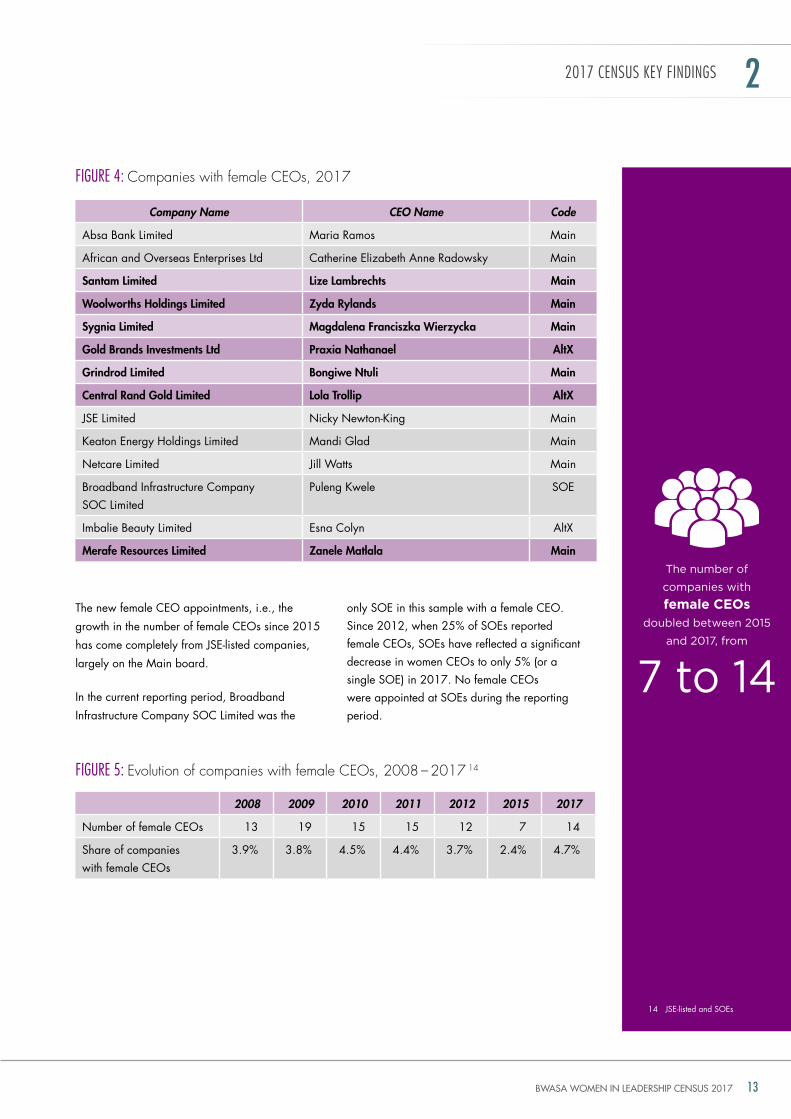
BWASA WOMEN IN LEADERSHIP CENSUS 2017 13
the new female CEo appointments, i.e., the
growth in the number of female CEos since 2015
has come completely from JSE-listed companies,
largely on the Main board.
in the current reporting period, Broadband
infrastructure Company SoC Limited was the
only SoE in this sample with a female CEo. Since 2012, when 25% of SoEs reported female CEos, SoEs have reflected a significant decrease in women CEos to only 5% (or a single SoE) in 2017. no female CEos were appointed at SoEs during the reporting period.
2017 CeNsUs Key FINDINgs 2
14 JSE-listed and SoEs
Company Name CEO Name Code
Absa Bank Limited Maria ramos Main
African and overseas Enterprises Ltd Catherine Elizabeth Anne radowsky Main
Santam limited lize lambrechts Main
Woolworths Holdings limited Zyda rylands Main
Sygnia limited Magdalena Franciszka Wierzycka Main
Gold Brands Investments ltd praxia nathanael altX
Grindrod limited Bongiwe ntuli Main
central rand Gold limited lola trollip altX
JSE Limited nicky newton-King Main
Keaton Energy holdings Limited Mandi glad Main
netcare Limited Jill Watts Main
Broadband infrastructure Company SoC Limited
Puleng Kwele SoE
imbalie Beauty Limited Esna Colyn AltX
Merafe resources limited Zanele Matlala Main
FIgURe 4: companies with female ceos, 2017
FIgURe 5: evolution of companies with female ceos, 2008 – 2017 14
2008 2009 2010 2011 2012 2015 2017
number of female CEos 13 19 15 15 12 7 14
Share of companies with female CEos
3.9% 3.8% 4.5% 4.4% 3.7% 2.4% 4.7%
the number of
companies with
female CEOs doubled between 2015
and 2017, from
7 to 14
BWASA WOMEN IN LEADERSHIP CENSUS 201714
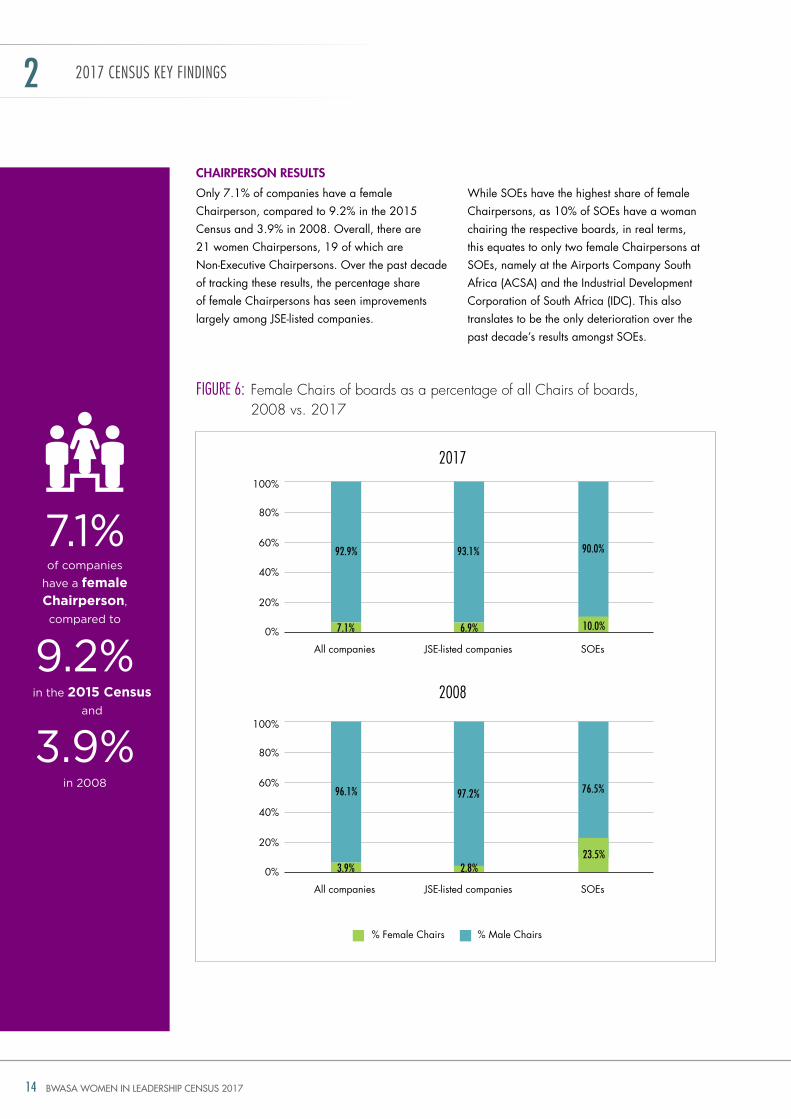
cHaIrpErSon rESultS
only 7.1% of companies have a female Chairperson, compared to 9.2% in the 2015 Census and 3.9% in 2008. overall, there are 21 women Chairpersons, 19 of which are non-Executive Chairpersons. over the past decade of tracking these results, the percentage share of female Chairpersons has seen improvements largely among JSE-listed companies.
FIgURe 6: Female chairs of boards as a percentage of all chairs of boards, 2008 vs. 2017
While SoEs have the highest share of female Chairpersons, as 10% of SoEs have a woman chairing the respective boards, in real terms, this equates to only two female Chairpersons at SoEs, namely at the Airports Company South Africa (ACSA) and the industrial development Corporation of South Africa (idC). this also translates to be the only deterioration over the past decade’s results amongst SoEs.
2017 CeNsUs Key FINDINgs 2
of companies
have a female Chairperson,
compared to
in the 2015 Census
and
7.1%
9.2%
3.9%in 2008
20%
20%
0%
0%
40%
40%
60%
60%
80%
80%
100%
100%
All companies
All companies
JSE-listed companies
JSE-listed companies
SoEs
SoEs
92.9%
96.1%
93.1%
97.2%
90.0%
76.5%
2017
2008
% Female Chairs % Male Chairs
7.1%
3.9%
6.9%
2.8%
10.0%
23.5%
BWASA WOMEN IN LEADERSHIP CENSUS 2017 15
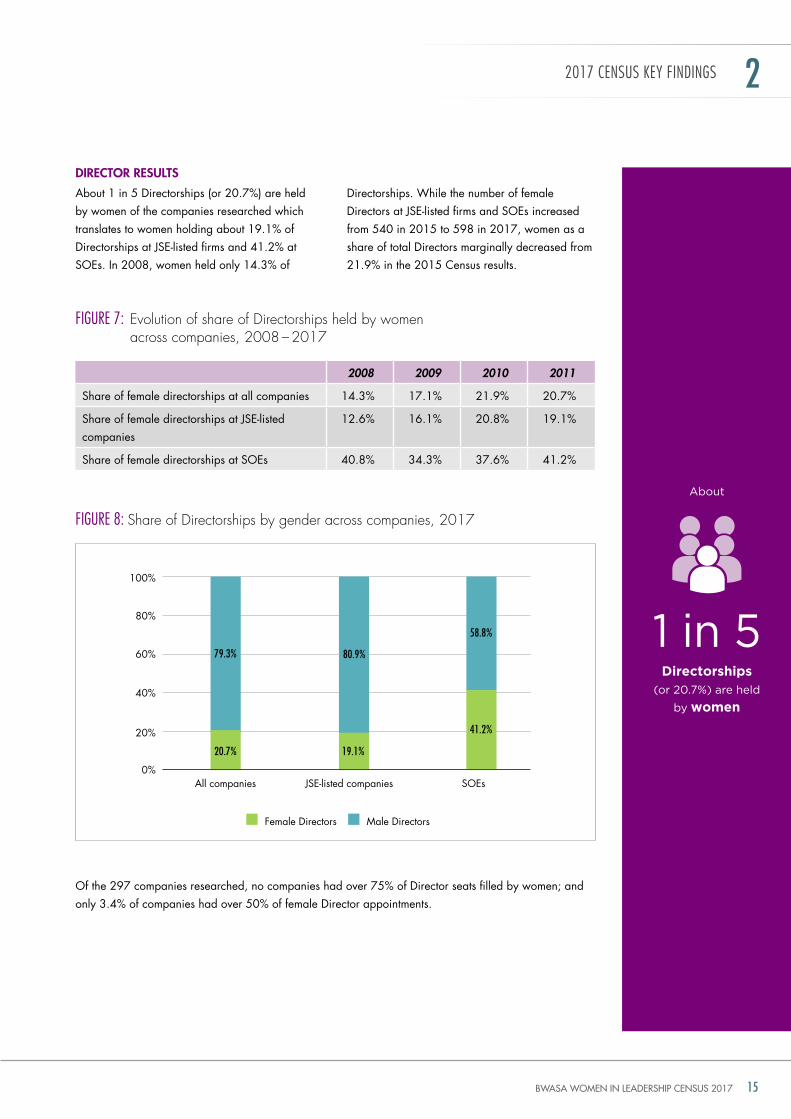
dIrEctor rESultS
About 1 in 5 directorships (or 20.7%) are held by women of the companies researched which translates to women holding about 19.1% of directorships at JSE-listed firms and 41.2% at SoEs. in 2008, women held only 14.3% of
of the 297 companies researched, no companies had over 75% of director seats filled by women; and only 3.4% of companies had over 50% of female director appointments.
directorships. While the number of female directors at JSE-listed firms and SoEs increased from 540 in 2015 to 598 in 2017, women as a share of total directors marginally decreased from 21.9% in the 2015 Census results.
2017 CeNsUs Key FINDINgs 2
FIgURe 7: evolution of share of directorships held by women across companies, 2008 – 2017
FIgURe 8: share of directorships by gender across companies, 2017
2008 2009 2010 2011
Share of female directorships at all companies 14.3% 17.1% 21.9% 20.7%
Share of female directorships at JSE-listed companies
12.6% 16.1% 20.8% 19.1%
Share of female directorships at SoEs 40.8% 34.3% 37.6% 41.2%
Directorships
(or 20.7%) are held
by women
About
1 in 5
20%
0%
40%
60%
80%
100%
All companies JSE-listed companies SoEs
Female directors Male directors
79.3%
20.7% 19.1%
41.2%
80.9%
58.8%
BWASA WOMEN IN LEADERSHIP CENSUS 201716
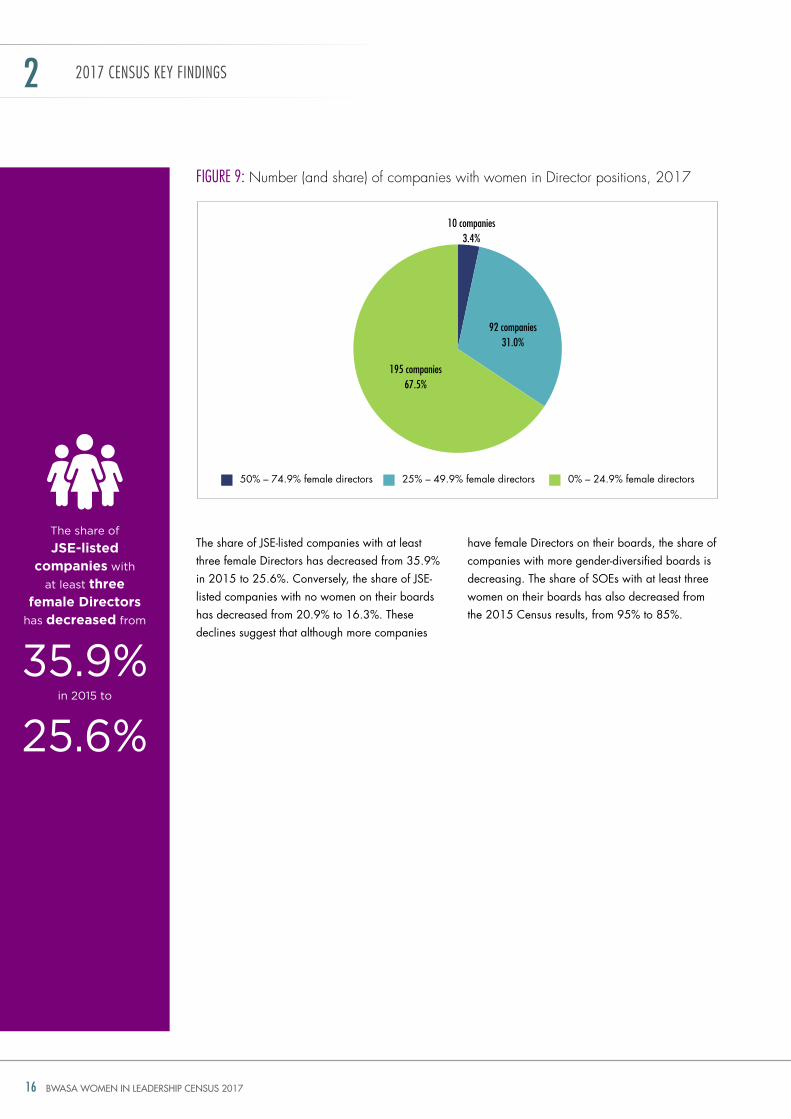
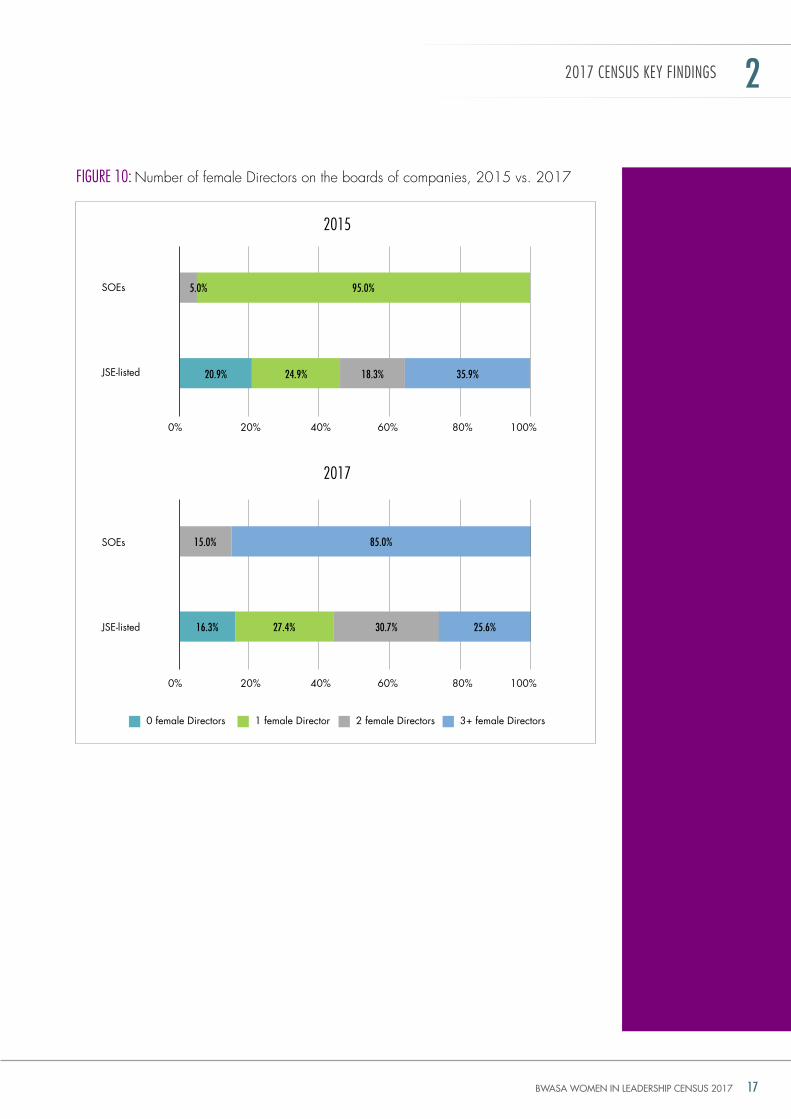
the share of JSE-listed companies with at least three female directors has decreased from 35.9% in 2015 to 25.6%. Conversely, the share of JSE-listed companies with no women on their boards has decreased from 20.9% to 16.3%. these declines suggest that although more companies
FIgURe 9: number (and share) of companies with women in director positions, 2017
have female directors on their boards, the share of companies with more gender-diversified boards is decreasing. the share of SoEs with at least three women on their boards has also decreased from the 2015 Census results, from 95% to 85%.
2017 CeNsUs Key FINDINgs 2
the share of
JSE-listed companies with
at least three female Directors
has decreased from
in 2015 to
25.6%
35.9%
50% – 74.9% female directors 25% – 49.9% female directors 0% – 24.9% female directors
10 companies3.4%
92 companies31.0%
195 companies67.5%
BWASA WOMEN IN LEADERSHIP CENSUS 2017 17
FIgURe 10: number of female directors on the boards of companies, 2015 vs. 2017
2017 CeNsUs Key FINDINgs 2
20%
20%
0%
0%
40%
40%
60%
60%
80%
80%
100%
100%
0 female directors 1 female director 2 female directors 3+ female directors
JSE-listed
JSE-listed
SoEs
SoEs
2015
2017
5.0%
15.0%
20.9%
16.3%
24.9%
27.4%
18.3%
30.7%
35.9%
25.6%
95.0%
85.0%
BWASA WOMEN IN LEADERSHIP CENSUS 201718
Although the data from the current Census shows a total of 1,062 female-held director positions (including subsidiaries), these are only filled by 506 women, with several women holding three or more directorships. the number of women holding director positions has only increased incrementally from the 2015 pool of 500 women.
South Africa’s ‘stretch factor’, calculated by dividing the number of board seats occupied by women in a given country by the total number of women on boards in that particular country, is the fourth highest globally,15 behind France, Australia and the united States. the higher the stretch factor, the greater the number of board seats occupied by the same woman director in a given country. the report calculates South Africa’s stretch factor as 1.32.16 however, if SoEs and subsidiaries are included, this increases the stretch factor to 2.1 according to the 2017 Census data. this higher stretch factor indicates that a greater number of women on boards currently and going forward is likely to only benefit the small (and continuously so) same share of the female population rather than providing for gender parity at the societal level.
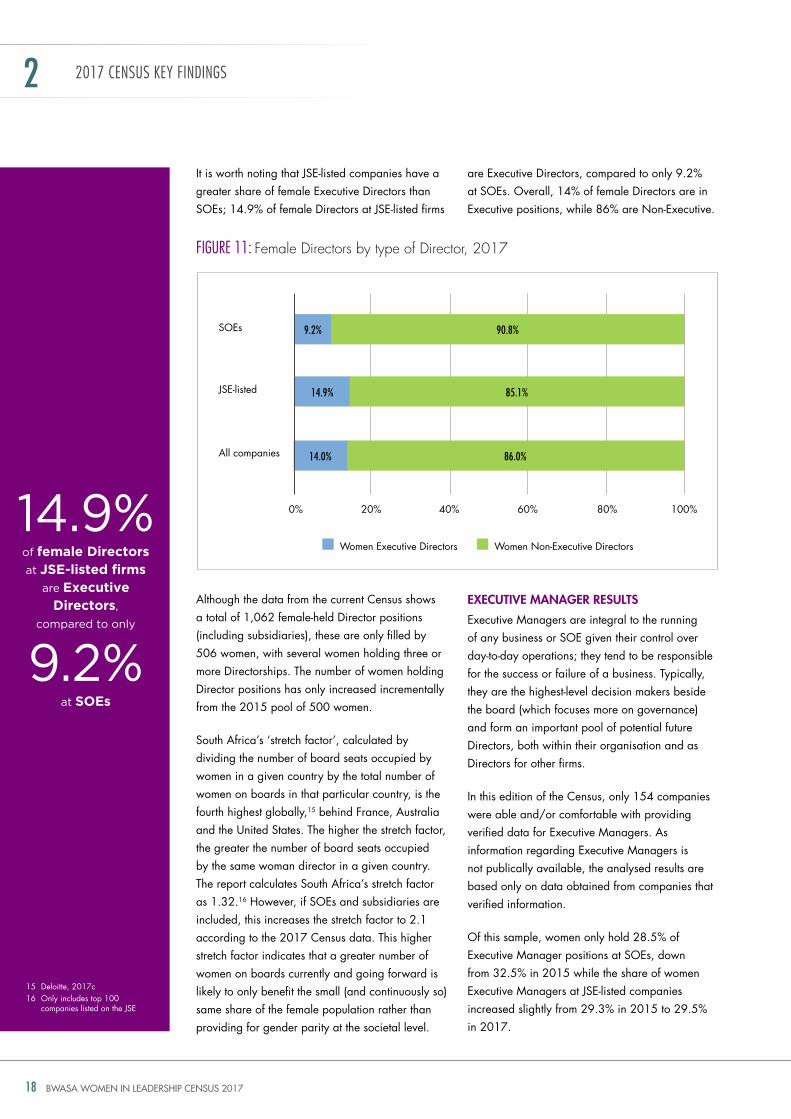
FIgURe 11: Female directors by type of director, 2017
EXEcutIVE ManaGEr rESultS
Executive Managers are integral to the running of any business or SoE given their control over day-to-day operations; they tend to be responsible for the success or failure of a business. typically, they are the highest-level decision makers beside the board (which focuses more on governance) and form an important pool of potential future directors, both within their organisation and as directors for other firms.
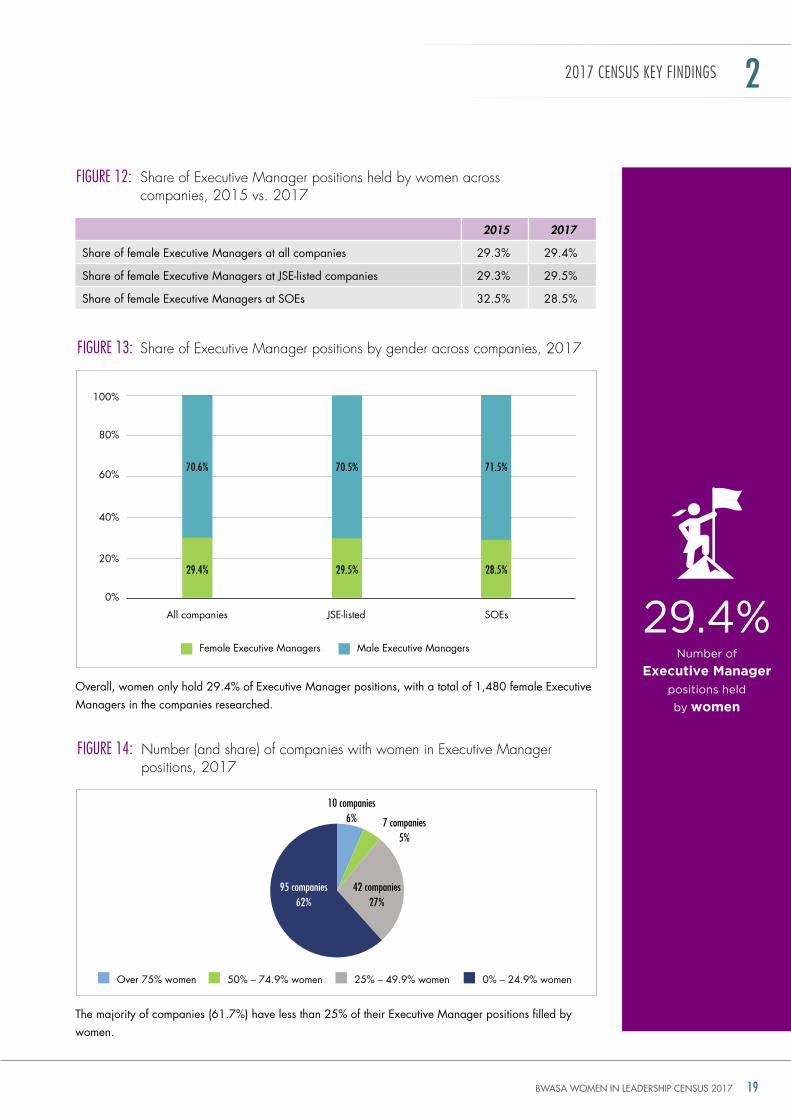
in this edition of the Census, only 154 companies were able and/or comfortable with providing verified data for Executive Managers. As information regarding Executive Managers is not publically available, the analysed results are based only on data obtained from companies that verified information.
of this sample, women only hold 28.5% of Executive Manager positions at SoEs, down from 32.5% in 2015 while the share of women Executive Managers at JSE-listed companies increased slightly from 29.3% in 2015 to 29.5% in 2017.
2017 CeNsUs Key FINDINgs 2
15 deloitte, 2017c16 only includes top 100
companies listed on the JSE
86.0%
Women Executive directors Women non-Executive directors
JSE-listed
All companies
SoEs 9.2%
14.9%
14.0%
85.1%
90.8%
20%0% 40% 60% 80% 100%
it is worth noting that JSE-listed companies have a greater share of female Executive directors than SoEs; 14.9% of female directors at JSE-listed firms
are Executive directors, compared to only 9.2% at SoEs. overall, 14% of female directors are in Executive positions, while 86% are non-Executive.
of female Directors
at JSE-listed firms
are Executive Directors,
compared to only
at SOEs
14.9%
9.2%
BWASA WOMEN IN LEADERSHIP CENSUS 2017 19
overall, women only hold 29.4% of Executive Manager positions, with a total of 1,480 female Executive Managers in the companies researched.
the majority of companies (61.7%) have less than 25% of their Executive Manager positions filled by women.
FIgURe 13: share of executive manager positions by gender across companies, 2017
FIgURe 14: number (and share) of companies with women in executive manager positions, 2017
FIgURe 12: share of executive manager positions held by women across companies, 2015 vs. 2017
2017 CeNsUs Key FINDINgs 2
2015 2017
Share of female Executive Managers at all companies 29.3% 29.4%
Share of female Executive Managers at JSE-listed companies 29.3% 29.5%
Share of female Executive Managers at SoEs 32.5% 28.5%
number of
Executive Manager
positions held
by women
29.4%
20%
0%
40%
60%
80%
100%
All companies JSE-listed SoEs
70.6% 70.5% 71.5%
29.4% 29.5% 28.5%
Female Executive Managers Male Executive Managers
over 75% women 50% – 74.9% women 25% – 49.9% women 0% – 24.9% women
10 companies6% 7 companies
5%
42 companies27%
95 companies62%
BWASA WOMEN IN LEADERSHIP CENSUS 201720
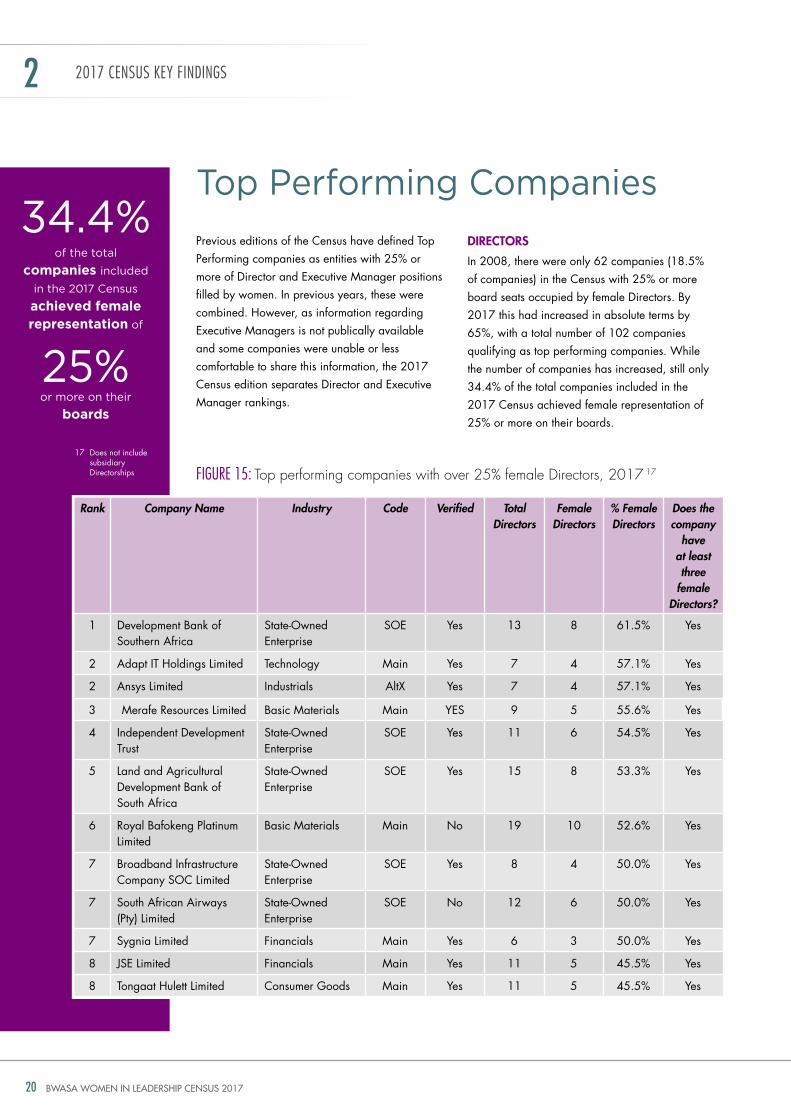
Previous editions of the Census have defined top Performing companies as entities with 25% or more of director and Executive Manager positions filled by women. in previous years, these were combined. however, as information regarding Executive Managers is not publically available and some companies were unable or less comfortable to share this information, the 2017 Census edition separates director and Executive Manager rankings.
FIgURe 15: top performing companies with over 25% female directors, 2017 17
dIrEctorS
in 2008, there were only 62 companies (18.5% of companies) in the Census with 25% or more board seats occupied by female directors. By 2017 this had increased in absolute terms by 65%, with a total number of 102 companies qualifying as top performing companies. While the number of companies has increased, still only 34.4% of the total companies included in the 2017 Census achieved female representation of 25% or more on their boards.
2017 CeNsUs Key FINDINgs 2
top Performing Companies
17 does not include subsidiary directorships
of the total
companies included
in the 2017 Census
achieved female representation of
or more on their
boards
34.4%
25%
Rank Company Name Industry Code Verified Total Directors
Female Directors
% Female Directors
Does the company
have at least three
female Directors?
1 development Bank of Southern Africa
State-owned Enterprise
SoE yes 13 8 61.5% yes
2 Adapt it holdings Limited technology Main yes 7 4 57.1% yes
2 Ansys Limited industrials AltX yes 7 4 57.1% yes
3 Merafe resources Limited Basic Materials Main yES 9 5 55.6% yes
4 independent development trust
State-owned Enterprise
SoE yes 11 6 54.5% yes
5 Land and Agricultural development Bank of South Africa
State-owned Enterprise
SoE yes 15 8 53.3% yes
6 royal Bafokeng Platinum Limited
Basic Materials Main no 19 10 52.6% yes
7 Broadband infrastructure Company SoC Limited
State-owned Enterprise
SoE yes 8 4 50.0% yes
7 South African Airways (Pty) Limited
State-owned Enterprise
SoE no 12 6 50.0% yes
7 Sygnia Limited Financials Main yes 6 3 50.0% yes
8 JSE Limited Financials Main yes 11 5 45.5% yes
8 tongaat hulett Limited Consumer goods Main yes 11 5 45.5% yes
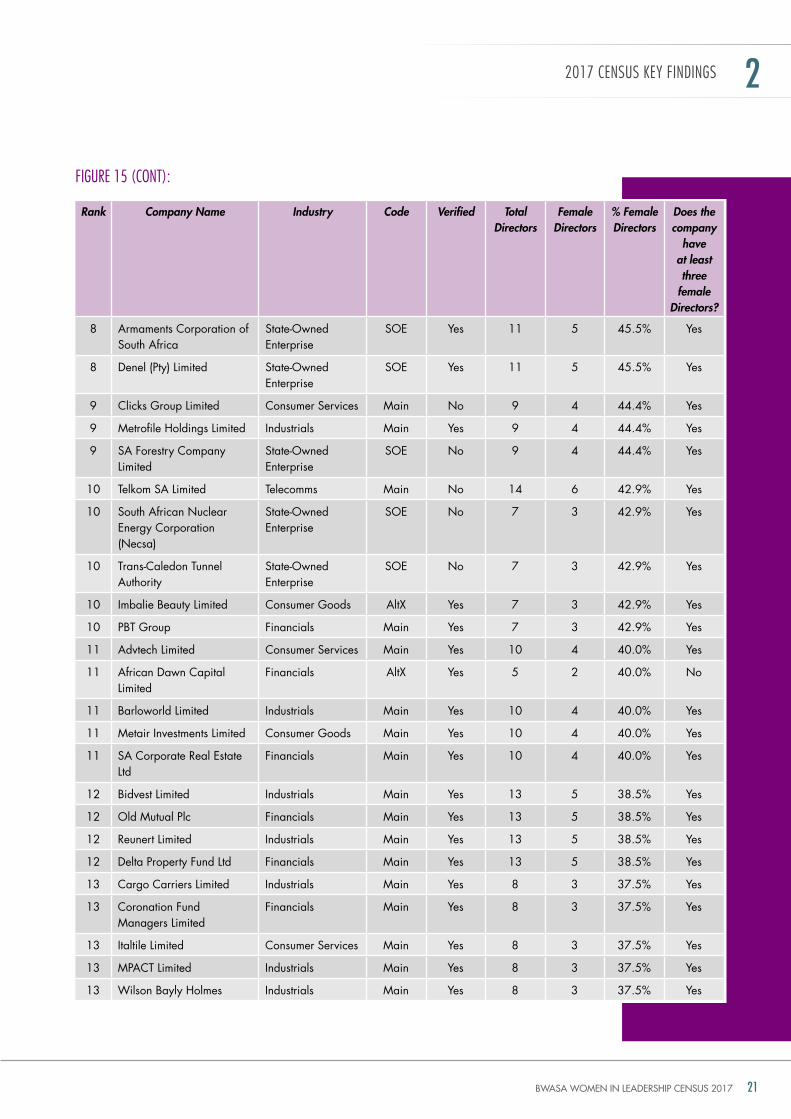
BWASA WOMEN IN LEADERSHIP CENSUS 2017 21
FIgURe 15 (CONT):
2017 CeNsUs Key FINDINgs 2
Rank Company Name Industry Code Verified Total Directors
Female Directors
% Female Directors
Does the company
have at least three
female Directors?
8 Armaments Corporation of South Africa
State-owned Enterprise
SoE yes 11 5 45.5% yes
8 denel (Pty) Limited State-owned Enterprise
SoE yes 11 5 45.5% yes
9 Clicks group Limited Consumer Services Main no 9 4 44.4% yes
9 Metrofile holdings Limited industrials Main yes 9 4 44.4% yes
9 SA Forestry Company Limited
State-owned Enterprise
SoE no 9 4 44.4% yes
10 telkom SA Limited telecomms Main no 14 6 42.9% yes
10 South African nuclear Energy Corporation (necsa)
State-owned Enterprise
SoE no 7 3 42.9% yes
10 trans-Caledon tunnel Authority
State-owned Enterprise
SoE no 7 3 42.9% yes
10 imbalie Beauty Limited Consumer goods AltX yes 7 3 42.9% yes
10 PBt group Financials Main yes 7 3 42.9% yes
11 Advtech Limited Consumer Services Main yes 10 4 40.0% yes
11 African dawn Capital Limited
Financials AltX yes 5 2 40.0% no
11 Barloworld Limited industrials Main yes 10 4 40.0% yes
11 Metair investments Limited Consumer goods Main yes 10 4 40.0% yes
11 SA Corporate real Estate Ltd
Financials Main yes 10 4 40.0% yes
12 Bidvest Limited industrials Main yes 13 5 38.5% yes
12 old Mutual Plc Financials Main yes 13 5 38.5% yes
12 reunert Limited industrials Main yes 13 5 38.5% yes
12 delta Property Fund Ltd Financials Main yes 13 5 38.5% yes
13 Cargo Carriers Limited industrials Main yes 8 3 37.5% yes
13 Coronation Fund Managers Limited
Financials Main yes 8 3 37.5% yes
13 italtile Limited Consumer Services Main yes 8 3 37.5% yes
13 MPACt Limited industrials Main yes 8 3 37.5% yes
13 Wilson Bayly holmes industrials Main yes 8 3 37.5% yes
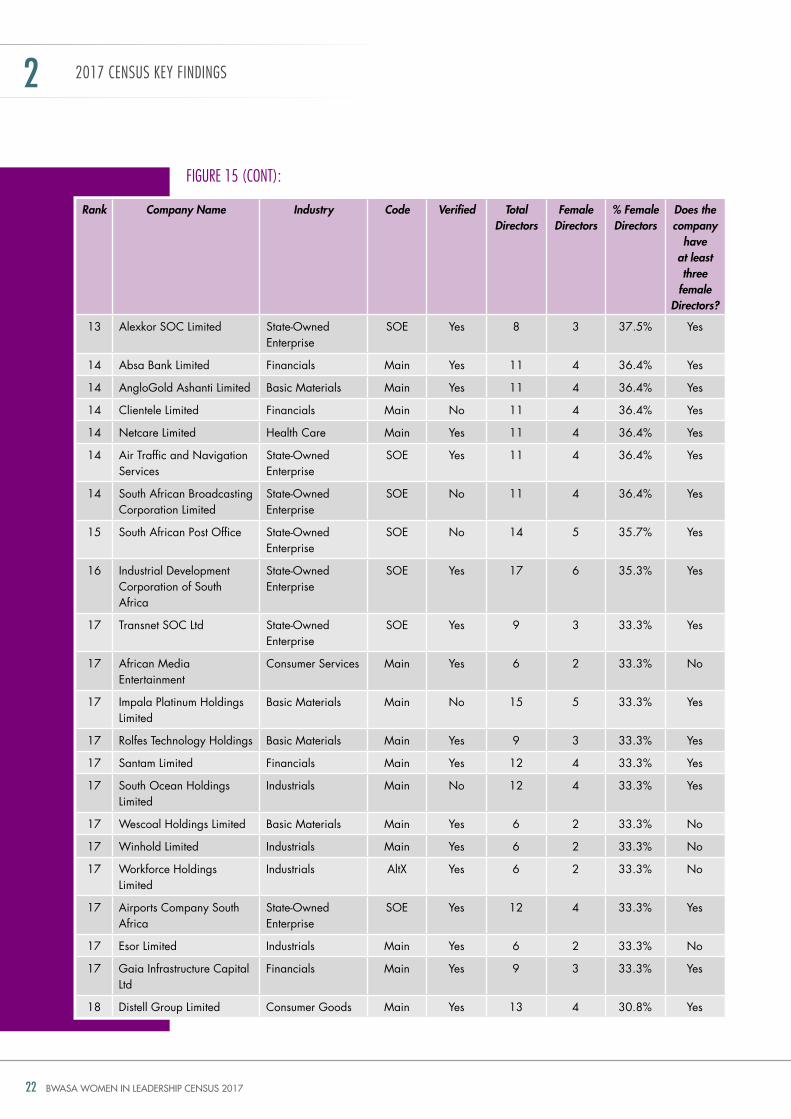
BWASA WOMEN IN LEADERSHIP CENSUS 201722
FIgURe 15 (CONT):
2017 CeNsUs Key FINDINgs 2
Rank Company Name Industry Code Verified Total Directors
Female Directors
% Female Directors
Does the company
have at least three
female Directors?
13 Alexkor SoC Limited State-owned Enterprise
SoE yes 8 3 37.5% yes
14 Absa Bank Limited Financials Main yes 11 4 36.4% yes
14 Anglogold Ashanti Limited Basic Materials Main yes 11 4 36.4% yes
14 Clientele Limited Financials Main no 11 4 36.4% yes
14 netcare Limited health Care Main yes 11 4 36.4% yes
14 Air traffic and navigation Services
State-owned Enterprise
SoE yes 11 4 36.4% yes
14 South African Broadcasting Corporation Limited
State-owned Enterprise
SoE no 11 4 36.4% yes
15 South African Post office State-owned Enterprise
SoE no 14 5 35.7% yes
16 industrial development Corporation of South Africa
State-owned Enterprise
SoE yes 17 6 35.3% yes
17 transnet SoC Ltd State-owned Enterprise
SoE yes 9 3 33.3% yes
17 African Media Entertainment
Consumer Services Main yes 6 2 33.3% no
17 impala Platinum holdings Limited
Basic Materials Main no 15 5 33.3% yes
17 rolfes technology holdings Basic Materials Main yes 9 3 33.3% yes
17 Santam Limited Financials Main yes 12 4 33.3% yes
17 South ocean holdings Limited
industrials Main no 12 4 33.3% yes
17 Wescoal holdings Limited Basic Materials Main yes 6 2 33.3% no
17 Winhold Limited industrials Main yes 6 2 33.3% no
17 Workforce holdings Limited
industrials AltX yes 6 2 33.3% no
17 Airports Company South Africa
State-owned Enterprise
SoE yes 12 4 33.3% yes
17 Esor Limited industrials Main yes 6 2 33.3% no
17 gaia infrastructure Capital Ltd
Financials Main yes 9 3 33.3% yes
18 distell group Limited Consumer goods Main yes 13 4 30.8% yes
BWASA WOMEN IN LEADERSHIP CENSUS 2017 23
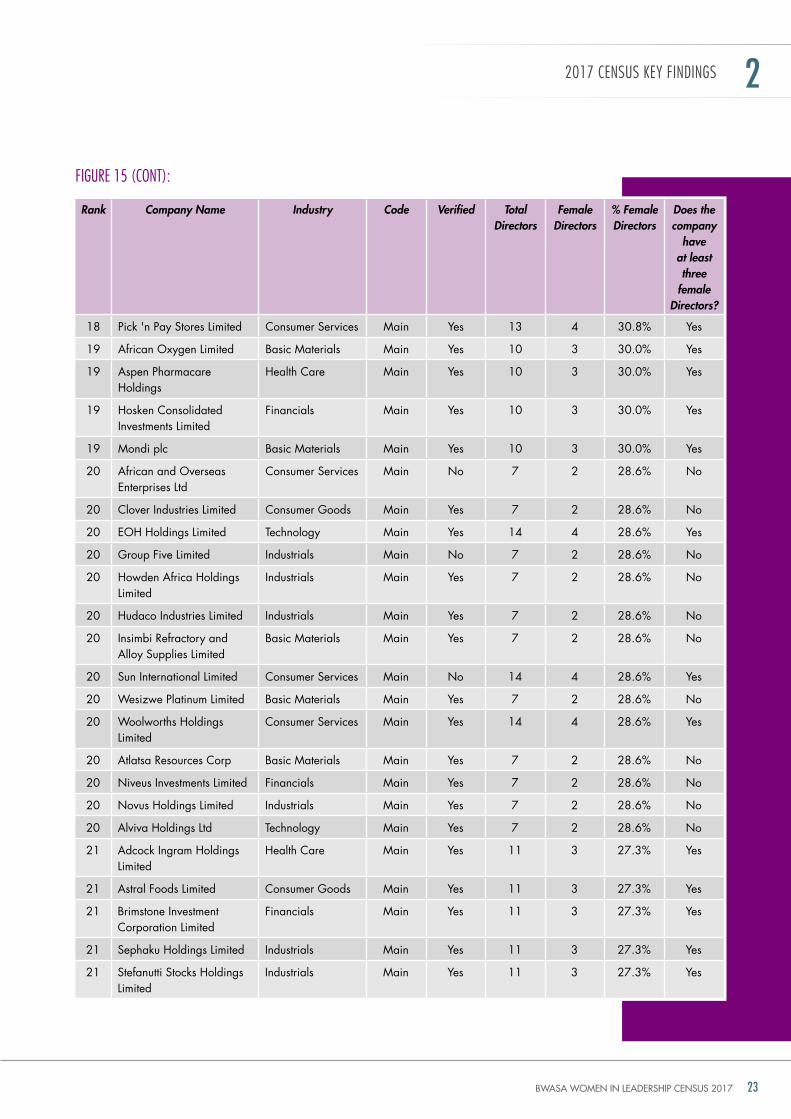
FIgURe 15 (CONT):
2017 CeNsUs Key FINDINgs 2
Rank Company Name Industry Code Verified Total Directors
Female Directors
% Female Directors
Does the company
have at least three
female Directors?
18 Pick 'n Pay Stores Limited Consumer Services Main yes 13 4 30.8% yes
19 African oxygen Limited Basic Materials Main yes 10 3 30.0% yes
19 Aspen Pharmacare holdings
health Care Main yes 10 3 30.0% yes
19 hosken Consolidated investments Limited
Financials Main yes 10 3 30.0% yes
19 Mondi plc Basic Materials Main yes 10 3 30.0% yes
20 African and overseas Enterprises Ltd
Consumer Services Main no 7 2 28.6% no
20 Clover industries Limited Consumer goods Main yes 7 2 28.6% no
20 Eoh holdings Limited technology Main yes 14 4 28.6% yes
20 group Five Limited industrials Main no 7 2 28.6% no
20 howden Africa holdings Limited
industrials Main yes 7 2 28.6% no
20 hudaco industries Limited industrials Main yes 7 2 28.6% no
20 insimbi refractory and Alloy Supplies Limited
Basic Materials Main yes 7 2 28.6% no
20 Sun international Limited Consumer Services Main no 14 4 28.6% yes
20 Wesizwe Platinum Limited Basic Materials Main yes 7 2 28.6% no
20 Woolworths holdings Limited
Consumer Services Main yes 14 4 28.6% yes
20 Atlatsa resources Corp Basic Materials Main yes 7 2 28.6% no
20 niveus investments Limited Financials Main yes 7 2 28.6% no
20 novus holdings Limited industrials Main yes 7 2 28.6% no
20 Alviva holdings Ltd technology Main yes 7 2 28.6% no
21 Adcock ingram holdings Limited
health Care Main yes 11 3 27.3% yes
21 Astral Foods Limited Consumer goods Main yes 11 3 27.3% yes
21 Brimstone investment Corporation Limited
Financials Main yes 11 3 27.3% yes
21 Sephaku holdings Limited industrials Main yes 11 3 27.3% yes
21 Stefanutti Stocks holdings Limited
industrials Main yes 11 3 27.3% yes
BWASA WOMEN IN LEADERSHIP CENSUS 201724
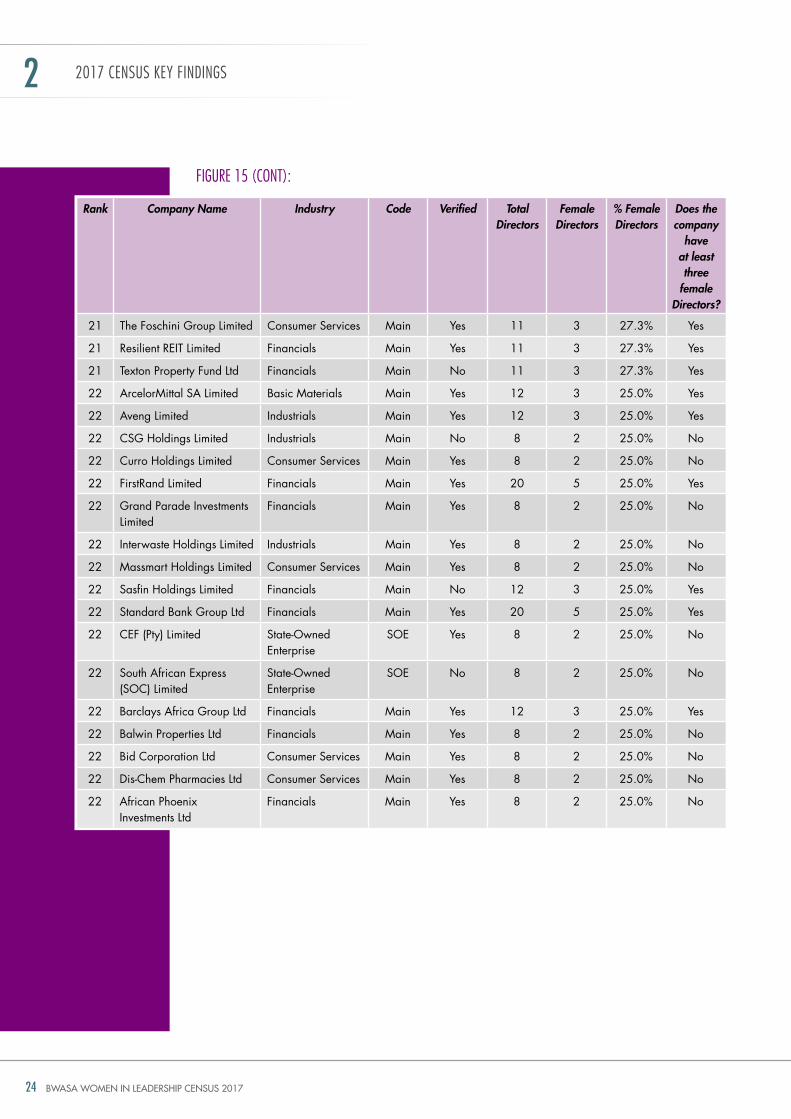
FIgURe 15 (CONT):
2017 CeNsUs Key FINDINgs 2
Rank Company Name Industry Code Verified Total Directors
Female Directors
% Female Directors
Does the company
have at least three
female Directors?
21 the Foschini group Limited Consumer Services Main yes 11 3 27.3% yes
21 resilient rEit Limited Financials Main yes 11 3 27.3% yes
21 texton Property Fund Ltd Financials Main no 11 3 27.3% yes
22 ArcelorMittal SA Limited Basic Materials Main yes 12 3 25.0% yes
22 Aveng Limited industrials Main yes 12 3 25.0% yes
22 CSg holdings Limited industrials Main no 8 2 25.0% no
22 Curro holdings Limited Consumer Services Main yes 8 2 25.0% no
22 Firstrand Limited Financials Main yes 20 5 25.0% yes
22 grand Parade investments Limited
Financials Main yes 8 2 25.0% no
22 interwaste holdings Limited industrials Main yes 8 2 25.0% no
22 Massmart holdings Limited Consumer Services Main yes 8 2 25.0% no
22 Sasfin holdings Limited Financials Main no 12 3 25.0% yes
22 Standard Bank group Ltd Financials Main yes 20 5 25.0% yes
22 CEF (Pty) Limited State-owned Enterprise
SoE yes 8 2 25.0% no
22 South African Express (SoC) Limited
State-owned Enterprise
SoE no 8 2 25.0% no
22 Barclays Africa group Ltd Financials Main yes 12 3 25.0% yes
22 Balwin Properties Ltd Financials Main yes 8 2 25.0% no
22 Bid Corporation Ltd Consumer Services Main yes 8 2 25.0% no
22 dis-Chem Pharmacies Ltd Consumer Services Main yes 8 2 25.0% no
22 African Phoenix investments Ltd
Financials Main yes 8 2 25.0% no
BWASA WOMEN IN LEADERSHIP CENSUS 2017 25
2017 CeNsUs Key FINDINgs 2
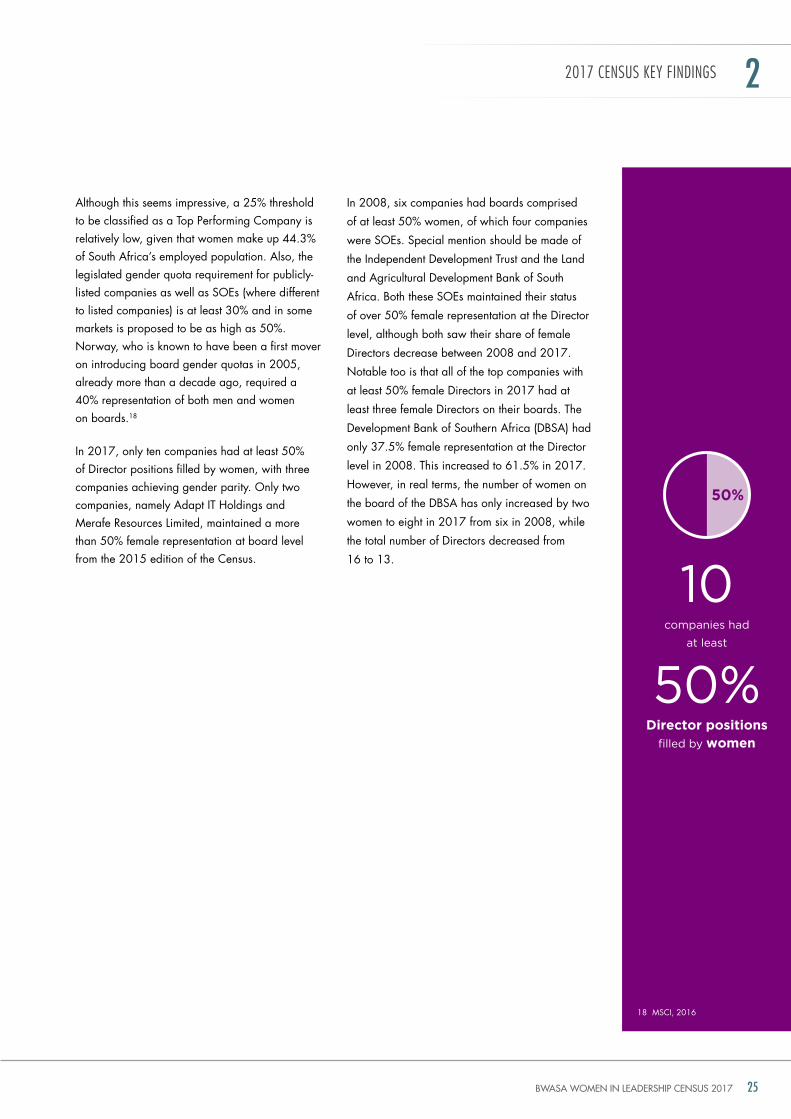
Although this seems impressive, a 25% threshold to be classified as a top Performing Company is relatively low, given that women make up 44.3% of South Africa’s employed population. Also, the legislated gender quota requirement for publicly-listed companies as well as SoEs (where different to listed companies) is at least 30% and in some markets is proposed to be as high as 50%. norway, who is known to have been a first mover on introducing board gender quotas in 2005, already more than a decade ago, required a 40% representation of both men and women on boards.18
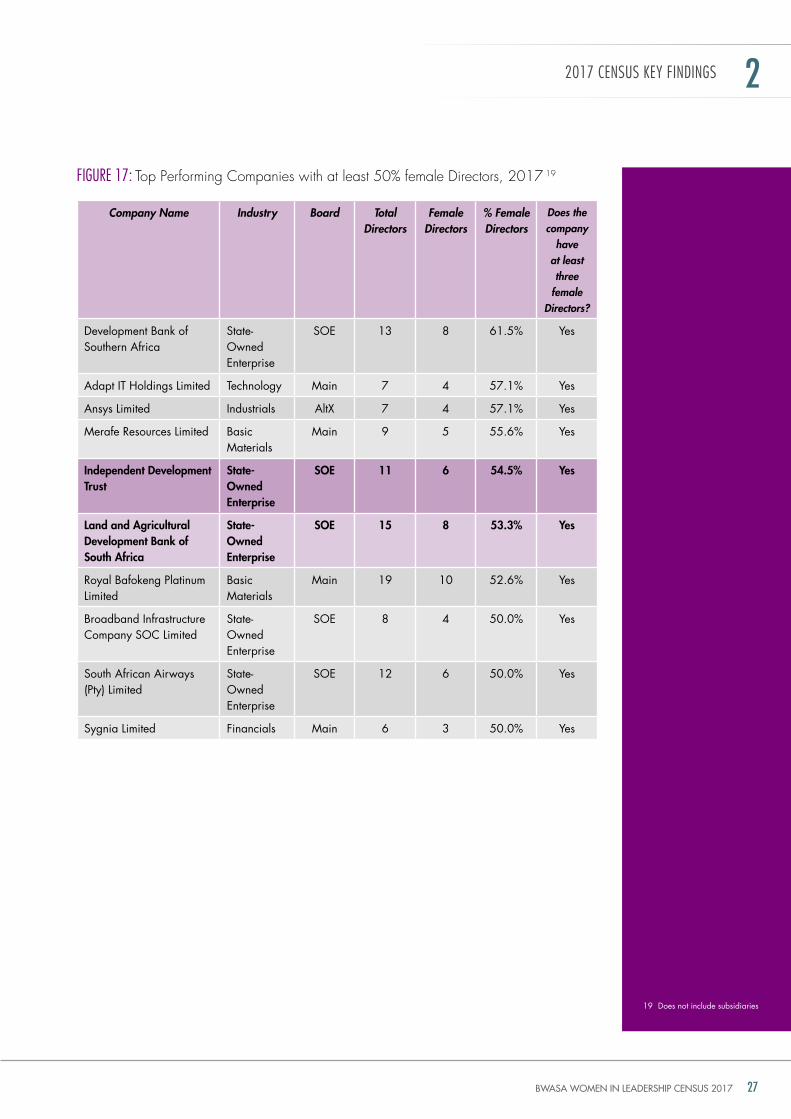
in 2017, only ten companies had at least 50% of director positions filled by women, with three companies achieving gender parity. only two companies, namely Adapt it holdings and Merafe resources Limited, maintained a more than 50% female representation at board level from the 2015 edition of the Census.
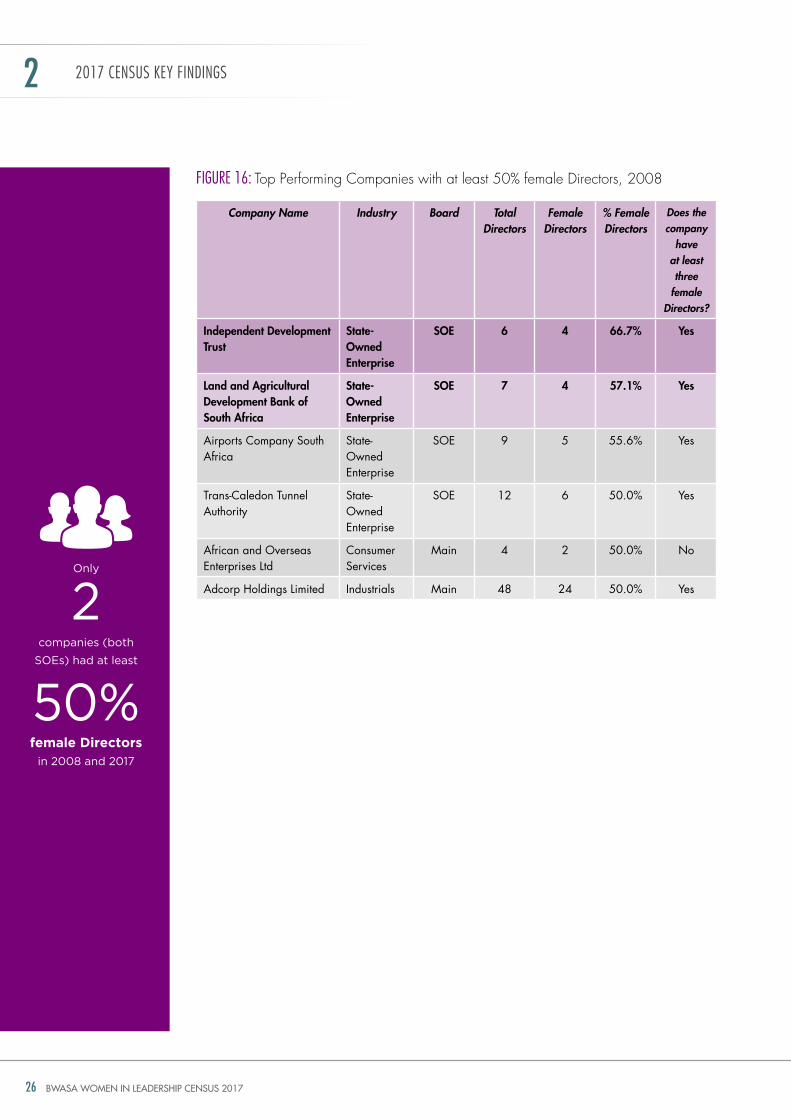
in 2008, six companies had boards comprised
of at least 50% women, of which four companies
were SoEs. Special mention should be made of
the independent development trust and the Land
and Agricultural development Bank of South
Africa. Both these SoEs maintained their status
of over 50% female representation at the director
level, although both saw their share of female
directors decrease between 2008 and 2017.
notable too is that all of the top companies with
at least 50% female directors in 2017 had at
least three female directors on their boards. the
development Bank of Southern Africa (dBSA) had
only 37.5% female representation at the director
level in 2008. this increased to 61.5% in 2017.
however, in real terms, the number of women on
the board of the dBSA has only increased by two
women to eight in 2017 from six in 2008, while
the total number of directors decreased from
16 to 13.
18 MSCi, 2016
companies had
at least
10
50%Director positions
filled by women
50%
BWASA WOMEN IN LEADERSHIP CENSUS 201726
2017 CeNsUs Key FINDINgs 2
FIgURe 16: top Performing companies with at least 50% female directors, 2008
Company Name Industry Board Total Directors
Female Directors
% Female Directors
Does the company
have at least three
female Directors?
Independent development trust
State-owned Enterprise
SoE 6 4 66.7% Yes
land and agricultural development Bank of South africa
State-owned Enterprise
SoE 7 4 57.1% Yes
Airports Company South Africa
State-owned Enterprise
SoE 9 5 55.6% yes
trans-Caledon tunnel Authority
State-owned Enterprise
SoE 12 6 50.0% yes
African and overseas Enterprises Ltd
Consumer Services
Main 4 2 50.0% no
Adcorp holdings Limited industrials Main 48 24 50.0% yes
companies (both
soes) had at least
only
2
50%female Directors
in 2008 and 2017
BWASA WOMEN IN LEADERSHIP CENSUS 2017 27
2017 CeNsUs Key FINDINgs 2
FIgURe 17: top Performing companies with at least 50% female directors, 2017 19
Company Name Industry Board Total Directors
Female Directors
% Female Directors
Does the company
have at least three
female Directors?
development Bank of Southern Africa
State-owned Enterprise
SoE 13 8 61.5% yes
Adapt it holdings Limited technology Main 7 4 57.1% yes
Ansys Limited industrials AltX 7 4 57.1% yes
Merafe resources Limited Basic Materials
Main 9 5 55.6% yes
Independent development trust
State-owned Enterprise
SoE 11 6 54.5% Yes
land and agricultural development Bank of South africa
State-owned Enterprise
SoE 15 8 53.3% Yes
royal Bafokeng Platinum Limited
Basic Materials
Main 19 10 52.6% yes
Broadband infrastructure Company SoC Limited
State-owned Enterprise
SoE 8 4 50.0% yes
South African Airways (Pty) Limited
State-owned Enterprise
SoE 12 6 50.0% yes
Sygnia Limited Financials Main 6 3 50.0% yes
19 does not include subsidiaries
BWASA WOMEN IN LEADERSHIP CENSUS 201728
2017 CeNsUs Key FINDINgs 2
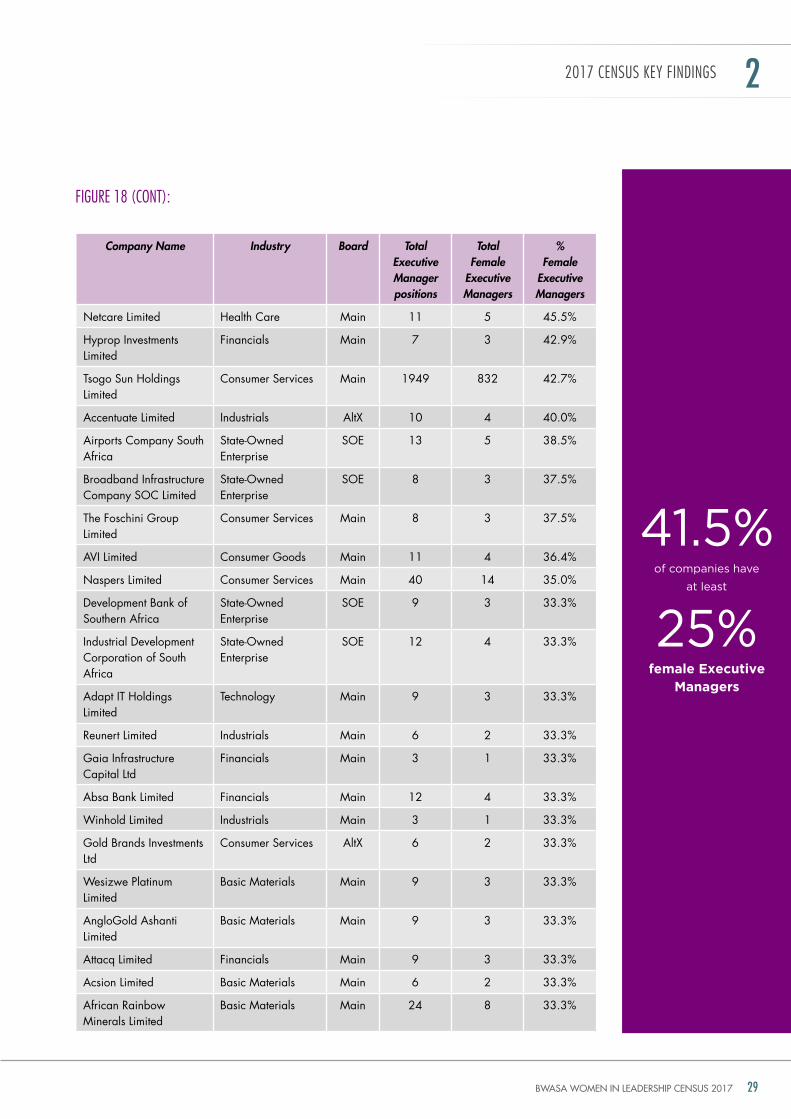
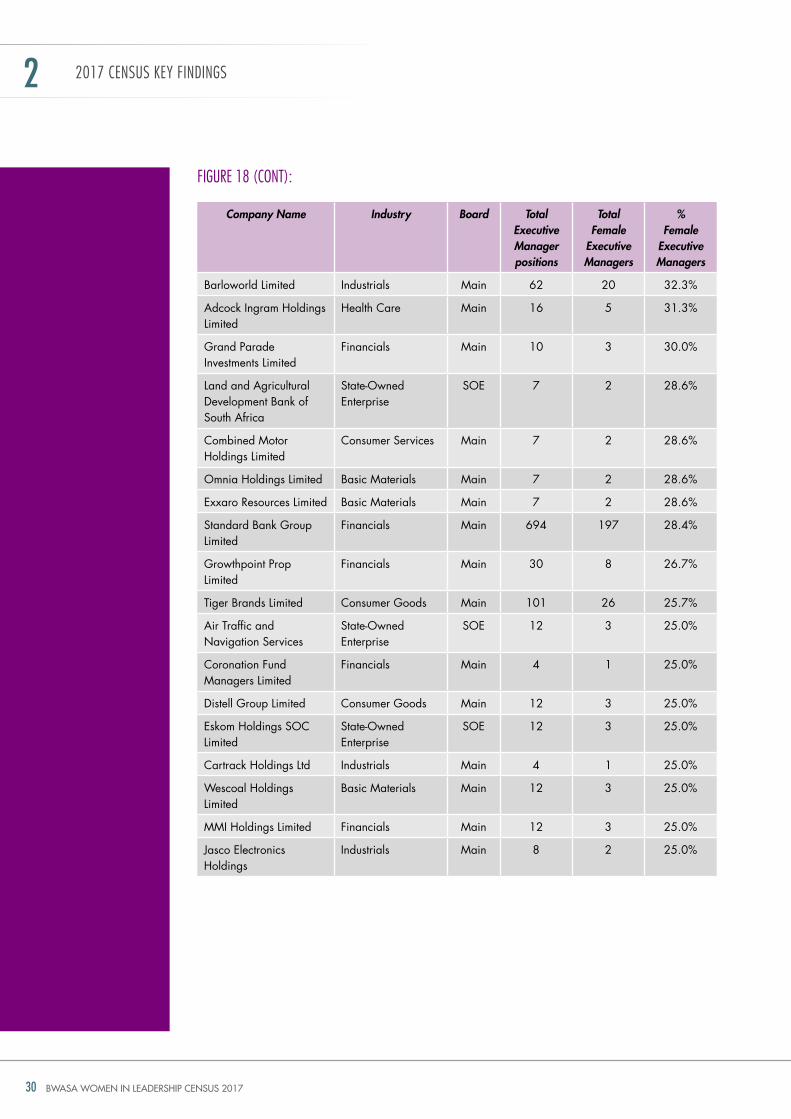
FIgURe 18: top Performing companies with over 25% female executive managers, 2017
Company Name Industry Board Total Executive Manager positions
Total Female
Executive Managers
% Female
Executive Managers
Merafe resources limited
Basic Materials Main 1 1 100.0%
renergen limited Financials altX 1 1 100.0%
Hulisani limited Financials Main 2 2 100.0%
Equites prop Fund limited
Financials Main 1 1 100.0%
comair limited consumer Services Main 1 1 100.0%
BSI Steel limited Basic Materials altX 4 4 100.0%
telemaster Holdings limited
telecommunications altX 1 1 100.0%
Ecsponent limited Financials Main 4 4 100.0%
Ingenuity property Investments ltd
Financials Main 6 5 83.3%
datatec limited technology Main 4 3 75.0%
atlatsa resources corp Basic Materials Main 3 2 66.7%
Imbalie Beauty limited consumer Goods altX 8 5 62.5%
Imperial Holdings limited
Industrials Main 5 3 60.0%
Huge Group limited telecommunications Main 7 4 57.1%
Homechoice International plc
consumer Services Main 9 5 55.6%
JSE limited Financials Main 11 6 54.5%
transnet Soc ltd State-owned Enterprise
SoE 10 5 50.0%
Life healthcare group holdings Limited
health Care Main 13 6 46.2%
Workforce holdings Limited
industrials AltX 22 10 45.5%
EXEcutIVE ManaGErS
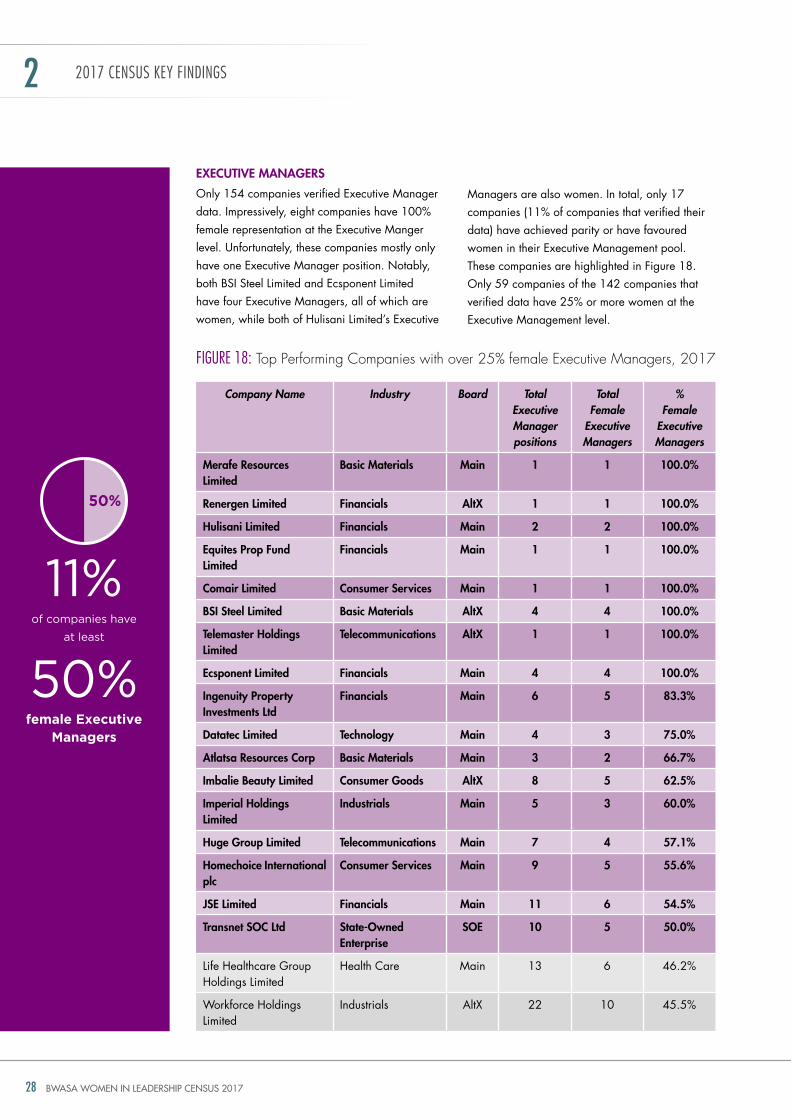
only 154 companies verified Executive Manager data. impressively, eight companies have 100% female representation at the Executive Manger level. unfortunately, these companies mostly only have one Executive Manager position. notably, both BSi Steel Limited and Ecsponent Limited have four Executive Managers, all of which are women, while both of hulisani Limited’s Executive
Managers are also women. in total, only 17 companies (11% of companies that verified their data) have achieved parity or have favoured women in their Executive Management pool. these companies are highlighted in Figure 18. only 59 companies of the 142 companies that verified data have 25% or more women at the Executive Management level.
of companies have
at least
11%
50%female Executive
Managers
50%
BWASA WOMEN IN LEADERSHIP CENSUS 2017 29
FIgURe 18 (CONT):
2017 CeNsUs Key FINDINgs 2
Company Name Industry Board Total Executive Manager positions
Total Female
Executive Managers
% Female
Executive Managers
netcare Limited health Care Main 11 5 45.5%
hyprop investments Limited
Financials Main 7 3 42.9%
tsogo Sun holdings Limited
Consumer Services Main 1949 832 42.7%
Accentuate Limited industrials AltX 10 4 40.0%
Airports Company South Africa
State-owned Enterprise
SoE 13 5 38.5%
Broadband infrastructure Company SoC Limited
State-owned Enterprise
SoE 8 3 37.5%
the Foschini group Limited
Consumer Services Main 8 3 37.5%
AVi Limited Consumer goods Main 11 4 36.4%
naspers Limited Consumer Services Main 40 14 35.0%
development Bank of Southern Africa
State-owned Enterprise
SoE 9 3 33.3%
industrial development Corporation of South Africa
State-owned Enterprise
SoE 12 4 33.3%
Adapt it holdings Limited
technology Main 9 3 33.3%
reunert Limited industrials Main 6 2 33.3%
gaia infrastructure Capital Ltd
Financials Main 3 1 33.3%
Absa Bank Limited Financials Main 12 4 33.3%
Winhold Limited industrials Main 3 1 33.3%
gold Brands investments Ltd
Consumer Services AltX 6 2 33.3%
Wesizwe Platinum Limited
Basic Materials Main 9 3 33.3%
Anglogold Ashanti Limited
Basic Materials Main 9 3 33.3%
Attacq Limited Financials Main 9 3 33.3%
Acsion Limited Basic Materials Main 6 2 33.3%
African rainbow Minerals Limited
Basic Materials Main 24 8 33.3%
of companies have
at least
41.5%
25%female Executive
Managers
BWASA WOMEN IN LEADERSHIP CENSUS 201730
2017 CeNsUs Key FINDINgs 2
FIgURe 18 (CONT):
Company Name Industry Board Total Executive Manager positions
Total Female
Executive Managers
% Female
Executive Managers
Barloworld Limited industrials Main 62 20 32.3%
Adcock ingram holdings Limited
health Care Main 16 5 31.3%
grand Parade investments Limited
Financials Main 10 3 30.0%
Land and Agricultural development Bank of South Africa
State-owned Enterprise
SoE 7 2 28.6%
Combined Motor holdings Limited
Consumer Services Main 7 2 28.6%
omnia holdings Limited Basic Materials Main 7 2 28.6%
Exxaro resources Limited Basic Materials Main 7 2 28.6%
Standard Bank group Limited
Financials Main 694 197 28.4%
growthpoint Prop Limited
Financials Main 30 8 26.7%
tiger Brands Limited Consumer goods Main 101 26 25.7%
Air traffic and navigation Services
State-owned Enterprise
SoE 12 3 25.0%
Coronation Fund Managers Limited
Financials Main 4 1 25.0%
distell group Limited Consumer goods Main 12 3 25.0%
Eskom holdings SoC Limited
State-owned Enterprise
SoE 12 3 25.0%
Cartrack holdings Ltd industrials Main 4 1 25.0%
Wescoal holdings Limited
Basic Materials Main 12 3 25.0%
MMi holdings Limited Financials Main 12 3 25.0%
Jasco Electronics holdings
industrials Main 8 2 25.0%
BWASA WOMEN IN LEADERSHIP CENSUS 2017 31
2017 CeNsUs Key FINDINgs 2
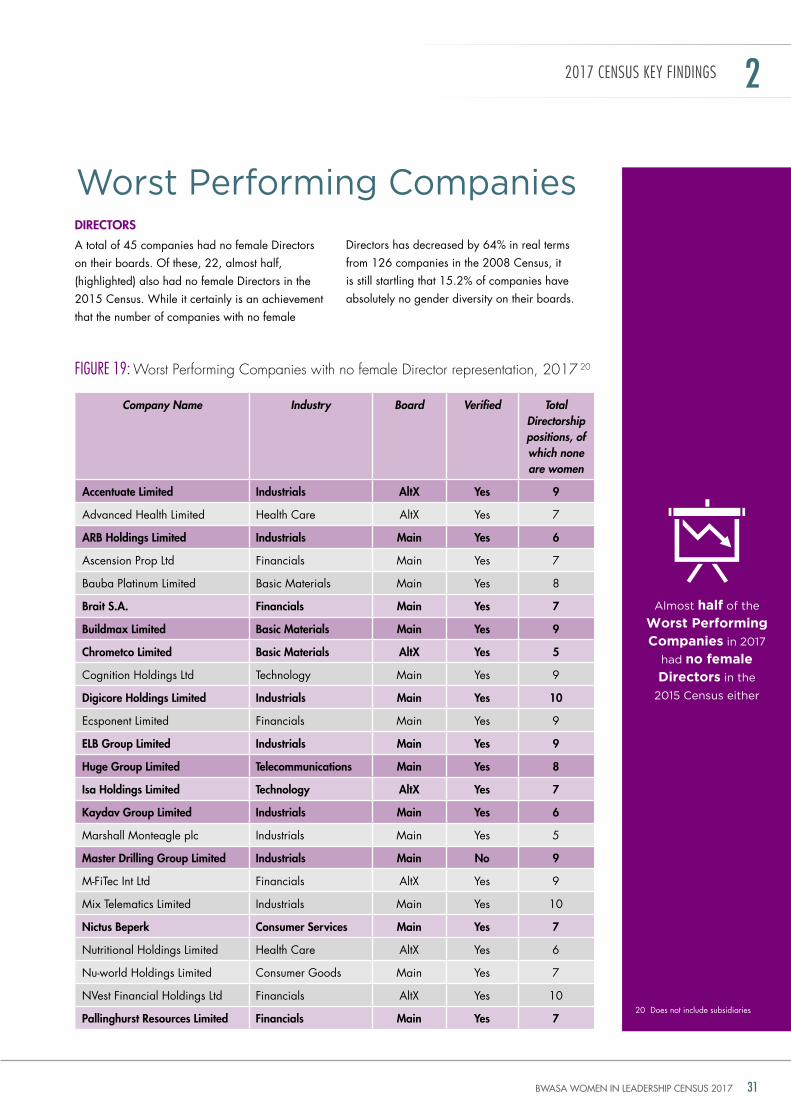
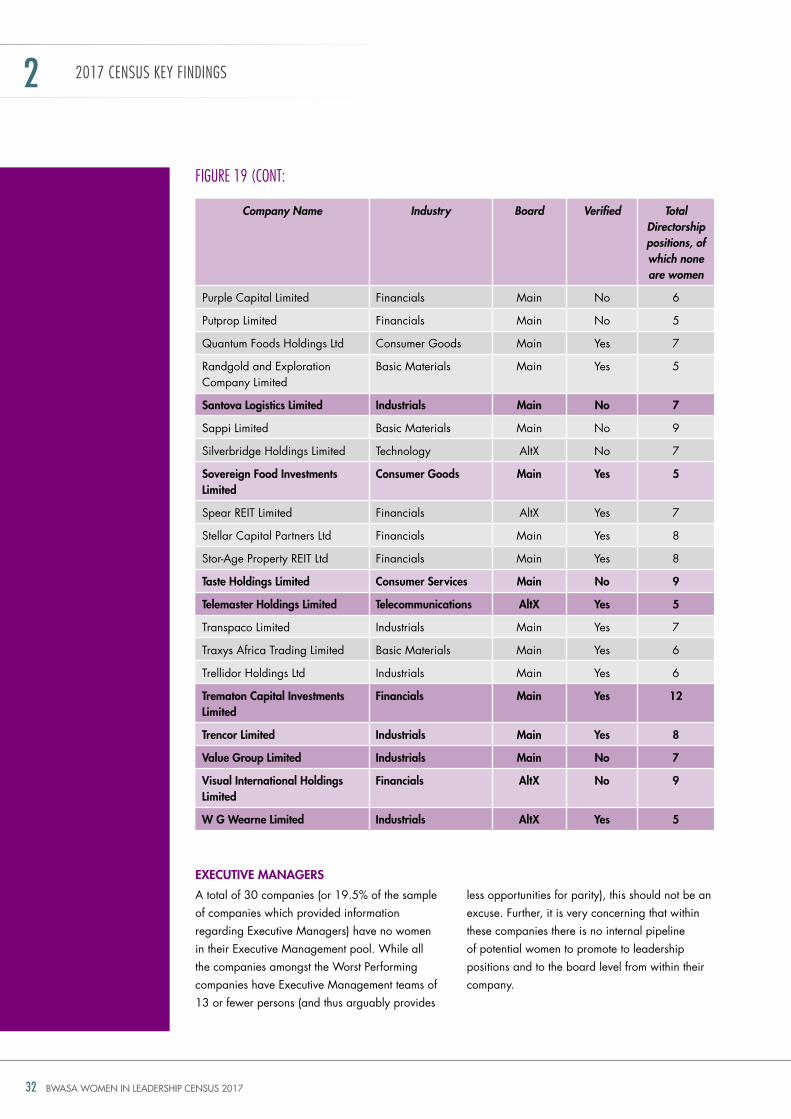
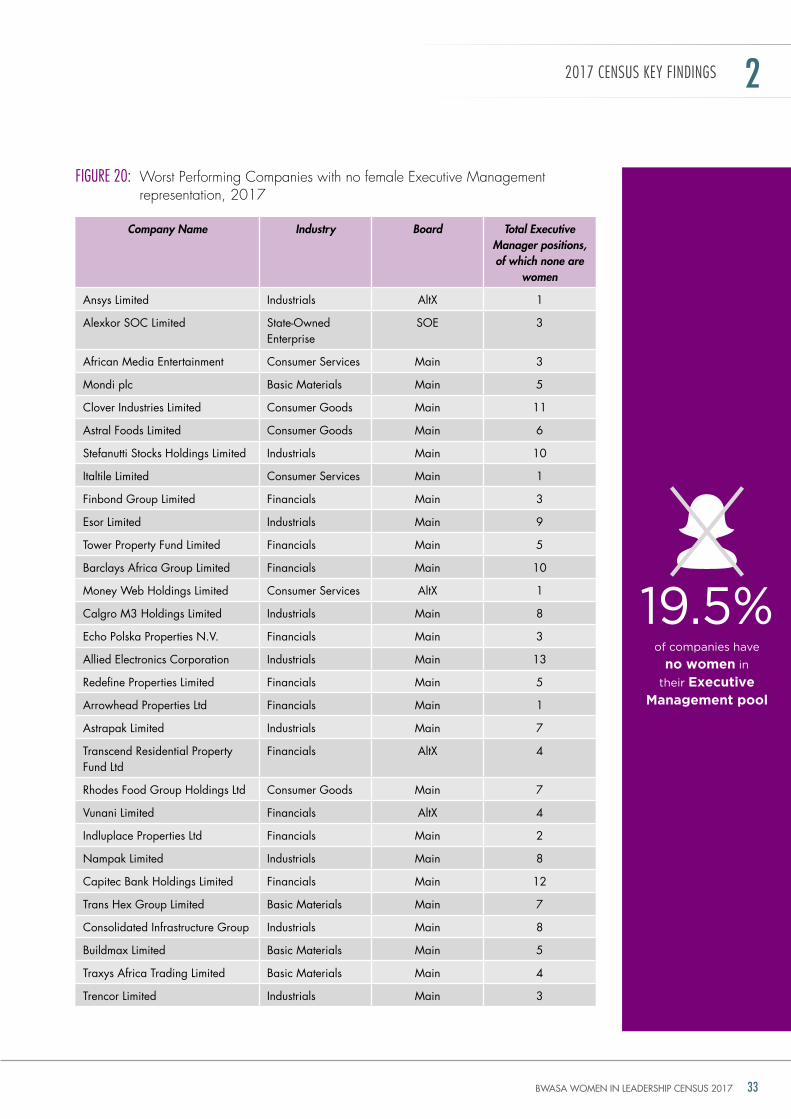
FIgURe 19: Worst Performing companies with no female director representation, 2017 20
dIrEctorS
A total of 45 companies had no female directors on their boards. of these, 22, almost half, (highlighted) also had no female directors in the 2015 Census. While it certainly is an achievement that the number of companies with no female
worst Performing Companies
Company Name Industry Board Verified Total Directorship positions, of which none are women
accentuate limited Industrials altX Yes 9
Advanced health Limited health Care AltX yes 7
arB Holdings limited Industrials Main Yes 6
Ascension Prop Ltd Financials Main yes 7
Bauba Platinum Limited Basic Materials Main yes 8
Brait S.a. Financials Main Yes 7
Buildmax limited Basic Materials Main Yes 9
chrometco limited Basic Materials altX Yes 5
Cognition holdings Ltd technology Main yes 9
digicore Holdings limited Industrials Main Yes 10
Ecsponent Limited Financials Main yes 9
ElB Group limited Industrials Main Yes 9
Huge Group limited telecommunications Main Yes 8
Isa Holdings limited technology altX Yes 7
kaydav Group limited Industrials Main Yes 6
Marshall Monteagle plc industrials Main yes 5
Master drilling Group limited Industrials Main no 9
M-Fitec int Ltd Financials AltX yes 9
Mix telematics Limited industrials Main yes 10
nictus Beperk consumer Services Main Yes 7
nutritional holdings Limited health Care AltX yes 6
nu-world holdings Limited Consumer goods Main yes 7
nVest Financial holdings Ltd Financials AltX yes 10
pallinghurst resources limited Financials Main Yes 7
directors has decreased by 64% in real terms from 126 companies in the 2008 Census, it is still startling that 15.2% of companies have absolutely no gender diversity on their boards.
20 does not include subsidiaries
Almost half of the
Worst Performing Companies in 2017
had no female Directors in the
2015 Census either
BWASA WOMEN IN LEADERSHIP CENSUS 201732
2017 CeNsUs Key FINDINgs 2
EXEcutIVE ManaGErS
A total of 30 companies (or 19.5% of the sample of companies which provided information regarding Executive Managers) have no women in their Executive Management pool. While all the companies amongst the Worst Performing companies have Executive Management teams of 13 or fewer persons (and thus arguably provides
less opportunities for parity), this should not be an excuse. Further, it is very concerning that within these companies there is no internal pipeline of potential women to promote to leadership positions and to the board level from within their company.
FIgURe 19 (CONT:
Company Name Industry Board Verified Total Directorship positions, of which none are women
Purple Capital Limited Financials Main no 6
Putprop Limited Financials Main no 5
Quantum Foods holdings Ltd Consumer goods Main yes 7
randgold and Exploration Company Limited
Basic Materials Main yes 5
Santova logistics limited Industrials Main no 7
Sappi Limited Basic Materials Main no 9
Silverbridge holdings Limited technology AltX no 7
Sovereign Food Investments limited
consumer Goods Main Yes 5
Spear rEit Limited Financials AltX yes 7
Stellar Capital Partners Ltd Financials Main yes 8
Stor-Age Property rEit Ltd Financials Main yes 8
taste Holdings limited consumer Services Main no 9
telemaster Holdings limited telecommunications altX Yes 5
transpaco Limited industrials Main yes 7
traxys Africa trading Limited Basic Materials Main yes 6
trellidor holdings Ltd industrials Main yes 6
trematon capital Investments limited
Financials Main Yes 12
trencor limited Industrials Main Yes 8
Value Group limited Industrials Main no 7
Visual International Holdings limited
Financials altX no 9
W G Wearne limited Industrials altX Yes 5
BWASA WOMEN IN LEADERSHIP CENSUS 2017 33
2017 CeNsUs Key FINDINgs 2
FIgURe 20: Worst Performing companies with no female executive management representation, 2017
Company Name Industry Board Total Executive Manager positions, of which none are
women
Ansys Limited industrials AltX 1
Alexkor SoC Limited State-owned Enterprise
SoE 3
African Media Entertainment Consumer Services Main 3
Mondi plc Basic Materials Main 5
Clover industries Limited Consumer goods Main 11
Astral Foods Limited Consumer goods Main 6
Stefanutti Stocks holdings Limited industrials Main 10
italtile Limited Consumer Services Main 1
Finbond group Limited Financials Main 3
Esor Limited industrials Main 9
tower Property Fund Limited Financials Main 5
Barclays Africa group Limited Financials Main 10
Money Web holdings Limited Consumer Services AltX 1
Calgro M3 holdings Limited industrials Main 8
Echo Polska Properties n.V. Financials Main 3
Allied Electronics Corporation industrials Main 13
redefine Properties Limited Financials Main 5
Arrowhead Properties Ltd Financials Main 1
Astrapak Limited industrials Main 7
transcend residential Property Fund Ltd
Financials AltX 4
rhodes Food group holdings Ltd Consumer goods Main 7
Vunani Limited Financials AltX 4
indluplace Properties Ltd Financials Main 2
nampak Limited industrials Main 8
Capitec Bank holdings Limited Financials Main 12
trans hex group Limited Basic Materials Main 7
Consolidated infrastructure group industrials Main 8
Buildmax Limited Basic Materials Main 5
traxys Africa trading Limited Basic Materials Main 4
trencor Limited industrials Main 3
of companies have
no women in
their Executive Management pool
19.5%
BWASA WOMEN IN LEADERSHIP CENSUS 201734
PriVAte seCtor resultsseCtion 3:
PRIvaTe seCTOR ResUlTs3
BWASA WOMEN IN LEADERSHIP CENSUS 2017 35
Jse-listed Companies
PRIvaTe seCTOR ResUlTs 3
Companies should be able to report on the progress made in achieving their self-imposed targets in order to be held accountable. Boards which view diversity as a critical element to delivering effectiveness and are deliberately and voluntarily diverse are likely to perform better than boards that are constructed vis-a-vis compliance.21
Although South Africa does not have legislated quotas for women on boards, in 2015 the Johannesburg Stock Exchange (JSE) included specific listing requirements whereby as of January 2017 listed companies need to disclose their set targets for gender and race representation at the board level and the progress made against these targets in their annual report.22
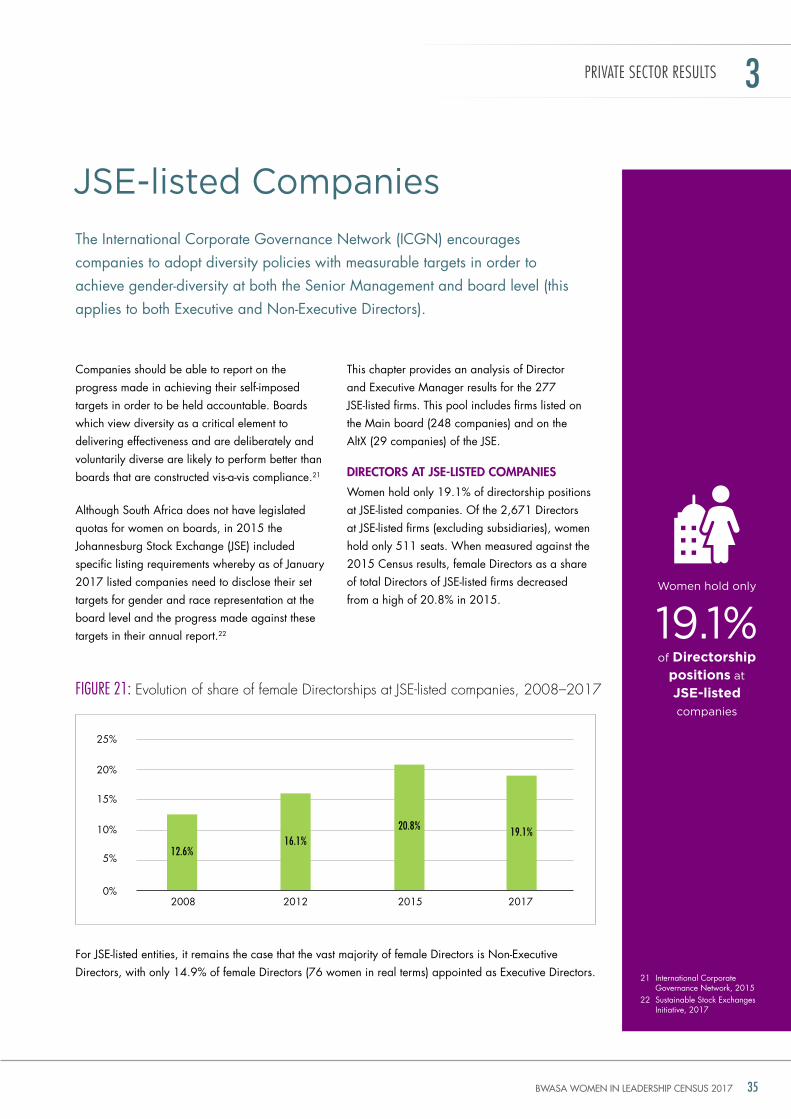
this chapter provides an analysis of director and Executive Manager results for the 277 JSE-listed firms. this pool includes firms listed on the Main board (248 companies) and on the AltX (29 companies) of the JSE.
dIrEctorS at JSE-lIStEd coMpanIES
Women hold only 19.1% of directorship positions at JSE-listed companies. of the 2,671 directors at JSE-listed firms (excluding subsidiaries), women hold only 511 seats. When measured against the 2015 Census results, female directors as a share of total directors of JSE-listed firms decreased from a high of 20.8% in 2015.
the international Corporate governance network (iCgn) encourages companies to adopt diversity policies with measurable targets in order to achieve gender-diversity at both the Senior Management and board level (this applies to both Executive and non-Executive directors).
21 international Corporate governance network, 2015
22 Sustainable Stock Exchanges initiative, 2017
FIgURe 21: evolution of share of female directorships at Jse-listed companies, 2008–2017
For JSE-listed entities, it remains the case that the vast majority of female directors is non-Executive directors, with only 14.9% of female directors (76 women in real terms) appointed as Executive directors.
women hold only
of Directorship positions at
JSE-listed
companies
19.1%
0%
5%
10%
15%
20%
25%
2008 2012 2015 2017
12.6%16.1%
20.8% 19.1%
BWASA WOMEN IN LEADERSHIP CENSUS 201736
Female Executive directors Female non-Executive directors
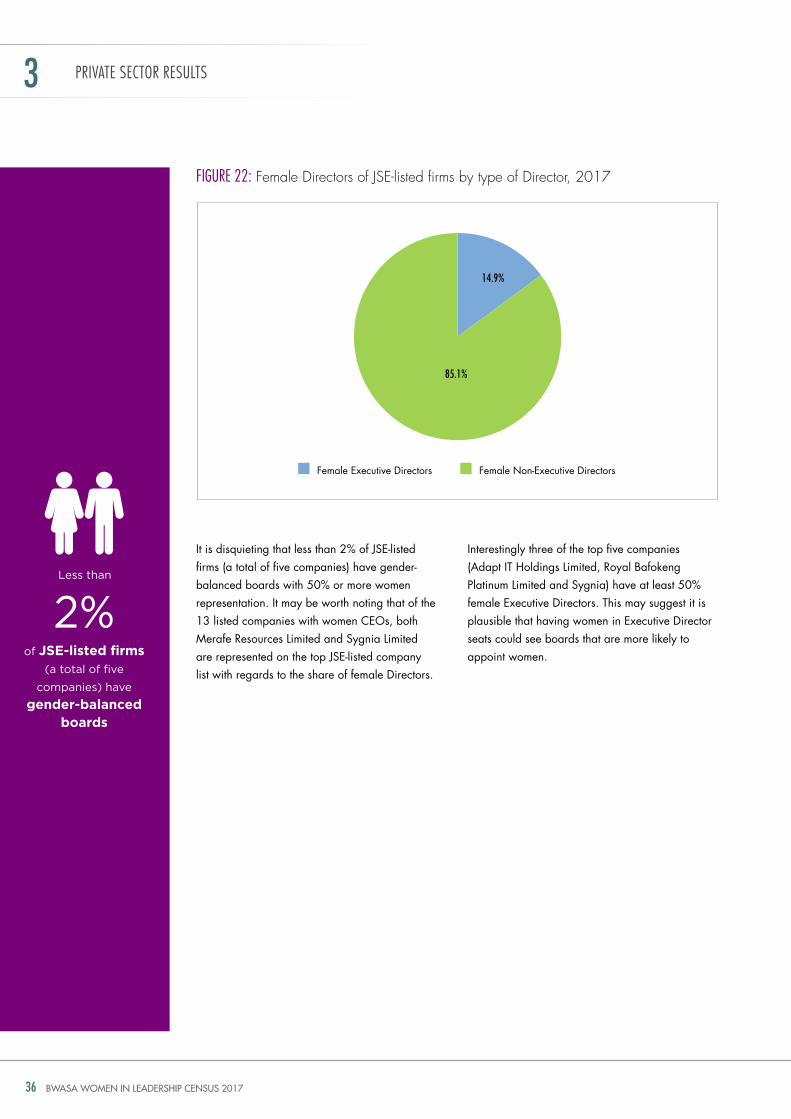
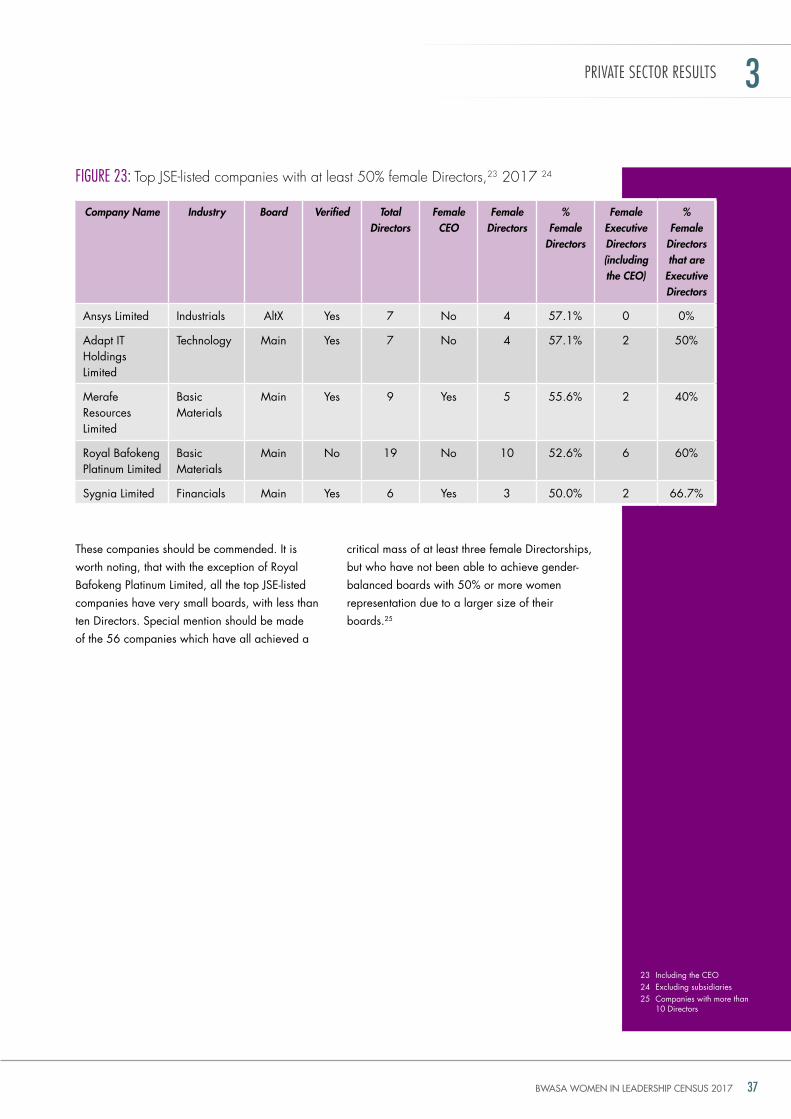
it is disquieting that less than 2% of JSE-listed firms (a total of five companies) have gender-balanced boards with 50% or more women representation. it may be worth noting that of the 13 listed companies with women CEos, both Merafe resources Limited and Sygnia Limited are represented on the top JSE-listed company list with regards to the share of female directors.
FIgURe 22: Female directors of Jse-listed firms by type of director, 2017
interestingly three of the top five companies (Adapt it holdings Limited, royal Bafokeng Platinum Limited and Sygnia) have at least 50% female Executive directors. this may suggest it is plausible that having women in Executive director seats could see boards that are more likely to appoint women.
PRIvaTe seCTOR ResUlTs3
less than
2%of JSE-listed firms
(a total of five
companies) have
gender-balanced boards
14.9%
85.1%
BWASA WOMEN IN LEADERSHIP CENSUS 2017 37
these companies should be commended. it is worth noting, that with the exception of royal Bafokeng Platinum Limited, all the top JSE-listed companies have very small boards, with less than ten directors. Special mention should be made of the 56 companies which have all achieved a
critical mass of at least three female directorships, but who have not been able to achieve gender-balanced boards with 50% or more women representation due to a larger size of their boards.25
FIgURe 23: top Jse-listed companies with at least 50% female directors,23 2017 24
PRIvaTe seCTOR ResUlTs 3
Company Name Industry Board Verified Total Directors
Female CEO
Female Directors
% Female
Directors
Female Executive Directors (including the CEO)
% Female
Directors that are
Executive Directors
Ansys Limited industrials AltX yes 7 no 4 57.1% 0 0%
Adapt it holdings Limited
technology Main yes 7 no 4 57.1% 2 50%
Merafe resources Limited
Basic Materials
Main yes 9 yes 5 55.6% 2 40%
royal Bafokeng Platinum Limited
Basic Materials
Main no 19 no 10 52.6% 6 60%
Sygnia Limited Financials Main yes 6 yes 3 50.0% 2 66.7%
23 including the CEo24 Excluding subsidiaries25 Companies with more than
10 directors
BWASA WOMEN IN LEADERSHIP CENSUS 201738
Company Name Industry Board Verified Total Directors
Female Directors
% Female Directors
royal Bafokeng Platinum Limited Basic Materials Main no 19 10 52.6%
telkom SA Limited telecommunications Main no 14 6 42.9%
Firstrand Limited Financials Main yes 20 5 25.0%
Standard Bank group Limited Financials Main yes 20 5 25.0%
impala Platinum holdings Limited Basic Materials Main no 15 5 33.3%
Bidvest Limited industrials Main yes 13 5 38.5%
old Mutual Plc Financials Main yes 13 5 38.5%
reunert Limited industrials Main yes 13 5 38.5%
delta Property Fund Ltd Financials Main yes 13 5 38.5%
JSE Limited Financials Main yes 11 5 45.5%
tongaat hulett Limited Consumer goods Main yes 11 5 45.5%
Exxaro resources Limited Basic Materials Main yes 21 4 19.0%
Pretoria Portland Cement industrials Main no 17 4 23.5%
Sanlam Limited Financials Main yes 17 4 23.5%
Eoh holdings Limited technology Main yes 14 4 28.6%
Sun international Limited Consumer Services Main no 14 4 28.6%
Woolworths holdings Limited Consumer Services Main yes 14 4 28.6%
distell group Limited Consumer goods Main yes 13 4 30.8%
Pick ‘n Pay Stores Limited Consumer Services Main yes 13 4 30.8%
Santam Limited Financials Main yes 12 4 33.3%
South ocean holdings Limited industrials Main no 12 4 33.3%
Absa Bank Limited Financials Main yes 11 4 36.4%
Anglogold Ashanti Limited Basic Materials Main yes 11 4 36.4%
Clientele Limited Financials Main no 11 4 36.4%
netcare Limited health Care Main yes 11 4 36.4%
Advtech Limited Consumer Services Main yes 10 4 40.0%
Barloworld Limited industrials Main yes 10 4 40.0%
Metair investments Limited Consumer goods Main yes 10 4 40.0%
SA Corporate real Estate Ltd Financials Main yes 10 4 40.0%
discovery Limited Financials Main yes 20 3 15.0%
hulamin Limited Basic Materials Main yes 18 3 16.7%
Comair Limited Consumer Services Main yes 17 3 17.6%
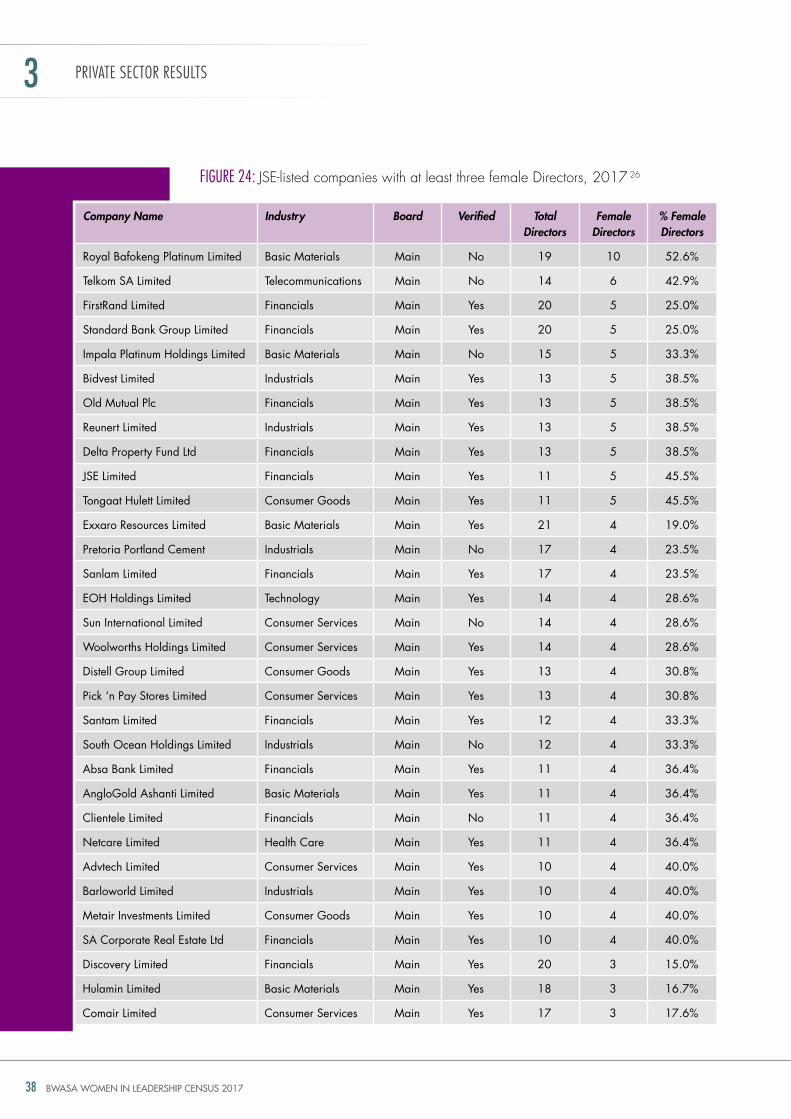
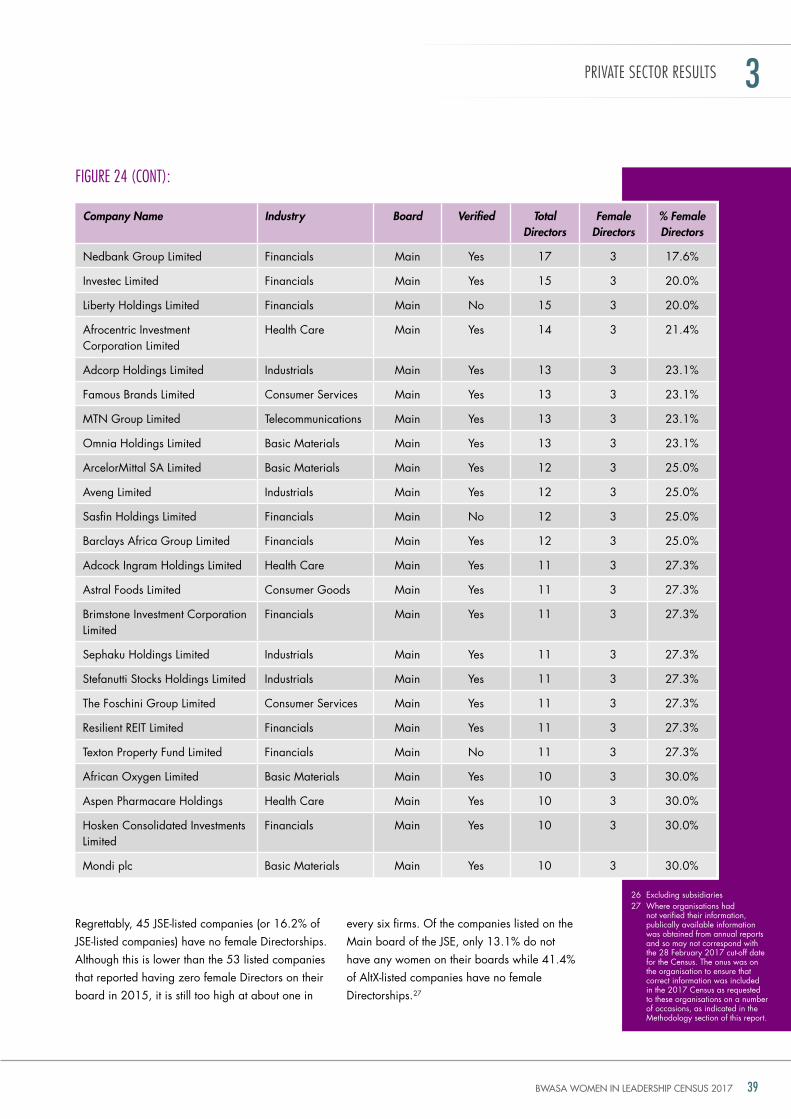
FIgURe 24: Jse-listed companies with at least three female directors, 2017 26
PRIvaTe seCTOR ResUlTs3
BWASA WOMEN IN LEADERSHIP CENSUS 2017 39
FIgURe 24 (CONT):
Company Name Industry Board Verified Total Directors
Female Directors
% Female Directors
nedbank group Limited Financials Main yes 17 3 17.6%
investec Limited Financials Main yes 15 3 20.0%
Liberty holdings Limited Financials Main no 15 3 20.0%
Afrocentric investment Corporation Limited
health Care Main yes 14 3 21.4%
Adcorp holdings Limited industrials Main yes 13 3 23.1%
Famous Brands Limited Consumer Services Main yes 13 3 23.1%
Mtn group Limited telecommunications Main yes 13 3 23.1%
omnia holdings Limited Basic Materials Main yes 13 3 23.1%
ArcelorMittal SA Limited Basic Materials Main yes 12 3 25.0%
Aveng Limited industrials Main yes 12 3 25.0%
Sasfin holdings Limited Financials Main no 12 3 25.0%
Barclays Africa group Limited Financials Main yes 12 3 25.0%
Adcock ingram holdings Limited health Care Main yes 11 3 27.3%
Astral Foods Limited Consumer goods Main yes 11 3 27.3%
Brimstone investment Corporation Limited
Financials Main yes 11 3 27.3%
Sephaku holdings Limited industrials Main yes 11 3 27.3%
Stefanutti Stocks holdings Limited industrials Main yes 11 3 27.3%
the Foschini group Limited Consumer Services Main yes 11 3 27.3%
resilient rEit Limited Financials Main yes 11 3 27.3%
texton Property Fund Limited Financials Main no 11 3 27.3%
African oxygen Limited Basic Materials Main yes 10 3 30.0%
Aspen Pharmacare holdings health Care Main yes 10 3 30.0%
hosken Consolidated investments Limited
Financials Main yes 10 3 30.0%
Mondi plc Basic Materials Main yes 10 3 30.0%
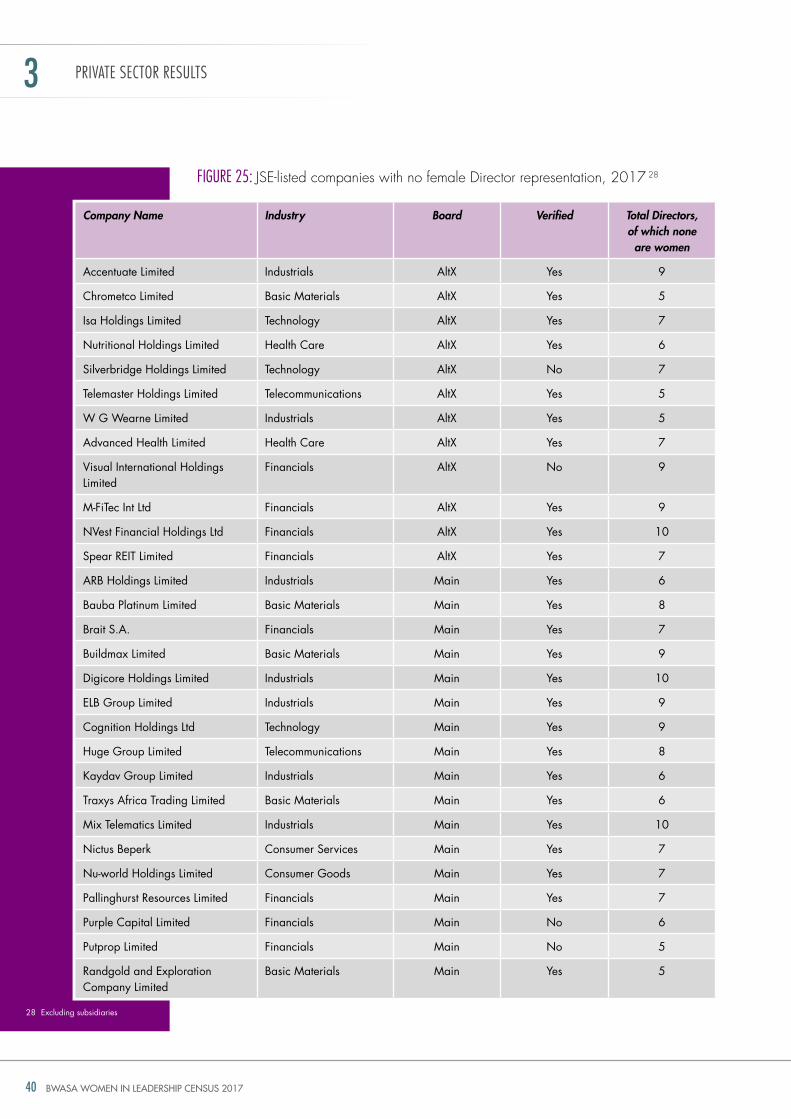
regrettably, 45 JSE-listed companies (or 16.2% of JSE-listed companies) have no female directorships. Although this is lower than the 53 listed companies that reported having zero female directors on their board in 2015, it is still too high at about one in
every six firms. of the companies listed on the Main board of the JSE, only 13.1% do not have any women on their boards while 41.4% of AltX-listed companies have no female directorships.27
26 Excluding subsidiaries27 Where organisations had
not verified their information, publically available information was obtained from annual reports and so may not correspond with the 28 February 2017 cut-off date for the Census. the onus was on the organisation to ensure that correct information was included in the 2017 Census as requested to these organisations on a number of occasions, as indicated in the Methodology section of this report.
PRIvaTe seCTOR ResUlTs 3
BWASA WOMEN IN LEADERSHIP CENSUS 201740
Company Name Industry Board Verified Total Directors, of which none
are women
Accentuate Limited industrials AltX yes 9
Chrometco Limited Basic Materials AltX yes 5
isa holdings Limited technology AltX yes 7
nutritional holdings Limited health Care AltX yes 6
Silverbridge holdings Limited technology AltX no 7
telemaster holdings Limited telecommunications AltX yes 5
W g Wearne Limited industrials AltX yes 5
Advanced health Limited health Care AltX yes 7
Visual international holdings Limited
Financials AltX no 9
M-Fitec int Ltd Financials AltX yes 9
nVest Financial holdings Ltd Financials AltX yes 10
Spear rEit Limited Financials AltX yes 7
ArB holdings Limited industrials Main yes 6
Bauba Platinum Limited Basic Materials Main yes 8
Brait S.A. Financials Main yes 7
Buildmax Limited Basic Materials Main yes 9
digicore holdings Limited industrials Main yes 10
ELB group Limited industrials Main yes 9
Cognition holdings Ltd technology Main yes 9
huge group Limited telecommunications Main yes 8
Kaydav group Limited industrials Main yes 6
traxys Africa trading Limited Basic Materials Main yes 6
Mix telematics Limited industrials Main yes 10
nictus Beperk Consumer Services Main yes 7
nu-world holdings Limited Consumer goods Main yes 7
Pallinghurst resources Limited Financials Main yes 7
Purple Capital Limited Financials Main no 6
Putprop Limited Financials Main no 5
randgold and Exploration Company Limited
Basic Materials Main yes 5
FIgURe 25: Jse-listed companies with no female director representation, 2017 28
PRIvaTe seCTOR ResUlTs3
28 Excluding subsidiaries
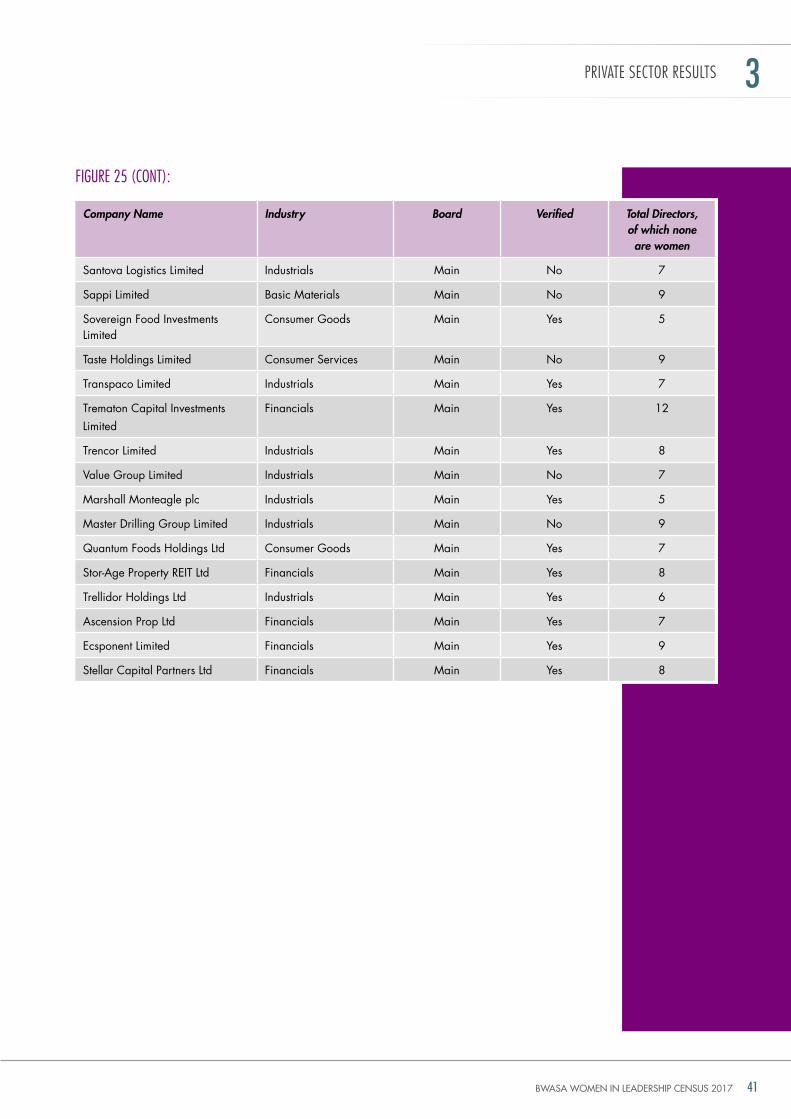
BWASA WOMEN IN LEADERSHIP CENSUS 2017 41
FIgURe 25 (CONT):
Company Name Industry Board Verified Total Directors, of which none
are women
Santova Logistics Limited industrials Main no 7
Sappi Limited Basic Materials Main no 9
Sovereign Food investments Limited
Consumer goods Main yes 5
taste holdings Limited Consumer Services Main no 9
transpaco Limited industrials Main yes 7
trematon Capital investments Limited
Financials Main yes 12
trencor Limited industrials Main yes 8
Value group Limited industrials Main no 7
Marshall Monteagle plc industrials Main yes 5
Master drilling group Limited industrials Main no 9
Quantum Foods holdings Ltd Consumer goods Main yes 7
Stor-Age Property rEit Ltd Financials Main yes 8
trellidor holdings Ltd industrials Main yes 6
Ascension Prop Ltd Financials Main yes 7
Ecsponent Limited Financials Main yes 9
Stellar Capital Partners Ltd Financials Main yes 8
28 Excluding subsidiaries
PRIvaTe seCTOR ResUlTs 3
BWASA WOMEN IN LEADERSHIP CENSUS 201742
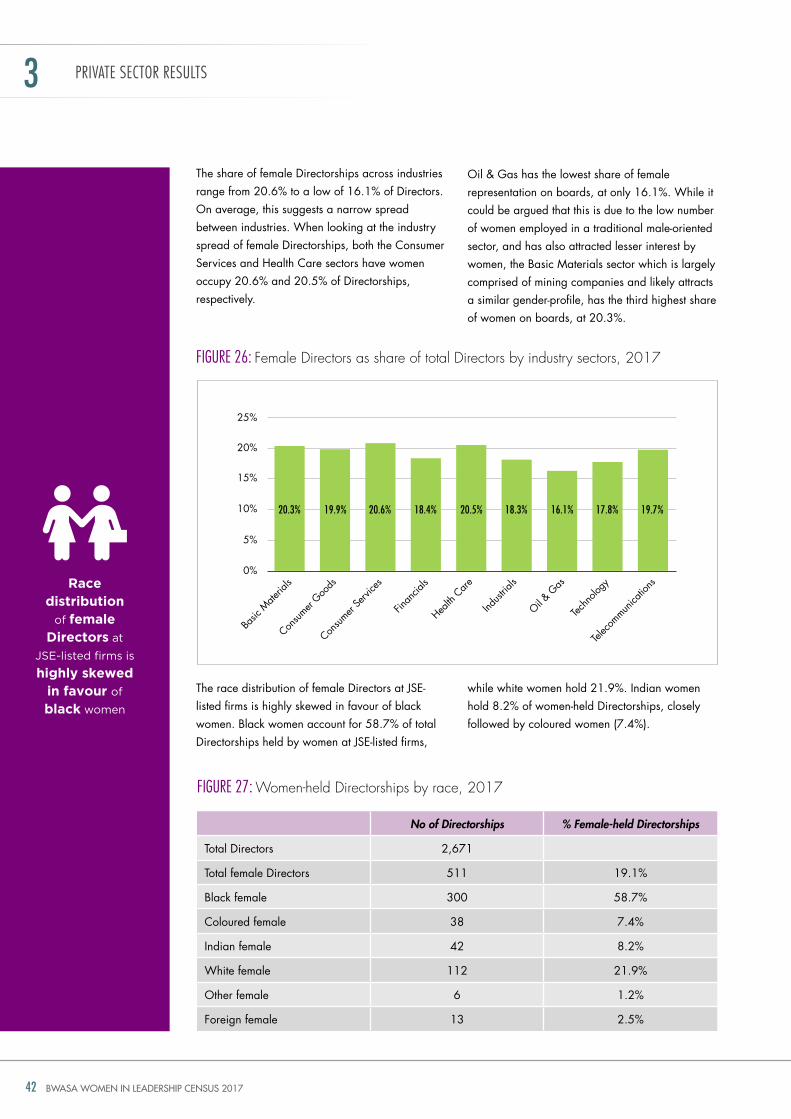
the race distribution of female directors at JSE-listed firms is highly skewed in favour of black women. Black women account for 58.7% of total directorships held by women at JSE-listed firms,
FIgURe 26: Female directors as share of total directors by industry sectors, 2017
while white women hold 21.9%. indian women hold 8.2% of women-held directorships, closely followed by coloured women (7.4%).
PRIvaTe seCTOR ResUlTs3
FIgURe 27: Women-held directorships by race, 2017
No of Directorships % Female-held Directorships
total directors 2,671
total female directors 511 19.1%
Black female 300 58.7%
Coloured female 38 7.4%
indian female 42 8.2%
White female 112 21.9%
other female 6 1.2%
Foreign female 13 2.5%
Race distribution
of female Directors at
JSE-listed firms is
highly skewed in favour of
black women
5%
10%
15%
20%
25%
0%
Basic
Mate
rials
Consum
er goo
ds
Consum
er Se
rvice
s
Finan
cials
health
Care
indust
rials
oil & g
as
techn
ology
telec
ommun
icatio
ns
20.3% 19.9% 18.4%20.6% 20.5% 18.3% 16.1% 17.8% 19.7%
the share of female directorships across industries range from 20.6% to a low of 16.1% of directors. on average, this suggests a narrow spread between industries. When looking at the industry spread of female directorships, both the Consumer Services and health Care sectors have women occupy 20.6% and 20.5% of directorships, respectively.
oil & gas has the lowest share of female representation on boards, at only 16.1%. While it could be argued that this is due to the low number of women employed in a traditional male-oriented sector, and has also attracted lesser interest by women, the Basic Materials sector which is largely comprised of mining companies and likely attracts a similar gender-profile, has the third highest share of women on boards, at 20.3%.
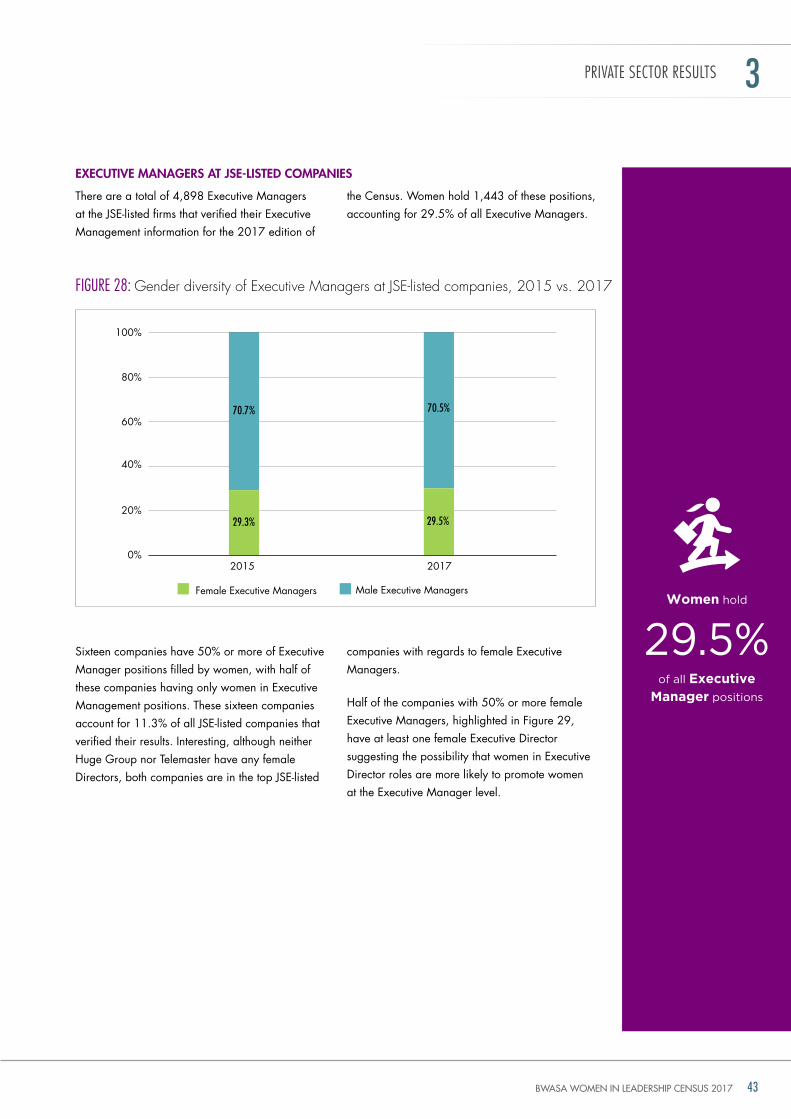
BWASA WOMEN IN LEADERSHIP CENSUS 2017 43
there are a total of 4,898 Executive Managers at the JSE-listed firms that verified their Executive Management information for the 2017 edition of
Sixteen companies have 50% or more of Executive Manager positions filled by women, with half of these companies having only women in Executive Management positions. these sixteen companies account for 11.3% of all JSE-listed companies that verified their results. interesting, although neither huge group nor telemaster have any female directors, both companies are in the top JSE-listed
the Census. Women hold 1,443 of these positions, accounting for 29.5% of all Executive Managers.
companies with regards to female Executive Managers.
half of the companies with 50% or more female Executive Managers, highlighted in Figure 29, have at least one female Executive director suggesting the possibility that women in Executive director roles are more likely to promote women at the Executive Manager level.
FIgURe 28: gender diversity of executive managers at Jse-listed companies, 2015 vs. 2017
PRIvaTe seCTOR ResUlTs 3
EXEcutIVE ManaGErS at JSE-lIStEd coMpanIES
of all Executive Manager positions
29.5%Women hold
0%
20%
40%
60%
80%
100%
70.7% 70.5%
2015 2017
Female Executive Managers Male Executive Managers
29.3% 29.5%
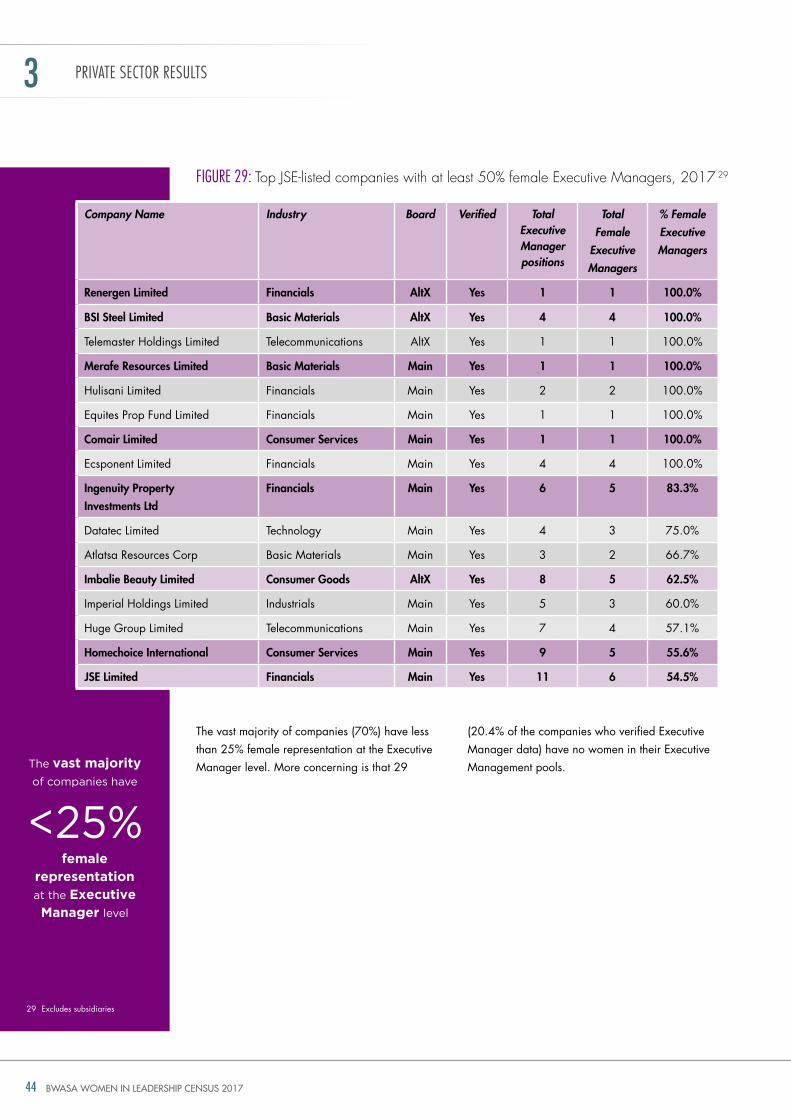
BWASA WOMEN IN LEADERSHIP CENSUS 201744
FIgURe 29: top Jse-listed companies with at least 50% female executive managers, 2017 29
Company Name Industry Board Verified Total Executive Manager positions
Total Female
Executive Managers
% Female Executive Managers
renergen limited Financials altX Yes 1 1 100.0%
BSI Steel limited Basic Materials altX Yes 4 4 100.0%
telemaster holdings Limited telecommunications AltX yes 1 1 100.0%
Merafe resources limited Basic Materials Main Yes 1 1 100.0%
hulisani Limited Financials Main yes 2 2 100.0%
Equites Prop Fund Limited Financials Main yes 1 1 100.0%
comair limited consumer Services Main Yes 1 1 100.0%
Ecsponent Limited Financials Main yes 4 4 100.0%
Ingenuity property
Investments ltd
Financials Main Yes 6 5 83.3%
datatec Limited technology Main yes 4 3 75.0%
Atlatsa resources Corp Basic Materials Main yes 3 2 66.7%
Imbalie Beauty limited consumer Goods altX Yes 8 5 62.5%
imperial holdings Limited industrials Main yes 5 3 60.0%
huge group Limited telecommunications Main yes 7 4 57.1%
Homechoice International consumer Services Main Yes 9 5 55.6%
JSE limited Financials Main Yes 11 6 54.5%
29 Excludes subsidiaries
the vast majority of companies (70%) have less than 25% female representation at the Executive Manager level. More concerning is that 29
(20.4% of the companies who verified Executive Manager data) have no women in their Executive Management pools.
female representation
at the Executive Manager level
PRIvaTe seCTOR ResUlTs3
<25%
the vast majority
of companies have
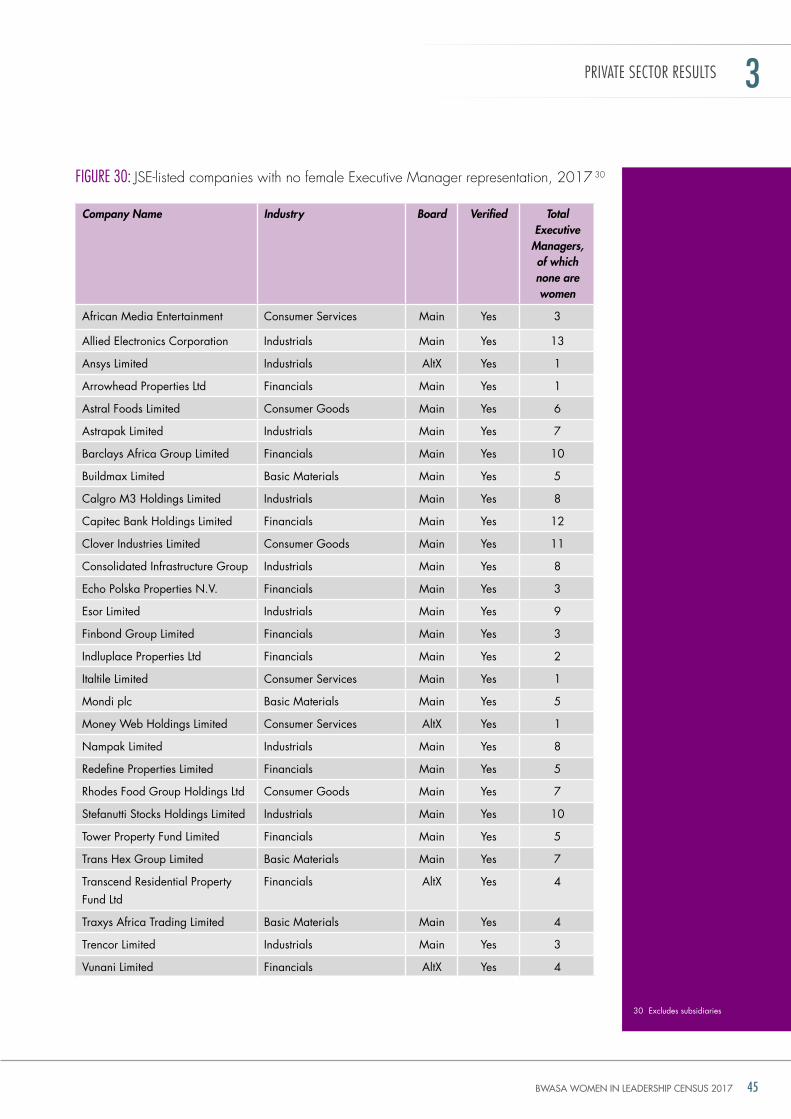
BWASA WOMEN IN LEADERSHIP CENSUS 2017 45
FIgURe 30: Jse-listed companies with no female executive manager representation, 2017 30
PRIvaTe seCTOR ResUlTs 3
Company Name Industry Board Verified Total Executive
Managers, of which none are women
African Media Entertainment Consumer Services Main yes 3
Allied Electronics Corporation industrials Main yes 13
Ansys Limited industrials AltX yes 1
Arrowhead Properties Ltd Financials Main yes 1
Astral Foods Limited Consumer goods Main yes 6
Astrapak Limited industrials Main yes 7
Barclays Africa group Limited Financials Main yes 10
Buildmax Limited Basic Materials Main yes 5
Calgro M3 holdings Limited industrials Main yes 8
Capitec Bank holdings Limited Financials Main yes 12
Clover industries Limited Consumer goods Main yes 11
Consolidated infrastructure group industrials Main yes 8
Echo Polska Properties n.V. Financials Main yes 3
Esor Limited industrials Main yes 9
Finbond group Limited Financials Main yes 3
indluplace Properties Ltd Financials Main yes 2
italtile Limited Consumer Services Main yes 1
Mondi plc Basic Materials Main yes 5
Money Web holdings Limited Consumer Services AltX yes 1
nampak Limited industrials Main yes 8
redefine Properties Limited Financials Main yes 5
rhodes Food group holdings Ltd Consumer goods Main yes 7
Stefanutti Stocks holdings Limited industrials Main yes 10
tower Property Fund Limited Financials Main yes 5
trans hex group Limited Basic Materials Main yes 7
transcend residential Property Fund Ltd
Financials AltX yes 4
traxys Africa trading Limited Basic Materials Main yes 4
trencor Limited industrials Main yes 3
Vunani Limited Financials AltX yes 4
30 Excludes subsidiaries
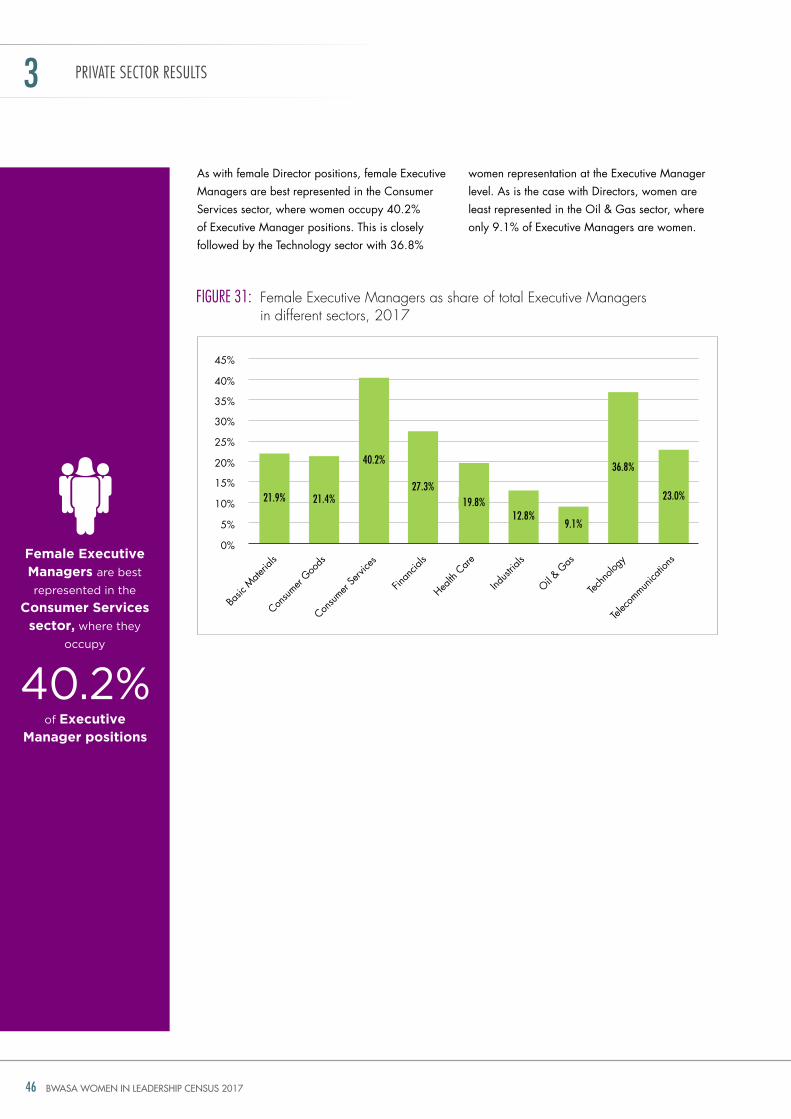
BWASA WOMEN IN LEADERSHIP CENSUS 201746
0%
5%
10%
15%
20%
25%
30%
35%
40%
45%
21.9% 21.4%
40.2%36.8%
23.0%27.3%
19.8%12.8%
9.1%
Basic
Mate
rials
Consum
er goo
ds
Consum
er Se
rvice
s
Finan
cials
health
Care
indust
rials
oil & g
as
techn
ology
telec
ommun
icatio
ns
FIgURe 31: Female executive managers as share of total executive managers in different sectors, 2017
PRIvaTe seCTOR ResUlTs3
As with female director positions, female Executive Managers are best represented in the Consumer Services sector, where women occupy 40.2% of Executive Manager positions. this is closely followed by the technology sector with 36.8%
women representation at the Executive Manager level. As is the case with directors, women are least represented in the oil & gas sector, where only 9.1% of Executive Managers are women.
Female Executive Managers are best
represented in the Consumer Services
sector, where they
occupy
40.2%of Executive
Manager positions
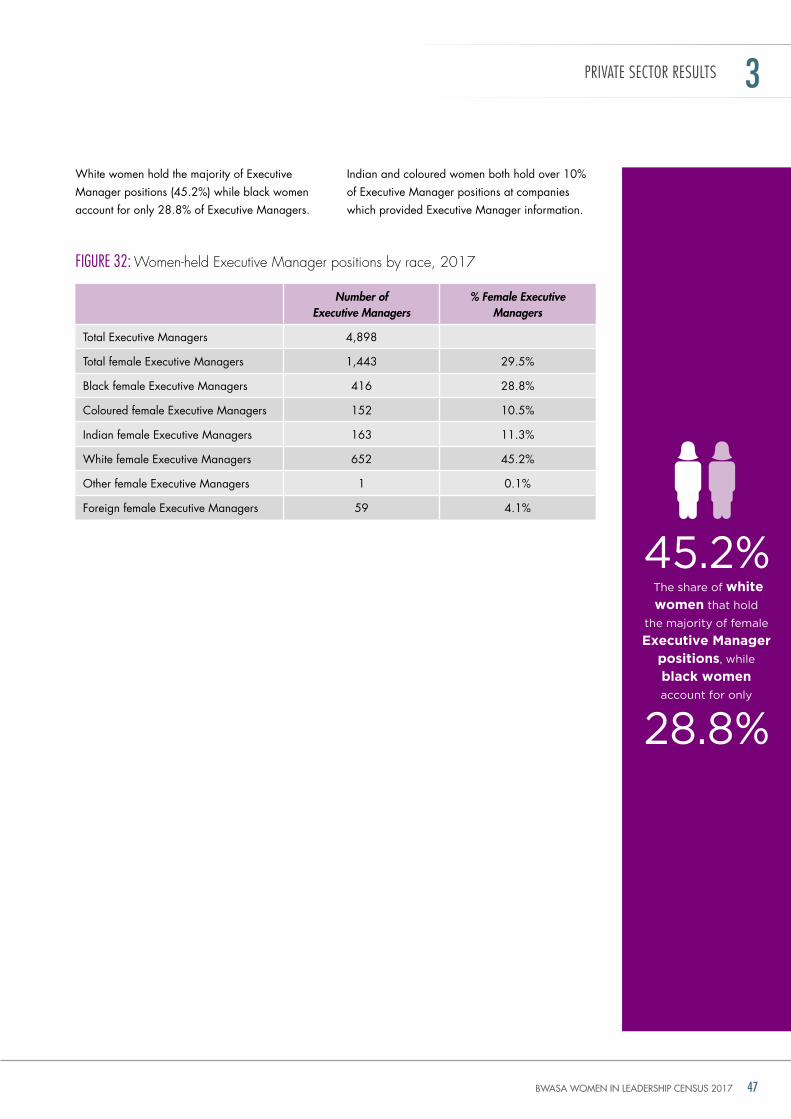
BWASA WOMEN IN LEADERSHIP CENSUS 2017 47
White women hold the majority of Executive Manager positions (45.2%) while black women account for only 28.8% of Executive Managers.
FIgURe 32: Women-held executive manager positions by race, 2017
indian and coloured women both hold over 10% of Executive Manager positions at companies which provided Executive Manager information.
PRIvaTe seCTOR ResUlTs 3
Number of Executive Managers
% Female Executive Managers
total Executive Managers 4,898
total female Executive Managers 1,443 29.5%
Black female Executive Managers 416 28.8%
Coloured female Executive Managers 152 10.5%
indian female Executive Managers 163 11.3%
White female Executive Managers 652 45.2%
other female Executive Managers 1 0.1%
Foreign female Executive Managers 59 4.1%
the share of white women that hold
the majority of female
Executive Manager positions, while
black women
account for only
45.2%
28.8%
BWASA WOMEN IN LEADERSHIP CENSUS 201748
Barloworld takes pride in the diverse leadership talent the company has attracted in recent years. With group-level targets – to have at least 35% of women
representation across the business and at least 40% women in middle management level and above by 2020 – deliberate decisions have been taken to attract, nurture and give opportunities to diverse talent.
At the leadership level, the perspectives and viewpoints that Barloworld’s four women board members have brought to the table have “changed both the dynamic and language of board
meetings” as well as helped to identify and navigate “blind spots”. Even though women bring different leadership styles with unique strengths, it is only when a board comprises of at least
three women that their voice starts to shift board discussions effectively.
having four women board members has assisted Barloworld with transitioning and changing its collective leadership style which has, without a doubt, progressed the company. For example, Barloworld realised leave policies needed to be overhauled as previously, having been designed solely by men, they favoured men. With the business becoming results orientated, rather than time orientated, they introduced flexi-time which has had a positive impact on women who carry out a lot of ‘unpaid’ work in the home including, child-rearing.
it has also led to the leadership looking at the company’s talent differently. Although the prioritising, recognition and development of talent is important, it takes more than this to bring in and develop women leaders. Women need to be given the space to articulate their thinking and views and ability in an environment which treats them with respect and integrity. Barloworld aims to drive a culture of diversity and inclusivity, across all its operations around the world,
doMiniC sewelA
A toP-doWn APProACh CAn ChAngE thE trAnSForMAtion nArrAtiVE in
trAditionALLy MALE-doMinAtEd induStriES. LEAdErShiP MuSt SEt thE tonE to CrEAtE
An intEr-SECtorAL And intErgEnErAtionAL CuLturE oF diVErSity And inCLuSiVity,
And to BrEAK PrE-EXiSting StErEotyPES.
ChieF exeCutiVe, BArloworld
“it is only when a board comprises of at least three women that their voice starts to shift board discussions effectively.”
INTeRvIeW3
BWASA WOMEN IN LEADERSHIP CENSUS 2017 49
Who is Dominic seWela? • DominicSewelaistheChiefExecutiveofBarloworldLtdandwas
appointedtothispositioninFebruary2017.
• HewasappointedtotheBarloworldboardin2014andpreviouslyservedasChiefExecutiveOfficerofBarloworldEquipmentSouthAfricaandCEOofBarloworldEquipmentSouthernAfrica.
• DominicholdsaBSc.ChemicalEngineeringfromTuskegeeUniversity.
• PriortojoiningBarloworld,hewasdeputymanagingdirectorofAfgriLimited,whichconsequentlymadehiminstrumentalinsealingtheAFGRI’sR500mempowermentdealwithAgriSizweEmpowermentTrust.
What inspires us about Dominic seWela? Hispassionforpromotingtheintegrationofyoungpeopleandwomenintothebusiness,anddoingthisbydrawingfromintergenerationalexperiences.
tackling prevailing biases and pervasive cultural norms, such as a lack of respect for women, in some of these wide-spanning geographies.
Barloworld believes that women can articulate their needs without requiring a spokesperson and has created the space for this to happen. this is important to create an inter-sectoral work environment, with dialogue that allows a change in mind-sets and culture crucial to this. Similarly, intergenerational diversity is being embraced, with experienced leaders noting that they learn from younger staff and women, largely as they come from a culture less focused on race and gender.
having short, medium and long-term plans to invest in a pipeline of women, and in retention programmes is vital at all tiers of the organisation. these include two-year fast-track programmes, ongoing up-skilling women, and being exposed to and given opportunities in all parts of the business through rotation initiatives. rotation initiatives result in development through closer interaction with diverse teams, taking women out of their comfort zones as well as enhancing their absorption into the business. this provides Barloworld women with opportunities to step up and to build on their strengths while recognising their capability and potential thus strengthening their confidence muscle.
Setting transformation targets specifically for women is imperative if companies are to deal effectively with the historical and structural issues that hinder women’s development. these tend to “focus the mind” and put in place consequences where targets are not met.
Barloworld cannot achieve this on its own. the onus is on organisations such as Barloworld to challenge their suppliers and customers on their own empowerment initiatives, to develop an ecosystem that allows women to flourish. industry transformation will only come about when an enabling environment and more inclusive culture that helps to eradicate the barriers faced across gender, race, religion and disabilities is created.
FAst FACts
Key stAts*
Barloworld is among the top performing
listed firms both in terms of female Directors
as well as female executive Managers
Fourteen of 62 Executive Managers are women (23%)
Four of ten Directors are women (40%)
4
INTeRvIeW 3
* From the 2017 Census
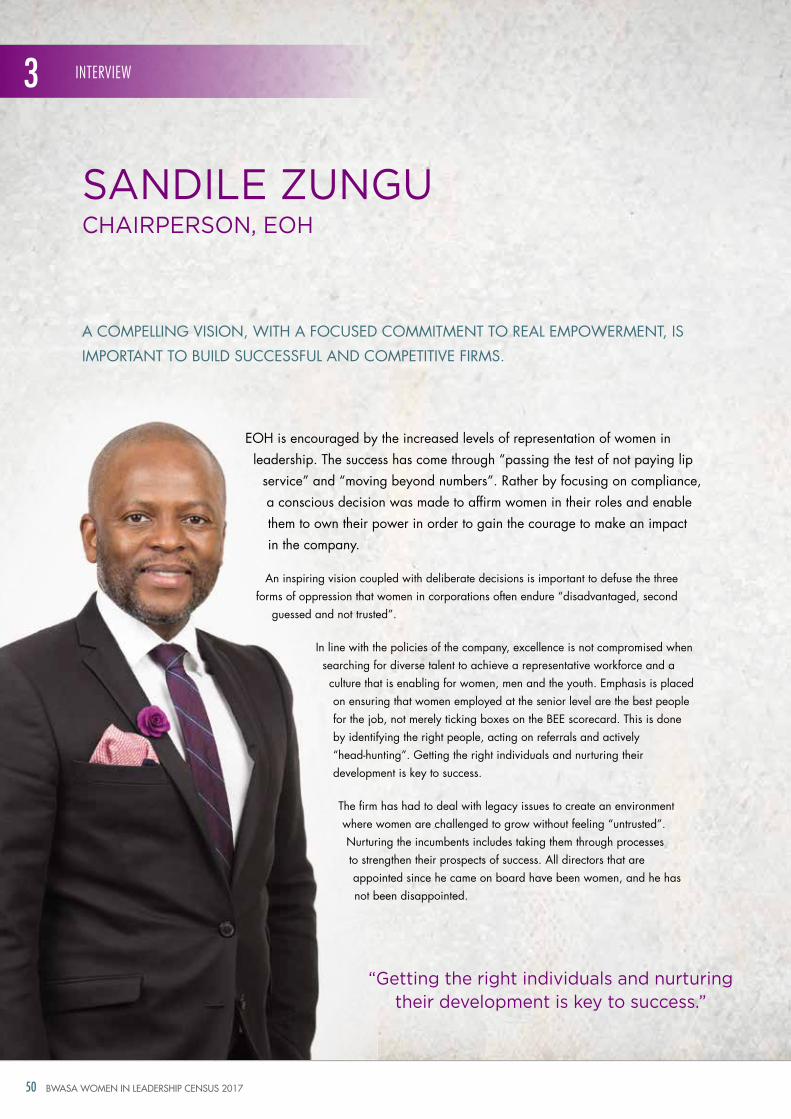
BWASA WOMEN IN LEADERSHIP CENSUS 201750
INTeRvIeW3
Eoh is encouraged by the increased levels of representation of women in leadership. the success has come through “passing the test of not paying lip
service” and “moving beyond numbers”. rather by focusing on compliance, a conscious decision was made to affirm women in their roles and enable them to own their power in order to gain the courage to make an impact in the company.
An inspiring vision coupled with deliberate decisions is important to defuse the three forms of oppression that women in corporations often endure “disadvantaged, second
guessed and not trusted”.
in line with the policies of the company, excellence is not compromised when searching for diverse talent to achieve a representative workforce and a culture that is enabling for women, men and the youth. Emphasis is placed on ensuring that women employed at the senior level are the best people for the job, not merely ticking boxes on the BEE scorecard. this is done by identifying the right people, acting on referrals and actively “head-hunting”. getting the right individuals and nurturing their development is key to success.
the firm has had to deal with legacy issues to create an environment where women are challenged to grow without feeling “untrusted”. nurturing the incumbents includes taking them through processes to strengthen their prospects of success. All directors that are appointed since he came on board have been women, and he has not been disappointed.
sAndile ZunGu
A CoMPELLing ViSion, With A FoCuSEd CoMMitMEnt to rEAL EMPoWErMEnt, iS
iMPortAnt to BuiLd SuCCESSFuL And CoMPEtitiVE FirMS.
ChAirPerson, eoh
“Getting the right individuals and nurturing their development is key to success.”
BWASA WOMEN IN LEADERSHIP CENSUS 2017 51
Who is sanDile Zungu? • SandileZunguisanindependentnon-executiveChairmanatEOH
Holdings.SandileholdsaBScMechanicalEngineeringdegreefromUniversityofCapeTown(UCT).
• Inaddition,SandileholdsanMBAfromUCT’sGraduateBusinessSchool,whichhasenabledhimtofulfilaplethoraofrolesincludingbutnotlimitedtoexecutivechairmanofZunguInvestmentsCompany(ZICO),non-executivedirectoratNovusHoldingsLtd,IndependentNon-ExecutiveDirectoratCiplaMedproSouthAfricaLtd,etc.
• SandileisalsocurrentlyamemberofthepresidentialBlackEconomicEmpowermentAdvisoryCouncil,arolewhichhewaspersonallyappointedforbyPresidentJacobZumaandonededicatedtotransitionalsocio-economicjustice.
What inspires us about sanDile Zungu? Sandilehasheldpowerfulpositions,andtheexperiencegainedfromthosehavemadehisvoiceoneworthhearingwhentalkingaboutgenderdisparitiesincorporateSouthAfrica.Sincehisappointmentaschairperson,onlyfemalemembershavebeenappointedtotheboard.
FAst FACts
Key stAts*
INTeRvIeW 3
eoh is among the
top performing listed
companies with more than 25% female
Directors
out of 14 board
members are women (28.6%)4
to achieve the desired transactional environment also requires that the diverse strengths that women bring should be celebrated and made visible which will go a long way in changing attitudes as well as promoting the confidence of women entering new terrains. Building a brand of success among women achievers is important. giving awards to outstanding women is one of the ways of making their success visible. Women make good managers because of the way they relate to power and achievement. this needs to be celebrated, too.
As it is important to create an environment that is enabling internally and externally to contribute to meaningful change in the economy, Eoh also sets standards for suppliers. Suppliers are required to meet identified targets of representation in their supply chain. in sourcing legal, accounting and auditing services for example, the emphasis is placed on bringing on board small and medium-sized firms from disadvantaged backgrounds including women-owned businesses.
to promote excellence in leadership and management the firm also provides executive and management development opportunities. Attitudinal and stereotypical issues are also addressed through dialogue and training to create a more humane and enabling environment for the firm and its stakeholders.
* From the 2017 Census
BWASA WOMEN IN LEADERSHIP CENSUS 201752
South Africa’s mainstream economy comprises more than JSE-listed firms and SoEs. Multinationals and non-listed companies are important contributors to employment and gross domestic product (gdP). So too are business services as a sector. in 2015, business services as a whole contributed 5% of South Africa’s gdP. 31 Professional services firms, including audit, accounting and consulting, and law firms, also employ a large number of persons, (approximately 2 174 000 or 22.5% of all employed persons) in South Africa. 32 For these reasons, an analysis of gender representation at professional services partnerships such as audit, accounting and consulting, as well as law firms is important, and the conversation that such an analysis could foster is a necessity. Both listed firms and SoEs, as well as other government entities, and large multinational corporations that focus on gender diversity and transformation in their supply chains are often major clients of many of these professional services firms.
the 2017 Census aimed to extend its reporting structure and provide an initial analysis of South Africa’s non-listed private sector, by including a select number of larger audit and law firms in South Africa and comparing the number of women in leadership and ownership role broadly at these firms. this is notably the Big Four audit, accounting and consulting firms including deloitte, Ey, KPMg, and PwC as well as grant thornton; and the Big Five law firms: Bowman gilfillan, Cliffe dekker hofmeyr, EnSafrica, norton rose Fulbright and Webber Wentzel. these ten firms were chosen as an initial sample of the professional services space in South Africa and this inclusion could be extended in future editions of this Census.
While JSE-listed firms now need to include targets and report on progress on these targets, audit, accounting and consulting, and law firms servicing these listed firms are also increasingly putting plans in place to adhere to the transformation
objectives of their clients regarding both gender and race.
Some of these firms subscribe to initiatives such as the 30% Club campaign that was created in 2010 in the uK with the objective of achieving a minimum 30% women representation on the boards of on FtSE-100 companies. deloitte, Ey, PwC, norton rose Fulbright and Webber Wentzel are all members of the 30% Club. in South Africa specifically, transformation targets have been publicly set. For example, deloitte has targets in place to be 35% female-owned by 2020 and 51% black-owned versus at June 2017 being 28% female-owned and 37% black-owned. 33
transformation and empowerment metrics are increasingly being measured and reported on in the professional services industry. these metrics are often an important component of various awards within the private sector, including the oliver Empowerment Awards, the Employment Equity Awards, SA Professional Services Awards (SAPSA) and the Empowerdex “Most Empowered Companies index”.
this year, the above-noted organisations were requested to provide information on the transformation status of their firms during the data collection period. grant thornton, EnSafrica, KPMg and Cliffe dekker hofmeyr provided and verified the requested information and are commended for their openness and transparency in this regard.
All the required information from the sample identified was not obtained during the data collection period for various reasons. however, data regarding board members and/or Executive Committee members, and partners were often available publicly on websites. it must be noted though that this publicly available information was neither for the reporting period of the Census, i.e. as of 28 February 2017, nor was the information always verified by the firms in question, as indicated.
Professional services Firms
31 Stats SA, 2017 and this includes other business services as well
32 Stats SA, 2017 and this includes other business services as well
33 Financial Mail, June 2017
the 2017 Census
aimed to extend its
reporting structure
and provide an initial
analysis of South
Africa’s non-listed
private sector
PRIvaTe seCTOR ResUlTs3
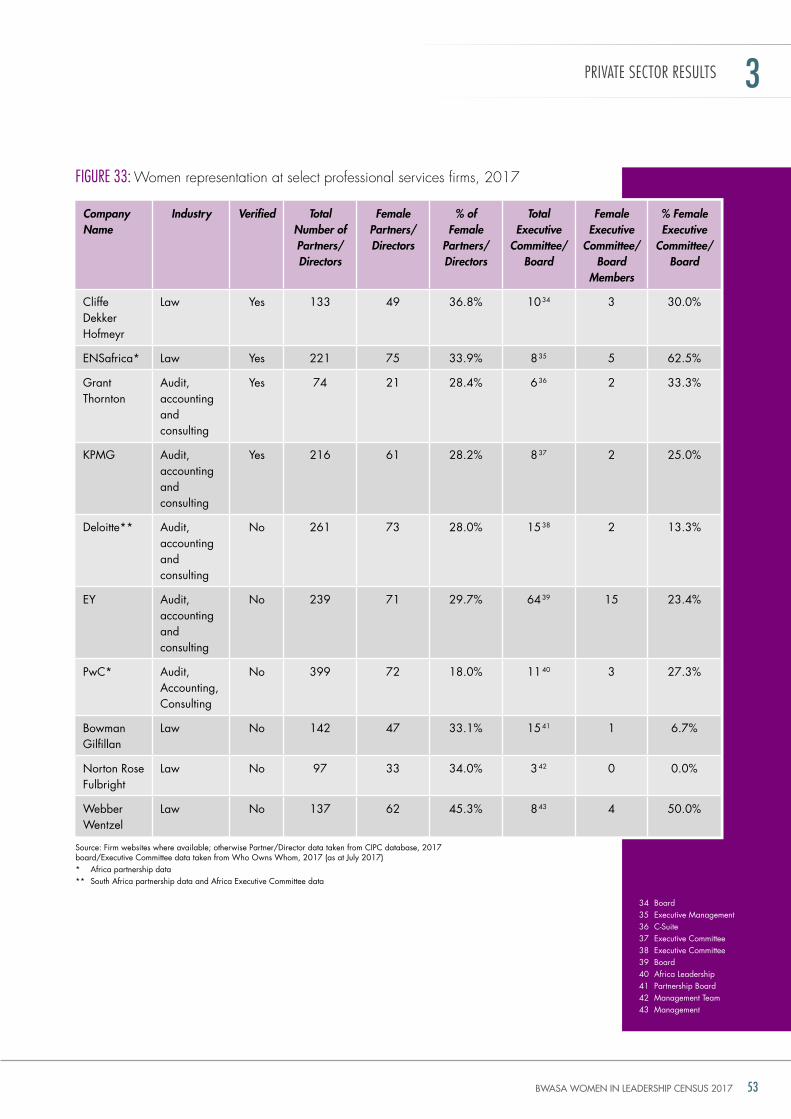
BWASA WOMEN IN LEADERSHIP CENSUS 2017 53
FIgURe 33: Women representation at select professional services firms, 2017
Source: Firm websites where available; otherwise Partner/director data taken from CiPC database, 2017 board/Executive Committee data taken from Who owns Whom, 2017 (as at July 2017) * Africa partnership data** South Africa partnership data and Africa Executive Committee data
34 Board35 Executive Management36 C-Suite37 Executive Committee38 Executive Committee39 Board40 Africa Leadership41 Partnership Board42 Management team43 Management
Company Name
Industry Verified Total Number of Partners/ Directors
Female Partners/ Directors
% of Female
Partners/Directors
Total Executive
Committee/ Board
Female Executive
Committee/ Board
Members
% Female Executive
Committee/ Board
Cliffe dekker hofmeyr
Law yes 133 49 36.8% 10 34 3 30.0%
EnSafrica* Law yes 221 75 33.9% 8 35 5 62.5%
grant thornton
Audit, accounting and consulting
yes 74 21 28.4% 6 36 2 33.3%
KPMg Audit, accounting and consulting
yes 216 61 28.2% 8 37 2 25.0%
deloitte** Audit, accounting and consulting
no 261 73 28.0% 15 38 2 13.3%
Ey Audit, accounting and consulting
no 239 71 29.7% 64 39 15 23.4%
PwC* Audit, Accounting, Consulting
no 399 72 18.0% 11 40 3 27.3%
Bowman gilfillan
Law no 142 47 33.1% 15 41 1 6.7%
norton rose Fulbright
Law no 97 33 34.0% 3 42 0 0.0%
Webber Wentzel
Law no 137 62 45.3% 8 43 4 50.0%
PRIvaTe seCTOR ResUlTs 3
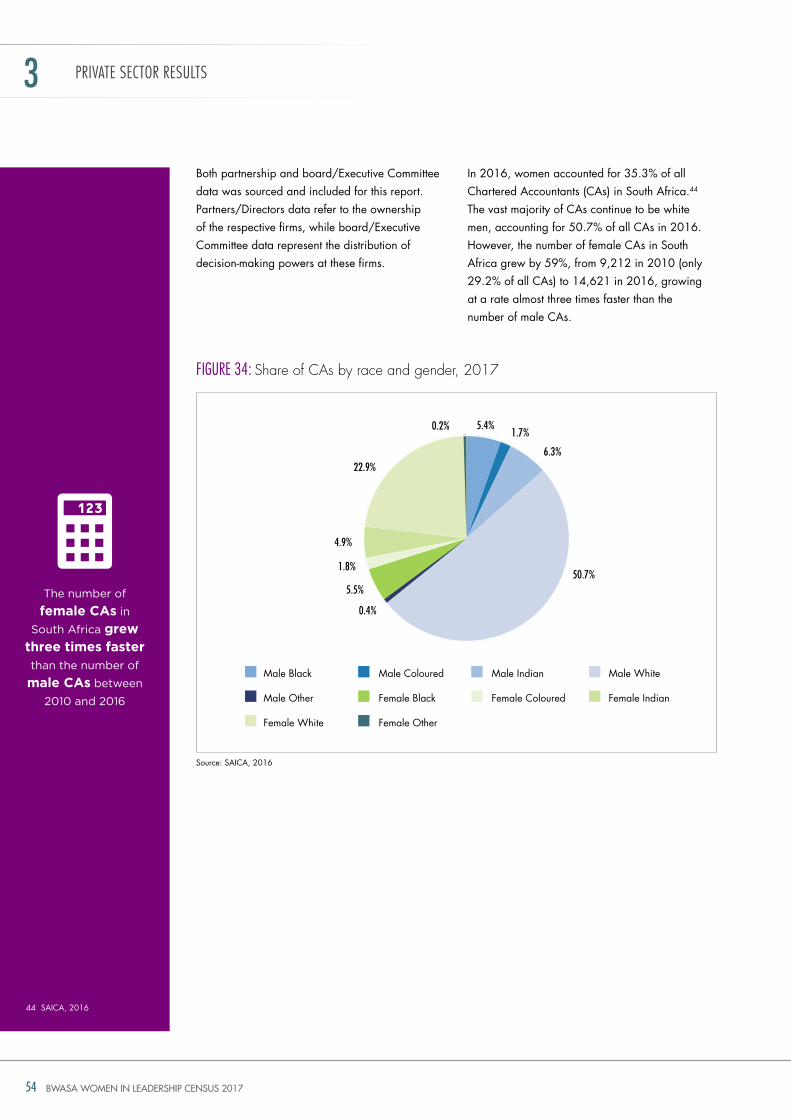
BWASA WOMEN IN LEADERSHIP CENSUS 201754
Male Black Male Coloured Male WhiteMale indian
Male other Female Black Female Coloured Female indian
Female White Female other
Both partnership and board/Executive Committee data was sourced and included for this report. Partners/directors data refer to the ownership of the respective firms, while board/Executive Committee data represent the distribution of decision-making powers at these firms.
FIgURe 34: share of cas by race and gender, 2017
in 2016, women accounted for 35.3% of all Chartered Accountants (CAs) in South Africa.44 the vast majority of CAs continue to be white men, accounting for 50.7% of all CAs in 2016. however, the number of female CAs in South Africa grew by 59%, from 9,212 in 2010 (only 29.2% of all CAs) to 14,621 in 2016, growing at a rate almost three times faster than the number of male CAs.
PRIvaTe seCTOR ResUlTs3
Source: SAiCA, 2016
the number of
female CAs in
south Africa grew three times faster
than the number of
male CAs between
2010 and 2016
5.4%1.7%
6.3%
0.4%
0.2%
5.5%
1.8%
4.9%
22.9%
50.7%
44 SAiCA, 2016
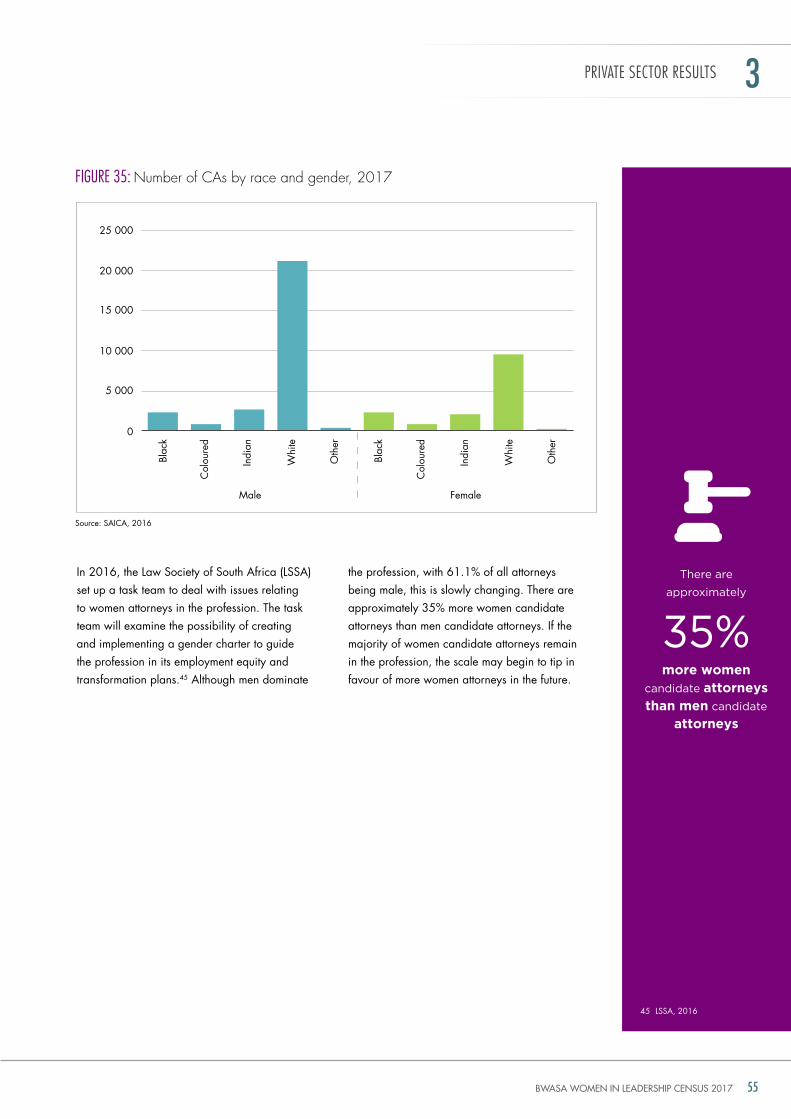
BWASA WOMEN IN LEADERSHIP CENSUS 2017 55
5 000
0
10 000
15 000
20 000
25 000
in 2016, the Law Society of South Africa (LSSA) set up a task team to deal with issues relating to women attorneys in the profession. the task team will examine the possibility of creating and implementing a gender charter to guide the profession in its employment equity and transformation plans.45 Although men dominate
FIgURe 35: number of cas by race and gender, 2017
the profession, with 61.1% of all attorneys being male, this is slowly changing. there are approximately 35% more women candidate attorneys than men candidate attorneys. if the majority of women candidate attorneys remain in the profession, the scale may begin to tip in favour of more women attorneys in the future.
PRIvaTe seCTOR ResUlTs 3
Source: SAiCA, 2016
45 LSSA, 2016
there are
approximately
more women
candidate attorneys
than men candidate
attorneys
35%
Blac
k
Col
oure
d
indi
an
Whi
te
oth
er
Blac
k
Col
oure
d
indi
an
Whi
te
oth
er
Male Female
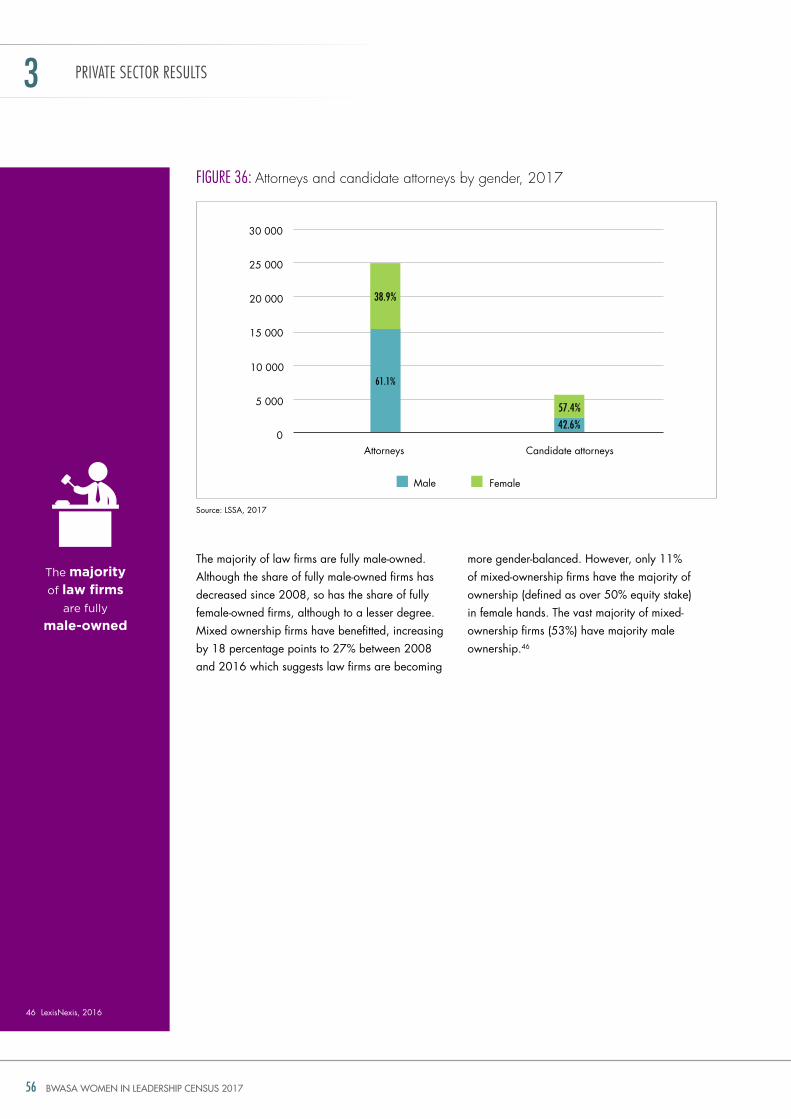
BWASA WOMEN IN LEADERSHIP CENSUS 201756
PRIvaTe seCTOR ResUlTs3
46 Lexisnexis, 2016
the majority
of law firms
are fully
male-owned
the majority of law firms are fully male-owned. Although the share of fully male-owned firms has decreased since 2008, so has the share of fully female-owned firms, although to a lesser degree. Mixed ownership firms have benefitted, increasing by 18 percentage points to 27% between 2008 and 2016 which suggests law firms are becoming
more gender-balanced. however, only 11% of mixed-ownership firms have the majority of ownership (defined as over 50% equity stake) in female hands. the vast majority of mixed-ownership firms (53%) have majority male ownership.46
FIgURe 36: attorneys and candidate attorneys by gender, 2017
Source: LSSA, 2017
5 000
15 000
20 000
25 000
30 000
10 000
0Attorneys Candidate attorneys
Male Female
38.9%
61.1%
42.6%
57.4%
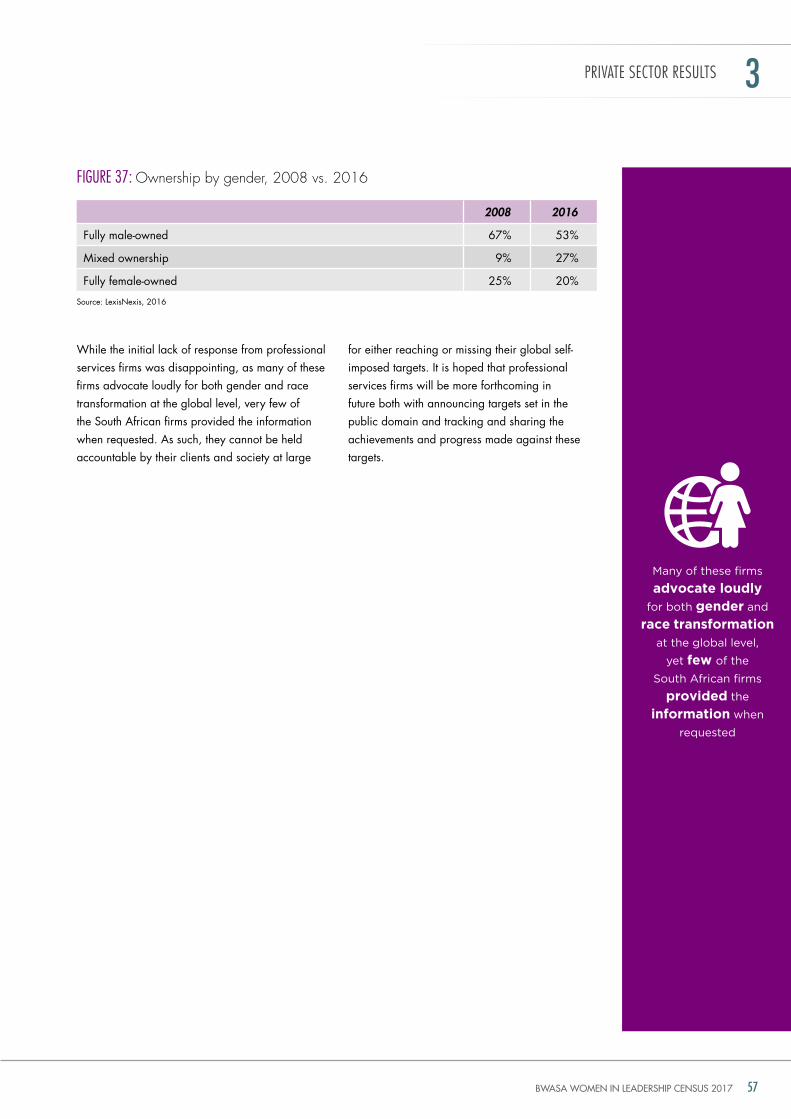
BWASA WOMEN IN LEADERSHIP CENSUS 2017 57
While the initial lack of response from professional services firms was disappointing, as many of these firms advocate loudly for both gender and race transformation at the global level, very few of the South African firms provided the information when requested. As such, they cannot be held accountable by their clients and society at large
for either reaching or missing their global self-imposed targets. it is hoped that professional services firms will be more forthcoming in future both with announcing targets set in the public domain and tracking and sharing the achievements and progress made against these targets.
PRIvaTe seCTOR ResUlTs 3
FIgURe 37: ownership by gender, 2008 vs. 2016
2008 2016
Fully male-owned 67% 53%
Mixed ownership 9% 27%
Fully female-owned 25% 20%
Source: Lexisnexis, 2016
Many of these firms
advocate loudly
for both gender and
race transformation
at the global level,
yet few of the
South African firms
provided the information when
requested
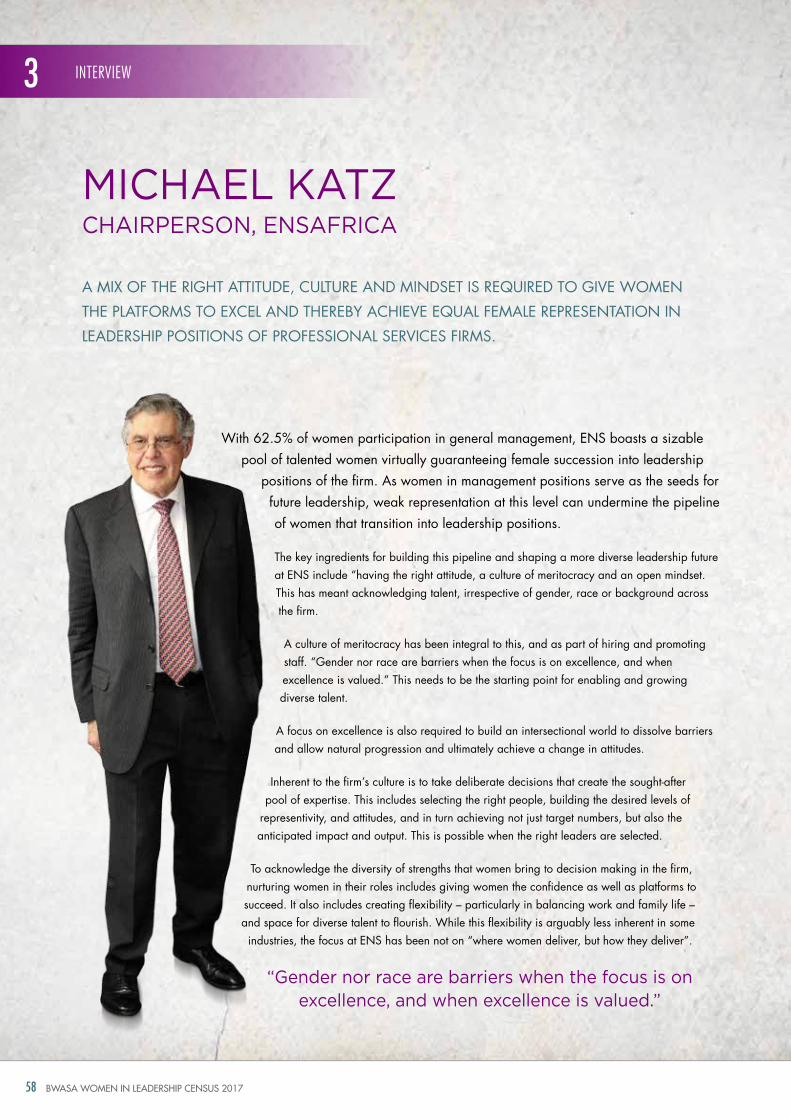
BWASA WOMEN IN LEADERSHIP CENSUS 201758
With 62.5% of women participation in general management, EnS boasts a sizable pool of talented women virtually guaranteeing female succession into leadership
positions of the firm. As women in management positions serve as the seeds for future leadership, weak representation at this level can undermine the pipeline of women that transition into leadership positions.
the key ingredients for building this pipeline and shaping a more diverse leadership future at EnS include “having the right attitude, a culture of meritocracy and an open mindset. this has meant acknowledging talent, irrespective of gender, race or background across the firm.
A culture of meritocracy has been integral to this, and as part of hiring and promoting staff. “gender nor race are barriers when the focus is on excellence, and when excellence is valued.” this needs to be the starting point for enabling and growing diverse talent.
A focus on excellence is also required to build an intersectional world to dissolve barriers and allow natural progression and ultimately achieve a change in attitudes.
inherent to the firm’s culture is to take deliberate decisions that create the sought-after pool of expertise. this includes selecting the right people, building the desired levels of
representivity, and attitudes, and in turn achieving not just target numbers, but also the anticipated impact and output. this is possible when the right leaders are selected.
to acknowledge the diversity of strengths that women bring to decision making in the firm, nurturing women in their roles includes giving women the confidence as well as platforms to succeed. it also includes creating flexibility – particularly in balancing work and family life – and space for diverse talent to flourish. While this flexibility is arguably less inherent in some industries, the focus at EnS has been not on “where women deliver, but how they deliver”.
MiChAel KAtZ
A MiX oF thE right AttitudE, CuLturE And MindSEt iS rEQuirEd to giVE WoMEn
thE PLAtForMS to EXCEL And thErEBy AChiEVE EQuAL FEMALE rEPrESEntAtion in
LEAdErShiP PoSitionS oF ProFESSionAL SErViCES FirMS.
ChAirPerson, ensAFriCA
“Gender nor race are barriers when the focus is on excellence, and when excellence is valued.”
INTeRvIeW3
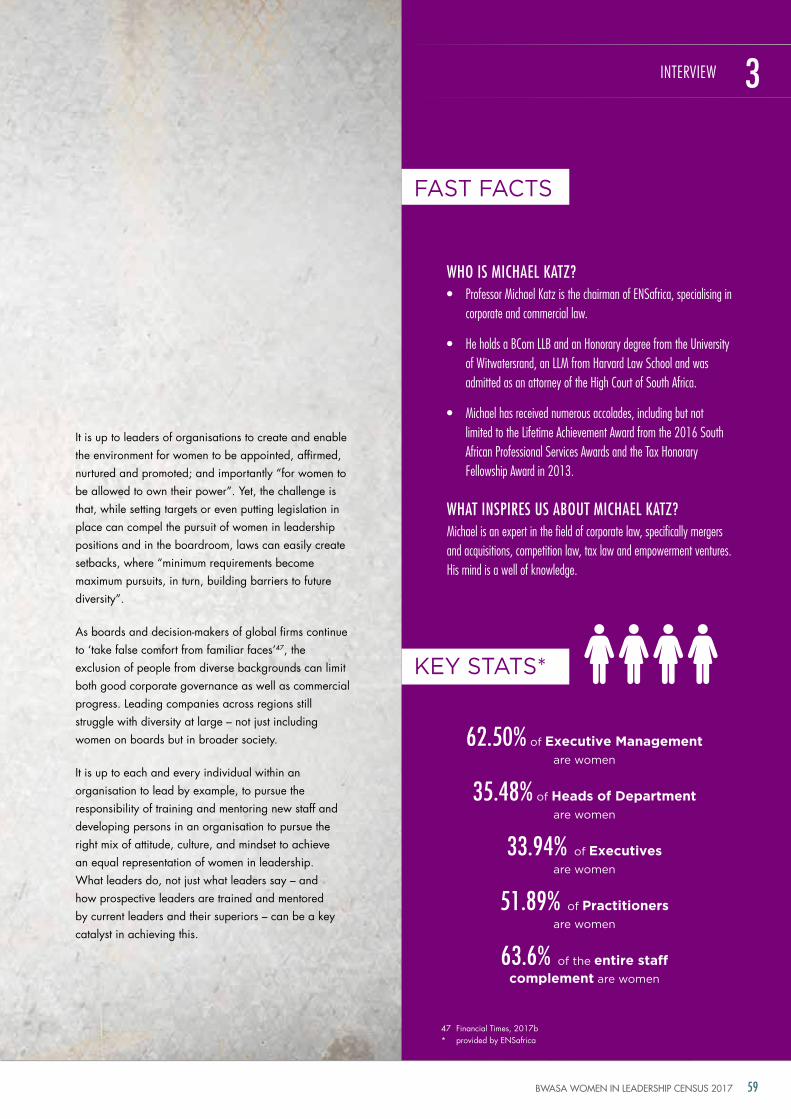
BWASA WOMEN IN LEADERSHIP CENSUS 2017 59
Who is michael KatZ? • ProfessorMichaelKatzisthechairmanofENSafrica,specialisingin
corporateandcommerciallaw.
• HeholdsaBComLLBandanHonorarydegreefromtheUniversityofWitwatersrand,anLLMfromHarvardLawSchoolandwasadmittedasanattorneyoftheHighCourtofSouthAfrica.
• Michaelhasreceivednumerousaccolades,includingbutnotlimitedtotheLifetimeAchievementAwardfromthe2016SouthAfricanProfessionalServicesAwardsandtheTaxHonoraryFellowshipAwardin2013.
What inspires us about michael KatZ? Michaelisanexpertinthefieldofcorporatelaw,specificallymergersandacquisitions,competitionlaw,taxlawandempowermentventures.Hismindisawellofknowledge.
it is up to leaders of organisations to create and enable the environment for women to be appointed, affirmed, nurtured and promoted; and importantly “for women to be allowed to own their power”. yet, the challenge is that, while setting targets or even putting legislation in place can compel the pursuit of women in leadership positions and in the boardroom, laws can easily create setbacks, where “minimum requirements become maximum pursuits, in turn, building barriers to future diversity”.
As boards and decision-makers of global firms continue to ‘take false comfort from familiar faces’47, the exclusion of people from diverse backgrounds can limit both good corporate governance as well as commercial progress. Leading companies across regions still struggle with diversity at large – not just including women on boards but in broader society.
it is up to each and every individual within an organisation to lead by example, to pursue the responsibility of training and mentoring new staff and developing persons in an organisation to pursue the right mix of attitude, culture, and mindset to achieve an equal representation of women in leadership. What leaders do, not just what leaders say – and how prospective leaders are trained and mentored by current leaders and their superiors – can be a key catalyst in achieving this.
FAst FACts
Key stAts*
62.50% of Executive Management
are women
35.48% of Heads of Department
are women
33.94% of Executives
are women
51.89% of Practitioners
are women
63.6% of the entire staff complement are women
INTeRvIeW 3
47 Financial times, 2017b* provided by EnSafrica
BWASA WOMEN IN LEADERSHIP CENSUS 201760
PRIvaTe seCTOR ResUlTs3
in many cases, the private sector has been the vanguard of legislating gender diversity at the board level. Shareholder activists and investors are playing an important role and are increasingly lobbying government and policy makers as well as corporates to implement a more diverse board composition, either through legislation or corporate governance initiatives. internationally, corporate movements are calling on companies to nurture greater gender representivity on boards. in the uS, 2020 Women on Boards is campaigning to raise the share of women on boards to at least 20% by 2020. the 30% Club in the uK advocates for women to make up 30% of boards of FtSE firms.
the international Corporate governance network (iCgn) encourages companies to adopt diversity policies with measurable targets for achieving diversity at both the senior management and board level and report on the progress made to achieve the targets. 48
External pressure from shareholders has also resulted in diversity becoming a key performance criterion on which executives are judged. At some large business banks like Barclays, Santander, Swedbank and uBS, diversity and inclusion form part of management’s performance evaluations.
in line with a push to increase gender diversity on boards, a number of multinational companies have committed to publically reporting on their gender pay gap. Large insurance companies such as Aig and Prudential, and international professional services firms such as deloitte and
PwC have committed to gender-based pay disclosures. this transparency should result in more equitable pay for equal work. Many of the world’s 50 largest banks, insurers, asset managers and professional services firms surveyed by the Financial times 49 already conduct an internal audit to examine the gender pay gap within their respective organisations. Although statistics vary greatly across sectors and countries, the gender pay gap between men and women ranges from approximately 10% to 25%. 50
According to the World Economic Forum’s Global Gender Gap Report, the global pay gap between men and women is only expected to close in 2186. 51 South Africa ranks 15th out of 144 countries, with women earning on average about r130,000 annually, compared to men who earn r210,000 on average. Women also work for a longer period of time than men, working for 445 minutes per day with men only working for 397 minutes. 52
According to South African law (the Constitution, Bill of rights and Employment Equity Act) there must be equal pay for equal work. however, within South Africa’s corporate culture there is little to no transparency regarding salaries. in many companies, discussing one’s salary with colleagues is against company policy and may even be grounds for dismissal. Furthermore, women who negotiate hard for promotions and higher salaries are viewed negatively; women are 30% more likely than men to be labelled as intimidating or even aggressive. 53
Private sector-led diversity Policies
the global
pay gap between
men and women
is only expected
to close in 2186
48 deloitte, 2017c49 Financial times, 2017a50 Financial times, 2017a51 World Economic Forum,
201652 World Economic Forum,
201653 McKinsey, 2016
BWASA WOMEN IN LEADERSHIP CENSUS 2017 61
PRIvaTe seCTOR ResUlTs 3
BWASA WOMEN IN LEADERSHIP CENSUS 201762
PuBliC seCtor resultsseCtion 4:
PUBLICSECTORRESULTS4
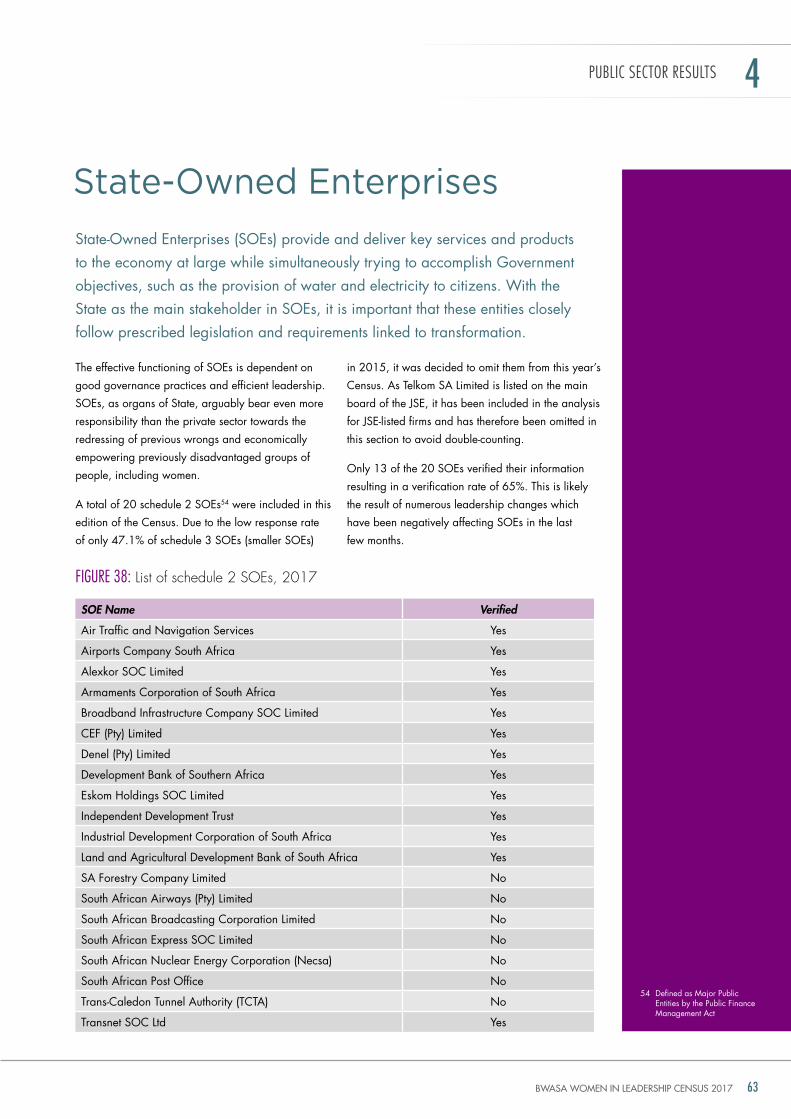
BWASA WOMEN IN LEADERSHIP CENSUS 2017 63
SOE Name Verified
Air traffic and navigation Services yes
Airports Company South Africa yes
Alexkor SoC Limited yes
Armaments Corporation of South Africa yes
Broadband infrastructure Company SoC Limited yes
CEF (Pty) Limited yes
denel (Pty) Limited yes
development Bank of Southern Africa yes
Eskom holdings SoC Limited yes
independent development trust yes
industrial development Corporation of South Africa yes
Land and Agricultural development Bank of South Africa yes
SA Forestry Company Limited no
South African Airways (Pty) Limited no
South African Broadcasting Corporation Limited no
South African Express SoC Limited no
South African nuclear Energy Corporation (necsa) no
South African Post office no
trans-Caledon tunnel Authority (tCtA) no
transnet SoC Ltd yes
state-owned enterprises
PUBLICSECTORRESULTS 4
the effective functioning of SoEs is dependent on
good governance practices and efficient leadership.
SoEs, as organs of State, arguably bear even more
responsibility than the private sector towards the
redressing of previous wrongs and economically
empowering previously disadvantaged groups of
people, including women.
A total of 20 schedule 2 SoEs54 were included in this
edition of the Census. due to the low response rate
of only 47.1% of schedule 3 SoEs (smaller SoEs)
in 2015, it was decided to omit them from this year’s
Census. As telkom SA Limited is listed on the main
board of the JSE, it has been included in the analysis
for JSE-listed firms and has therefore been omitted in
this section to avoid double-counting.
only 13 of the 20 SoEs verified their information
resulting in a verification rate of 65%. this is likely
the result of numerous leadership changes which
have been negatively affecting SoEs in the last
few months.
State-owned Enterprises (SoEs) provide and deliver key services and products to the economy at large while simultaneously trying to accomplish government objectives, such as the provision of water and electricity to citizens. With the State as the main stakeholder in SoEs, it is important that these entities closely follow prescribed legislation and requirements linked to transformation.
54 defined as Major Public Entities by the Public Finance Management Act
FIgURe 38: List of schedule 2 soes, 2017
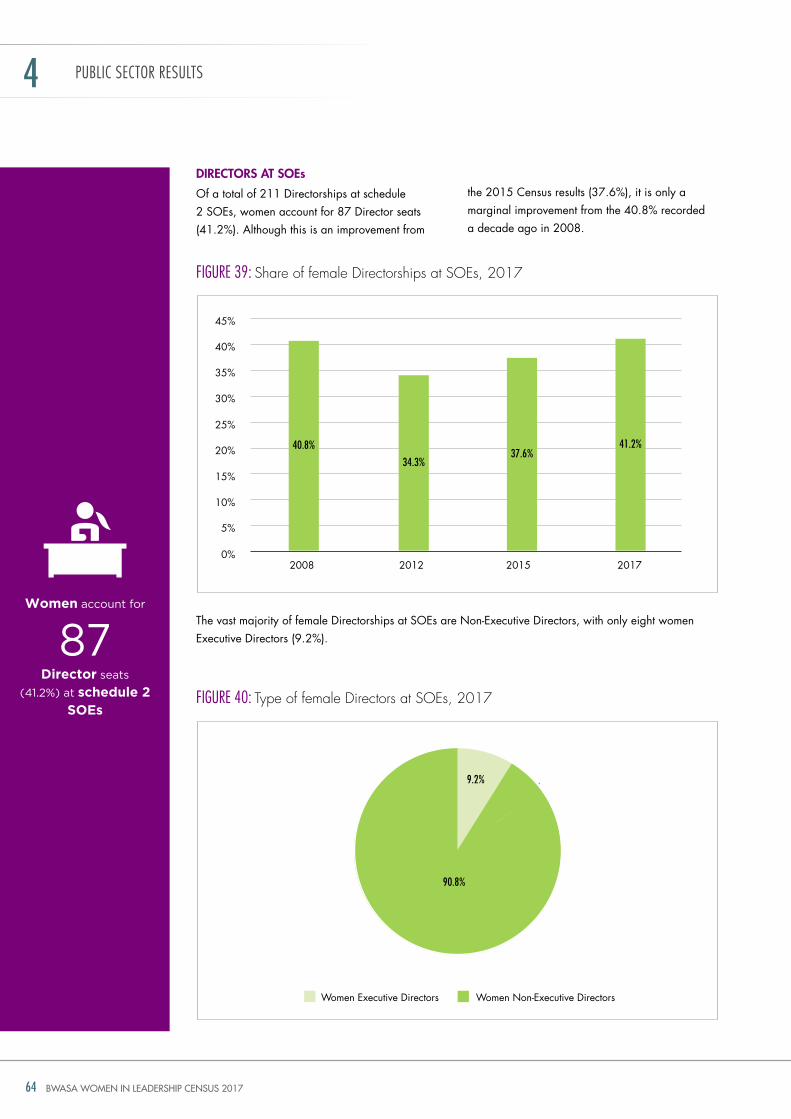
BWASA WOMEN IN LEADERSHIP CENSUS 201764
dIrEctorS at SoEs
of a total of 211 directorships at schedule 2 SoEs, women account for 87 director seats (41.2%). Although this is an improvement from
the vast majority of female directorships at SoEs are non-Executive directors, with only eight women Executive directors (9.2%).
the 2015 Census results (37.6%), it is only a marginal improvement from the 40.8% recorded a decade ago in 2008.
PUBLICSECTORRESULTS4
FIgURe 39: share of female directorships at soes, 2017
FIgURe 40: type of female directors at soes, 2017
Director seats
(41.2%) at schedule 2 SOEs
87Women account for
0%
5%
10%
15%
20%
25%
30%
35%
40%
45%
201520122008 2017
90.8%
9.2%
Women Executive directors Women non-Executive directors
40.8%
34.3%37.6%
41.2%
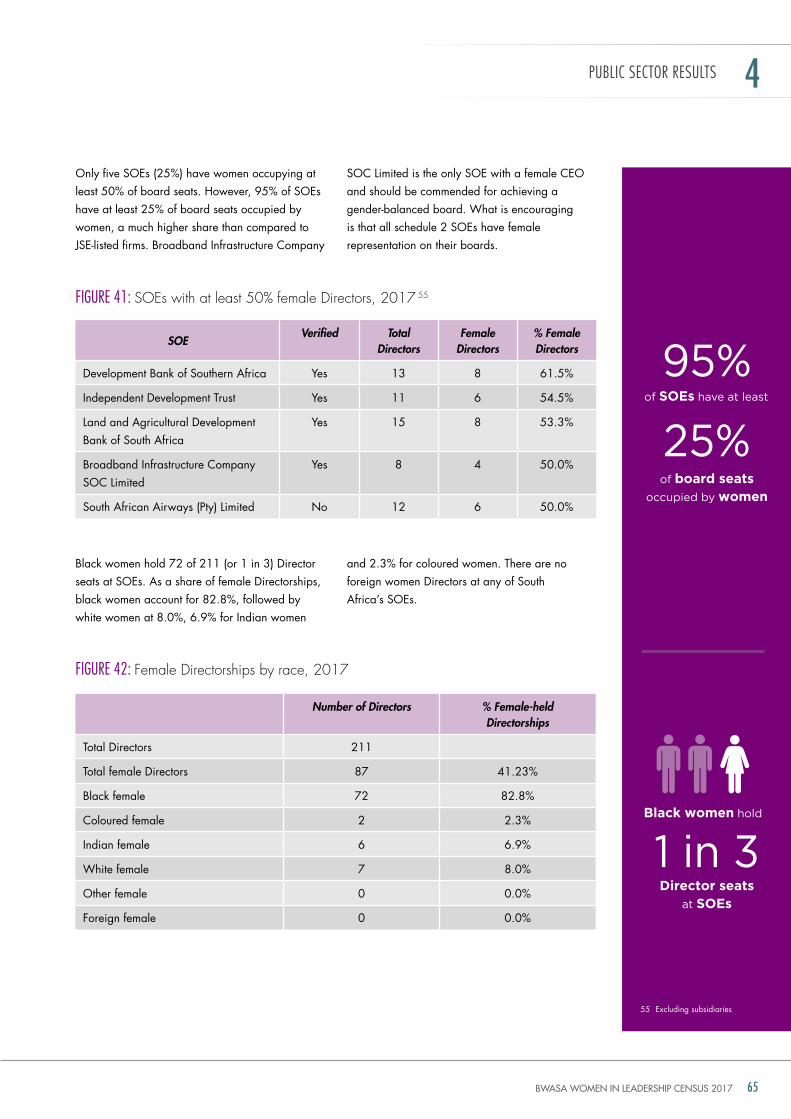
BWASA WOMEN IN LEADERSHIP CENSUS 2017 65
only five SoEs (25%) have women occupying at least 50% of board seats. however, 95% of SoEs have at least 25% of board seats occupied by women, a much higher share than compared to JSE-listed firms. Broadband infrastructure Company
Black women hold 72 of 211 (or 1 in 3) director seats at SoEs. As a share of female directorships, black women account for 82.8%, followed by white women at 8.0%, 6.9% for indian women
SoC Limited is the only SoE with a female CEo and should be commended for achieving a gender-balanced board. What is encouraging is that all schedule 2 SoEs have female representation on their boards.
and 2.3% for coloured women. there are no foreign women directors at any of South Africa’s SoEs.
of SOEs have at least
FIgURe 41: soes with at least 50% female directors, 2017 55
FIgURe 42: Female directorships by race, 2017
PUBLICSECTORRESULTS 4
SOEVerified Total
DirectorsFemale
Directors% Female Directors
development Bank of Southern Africa yes 13 8 61.5%
independent development trust yes 11 6 54.5%
Land and Agricultural development Bank of South Africa
yes 15 8 53.3%
Broadband infrastructure Company SoC Limited
yes 8 4 50.0%
South African Airways (Pty) Limited no 12 6 50.0%
Number of Directors % Female-held Directorships
total directors 211
total female directors 87 41.23%
Black female 72 82.8%
Coloured female 2 2.3%
indian female 6 6.9%
White female 7 8.0%
other female 0 0.0%
Foreign female 0 0.0%
55 Excluding subsidiaries
95%
25%of board seats
occupied by women
Black women hold
1 in 3Director seats
at SOEs
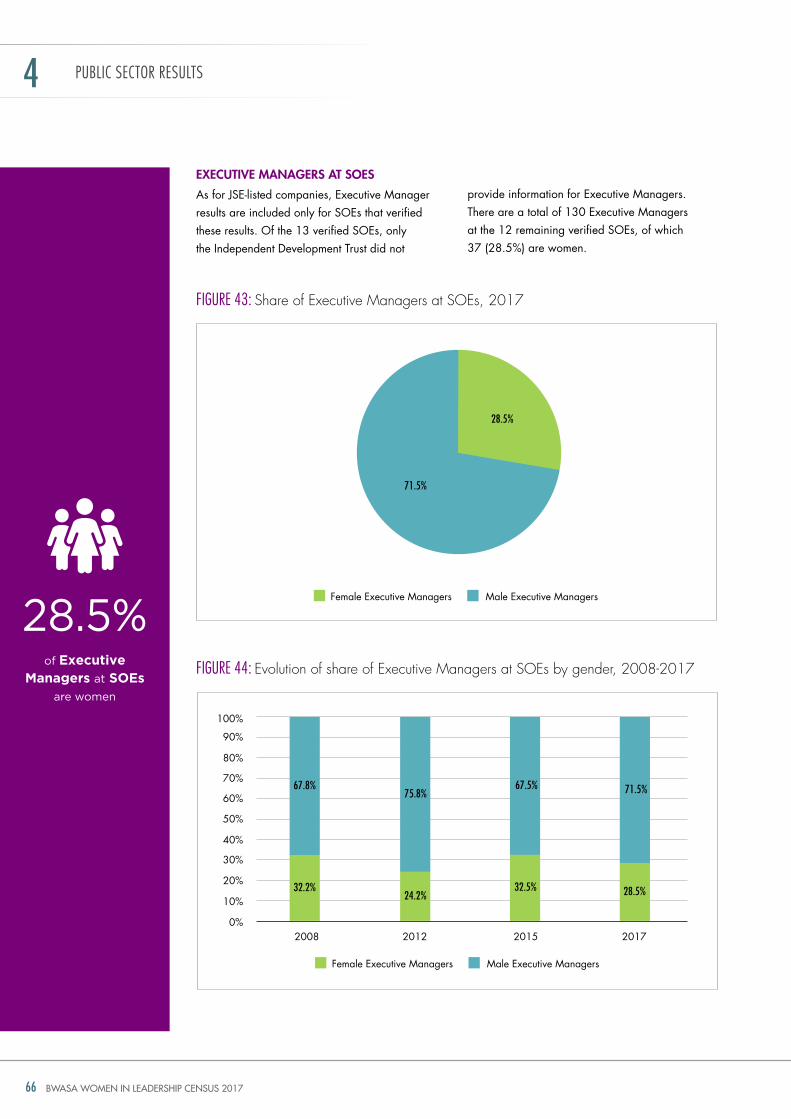
BWASA WOMEN IN LEADERSHIP CENSUS 201766
0%
10%
20%
30%
40%
50%
60%
70%
80%
90%
100%
201520122008 2017
71.5%
28.5%
EXEcutIVE ManaGErS at SoES
As for JSE-listed companies, Executive Manager results are included only for SoEs that verified these results. of the 13 verified SoEs, only the independent development trust did not
provide information for Executive Managers. there are a total of 130 Executive Managers at the 12 remaining verified SoEs, of which 37 (28.5%) are women.
PUBLICSECTORRESULTS4
FIgURe 43: share of executive managers at soes, 2017
FIgURe 44: evolution of share of executive managers at soes by gender, 2008-2017of Executive
Managers at SOEs are women
28.5%Female Executive Managers Male Executive Managers
67.8%75.8%
67.5% 71.5%
32.2%24.2%
32.5% 28.5%
Female Executive Managers Male Executive Managers
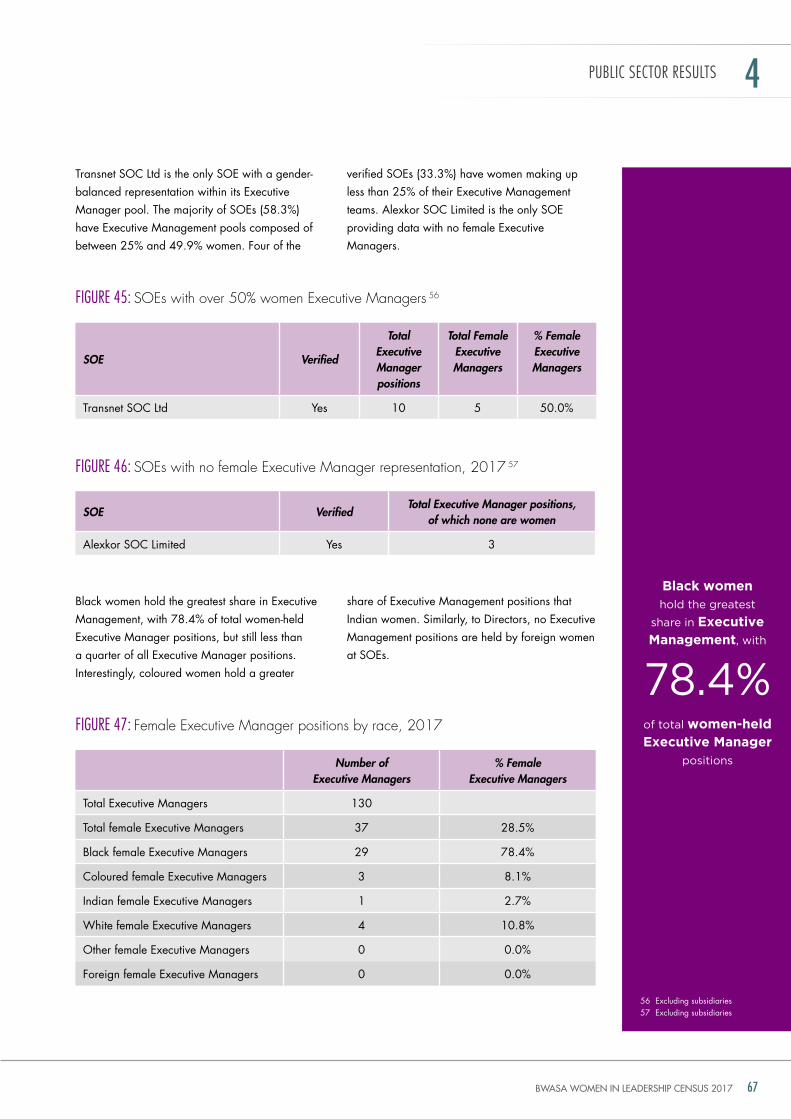
BWASA WOMEN IN LEADERSHIP CENSUS 2017 67
transnet SoC Ltd is the only SoE with a gender-balanced representation within its Executive Manager pool. the majority of SoEs (58.3%) have Executive Management pools composed of between 25% and 49.9% women. Four of the
Black women hold the greatest share in Executive Management, with 78.4% of total women-held Executive Manager positions, but still less than a quarter of all Executive Manager positions. interestingly, coloured women hold a greater
verified SoEs (33.3%) have women making up less than 25% of their Executive Management teams. Alexkor SoC Limited is the only SoE providing data with no female Executive Managers.
share of Executive Management positions that indian women. Similarly, to directors, no Executive Management positions are held by foreign women at SoEs.
Black women
hold the greatest
share in Executive Management, with
of total women-held
Executive Manager
positions
PUBLICSECTORRESULTS 4
FIgURe 45: soes with over 50% women executive managers 56
FIgURe 46: soes with no female executive manager representation, 2017 57
FIgURe 47: Female executive manager positions by race, 2017
SOE Verified
Total Executive Manager positions
Total Female Executive Managers
% Female Executive Managers
transnet SoC Ltd yes 10 5 50.0%
SOE VerifiedTotal Executive Manager positions,
of which none are women
Alexkor SoC Limited yes 3
Number of Executive Managers
% Female Executive Managers
total Executive Managers 130
total female Executive Managers 37 28.5%
Black female Executive Managers 29 78.4%
Coloured female Executive Managers 3 8.1%
indian female Executive Managers 1 2.7%
White female Executive Managers 4 10.8%
other female Executive Managers 0 0.0%
Foreign female Executive Managers 0 0.0%
56 Excluding subsidiaries57 Excluding subsidiaries
78.4%
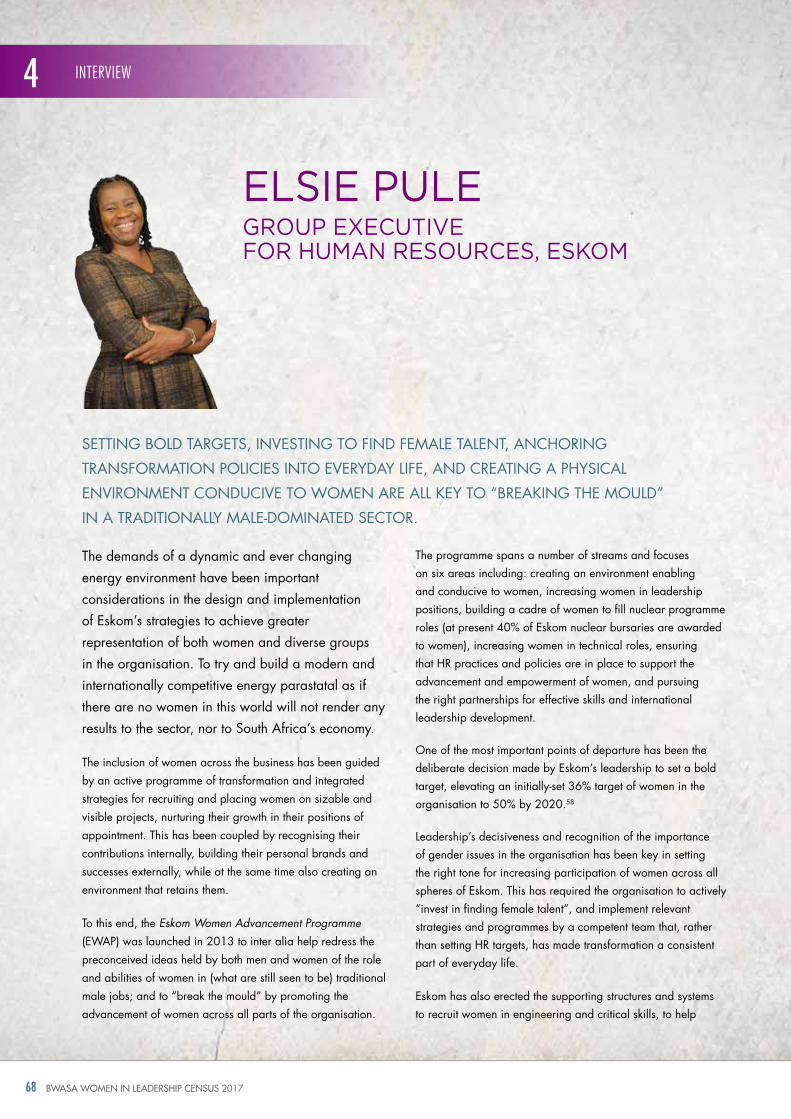
BWASA WOMEN IN LEADERSHIP CENSUS 201768
elsie Pule
SEtting BoLd tArgEtS, inVESting to Find FEMALE tALEnt, AnChoring
trAnSForMAtion PoLiCiES into EVErydAy LiFE, And CrEAting A PhySiCAL
EnVironMEnt ConduCiVE to WoMEn ArE ALL KEy to “BrEAKing thE MouLd”
in A trAditionALLy MALE-doMinAtEd SECtor.
GrouP exeCutiVe For huMAn resourCes, esKoM
INTeRvIeW4
the demands of a dynamic and ever changing energy environment have been important considerations in the design and implementation of Eskom’s strategies to achieve greater representation of both women and diverse groups in the organisation. to try and build a modern and internationally competitive energy parastatal as if there are no women in this world will not render any results to the sector, nor to South Africa’s economy.
the inclusion of women across the business has been guided by an active programme of transformation and integrated strategies for recruiting and placing women on sizable and visible projects, nurturing their growth in their positions of appointment. this has been coupled by recognising their contributions internally, building their personal brands and successes externally, while at the same time also creating an environment that retains them.
to this end, the Eskom Women Advancement Programme (EWAP) was launched in 2013 to inter alia help redress the preconceived ideas held by both men and women of the role and abilities of women in (what are still seen to be) traditional male jobs; and to “break the mould” by promoting the advancement of women across all parts of the organisation.
the programme spans a number of streams and focuses on six areas including: creating an environment enabling and conducive to women, increasing women in leadership positions, building a cadre of women to fill nuclear programme roles (at present 40% of Eskom nuclear bursaries are awarded to women), increasing women in technical roles, ensuring that hr practices and policies are in place to support the advancement and empowerment of women, and pursuing the right partnerships for effective skills and international leadership development.
one of the most important points of departure has been the deliberate decision made by Eskom’s leadership to set a bold target, elevating an initially-set 36% target of women in the organisation to 50% by 2020.58
Leadership’s decisiveness and recognition of the importance of gender issues in the organisation has been key in setting the right tone for increasing participation of women across all spheres of Eskom. this has required the organisation to actively “invest in finding female talent”, and implement relevant strategies and programmes by a competent team that, rather than setting hr targets, has made transformation a consistent part of everyday life.
Eskom has also erected the supporting structures and systems to recruit women in engineering and critical skills, to help
BWASA WOMEN IN LEADERSHIP CENSUS 2017 69
Who is elsie pule? • Afteranumberofyearswithexperienceinsocialwork,community
developmentandteaching,ElsiePulestartedherHRcareeratEskomin1995.FollowingtwoyearsatSARSshereturnedtoEskomin2012astheGeneralManagerforHR.ShewasappointedasactingGroupExecutiveforHRin2016.
• ShewasuntilrecentlyDeputyPresidentoftheInstituteforPersonnelManagement,apositionsheheldfortwoyears.ShealsoservedontheEskomPensionandProvidentFundboardandcurrentlyservesontheEskomFinanceCompanyboard.
• ElsiewasrunnerupoftheIPMHRDirectoroftheYearin2011andwasawardedaHRAchiever/LeaderbytheAfrica/IndiaSummitinthesameyear.SheiscurrentlydeputypresidentoftheInstituteforPeopleManagement(IPM).
• SheholdsaBASocialWorkDegreefromtheUniversityofLimpopoaswellasanHonoursinPsychologyfromtheUniversityinPretoria.
“to try and build a modern and internationally competitive energy
parastatal as if there are no women in this world
will not render any results to the sector, nor to
south Africa’s economy.”
Two out of nine directors are women (22.2%)
Three out of twelve executive Managers
are women (25%)
INTeRvIeW 4
position, nurture, mentor and train women to succeed and to measure progress against targets set on an ongoing basis. training by pairing women with men, especially on remote projects, as well as mentoring and coaching programmes for women by “legends who came before them”. Women who have succeeded at Eskom and understand the business and surrounding environment, have also been integral to this.
to help change mindsets and empower women, Eskom has arranged dialogue sessions to break some of the ongoing barriers experienced by women vis-à-vis their male counterparts, as well as to tackle challenges like sexual harassment in the workplace. ultimately, without being an organisation that has a work environment truly conducive to women – be it, for example, something simple such as providing better ablution facilities which as an increase in the number of women doing live wire work at Eskom – change will not transpire.
Special exposure has also been created to strengthen not just the mindset but also the skill set of women professionals through international leadership programmes with partner organisations. the Chief Executive Women Development Programme was launched in 2000 to close the gender gap within Eskom for technical roles. ninety women were enrolled in an MSc with Warwick university.
58 this interview was conducted in May 2017 and prior to the leadership changes that followed at Eskom. this particular target was set under the leadership of dr Ben ngubane, former Chairperson of Eskom.
* From the 2017 Census for Eskom
FAst FACts
Key stAts*
eskom ranks among the top performing companies in the
2017 Census for
executive Managers
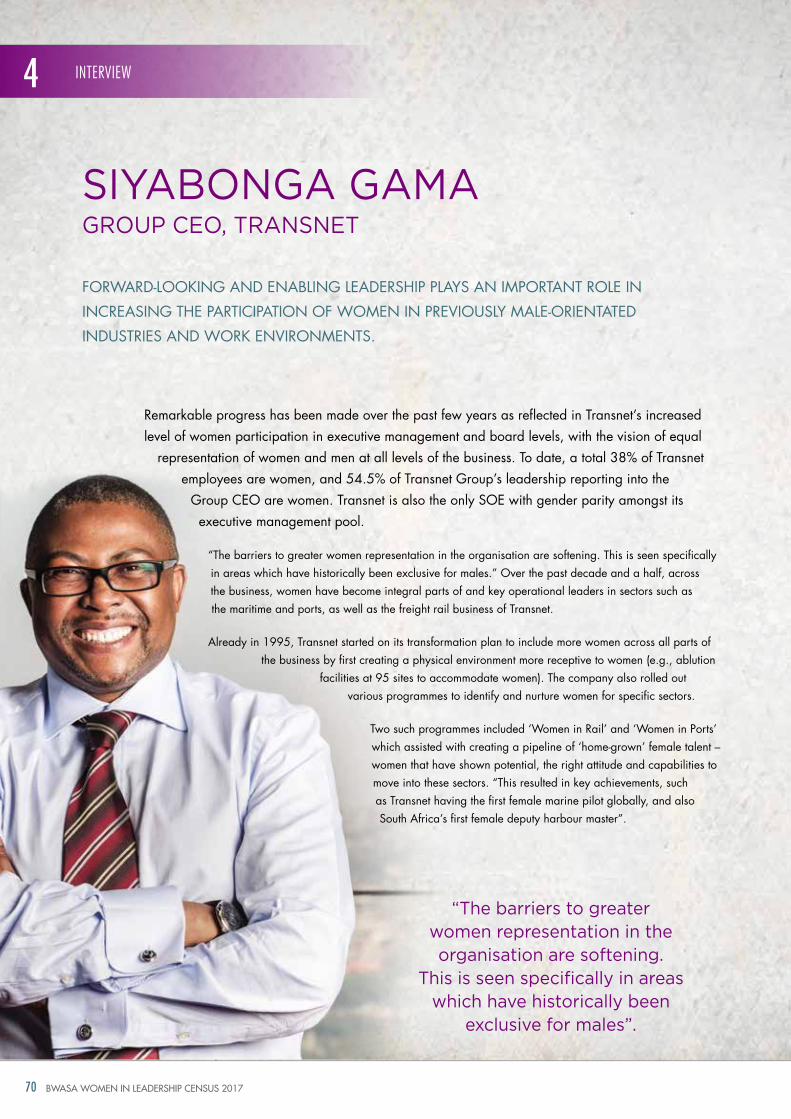
BWASA WOMEN IN LEADERSHIP CENSUS 201770
siyABonGA GAMA
ForWArd-LooKing And EnABLing LEAdErShiP PLAyS An iMPortAnt roLE in
inCrEASing thE PArtiCiPAtion oF WoMEn in PrEViouSLy MALE-oriEntAtEd
induStriES And WorK EnVironMEntS.
GrouP Ceo, trAnsnet
INTeRvIeW4
remarkable progress has been made over the past few years as reflected in transnet’s increased level of women participation in executive management and board levels, with the vision of equal
representation of women and men at all levels of the business. to date, a total 38% of transnet employees are women, and 54.5% of transnet group’s leadership reporting into the
group CEo are women. transnet is also the only SoE with gender parity amongst its executive management pool.
“the barriers to greater women representation in the organisation are softening. this is seen specifically in areas which have historically been exclusive for males.” over the past decade and a half, across the business, women have become integral parts of and key operational leaders in sectors such as the maritime and ports, as well as the freight rail business of transnet.
Already in 1995, transnet started on its transformation plan to include more women across all parts of the business by first creating a physical environment more receptive to women (e.g., ablution
facilities at 95 sites to accommodate women). the company also rolled out various programmes to identify and nurture women for specific sectors.
two such programmes included ‘Women in rail’ and ‘Women in Ports’ which assisted with creating a pipeline of ‘home-grown’ female talent – women that have shown potential, the right attitude and capabilities to move into these sectors. “this resulted in key achievements, such as transnet having the first female marine pilot globally, and also South Africa’s first female deputy harbour master”.
“the barriers to greater women representation in the organisation are softening.
This is seen specifically in areas which have historically been
exclusive for males”.
BWASA WOMEN IN LEADERSHIP CENSUS 2017 71
Who is siyabonga gama?
• SiyabongaGamaisChiefExecutiveofTransnetSOCLimited.HehasservedasCEOofTheNationalPortsAuthorityandofSpoornet/TransnetFreightRail.HehasheldvariousseniorGeneralManagementpositionsinTransnetandclimbeduptherankshavingjoinedTransnetin1994.PriortojoiningTransnet,heheldvariousmanagementpositionsatStandardBankandJPMorgan(NewYork).
• HeholdsaBComfromtheUniversityofSwaziland,aCertificateofPortManagementfromtheInstituteofInfrastructureandHydraulicEngineeringinDelft,Netherlands,anAdvancedExecutiveProgrammefromtheCityUniversityofNewYork(BaruchCollege),andanAdvancedCertificateinPortandOperationsandManagementfromtheSingaporePortInstitute.HehasalsocompletedanExecutiveDevelopmentprogrammeatTheWhartonBusinessSchoolandholdsaMBAfromSternBusinessSchool,NYU,theLondonSchoolofEconomicsandHEC,Paris.
• HehasheldtwotermsasChairmanofthePortManagementAssociationofEasternandSouthernAfrican,andwasthepastpresidentofthePanAfricanAssociationforAfricaPorts.HewasConferenceVicePresidentandThirdVicePresidentoftheInternationalAssociationofPortsandHarbors.HebecamethePresidentoftheUnionofAfricanRailways(UAR)in2006andisanHonoraryLifePresidentoftheUAR.
What inspires us about siyabonga gama?
• In2008,SiyabongawasbestowedwiththehonourofNationalbusinessleaderoftheyear,havingwontheBBQyoungbusinessleaderfor2005.In2014,hewasawardedwiththeBBQVisionaryAwardwhichforSiyabonga,“solidifiedthefactthatheissteeringhisshipandtraininaprogressivedirection”(BBQMagazine,2015).
Acknowledging these achievements, female talent has received support and space, as well as the confidence to take on opportunities, to grow and to be more resilient. Leaders at all levels of the company have been required to nurture talent and to create the desired diverse pool as well as a pipeline of expertise.
Building an intersectional team which is vibrant, diverse and exceptional also has transpired beyond the firm and been extended to partners of transnet into the continent and globally.
transnet has also emphasised partnerships with women-owned suppliers and businesses through having programmes that fast-track the participation of women-owned businesses in procurement contracts. Currently, about 13% (or r4.8bn) of total procurement contracts have been extended to women-owned businesses; and is targeted to more than double in value, with a goal of 30% (or r10bn) set by transnet over the next two years. this has included specialised supplier development programmes that assist smaller to medium-sized enterprises to grow through mentoring and relevant technical training at established Enterprise hubs.
however, for example, expanding into the African continent comes with additional challenges for women at transnet, such as mindset issues, but also often a resistance to accept women in leadership positions by their male counterparts. the role of women needs to be strengthened in such circumstances. “in these challenging environments, women are elevated by pairing them with male colleagues in order to meet the expectations of their clients or counterparts.”
Whereas the African union’s Agenda 2063 which is a strategy of African heads of States is promoting acceptance of women in leadership and creating common ground, changes in attitudes, however, requires ongoing attention. until such time it remains yes that “women truly have to ‘earn their stripes’ and need to work extra hard to prove themselves” across the continent in the sector.
FAst FACts
INTeRvIeW 4
Three out of nine board members are women (33.3%)
Equal representation of women and men
at the executive Manager level
Among the top 20 best performing companies
in terms of female executive Managers
the best performing and only SOE with a gender-balanced Executive Management team
Key stAts*
* From the 2017 Census
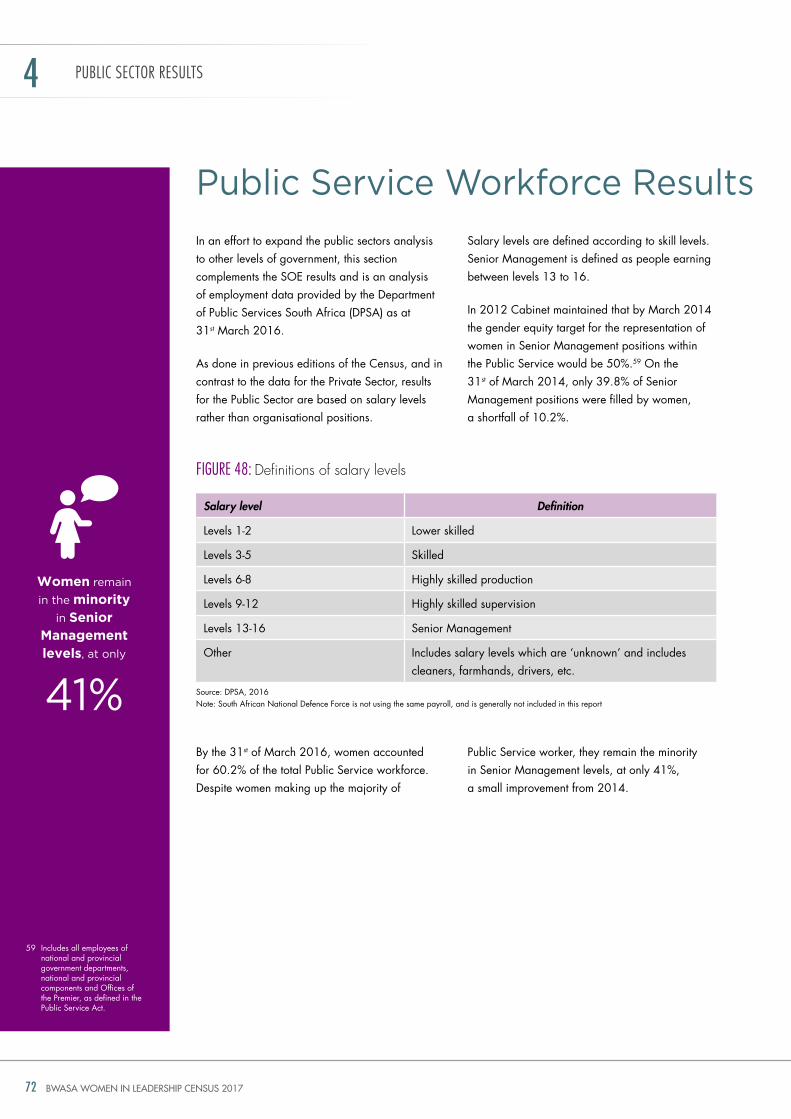
BWASA WOMEN IN LEADERSHIP CENSUS 201772
in an effort to expand the public sectors analysis to other levels of government, this section complements the SoE results and is an analysis of employment data provided by the department of Public Services South Africa (dPSA) as at 31st March 2016.
As done in previous editions of the Census, and in contrast to the data for the Private Sector, results for the Public Sector are based on salary levels rather than organisational positions.
By the 31st of March 2016, women accounted for 60.2% of the total Public Service workforce. despite women making up the majority of
Salary levels are defined according to skill levels. Senior Management is defined as people earning between levels 13 to 16.
in 2012 Cabinet maintained that by March 2014 the gender equity target for the representation of women in Senior Management positions within the Public Service would be 50%.59 on the 31st of March 2014, only 39.8% of Senior Management positions were filled by women, a shortfall of 10.2%.
Public Service worker, they remain the minority in Senior Management levels, at only 41%, a small improvement from 2014.
Public service workforce results
PUBLICSECTORRESULTS4
FIgURe 48: definitions of salary levels
Salary level Definition
Levels 1-2 Lower skilled
Levels 3-5 Skilled
Levels 6-8 highly skilled production
Levels 9-12 highly skilled supervision
Levels 13-16 Senior Management
other includes salary levels which are ‘unknown’ and includes cleaners, farmhands, drivers, etc.
Source: dPSA, 2016note: South African national defence Force is not using the same payroll, and is generally not included in this report
59 includes all employees of national and provincial government departments, national and provincial components and offices of the Premier, as defined in the Public Service Act.
Women remain
in the minority
in Senior Management levels, at only
41%
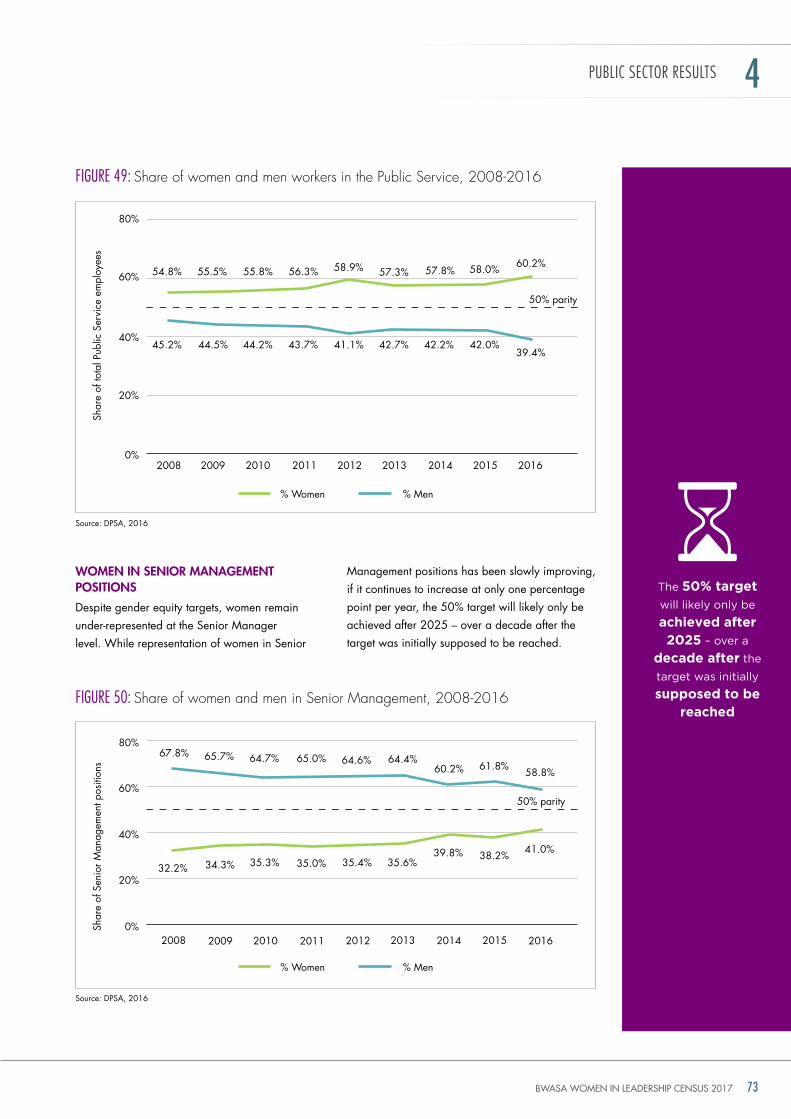
BWASA WOMEN IN LEADERSHIP CENSUS 2017 73
WoMEn In SEnIor ManaGEMEnt poSItIonS
despite gender equity targets, women remain under-represented at the Senior Manager level. While representation of women in Senior
Management positions has been slowly improving, if it continues to increase at only one percentage point per year, the 50% target will likely only be achieved after 2025 – over a decade after the target was initially supposed to be reached.
Public service workforce results
PUBLICSECTORRESULTS 4
FIgURe 49: share of women and men workers in the Public service, 2008-2016
FIgURe 50: share of women and men in senior management, 2008-2016
Source: dPSA, 2016
Source: dPSA, 2016
the 50% target
will likely only be
achieved after 2025 – over a
decade after the
target was initially
supposed to be reached
0%
40%
20%
60%
80%
Shar
e of
tota
l Pub
lic S
ervi
ce e
mpl
oyee
s
201520122008 2016201120102009 2013 2014
54.8% 55.5% 55.8% 56.3% 58.9% 57.3% 57.8% 58.0% 60.2%
50% parity
45.2% 44.5% 44.2% 43.7% 41.1% 42.7% 42.2% 42.0%39.4%
0%
40%
20%
60%
80%
Shar
e of
Sen
ior M
anag
emen
t pos
ition
s
50% parity
201520122008 2016201120102009 2013 2014
67.8% 65.7% 64.7% 65.0% 64.6% 64.4%60.2% 61.8% 58.8%
32.2% 34.3% 35.3% 35.0% 35.4% 35.6%39.8% 38.2% 41.0%
% Women % Men
% Women % Men
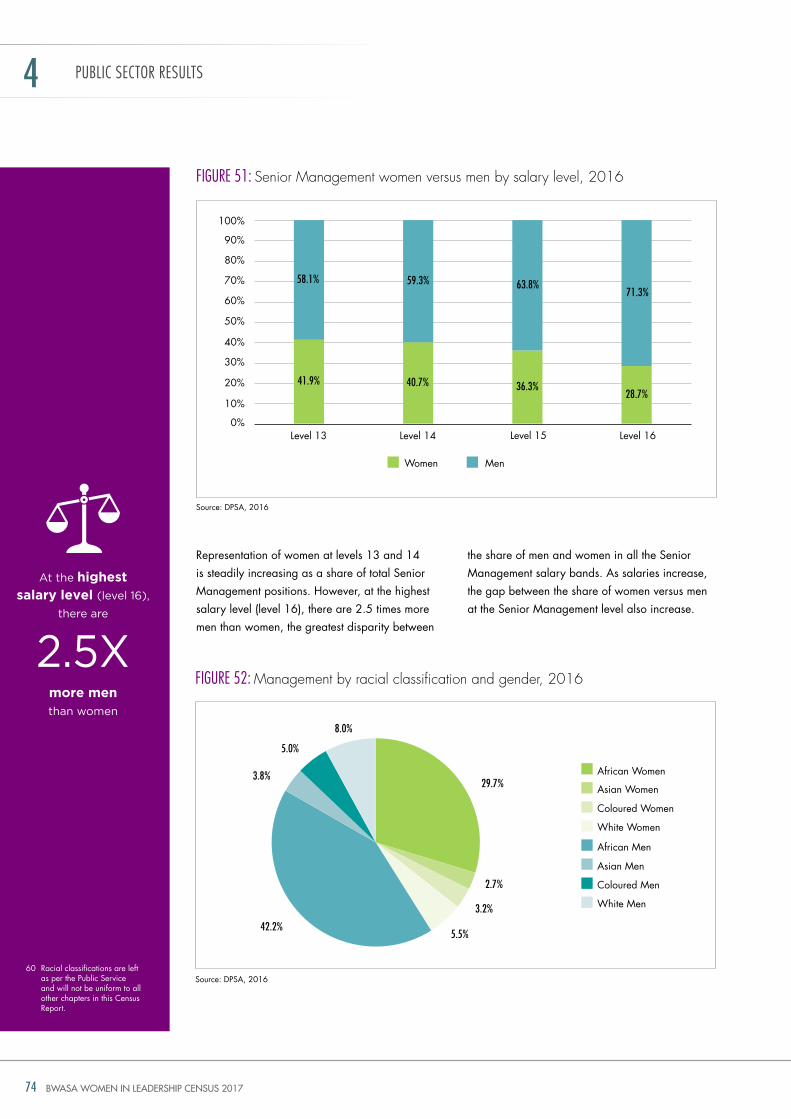
BWASA WOMEN IN LEADERSHIP CENSUS 201774
PUBLICSECTORRESULTS4
FIgURe 51: senior management women versus men by salary level, 2016
Source: dPSA, 2016
60 racial classifications are left as per the Public Service and will not be uniform to all other chapters in this Census report.
At the highest salary level (level 16),
there are
2.5xmore men
than women
Women Men
0%
10%
20%
30%
40%
50%
60%
70%
80%
90%
100%
Level 13 Level 14 Level 15 Level 16
41.9%
58.1%
40.7%
59.3%
36.3%
63.8%71.3%
28.7%
representation of women at levels 13 and 14 is steadily increasing as a share of total Senior Management positions. however, at the highest salary level (level 16), there are 2.5 times more men than women, the greatest disparity between
the share of men and women in all the Senior Management salary bands. As salaries increase, the gap between the share of women versus men at the Senior Management level also increase.
FIgURe 52: management by racial classification and gender, 2016
Source: dPSA, 2016
African Women
Asian Women
Coloured Women
White Women
African Men
Asian Men
Coloured Men
White Men
42.2%5.5%
3.2%
2.7%
8.0%
5.0%
3.8%29.7%
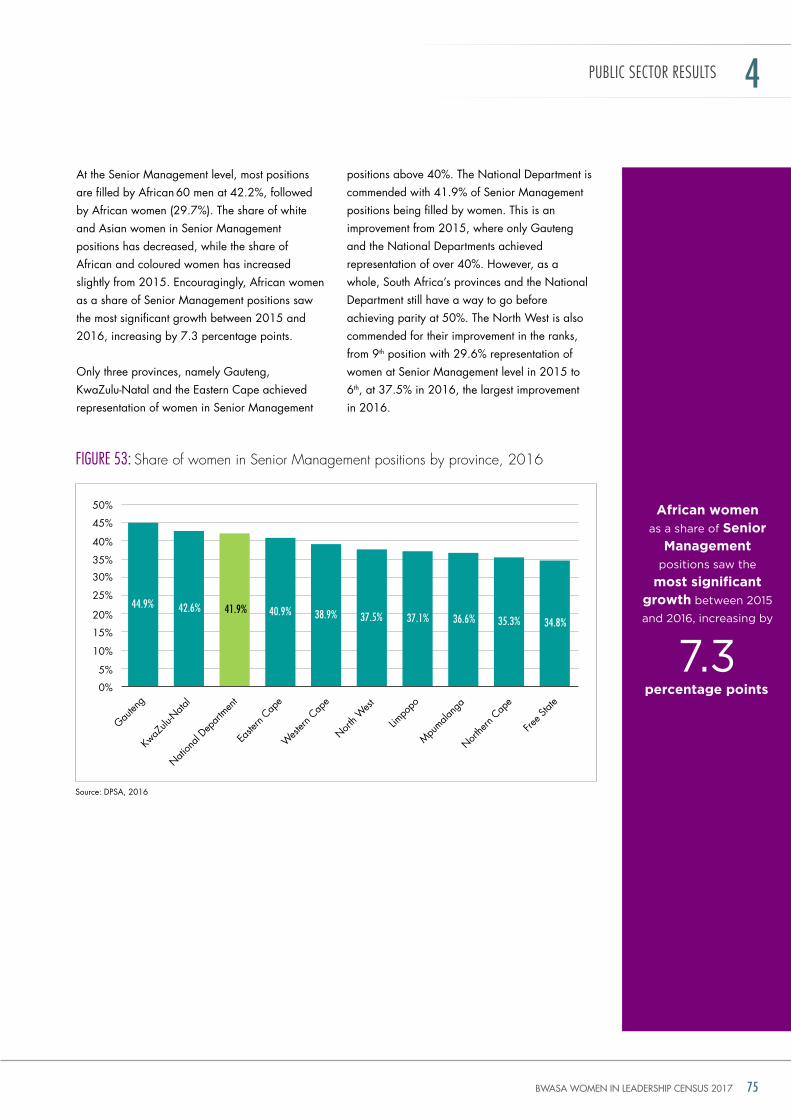
BWASA WOMEN IN LEADERSHIP CENSUS 2017 75
Free S
tate
positions above 40%. the national department is commended with 41.9% of Senior Management positions being filled by women. this is an improvement from 2015, where only gauteng and the national departments achieved representation of over 40%. however, as a whole, South Africa’s provinces and the national department still have a way to go before achieving parity at 50%. the north West is also commended for their improvement in the ranks, from 9th position with 29.6% representation of women at Senior Management level in 2015 to 6th, at 37.5% in 2016, the largest improvement in 2016.
PUBLICSECTORRESULTS 4
FIgURe 53: share of women in senior management positions by province, 2016
Source: dPSA, 2016
0%
5%
10%
15%
20%
25%
30%
35%
40%
45%
50%
gauten
g
KwaZ
ulu-n
atal
nation
al dep
artm
ent
Easte
rn Cap
e
West
ern C
ape
north W
est
Limpo
po
Mpumala
nga
northe
rn Cap
e
At the Senior Management level, most positions are filled by African 60 men at 42.2%, followed by African women (29.7%). the share of white and Asian women in Senior Management positions has decreased, while the share of African and coloured women has increased slightly from 2015. Encouragingly, African women as a share of Senior Management positions saw the most significant growth between 2015 and 2016, increasing by 7.3 percentage points.
only three provinces, namely gauteng, KwaZulu-natal and the Eastern Cape achieved representation of women in Senior Management
44.9% 42.6% 41.9% 40.9% 38.9% 37.5% 37.1% 36.6% 35.3% 34.8%
African women
as a share of Senior Management
positions saw the
most significant growth between 2015
and 2016, increasing by
7.3percentage points
BWASA WOMEN IN LEADERSHIP CENSUS 201776
woMen in hiGher eduCAtion
seCtion 5:
WOMENINHIGHEREDUCATION5
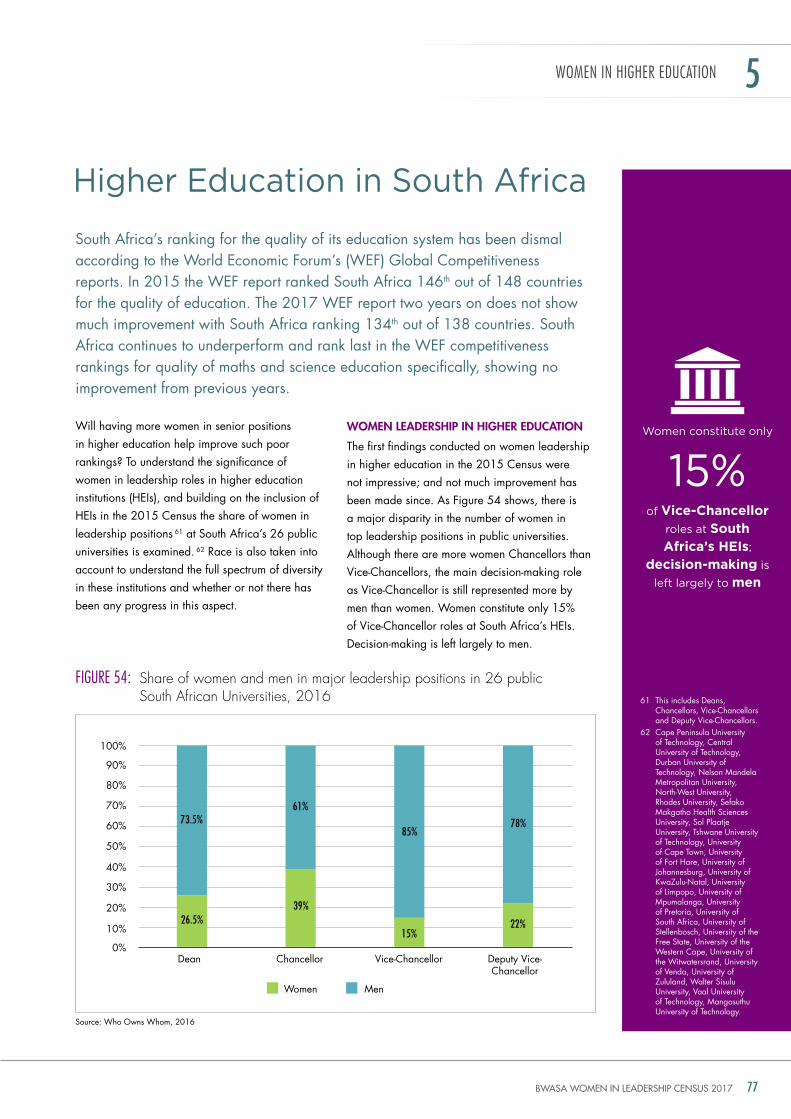
BWASA WOMEN IN LEADERSHIP CENSUS 2017 77
higher education in south Africa
WOMENINHIGHEREDUCATION 5
Will having more women in senior positions in higher education help improve such poor rankings? to understand the significance of women in leadership roles in higher education institutions (hEis), and building on the inclusion of hEis in the 2015 Census the share of women in leadership positions 61 at South Africa’s 26 public universities is examined. 62 race is also taken into account to understand the full spectrum of diversity in these institutions and whether or not there has been any progress in this aspect.
WoMEn lEadErSHIp In HIGHEr EducatIon
the first findings conducted on women leadership in higher education in the 2015 Census were not impressive; and not much improvement has been made since. As Figure 54 shows, there is a major disparity in the number of women in top leadership positions in public universities. Although there are more women Chancellors than Vice-Chancellors, the main decision-making role as Vice-Chancellor is still represented more by men than women. Women constitute only 15% of Vice-Chancellor roles at South Africa’s hEis. decision-making is left largely to men.
South Africa’s ranking for the quality of its education system has been dismal according to the World Economic Forum’s (WEF) global Competitiveness reports. in 2015 the WEF report ranked South Africa 146th out of 148 countries for the quality of education. the 2017 WEF report two years on does not show much improvement with South Africa ranking 134th out of 138 countries. South Africa continues to underperform and rank last in the WEF competitiveness rankings for quality of maths and science education specifically, showing no improvement from previous years.
61 this includes deans, Chancellors, Vice-Chancellors and deputy Vice-Chancellors.
62 Cape Peninsula university of technology, Central university of technology, durban university of technology, nelson Mandela Metropolitan university, north-West university, rhodes university, Sefako Makgatho health Sciences university, Sol Plaatje university, tshwane university of technology, university of Cape town, university of Fort hare, university of Johannesburg, university of KwaZulu-natal, university of Limpopo, university of Mpumalanga, university of Pretoria, university of South Africa, university of Stellenbosch, university of the Free State, university of the Western Cape, university of the Witwatersrand, university of Venda, university of Zululand, Walter Sisulu university, Vaal university of technology, Mangosuthu university of technology.
women constitute only
of Vice-Chancellor roles at South Africa’s HEIs;
decision-making is
left largely to men
FIgURe 54: share of women and men in major leadership positions in 26 public south african universities, 2016
Source: Who owns Whom, 2016
15%
0%
10%
20%
30%
40%
50%
60%
70%
80%
90%
100%
dean Chancellor Vice-Chancellor deputy Vice-Chancellor
26.5%39%
22%
73.5%61%
85%78%
15%
Women Men
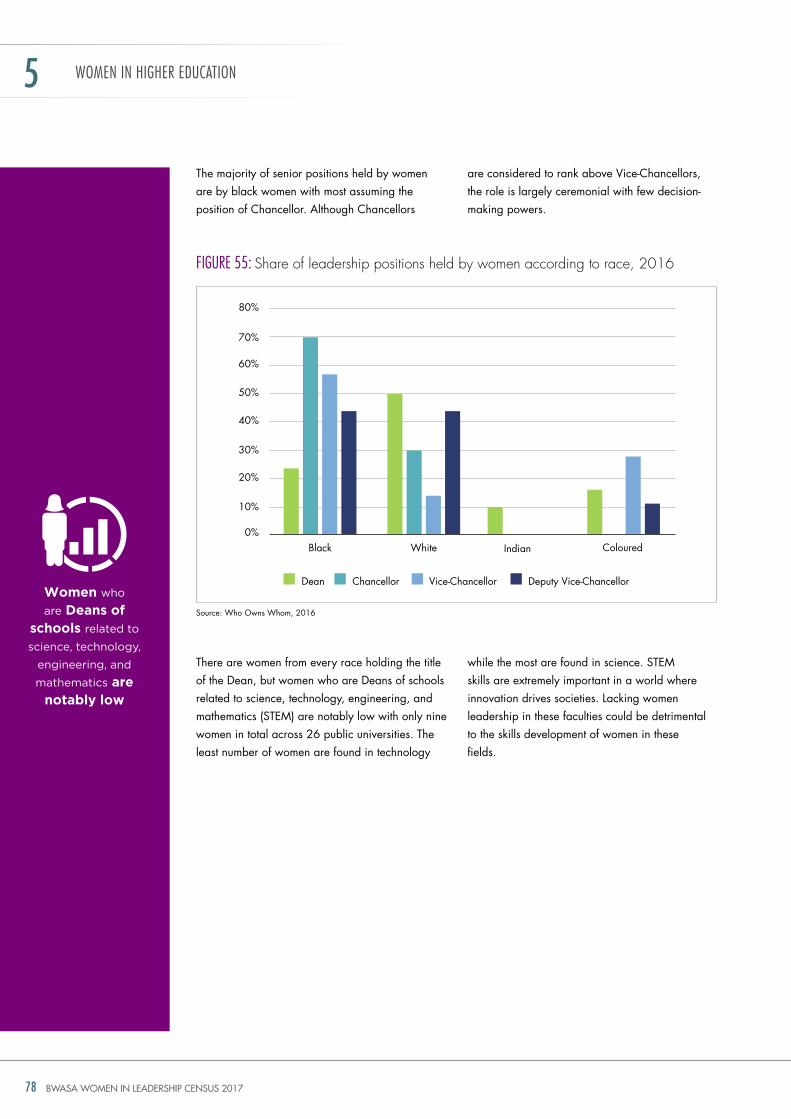
BWASA WOMEN IN LEADERSHIP CENSUS 201778
the majority of senior positions held by women are by black women with most assuming the position of Chancellor. Although Chancellors
there are women from every race holding the title of the dean, but women who are deans of schools related to science, technology, engineering, and mathematics (StEM) are notably low with only nine women in total across 26 public universities. the least number of women are found in technology
are considered to rank above Vice-Chancellors, the role is largely ceremonial with few decision-making powers.
while the most are found in science. StEM skills are extremely important in a world where innovation drives societies. Lacking women leadership in these faculties could be detrimental to the skills development of women in these fields.
FIgURe 55: share of leadership positions held by women according to race, 2016
Source: Who owns Whom, 2016
WOMENINHIGHEREDUCATION5
0%
10%
20%
30%
40%
50%
60%
70%
80%
Black White indian Coloured
dean Chancellor Vice-Chancellor deputy Vice-ChancellorWomen who
are Deans of schools related to
science, technology,
engineering, and
mathematics are notably low
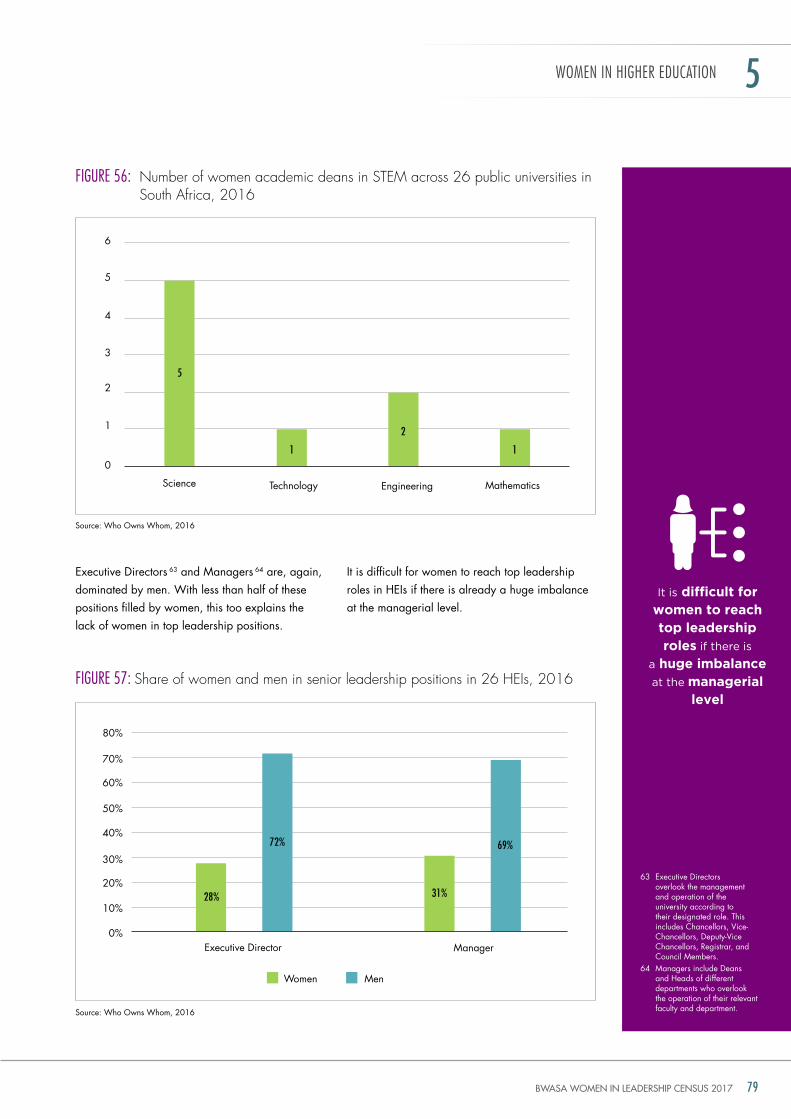
BWASA WOMEN IN LEADERSHIP CENSUS 2017 79
Executive directors 63 and Managers 64 are, again, dominated by men. With less than half of these positions filled by women, this too explains the lack of women in top leadership positions.
it is difficult for women to reach top leadership roles in hEis if there is already a huge imbalance at the managerial level.
FIgURe 56: number of women academic deans in stem across 26 public universities in south africa, 2016
FIgURe 57: share of women and men in senior leadership positions in 26 heis, 2016
63 Executive directors overlook the management and operation of the university according to their designated role. this includes Chancellors, Vice-Chancellors, deputy-Vice Chancellors, registrar, and Council Members.
64 Managers include deans and heads of different departments who overlook the operation of their relevant faculty and department.
Source: Who owns Whom, 2016
Source: Who owns Whom, 2016
WOMENINHIGHEREDUCATION 5
Science technology Engineering Mathematics
0
1
2
3
4
5
6
0%
10%
20%
30%
40%
50%
60%
70%
80%
Executive director Manager
5
1
2
1
Women Men
28% 31%
72% 69%
it is difficult for women to reach top leadership roles if there is
a huge imbalance at the managerial
level
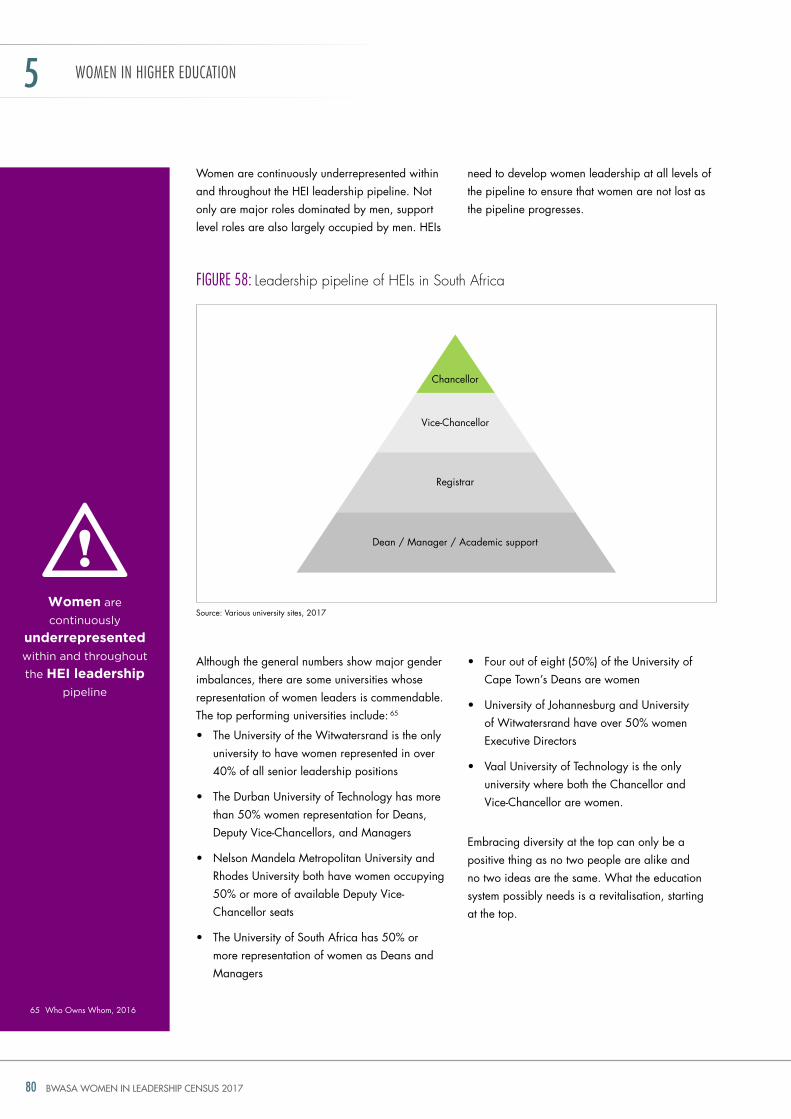
BWASA WOMEN IN LEADERSHIP CENSUS 201780
Women are continuously underrepresented within and throughout the hEi leadership pipeline. not only are major roles dominated by men, support level roles are also largely occupied by men. hEis
Although the general numbers show major gender imbalances, there are some universities whose representation of women leaders is commendable. the top performing universities include: 65
• TheUniversityoftheWitwatersrandistheonlyuniversity to have women represented in over 40% of all senior leadership positions
• TheDurbanUniversityofTechnologyhasmorethan 50% women representation for deans, deputy Vice-Chancellors, and Managers
• NelsonMandelaMetropolitanUniversityandrhodes university both have women occupying 50% or more of available deputy Vice-Chancellor seats
• TheUniversityofSouthAfricahas50%ormore representation of women as deans and Managers
need to develop women leadership at all levels of the pipeline to ensure that women are not lost as the pipeline progresses.
• Fouroutofeight(50%)oftheUniversityofCape town’s deans are women
• UniversityofJohannesburgandUniversityof Witwatersrand have over 50% women Executive directors
• VaalUniversityofTechnologyistheonlyuniversity where both the Chancellor and Vice-Chancellor are women.
Embracing diversity at the top can only be a positive thing as no two people are alike and no two ideas are the same. What the education system possibly needs is a revitalisation, starting at the top.
FIgURe 58: Leadership pipeline of heis in south africa
65 Who owns Whom, 2016
Source: Various university sites, 2017
WOMENINHIGHEREDUCATION5
Women are
continuously
underrepresented within and throughout
the HEI leadership pipeline
Chancellor
Vice-Chancellor
registrar
dean / Manager / Academic support
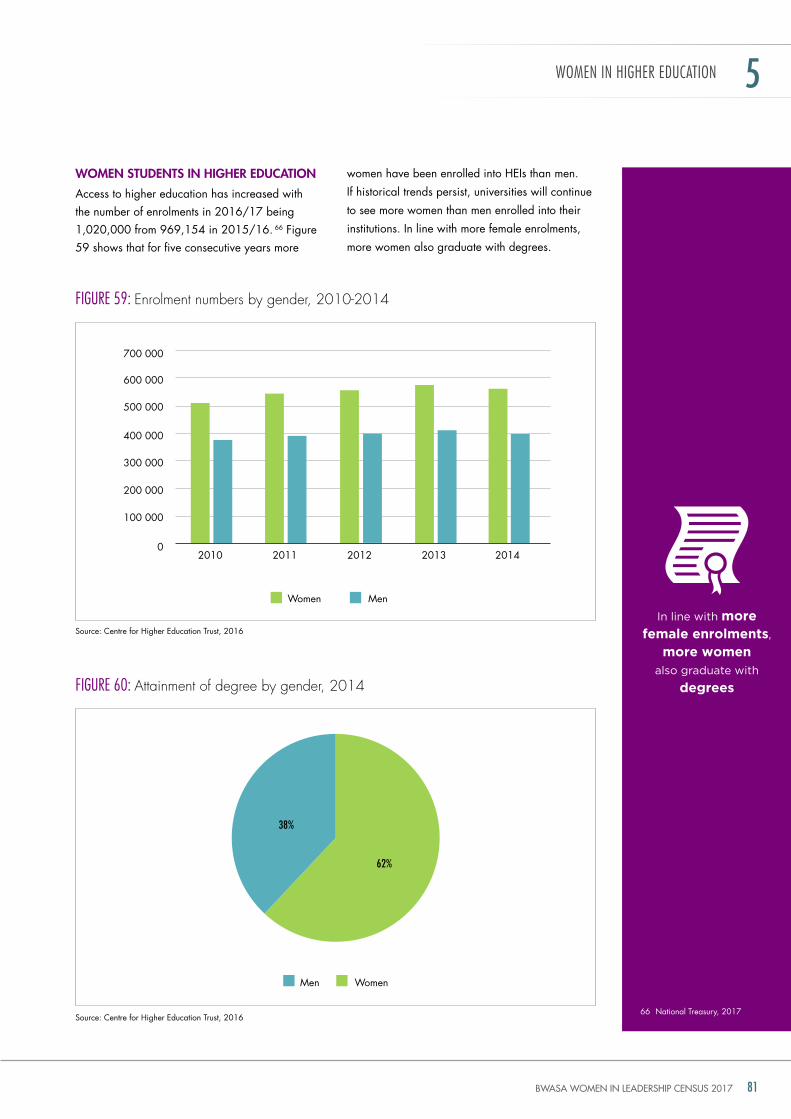
BWASA WOMEN IN LEADERSHIP CENSUS 2017 81
WoMEn StudEntS In HIGHEr EducatIon
Access to higher education has increased with the number of enrolments in 2016/17 being 1,020,000 from 969,154 in 2015/16. 66 Figure 59 shows that for five consecutive years more
women have been enrolled into hEis than men.
if historical trends persist, universities will continue
to see more women than men enrolled into their
institutions. in line with more female enrolments,
more women also graduate with degrees.
FIgURe 59: enrolment numbers by gender, 2010-2014
FIgURe 60: attainment of degree by gender, 2014
66 national treasury, 2017
Source: Centre for higher Education trust, 2016
Source: Centre for higher Education trust, 2016
WOMENINHIGHEREDUCATION 5
in line with more female enrolments,
more women
also graduate with
degrees
0
100 000
200 000
300 000
400 000
500 000
600 000
700 000
2010 2011 2012 2013 2014
62%
38%
Women Men
Men Women
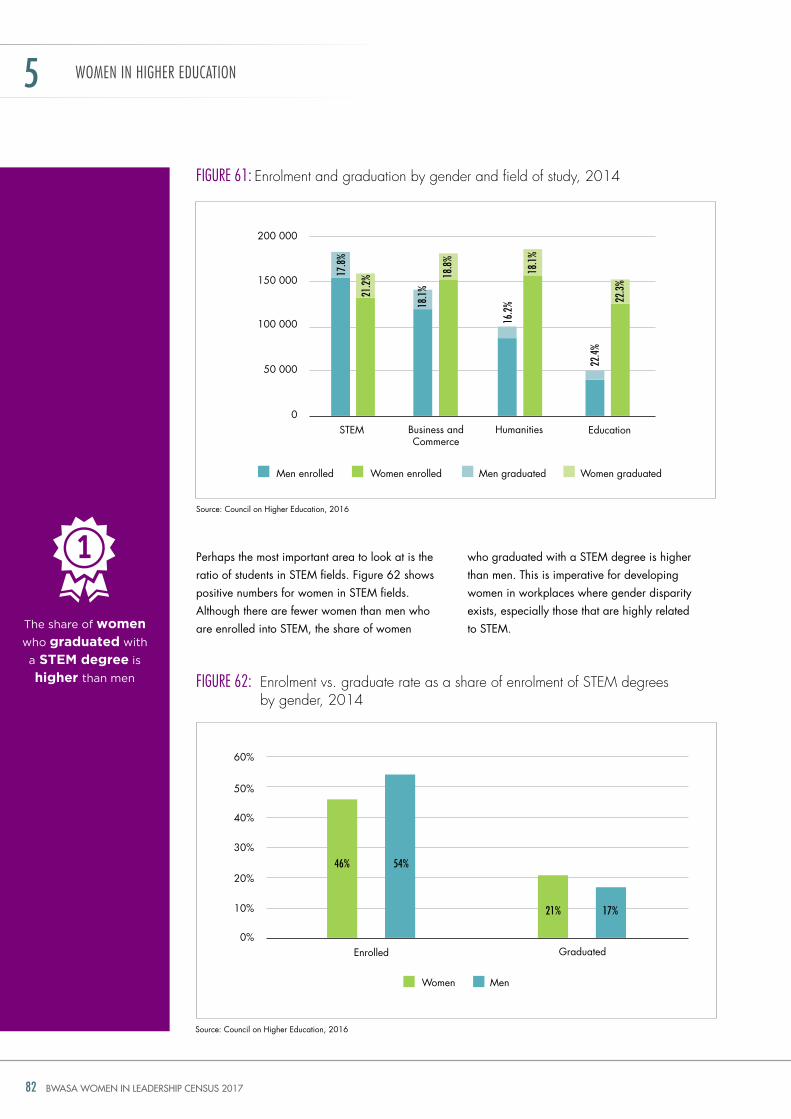
BWASA WOMEN IN LEADERSHIP CENSUS 201782
Perhaps the most important area to look at is the ratio of students in StEM fields. Figure 62 shows positive numbers for women in StEM fields. Although there are fewer women than men who are enrolled into StEM, the share of women
who graduated with a StEM degree is higher than men. this is imperative for developing women in workplaces where gender disparity exists, especially those that are highly related to StEM.
FIgURe 61: enrolment and graduation by gender and field of study, 2014
FIgURe 62: enrolment vs. graduate rate as a share of enrolment of stem degrees by gender, 2014
Source: Council on higher Education, 2016
Source: Council on higher Education, 2016
WOMENINHIGHEREDUCATION5
the share of women
who graduated with
a STEM degree is
higher than men
0%
10%
20%
30%
40%
50%
60%
Enrolled graduated
46% 54%
21% 17%
MenWomen
50 000
0
100 000
150 000
200 000
StEM humanities EducationBusiness and Commerce
17.8
%
18.1
%
16.2
%
22.4
%
Men graduatedMen enrolled Women graduatedWomen enrolled
21.2
% 18.8
%
18.1
%
22.3
%
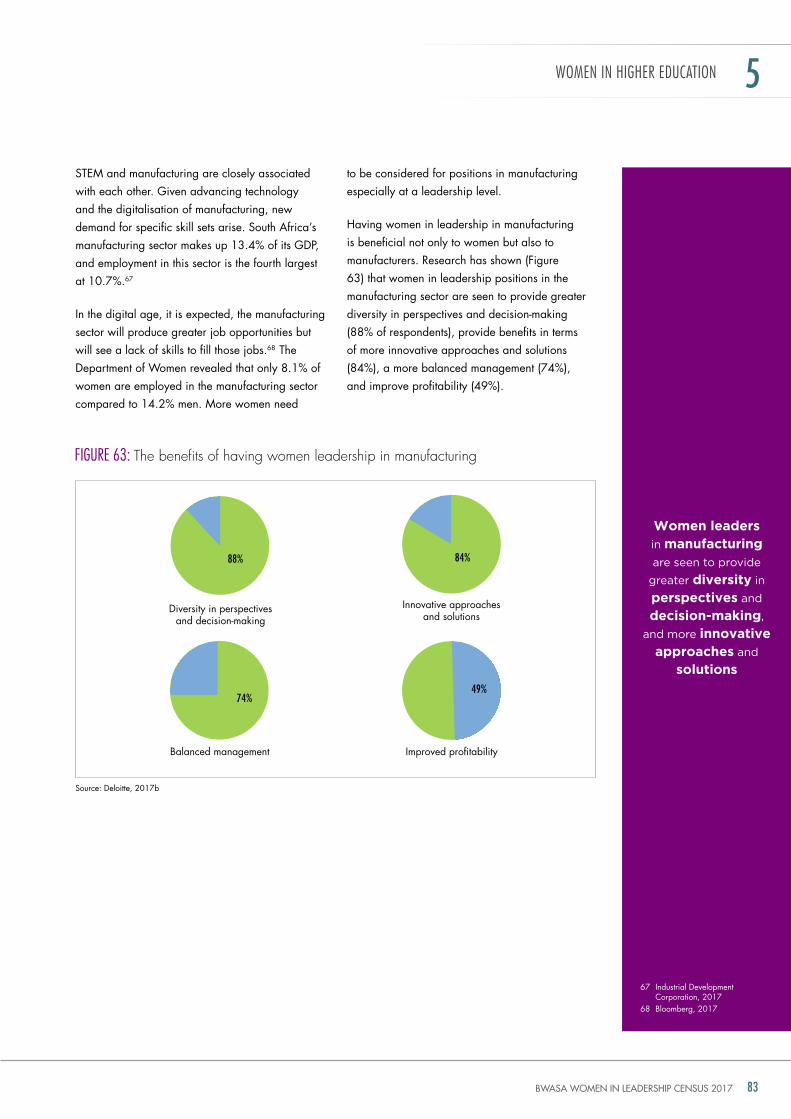
BWASA WOMEN IN LEADERSHIP CENSUS 2017 83
StEM and manufacturing are closely associated with each other. given advancing technology and the digitalisation of manufacturing, new demand for specific skill sets arise. South Africa’s manufacturing sector makes up 13.4% of its gdP, and employment in this sector is the fourth largest at 10.7%.67
in the digital age, it is expected, the manufacturing sector will produce greater job opportunities but will see a lack of skills to fill those jobs.68 the department of Women revealed that only 8.1% of women are employed in the manufacturing sector compared to 14.2% men. More women need
to be considered for positions in manufacturing especially at a leadership level.
having women in leadership in manufacturing is beneficial not only to women but also to manufacturers. research has shown (Figure 63) that women in leadership positions in the manufacturing sector are seen to provide greater diversity in perspectives and decision-making (88% of respondents), provide benefits in terms of more innovative approaches and solutions (84%), a more balanced management (74%), and improve profitability (49%).
FIgURe 63: the benefits of having women leadership in manufacturing
Source: deloitte, 2017b
WOMENINHIGHEREDUCATION 5
Women leaders
in manufacturing
are seen to provide
greater diversity in
perspectives and
decision-making,
and more innovative approaches and
solutions
improved profitability
49%
67 industrial development Corporation, 2017
68 Bloomberg, 2017
diversity in perspectives and decision-making
88%
innovative approaches and solutions
84%
Balanced management
74%
BWASA WOMEN IN LEADERSHIP CENSUS 201784
StEM education creates critical thinkers, drives innovation and sustains economic growth. With South Africa’s maths and science education ranking last, South Africa will need to cultivate StEM skills in order to achieve a global competitive advantage. South Africa’s manufacturing sector can drive its global competitiveness through diversification into becoming a producer in value-added products instead of primary products. Education is the key to developing StEM skills and moving South Africa’s global competitiveness forward.
Major challenges that women face when considering a role in leadership in StEM are bias and lack of career development and female mentors. Very few studies exist on the lack of women leadership in StEM, leaving this particular area relatively unexplored. More focus should be given to this area as leadership in StEM is just as important as producing female students in StEM.
it is clear that women are capable of achieving technical degrees with a higher percentage of women graduating than men. however, this does not reflect in the workplace with only 23% of women in StEM work fields globally. the workforce of South African women in StEM in comparison is only 7%.69 StEM fields are amongst the fastest growing fields with a plethora of opportunities. Women are just as deserving as men to pursue and grow a career in StEM which is why fostering the skills of women in StEM is so important.
Women may find it difficult to break the barrier created by societal beliefs that StEM careers are traditionally dominated by men. Women are often seen as incapable or unsuited for these careers. Either way, the number of women graduating with a StEM degree is higher than men, illustrating that women are more than capable of achieving what is traditionally believed to be only suited for men.
69 MEdo, 2016
WOMENINHIGHEREDUCATION5
Major challenges
that women face
when considering
a role in leadership
in STEM are bias
and lack of career development and
female mentors
BWASA WOMEN IN LEADERSHIP CENSUS 2017 85
WOMENINHIGHEREDUCATION 5
BWASA WOMEN IN LEADERSHIP CENSUS 201786
GoVernMent leGislAtionseCtion 6:
GOVERNMENTLEGISLATION6
BWASA WOMEN IN LEADERSHIP CENSUS 2017 87
Government legislation in south Africa
GOVERNMENTLEGISLATION 6
governments play an important role in instituting policies that are gender inclusive but also promote economic opportunities for women. there are several laws in place in South Africa that protect the rights of women in the workplace. these rights are enshrined in the Bill of rights in the Constitution, South Africa’s supreme law.
laWS tHat protEct tHE rIGHtS oF WoMEn In tHE WorkplacE In SoutH aFrIca
despite gender diversity being as an important and robust discussion as racial diversity in South Africa’s economy, it has been side-lined legislatively. there are many reasons for this (some more controversial than others), but it could be the result of a patriarchal society, in which women have not been as active in the fight for economic equality as black people have, particularly black men.
• Equality clause in the Bill of rights, Section
9(3); “the state may not unfairly discriminate directly or indirectly against anyone on one or more grounds, including race, gender, sex, pregnancy, marital status, ethnic or social origin, colour, sexual orientation, age, disability, religion, conscience, belief, culture, language and birth.”
• Equality clause in the Bill of rights, Section
9(2); “Equality includes the full and equal enjoyment of all rights and freedoms. to promote the achievement of equality, legislative and other measures designed to protect or advance persons, or categories of persons, disadvantaged by unfair discrimination may be taken.”
• Broad-Based Black Economic Empowerment
act 2003, Section 1 & 2(d); “economic empowerment of all black people including women, workers, youth, people with disabilities and people living in rural areas through diverse but integrated socio-economic strategies.”
• Employment Equity act 1998, Section 6a(1); “Employers may not discriminate on the grounds of race, gender, sexual orientation, pregnancy, marital status, family responsibility,
ethnic or social origin, colour, age, disability, religious belief, political opinion, language or hiV status.”
• Employment Equity amendment act 2013,
Section 6b(4); Amends Section 6(a) “A difference in terms and conditions of employment and employees of the same employer performing the same or substantially the same work or work of equal value that is directly or indirectly based on any one or more of the grounds listed in subsection (1), is unfair discrimination.”
• Basic conditions of Employment act 1997,
Section 26(2); “during an employee’s pre gnancy, and for a period of six months after the birth of her child, her employer must offer her suitable, alternative employment on terms and conditions that are no less favourable than her ordinary terms and conditions of employment.”
• labour relations act 1995, Section 187(e); “the dismissal of an employee on account of her pregnancy, intended pregnancy, or any reason related to her pregnancy, is automatically unfair.”
Governments
play an important
role in instituting policies that are
gender inclusive
but also promote economic
opportunities
for women
BWASA WOMEN IN LEADERSHIP CENSUS 201788
tHE WoMEn EMpoWErMEnt and GEndEr EqualItY BIll
South Africa’s Women Empowerment and gender Equality (WEgE) Bill was approved by Cabinet in 2012 but has since lapsed in Parliament. the Bill aimed to achieve representation of women of at least 50% in decision-making structures in both the public and the private sector.
the Bill focussed on numerically equal representation and proposed that organisations which did not meet the 50% quota would be fined, or in extreme cases, members could face imprisonment.
Critics of the Bill claimed that it duplicated functions and provisions as expanded on in other Acts, such as the Commission on gender
Equality Act (1996), the Employment Equity Act and the Broad-Based Black Economic Empowerment Act, while reiterating already existing rights.70 this duplication would render most of the Bill redundant, lead to a duplication of efforts and resources and increase administrative functions for organisations.
Furthermore, it was pointed out that the Bill sought to impose top-down manipulation through the use of quotas, rather than addressing structural inequality. the fear was organisations would resort to a ‘tick-box’ response, rather than implementing genuine representation.
in 2015 it was announced by the Minister in the Presidency responsible for Women’s Affairs that the Bill will not be resuscitated in any form in the future.
70 Centre for Constitutional rights, 2013
GOVERNMENTLEGISLATION6
BWASA WOMEN IN LEADERSHIP CENSUS 2017 89
Boardrooms have been historically male-dominated. this has increasingly been challenged in recent years as the benefits of having gender-balanced boardrooms have become more evident. 71 A number of countries have implemented diversity legislation and gender quotas, particularly with regards to the representation of women on boards of either public or private companies. 72
norway made waves as the first country to introduce board gender quotas in 2005, requiring a 40% representation of both men and women on boards.
Very few countries put in place or enforce penalties for companies that do not meet gender quotas; the ‘comply or explain’ approach is usually applied. Companies are encouraged to disclose their diversity policies. For example, in Australia listed companies are required to benchmark their progress against the recommendations provided by the Australian Corporate governance Council, which includes recommendations on diversity but the level of diversity is not prescribed. 73
As of January 2017, the JSE has included a requirement for all listed companies to disclose the targets they have set for gender representation
at the board level and the progress made in achieving these targets. 74 it is hoped that while quotas have not been prescribed, stakeholders will hold these companies accountable for meeting their self-imposed gender targets.
in 2013 the European Parliament approved a draft directive 75 which plans to set a binding minimum target of 40% representation of the underrepresented sex (whether male or female) for non-executive board members of listed companies by 1 January 2020. Member states will be required to adopt appropriate and dissuasive sanctions for companies that do not comply with the terms of the directive. the European Council has not yet accepted the directive.
in March 2017, iceland presented a bill which requires companies with 25 or more employees to prove they pay all employees equally, irrespective of gender, race, ethnicity or nationality, enshrining equal pay for women in the law and becoming the first country globally to do so. Private companies and government agencies will need to undergo audits to ensure pay equality. 76
Although the uK does not have a quota system in place, in April 2017 it became a legal requirement for companies in the uK to report on the pay differential between men and women. 77
71 Credit Suisse research institute, 2016
72 World Bank, 201673 deloitte, 2017c74 Mans-Kemp & Viviers, 201775 deloitte, 2017c76 the guardian, 201777 Jenkins, 2017
GOVERNMENTLEGISLATION 6
Very few countries
put in place or
enforce penalties
for companies that
do not meet gender quotas;
the ‘comply or explain’ approach
is usually applied
Government legislation in the rest of the world
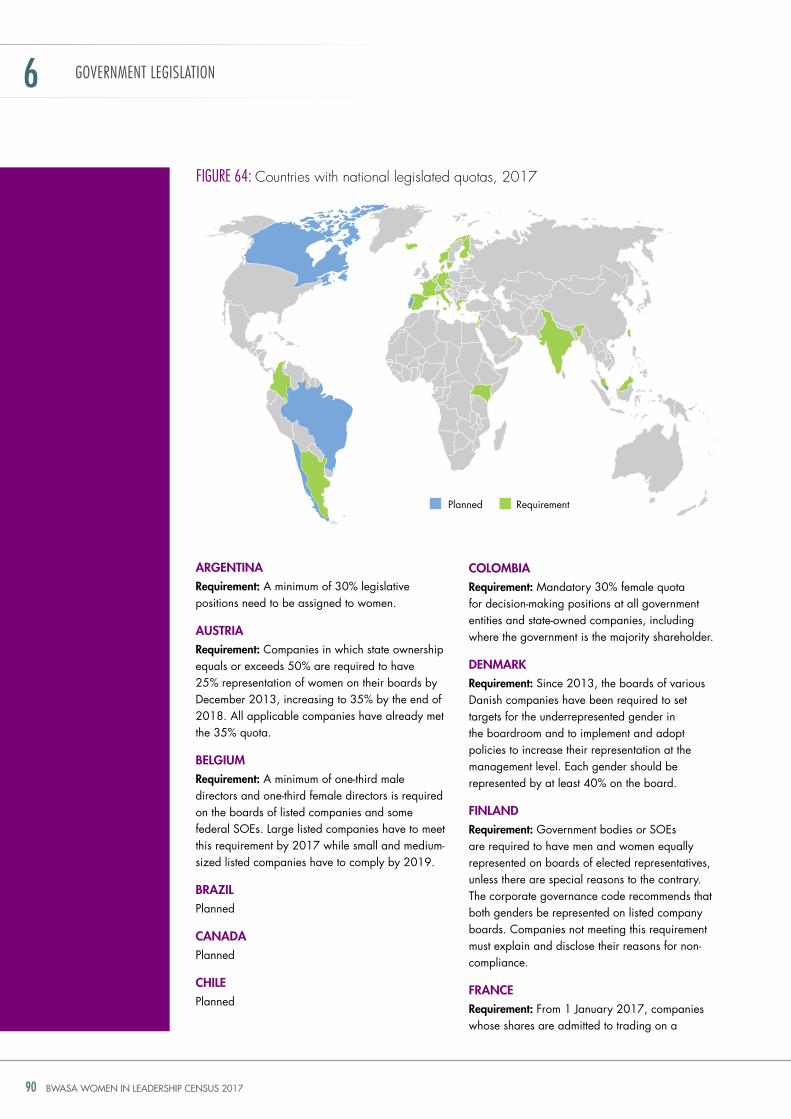
BWASA WOMEN IN LEADERSHIP CENSUS 201790
GOVERNMENTLEGISLATION6
arGEntInarequirement: A minimum of 30% legislative positions need to be assigned to women.
auStrIarequirement: Companies in which state ownership equals or exceeds 50% are required to have 25% representation of women on their boards by december 2013, increasing to 35% by the end of 2018. All applicable companies have already met the 35% quota.
BElGIuMrequirement: A minimum of one-third male directors and one-third female directors is required on the boards of listed companies and some federal SoEs. Large listed companies have to meet this requirement by 2017 while small and medium-sized listed companies have to comply by 2019.
BraZIlPlanned
canadaPlanned
cHIlEPlanned
FIgURe 64: countries with national legislated quotas, 2017
requirementPlanned
coloMBIarequirement: Mandatory 30% female quota for decision-making positions at all government entities and state-owned companies, including where the government is the majority shareholder.
dEnMarkrequirement: Since 2013, the boards of various danish companies have been required to set targets for the underrepresented gender in the boardroom and to implement and adopt policies to increase their representation at the management level. Each gender should be represented by at least 40% on the board.
FInlandrequirement: government bodies or SoEs are required to have men and women equally represented on boards of elected representatives, unless there are special reasons to the contrary. the corporate governance code recommends that both genders be represented on listed company boards. Companies not meeting this requirement must explain and disclose their reasons for non-compliance.
FrancErequirement: From 1 January 2017, companies whose shares are admitted to trading on a
BWASA WOMEN IN LEADERSHIP CENSUS 2017 91
GOVERNMENTLEGISLATION 6
regulated market, governmental organisations and companies (whether or not listed) with revenues or total assets over €50 million (who employ over 500 people) must have a 40% representation of both men and women on the board.
GErManYrequirement: in 2015 the german parliament passed legislation requiring listed companies with employee representation on their supervisory boards to allocate 30% of non-executive board seats to women from 2016 onwards. the quota is planned to increase to 50% from 2018.
GrEEcErequirement: one third of the state-appointed portion of full or partially state-owned company boards must belong to each sex.
IcElandrequirement: At least 40% of each gender needs to be represented on the board of private companies as well as in senior management positions within public corporations.
IndIarequirement: it is mandatory for all listed companies and large public limited companies to appoint at least one female director to their boards.
ISraElrequirement: if a board is composed of only one gender, any new appointments must be of the other gender. All government-owned companies must have an equal gender representation on their boards.
ItalYrequirement: the less represented gender should hold at least 20% of seats on the board of directors and the board of statutory auditors for the first term and 33% for the other terms. if requirements are not met after a four-month notice period, the company will be fined.
kEnYarequirement: no gender can hold more than 66% of boardroom seats at SoEs or companies in which the government is the largest shareholder.
MalaYSIarequirement: At least 30% of senior management and board positions in companies with more than 250 employees must be filled by women.
nEtHErlandSrequirement: Executive and supervisory board members should be at least 30% male and 30% female by 2016. this applies to both listed and non-listed companies that meet two of the three criteria: balance sheet greater than €17.5 million, gross annual revenue larger than €35 million and an average number of employees of at least 250. A ‘comply or explain’ approach applies. Although the dutch Management and Supervisory Act was not mandatory and expired in 2016, it was extended in 2017 by the Parliament under the same conditions. the government has stated that a mandatory gender quota will come into effect if the targets are not met.
norWaYrequirement: Company boards require 40% representation of both sexes. disclosure of the state of diversity of the company is also required under the norwegian Accounting Act. noncompliance could result in the dissolution of the offending company.
portuGalPlanned
SInGaporEPlanned
SpaInrequirement: Companies are required to self-impose a minimum target of female directors on their boards. there is no penalty for non-compliance but the government will take a company’s compliance into consideration when assigning certain public contracts.
taIWanrequirement: SoEs and legal foundations need to have boards comprised of at least one-third women.
tHE unItEd araB EMIratESrequirement: All state-owned corporations are required to have at least one woman on their boards.
BWASA WOMEN IN LEADERSHIP CENSUS 201792
eMerGinG MArKets & AFriCAn Peers
seCtion 7:
EMERGINGMARKETS&AFRICANPEERS7
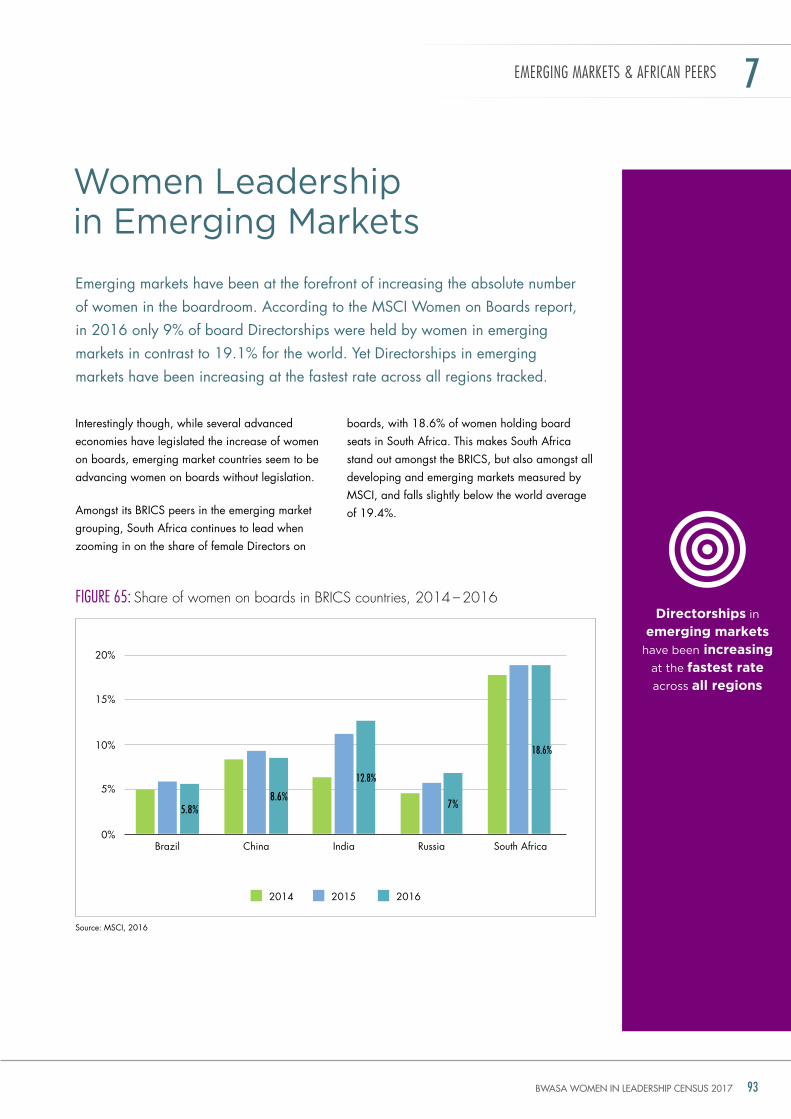
BWASA WOMEN IN LEADERSHIP CENSUS 2017 93
women leadership in emerging Markets
EMERGINGMARKETS&AFRICANPEERS 7
Emerging markets have been at the forefront of increasing the absolute number of women in the boardroom. According to the MSCi Women on Boards report, in 2016 only 9% of board directorships were held by women in emerging markets in contrast to 19.1% for the world. yet directorships in emerging markets have been increasing at the fastest rate across all regions tracked.
interestingly though, while several advanced economies have legislated the increase of women on boards, emerging market countries seem to be advancing women on boards without legislation.
Amongst its BriCS peers in the emerging market grouping, South Africa continues to lead when zooming in on the share of female directors on
boards, with 18.6% of women holding board seats in South Africa. this makes South Africa stand out amongst the BriCS, but also amongst all developing and emerging markets measured by MSCi, and falls slightly below the world average of 19.4%.
FIgURe 65: share of women on boards in brics countries, 2014 – 2016
Source: MSCi, 2016
Brazil China india russia South Africa0%
5%
10%
15%
20%
2014 2015 2016
5.8%8.6%
12.8%
7%
18.6%
Directorships in
emerging markets have been increasing
at the fastest rate
across all regions
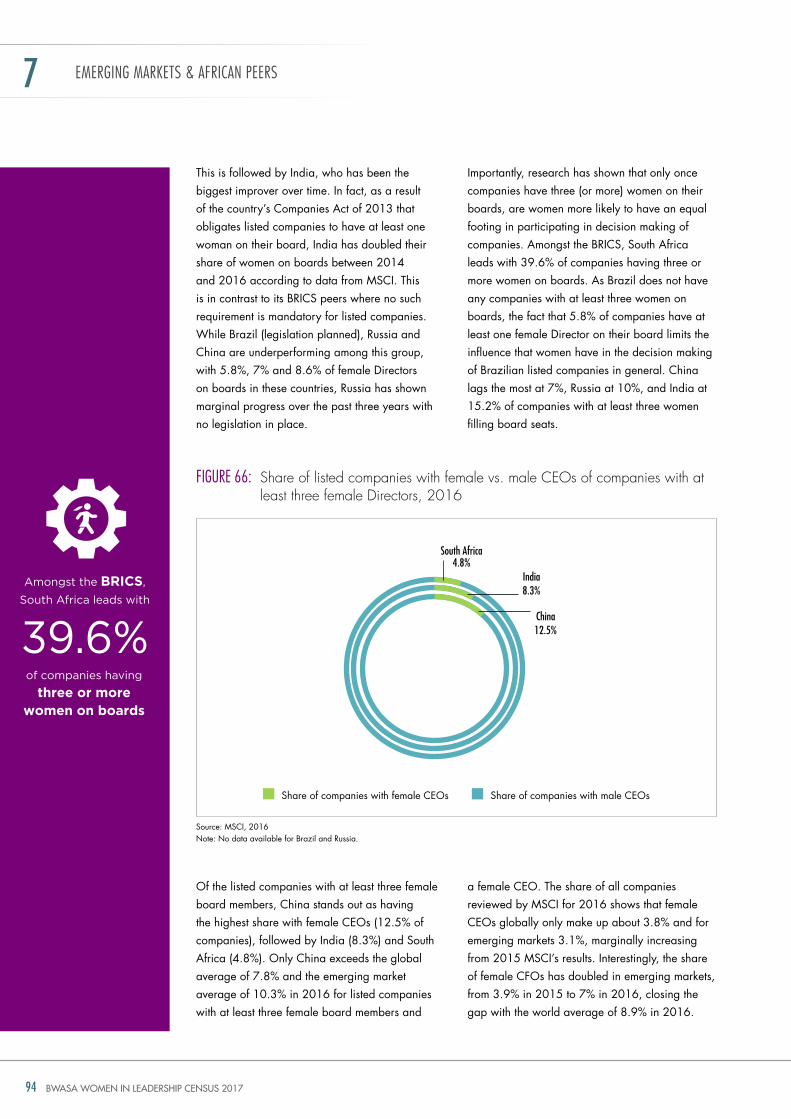
BWASA WOMEN IN LEADERSHIP CENSUS 201794
this is followed by india, who has been the biggest improver over time. in fact, as a result of the country’s Companies Act of 2013 that obligates listed companies to have at least one woman on their board, india has doubled their share of women on boards between 2014 and 2016 according to data from MSCi. this is in contrast to its BriCS peers where no such requirement is mandatory for listed companies. While Brazil (legislation planned), russia and China are underperforming among this group, with 5.8%, 7% and 8.6% of female directors on boards in these countries, russia has shown marginal progress over the past three years with no legislation in place.
of the listed companies with at least three female board members, China stands out as having the highest share with female CEos (12.5% of companies), followed by india (8.3%) and South Africa (4.8%). only China exceeds the global average of 7.8% and the emerging market average of 10.3% in 2016 for listed companies with at least three female board members and
importantly, research has shown that only once companies have three (or more) women on their boards, are women more likely to have an equal footing in participating in decision making of companies. Amongst the BriCS, South Africa leads with 39.6% of companies having three or more women on boards. As Brazil does not have any companies with at least three women on boards, the fact that 5.8% of companies have at least one female director on their board limits the influence that women have in the decision making of Brazilian listed companies in general. China lags the most at 7%, russia at 10%, and india at 15.2% of companies with at least three women filling board seats.
a female CEo. the share of all companies reviewed by MSCi for 2016 shows that female CEos globally only make up about 3.8% and for emerging markets 3.1%, marginally increasing from 2015 MSCi’s results. interestingly, the share of female CFos has doubled in emerging markets, from 3.9% in 2015 to 7% in 2016, closing the gap with the world average of 8.9% in 2016.
FIgURe 66: share of listed companies with female vs. male ceos of companies with at least three female directors, 2016
Source: MSCi, 2016note: no data available for Brazil and russia.
EMERGINGMARKETS&AFRICANPEERS7
india8.3%
china12.5%
south africa 4.8%
Share of companies with female CEos Share of companies with male CEos
Amongst the BRICS,
south Africa leads with
39.6%of companies having
three or more women on boards
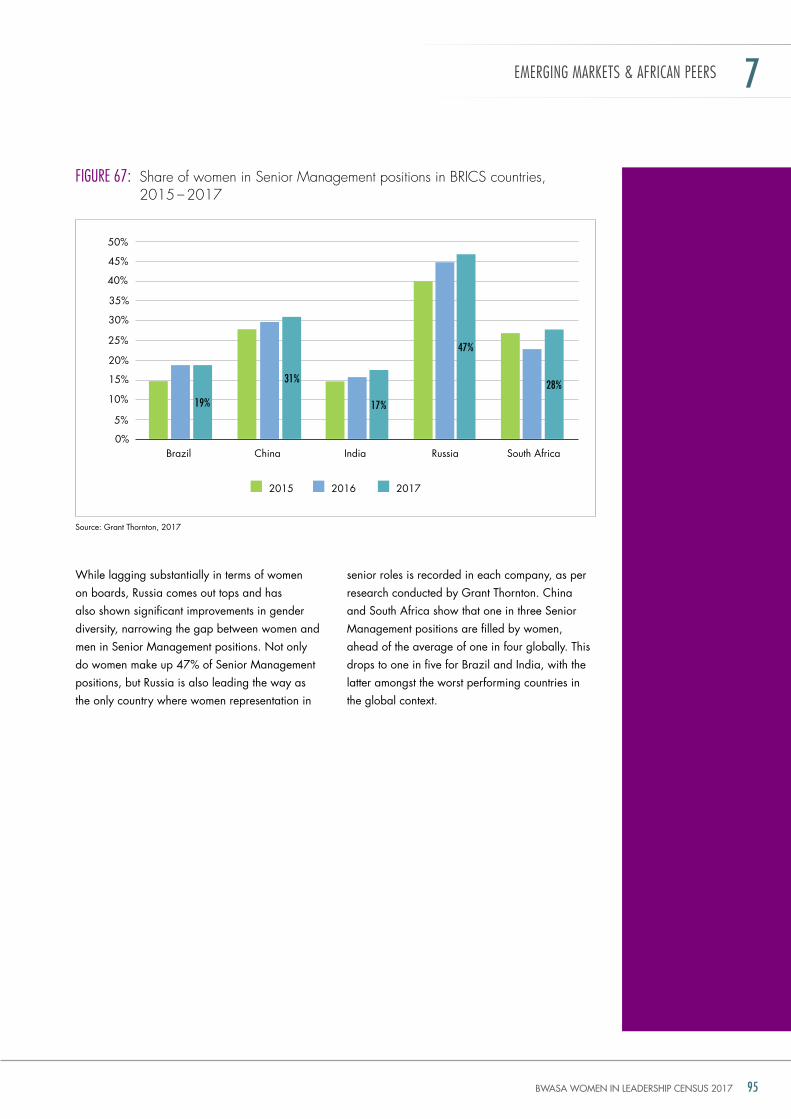
BWASA WOMEN IN LEADERSHIP CENSUS 2017 95
While lagging substantially in terms of women on boards, russia comes out tops and has also shown significant improvements in gender diversity, narrowing the gap between women and men in Senior Management positions. not only do women make up 47% of Senior Management positions, but russia is also leading the way as the only country where women representation in
senior roles is recorded in each company, as per research conducted by grant thornton. China and South Africa show that one in three Senior Management positions are filled by women, ahead of the average of one in four globally. this drops to one in five for Brazil and india, with the latter amongst the worst performing countries in the global context.
FIgURe 67: share of women in senior management positions in brics countries, 2015 – 2017
Source: grant thornton, 2017
EMERGINGMARKETS&AFRICANPEERS 7
0%
5%
10%
15%
20%
25%
30%
35%
40%
45%
50%
2015 2016 2017
Brazil China india russia South Africa
19%
31%
17%
47%
28%
BWASA WOMEN IN LEADERSHIP CENSUS 201796
over the past 20 years and since the Beijing declaration and Platform for Action was adopted by over 180 member states, governments have taken steps to address gender discrimination, increasingly focused on the need to promote gender equality in the social, economic and political status of women.
the united nations Commission on the Status of Women (unCSW) process and recent Sustainable development goals (Sdgs) highlight the need to remove impediments that deny women equal rights and participation in their environments and to enable their inclusion in the opportunities for productive quality lives in their economies.
Many countries have made commitments to meet gender equity, and in particular are addressing issues relating to challenges of violence against women. Areas of economic empowerment still require focused attention. this is particularly evident in Africa, especially at a time when the continent’s growth performance requires rethinking.
rEJuVEnatInG aFrIca’S GroWtH ModEl
According to data from the international Monetary Fund (iMF), 79 sub-Saharan Africa (SSA) has averaged 5.6% growth over the 2000-2014 period. this growth peaked in 2004 and again in 2007 at the height of the commodity price super-cycle at 7.16% and 7.12% respectively, and dropped to 3.9% in 2009 on account of the headwinds from the global financial crisis.
SSA was the second fastest-growing region in the world after developing Asia in the past ten plus years. increasing peace and stability, coupled with heightened business interests of both emerging and traditional partners ran in parallel with the improving reputational image and brand of the continent – one that has portrayed Africa
as a commercial opportunity, rather than a developmental burden.
the world changed drastically in the last few years. Post the global financial and economic crisis the rebound in global growth has been pedestrian, and the post-crisis recovery in most of the developed world has been lethargic. this has been coupled with the end of China’s supercharged growth trajectory, the glut in oil and commodity price markets, and shrinking global trade and cross-border capital flows, amongst greater nationalism and protectionist policies coming out of the uS and the uK. Both developed and emerging markets’ growth have been flat-lining.
With looming risks and rising macroeconomic vulnerabilities across the continent – including deteriorating trade and fiscal deficits, rising government debt levels, and currency depreciations – Africa needs to refocus its resource-dependent business models and value propositions. recent economic expansion of SSA has averaged 3.1% per annum over the 2014-2016 period 80 – still ahead of the 0.2% and -0.7% averaged over the same period by other resource-dependent regions such as Latin America, russia and Central Asia respectively.
As a result, diverging performances at the country level are increasingly visible – a multi-speed Africa, with countries in East Africa as well as Francophone West Africa taking the lead as key performers. Africa’s tired business model is overdue for change, and years of economic adjustment are ahead for the continent. in this light it is imperative that new and more drivers of growth emerge, urgently. And a new foundation of prosperity, built on ideas rather than resource exports needs to surface.
the imperative of women empowerment in Africa78
78 With permission from the authors, taken from and based on Magau & Edinger, 2016
79 iMF WEo, April 201780 deloitte, 2017a
EMERGINGMARKETS&AFRICANPEERS7
An integral part
of unlocking the full potential of African
economies will depend
on both developing and including
countries’ full human capital resources –
i.e,. not only men
but also women
as productive members of society
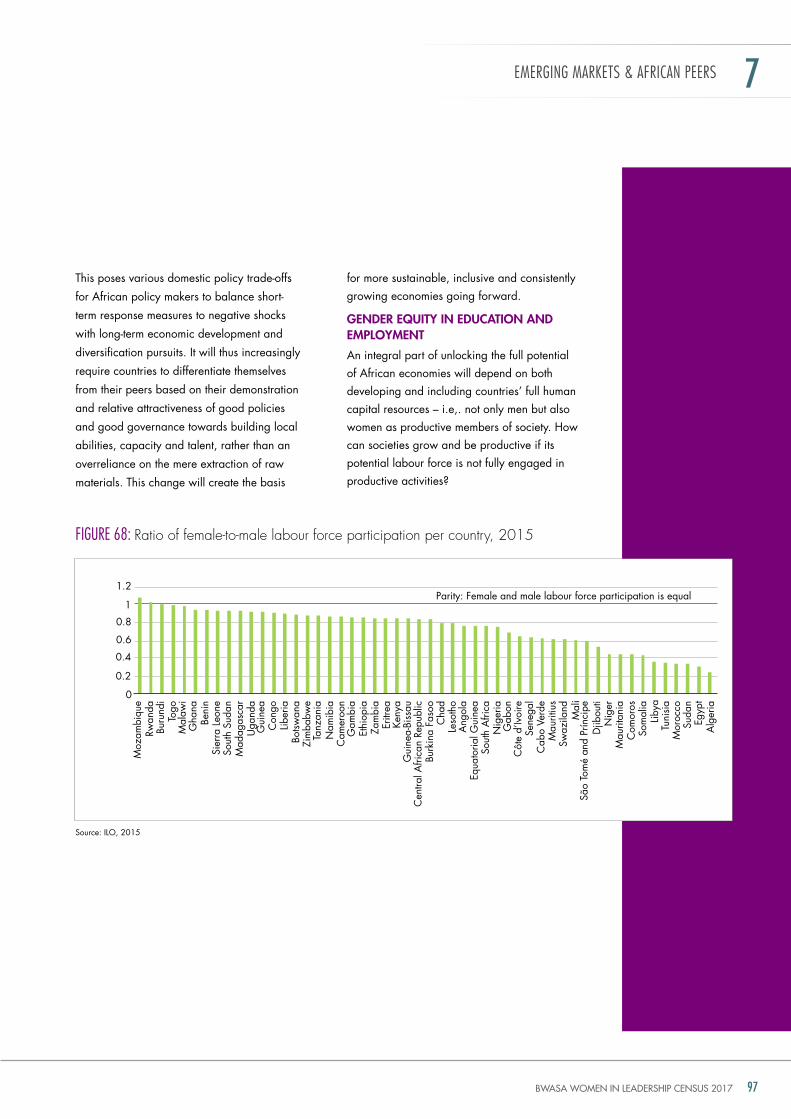
BWASA WOMEN IN LEADERSHIP CENSUS 2017 97
this poses various domestic policy trade-offs
for African policy makers to balance short-
term response measures to negative shocks
with long-term economic development and
diversification pursuits. it will thus increasingly
require countries to differentiate themselves
from their peers based on their demonstration
and relative attractiveness of good policies
and good governance towards building local
abilities, capacity and talent, rather than an
overreliance on the mere extraction of raw
materials. this change will create the basis
for more sustainable, inclusive and consistently growing economies going forward.
GEndEr EquItY In EducatIon and EMploYMEnt
An integral part of unlocking the full potential of African economies will depend on both developing and including countries’ full human capital resources – i.e,. not only men but also women as productive members of society. how can societies grow and be productive if its potential labour force is not fully engaged in productive activities?
EMERGINGMARKETS&AFRICANPEERS 7
FIgURe 68: ratio of female-to-male labour force participation per country, 2015
Source: iLo, 2015
Parity: Female and male labour force participation is equal
0
0.2
0.4
0.6
0.8
1
1.2
Moz
ambi
que
rwan
daBu
rund
ito
goM
alaw
ig
hana
Beni
nSi
erra
Leo
neSo
uth
Suda
nM
adag
asca
ru
gand
ag
uine
aC
ongo
Liber
iaBo
tswan
aZi
mba
bwe
tanz
ania
nam
ibia
Cam
eroo
ng
ambi
aEt
hiop
iaZa
mbi
a E
ritre
aKe
nya
gui
nea-
Biss
auC
entra
l Afri
can
repu
blic
Burk
ina
Faso
oC
had
Leso
tho
Ang
ola
Equa
toria
l gui
nea
Sout
h A
frica
nig
eria
gab
onC
ôte
d’iv
oire
Sene
gal
Cab
o Ve
rde
Mau
ritiu
sSw
azila
ndM
ali
São
tom
é an
d Pr
ínci
ped
jibou
tin
iger
Mau
ritan
iaC
omor
osSo
mal
iaLib
yatu
nisi
aM
oroc
coSu
dan
Egyp
tA
lger
ia
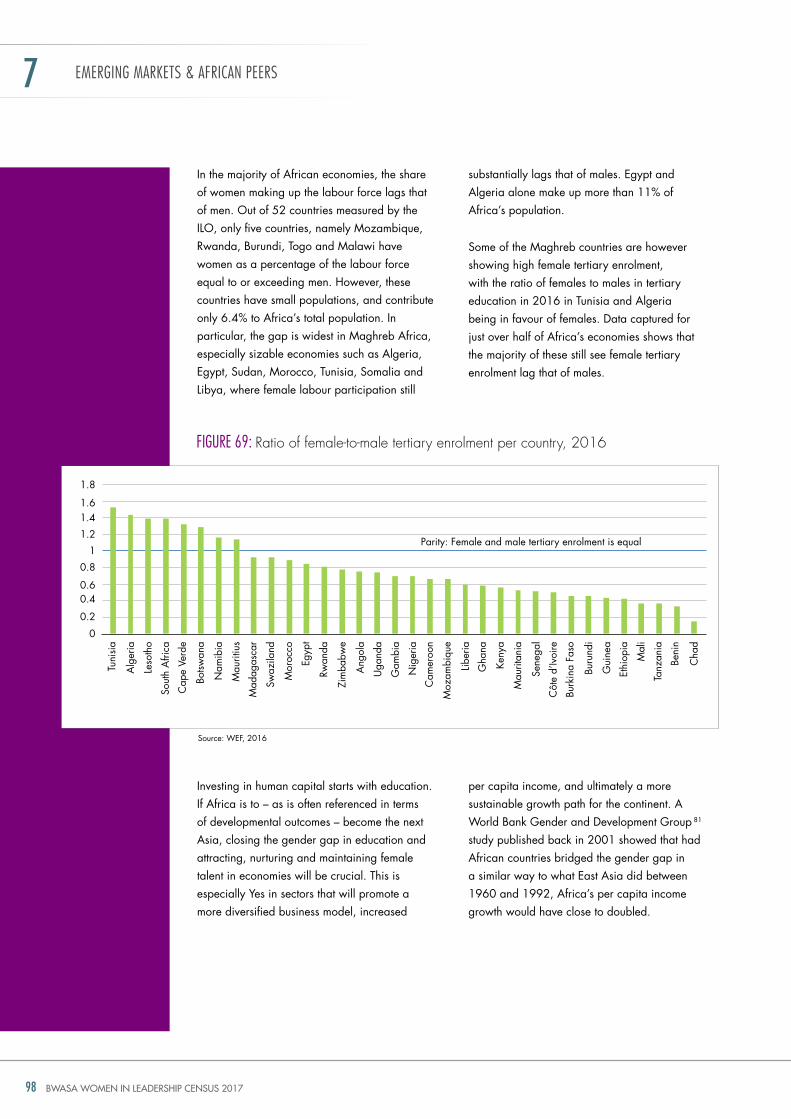
BWASA WOMEN IN LEADERSHIP CENSUS 201798
EMERGINGMARKETS&AFRICANPEERS7
in the majority of African economies, the share of women making up the labour force lags that of men. out of 52 countries measured by the iLo, only five countries, namely Mozambique, rwanda, Burundi, togo and Malawi have women as a percentage of the labour force equal to or exceeding men. however, these countries have small populations, and contribute only 6.4% to Africa’s total population. in particular, the gap is widest in Maghreb Africa, especially sizable economies such as Algeria, Egypt, Sudan, Morocco, tunisia, Somalia and Libya, where female labour participation still
investing in human capital starts with education. if Africa is to – as is often referenced in terms of developmental outcomes – become the next Asia, closing the gender gap in education and attracting, nurturing and maintaining female talent in economies will be crucial. this is especially yes in sectors that will promote a more diversified business model, increased
substantially lags that of males. Egypt and Algeria alone make up more than 11% of Africa’s population.
Some of the Maghreb countries are however showing high female tertiary enrolment, with the ratio of females to males in tertiary education in 2016 in tunisia and Algeria being in favour of females. data captured for just over half of Africa’s economies shows that the majority of these still see female tertiary enrolment lag that of males.
per capita income, and ultimately a more sustainable growth path for the continent. A World Bank gender and development group 81 study published back in 2001 showed that had African countries bridged the gender gap in a similar way to what East Asia did between 1960 and 1992, Africa’s per capita income growth would have close to doubled.
FIgURe 69: ratio of female-to-male tertiary enrolment per country, 2016
Source: WEF, 2016
0
0.2
0.40.6
0.8
1
1.2
1.41.6
1.8
tuni
sia
Alg
eria
Leso
tho
Sout
h A
frica
Cap
e Ve
rde
Botsw
ana
nam
ibia
Mau
ritiu
s
Mad
agas
car
Swaz
iland
Mor
occo
Egyp
t
rwan
da
Zim
babw
e
Ang
ola
uga
nda
gam
bia
nig
eria
Cam
eroo
n
Moz
ambi
que
Liber
ia
gha
na
Keny
a
Mau
ritan
ia
Sene
gal
Côt
e d’
ivoi
re
Burk
ina
Faso
Buru
ndi
gui
nea
Ethi
opia
Mal
i
tanz
ania
Beni
n
Cha
d
Parity: Female and male tertiary enrolment is equal
BWASA WOMEN IN LEADERSHIP CENSUS 2017 99
81 the World Bank, 2001
EMERGINGMARKETS&AFRICANPEERS 7
MEaSurInG and coMparInG proGrESS
investing in women and girls’ education and health, in their rights, in mainstreaming them into societies; and tracking the progress of such activities and investments to achieve gender equality, women economic empowerment and ultimately a more inclusive and prosperous society will be important ingredients in changing Africa’s business model going forward.
the current “African moment” increasingly needs to refocus around economic governance. how much economic progress has been about or has facilitated inclusive growth, specifically the inclusiveness of women?
A number of tools to track and monitor progress are already in place. these include the African Peer Review Mechanism (APRM) – an important vehicle that enables African governments to review their progress against overall goals for promoting development of the continent. the Awards given by the Au Chair to heads of States who have made significant progress on various indicators, reflect an active process of assessing progress and highlighting steps achieved while motivating ongoing development.
the Africa Gender Score Card, an initiative by the Africa union, the African Gender Equality Index, published by the African development Bank, as well as the World Bank’s Women, Business and the Law publications complement such mechanisms by focusing on gender equality progress.
As tools promoting the implementation of gender equity policies in African countries as part of Agenda 2063 and related commitments, to measure change and to influence policy, future editions of this report look to track the performance of key African peer economies across available metrics. For example, both the score card and the index measure women empowerment across various dimensions: the AfdB in terms of economic opportunities and production, human development, and leaders and active citizens, and the Au across selected sectors including health, education, access to land, business sectors, employment, parliament and decision-making, as well as access to credit.
BWASA WOMEN IN LEADERSHIP CENSUS 2017100
CAll to ACtionseCtion 8:
Call TO aCTION8
BWASA WOMEN IN LEADERSHIP CENSUS 2017 101
how the BwAsA can Assist
Call TO aCTION 8
South Africa still has a long way to go before achieving gender parity at these levels. this has been the conclusion of every Women in Leadership Census to date; we’re improving, but not quickly enough. Companies need to put in more of a concerted effort to improve the representation of women on their boards. the time for loud announcements and little action is over.
the Businesswomen’s Association of South Africa (BWASA) is the largest association of business and professional women in the country. the BWASA plays a key role in highlighting the current status of women in leadership and acts as a lobby group to advocate on women’s business issues in an effort to transform the economy.
For more information and to understand how the BWaSa can assist your organisation with gender
transformation, please visit the website: www.bwasa.co.za
Issues faced by companies/organisations How the BWASA can assist
Female leaders require to be equipped with the right skillset and knowledge to be effective board members
Board readiness Workshops, to address corporate governance, anti-corruption and ethics
Lack of gender representation at all levels of organisations
diversity Management Workshops, for all levels of the organisation
Various issues which discourage women from accepting leadership positions
When She Leads series, that addresses the issues faced by women in leadership positions and at the board level
Women do not have the skills to move up into senior management positions
Fast track, a programme that accelerates women from mid-level management to senior management
Lack of available women to fill board seats Board-ready Women: the BWASA, institute of directors SA and the 30% Club have a large database of women who are ready to be Board members
Lack of women-owned companies for preferential procurement/supplier diversity purposes
Women-owned Companies, a database of women-owned businesses in every industry
through strategic partnerships with sponsors, other non-profit organisations, leading companies and business schools and the BWASA’s wide-spanning network, the BWASA provides on-going events, training, and opportunities to advance the interests and needs of women in business.
the BWASA also works in close cooperation with the leadership of companies to assist with transforming their boards and becoming more gender-balanced, benefitting both the company and society at large.
A number of initiatives and programmes of the BWASA and how these relate to specific issues experienced by companies and organisations are included below.
Since 2008, there has been an across-the-board increase in the share of leadership positions held by women across both JSE-listed firms and SoEs. despite accounting for 44.3% of the employed population, women still account for less than 30% of CEo, Chairperson, board and Executive Manager seats.
BWASA WOMEN IN LEADERSHIP CENSUS 2017102
BACKGround & MethodoloGies
BACKGROUND&METHODOLOGIES
BWASA WOMEN IN LEADERSHIP CENSUS 2017 103
BACKGROUND&METHODOLOGIES
All companies listed on either the Main or AltX boards of the Johannesburg Stock Exchange (JSE) as at 28 February 2017 were included in the Census. Companies excluded from the analysis include:
• FirmswithasecondarylistingontheJSEbutaprimary listing elsewhere
• Companiesthatweresuspendedasat28February 2017
• HoldingcompanieswithnooperationsinSouth Africa
twenty of the largest state-owned enterprises (SoEs) were also included in the data sample which recognises the importance of their role in developing the South African economy as well as driving economic transformation initiatives. Schedule 3 SoEs (known as smaller SoEs) were excluded from this edition of the Census due to their low response rate of only 47.1% for the 2015 Census.
government departments have been incorporated since the 2008 Census. information included in this Census is provided by the department of Public Service and Administration (dPSA).
this edition of the Census has omitted subsidiary information for directors as many companies consider this information to be confidential. in this way, it was ensured that comparisons for the JSE-listed company were made and that the data was not skewed in favour of companies that were able to share subsidiary information.
As not all companies were willing or able to share data for Executive Managers, the analysis for directors and Executive Managers was split so as to not distort the data. Previously, the data was combined and companies were evaluated in terms of how they performed with respects to both female directors and female Executive Managers as a share of the total. this year, companies were evaluated based on either verified data regarding directors or publically available director information. only companies which
provided verified Executive Manager information were evaluated based on the representation of female Executive Managers within the Executive Management pool.
the Census methodology was developed in 2004 in conjunction with Catalyst, a leading international research and advisory organisation working with businesses and the professions to build inclusive environments and expand opportunities for women at work.
the main metrics collated for each of the companies are:
• TotalnumberofDirectorsontheboardoftheJSE-listed firm/SoE
• NumberoffemaleDirectors
• TheraceofbothmaleandfemaleDirectors
• TotalnumberofExecutiveManagers
• NumberofExecutiveManagersbyraceandgender
this methodology ensures that the most accurate and complete data is captured for women in key positions for all JSE-listed firms as well as the 20 SoEs as at 28 February 2017.
director information was sourced from publicly available annual reports and verified by the company/SoE or was unverified – both as indicated in this report. Executive Manager information had to be sourced directly from each company in the data samples since this information is not consistently contained in annual reports or other reliable sources that are publicly available.
due to the new Protection of Personal information (PoPi) Act, this edition of the Census does not publish specific director information.
Where data was not verified, the information included in the Census is taken from publically available data and information as at 28 February 2017.
BWASA WOMEN IN LEADERSHIP CENSUS 2017104
aPPeNDIx: CeNsUs DaTa
JSE-lIStEd coMpanIES: cEnSuS data and rESultS aS oF 28 FEBruarY 2017
Company Name Industry Board Verified Total Directorships
Total Female Directors
% Female Directors
Absa Bank Limited Financials Main yes 37 12 32.4%
Accelerate Property Fund Limited
Financials Main yes 10 1 10.0%
Accentuate Limited industrials AltX yes 19 0 0.0%
Acsion Limited Basic Materials Main yes 6 1 16.7%
Adapt it holdings Limited technology Main yes 13 7 53.8%
Adcock ingram holdings Limited
health Care Main yes 13 3 23.1%
Adcorp holdings Limited industrials Main yes 40 12 30.0%
Adrenna Property grp Limited Financials Main yes 6 1 16.7%
Advanced health Limited health Care AltX yes 12 1 8.3%
Advtech Limited Consumer Services
Main yes 10 4 40.0%
AECi Limited Basic Materials Main yes 12 2 16.7%
African and overseas Enterprises Ltd
Consumer Services
Main no 7 2 28.6%
African dawn Capital Limited Financials AltX yes 5 2 40.0%
African Media Entertainment Consumer Services
Main yes 6 2 33.3%
African oxygen Limited Basic Materials Main yes 10 3 30.0%
African Phoenix investments Ltd Financials Main yes 8 2 25.0%
African rainbow Minerals Limited
Basic Materials Main yes 15 2 13.3%
Afrimat Limited industrials Main yes 54 1 1.9%
Afrocentric investment Corporation Limited
health Care Main yes 23 6 26.1%
Alaris holdings technology AltX yes 7 1 14.3%
Allied Electronics Corporation industrials Main yes 104 17 16.3%
Alviva holdings Ltd technology Main yes 103 15 14.6%
Anchor group Limited Financials AltX yes 9 2 22.2%
APPendix: Census dAtA
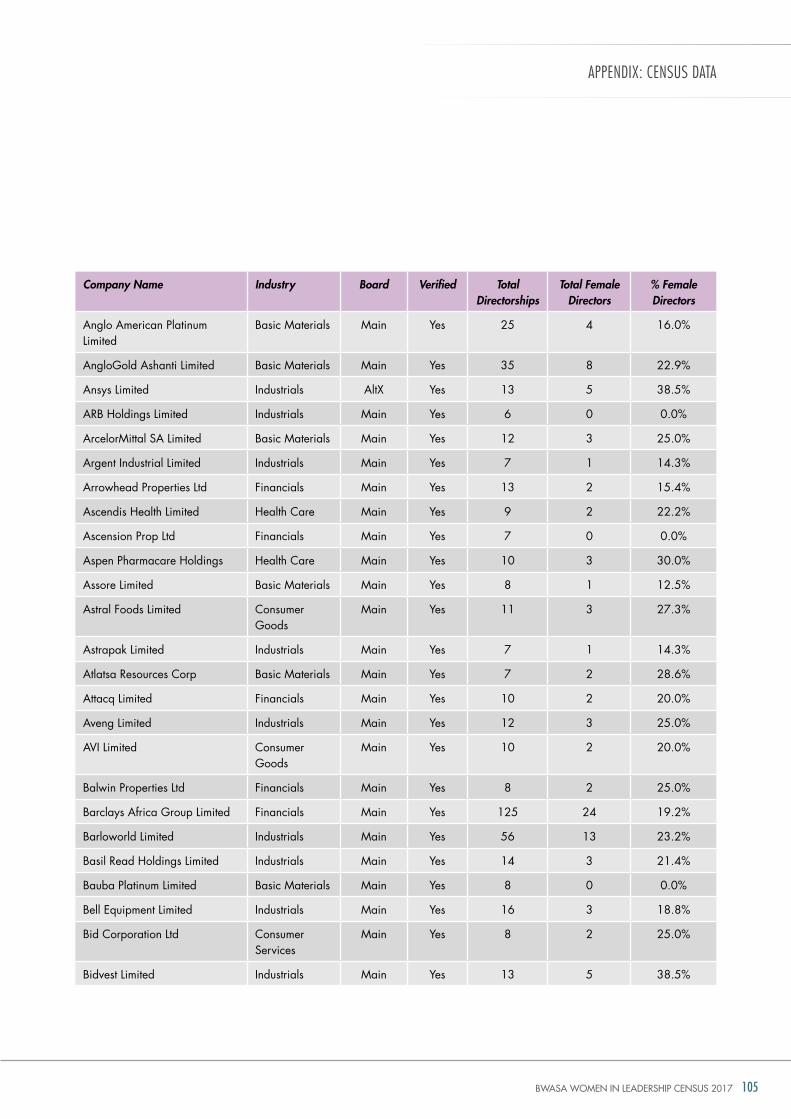
BWASA WOMEN IN LEADERSHIP CENSUS 2017 105
aPPeNDIx: CeNsUs DaTa
Company Name Industry Board Verified Total Directorships
Total Female Directors
% Female Directors
Anglo American Platinum Limited
Basic Materials Main yes 25 4 16.0%
Anglogold Ashanti Limited Basic Materials Main yes 35 8 22.9%
Ansys Limited industrials AltX yes 13 5 38.5%
ArB holdings Limited industrials Main yes 6 0 0.0%
ArcelorMittal SA Limited Basic Materials Main yes 12 3 25.0%
Argent industrial Limited industrials Main yes 7 1 14.3%
Arrowhead Properties Ltd Financials Main yes 13 2 15.4%
Ascendis health Limited health Care Main yes 9 2 22.2%
Ascension Prop Ltd Financials Main yes 7 0 0.0%
Aspen Pharmacare holdings health Care Main yes 10 3 30.0%
Assore Limited Basic Materials Main yes 8 1 12.5%
Astral Foods Limited Consumer goods
Main yes 11 3 27.3%
Astrapak Limited industrials Main yes 7 1 14.3%
Atlatsa resources Corp Basic Materials Main yes 7 2 28.6%
Attacq Limited Financials Main yes 10 2 20.0%
Aveng Limited industrials Main yes 12 3 25.0%
AVi Limited Consumer goods
Main yes 10 2 20.0%
Balwin Properties Ltd Financials Main yes 8 2 25.0%
Barclays Africa group Limited Financials Main yes 125 24 19.2%
Barloworld Limited industrials Main yes 56 13 23.2%
Basil read holdings Limited industrials Main yes 14 3 21.4%
Bauba Platinum Limited Basic Materials Main yes 8 0 0.0%
Bell Equipment Limited industrials Main yes 16 3 18.8%
Bid Corporation Ltd Consumer Services
Main yes 8 2 25.0%
Bidvest Limited industrials Main yes 13 5 38.5%
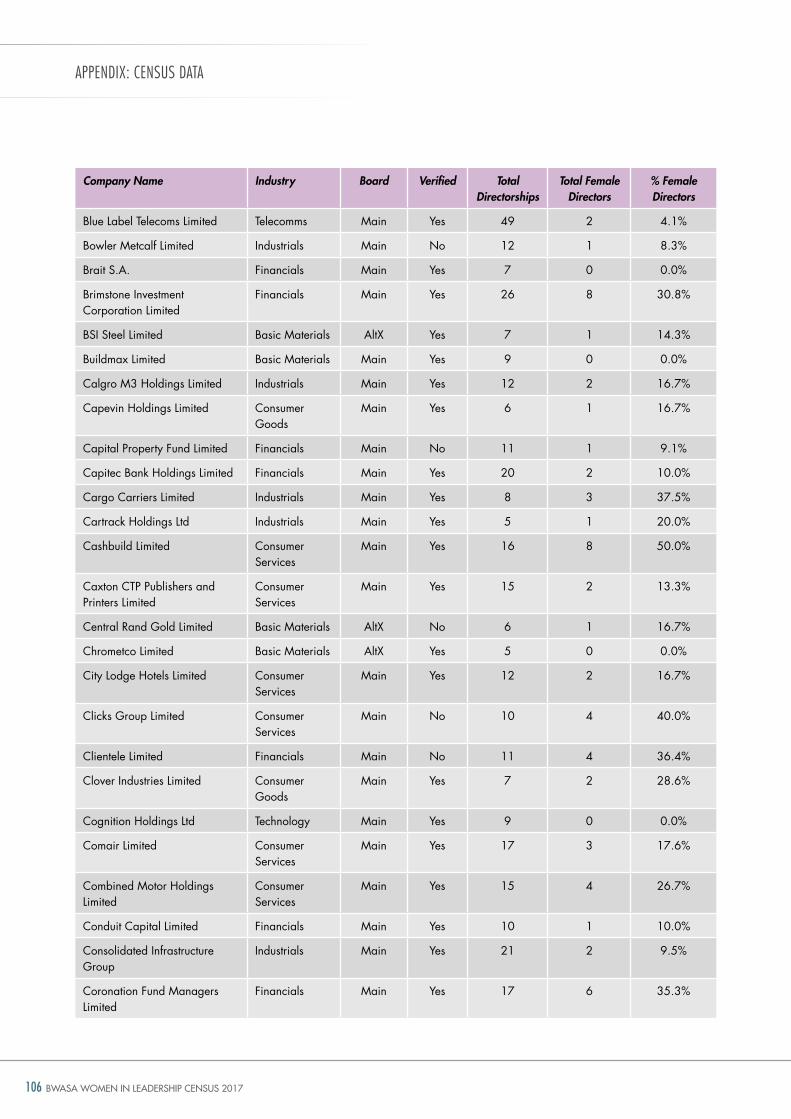
BWASA WOMEN IN LEADERSHIP CENSUS 2017106
aPPeNDIx: CeNsUs DaTa
Company Name Industry Board Verified Total Directorships
Total Female Directors
% Female Directors
Blue Label telecoms Limited telecomms Main yes 49 2 4.1%
Bowler Metcalf Limited industrials Main no 12 1 8.3%
Brait S.A. Financials Main yes 7 0 0.0%
Brimstone investment Corporation Limited
Financials Main yes 26 8 30.8%
BSi Steel Limited Basic Materials AltX yes 7 1 14.3%
Buildmax Limited Basic Materials Main yes 9 0 0.0%
Calgro M3 holdings Limited industrials Main yes 12 2 16.7%
Capevin holdings Limited Consumer goods
Main yes 6 1 16.7%
Capital Property Fund Limited Financials Main no 11 1 9.1%
Capitec Bank holdings Limited Financials Main yes 20 2 10.0%
Cargo Carriers Limited industrials Main yes 8 3 37.5%
Cartrack holdings Ltd industrials Main yes 5 1 20.0%
Cashbuild Limited Consumer Services
Main yes 16 8 50.0%
Caxton CtP Publishers and Printers Limited
Consumer Services
Main yes 15 2 13.3%
Central rand gold Limited Basic Materials AltX no 6 1 16.7%
Chrometco Limited Basic Materials AltX yes 5 0 0.0%
City Lodge hotels Limited Consumer Services
Main yes 12 2 16.7%
Clicks group Limited Consumer Services
Main no 10 4 40.0%
Clientele Limited Financials Main no 11 4 36.4%
Clover industries Limited Consumer goods
Main yes 7 2 28.6%
Cognition holdings Ltd technology Main yes 9 0 0.0%
Comair Limited Consumer Services
Main yes 17 3 17.6%
Combined Motor holdings Limited
Consumer Services
Main yes 15 4 26.7%
Conduit Capital Limited Financials Main yes 10 1 10.0%
Consolidated infrastructure group
industrials Main yes 21 2 9.5%
Coronation Fund Managers Limited
Financials Main yes 17 6 35.3%
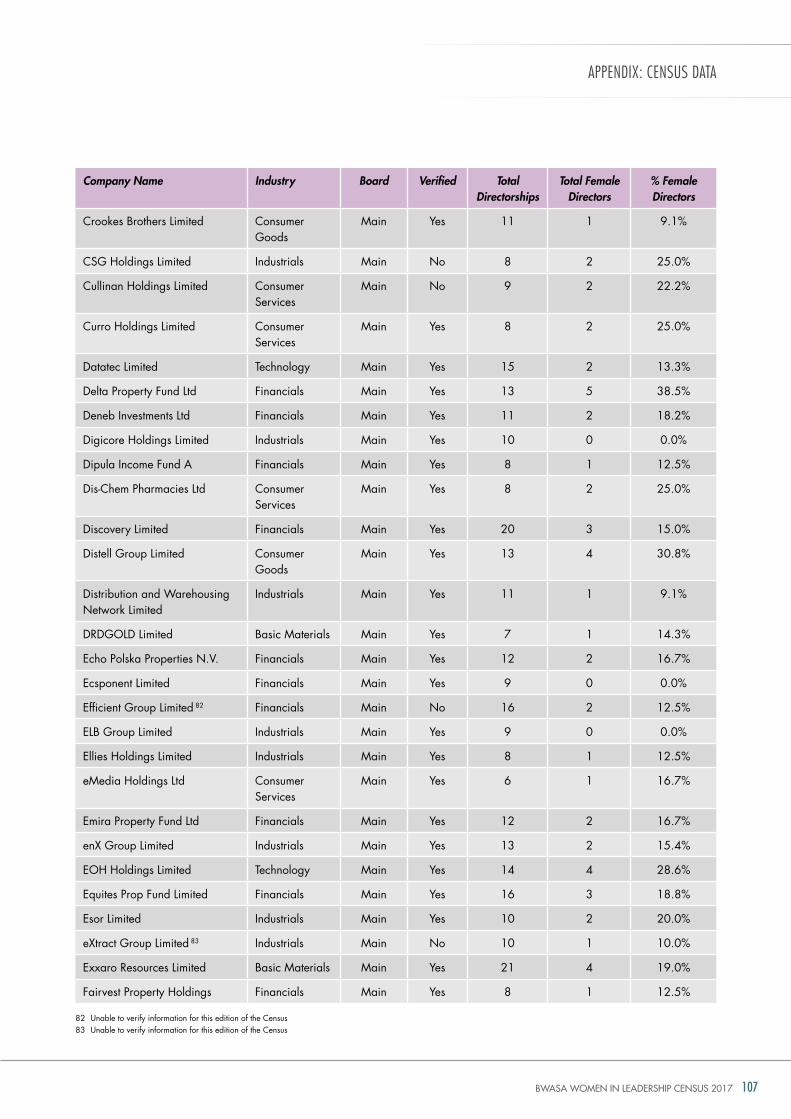
BWASA WOMEN IN LEADERSHIP CENSUS 2017 107
aPPeNDIx: CeNsUs DaTa
Company Name Industry Board Verified Total Directorships
Total Female Directors
% Female Directors
Crookes Brothers Limited Consumer goods
Main yes 11 1 9.1%
CSg holdings Limited industrials Main no 8 2 25.0%
Cullinan holdings Limited Consumer Services
Main no 9 2 22.2%
Curro holdings Limited Consumer Services
Main yes 8 2 25.0%
datatec Limited technology Main yes 15 2 13.3%
delta Property Fund Ltd Financials Main yes 13 5 38.5%
deneb investments Ltd Financials Main yes 11 2 18.2%
digicore holdings Limited industrials Main yes 10 0 0.0%
dipula income Fund A Financials Main yes 8 1 12.5%
dis-Chem Pharmacies Ltd Consumer Services
Main yes 8 2 25.0%
discovery Limited Financials Main yes 20 3 15.0%
distell group Limited Consumer goods
Main yes 13 4 30.8%
distribution and Warehousing network Limited
industrials Main yes 11 1 9.1%
drdgoLd Limited Basic Materials Main yes 7 1 14.3%
Echo Polska Properties n.V. Financials Main yes 12 2 16.7%
Ecsponent Limited Financials Main yes 9 0 0.0%
Efficient group Limited 82 Financials Main no 16 2 12.5%
ELB group Limited industrials Main yes 9 0 0.0%
Ellies holdings Limited industrials Main yes 8 1 12.5%
eMedia holdings Ltd Consumer Services
Main yes 6 1 16.7%
Emira Property Fund Ltd Financials Main yes 12 2 16.7%
enX group Limited industrials Main yes 13 2 15.4%
Eoh holdings Limited technology Main yes 14 4 28.6%
Equites Prop Fund Limited Financials Main yes 16 3 18.8%
Esor Limited industrials Main yes 10 2 20.0%
eXtract group Limited 83 industrials Main no 10 1 10.0%
Exxaro resources Limited Basic Materials Main yes 21 4 19.0%
Fairvest Property holdings Financials Main yes 8 1 12.5%
82 unable to verify information for this edition of the Census83 unable to verify information for this edition of the Census
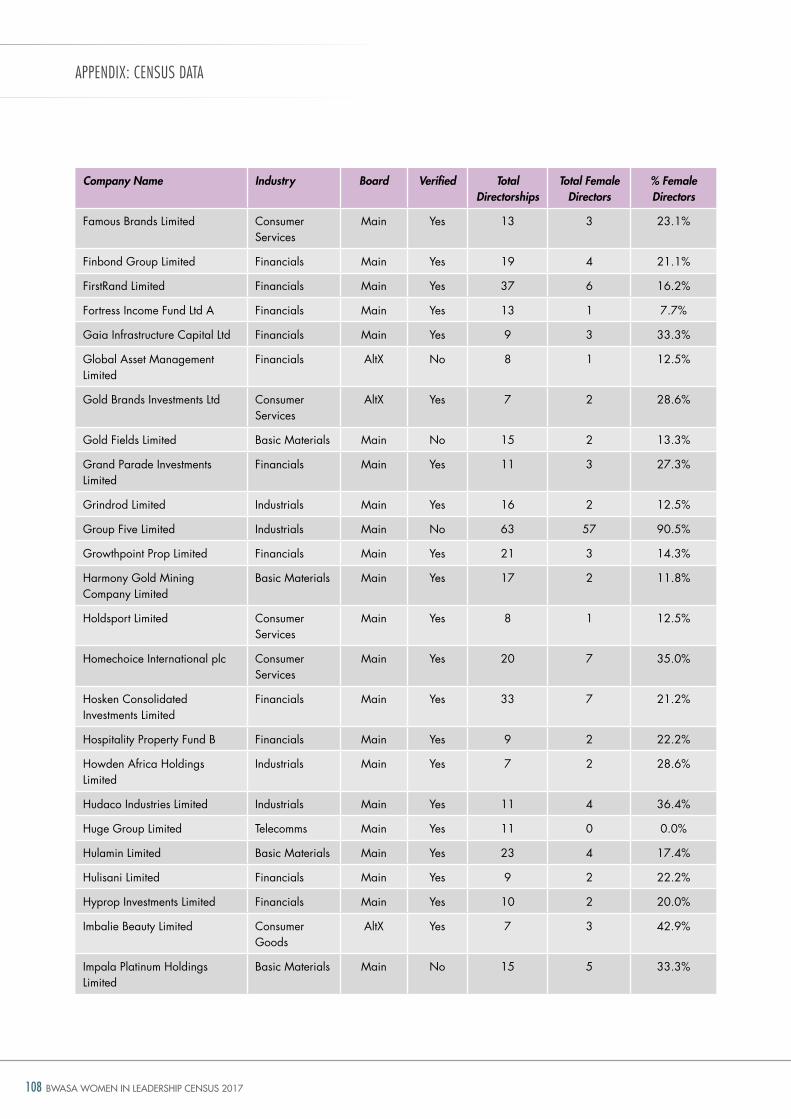
BWASA WOMEN IN LEADERSHIP CENSUS 2017108
aPPeNDIx: CeNsUs DaTa
Company Name Industry Board Verified Total Directorships
Total Female Directors
% Female Directors
Famous Brands Limited Consumer Services
Main yes 13 3 23.1%
Finbond group Limited Financials Main yes 19 4 21.1%
Firstrand Limited Financials Main yes 37 6 16.2%
Fortress income Fund Ltd A Financials Main yes 13 1 7.7%
gaia infrastructure Capital Ltd Financials Main yes 9 3 33.3%
global Asset Management Limited
Financials AltX no 8 1 12.5%
gold Brands investments Ltd Consumer Services
AltX yes 7 2 28.6%
gold Fields Limited Basic Materials Main no 15 2 13.3%
grand Parade investments Limited
Financials Main yes 11 3 27.3%
grindrod Limited industrials Main yes 16 2 12.5%
group Five Limited industrials Main no 63 57 90.5%
growthpoint Prop Limited Financials Main yes 21 3 14.3%
harmony gold Mining Company Limited
Basic Materials Main yes 17 2 11.8%
holdsport Limited Consumer Services
Main yes 8 1 12.5%
homechoice international plc Consumer Services
Main yes 20 7 35.0%
hosken Consolidated investments Limited
Financials Main yes 33 7 21.2%
hospitality Property Fund B Financials Main yes 9 2 22.2%
howden Africa holdings Limited
industrials Main yes 7 2 28.6%
hudaco industries Limited industrials Main yes 11 4 36.4%
huge group Limited telecomms Main yes 11 0 0.0%
hulamin Limited Basic Materials Main yes 23 4 17.4%
hulisani Limited Financials Main yes 9 2 22.2%
hyprop investments Limited Financials Main yes 10 2 20.0%
imbalie Beauty Limited Consumer goods
AltX yes 7 3 42.9%
impala Platinum holdings Limited
Basic Materials Main no 15 5 33.3%
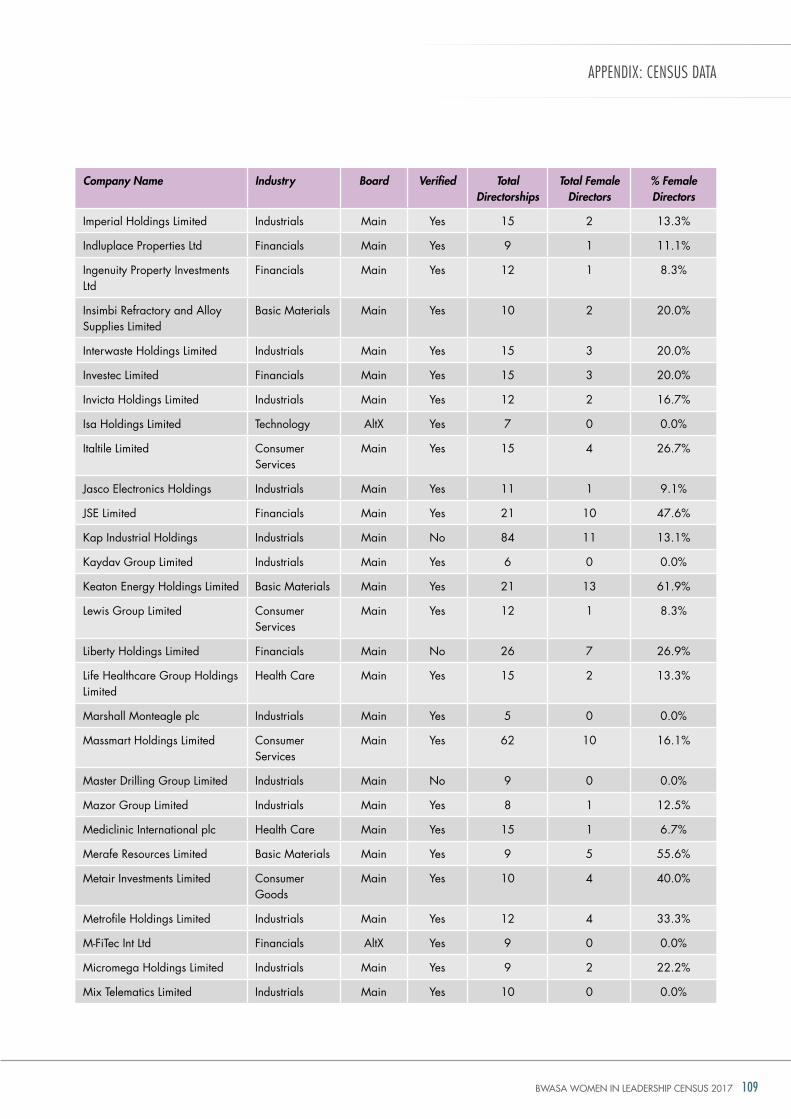
BWASA WOMEN IN LEADERSHIP CENSUS 2017 109
aPPeNDIx: CeNsUs DaTa
Company Name Industry Board Verified Total Directorships
Total Female Directors
% Female Directors
imperial holdings Limited industrials Main yes 15 2 13.3%
indluplace Properties Ltd Financials Main yes 9 1 11.1%
ingenuity Property investments Ltd
Financials Main yes 12 1 8.3%
insimbi refractory and Alloy Supplies Limited
Basic Materials Main yes 10 2 20.0%
interwaste holdings Limited industrials Main yes 15 3 20.0%
investec Limited Financials Main yes 15 3 20.0%
invicta holdings Limited industrials Main yes 12 2 16.7%
isa holdings Limited technology AltX yes 7 0 0.0%
italtile Limited Consumer Services
Main yes 15 4 26.7%
Jasco Electronics holdings industrials Main yes 11 1 9.1%
JSE Limited Financials Main yes 21 10 47.6%
Kap industrial holdings industrials Main no 84 11 13.1%
Kaydav group Limited industrials Main yes 6 0 0.0%
Keaton Energy holdings Limited Basic Materials Main yes 21 13 61.9%
Lewis group Limited Consumer Services
Main yes 12 1 8.3%
Liberty holdings Limited Financials Main no 26 7 26.9%
Life healthcare group holdings Limited
health Care Main yes 15 2 13.3%
Marshall Monteagle plc industrials Main yes 5 0 0.0%
Massmart holdings Limited Consumer Services
Main yes 62 10 16.1%
Master drilling group Limited industrials Main no 9 0 0.0%
Mazor group Limited industrials Main yes 8 1 12.5%
Mediclinic international plc health Care Main yes 15 1 6.7%
Merafe resources Limited Basic Materials Main yes 9 5 55.6%
Metair investments Limited Consumer goods
Main yes 10 4 40.0%
Metrofile holdings Limited industrials Main yes 12 4 33.3%
M-Fitec int Ltd Financials AltX yes 9 0 0.0%
Micromega holdings Limited industrials Main yes 9 2 22.2%
Mix telematics Limited industrials Main yes 10 0 0.0%
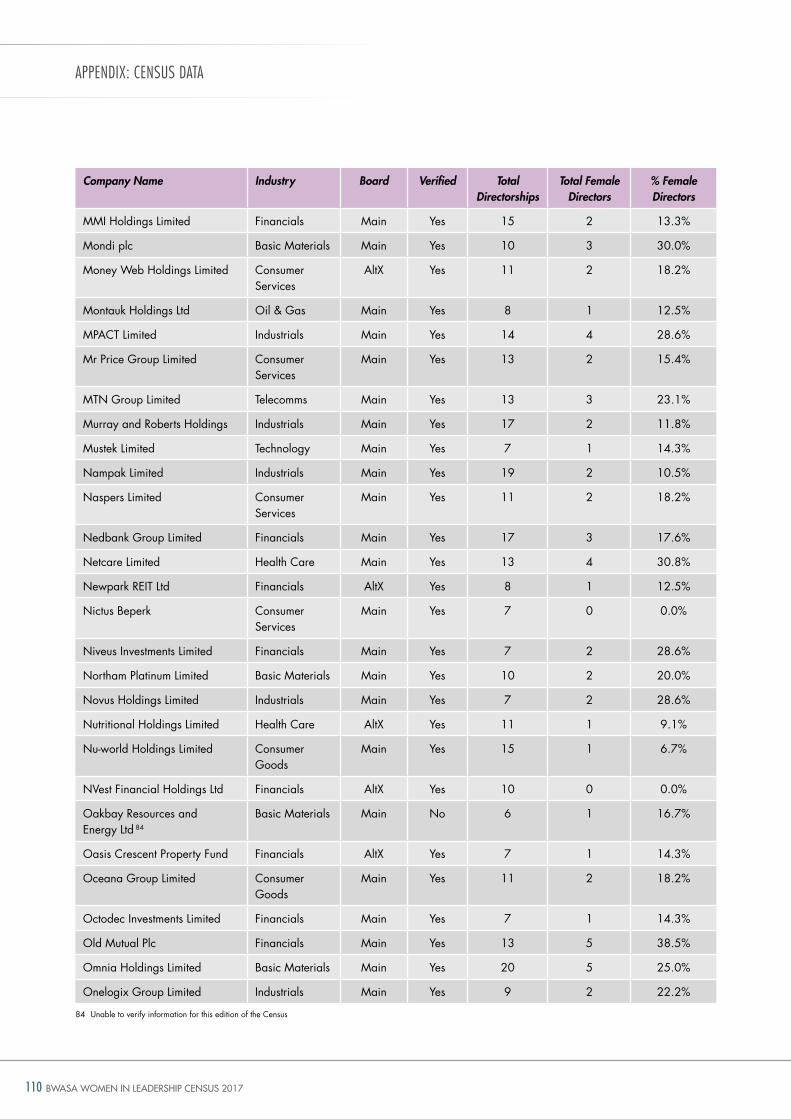
BWASA WOMEN IN LEADERSHIP CENSUS 2017110
aPPeNDIx: CeNsUs DaTa
Company Name Industry Board Verified Total Directorships
Total Female Directors
% Female Directors
MMi holdings Limited Financials Main yes 15 2 13.3%
Mondi plc Basic Materials Main yes 10 3 30.0%
Money Web holdings Limited Consumer Services
AltX yes 11 2 18.2%
Montauk holdings Ltd oil & gas Main yes 8 1 12.5%
MPACt Limited industrials Main yes 14 4 28.6%
Mr Price group Limited Consumer Services
Main yes 13 2 15.4%
Mtn group Limited telecomms Main yes 13 3 23.1%
Murray and roberts holdings industrials Main yes 17 2 11.8%
Mustek Limited technology Main yes 7 1 14.3%
nampak Limited industrials Main yes 19 2 10.5%
naspers Limited Consumer Services
Main yes 11 2 18.2%
nedbank group Limited Financials Main yes 17 3 17.6%
netcare Limited health Care Main yes 13 4 30.8%
newpark rEit Ltd Financials AltX yes 8 1 12.5%
nictus Beperk Consumer Services
Main yes 7 0 0.0%
niveus investments Limited Financials Main yes 7 2 28.6%
northam Platinum Limited Basic Materials Main yes 10 2 20.0%
novus holdings Limited industrials Main yes 7 2 28.6%
nutritional holdings Limited health Care AltX yes 11 1 9.1%
nu-world holdings Limited Consumer goods
Main yes 15 1 6.7%
nVest Financial holdings Ltd Financials AltX yes 10 0 0.0%
oakbay resources and Energy Ltd 84
Basic Materials Main no 6 1 16.7%
oasis Crescent Property Fund Financials AltX yes 7 1 14.3%
oceana group Limited Consumer goods
Main yes 11 2 18.2%
octodec investments Limited Financials Main yes 7 1 14.3%
old Mutual Plc Financials Main yes 13 5 38.5%
omnia holdings Limited Basic Materials Main yes 20 5 25.0%
onelogix group Limited industrials Main yes 9 2 22.2%
84 unable to verify information for this edition of the Census
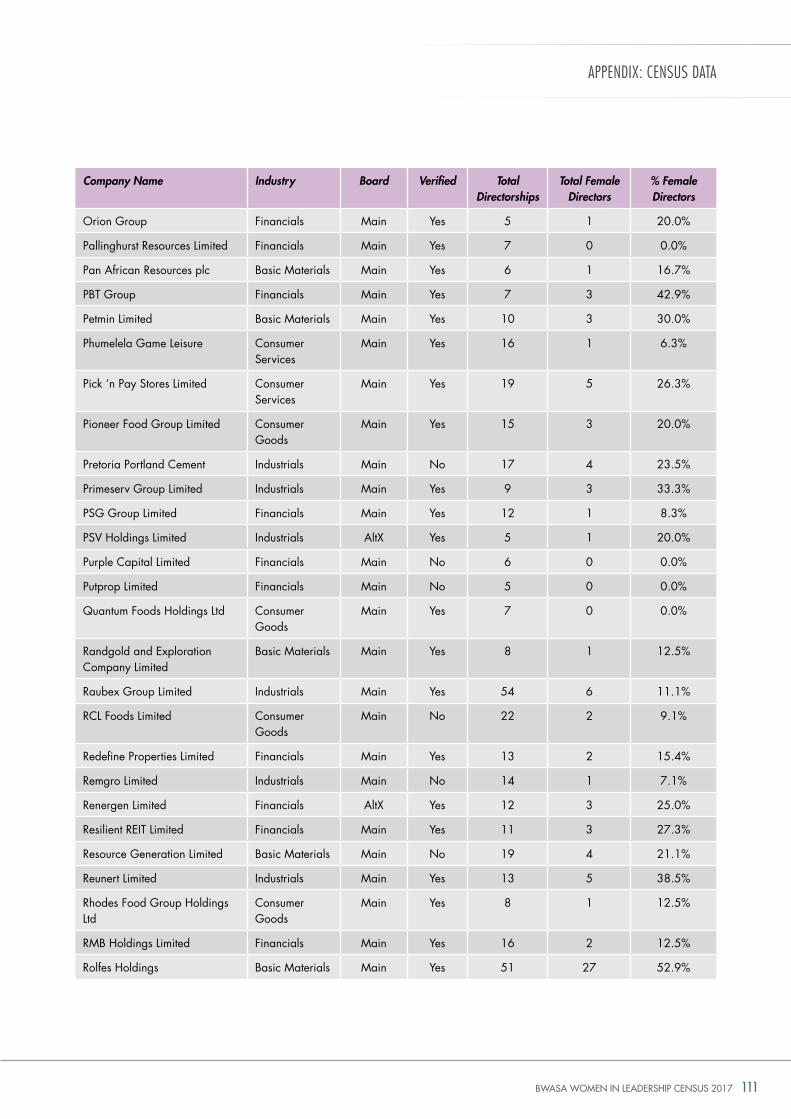
BWASA WOMEN IN LEADERSHIP CENSUS 2017 111
aPPeNDIx: CeNsUs DaTa
Company Name Industry Board Verified Total Directorships
Total Female Directors
% Female Directors
orion group Financials Main yes 5 1 20.0%
Pallinghurst resources Limited Financials Main yes 7 0 0.0%
Pan African resources plc Basic Materials Main yes 6 1 16.7%
PBt group Financials Main yes 7 3 42.9%
Petmin Limited Basic Materials Main yes 10 3 30.0%
Phumelela game Leisure Consumer Services
Main yes 16 1 6.3%
Pick ‘n Pay Stores Limited Consumer Services
Main yes 19 5 26.3%
Pioneer Food group Limited Consumer goods
Main yes 15 3 20.0%
Pretoria Portland Cement industrials Main no 17 4 23.5%
Primeserv group Limited industrials Main yes 9 3 33.3%
PSg group Limited Financials Main yes 12 1 8.3%
PSV holdings Limited industrials AltX yes 5 1 20.0%
Purple Capital Limited Financials Main no 6 0 0.0%
Putprop Limited Financials Main no 5 0 0.0%
Quantum Foods holdings Ltd Consumer goods
Main yes 7 0 0.0%
randgold and Exploration Company Limited
Basic Materials Main yes 8 1 12.5%
raubex group Limited industrials Main yes 54 6 11.1%
rCL Foods Limited Consumer goods
Main no 22 2 9.1%
redefine Properties Limited Financials Main yes 13 2 15.4%
remgro Limited industrials Main no 14 1 7.1%
renergen Limited Financials AltX yes 12 3 25.0%
resilient rEit Limited Financials Main yes 11 3 27.3%
resource generation Limited Basic Materials Main no 19 4 21.1%
reunert Limited industrials Main yes 13 5 38.5%
rhodes Food group holdings Ltd
Consumer goods
Main yes 8 1 12.5%
rMB holdings Limited Financials Main yes 16 2 12.5%
rolfes holdings Basic Materials Main yes 51 27 52.9%
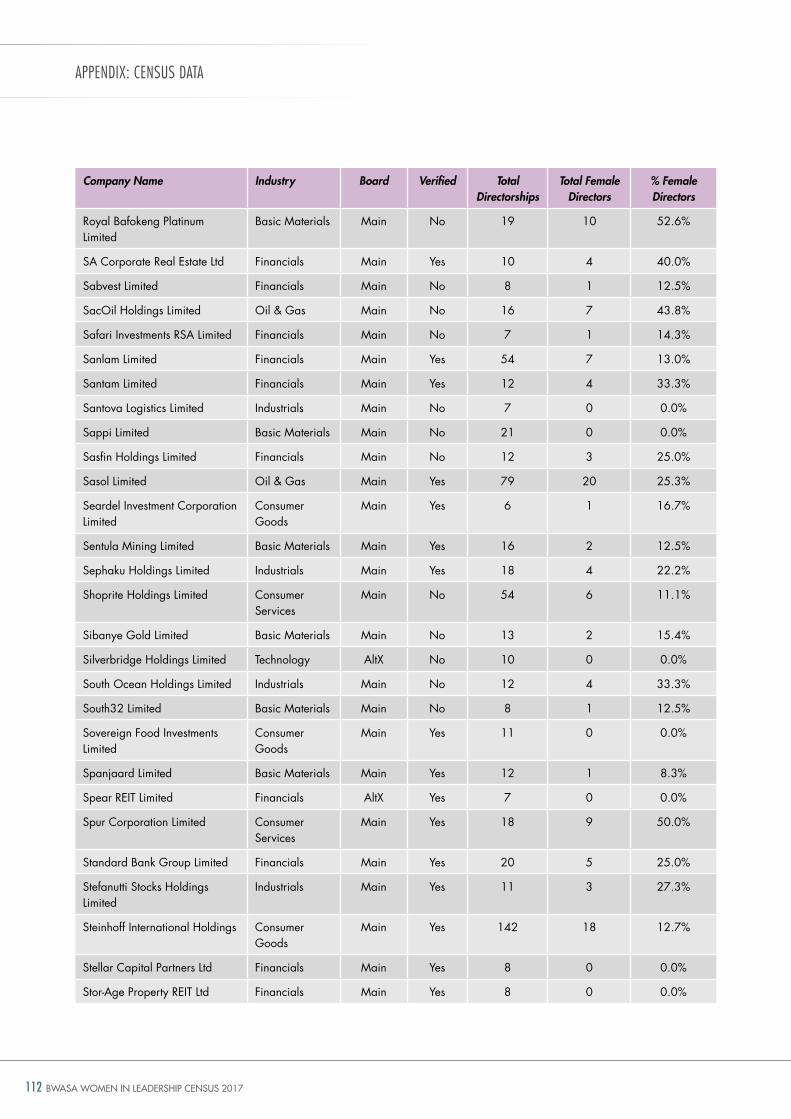
BWASA WOMEN IN LEADERSHIP CENSUS 2017112
aPPeNDIx: CeNsUs DaTa
Company Name Industry Board Verified Total Directorships
Total Female Directors
% Female Directors
royal Bafokeng Platinum Limited
Basic Materials Main no 19 10 52.6%
SA Corporate real Estate Ltd Financials Main yes 10 4 40.0%
Sabvest Limited Financials Main no 8 1 12.5%
Sacoil holdings Limited oil & gas Main no 16 7 43.8%
Safari investments rSA Limited Financials Main no 7 1 14.3%
Sanlam Limited Financials Main yes 54 7 13.0%
Santam Limited Financials Main yes 12 4 33.3%
Santova Logistics Limited industrials Main no 7 0 0.0%
Sappi Limited Basic Materials Main no 21 0 0.0%
Sasfin holdings Limited Financials Main no 12 3 25.0%
Sasol Limited oil & gas Main yes 79 20 25.3%
Seardel investment Corporation Limited
Consumer goods
Main yes 6 1 16.7%
Sentula Mining Limited Basic Materials Main yes 16 2 12.5%
Sephaku holdings Limited industrials Main yes 18 4 22.2%
Shoprite holdings Limited Consumer Services
Main no 54 6 11.1%
Sibanye gold Limited Basic Materials Main no 13 2 15.4%
Silverbridge holdings Limited technology AltX no 10 0 0.0%
South ocean holdings Limited industrials Main no 12 4 33.3%
South32 Limited Basic Materials Main no 8 1 12.5%
Sovereign Food investments Limited
Consumer goods
Main yes 11 0 0.0%
Spanjaard Limited Basic Materials Main yes 12 1 8.3%
Spear rEit Limited Financials AltX yes 7 0 0.0%
Spur Corporation Limited Consumer Services
Main yes 18 9 50.0%
Standard Bank group Limited Financials Main yes 20 5 25.0%
Stefanutti Stocks holdings Limited
industrials Main yes 11 3 27.3%
Steinhoff international holdings Consumer goods
Main yes 142 18 12.7%
Stellar Capital Partners Ltd Financials Main yes 8 0 0.0%
Stor-Age Property rEit Ltd Financials Main yes 8 0 0.0%
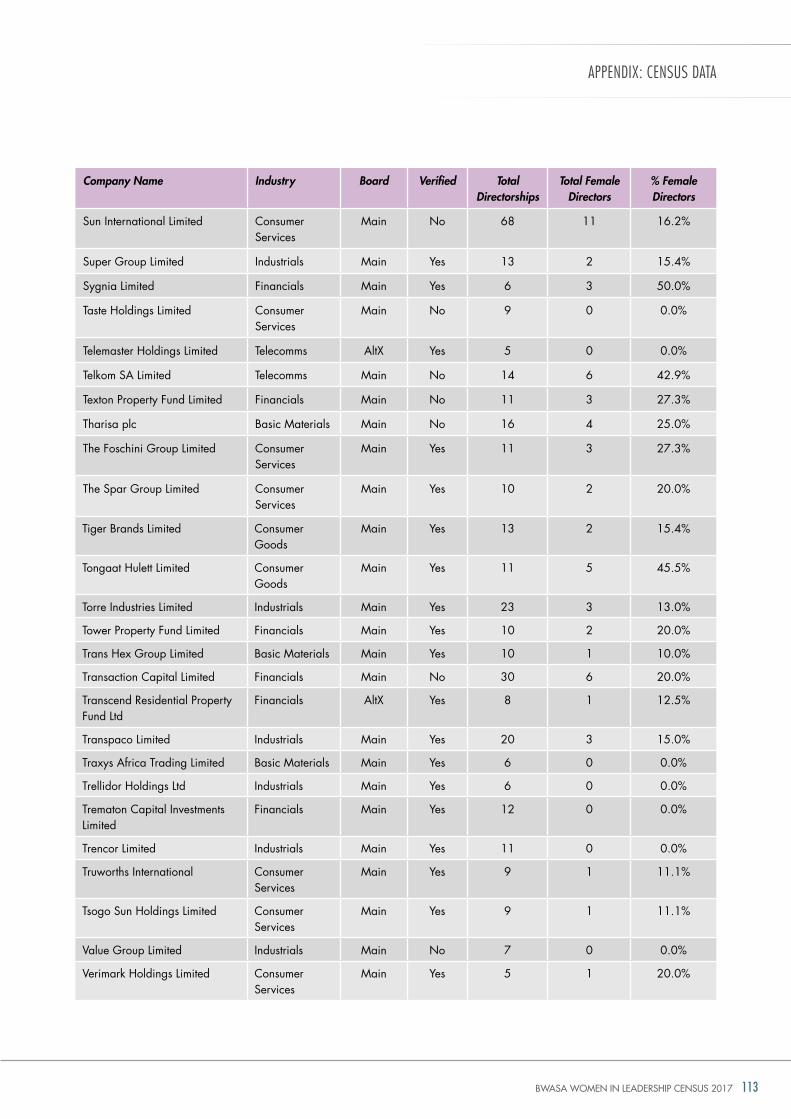
BWASA WOMEN IN LEADERSHIP CENSUS 2017 113
aPPeNDIx: CeNsUs DaTa
Company Name Industry Board Verified Total Directorships
Total Female Directors
% Female Directors
Sun international Limited Consumer Services
Main no 68 11 16.2%
Super group Limited industrials Main yes 13 2 15.4%
Sygnia Limited Financials Main yes 6 3 50.0%
taste holdings Limited Consumer Services
Main no 9 0 0.0%
telemaster holdings Limited telecomms AltX yes 5 0 0.0%
telkom SA Limited telecomms Main no 14 6 42.9%
texton Property Fund Limited Financials Main no 11 3 27.3%
tharisa plc Basic Materials Main no 16 4 25.0%
the Foschini group Limited Consumer Services
Main yes 11 3 27.3%
the Spar group Limited Consumer Services
Main yes 10 2 20.0%
tiger Brands Limited Consumer goods
Main yes 13 2 15.4%
tongaat hulett Limited Consumer goods
Main yes 11 5 45.5%
torre industries Limited industrials Main yes 23 3 13.0%
tower Property Fund Limited Financials Main yes 10 2 20.0%
trans hex group Limited Basic Materials Main yes 10 1 10.0%
transaction Capital Limited Financials Main no 30 6 20.0%
transcend residential Property Fund Ltd
Financials AltX yes 8 1 12.5%
transpaco Limited industrials Main yes 20 3 15.0%
traxys Africa trading Limited Basic Materials Main yes 6 0 0.0%
trellidor holdings Ltd industrials Main yes 6 0 0.0%
trematon Capital investments Limited
Financials Main yes 12 0 0.0%
trencor Limited industrials Main yes 11 0 0.0%
truworths international Consumer Services
Main yes 9 1 11.1%
tsogo Sun holdings Limited Consumer Services
Main yes 9 1 11.1%
Value group Limited industrials Main no 7 0 0.0%
Verimark holdings Limited Consumer Services
Main yes 5 1 20.0%
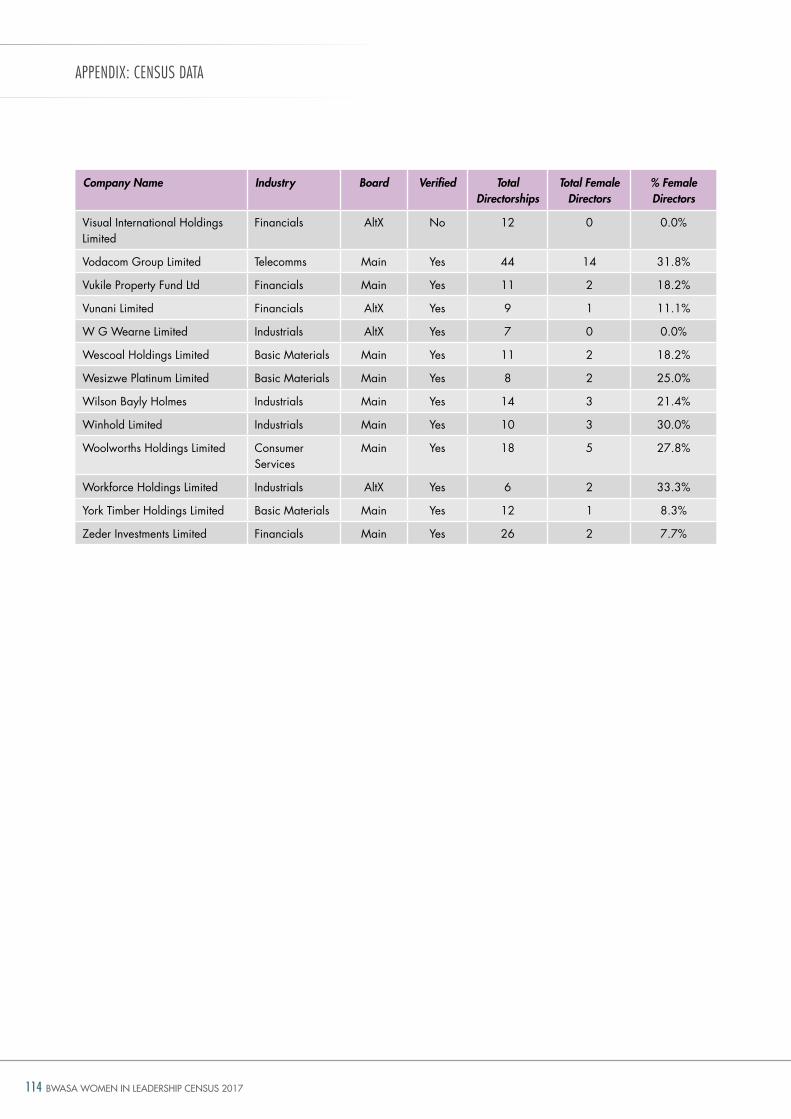
BWASA WOMEN IN LEADERSHIP CENSUS 2017114
aPPeNDIx: CeNsUs DaTa
Company Name Industry Board Verified Total Directorships
Total Female Directors
% Female Directors
Visual international holdings Limited
Financials AltX no 12 0 0.0%
Vodacom group Limited telecomms Main yes 44 14 31.8%
Vukile Property Fund Ltd Financials Main yes 11 2 18.2%
Vunani Limited Financials AltX yes 9 1 11.1%
W g Wearne Limited industrials AltX yes 7 0 0.0%
Wescoal holdings Limited Basic Materials Main yes 11 2 18.2%
Wesizwe Platinum Limited Basic Materials Main yes 8 2 25.0%
Wilson Bayly holmes industrials Main yes 14 3 21.4%
Winhold Limited industrials Main yes 10 3 30.0%
Woolworths holdings Limited Consumer Services
Main yes 18 5 27.8%
Workforce holdings Limited industrials AltX yes 6 2 33.3%
york timber holdings Limited Basic Materials Main yes 12 1 8.3%
Zeder investments Limited Financials Main yes 26 2 7.7%
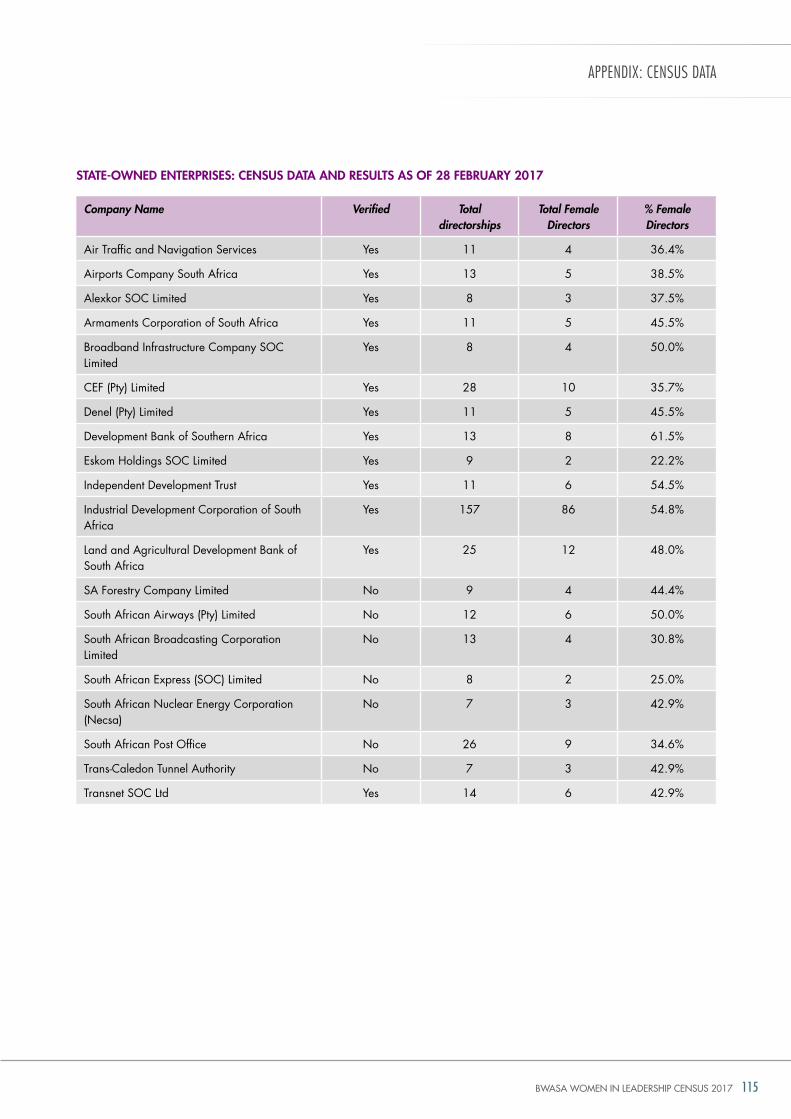
BWASA WOMEN IN LEADERSHIP CENSUS 2017 115
aPPeNDIx: CeNsUs DaTa
StatE-oWnEd EntErprISES: cEnSuS data and rESultS aS oF 28 FEBruarY 2017
Company Name Verified Total directorships
Total Female Directors
% Female Directors
Air traffic and navigation Services yes 11 4 36.4%
Airports Company South Africa yes 13 5 38.5%
Alexkor SoC Limited yes 8 3 37.5%
Armaments Corporation of South Africa yes 11 5 45.5%
Broadband infrastructure Company SoC Limited
yes 8 4 50.0%
CEF (Pty) Limited yes 28 10 35.7%
denel (Pty) Limited yes 11 5 45.5%
development Bank of Southern Africa yes 13 8 61.5%
Eskom holdings SoC Limited yes 9 2 22.2%
independent development trust yes 11 6 54.5%
industrial development Corporation of South Africa
yes 157 86 54.8%
Land and Agricultural development Bank of South Africa
yes 25 12 48.0%
SA Forestry Company Limited no 9 4 44.4%
South African Airways (Pty) Limited no 12 6 50.0%
South African Broadcasting Corporation Limited
no 13 4 30.8%
South African Express (SoC) Limited no 8 2 25.0%
South African nuclear Energy Corporation (necsa)
no 7 3 42.9%
South African Post office no 26 9 34.6%
trans-Caledon tunnel Authority no 7 3 42.9%
transnet SoC Ltd yes 14 6 42.9%
BWASA WOMEN IN LEADERSHIP CENSUS 2017116
ReFeReNCes
reFerenCesBloomberg. (2017). Millions of Manufacturing Jobs Could go unfilled. [online]. Available: https://www.bloomberg.com/news/articles/2017-03-16/millions-of-manufacturing-jobs-could-go-unfilled
centre for constitutional rights. (2013). An analysis: the Women Empowerment and gender Equality Bill. [online]: http://www.cfcr.org.za/index.php/latest/264-article-an-analysis-the-women-empowerment-and-gender-equality-bill
centre for Higher Education trust. (2016). open data. [online]. Available: https://chet.org.za/data/sahe-open-data
council on Higher Education. (2016). higher Education data. [online]. Available: http://www.che.ac.za/focus_areas/higher_education_data
credit Suisse research Institute. (2016). gender 3000: the reward for Change. [online]. Available: https://www.credit-suisse.com/corporate/en/media/news/articles/media-releases/2016/09/en/csri-gender-3000.html
deloitte. (2017a). African trends going into 2017: how business needs to plan for a changing continent. March 2017. [online]. Available: https://www2.deloitte.com/za/en/pages/deloitte-africa/articles/african-trends-going-into-2017.html
deloitte. (2017b). Women in manufacturing: stepping up to make an impact that matters. [online]. Available: https://www2.deloitte.com/content/dam/Deloitte/us/Documents/manufacturing/us-manu-women-in-manufacturing.pdf
deloitte. (2017c). Women in the Boardroom 5th edition – A global Perspective. [online]. Available: https://www2.deloitte.com/global/en/pages/risk/articles/women-in-the-boardroom5th-edition.html
dpSa. (2016). Employment Equity report. [online]. Available: http://www.dpsa.gov.za/dpsa2g/documents/ee/2016/Employment%20Equity%20report%202015%202016.pdf
Financial Mail. (2017). deloitte Advertorial: our transformation journey continues. June 2017 [online]. Available: https://www2.deloitte.com/content/dam/Deloitte/za/Documents/about-deloitte/za_tranformation_advert_fm_june2017.pdf
Financial times. (2017a). Management’s missing women. [online]. Available: https://www.ft.com/management-women
Financial times. (2017b). Corporate scandals demand boardroom shake-up. 14 April 2017. [online]. Available: https://www.ft.com/content/570b60b2-1ece-11e7-b7d3-163f5a7f229c
Grant thornton. (2017). Women in business: new perspectives on risk and reward. March 2017. [online]. Available: https://www.grantthornton.global/globalassets/1.-member-firms/global/insights/article-pdfs/2017/grant-thornton_women-in-business_2017-report.pdf
Industrial development corporation. (2017). Economic trends: Key trends in the South African economy. March 2017. [online]. Available: https://www.idc.co.za/images/2017/IDC_RI_publication_Key-trends- in-SA-economy_31-March-2017.pdf
Institute of directors of Southern africa. (2016). King iV report on Corporate governance for South Africa 2016.
international Corporate governance network. (2015). iCgn guidance on gender diversity on Boards. [online]. Available: https://www.icgn.org/sites/default/files/ICGN_Gender-Diversity_2015.pdf
International labour organisation. (2015). Statistics and databases. [online]. Available: http://www.ilo.org/global/statistics-and-databases/lang--en/index.htm
International Monetary Fund. (2017). WEo April 2017. [online]. Available: http://www.imf.org/en/Publications/WEO/Issues/2017/04/04/world-economic-outlook-april-2017
Jenkins. (2017). Addressing the gender pay gap makes good business sense. 3 April 2017. Financial times. [online]. Available: https://www.ft.com/content/1b410258-185c-11e7-a53d-df09f373be87
kramer, V. W., konrad, a. M., and Erkut, S. (2006). Critical Mass on Corporate Boards: Why three or More Women Enhance governance. research & Action report Fall/Winter 2006
BWASA WOMEN IN LEADERSHIP CENSUS 2017 117
ReFeReNCes
law Society of South africa. (2016). Annual report 2016/2017. [online]. Available: http://www.lssa.org.za/upload/LSSA%20Annual%20report%202016%20to%202017.pdf
law Society of South africa. (2017). Statistics. [online]. Available: http://www.lssa.org.za/about-us/about-the-attorneys--profession/statistics-for-the-attorneys--profession
lexisnexis. (2016). Attorneys’ Profession in South Africa: 2016 review. [online]. Available: http://www.lssa.org.za/about-us/about-the-attorneys--profession/lssa-lexisnexis-review-of-the-attorneys--profession-2016
Magau, n. and Edinger, H. (2016). An Economically Prosperous Africa requires the Full Economic Participation of Women. [online]. Available: https://www.empowerwomen.org/en/community/stories/2016/12/an-economically-prosperous-africa
Mans-kemp, n., and Viviers, S. (2017). Women in the boardroom: the right and the bright thing to do. March 2017. [online]. Available: http://www.fin24.com/Opinion/women-in-the-boardroom-the-right-and-the-bright-thing-to-do-20170307
Mckinsey. (2016). Women in the Workplace. [online]. Available: http://www.mckinsey.com/business-functions/organization/our-insights/women-in-the-workplace-2016
Meta Economic development organisation. (2016). Women in StEM for Africa. [online]. Available: https://medo.site/2199-2/
MSCi, (2016). the tipping point: women on boards and financial performance: women on boards report 2016. december 2016. [online]. Available: https://www.msci.com/documents/10199/fd1f8228-cc07-4789-acee-3f9ed97ee8bb
MScI. (2015). Women on Boards: global trends in gender diversity on Corporate Boards. MSCi research insights. [online]. Available: https://www.msci.com/www/research-paper/research-insight-women-on/0263428390
national treasury. (2017). Estimates of national Expenditure. [online]. Available: http://www.treasury.gov.za/documents/national%20budget/2017/ene/FullENE.pdf
peterson Institute for International Economics. (2016). is gender diversity Profitable? Evidence from a global Survey. Peterson institute for international Economics. [online]. Available: https://piie.com/publications/wp/wp16-3.pdf
SaIca. (2016). Annual integrated report 2016. [online]. Available: https://www.saica.co.za/About/SAICAAnnualReport/tabid/1219/language/en-ZA/Default.aspx
Stats Sa. (2017). Quarterly Labour Force Survey Q1 2017. [online]. Available: http://www.statssa.gov.za/publications/P0211/P02111stQuarter2017.pdf
Sustainable Stock Exchanges Initiative. (2017). how stock exchanges can advance gender equality. [online]. Available: https://www.unpri.org/press-releases/stock-exchanges-among-the-leaders-in-addressing-gender-equality
the Guardian. (2017). iceland to enshrine equal pay for women and men in law. [online]. Available: https://www.theguardian.com/world/2017/apr/05/iceland-equal-pay-women-men-law
Who owns Whom. (2016). higher Educations institutions database.
World Bank. (2016). Women, Business and the Law 2016: getting to Equal. [online]. Available: http://wbl.worldbank.org/
World Bank. (2001). Engendering development. [online]. Available: http://siteresources.worldbank.org/PGLP/Resources/Engendering_Development.pdf
World Economic Forum. (2016). global gender gap report 2016. [online]. Available: Available: http://www3.weforum.org/docs/GGGR16/WEF_Global_Gender_Gap_Report_2016.pdf
BWASA WOMEN IN LEADERSHIP CENSUS 2017118
over many decades, the united nations has made significant progress in advancing gender
equality, including through landmark agreements such as the Beijing declaration and Platform for Action and the Convention on the Elimination of All Forms of discrimination against Women (CEdAW).
gender equality is not only a basic human right, but its achievement has enormous socio-economic ramifications. Empowering women fuels thriving economies, spurring productivity and growth. yet gender inequalities remain deeply entrenched in every society. Women are under-represented in leadership and decision making roles.
the theme for the 2017 international Women’s day is “Be bold for change”, a call on all global citizens to help forge a more inclusive, gender equal world by taking ground-breaking action that truly drives the greatest change for women.
Accordingly, as a result to the commitment to ensure Power to the Women, the Eskom Women Advancement Programme (EWAP) was launched in 2014. the Programme is a holistic approach aimed at “breaking the mould” that is based on perceptions about women that perpetuate mis representation of women in leadership roles and technical roles.
they face occupational segregation and the gender wage gap continues to widen.
Women in all parts of the world are prone to being sexually harassed by their male counterparts let alone suffer violence and discrimination. the consequences to these challenges are increased absenteeism, reduced efficiency, costs associated with recruit-ment and training on resignation as well as damage to image in the market.
too often, those marginalised women are also those without hope. that is not the promise we have made to the people of our country. our promise is an inclusive, non-sexist and non-discriminatory society, where all citizens enjoys a better life.
esKoM’s woMen eMPowerMent
JourneyAmongst many factors enshrined in our Constitution is a provision that obliges the State to take reasonable legislative and other measures,
within its available resources, to eliminate inequality and any forms of discrimination against women.
the programme seeks to make deliberate and considered interventions to advance and deploy women in Eskom. What is most important is that the purpose of this programme is to create an environment conducive to unleashing women’s full potential in Eskom, a potential that has been constrained and stifled in the past; a potential that can benefit Eskom, in particular, and society, in general.
EWAP is organised around five streams, namely Women in Leadership, Women in technical roles, Women in nuclear, Creating a Conducive Environment, as well as Partnerships. A five-year project plan has been developed to monitor interventions in each stream. Embedded in the plan are flagship projects aimed at creating a conducive environment for women to equally participate without discrimination.
what is the eskom women Advancement Programme?
the purpose of the EWAP is to rewrite the story of how both men and women view women and their role in society and in the work environment.
EWap
tarGEt poSItIonS
IdEntIFY/ attract
dEploY adVancE
dEVElop
BWASA WOMEN IN LEADERSHIP CENSUS 2017 119
“Walking with a friend in the dark is better than walking alone in the light... Alone we can do so little; together we can do so much.” – hELEn KELLEr
•Governance: A national EWAP Steering committee has been established to provide strategic direction and monitor implementation of the programme. to inculcate a culture of ownership and participation regional, divisional and Business unit EWAP SteerCos have been established.
•Budget: there is a dedicated budget allocated for the rollout of the EWAP strategy.
•Gender office: EWAP is in the process of establishing a gender office in partnership with the university of the Witwatersrand gender office. it is envisaged that the office will operate as a nodal point for policy and strategy development and support to women in dealing with any form of discrimination including sexual harassment.
•Gender Equalisation plan: Eskom has developed an ambitious gender Equalisation Plan to ensure that there is gender parity in the organisation by 2020. during March 2017, Eskom saw ground-breaking transformation by appointing 41 females in Senior Management roles. group hr and the transformation team play critical roles to ensure that gender parity is achieved at Professional and Middle Management level.
•online Mentorship Model: the introduction of an online mentorship and coaching programme through EWAP is an added activity on the traditional approach, aimed at broadening the channel for social capital within the work environment. E-mentoring and coaching are computer-mediated mutually beneficial relationships between a mentor/coach and a protégé, which provide learning, advise, encouragement, promoting and modelling that is often without boundaries, egalitarian and qualitatively different from traditional face-to-face mentoring. this can be accessed on the EWAP website. the process focuses on women leaders who are willing to be mentors and coaches and keen to develop the next generation of leaders by giving beginning and mid-stage female leaders the opportunity to learn from their successes as experienced leaders. E-mentoring and Coaching incorporates both web-based, email-based and face-to-face mentorship models.
•round table discussions: the purpose of the round table discussions is to engage women on pertinent issues affecting them and to explore possible innovative interventions of taking EWAP to the next level. the round table discussions are centre-led but deployed at regional levels in partnership with various stakeholders like the Commission for gender Equality.
•Eskom Women‘s book: the historic launch of the book titled “Eskom transformation Journey: A nickel of democracy” by the honourable Minister, Lynn Brown is one of the greatest milestones for the emancipation of women in Eskom. the book showcases the strides made by the organisation in advancing and empowering women. the journey continues as women forge ahead to break the mould and transform the landscape of Eskom.
• Japan International cooperation agency (JIca): through the partnership with the Japan international Cooperation Agency, EWAP deployed two engineers to study for Master’s degree in Japan at no costs.
•Human resources policies: organisations leading the way in workplace have in place policies that specifically support gender equality. A number of human resources policies and procedures at Eskom were reviewed and aligned to be gender sensitive. these include policies and procedures relating to further study; recognition of prior learning; skills and knowledge transfer; workplace skills training; talent management; succession management; recruitment and selection; and sexual harassment.
•Sexual Harassment Strategy: Sexual harassment is the most heinous misconduct that plagues a workplace. in terms of the Employment Equity Act, no 55 of 1998 (EEA) harassment of an employee is a form of unfair discrimination and is prohibited. through EWAP an analysis of the extend of sexual harassment in Eskom has been conducted and an intervention strategy was developed and is currently being rolled out.
•Strategic alliances: during the reporting period, EWAP entered into the following value adding strategic alliances.
what gains have been realised through the programme since its inception?
Whilst Eskom has made strides in the development and advancement of women in both technical and leadership roles, the harsh realities of under-representation still persist. Statistics indicate that Eskom is far below
achieving the 50% target set by the united nations as part of the Sustainable development goals by 2030. Females represent 33% of the total employee compliment, whilst males are at 67%. Since its inception,
the programme has realised a number of achievements through the following initiatives:
aDveRTORIal
BWASA WOMEN IN LEADERSHIP CENSUS 2017120
orGanISatIondEScrIptIon oF
partnEr orGanISatIonValuE to ESkoM
department of Women in the presidency
Custodian of gender Equity and mainstreaming in South Africa
• Provides strategic direction and leadership on gender mainstreaming
• Provides a networking platform for Eskom with other employers.
commission for Gender Equality
Chapter 9 institution • Performs oversight function on gender equity and mainstreaming
• Provides expert advice on EWAP
• Facilitated round table discussions at no costs to Eskom through its public education department.
Japan International cooperation agency
development assistance organisation that promotes international cooperation, by supporting socio-economic development and recovery or economic stability of developing regions.
• Provides opportunities for young and eligible Africans to study postgraduate degrees at Japanese universities
• Provides internships at Japanese enterprises in order to develop effective skills and knowledge in various fields for contributing to the development of industries in Africa
• two guardians have commenced with their studies during September 2016 at no costs to Eskom
• the 2018 intake will commence in August 2017 with both male and female guardians afforded an opportunity to apply.
deloitte
Professional services firm providing services in areas of consulting, auditing, tax, financial advisory and risks.
• Compiled and provided guidance with regards to the design of the “Eskom Journey: A nickel of democracy” at no cost to Eskom, published in 2015.
Businesswomen’s association of South africa
Association of professional and businesswomen.
• Provides a platform through on-going events and opportunities to advance the interests and needs of women, through its networks and strategic partnerships with other non-profit organisations, leading companies, organisations and business schools.
rising Star programme
recognises, celebrates and connect young talented people who have a capacity for achievement and success and who contribute in an inspirational manner to the future of South Africa.
• Provides an opportunity for Eskom to establish a living community of young African talent that will be mentored and provided with platforms for development and communication, therefore enabling them to become role models, opinion leaders and the inspiration for other future African talent.
esKoM’s woMen eMPowerMent
Journey

Published by: Brighton Wealth Subsaharan (Pty) Limited
IN PARTNERSHIP WITH:
The BWASA is the largest and most prominent association of business and professional women in South Africa
and a dynamic forum that inspires and develops women in business.
For more inFormation, or to join the BWaSa, viSit www.bwasa.co.za
national oFFice
address: Ground Floor, KPMG Crescent, 85 Empire Road, Parktown, Johannesburg 2193
tel: 011 484 4945 • email: [email protected]