Embed Size (px)
Citation preview
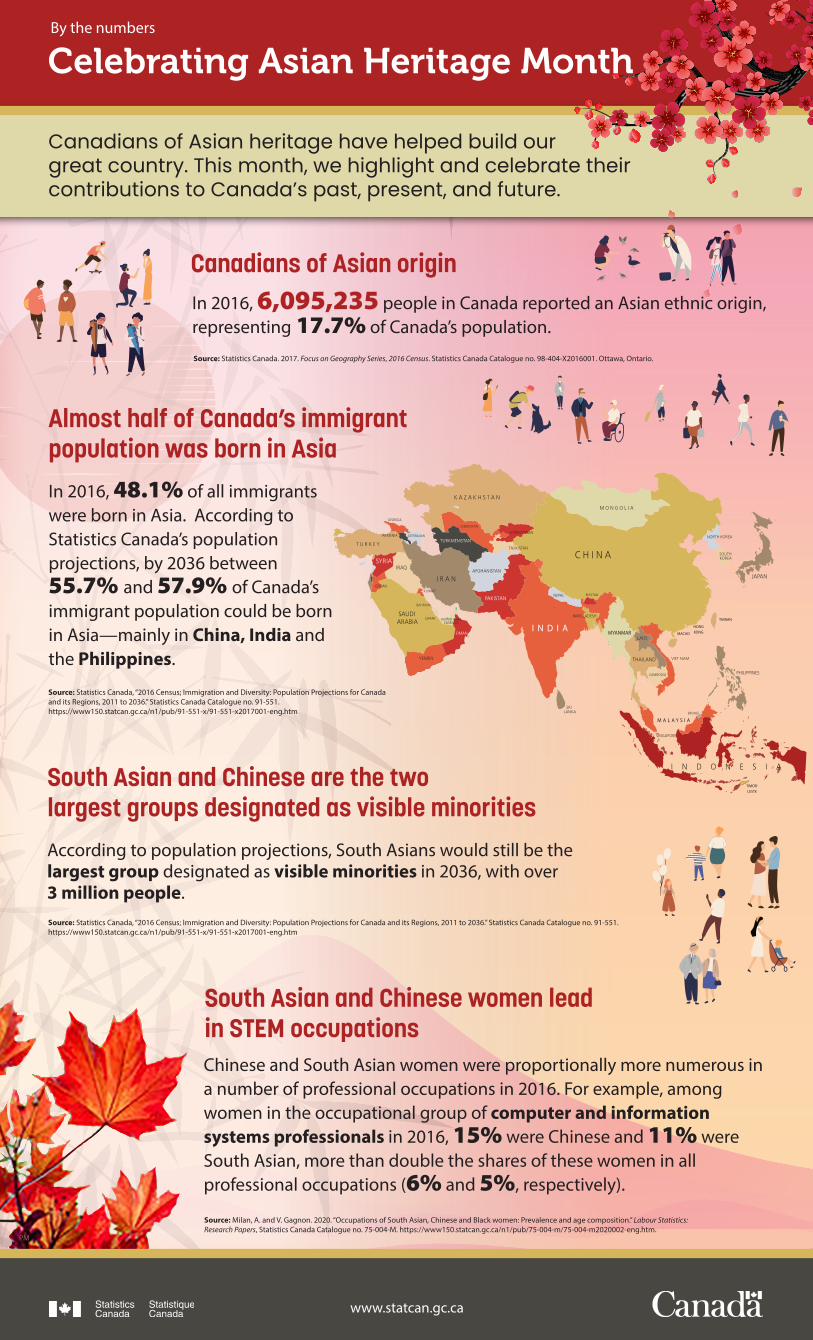
Almost half of Canada’s immigrant population was born in Asia
In 2016, 6,095,235 people in Canada reported an Asian ethnic origin, representing 17.7% of Canada’s population.
In 2016, 48.1% of all immigrants were born in Asia. According to Statistics Canada’s population projections, by 2036 between 55.7% and 57.9% of Canada’s immigrant population could be born in Asia—mainly in China, India and the Philippines.
According to population projections, South Asians would still be the largest group designated as visible minorities in 2036, with over 3 million people.
Chinese and South Asian women were proportionally more numerous in a number of professional occupations in 2016. For example, among women in the occupational group of computer and information systems professionals in 2016, 15% were Chinese and 11% were South Asian, more than double the shares of these women in all professional occupations (6% and 5%, respectively).
Canadians of Asian origin
Canadians of Asian heritage have helped build our great country. This month, we highlight and celebrate their contributions to Canada’s past, present, and future.
By the numbers
Source: Statistics Canada. 2017. Focus on Geography Series, 2016 Census. Statistics Canada Catalogue no. 98-404-X2016001. Ottawa, Ontario.
Source: Statistics Canada, “2016 Census; Immigration and Diversity: Population Projections for Canada and its Regions, 2011 to 2036.” Statistics Canada Catalogue no. 91-551.https://www150.statcan.gc.ca/n1/pub/91-551-x/91-551-x2017001-eng.htm
Source: Milan, A. and V. Gagnon. 2020. “Occupations of South Asian, Chinese and Black women: Prevalence and age composition.” Labour Statistics: Research Papers, Statistics Canada Catalogue no. 75-004-M. https://www150.statcan.gc.ca/n1/pub/75-004-m/75-004-m2020002-eng.htm.
South Asian and Chinese women lead in STEM occupations
South Asian and Chinese are the two largest groups designated as visible minorities
www.statcan.gc.ca
MYANMAR MACAOI N D I A HONG
KONG
TIMOR-LESTE
M A L A Y S I A
TAIWAN
PM
Celebrating Asian Heritage Month
Source: Statistics Canada, “2016 Census; Immigration and Diversity: Population Projections for Canada and its Regions, 2011 to 2036.” Statistics Canada Catalogue no. 91-551.https://www150.statcan.gc.ca/n1/pub/91-551-x/91-551-x2017001-eng.htm