Embed Size (px)
Citation preview
Thioesterase-mediated control of cellularcalcium homeostasis enables hepatic ER stress
Baran A. Ersoy, … , Ipek Alpertunga, David E. Cohen
J Clin Invest. 2018;128(1):141-156. https://doi.org/10.1172/JCI93123.
The incorporation of excess saturated free fatty acids (SFAs) into membrane phospholipidswithin the ER promotes ER stress, insulin resistance, and hepatic gluconeogenesis.Thioesterase superfamily member 2 (Them2) is a mitochondria-associated long-chain fattyacyl-CoA thioesterase that is activated upon binding phosphatidylcholine transfer protein(PC-TP). Under fasting conditions, the Them2/PC-TP complex directs saturated fatty acyl-CoA toward b-oxidation. Here, we showed that during either chronic overnutrition or acuteinduction of ER stress, Them2 and PC-TP play critical roles in trafficking SFAs into theglycerolipid biosynthetic pathway to form saturated phospholipids, which ultimately reduceER membrane fluidity. The Them2/PC-TP complex activated ER stress pathways byenhancing translocon-mediated efflux of ER calcium. The increased cytosolic calcium, inturn, led to the phosphorylation of calcium/calmodulin-dependent protein kinase II, whichpromoted both hepatic insulin resistance and gluconeogenesis. These findings delineate amechanistic link between obesity and insulin resistance and establish the Them2/PC-TPcomplex as an attractive target for the management of hepatic steatosis and insulinresistance.
Research Article Cell biology Metabolism
Find the latest version:
http://jci.me/93123/pdf
The Journal of Clinical Investigation R E S E A R C H A R T I C L E
1 4 1jci.org Volume 128 Number 1 January 2018
IntroductionHepatic lipotoxicity due to saturated free fatty acids (SFAs) is a key contributor to the insulin resistance and excess hepatic glucose production associated with type 2 diabetes mellitus (1–3). SFAs are rapidly incorporated into ER membrane phospholipids (4, 5), the fatty acid composition of which is dynamic and dependent on nutritional status. Phospholipids containing saturated fatty acyl chains promote ER stress (5), at least in part by increasing calcium efflux from the ER lumen (4). If unresolved, ongoing ER stress pro-motes insulin resistance and excess hepatic gluconeogenesis (6).
Plasma nonesterified fatty acids (NEFAs) originating from the diet or adipose tissue stores are taken up by the liver or are syn-thesized de novo by well-described, transcriptionally regulated pathways (7, 8). Within the liver, NEFAs are esterified to form fatty acyl-CoA molecules, the metabolic fates of which depend on their intracellular trafficking controlled by compartmentalized hydrolysis and re-esterification by long-chain acyl-CoA thioes-terases (Acots) and synthetases (ACSLs), respectively (9–11). For example, mitochondria-associated ACSL1 directs fatty acyl-CoAs toward either β-oxidation or glycerolipid biosynthesis, depending on metabolic conditions within the hepatocyte (11, 12).
We have identified thioesterase superfamily member 2 (Them2; synonym Acot13) as a protein that interacts with phos-phatidylcholine transfer protein (PC-TP; synonym StARD2) (13). Them2 associates with mitochondria and exhibits substrate spec-ificity for long-chain saturated fatty acyl-CoA (e.g., myristoyl-CoA and palmitoyl-CoA) (14, 15). PC-TP comprises a single lipid-binding domain with high specificity for phosphatidylcholines
(PCs), particularly those containing more unsaturated fatty acyl chains (13). Binding of PCs to PC-TP promotes its interaction with Them2 (16), which in turn increases thioesterase activity (13). Mice lacking either Them2 (Them2–/–) or PC-TP (Pctp–/–) exhibit altered fatty acid metabolism (15, 17, 18). In keeping with a prima-ry role in SFA trafficking, the Them2/PC-TP complex promotes β-oxidation of exogenous NEFAs in cultured mouse hepatocytes under fasting conditions (19).
The genetic ablation of Them2 or PC-TP also increases hepat-ic insulin sensitivity and protects against high-fat diet–induced increases in hepatic glucose production by incompletely under-stood mechanisms (15, 17). We have postulated that this com-plex channels fatty acids to glycerol-phosphate acyl transferase 1 (GPAT1), a mitochondria-associated enzyme that represents the rate-controlling step in glycerolipid synthesis, including ER mem-brane phospholipids (20). Our current findings demonstrate that, by promoting the incorporation of SFAs into ER membrane phos-pholipids, the Them2/PC-TP complex reduces membrane fluid-ity, increases calcium efflux through translocons within the ER membrane, and activates ER stress pathways that promote insulin resistance and excess hepatic glucose production.
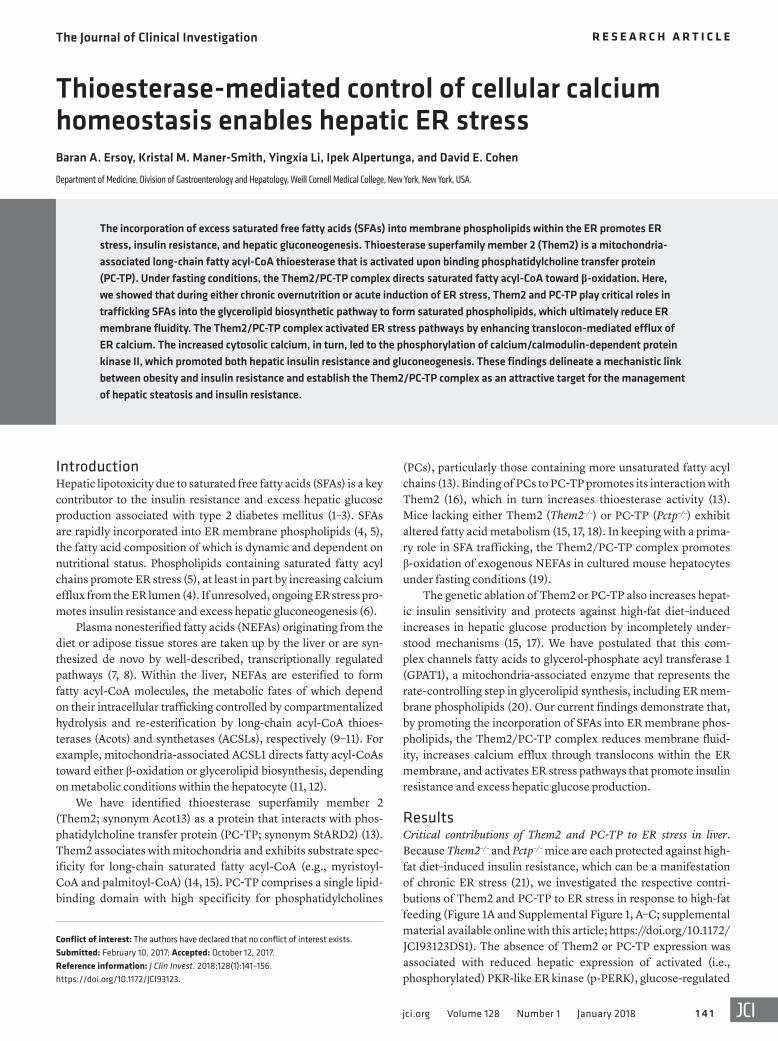
ResultsCritical contributions of Them2 and PC-TP to ER stress in liver. Because Them2–/– and Pctp–/– mice are each protected against high-fat diet–induced insulin resistance, which can be a manifestation of chronic ER stress (21), we investigated the respective contri-butions of Them2 and PC-TP to ER stress in response to high-fat feeding (Figure 1A and Supplemental Figure 1, A–C; supplemental material available online with this article; https://doi.org/10.1172/JCI93123DS1). The absence of Them2 or PC-TP expression was associated with reduced hepatic expression of activated (i.e., phosphorylated) PKR-like ER kinase (p-PERK), glucose-regulated
The incorporation of excess saturated free fatty acids (SFAs) into membrane phospholipids within the ER promotes ER stress, insulin resistance, and hepatic gluconeogenesis. Thioesterase superfamily member 2 (Them2) is a mitochondria-associated long-chain fatty acyl-CoA thioesterase that is activated upon binding phosphatidylcholine transfer protein (PC-TP). Under fasting conditions, the Them2/PC-TP complex directs saturated fatty acyl-CoA toward β-oxidation. Here, we showed that during either chronic overnutrition or acute induction of ER stress, Them2 and PC-TP play critical roles in trafficking SFAs into the glycerolipid biosynthetic pathway to form saturated phospholipids, which ultimately reduce ER membrane fluidity. The Them2/PC-TP complex activated ER stress pathways by enhancing translocon-mediated efflux of ER calcium. The increased cytosolic calcium, in turn, led to the phosphorylation of calcium/calmodulin-dependent protein kinase II, which promoted both hepatic insulin resistance and gluconeogenesis. These findings delineate a mechanistic link between obesity and insulin resistance and establish the Them2/PC-TP complex as an attractive target for the management of hepatic steatosis and insulin resistance.
Thioesterase-mediated control of cellular calcium homeostasis enables hepatic ER stressBaran A. Ersoy, Kristal M. Maner-Smith, Yingxia Li, Ipek Alpertunga, and David E. Cohen
Department of Medicine, Division of Gastroenterology and Hepatology, Weill Cornell Medical College, New York, New York, USA.
Conflict of interest: The authors have declared that no conflict of interest exists.Submitted: February 10, 2017; Accepted: October 12, 2017.Reference information: J Clin Invest. 2018;128(1):141–156. https://doi.org/10.1172/JCI93123.
The Journal of Clinical Investigation R E S E A R C H A R T I C L E
1 4 2 jci.org Volume 128 Number 1 January 2018
The Journal of Clinical Investigation R E S E A R C H A R T I C L E
1 4 3jci.org Volume 128 Number 1 January 2018
both exhibited similarly rapid resolution of hepatic ER stress, we next tested whether refeeding might influence the interaction between Them2 and PC-TP. Indeed, more Them2 protein was coimmunoprecipitated with PC-TP within 1–3 hours of refeeding (Figure 1D). Them2–PC-TP interactions returned their fasting levels within 5 hours (Figure 1D).
To ensure that reductions in hepatic ER stress in Them2–/– and Pctp–/– mice were not simply attributable to improved glucose homeostasis (15, 17, 18), ER stress was also induced chemically by i.p. administration of tunicamycin, which inhibits protein gly-cosylation and promotes protein misfolding (21). Treatment of mice with tunicamycin led to body weight losses of 8.1% and 7% in Them2+/+ and Pctp+/+ mice, respectively (Figure 1, E and F). By contrast, Them2–/– and Pctp–/– mice sustained body weight losses of only 4.3% and 1.5%, respectively (Figure 1, E and F). Tunicamy-cin treatment tended to reduce glucose tolerance in WT but not in Them2–/– and Pctp–/– mice (Supplemental Figure 2A). Insulin sensi-tivity also tended to decrease following tunicamycin injections in WT and Pctp–/– mice but not in Them2–/– mice (Supplemental Figure 2B). The failure to reach statistical significance may have been due, at least in part, to substantial variations in body weight loss follow-ing tunicamycin treatment.
Whereas livers of Them2+/+ and Pctp+/+ mice appeared grossly pale, livers from tunicamycin-treated Them2–/– and Pctp–/– mice were indistinguishable from vehicle-treated WT controls (Figure 1G and Supplemental Figure 3). Histologically, large lipid drop-lets were evident in livers of WT, but not Them2–/– and Pctp–/– mice (Figure 1G). Tunicamycin treatment increased hepatic triglycer-ide concentrations, tended to increase NEFA concentrations, and increased cholesterol concentrations in the livers of Them2+/+, but not Them2–/– mice (Figure 1, H–J). Tunicamycin induced similar changes in the livers of Pctp+/+ mice, but in the absence of PC-TP expression, we observed only slight increases in these lipid concen-trations (Figure 1, K–M). Although NEFA concentrations tended to be higher in the livers of vehicle-treated Pctp–/– mice, tunicamycin treatment did not increase concentrations relative to vehicle treat-ment (Figure 1L). In keeping with the likelihood that lipid accumu-lation in WT mice was a consequence of ER stress, we observed increased levels of p-PERK, p-IRE1α, CHOP, cleaved ATF6, and Grp78 in the livers of tunicamycin-treated WT mice (Figure 1N). By contrast, the levels of these ER stress markers in the livers of tunicamycin-treated Them2–/– and Pctp–/– mice remained indistin-guishable from those of vehicle-treated mice (Figure 1N).
To validate the importance of Them2–PC-TP interactions in regulating the ER stress response, we treated mice with the PC-TP inhibitor compound A1 (16, 17, 19, 23). In Them2+/+ mice, inhibition of PC-TP by compound A1 before tunicamycin administration led to increased PERK activity and reduced activities of IRE1α and eIF2α relative to vehicle-treated controls (Supplemental Figure 4). Moreover, compound A1 treatment was associated with a 62% reduction in CHOP expression. The dependence of these effects on Them2 expression was evidenced by the absence of changes in the hepatic activities of PERK, IRE1α, eIF2α, and CHOP in compound A1–treated Them2–/– mice following tunicamycin administration (Supplemental Figure 4). When taken together, these observations in mouse models support a role for a Them2/PC-TP complex in the induction as well as the resolution of ER stress.
protein 78 (Grp78), and CCAAT/enhancer-binding protein homol-ogous protein (CHOP) and a trend toward decreased expression of phosphorylated inositol-requiring enzyme 1α (p-IRE1α). Cleaved activating transcription factor 6 (ATF6) levels were also decreased in livers of Pctp–/– but not Them2–/– mice.
ER stress is also induced when chow-fed mice are re-fed after a prolonged fast. Unlike in livers of high-fat-fed mice, ER stress induced by so-called fasting-refeeding is self-limited, resolves upon restoration of nutrient balance, and does not impair long-term glucose homeostasis (22). Although the time course of PERK activation and resolution was independent of Them2 expression (Figure 1B and Supplemental Figure 1D), the magnitude of PERK activation was reduced in livers of Them2–/– mice (Supplemental Figure 1E). In addition to reducing p-PERK, the absence of PC-TP expression led to its more rapid return to baseline (Figure 1C and Supplemental Figure 1F). In livers of WT mice, p-IRE1α levels were elevated throughout the 5-hour refeed-ing period (Figure 1, B and C, and Supplemental Figure 1, D and F). Although p-IRE1α levels were more elevated in Them2–/– livers at 3 hours (Supplemental Figure 1E), they returned to baseline by 5 hours (Figure 1B and Supplemental Figure 1D). Similarly, in Pctp–/– livers, p-IRE1α was elevated early within 1 hour of refeed-ing and returned to baseline by 3 hours (Figure 1C and Supple-mental Figure 1F). Livers of Them2–/– and Pctp–/– mice exhib-ited robust ATF6 cleavage within 1 hour of refeeding, whereas weaker ATF6 activation in livers of WT mice subsided within 3 hours (Figure 1, B and C, and Supplemental Figure 1, D and F). Grp78 expression also exhibited time-dependent elevations in livers of WT mice, which did not resolve in 5 hours (Figure 1, B and C, and Supplemental Figure 1, D and F). Whereas hepatic Grp78 expression remained unchanged in Them2–/– mice (Fig-ure 1B and Supplemental Figure 1D), initial increases in Pctp–/– mice (within 1–3 hours) were resolved within 5 hours (Figure 1C and Supplemental Figure 1F). Because Them2–/– and Pctp–/– mice
Figure 1. Them2 and PC-TP regulate ER stress in mice. (A) The livers of Them2–/– and Pctp–/– mice are protected against ER stress due to high-fat feeding. Liver homogenates from high-fat-fed Them2+/+ (n = 8), Them2–/– (n = 9), Pctp+/+ (n = 5), and Pctp–/– (n = 5) mice were subjected to immunoblot analyses, and bands were quantified by densitometry and normalized to β-actin. Error bars represent SEM. *P < 0.05 compared with Them2–/– or Pctp+/+, ‡P = 0.057 compared with Pctp+/+. (B and C) Them2 and PC-TP modulate the resolution of hepatic ER stress following refeeding. Liver homogenates (n = 3 per genotype) were subjected to immunoblot analyses, and bands were quantified by densitometry. (D) The influence of refeeding on the interactions between PC-TP and Them2 was determined by coimmunoprecipitation in the liver lysates that were harvested from Pctp+/+ (n = 3) mice, and bands were quantified by densitometry. (E–N) Them2 or PC-TP expression enables tunicamycin-induced liver injury. Eight-week-old chow-fed mice were injected i.p. with tunicamycin (0.25 mg/kg body weight) or vehicle (DMSO, 0.25% v/v) for 2 consecutive days. (E and F) Body weights (n = 3 per genotype) following tunicamycin injec-tions (arrows). (G) Livers were harvested and imaged 6 hours following food restriction. Liver sections were subjected to hematoxylin and eosin (H&E) staining. Microscope images (×60) are representatives of n = 3. (H–M) Livers were analyzed for the concentrations of triglycerides (TG) (H and K), NEFA (I and L), and total cholesterol (J and M). (N) ER stress markers were detected in the liver lysates by immunoblot analyses. Error bars represent SEM. *P < 0.05 compared with WT. Statistical significance was determined by Student’s t test.
The Journal of Clinical Investigation R E S E A R C H A R T I C L E
1 4 4 jci.org Volume 128 Number 1 January 2018
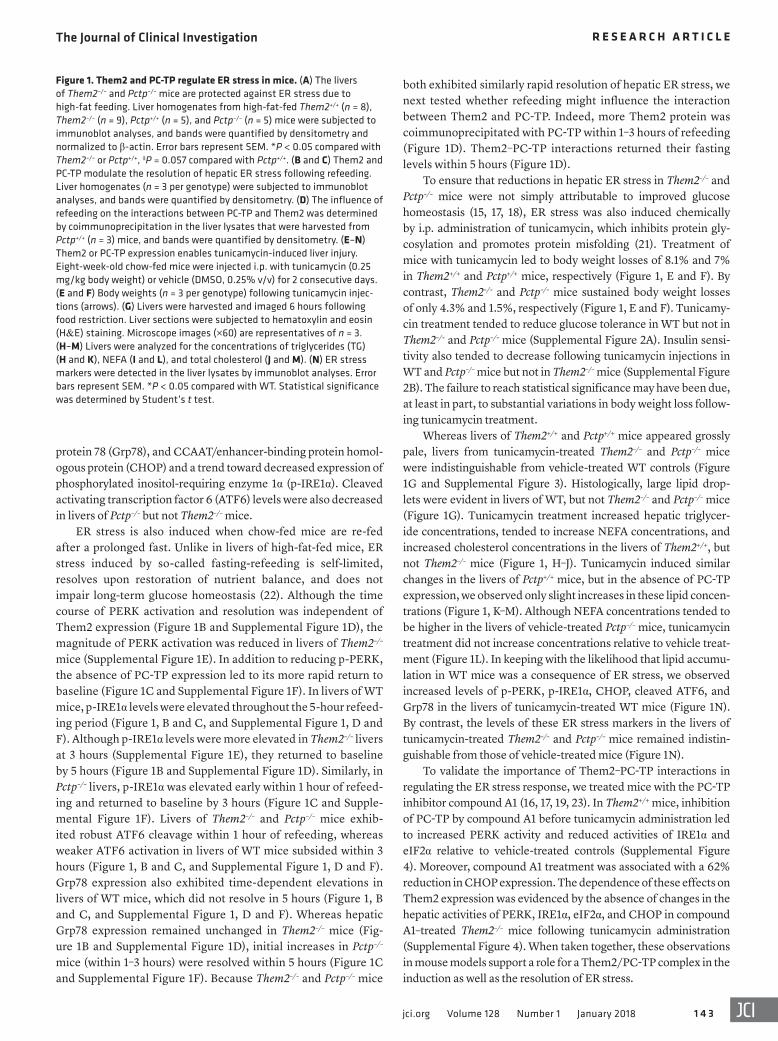
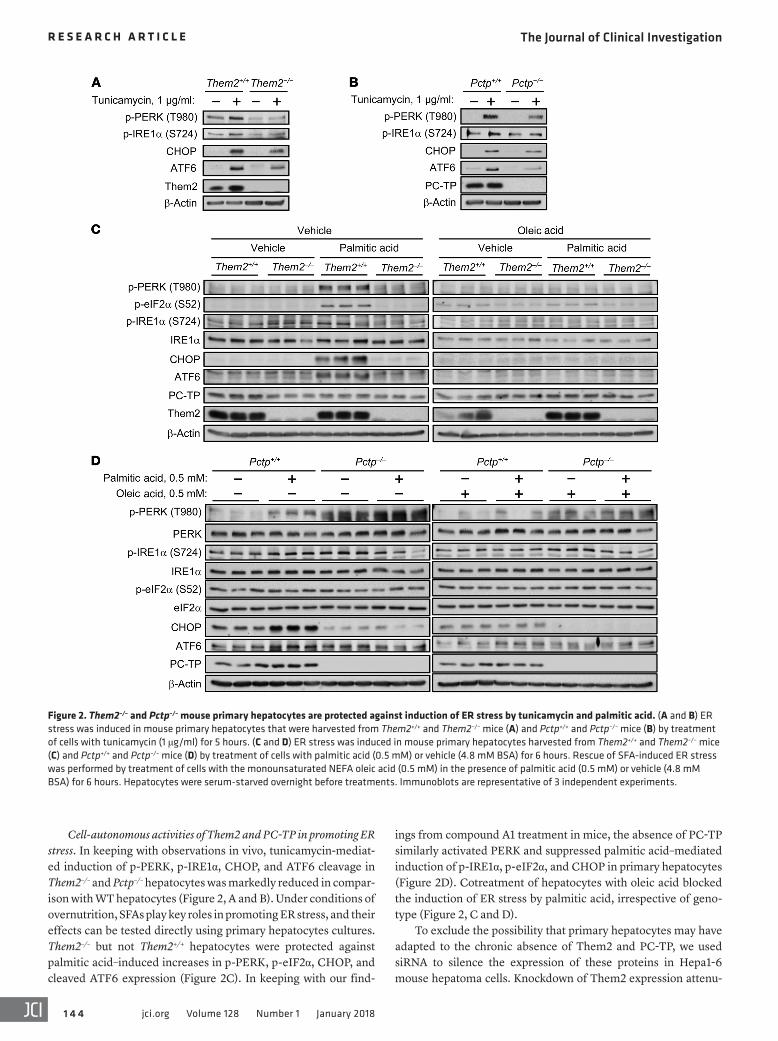
ings from compound A1 treatment in mice, the absence of PC-TP similarly activated PERK and suppressed palmitic acid–mediated induction of p-IRE1α, p-eIF2α, and CHOP in primary hepatocytes (Figure 2D). Cotreatment of hepatocytes with oleic acid blocked the induction of ER stress by palmitic acid, irrespective of geno-type (Figure 2, C and D).
To exclude the possibility that primary hepatocytes may have adapted to the chronic absence of Them2 and PC-TP, we used si RNA to silence the expression of these proteins in Hepa1-6 mouse hepatoma cells. Knockdown of Them2 expression attenu-
Cell-autonomous activities of Them2 and PC-TP in promoting ER stress. In keeping with observations in vivo, tunicamycin-mediat-ed induction of p-PERK, p-IRE1α, CHOP, and ATF6 cleavage in Them2–/– and Pctp–/– hepatocytes was markedly reduced in compar-ison with WT hepatocytes (Figure 2, A and B). Under conditions of overnutrition, SFAs play key roles in promoting ER stress, and their effects can be tested directly using primary hepatocytes cultures. Them2–/– but not Them2+/+ hepatocytes were protected against palmitic acid–induced increases in p-PERK, p-eIF2α, CHOP, and cleaved ATF6 expression (Figure 2C). In keeping with our find-
Figure 2. Them2–/– and Pctp–/– mouse primary hepatocytes are protected against induction of ER stress by tunicamycin and palmitic acid. (A and B) ER stress was induced in mouse primary hepatocytes that were harvested from Them2+/+ and Them2–/– mice (A) and Pctp+/+ and Pctp–/– mice (B) by treatment of cells with tunicamycin (1 μg/ml) for 5 hours. (C and D) ER stress was induced in mouse primary hepatocytes harvested from Them2+/+ and Them2–/– mice (C) and Pctp+/+ and Pctp–/– mice (D) by treatment of cells with palmitic acid (0.5 mM) or vehicle (4.8 mM BSA) for 6 hours. Rescue of SFA-induced ER stress was performed by treatment of cells with the monounsaturated NEFA oleic acid (0.5 mM) in the presence of palmitic acid (0.5 mM) or vehicle (4.8 mM BSA) for 6 hours. Hepatocytes were serum-starved overnight before treatments. Immunoblots are representative of 3 independent experiments.
The Journal of Clinical Investigation R E S E A R C H A R T I C L E
1 4 5jci.org Volume 128 Number 1 January 2018
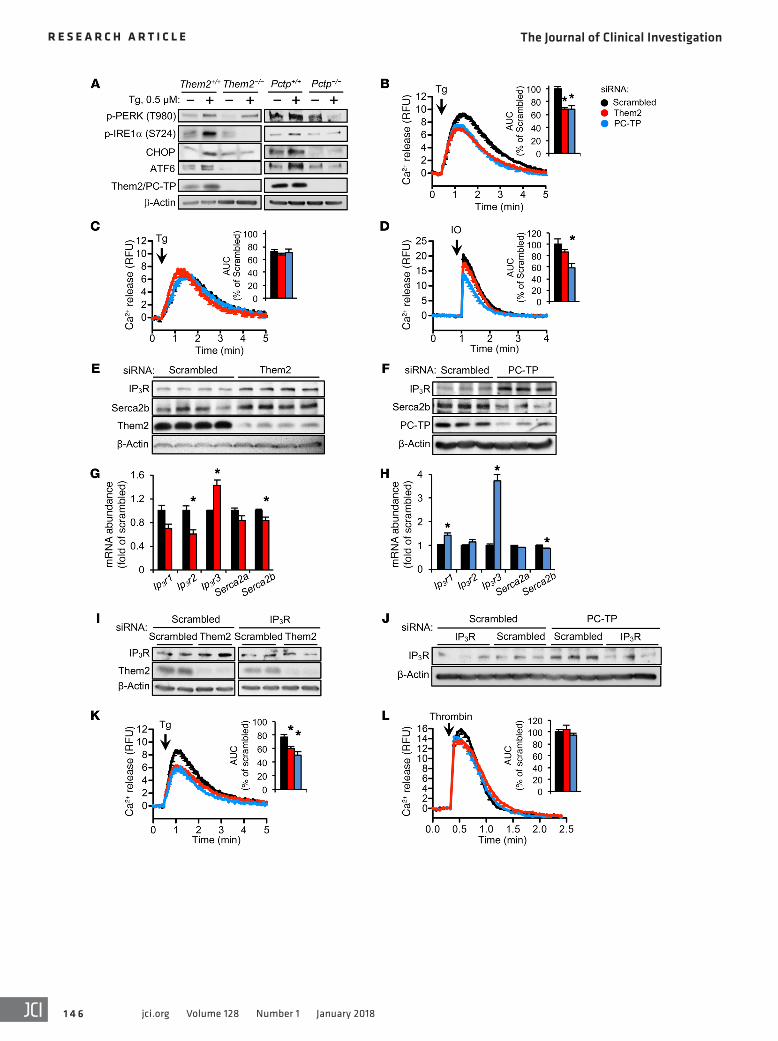
was associated with 1.4- and 3.7-fold increases in the mRNA abun-dance of Ip3r subtype 3 (Ip3r3) following the knockdown of Them2 and PC-TP expression, respectively (Figure 3, G and H). We used a siRNA targeting IP3R3 to neutralize the effects of Them2 and PC-TP knockdown on IP3R-mediated calcium release (Figure 3, I and J). Indeed, knockdown of IP3R3 reduced ER calcium release (Figure 3K); however, calcium release was further reduced by 21% and 35% in response to concomitant knockdown of Them2 and PC-TP, respectively (Figure 3K). This additional decrement in calcium efflux might have resulted from reduced IP3-mediated activation of IP3Rs in the absence of Them2 and PC-TP. To test this, we treated cells with the protease-activated receptor (PAR) agonist thrombin, which triggers rapid intracellular accumulation of IP3 in response to activation of phospholipase C (31). However, knockdown of Them2 or PC-TP expression did not impair IP3-mediated ER calcium release (Figure 3L).
We previously demonstrated that knockdown of Them2 or PC-TP expression in HEK 293E cells activates Akt and the mammalian target of rapamycin (mTOR) (16). We found that the regulation of calcium fluxes by Them2 and PC-TP occurs independently of Akt and mTOR activity, since inhibiting Akt or mTOR activity with GDC-0941 or rapamycin, respectively, did not abolish the effects of Them2 and PC-TP on ER calcium fluxes (Supplemental Figure 7).
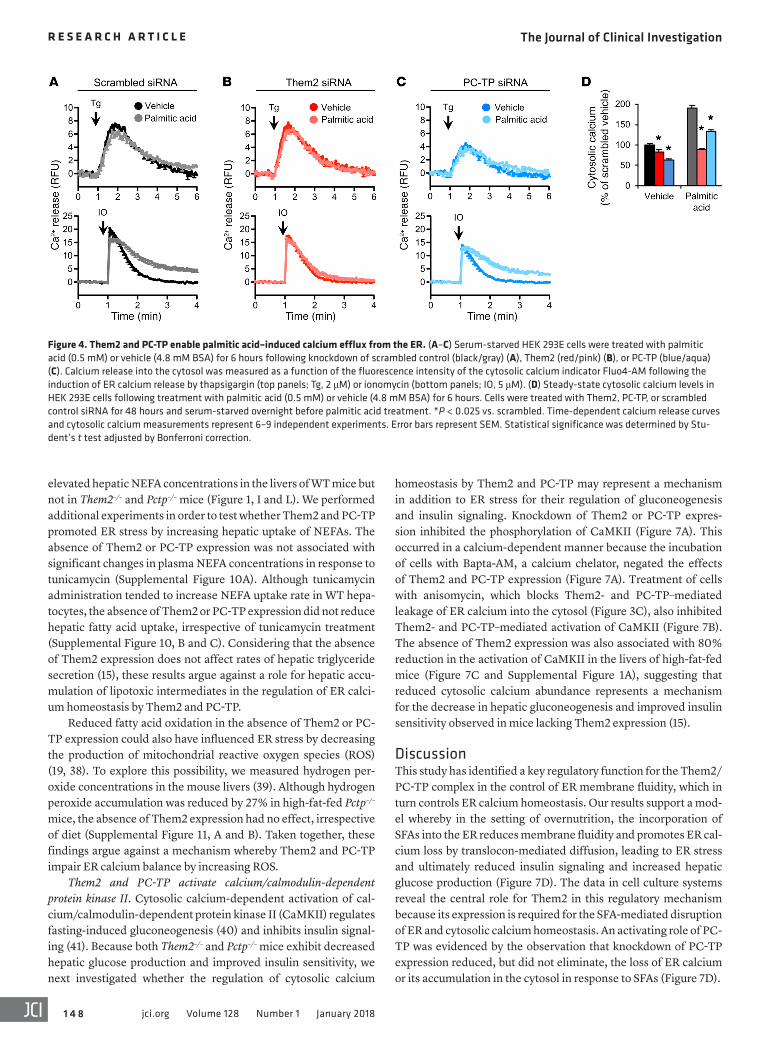
Disruption of calcium homeostasis by palmitic acid requires the expression of Them2 and PC-TP. Because the incorporation of palmitic acid into the ER membrane induces ER stress in cultured cells by altering ER membrane phospholipid composition and depleting ER calcium (4, 5, 32), we next tested whether Them2 and PC-TP might facilitate the depletion of ER calcium in response to SFAs. HEK 293E cells were treated with palmitic acid or vehicle (4.8 mM BSA) for 6 hours prior to the measurement of ER calcium efflux. Indicative of ER calcium depletion, palmitic acid reduced the magnitude (Emax) of cal-cium release in cells treated with scrambled but not Them2 or PC-TP siRNA following either thapsigargin- or ionomycin-mediated induc-tion of calcium release (Figure 4, A–C). Knockdown of Them2 expres-sion completely prevented disruption of calcium homeostasis by pal-mitic acid (Figure 4B). By contrast, palmitic acid treatment increased the duration of calcium release in scrambled and PC-TP siRNA–treat-ed cells (Figure 4, A and C). In scrambled siRNA–treated cells and to a lesser extent in PC-TP siRNA–treated cells, this was associated with a failure to fully restore cytosolic calcium to baseline (Figure 4, A and C). Steady-state cytosolic calcium concentrations were lower by 17% and 37% following knockdown of Them2 and PC-TP expression, respectively (Figure 4D). As anticipated from impaired restoration of baseline cytosolic calcium levels, palmitic acid induced a 1.9-fold increase in cytosolic calcium in scrambled siRNA–treated cells but not in Them2 siRNA–treated cells (Figure 4D). Knockdown of PC-TP expression also diminished the cytosolic calcium accumulation by 30% (Figure 4D). These results indicate that a Them2/PC-TP com-plex is integral to palmitic acid cytotoxicity.
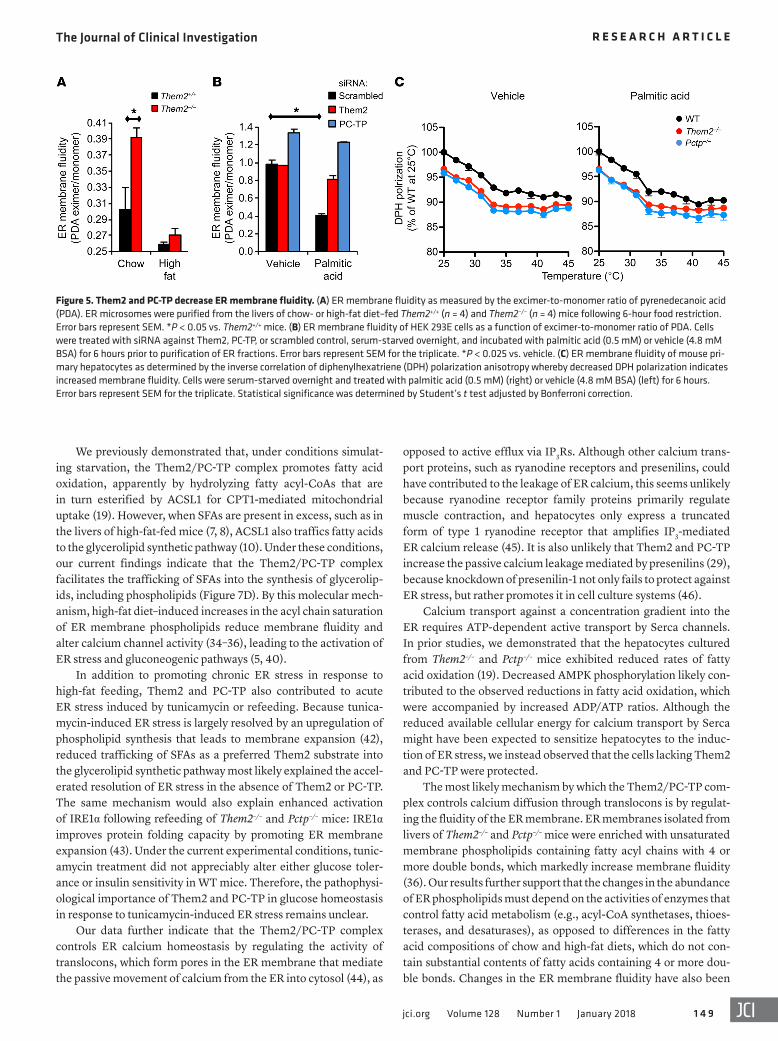
Them2 and PC-TP reduce ER membrane fluidity. Because ER membrane fluidity regulates the activity of ER calcium channels (33–35), we next assessed whether Them2 and PC-TP may alter ER membrane fluidity, thereby providing a mechanism for the con-trol of calcium homeostasis and ER stress. Loss of Them2 expres-sion was associated with a 30% increase in hepatic ER membrane fluidity in comparison with WT littermates as determined by
ated all tunicamycin-induced ER stress, but the PC-TP siRNA treatment only reduced p-PERK and cleaved ATF6 abundance fol-lowing tunicamycin treatment (Supplemental Figure 5A). Knock-down of Them2 expression suppressed the mRNA transcription of CHOP, whereas PC-TP knockdown reduced both Grp78 and CHOP mRNA expression (Supplemental Figure 5, B and C). Simi-lar protection against ER stress following knockdown of Them2 in human embryonic kidney (HEK) 293E cells was not reversed by the overexpression of either Acot7 or Acot12 (Supplemental Figure 6), which exhibit different subcellular localization and substrate specificity than Them2 (24).
Them2 and PC-TP induce ER stress by promoting release of lumi-nal calcium. Reduced ER calcium concentrations are an important trigger of the ER stress response (25). Treatment of hepatocytes with the sarcoplasmic reticulum ATPase 2b (Serca2b) inhibi-tor thapsigargin increased Them2 protein expression (Figure 3A) along with p-IRE1α, CHOP, and cleaved ATF6 in WT but not in Them2–/– and Pctp–/– hepatocytes (Figure 3A). Whereas the absence of PC-TP expression also prevented PERK activation, the absence of Them2 expression reduced this only slightly (Fig-ure 3A). Together these findings suggest that Them2 and PC-TP might promote ER stress by increasing luminal calcium losses. To explore this possibility, we measured the loss of ER calcium into the cytosol using the calcium reporter Fluo4-AM. Because of the high background fluorescence of primary hepatocytes, we used HEK 293E cells: Knockdown of either Them2 or PC-TP expres-sion led to a 31% reduction in the efflux of ER calcium following thapsigargin treatment (Figure 3B).
A significant proportion of ER calcium loss into the cytosol following thapsigargin treatment or lipotoxicity occurs as pas-sive diffusion through translocons (26–28). Treatment of cells with anisomycin, a pharmacological inhibitor of translocons (27), reduced the calcium leak from the ER into the cytosol in the scrambled siRNA–treated cells to the same level as in Them2 and PC-TP siRNA–treated cells (Figure 3C). Presumably because cal-cium leak via translocons was already reduced, anisomycin treat-ment did not alter the ER calcium release in Them2 and PC-TP siRNA–treated cells (Figure 3C). These results suggest that Them2 and PC-TP promote ER calcium efflux at least in part through the activity of translocons.
To determine whether Them2 and PC-TP also affected rest-ing total ER calcium stores, we treated cells with ionomycin, which permeabilizes the ER membrane (29). Whereas knockdown of Them2 had little effect, knockdown of PC-TP reduced ionomycin-induced calcium release (Figure 3D). Whereas the role of mem-brane fluidity in ionomycin efficacy is not known, the absence of Them2 expression, which increased membrane fluidity, did not appear to reduce ionomycin-mediated calcium release. Poten-tially explaining these differences in calcium release following ionomycin treatment, Serca2b protein abundance was increased in cells treated with Them2 siRNA (Figure 3E) but reduced in cells treated with PC-TP siRNA (Figure 3F).
We next eliminated the potential contributions of inositol 1,4,5-triphosphate receptors (IP3Rs), which, when activated, mediate the efflux of ER calcium, leading to ER stress (30). Unex-pectedly, knockdown of Them2 or PC-TP markedly increased IP3R expression (Figure 3, E and F). The induction of IP3R protein
The Journal of Clinical Investigation R E S E A R C H A R T I C L E
1 4 6 jci.org Volume 128 Number 1 January 2018
The Journal of Clinical Investigation R E S E A R C H A R T I C L E
1 4 7jci.org Volume 128 Number 1 January 2018
increased pyrenedecanoic acid (PDA) excimer-to-monomer ratios (Figure 5A). Despite a trend toward increased fluidity in the ER membranes isolated from livers of high-fat diet–fed Them2–/– mice, the differences did not achieve statistical significance, potentially because of the high saturated fatty acid content of the high-fat diet and the biological variability in response to the diet, as well as the presence of additional cell types within the liver. For these reasons, we further tested the role of Them2 and PC-TP in mem-brane fluidity using cell culture systems in which the experimental conditions could be more tightly controlled.
Palmitic acid treatment of cultured cells increases the abun-dance of membrane phospholipids with saturated and monoun-saturated fatty acyl chains while reducing the relative abundance of polyunsaturated fatty acyl chains with 4 or more double bonds (33). Indeed, we observed that palmitic acid treatment of HEK 293E cells reduced ER membrane fluidity 2.4-fold, but these changes were abrogated by knockdown of either Them2 or PC-TP (Figure 5B). These findings were validated using diphenylhexatri-ene (DPH) polarization anisotropy to measure membrane fluidity of the ER fractions purified from Them2–/– and Pctp–/– mouse pri-mary hepatocytes (Figure 5C). Consistent with effects of Them2 and PC-TP on membrane fluidity, genotype-dependent differ-ences in DPH polarization were eliminated by increasing tem-peratures (Figure 5C). These results demonstrate that Them2 and PC-TP regulate ER membrane fluidity, providing a mechanistic connection to ER calcium homeostasis (4).
Them2 and PC-TP regulate hepatic ER phospholipid composi-tion. To delineate the mechanisms underlying the regulation of ER membrane fluidity by Them2 and PC-TP, we assessed the regula-tion of lipid channeling into ER by Them2 and PC-TP using radio-labeled palmitic acid and oleic acid tracers. Consistent with pro-tection against palmitate-induced ER stress and ER calcium loss,
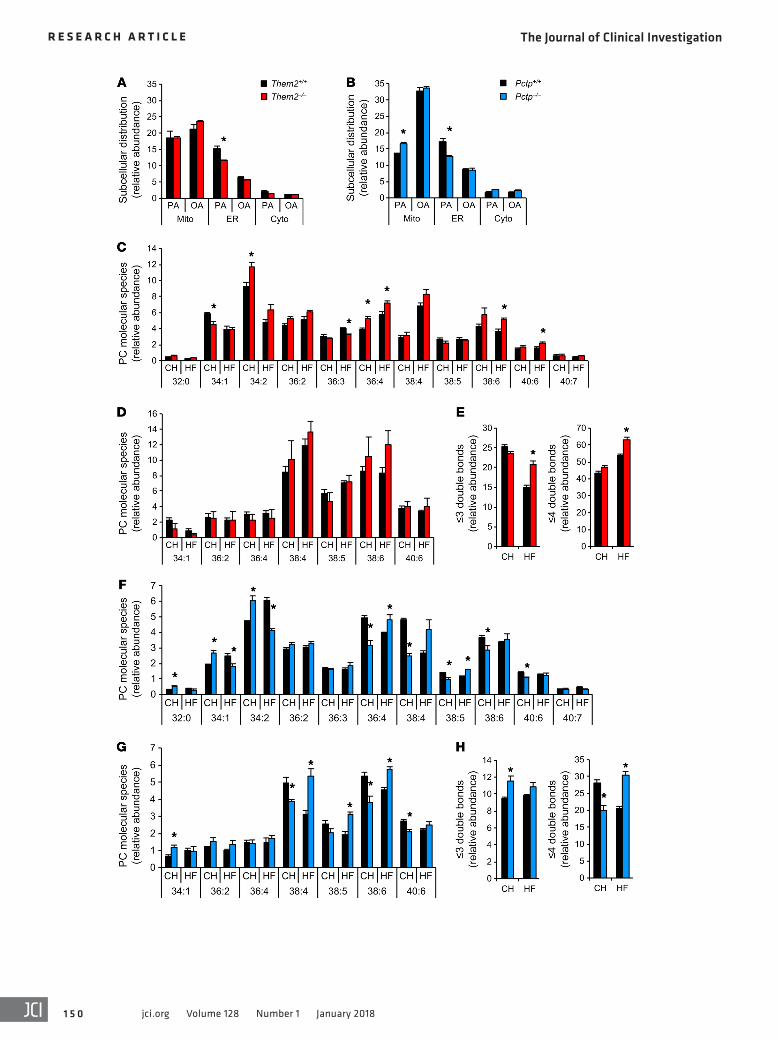
trafficking of radiolabeled palmitic acid into the ER was reduced by 24% and 26% in Them2–/– and Pctp–/– hepatocytes, respectively (Figure 6, A and B). Suggestive of selective targeting of palmitic acid to the ER by Them2/PC-TP, the subcellular localization of radiolabeled oleic acid remained unchanged in the absence of Them2 and PC-TP (Figure 6, A and B).
Membrane phospholipids with polyunsaturated fatty acyl chains with 4 or more double bonds have been associated with increased membrane fluidity (34–36). We investigated the influence of Them2 and PC-TP on the composition of the major ER membrane phospho-lipids, phosphatidylcholines (PCs) and phosphatidylethanolamines (PEs), by mass spectrometry analyses (Figure 6, C–H). We observed increased proportions of polyunsaturated PC molecular species (36:4, 38:6, and 40:6) in hepatic ER membrane fractions from high-fat-fed Them2–/– mice compared with livers of WT mice (Figure 6C). There was a parallel trend toward greater polyunsaturated PE molec-ular species (38:4 and 38:6) in Them2–/– mice (Figure 6D). Similarly in high-fat-fed Pctp–/– mice, we observed greater proportions of poly-unsaturated PC (36:4, 38:5) (Figure 6F) and PE (38:4, 38:5, and 38:6) (Figure 6G) molecular species compared with those in WT litter-mates. Consistent with improved ER membrane fluidity in the set-ting of high-fat diet, the overall abundance of ER phospholipids that contained fatty acids with 4 or more double bonds was elevated by 17% and 47% in the livers of Them2–/– and Pctp–/– mice, respectively, compared with WT littermates (Figure 6, E and H).
Elevated hepatic ER membrane PC/PE ratios due to increased expression of Pemt, which catalyzes the conversion of PE into PC, have been mechanistically linked to increased ER stress due to impaired Serca2b function (37). We therefore tested the influence of Them2 and PC-TP expression on the hepatic ER membrane PC/PE ratio in high-fat-fed mice. Compared with chow diet–fed littermates, ER membrane PC/PE ratios were increased in the liv-ers of high-fat-fed Pctp+/+ but not of Pctp–/–, Them2+/+, or Them2–/– mice (Supplemental Figure 8, A and B). The mRNA abundance of Pemt was unchanged in response to high-fat feeding of Them2+/+ and Them2–/– mice (Supplemental Figure 8C) and was equally increased in the livers of high-fat-fed Pctp+/+ and Pctp–/– mice. This suggests that different PC/PE ratios observed in ER membranes from livers of high-fat-fed Pctp+/+ and Pctp–/– were not attributable to changes in Pemt expression (Supplemental Figure 8D). Pcyt1a, encoding a phosphate cytidylyltransferase that regulates the syn-thesis of PCs from diacylglycerols and choline, was upregulated in both Pctp+/+ and Them2+/+ mice in response to high-fat feeding. Although the absence of Them2 or PC-TP expression blunted the induction of Pcyt1a, decreased PC/PE ratios were observed only in Pctp–/– mice (Supplemental Figure 8, C and D).
Them2 and PC-TP do not promote the hepatic accumulation of lipotoxic molecules. We previously demonstrated that Them2–/– mice exhibit increased hepatic concentrations of fatty acyl-CoAs and reduced hepatic NEFAs (15). This suggests that reduced ER stress in these mice may have been the result of reduced accumu-lation of lipotoxic molecules. To explore this possibility, we mea-sured other lipotoxic intermediates and found that the absence of Them2 or PC-TP did not reduce the abundance of free cholesterol (Supplemental Figure 9, A and B) or ceramides (Supplemental Figure 9, C and D) in livers of high-fat-fed mice. In the setting of tunicamycin-induced ER stress, there were only trends toward
Figure 3. Them2 and PC-TP promote efflux of ER calcium into the cyto-sol. (A) ER stress induced by 0.5 μM thapsigargin (Tg) in mouse primary hepatocytes. Immunoblots are representative of 3 independent experi-ments. (B) ER calcium release into cytosol induced by 2 μM Tg in HEK 293E cells following knockdown of Them2, PC-TP, or scrambled control. Calcium release into cytosol was measured by Fluo4-AM relative fluorescence units (RFU). Inset barplot displays the AUC. *P < 0.025 compared with scrambled. (C) HEK 293E cells were preincubated with the translocon inhibitor anisomycin (200 μM) or vehicle (0.1% v/v DMSO) for 1 hour prior to Tg-induced ER calcium release into the cytosol following knockdown of Them2, PC-TP, or scrambled control. (D) ER calcium release into cytosol induced by 5 μM ionomycin (IO) in HEK 293E cells following knockdown of Them2, PC-TP, or scrambled control. *P < 0.025 compared with scrambled. (E and F) Immunoblot analyses of IP3R and Serca2b following knockdown of Them2 (E), PC-TP (F), or scrambled control in HEK 293E cells. (G and H) mRNA abundance of Ip3r1, Ip3r2, Ip3r3, Serca2a, and Serca2b was deter-mined by qPCR analysis following knockdown of Them2 (G), PC-TP (H), or scrambled control in HEK 293E cells. GAPDH mRNA served as reference. Error bars represent SEM for n = 3. *P < 0.05 compared with scrambled. (I and J) IP3R3 expression was knocked down along with Them2 (I), PC-TP (J), or scrambled control. (K) Tg-induced ER calcium release into cytosol following co-knockdown of IP3R3 in HEK 293E cells. AUC was normalized to scrambled control from B. *P < 0.025 compared with scrambled + IP3R3 siRNA. (L) IP3-mediated ER calcium release into cytosol was induced in HEK 293E cells by 40 μM thrombin. Calcium release curves represent 6–9 independent experiments. Statistical significance was determined by Student’s t test adjusted by Bonferroni correction.
The Journal of Clinical Investigation R E S E A R C H A R T I C L E
1 4 8 jci.org Volume 128 Number 1 January 2018
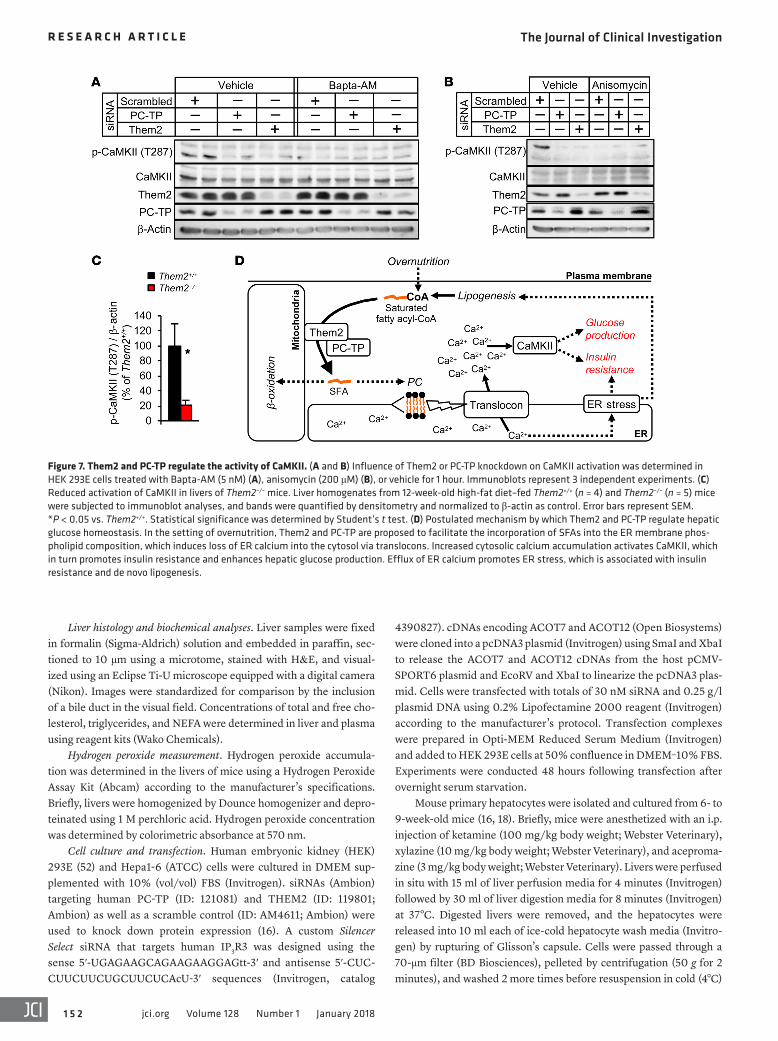
homeostasis by Them2 and PC-TP may represent a mechanism in addition to ER stress for their regulation of gluconeogenesis and insulin signaling. Knockdown of Them2 or PC-TP expres-sion inhibited the phosphorylation of CaMKII (Figure 7A). This occurred in a calcium-dependent manner because the incubation of cells with Bapta-AM, a calcium chelator, negated the effects of Them2 and PC-TP expression (Figure 7A). Treatment of cells with anisomycin, which blocks Them2- and PC-TP–mediated leakage of ER calcium into the cytosol (Figure 3C), also inhibited Them2- and PC-TP–mediated activation of CaMKII (Figure 7B). The absence of Them2 expression was also associated with 80% reduction in the activation of CaMKII in the livers of high-fat-fed mice (Figure 7C and Supplemental Figure 1A), suggesting that reduced cytosolic calcium abundance represents a mechanism for the decrease in hepatic gluconeogenesis and improved insulin sensitivity observed in mice lacking Them2 expression (15).
DiscussionThis study has identified a key regulatory function for the Them2/PC-TP complex in the control of ER membrane fluidity, which in turn controls ER calcium homeostasis. Our results support a mod-el whereby in the setting of overnutrition, the incorporation of SFAs into the ER reduces membrane fluidity and promotes ER cal-cium loss by translocon-mediated diffusion, leading to ER stress and ultimately reduced insulin signaling and increased hepatic glucose production (Figure 7D). The data in cell culture systems reveal the central role for Them2 in this regulatory mechanism because its expression is required for the SFA-mediated disruption of ER and cytosolic calcium homeostasis. An activating role of PC-TP was evidenced by the observation that knockdown of PC-TP expression reduced, but did not eliminate, the loss of ER calcium or its accumulation in the cytosol in response to SFAs (Figure 7D).
elevated hepatic NEFA concentrations in the livers of WT mice but not in Them2–/– and Pctp–/– mice (Figure 1, I and L). We performed additional experiments in order to test whether Them2 and PC-TP promoted ER stress by increasing hepatic uptake of NEFAs. The absence of Them2 or PC-TP expression was not associated with significant changes in plasma NEFA concentrations in response to tunicamycin (Supplemental Figure 10A). Although tunicamycin administration tended to increase NEFA uptake rate in WT hepa-tocytes, the absence of Them2 or PC-TP expression did not reduce hepatic fatty acid uptake, irrespective of tunicamycin treatment (Supplemental Figure 10, B and C). Considering that the absence of Them2 expression does not affect rates of hepatic triglyceride secretion (15), these results argue against a role for hepatic accu-mulation of lipotoxic intermediates in the regulation of ER calci-um homeostasis by Them2 and PC-TP.
Reduced fatty acid oxidation in the absence of Them2 or PC-TP expression could also have influenced ER stress by decreasing the production of mitochondrial reactive oxygen species (ROS) (19, 38). To explore this possibility, we measured hydrogen per-oxide concentrations in the mouse livers (39). Although hydrogen peroxide accumulation was reduced by 27% in high-fat-fed Pctp–/– mice, the absence of Them2 expression had no effect, irrespective of diet (Supplemental Figure 11, A and B). Taken together, these findings argue against a mechanism whereby Them2 and PC-TP impair ER calcium balance by increasing ROS.
Them2 and PC-TP activate calcium/calmodulin-dependent protein kinase II. Cytosolic calcium-dependent activation of cal-cium/calmodulin-dependent protein kinase II (CaMKII) regulates fasting-induced gluconeogenesis (40) and inhibits insulin signal-ing (41). Because both Them2–/– and Pctp–/– mice exhibit decreased hepatic glucose production and improved insulin sensitivity, we next investigated whether the regulation of cytosolic calcium
Figure 4. Them2 and PC-TP enable palmitic acid–induced calcium efflux from the ER. (A–C) Serum-starved HEK 293E cells were treated with palmitic acid (0.5 mM) or vehicle (4.8 mM BSA) for 6 hours following knockdown of scrambled control (black/gray) (A), Them2 (red/pink) (B), or PC-TP (blue/aqua) (C). Calcium release into the cytosol was measured as a function of the fluorescence intensity of the cytosolic calcium indicator Fluo4-AM following the induction of ER calcium release by thapsigargin (top panels; Tg, 2 μM) or ionomycin (bottom panels; IO, 5 μM). (D) Steady-state cytosolic calcium levels in HEK 293E cells following treatment with palmitic acid (0.5 mM) or vehicle (4.8 mM BSA) for 6 hours. Cells were treated with Them2, PC-TP, or scrambled control siRNA for 48 hours and serum-starved overnight before palmitic acid treatment. *P < 0.025 vs. scrambled. Time-dependent calcium release curves and cytosolic calcium measurements represent 6–9 independent experiments. Error bars represent SEM. Statistical significance was determined by Stu-dent’s t test adjusted by Bonferroni correction.
The Journal of Clinical Investigation R E S E A R C H A R T I C L E
1 4 9jci.org Volume 128 Number 1 January 2018
opposed to active efflux via IP3Rs. Although other calcium trans-port proteins, such as ryanodine receptors and presenilins, could have contributed to the leakage of ER calcium, this seems unlikely because ryanodine receptor family proteins primarily regulate muscle contraction, and hepatocytes only express a truncated form of type 1 ryanodine receptor that amplifies IP3-mediated ER calcium release (45). It is also unlikely that Them2 and PC-TP increase the passive calcium leakage mediated by presenilins (29), because knockdown of presenilin-1 not only fails to protect against ER stress, but rather promotes it in cell culture systems (46).
Calcium transport against a concentration gradient into the ER requires ATP-dependent active transport by Serca channels. In prior studies, we demonstrated that the hepatocytes cultured from Them2–/– and Pctp–/– mice exhibited reduced rates of fatty acid oxidation (19). Decreased AMPK phosphorylation likely con-tributed to the observed reductions in fatty acid oxidation, which were accompanied by increased ADP/ATP ratios. Although the reduced available cellular energy for calcium transport by Serca might have been expected to sensitize hepatocytes to the induc-tion of ER stress, we instead observed that the cells lacking Them2 and PC-TP were protected.
The most likely mechanism by which the Them2/PC-TP com-plex controls calcium diffusion through translocons is by regulat-ing the fluidity of the ER membrane. ER membranes isolated from livers of Them2–/– and Pctp–/– mice were enriched with unsaturated membrane phospholipids containing fatty acyl chains with 4 or more double bonds, which markedly increase membrane fluidity (36). Our results further support that the changes in the abundance of ER phospholipids must depend on the activities of enzymes that control fatty acid metabolism (e.g., acyl-CoA synthetases, thioes-terases, and desaturases), as opposed to differences in the fatty acid compositions of chow and high-fat diets, which do not con-tain substantial contents of fatty acids containing 4 or more dou-ble bonds. Changes in the ER membrane fluidity have also been
We previously demonstrated that, under conditions simulat-ing starvation, the Them2/PC-TP complex promotes fatty acid oxidation, apparently by hydrolyzing fatty acyl-CoAs that are in turn esterified by ACSL1 for CPT1-mediated mitochondrial uptake (19). However, when SFAs are present in excess, such as in the livers of high-fat-fed mice (7, 8), ACSL1 also traffics fatty acids to the glycerolipid synthetic pathway (10). Under these conditions, our current findings indicate that the Them2/PC-TP complex facilitates the trafficking of SFAs into the synthesis of glycerolip-ids, including phospholipids (Figure 7D). By this molecular mech-anism, high-fat diet–induced increases in the acyl chain saturation of ER membrane phospholipids reduce membrane fluidity and alter calcium channel activity (34–36), leading to the activation of ER stress and gluconeogenic pathways (5, 40).
In addition to promoting chronic ER stress in response to high-fat feeding, Them2 and PC-TP also contributed to acute ER stress induced by tunicamycin or refeeding. Because tunica-mycin-induced ER stress is largely resolved by an upregulation of phospholipid synthesis that leads to membrane expansion (42), reduced trafficking of SFAs as a preferred Them2 substrate into the glycerolipid synthetic pathway most likely explained the accel-erated resolution of ER stress in the absence of Them2 or PC-TP. The same mechanism would also explain enhanced activation of IRE1α following refeeding of Them2–/– and Pctp–/– mice: IRE1α improves protein folding capacity by promoting ER membrane expansion (43). Under the current experimental conditions, tunic-amycin treatment did not appreciably alter either glucose toler-ance or insulin sensitivity in WT mice. Therefore, the pathophysi-ological importance of Them2 and PC-TP in glucose homeostasis in response to tunicamycin-induced ER stress remains unclear.
Our data further indicate that the Them2/PC-TP complex controls ER calcium homeostasis by regulating the activity of translocons, which form pores in the ER membrane that mediate the passive movement of calcium from the ER into cytosol (44), as
Figure 5. Them2 and PC-TP decrease ER membrane fluidity. (A) ER membrane fluidity as measured by the excimer-to-monomer ratio of pyrenedecanoic acid (PDA). ER microsomes were purified from the livers of chow- or high-fat diet–fed Them2+/+ (n = 4) and Them2–/– (n = 4) mice following 6-hour food restriction. Error bars represent SEM. *P < 0.05 vs. Them2+/+ mice. (B) ER membrane fluidity of HEK 293E cells as a function of excimer-to-monomer ratio of PDA. Cells were treated with siRNA against Them2, PC-TP, or scrambled control, serum-starved overnight, and incubated with palmitic acid (0.5 mM) or vehicle (4.8 mM BSA) for 6 hours prior to purification of ER fractions. Error bars represent SEM for the triplicate. *P < 0.025 vs. vehicle. (C) ER membrane fluidity of mouse pri-mary hepatocytes as determined by the inverse correlation of diphenylhexatriene (DPH) polarization anisotropy whereby decreased DPH polarization indicates increased membrane fluidity. Cells were serum-starved overnight and treated with palmitic acid (0.5 mM) (right) or vehicle (4.8 mM BSA) (left) for 6 hours. Error bars represent SEM for the triplicate. Statistical significance was determined by Student’s t test adjusted by Bonferroni correction.
The Journal of Clinical Investigation R E S E A R C H A R T I C L E
1 5 0 jci.org Volume 128 Number 1 January 2018
The Journal of Clinical Investigation R E S E A R C H A R T I C L E
1 5 1jci.org Volume 128 Number 1 January 2018
production and insulin resistance. These findings further establish the Them2/PC-TP complex as an attractive target for the manage-ment of hepatic steatosis and insulin resistance.
MethodsMaterials. Media and supplies for cell culture experiments were pur-chased from Invitrogen. Rapamycin and GDC-0941 were from EMD Chemicals and Chemdea, respectively. Tunicamycin, thapsigargin, anisomycin, thrombin, palmitic acid, oleic acid, and fatty acid–free BSA were from Sigma-Aldrich. Polyclonal antibodies against PC-TP and Them2 were as previously described (13). Antibodies against IRE1α (3294), eIF2α (9722), p-PERK (T980) (3179), PERK (3192), and Serca2b (4388) were from Cell Signaling Technology. Antibod-ies against Grp78 (G8918) and β-actin (A5441) were from Sigma-Aldrich. Antibodies against p-CAMKII (T286) and p-eIF2α (S52) were obtained from Novus Biologicals (NB110-96869) and Enzo Life Sci-ences (ADI-KAP-CP131), respectively. Bapta-AM and p-IRE1α (S724) antibody (ab48187) was from Abcam. Antibodies against CAMKII (sc-13082), CHOP (sc-7351), normal rabbit IgG (sc-2027), and Acot7 (sc-376808) were obtained from Santa Cruz Biotechnology. An anti-body that reacts with all 3 IP3R isoforms was from Millipore (07-1210). An antibody against cleaved ATF6α was provided by Ann-Hwee Lee (Weill Cornell Medical College) (50). Synthetic phospholipid stan-dards for mass spectrometry were obtained from Avanti Polar Lipids. 1,6-Diphenyl-hexa-1,3,5-triene (DPH) was from Sigma-Aldrich. [9,10-3H]Palmitic acid and [9,10-3H]oleic acid were from Perkin-Elmer.
Animals and experimental induction of ER stress. Male Pctp+/+ and Pctp–/– mice and male Them2+/+ and Them2–/– mice were as previously described (15, 51). Mice were housed in a standard 12-hour alternate light/dark cycle and fed a standard rodent diet 5001 (LabDiets) with free access to drinking water. For studies of diet-induced ER stress, mice were fed a high-fat diet (60% kcal; D12492; Research Diets) starting at 4 weeks of age for 8 weeks. Livers were harvested from mice following withdrawal of food, but not water, for 6 hours (9:00 am–3:00 pm), and used immediately or snap-frozen in liquid N2 and stored at –80°C. For studies of chemical-induced ER stress, 8-week-old chow diet–fed mice were treated with an i.p. injection of tunicamycin (0.25 mg/kg body weight) or vehicle (0.1% DMSO vol/vol) for 2 consecutive days. Livers were harvested 24 hours after the second injection. ER stress was also induced by fasting-refeeding: After an overnight fast, 8-week-old mice were provided with free access to chow. Livers were harvested at times ranging up to 5 hours after refeeding. In selected experiments, mice were given compound A1 (5 mg/kg body weight dissolved in 4% DMSO and 96% of 6% hydroxypropyl-β-cyclodextrin vol/vol) or an equal vol-ume of vehicle i.p. daily for 5 days (17). Tunicamycin was coadminis-tered to mice on day 4 and day 5 of compound A1 injection. Livers were harvested 1 day after the second tunicamycin injection.
Glucose and insulin tolerance tests. Tolerance tests to glucose (GTTs) and insulin (ITTs) were performed at the end of 2-day tunicamycin treat-ment of mice as described above. Food was removed from cages, leaving mice with free access to water 6 hours before i.p. injection with 1 mg/g body weight d-glucose (20% wt/vol) for GTTs or 1 U/kg body weight insulin (HumulinR; Eli Lilly) for ITTs. Plasma glucose concentrations were monitored periodically for up to 120 minutes. Because of variations in body weight loss following tunicamycin administration, GTT and ITT curves were normalized to the basal plasma glucose concentrations, which were measured just before injection of glucose or insulin.
demonstrated to modulate Serca2b activity in other experimental settings (35, 47). Impaired Serca2b activity has been attributed to increases in PC/PE ratios of the hepatic ER membranes (37). In that study a 52% increase in the ER PC/PE ratio was mechanisti-cally linked to ER stress in livers of chow-fed ob/ob mice. A likely explanation was increased rates of conversion of PE to PC due to upregulation of Pemt (37). In the current study, high-fat feeding increased the ER PC/PE ratios only modestly (16%) in the livers of Pctp+/+ mice, and had no effect in Pctp–/–, Them2+/+, and Them2–/– mice. Expression of Pcyt1a, and not Pemt, was more consistently upregulated in livers of both Them2+/+ and Pctp+/+ mice, suggesting that the Kennedy pathway (48) played a more central role in PC synthesis in response to high-fat diet–induced ER stress.
The role of calcium-dependent signaling pathways in the acti-vation of hepatic glucose production has been well characterized (49). These effects likely contributed to the reduced hepatic gluco-neogenesis observed in Them2–/– and Pctp–/– mice (15, 17), as well as in primary hepatocyte cultures (19). In the absence of either pro-tein, reduced efflux of ER calcium into the cytosol was associated with reduced activation of CaMKII. In addition, the suppression of ER stress in the absence of Them2 or PC-TP expression prevented the downstream activation of CHOP, and this presumably contrib-uted to improved hepatic insulin sensitivity observed in high-fat-fed Them2–/– and Pctp–/– mice (15, 17).
We have proposed that the Them2/PC-TP complex plays an important role in the selection and trafficking of fatty acids into oxidative or glycerolipid biosynthetic pathways (20). Our current findings provide a plausible mechanism for our previous observa-tions in cultured hepatocytes that, under physiological conditions, PC-TP and Them2 interactions increase in response to fasting and function to promote hepatic glucose production (19). Under the current experimental conditions simulating hepatic ER stress, the activation of calcium-dependent hepatic glucose production by the interactions of PC-TP and Them2 is likely to reflect a mal-adaptive manifestation of this response: The same complex pro-motes ER stress by channeling excess SFAs to the phospholipids of the ER membrane. Reduced membrane fluidity increases cal-cium leak via translocons leading to increases in hepatic glucose
Figure 6. Them2 and PC-TP traffic saturated fatty acids into the ER and reduce fatty acyl chain unsaturation of ER membrane phospholipids in the setting of high-fat diet. (A and B) Influence of Them2 (A) and PC-TP (B) on the subcellular distribution of palmitic acid (PA) and oleic acid (OA). Mouse primary hepatocytes were treated with [9,10-3H]palmitic acid (500 μM, 10 μCi/mmol) or [9,10-3H]oleic acid (500 μM, 10 μCi/mmol) for 1 hour. Radioisotope distributions to mitochondria (Mito), ER, and cytosol (Cyto) were normalized for subcellular fraction protein amounts, as well as total cellular uptake. (C–H) Four-week-old mice were fed chow or high-fat diet for 8 weeks, and livers were harvested following 6 hours of food restriction. Lipids were extracted from purified ER microsomes and subjected to mass spectrometry analysis. (C and D) Hepatic ER membrane PC (C) and PE (D) fatty acyl chain composition for Them2+/+ (n = 4) and Them2–/– (n = 4) mice. (E) Phospholipid molecular species from C and D were divided into 2 groups by fatty acyl chain saturation: ≤3 double bonds (left) or ≥4 double bonds (right). (F and G) Hepatic ER membrane PC (F) and PE (G) fatty acyl chain composition for Pctp+/+ (n = 4) and Pctp–/– (n = 4) mice. (H) Phospholipid molecular species from F and G were divided into 2 groups as in C. Error bars represent SEM. *P < 0.05 vs. WT mice. Statistical significance was determined by Student’s t test.
The Journal of Clinical Investigation R E S E A R C H A R T I C L E
1 5 2 jci.org Volume 128 Number 1 January 2018
4390827). cDNAs encoding ACOT7 and ACOT12 (Open Biosystems) were cloned into a pcDNA3 plasmid (Invitrogen) using SmaI and XbaI to release the ACOT7 and ACOT12 cDNAs from the host pCMV-SPORT6 plasmid and EcoRV and XbaI to linearize the pcDNA3 plas-mid. Cells were transfected with totals of 30 nM siRNA and 0.25 g/l plasmid DNA using 0.2% Lipofectamine 2000 reagent (Invitrogen) according to the manufacturer’s protocol. Transfection complexes were prepared in Opti-MEM Reduced Serum Medium (Invitrogen) and added to HEK 293E cells at 50% confluence in DMEM–10% FBS. Experiments were conducted 48 hours following transfection after overnight serum starvation.
Mouse primary hepatocytes were isolated and cultured from 6- to 9-week-old mice (16, 18). Briefly, mice were anesthetized with an i.p. injection of ketamine (100 mg/kg body weight; Webster Veterinary), xylazine (10 mg/kg body weight; Webster Veterinary), and aceproma-zine (3 mg/kg body weight; Webster Veterinary). Livers were perfused in situ with 15 ml of liver perfusion media for 4 minutes (Invitrogen) followed by 30 ml of liver digestion media for 8 minutes (Invitrogen) at 37°C. Digested livers were removed, and the hepatocytes were released into 10 ml each of ice-cold hepatocyte wash media (Invitro-gen) by rupturing of Glisson’s capsule. Cells were passed through a 70-μm filter (BD Biosciences), pelleted by centrifugation (50 g for 2 minutes), and washed 2 more times before resuspension in cold (4°C)
Liver histology and biochemical analyses. Liver samples were fixed in formalin (Sigma-Aldrich) solution and embedded in paraffin, sec-tioned to 10 μm using a microtome, stained with H&E, and visual-ized using an Eclipse Ti-U microscope equipped with a digital camera (Nikon). Images were standardized for comparison by the inclusion of a bile duct in the visual field. Concentrations of total and free cho-lesterol, triglycerides, and NEFA were determined in liver and plasma using reagent kits (Wako Chemicals).
Hydrogen peroxide measurement. Hydrogen peroxide accumula-tion was determined in the livers of mice using a Hydrogen Peroxide Assay Kit (Abcam) according to the manufacturer’s specifications. Briefly, livers were homogenized by Dounce homogenizer and depro-teinated using 1 M perchloric acid. Hydrogen peroxide concentration was determined by colorimetric absorbance at 570 nm.
Cell culture and transfection. Human embryonic kidney (HEK) 293E (52) and Hepa1-6 (ATCC) cells were cultured in DMEM sup-plemented with 10% (vol/vol) FBS (Invitrogen). siRNAs (Ambion) targeting human PC-TP (ID: 121081) and THEM2 (ID: 119801; Ambion) as well as a scramble control (ID: AM4611; Ambion) were used to knock down protein expression (16). A custom Silencer Select siRNA that targets human IP3R3 was designed using the sense 5′-UGAGAAGCAGAAGAAGGAGtt-3′ and antisense 5′-CUC-CUUCUUCUGCUUCUCAcU-3′ sequences (Invitrogen, catalog
Figure 7. Them2 and PC-TP regulate the activity of CaMKII. (A and B) Influence of Them2 or PC-TP knockdown on CaMKII activation was determined in HEK 293E cells treated with Bapta-AM (5 nM) (A), anisomycin (200 μM) (B), or vehicle for 1 hour. Immunoblots represent 3 independent experiments. (C) Reduced activation of CaMKII in livers of Them2–/– mice. Liver homogenates from 12-week-old high-fat diet–fed Them2+/+ (n = 4) and Them2–/– (n = 5) mice were subjected to immunoblot analyses, and bands were quantified by densitometry and normalized to β-actin as control. Error bars represent SEM. *P < 0.05 vs. Them2+/+. Statistical significance was determined by Student’s t test. (D) Postulated mechanism by which Them2 and PC-TP regulate hepatic glucose homeostasis. In the setting of overnutrition, Them2 and PC-TP are proposed to facilitate the incorporation of SFAs into the ER membrane phos-pholipid composition, which induces loss of ER calcium into the cytosol via translocons. Increased cytosolic calcium accumulation activates CaMKII, which in turn promotes insulin resistance and enhances hepatic glucose production. Efflux of ER calcium promotes ER stress, which is associated with insulin resistance and de novo lipogenesis.
The Journal of Clinical Investigation R E S E A R C H A R T I C L E
1 5 3jci.org Volume 128 Number 1 January 2018
livers and vehicle-treated cells. Because increased membrane fluid-ity favors PDA excimer formation, excimer emission intensity was normalized to monomer emission intensity in order to quantify relative membrane fluidity. Microsomal concentrations were deter-mined and normalized based on microsomal protein abundance prior to the analysis of membrane fluidity using DPH and PDA.
Membrane phospholipid compositions. Subcellular fractions enriched with ER were isolated by serial centrifugation at 4°C (56). Briefly, 500-mg liver samples were gently homogenized in ice-cold 250-STM buffer (250 mM sucrose; 50 mM Tris-HCl, pH 7.4; 5 mM MgCl2) using a Dounce Teflon pestle homogenizer (1,000 rpm for 2 minutes). Homogenates were first centrifuged (800 g for 15 min-utes) to pellet unbroken cells and nuclei. Supernatants were centri-fuged (6,000 g for 15 minutes) to pellet mitochondrial fractions. After removal of mitochondria, supernatants were centrifuged (100,000 g for 1 hour) to pellet ER fractions. ER lipids were extracted by a modi-fied Bligh and Dyer method (57). Briefly, ER pellets were resuspend-ed in 1 ml of PBS, mixed with 2 ml methanol and 1 ml of chloroform, and vortexed for 2 hours at room temperature. After centrifugation (150 g for 10 minutes), supernatants were mixed with 2 ml of chlo-roform and 1 ml of 1 M NaCl, then centrifuged (150 g for 10 minutes) to achieve phase separations. The lower organic phases containing the phospholipids were dried under a stream of N2. For tandem mass spectrometry analyses, dried lipids were reconstituted in chloroform/methanol (1:1 vol/vol) to a final lipid concentration of 5.5 mg/ml. Using a syringe pump, lipids were directly injected into a QTrap 3000 mass spectrometer (Applied Biosystems) at a flow rate of 5 ml/min. To resolve PC molecular species, the mass spectrometer was oper-ated in the positive ion mode (58). The negative ion mode was used (59) to resolve PE molecular species. For both ionization modes, the electrospray ionization energy was (±)4,000 V. N2 was used as both the nebulizer and the collision gas. Declustering and collision ener-gies were 70 eV and 35 eV, respectively. Q1 and Q3 were operated in unit mass resolution settings with a step size of 0.5 amu. Experimen-tal conditions were optimized using a mixture of synthetic PC (sn-1–sn-2 acyl chains; 16:0–18:1, 16:0–18:2, 18:0–18:2) and PE (16:0–18:1 and 16:0–18:2) standards. To identify molecular species of PC and PE, a series of precursor ion scans were performed, with mass-to-charge ratios (m/z) of 184(+) and 196(–), as these masses correspond to key fragments from the phospholipid head group, respectively. Identified ions were then subjected to product ion scans to determine the sn-1 and sn-2 fatty acyl chain species. To calculate the relative abundance of ER membrane PC and PE species, precursor ion scanning for (+) m/z 184 and (–) m/z 196, respectively, was completed to specifically target each subset of lipids. The signal at the apex of the peak of inter-est was divided by the sum total of all peaks identified in each precur-sor ion scan to calculate that lipid’s relative abundance.
Hepatic ceramide concentrations. Hepatic ceramide concentra-tions were measured by the Metabolomics Platform at the Broad Institute (Cambridge, Massachusetts, USA) as previously described (60, 61). Livers were harvested 6 hours after food removal, and the hepatic lipids were extracted from liver homogenates using isopro-panol containing N-heptadecanoyl-d-erythro-sphingosine (Avanti Polar Lipids) as an internal standard. Lipids were purified by HPLC, and mass spectrometry analyses were performed using electrospray ionization in the positive ion mode using full-scan analysis over m/z 200–1,100 at 70,000 resolution and a 3-Hz data acquisition rate.
Williams E medium (Invitrogen) containing 10% FBS, 1 μM dexameth-asone, and 20 ng/ml EGF. Hepatocytes were plated on Primaria plates (BD Biosciences) at 80% confluence. The media were replenished the following day. For the chemical induction of ER stress, cultured hepa-tocytes were serum-starved overnight and then incubated with 1 μg/ml tunicamycin, 0.5 μM thapsigargin, or vehicle (0.1 % DMSO vol/vol) for 5 hours. Alternatively, hepatocytes were serum-starved for 8 hours and then incubated 12 hours with 500 μM palmitic acid or oleic acid complexed to BSA (19) or BSA alone in 150 mM NaCl.
Calcium exchange between ER and cytosol. Cellular cytosolic cal-cium levels were measured as previously described (53). Briefly, cel-lular and extracellular calcium contents were labeled by loading of HEK 293E cells with 3 μM Fluo-4 AM (Invitrogen) in HBSS (Invit-rogen) with calcium for 30 minutes at 37°C. Extracellular calcium was cleared by washing of cells 3 times with calcium-free HBSS. Steady-state cytosolic calcium levels were measured for 1 minute at 23°C in calcium-free HBSS. Calcium release from the ER was initi-ated using thapsigargin, which inhibits Serca2b-mediated calcium reuptake at a concentration of 2 μM. This concentration was chosen because it exceeds the threshold established for complete inhibition of Serca activity at the highest levels of cellular Serca2 expression (54). Alternatively, ER calcium efflux was induced by activation of IP3R channels using 40 μM of the human PAR1 agonist thrombin (Sigma-Aldrich). Total ER calcium stores were determined by mea-surement of ER calcium loss in response to treatment with ionomy-cin (Abcam), an ionophore that creates calcium-permeable pores (29). Calcium release into cytosol was monitored as time-dependent increase in Fluo-4 AM fluorescence intensity using the SpectraMax M5 microplate reader at excitation and emission wavelengths of 494 and 516 nm, respectively, in calcium-free HBSS. Cytosolic calcium was recorded at the beginning of each experiment in order to estab-lish the background intensity for each cell culture system, and values of calcium release were normalized to the background level. AUC values were calculated using Prism 5 (GraphPad Software).
Membrane fluidity. ER membrane fluidity was determined by 2 independent techniques. The first was to measure changes in the fluorescence polarization of DPH (55). Briefly, ER micro-somal fractions were resuspended in a KCl-based buffer (150 mM KCl; 10 mM HEPES, pH 7.4; 2 mM EGTA) and incubated with 10 μM DPH at 45°C for 30 minutes. Endpoint fluorescence polariza-tion measurements were performed using a Polarstar Omega plate reader (BMG Labtech) at excitation wavelength of 355 nm and par-allel and perpendicular emission wavelengths of 440 ± 10 nm. The temperature was ramped from 25°C to 45°C in 2°C intervals. The second approach was to measure the formation of pyrenedecanoic acid (PDA) excimers using a Membrane Fluidity Kit (MGT-M0271; Axxora, Enzo Life Sciences). ER microsomes were resuspended in PBS and incubated with 10 μM PDA in the presence of 0.08% Plu-ronic F127 for 20 minutes at 25°C. After PDA incorporation into the membranes, microsomes were washed 3 times with PBS to remove excess PDA and resuspended in fresh PBS. Endpoint fluorescence measurements were obtained using a SpectraMax M5 microplate reader (Molecular Devices) at an excitation wavelength of 360 nm. PDA monomer and excimer emissions were detected at 400 and 470 nm, respectively. Microsomal concentrations were titrated to obtain an even distribution of PDA molecules with an excimer-to-monomer ratio of 1 under basal conditions such as chow-fed mouse
The Journal of Clinical Investigation R E S E A R C H A R T I C L E
1 5 4 jci.org Volume 128 Number 1 January 2018
were washed 3 times with PBS before the elution and denaturation of proteins by heating for 5 minutes at 96°C in 2× Laemmli buffer.
Quantitative PCR and reverse transcription PCR analysis of gene expression. mRNA was extracted from cells or tissue using TRIzol (Invi-trogen) according to the manufacturer’s instructions. cDNA was synthe-sized from 2 μg total mRNA using SuperScript III First-Strand Synthe-sis System for reverse transcription PCR (Invitrogen). Gene expression was quantified using LightCycler FastStart DNA MasterPLUS SYBR Green I (Roche Applied Sciences) in a LightCycler 480II (Roche Applied Sci-ences). Mouse L32 ribosome protein and TATAA-box binding protein (Tbp) were used as invariant controls (18, 62). Nucleotide sequences of oligonucleotide primers were: mouse Pctp, forward 5′-CCAGAG-TATCTCGGCACCTC-3′, reverse 5′-ACGCTTTCACCATGTCCTTC-3′; mouse Pemt, forward 5′-TTGGGGATTCGTGTTTGTGCT-3′, reverse 5′-CACGCTGAAGGGAAATGTGG-3′ (37); mouse Pcyt1a, forward 5′- GATGCACAGAGTTCAGCTAAAGT-3′, reverse 5′-TGGCTGCCGTA-AACCAACTG-3′ (37); mouse Pcyt2, forward 5′-TGTGTTCACGGCAAT-GACATC-3′, reverse 5′-TTCCCGGTACTCAGAGGACAT-3′ (37); mouse Ptdss1, forward 5′-GCAGGACTCTGAGCAAGGATG-3′, reverse 5′-GGCGAAGTACATGAGGCTGAT-3′ (37); mouse Ptdss2, forward 5′-GGATTGCCTTTCAGTTCACGC-3′, reverse 5′-AGGTAGAAGGT-GTTCAGCTCTG-3′ (37); mouse Rpl32, forward 5′-CACCAGTCAGAC-CGATATGT-3′, reverse 5′-TTCTCCGCACCCTGTTG-3′; mouse Tbp, forward 5′-ACCCTTCACCAATGACTCCTATG-3′, reverse 5′-TGACT-GCAGCAAATCGCTTGG-3′ (62); human IP3R1, forward 5′-CGCTA-AGCCTGGGGCCAA-3′, reverse 5′-GGATTACGGTCCCCAGCAAT-3′; human IP3R2, forward 5′-GCCAAACAAGGGAACCACAC-3′, reverse 5′-GTATTTTACAATTTCTCCCAACAG-3′; human IP3R3, forward 5′-GACTAAGCAGGACAAGGAGAA-3′, reverse 5′-CTTCACGA-CATCCCCATGCA-3′; human SERCA2A, forward 5′-CCTCTATGTC-GAACCCTTGC-3′, reverse 5′-GTATTGCAGGTTCCAGGTAGTT-3′; human SERCA2B, forward 5′-CCTCTATGTCGAACCCTTGC-3′, reverse 5′-GCAGGCTGCACACACTCTT-3′; human GAPDH, forward 5′-CCTCCCGCTTCGCTCTCT-3′, reverse 5′-GGCGACGCAAAAGAA-GATG-3′; mouse Grp78, forward 5′-TCATCGGACGCACTTGGAA-3′, reverse 5′-CAACCACCTTGAATGGCAAGA-3′ (63); mouse Chop, for-ward 5′-GTCCCTAGCTTGGCTGACAGA-3′, reverse 5′-TGGAGAGC-GAGGGCTTTG-3′ (63).
Statistical analysis. Data are expressed as mean ± SEM of inde-pendent experiments. Means of experimental groups were com-pared using a 2-tailed Student’s t test. Differences were considered statistically significant for P less than 0.05. Statistical analyses were corrected for multiple comparisons when comparing knock-down of PC-TP and Them2 versus the scrambled siRNA control by a Bonferroni correction so that differences were considered statis-tically significant for P less than 0.025.
Study approval. Protocols for animal use, treatment, and euthana-sia were approved by the institutional animal care and use committees of Harvard Medical School and Weill Cornell Medical College.
Author contributionsBAE contributed to the hypothesis, designed and performed exper-iments, analyzed data, and wrote the manuscript. KMMS designed and performed mass spectrometry experiments and analyzed data. YL performed experiments. IA designed and performed calcium flux experiments. DEC contributed to the hypothesis, directed the work, designed experiments, and wrote the manuscript.
Subcellular distribution of exogenous fatty acids in cultured hepa-tocytes. The subcellular distribution of exogenous fatty acids fol-lowing uptake into cultured hepatocytes was essentially as previ-ously described (4). Primary mouse hepatocytes were cultured in 100-mm dishes, serum-starved overnight, and then incubated for 1 hour with 500 μM BSA-conjugated palmitic acid or oleic acid, which were radiolabeled using [9,10-3H]palmitic acid (53.7 Ci/mmol) or [9,10-3H]oleic acid (54.5 Ci/mmol), respectively, at a final specific activity of 10 μCi/mmol. Cells were then washed twice with PBS and then subjected to subcellular fractionation of ER, mitochondria, and cytosol by centrifugation, as described above. Radioactivity was determined by suspension of subcellular fractions in Ecoscint H scintillation solution (National Diagnostics) for quantification using an LS6000IC liquid scintillation counter (Beckman Coulter), and normalized to protein concentration of the respective fraction. To account for changes in the uptake of radio-labeled fatty acids, data were further normalized to total cellular radioactivity before fractionation.
Rates of hepatocellular NEFA uptake. NEFA uptake rates into mouse primary hepatocytes were measured using QBT Fatty Acid Uptake Assay Kit (Molecular Devices) according to the manufactur-er’s protocol. Cells (20,000 cells per well in 96-well format) were serum-starved for 1 hour and then treated with 1 μg/ml tunicamycin or vehicle (0.1 % DMSO, vol/vol) for 5 hours prior to the measure-ment of NEFA uptake according to time-dependent increase in fluo-rescence intensity using a microplate reader (Molecular Devices) at excitation and emission wavelengths of 485 and 515 nm, respec-tively. NEFA uptake rates (slopes) were calculated using the linear regression function of Prism 5.
Immunoblot analysis. Immunoblot analyses were as previously described (16). Cells or liver samples were washed with PBS and homogenized in ice-cold RIPA buffer (50 mM Tris-HCl, 150 mM NaCl, 2 mM EDTA, 0.35% NP-40, 0.5% sodium deoxycholate) containing Complete Protease Inhibitor Cocktail and PhosSTOP Phosphatase Inhibitor Cocktail Tablets (Roche). Cell lysates or liv-er homogenates were rotated for 30 minutes at 4°C prior to remov-al of cell or tissue debris by centrifugation (12,000 g for 20 min-utes). Proteins were denatured by heating for 5 minutes at 96°C in Laemmli buffer, separated by SDS-PAGE, and transferred elec-trophoretically to PVDF membranes (GE Healthcare). Membranes were blocked for 1 hour at 23°C in Tris buffer containing 0.1% Tween-20, 5% milk, and 1% BSA. Primary antibodies were then added to the blocking buffer, incubated overnight at 4°C, detected using goat anti-mouse (Sigma-Aldrich) or anti-rabbit HRP-conju-gated secondary antibodies (Bio-Rad), and visualized by enhanced chemiluminescence (GE Healthcare). Images were captured with a Bio-Rad Chemidoc XRS+ system equipped with a digital cam-era, and densitometry was performed using the histogram analysis function of Adobe Photoshop. Endogenous Them2 was coimmu-noprecipitated with PC-TP using Protein A Dynabeads according to the manufacturer’s protocol (Invitrogen). Briefly, the protein lysate from the livers of Pctp+/+ mice was precleared by incubation with 25 μl of rabbit IgG–bound beads for 1 hour at 4°C. IgG-bound beads were discarded, and the precleared lysate was incubated with 25 μl of PC-TP antibody–bound beads for 2 hours at 37°C. The protein lysate from the livers of Pctp–/– mice was used as nega-tive control for background Them2 coimmunoprecipitation. Beads
The Journal of Clinical Investigation R E S E A R C H A R T I C L E
1 5 5jci.org Volume 128 Number 1 January 2018
Address correspondence to: David E. Cohen, Weill Cornell Medi-cal College, 413 East 69th Street, Belfer Research Building, Room BB-630, New York, New York 10021, USA. Phone: 646.962.4746; E-mail: [email protected].
KMMS’s present address is: Department of Biochemistry, Emory School of Medicine, Atlanta, Georgia, USA.
AcknowledgmentsThis work was supported by NIH grants to DEC (DK048873 and DK056626) and BAE (DK102733). DEC was also supported by American Diabetes Association grant 7-13-MI-04. BAE was also the recipient of an NIH Ruth L. Kirschstein National Research Service Award (DK093195) and an American Association for the Study of Liver Diseases Liver Scholar Award.
1. Hu FB, van Dam RM, Liu S. Diet and risk of Type II diabetes: the role of types of fat and carbohy-drate. Diabetologia. 2001;44(7):805–817.
2. Feskens EJ, Kromhout D. Habitual dietary intake and glucose tolerance in euglycaemic men: the Zut-phen Study. Int J Epidemiol. 1990;19(4):953–959.
3. Vessby B, et al. Substituting dietary saturated for monounsaturated fat impairs insulin sensitivity in healthy men and women: the KANWU Study. Diabetologia. 2001;44(3):312–319.
4. Borradaile NM, Han X, Harp JD, Gale SE, Ory DS, Schaffer JE. Disruption of endoplasmic reticulum structure and integrity in lipotoxic cell death. J Lipid Res. 2006;47(12):2726–2737.
5. Rong X, et al. LXRs regulate ER stress and inflammation through dynamic modulation of membrane phospholipid composition. Cell Metab. 2013;18(5):685–697.
6. Ozcan U, et al. Chemical chaperones reduce ER stress and restore glucose homeostasis in a mouse model of type 2 diabetes. Science. 2006;313(5790):1137–1140.
7. Pagliassotti MJ. Endoplasmic reticulum stress in nonalcoholic fatty liver disease. Annu Rev Nutr. 2012;32:17–33.
8. Alkhouri N, Dixon LJ, Feldstein AE. Lipotoxicity in nonalcoholic fatty liver disease: not all lipids are created equal. Expert Rev Gastroenterol Hepa-tol. 2009;3(4):445–451.
9. Kawano Y, Cohen DE. Mechanisms of hepatic tri-glyceride accumulation in non-alcoholic fatty liver disease. J Gastroenterol. 2013;48(4):434–441.
10. Coleman RA, Lewin TM, Van Horn CG, Gonzalez-Baró MR. Do long-chain acyl-CoA synthetases regulate fatty acid entry into synthetic versus deg-radative pathways? J Nutr. 2002;132(8):2123–2126.
11. Grevengoed TJ, Klett EL, Coleman RA. Acyl-CoA metabolism and partitioning. Annu Rev Nutr. 2014;34:1–30.
12. Birkenfeld AL, Shulman GI. Nonalcoholic fatty liver disease, hepatic insulin resistance, and type 2 diabetes. Hepatology. 2014;59(2):713–723.
13. Kanno K, et al. Interacting proteins dictate func-tion of the minimal START domain phosphati-dylcholine transfer protein/StarD2. J Biol Chem. 2007;282(42):30728–30736.
14. Wei J, Kang HW, Cohen DE. Thioesterase super-family member 2 (Them2)/acyl-CoA thioester-ase 13 (Acot13): a homotetrameric hotdog fold thioesterase with selectivity for long-chain fatty acyl-CoAs. Biochem J. 2009;421(2):311–322.
15. Kang HW, Niepel MW, Han S, Kawano Y, Cohen DE. Thioesterase superfamily member 2/acyl-CoA thioesterase 13 (Them2/Acot13) regulates hepatic lipid and glucose metabolism. FASEB J. 2012;26(5):2209–2221.
16. Ersoy BA, et al. Phosphatidylcholine transfer protein interacts with thioesterase superfamily
member 2 to attenuate insulin signaling. Sci Sig-nal. 2013;6(286):ra64.
17. Shishova EY, et al. Genetic ablation or chemi-cal inhibition of phosphatidylcholine transfer protein attenuates diet-induced hepatic glucose production. Hepatology. 2011;54(2):664–674.
18. Scapa EF, et al. Regulation of energy substrate utilization and hepatic insulin sensitivity by phosphatidylcholine transfer protein/StarD2. FASEB J. 2008;22(7):2579–2590.
19. Kawano Y, Ersoy BA, Li Y, Nishiumi S, Yoshida M, Cohen DE. Thioesterase superfamily member 2 (Them2) and phosphatidylcholine transfer pro-tein (PC-TP) interact to promote fatty acid oxida-tion and control glucose utilization. Mol Cell Biol. 2014;34(13):2396–2408.
20. Tillander V, Alexson SEH, Cohen DE. Deactivat-ing fatty acids: acyl-CoA thioesterase-mediated control of lipid metabolism. Trends Endocrinol Metab. 2017;28(7):473–484.
21. Ozcan U, et al. Endoplasmic reticulum stress links obesity, insulin action, and type 2 diabetes. Science. 2004;306(5695):457–461.
22. Park SW, et al. The regulatory subunits of PI3K, p85α, and p85β, interact with XBP-1 and increase its nuclear translocation. Nat Med. 2010;16(4):429–437.
23. Wagle N, et al. Small-molecule inhibitors of phos-phatidylcholine transfer protein/StarD2 identi-fied by high-throughput screening. Anal Biochem. 2008;383(1):85–92.
24. Kirkby B, Roman N, Kobe B, Kellie S, Forwood JK. Functional and structural properties of mam-malian acyl-coenzyme A thioesterases. Prog Lipid Res. 2010;49(4):366–377.
25. Li WW, Alexandre S, Cao X, Lee AS. Transactiva-tion of the grp78 promoter by Ca2+ depletion. A comparative analysis with A23187 and the endo-plasmic reticulum Ca(2+)-ATPase inhibitor thapsi-gargin. J Biol Chem. 1993;268(16):12003–12009.
26. Flourakis M, Van Coppenolle F, Lehen’kyi V, Beck B, Skryma R, Prevarskaya N. Passive calcium leak via translocon is a first step for iPLA2-pathway regulated store operated channels activation. FASEB J. 2006;20(8):1215–1217.
27. Hammadi M, et al. Modulation of ER stress and apoptosis by endoplasmic reticulum calcium leak via translocon during unfolded protein response: involvement of GRP78. FASEB J. 2013;27(4):1600–1609.
28. Cassel R, et al. Protection of human pancreatic islets from lipotoxicity by modulation of the translocon. PLoS One. 2016;11(2):e0148686.
29. Tu H, et al. Presenilins form ER Ca2+ leak channels, a function disrupted by familial Alzheimer’s dis-ease-linked mutations. Cell. 2006;126(5):981–993.
30. Li G, et al. Role of ERO1-α-mediated stimulation of inositol 1,4,5-triphosphate receptor activity in
endoplasmic reticulum stress-induced apoptosis. J Cell Biol. 2009;186(6):783–792.
31. Coughlin SR. How the protease throm-bin talks to cells. Proc Natl Acad Sci U S A. 1999;96(20):11023–11027.
32. Wei Y, Wang D, Gentile CL, Pagliassotti MJ. Reduced endoplasmic reticulum luminal calcium links saturated fatty acid-mediated endoplasmic reticulum stress and cell death in liver cells. Mol Cell Biochem. 2009;331(1–2):31–40.
33. Spector AA, Yorek MA. Membrane lipid com-position and cellular function. J Lipid Res. 1985;26(9):1015–1035.
34. Castuma CE, Brenner RR. Effect of fatty acid deficiency on microsomal membrane fluidity and cooperativity of the UDP-glucuronyltransferase. Biochim Biophys Acta. 1983;729(1):9–16.
35. Christon R, et al. The effect of dietary essential fatty acid deficiency on the composition and properties of the liver microsomal membrane of rats. J Nutr. 1988;118(11):1311–1318.
36. Yang X, Sheng W, Sun GY, Lee JC. Effects of fatty acid unsaturation numbers on membrane fluidity and α-secretase-dependent amyloid precursor protein processing. Neurochem Int. 2011;58(3):321–329.
37. Fu S, et al. Aberrant lipid metabolism disrupts calcium homeostasis causing liver endo-plasmic reticulum stress in obesity. Nature. 2011;473(7348):528–531.
38. Serra D, Mera P, Malandrino MI, Mir JF, Herrero L. Mitochondrial fatty acid oxidation in obesity. Antioxid Redox Signal. 2013;19(3):269–284.
39. El-Said KS, Ali EM, Kanehira K, Taniguchi A. Molecular mechanism of DNA damage induced by titanium dioxide nanoparticles in toll-like receptor 3 or 4 expressing human hepatocarci-noma cell lines. J Nanobiotechnology. 2014;12:48.
40. Ozcan L, et al. Calcium signaling through CaM-KII regulates hepatic glucose production in fast-ing and obesity. Cell Metab. 2012;15(5):739–751.
41. Ozcan L, Cristina de Souza J, Harari AA, Backs J, Olson EN, Tabas I. Activation of calcium/calmodulin-dependent protein kinase II in obesity mediates suppression of hepatic insulin signaling. Cell Metab. 2013;18(6):803–815.
42. Schuck S, Prinz WA, Thorn KS, Voss C, Walter P. Membrane expansion alleviates endoplasmic reticulum stress independently of the unfolded protein response. J Cell Biol. 2009;187(4):525–536.
43. Sriburi R, Jackowski S, Mori K, Brewer JW. XBP1: a link between the unfolded protein response, lipid biosynthesis, and biogenesis of the endo-plasmic reticulum. J Cell Biol. 2004;167(1):35–41.
44. Hamman BD, Chen JC, Johnson EE, Johnson AE. The aqueous pore through the translocon has a diameter of 40-60 Å during cotranslational protein translocation at the ER membrane. Cell.
The Journal of Clinical Investigation R E S E A R C H A R T I C L E
1 5 6 jci.org Volume 128 Number 1 January 2018
1997;89(4):535–544. 45. Pierobon N, Renard-Rooney DC, Gaspers LD,
Thomas AP. Ryanodine receptors in liver. J Biol Chem. 2006;281(45):34086–34095.
46. Száraz P, Bánhegyi G, Marcolongo P, Benedetti A. Transient knockdown of presenilin-1 provokes endoplasmic reticulum stress related formation of autophagosomes in HepG2 cells. Arch Biochem Biophys. 2013;538(2):57–63.
47. Li Y, et al. Enrichment of endoplasmic reticulum with cholesterol inhibits sarcoplasmic-endo-plasmic reticulum calcium ATPase-2b activity in parallel with increased order of membrane lipids: implications for depletion of endoplas-mic reticulum calcium stores and apoptosis in cholesterol-loaded macrophages. J Biol Chem. 2004;279(35):37030–37039.
48. Gibellini F, Smith TK. The Kennedy pathway—de novo synthesis of phosphatidylethanol-amine and phosphatidylcholine. IUBMB Life. 2010;62(6):414–428.
49. Bartlett PJ, Gaspers LD, Pierobon N, Thomas AP. Calcium-dependent regulation of glu-cose homeostasis in the liver. Cell Calcium. 2014;55(6):306–316.
50. Haze K, Yoshida H, Yanagi H, Yura T, Mori K. Mammalian transcription factor ATF6 is synthe-
sized as a transmembrane protein and activated by proteolysis in response to endoplasmic reticu-lum stress. Mol Biol Cell. 1999;10(11):3787–3799.
51. Wu MK, Hyogo H, Yadav SK, Novikoff PM, Cohen DE. Impaired response of biliary lipid secretion to a lithogenic diet in phosphatidylcho-line transfer protein-deficient mice. J Lipid Res. 2005;46(3):422–431.
52. Dibble CC, Asara JM, Manning BD. Characteriza-tion of Rictor phosphorylation sites reveals direct regulation of mTOR complex 2 by S6K1. Mol Cell Biol. 2009;29(21):5657–5670.
53. Dietrich A, et al. Pressure-induced and store-operated cation influx in vascular smooth muscle cells is independent of TRPC1. Pflugers Arch. 2007;455(3):465–477.
54. Lytton J, Westlin M, Hanley MR. Thapsigargin inhibits the sarcoplasmic or endoplasmic reticu-lum Ca-ATPase family of calcium pumps. J Biol Chem. 1991;266(26):17067–17071.
55. Galvagnion C, et al. Lipid vesicles trigger α-synuclein aggregation by stimulating primary nucleation. Nat Chem Biol. 2015;11(3):229–234.
56. Cox B, Emili A. Tissue subcellular fraction-ation and protein extraction for use in mass-spectrometry-based proteomics. Nat Protoc. 2006;1(4):1872–1878.
57. Bligh EG, Dyer WJ. A rapid method of total lipid extraction and purification. Can J Biochem Physi-ol. 1959;37(8):911–917.
58. Pulfer M, Murphy RC. Electrospray mass spec-trometry of phospholipids. Mass Spectrom Rev. 2003;22(5):332–364.
59. Ejsing CS, et al. Automated identification and quantification of glycerophospholipid molecular species by multiple precursor ion scanning. Anal Chem. 2006;78(17):6202–6214.
60. Nicholls HT, Hornick JL, Cohen DE. Phospha-tidylcholine transfer protein/StarD2 promotes microvesicular steatosis and liver injury in murine experimental steatohepatitis. Am J Physiol Gastro-intest Liver Physiol. 2017;313(1):G50–G61.
61. Wang DD, et al. Plasma ceramides, mediterranean diet, and incident cardiovascular disease in the PREDIMED Trial (Prevención con Dieta Mediter-ránea). Circulation. 2017;135(21):2028–2040.
62. Choi JH, et al. Antidiabetic actions of a non-ago-nist PPARγ ligand blocking Cdk5-mediated phos-phorylation. Nature. 2011;477(7365):477–481.
63. Zhang Y, et al. Targeted deletion of thioester-ase superfamily member 1 promotes energy expenditure and protects against obesity and insulin resistance. Proc Natl Acad Sci U S A. 2012;109(14):5417–5422.