Embed Size (px)
Citation preview
Mires and Peat, Volume 4 (2008–2010), Article 09, http://www.mires-and-peat.net/, ISSN 1819-754X
© 2010 International Mire Conservation Group and International Peat Society 1
Calculating carbon budgets of wind farms on Scottish peatlands
D.R. Nayak1, D. Miller2, A. Nolan2, P. Smith1 and J.U. Smith1
1Institute of Biological and Environmental Sciences, School of Biological Science, University of Aberdeen, UK 2 Macaulay Land Use Research Institute, Craigiebuckler, Aberdeen, UK
__________________________________________________________________________________________ SUMMARY The reliability of calculation methods for the carbon emission savings to be achieved in Scotland by replacing power generated from fossil fuels (and other more conventional sources) with that produced by large-scale wind farm developments is a cause for concern, largely in relation to wind farms sited on peatlands. Scottish Government policy is to deliver renewable energy without environmental harm, and to meet biodiversity objectives including the conservation of designated wildlife sites and important habitats such as peatlands. The implications for carbon emissions of developing a wind farm are, therefore, just one aspect of the suite of considerations that the planning system takes into account. This paper presents a simple methodology for prospectively calculating the potential carbon emission savings to be realised by developing wind farms on peatland, forestland or afforested peatland. The total carbon emission savings of an individual wind farm are estimated by accounting emissions from the power source that will be replaced by wind power against: loss of carbon due to production, transportation, erection, operation and dismantling of the wind farm components (the infrastructure overhead); loss of carbon due to backup power generation; loss of carbon stored in peat and forest; loss of carbon-fixing potential of peatland and forest; and carbon savings due to habitat improvement. Most of the carbon losses are determined by national infrastructure, but those from peat soil and plants are influenced by site selection and management practices. The extent of drainage around each constructed element of the wind farm is a major factor for greenhouse gas emissions. Consideration of an example site with a low extent of drainage, where management practices that minimise net carbon losses (e.g. undrained floating roads, habitat improvement and site restoration on decommissioning) were used indicates that emissions from the soil and plants may cancel out as little as < 6% of the potential carbon savings, even on peatland. However, if the soil had a high extent of drainage and management practices that minimise carbon losses were abandoned, greenhouse gas emissions from the soil and plants could amount to 77% of the wind farm’s gross carbon savings; in other words, even though the development would not be a net cost in terms of greenhouse gas emissions, it would not provide much benefit. Thus, the development of wind farms on peat as opposed to mineral soils incurs a much greater risk that the potential net saving of greenhouse gas emissions will be significantly reduced by poor site management practice. This means that good site selection and management is of the utmost importance if wind farms are to be developed on peatlands. KEY WORDS: carbon payback, drainage extent, life cycle analysis, management, restoration. _______________________________________________________________________________________ DEFINITIONS AND UNITS OF TERMS USED IN THE EQUATIONS Symbol Definition Units
Adirect Area affected directly by infrastructure ha
Aforest Area of forestry to be felled ha
Aindirect Area indirectly affected by drainage ha
BDfreshsoil Fresh soil bulk density g cm-3
CCH4‑C→CO2 Converts CH4-C to CO2 equivalents CO2 eq. (CH4--C)-1
creserve Reserve capacity required for backup MWh yr-1
cturb Turbine capacity MW
Mires and Peat, Volume 4 (2008–2010), Article 09, http://www.mires-and-peat.net/, ISSN 1819-754X
© 2010 International Mire Conservation Group and International Peat Society 2
Symbol Definition Units
DF Number of days in the year that the land is flooded
dpeat,i Peat depth at ith constructed feature m
dwater Water table depth m ECH4 Annual emissions of CH4 t CO2 eq. ha-1 yr-1
ECO2 Annual emissions of CO2 t CO2 ha-1 yr-1
Efuel Emission factor for fuel t CO2 MWh-1
Elife Loss of C due to infrastructure overhead t CO2 MWh-1
Gbog C fixing capacity of undeveloped peatland t CO2 ha-1 yr-1
Gforest Average C sequestered per year by growing forest t CO2 ha-1 yr-1
Lback Total loss of C emission savings due to backup power generation t CO2
LCO2 Total reduction in C due to felling t CO2
Ldirect C emissions attributable to removal of the peat only t CO2 eq. LDOC Losses of CO2 due to leaching of DOC t CO2
learly Average longevity of products after early felling Lfix Loss of C fixing capacity t CO2
Lforest Loss of CO2 due to forestry clearance t CO2
Lgas Gaseous losses of C from the different sources in the soil t C li Average length of ith constructed features m Limprovement C emissions attributable to improvement only t CO2 eq. Lindirect C emissions attributable to drainage only t CO2 eq. Llife Total loss of C due to infrastructure overhead of the wind farm t CO2
Llong Losses of C due to changes in the longevity of the timber product t CO2
lnormal Average longevity of products after normal felling years Lremoved Loss of C from the removed peat t CO2 eq. Ltot Net loss of C from the site due to wind farm development t CO2 eq. Lundrained Loss of C from peat before it is drained t CO2 eq. nturb Number of turbines pback Extra capacity needed for backup power generation % pcap Capacity factor % pCdrypeat C content of dry peat % pDOC Percentage of the total gaseous loss of C that is leached as DOC % pDOC→CO2 Percentage of the leached DOC that is eventually emitted as CO2 % pH Soil pH of the top 20 cm of peat ptherm Extra capacity needed due to reduced thermal efficiency of reserve generation % RCH4 Annual rate of CH4 emissions t CH4-C ha-1 yr-1
RCO2 Annual rate of CO2 emission t CO2 ha-1 yr-1
Sfuel Annual emission savings tCO2 yr-1
t Lifetime of the wind farm years T Air temperature °C tpayback C payback time for a wind farm years trestore Time required for habitat restoration years Vdirect Volume of peat removed m3
Vindirect Volume of peat drained m3
wi Average width of ith constructed features m εout Total annual energy output mWh yr-1
D.R. Nayak et al. CALCULATING CARBON SAVINGS FROM WIND FARMS ON SCOTTISH PEATLANDS
Mires and Peat, Volume 4 (2008–2010), Article 09, http://www.mires-and-peat.net/, ISSN 1819-754X
© 2010 International Mire Conservation Group and International Peat Society 3
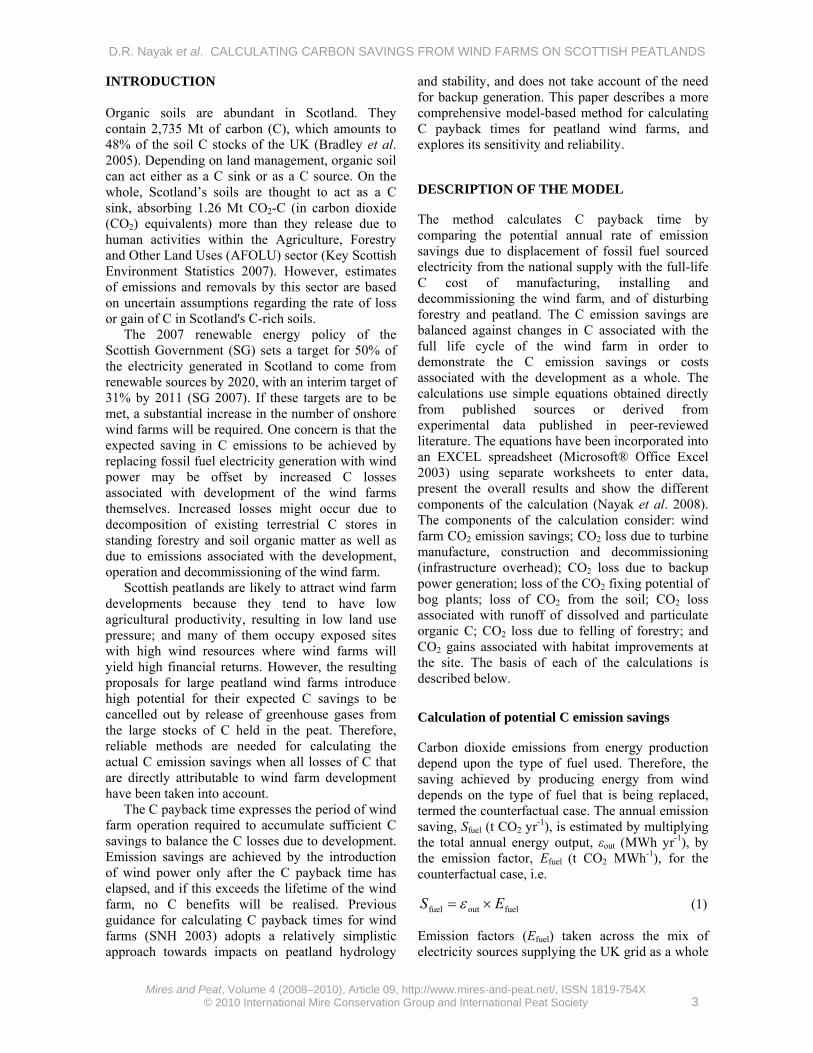
INTRODUCTION Organic soils are abundant in Scotland. They contain 2,735 Mt of carbon (C), which amounts to 48% of the soil C stocks of the UK (Bradley et al. 2005). Depending on land management, organic soil can act either as a C sink or as a C source. On the whole, Scotland’s soils are thought to act as a C sink, absorbing 1.26 Mt CO2-C (in carbon dioxide (CO2) equivalents) more than they release due to human activities within the Agriculture, Forestry and Other Land Uses (AFOLU) sector (Key Scottish Environment Statistics 2007). However, estimates of emissions and removals by this sector are based on uncertain assumptions regarding the rate of loss or gain of C in Scotland's C-rich soils.
The 2007 renewable energy policy of the Scottish Government (SG) sets a target for 50% of the electricity generated in Scotland to come from renewable sources by 2020, with an interim target of 31% by 2011 (SG 2007). If these targets are to be met, a substantial increase in the number of onshore wind farms will be required. One concern is that the expected saving in C emissions to be achieved by replacing fossil fuel electricity generation with wind power may be offset by increased C losses associated with development of the wind farms themselves. Increased losses might occur due to decomposition of existing terrestrial C stores in standing forestry and soil organic matter as well as due to emissions associated with the development, operation and decommissioning of the wind farm.
Scottish peatlands are likely to attract wind farm developments because they tend to have low agricultural productivity, resulting in low land use pressure; and many of them occupy exposed sites with high wind resources where wind farms will yield high financial returns. However, the resulting proposals for large peatland wind farms introduce high potential for their expected C savings to be cancelled out by release of greenhouse gases from the large stocks of C held in the peat. Therefore, reliable methods are needed for calculating the actual C emission savings when all losses of C that are directly attributable to wind farm development have been taken into account.
The C payback time expresses the period of wind farm operation required to accumulate sufficient C savings to balance the C losses due to development. Emission savings are achieved by the introduction of wind power only after the C payback time has elapsed, and if this exceeds the lifetime of the wind farm, no C benefits will be realised. Previous guidance for calculating C payback times for wind farms (SNH 2003) adopts a relatively simplistic approach towards impacts on peatland hydrology
and stability, and does not take account of the need for backup generation. This paper describes a more comprehensive model-based method for calculating C payback times for peatland wind farms, and explores its sensitivity and reliability. DESCRIPTION OF THE MODEL The method calculates C payback time by comparing the potential annual rate of emission savings due to displacement of fossil fuel sourced electricity from the national supply with the full-life C cost of manufacturing, installing and decommissioning the wind farm, and of disturbing forestry and peatland. The C emission savings are balanced against changes in C associated with the full life cycle of the wind farm in order to demonstrate the C emission savings or costs associated with the development as a whole. The calculations use simple equations obtained directly from published sources or derived from experimental data published in peer-reviewed literature. The equations have been incorporated into an EXCEL spreadsheet (Microsoft® Office Excel 2003) using separate worksheets to enter data, present the overall results and show the different components of the calculation (Nayak et al. 2008). The components of the calculation consider: wind farm CO2 emission savings; CO2 loss due to turbine manufacture, construction and decommissioning (infrastructure overhead); CO2 loss due to backup power generation; loss of the CO2 fixing potential of bog plants; loss of CO2 from the soil; CO2 loss associated with runoff of dissolved and particulate organic C; CO2 loss due to felling of forestry; and CO2 gains associated with habitat improvements at the site. The basis of each of the calculations is described below. Calculation of potential C emission savings Carbon dioxide emissions from energy production depend upon the type of fuel used. Therefore, the saving achieved by producing energy from wind depends on the type of fuel that is being replaced, termed the counterfactual case. The annual emission saving, Sfuel (t CO2 yr-1), is estimated by multiplying the total annual energy output, εout (MWh yr-1), by the emission factor, Efuel (t CO2 MWh-1), for the counterfactual case, i.e.
fueloutfuel ES ×= ε (1) Emission factors (Efuel) taken across the mix of electricity sources supplying the UK grid as a whole
D.R. Nayak et al. CALCULATING CARBON SAVINGS FROM WIND FARMS ON SCOTTISH PEATLANDS
Mires and Peat, Volume 4 (2008–2010), Article 09, http://www.mires-and-peat.net/, ISSN 1819-754X
© 2010 International Mire Conservation Group and International Peat Society 4
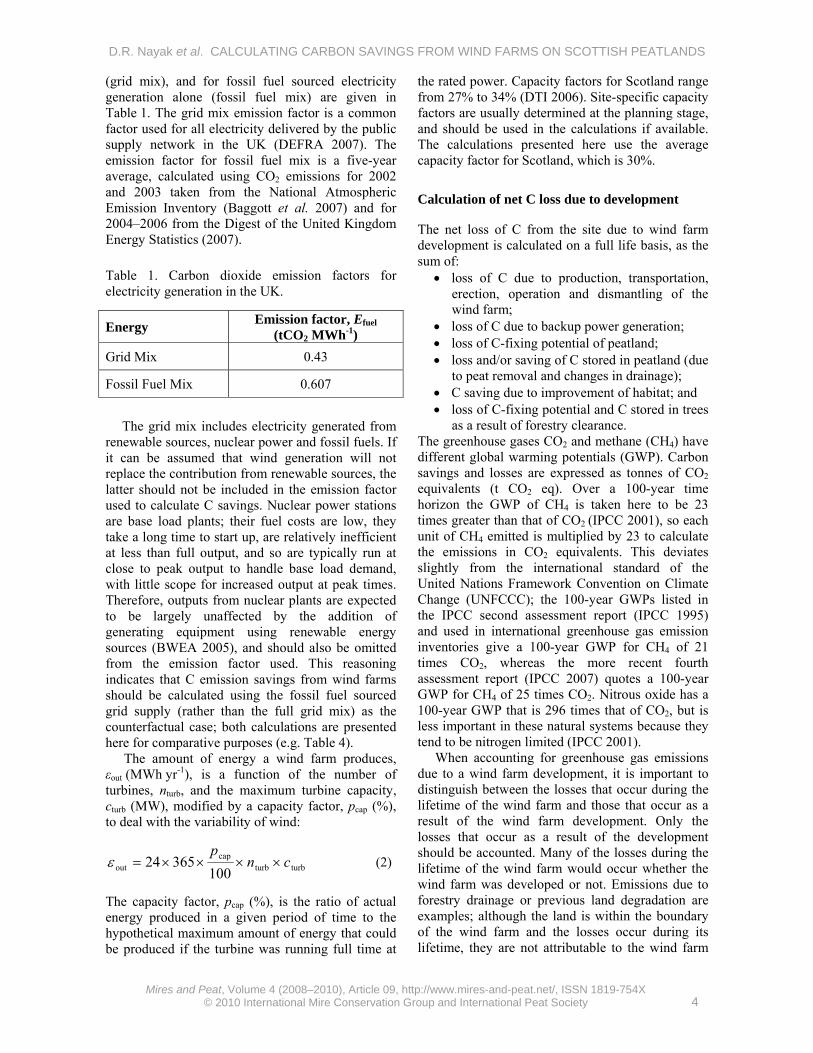
(grid mix), and for fossil fuel sourced electricity generation alone (fossil fuel mix) are given in Table 1. The grid mix emission factor is a common factor used for all electricity delivered by the public supply network in the UK (DEFRA 2007). The emission factor for fossil fuel mix is a five-year average, calculated using CO2 emissions for 2002 and 2003 taken from the National Atmospheric Emission Inventory (Baggott et al. 2007) and for 2004–2006 from the Digest of the United Kingdom Energy Statistics (2007). Table 1. Carbon dioxide emission factors for electricity generation in the UK.
Energy Emission factor, Efuel (tCO2 MWh-1)
Grid Mix 0.43
Fossil Fuel Mix 0.607
The grid mix includes electricity generated from
renewable sources, nuclear power and fossil fuels. If it can be assumed that wind generation will not replace the contribution from renewable sources, the latter should not be included in the emission factor used to calculate C savings. Nuclear power stations are base load plants; their fuel costs are low, they take a long time to start up, are relatively inefficient at less than full output, and so are typically run at close to peak output to handle base load demand, with little scope for increased output at peak times. Therefore, outputs from nuclear plants are expected to be largely unaffected by the addition of generating equipment using renewable energy sources (BWEA 2005), and should also be omitted from the emission factor used. This reasoning indicates that C emission savings from wind farms should be calculated using the fossil fuel sourced grid supply (rather than the full grid mix) as the counterfactual case; both calculations are presented here for comparative purposes (e.g. Table 4).
The amount of energy a wind farm produces, εout (MWh yr-1), is a function of the number of turbines, nturb, and the maximum turbine capacity, cturb (MW), modified by a capacity factor, pcap (%), to deal with the variability of wind:
turbturbcap
out 10036524 cn
p××××=ε (2)
The capacity factor, pcap (%), is the ratio of actual energy produced in a given period of time to the hypothetical maximum amount of energy that could be produced if the turbine was running full time at
the rated power. Capacity factors for Scotland range from 27% to 34% (DTI 2006). Site-specific capacity factors are usually determined at the planning stage, and should be used in the calculations if available. The calculations presented here use the average capacity factor for Scotland, which is 30%. Calculation of net C loss due to development The net loss of C from the site due to wind farm development is calculated on a full life basis, as the sum of:
• loss of C due to production, transportation, erection, operation and dismantling of the wind farm;
• loss of C due to backup power generation; • loss of C-fixing potential of peatland; • loss and/or saving of C stored in peatland (due
to peat removal and changes in drainage); • C saving due to improvement of habitat; and • loss of C-fixing potential and C stored in trees
as a result of forestry clearance. The greenhouse gases CO2 and methane (CH4) have different global warming potentials (GWP). Carbon savings and losses are expressed as tonnes of CO2 equivalents (t CO2 eq). Over a 100-year time horizon the GWP of CH4 is taken here to be 23 times greater than that of CO2 (IPCC 2001), so each unit of CH4 emitted is multiplied by 23 to calculate the emissions in CO2 equivalents. This deviates slightly from the international standard of the United Nations Framework Convention on Climate Change (UNFCCC); the 100-year GWPs listed in the IPCC second assessment report (IPCC 1995) and used in international greenhouse gas emission inventories give a 100-year GWP for CH4 of 21 times CO2, whereas the more recent fourth assessment report (IPCC 2007) quotes a 100-year GWP for CH4 of 25 times CO2. Nitrous oxide has a 100-year GWP that is 296 times that of CO2, but is less important in these natural systems because they tend to be nitrogen limited (IPCC 2001).
When accounting for greenhouse gas emissions due to a wind farm development, it is important to distinguish between the losses that occur during the lifetime of the wind farm and those that occur as a result of the wind farm development. Only the losses that occur as a result of the development should be accounted. Many of the losses during the lifetime of the wind farm would occur whether the wind farm was developed or not. Emissions due to forestry drainage or previous land degradation are examples; although the land is within the boundary of the wind farm and the losses occur during its lifetime, they are not attributable to the wind farm
D.R. Nayak et al. CALCULATING CARBON SAVINGS FROM WIND FARMS ON SCOTTISH PEATLANDS
Mires and Peat, Volume 4 (2008–2010), Article 09, http://www.mires-and-peat.net/, ISSN 1819-754X
© 2010 International Mire Conservation Group and International Peat Society 5
development. On the other hand, some types of emissions - e.g. those due to drainage of the soil for construction of access tracks - will occur only if the wind farm is developed, and may continue beyond its lifetime. Even if the wind farm has been decommissioned and the land no longer belongs to the wind farm company, any continued losses due to the presence of access tracks that would not have been constructed unless the wind farm had been developed are attributable to the wind farm. These principles have been applied in deciding whether or not emissions should be attributed to the wind farm throughout the calculations. Infrastructure overhead Ideally, a full life cycle analysis should be carried out to calculate the total loss of C due to the infrastructure overhead of the wind farm, Llife (t CO2). This analysis may be prohibitively expensive on a site-by-site basis, so generic data are provided as an alternative. Appropriate values reported in the peer-reviewed literature range from 0.006 (White & Kulcinski 2000) to 0.034 t CO2 MWh-1 (White 2007), unless the turbines are produced in countries with very high-emission grid mixes such as Japan (infrastructure overhead 1.237 t CO2 MWh-1; Lenzen & Munksgaard 2002). Defensible figures for the specific type of turbine and its place of manufacture should be used wherever possible, but if these are unavailable, CO2 emissions due to the infrastructure overhead, Llife (t CO2), can be estimated from the turbine capacity, cturb (MW), using the following equations for turbines of capacity less than 1MW (Equation 3) and equal to or greater than 1MW (Equation 4) respectively: Llife = 517.62 × cturb – 0.1788 (3) Llife = 934.35 × cturb – 467.55 (4) These equations were derived from data for 21 European sites (Lenzen & Munksgaard 2002, Vestas 2005, Ardente et al. 2006). Equation 3 (<1 MW) was derived from 14 measurements by regression analysis, and has an associated R2 value of 63%, P < 0.001. By statistical convention, the relationship can be considered to be highly significant if P < 0.01. Equation 4 (≥ 1 MW) was derived similarly from seven measurements; the associated R2 value is 85%, P < 0.01, and thus again highly significant.
It is noteworthy that equivalent infrastructure costs are not currently included in standard calculations of C emissions for conventional power sources, so that published life cycle C costs for coal and gas generating plant are slightly under-
estimated. Therefore, it is suggested that the infrastructure overhead should be omitted from the calculations if a direct comparison of wind farms with coal and gas generating plants is being conducted. However, it should be included in calculations of C payback time and in determining whether a net reduction of GHG emissions is achieved by a wind farm development. Loss of carbon due to backup power generation Wind generated electricity is inherently variable, setting unique challenges for the electricity generating industry in providing a supply that will always meet consumer demand (Bouillon et al. 2004). In order to stabilise the supply to the consumer, backup power is required to complement wind generation. The extra capacity needed for backup power generation, pback (%), is estimated at 5% of the rated capacity of the wind plant if wind power contributes more than 20% of the total supply to the National Grid (Dale et al. 2004). If fossil fuel provides the backup, there will be associated C emissions; but because backup power is useful energy which can be stored and used over time in the National Grid, these emissions are not additional to the total emissions arising from non-wind power generation, and are not accounted against the wind farm C emission savings. However, additional emissions result from reduced thermal efficiency of the reserve generation facilities, ptherm (%), due to plant running at sub-optimal rate. Dale et al. (2004) report that the additional emissions due to reduced thermal efficiency are approximately 10% of the backup power (ptherm = 10%).
The total loss of C emission savings due to backup power generation, Lback (t CO2), is calculated from the additional emissions, ptherm (%), the reserve capacity required for backup, creserve (MWh yr-1), the backup fuel emission factor, Efuel (t CO2 MWh-1), and the lifetime of the wind farm, t (years), as:
The reserve capacity required for backup, creserve (MWh yr-1), is estimated from the number of turbines on the wind farm, nturb, the turbine capacity, cturb (MW), and the extra capacity needed for backup power generation, pback (%), as:
( ) ⎟⎠⎞
⎜⎝⎛ ××××=
10024365 back
turbturbreservep
cnc (6)
According to Scottish Government targets, the contribution of renewables to the National Grid supply will be 31% by 2011 and 50% by 2020; and the Renewable Energy Statistics Database for the UK (2008) states that 23% of the electricity generated from renewables was from wind energy
t E cp
L × ××= fuelreservetherm
back 100(5)
D.R. Nayak et al. CALCULATING CARBON SAVINGS FROM WIND FARMS ON SCOTTISH PEATLANDS
Mires and Peat, Volume 4 (2008–2010), Article 09, http://www.mires-and-peat.net/, ISSN 1819-754X
© 2010 International Mire Conservation Group and International Peat Society 6
(offshore and onshore) in 2006. Assuming that total electricity generation from renewables continues to increase at the rate set by the Scottish Government targets and the relative contribution of wind energy remains unchanged, linear extrapolation suggests that the contribution of onshore wind power to the National Grid supply will be less than 20% until 2038. If no extra capacity is needed for backup until the quantity of wind generated electricity reaches this threshold, the appropriate value of pback for a wind farm in Scotland with a 25-year lifetime, commissioned in 2006, will be 0%. However, in order to illustrate the impact of backup power generation on the emissions, we have assumed that wind power already contributes more than 20% of the total supply to the National Grid, and so the extra capacity needed for backup power generation, pback, is 5% (Dale et al. 2004). Loss of carbon fixing capacity of peatland Construction of a wind farm involves the installation of infrastructure such as turbine foundations, crane hard-standings, access tracks and works compounds. Whether vegetation and/or peat are removed from the areas occupied or simply covered over, the vegetation will no longer photosynthesise, so that its capacity to fix C will be lost. During construction and operation, the soil may be drained unintentionally as well as by design. Drainage has significant effects on the vegetation of peatlands (Stewart & Lance 1991). Therefore, C fixing capacity is assumed to be lost from both the area occupied by infrastructure and the area affected by drainage. Thus, loss of C fixing capacity, Lfix (t CO2), is calculated from the area affected directly by infrastructure, Adirect (ha), and indirectly by drainage Aindirect (ha), the C fixing capacity of undeveloped peatland, Gbog (t CO2 ha-1 yr-1), and the time required until successful habitat restoration, trestore (years), as:
( ) restorebogindirectdirectfix tGAAL ××+= (7)
Estimates of the global average apparent C accumulation rate in peatland range from 0.12 to 0.31 t C ha-1 yr-1 (Botch et al. 1995, Turunen et al. 2001); and if available, site-specific data for Gbog could be used. However, as this loss represents a very small fraction of the total emissions, the mid-range value from the SNH (2003) guidance (0.25 t C ha-1 yr-1 = 0.92 t CO2 ha-1 yr-1) is an adequate surrogate.
It should be noted that trestore includes the time from initial disturbance of the habitat until full recovery of drainage and species composition. If habitat restoration is not initiated until after
decommissioning, trestore will be a number of years longer than the lifetime of the wind farm. However, if parts of the site are restored before decommissioning, C fixation may be re-established more quickly, and the value of trestore will be reduced. The important principle here is that the model should account fully for all impacts that are attributable to wind farm operations, whether they occur before or after decommissioning. Losses due to reduced C fixing capacity resulting from development of a wind farm may well continue beyond its lifetime, but as the losses were caused by the wind farm they should still be accounted. If losses beyond the lifetime of the wind farm were not included, the impact of the development on emissions would be under-estimated, and the model would lack capability to adequately reflect the reductions in C payback time that result from good practice such as habitat restoration.
It is emphasised that the model does not pre-judge the likelihood of successful restoration of a site, and it is incumbent on users to provide defensible input data. If, for example, at a wind farm site on blanket bog, habitat restoration is unlikely to be successful, the habitat should be specified as not being restored, or as being restored many years after decommissioning of the wind farm. In this case the carbon input might no longer be from bog plants, but from replacement species. Loss of carbon from drained peat C is lost indirectly as a result of wind farm construction, from the area affected by drainage. However, flooded peat soils are not zero-emitters of greenhouse gases; they emit less CO2 but more CH4 than when drained. Therefore, to calculate the C emissions attributable to drainage only, Lindirect (t CO2 eq.), any emissions of CO2 and CH4 occurring if the peat had remained undrained are subtracted from the emissions occurring after drainage, i.e.
undraineddrainedindirect LLL −= (8) When soils are aerated, the rate of aerobic decomposition increases such that C emissions usually exceed plant fixation, so the net exchange of C with the atmosphere tends to be positive. When flooded soils are drained, loss of soil C continues until a new stable state is reached: for peat, this is close to 0% C (IPCC 1997). Although, following decommissioning and without further intervention, the drains installed for a wind farm may eventually become blocked, this would be a fortuitous event that should not be credited to the wind farm developer. Similarly, any changes to the drainage
D.R. Nayak et al. CALCULATING CARBON SAVINGS FROM WIND FARMS ON SCOTTISH PEATLANDS
Mires and Peat, Volume 4 (2008–2010), Article 09, http://www.mires-and-peat.net/, ISSN 1819-754X
© 2010 International Mire Conservation Group and International Peat Society 7
regime resulting from actions of the new land user after decommissioning should not be attributed to the present developer. Therefore, if the site is not restored after the wind farm is decommissioned, it is assumed that 100% of the C will be lost from the drained volume of peat. For drained peatland that is not restored, loss of C, Ldrained (t CO2 eq), is calculated from the C content of dry peat, pCdrypeat (%), the dry soil bulk density (dried to constant weight at 105°C), BDdrysoil (g cm-3), and the volume of drained peat, Vindirect (m3) as follows:
indirectsoildry peatdry CO2C-CO2
drained 100VBDpC
CL ×××= →
(9)
The factor CCO2-C→CO2 converts the loss of CO2-C to CO2 equivalents and is given by (molecular weight of CO2 = 44) / (atomic weight of C = 12) = 3.667; dividing by 100 converts the percentage C content of dried peat into a fraction.
Restoration of the site could potentially halt C loss processes, allowing CO2 emissions to be limited to a period, trestore, starting when the wind farm is constructed and ending when the habitat and hydrological conditions are fully restored after decommissioning. The amount of C lost from the drained soil is then time-bound, and so is instead calculated from the annual emissions of CH4, ECH4 (t CO2 eq. ha-1 yr-1), the annual emissions of CO2, ECO2 (t CO2 ha-1 yr-1), the area of drained peat, Aindirect (ha), and trestore (years), as:
( ) restoreindirectCO2CH4drained tAEEL ××+= (10) It is valid to estimate the C losses in this way, rather than assuming that all C in the drained peat is lost as in Equation 9, only if the restoration plan for the site demonstrates a high probability that peat hydrology will be restored and disturbance of peat minimised. The amount of C lost if the soil had remained undrained is calculated similarly, but using values of ECH4 and ECO2 for undrained soils, as:
( ) restoreindirectCO2CH4undrained tAEEL ××+= (11)
The annual emissions of CH4 are calculated using the following equation:
CO2CCH4F
CH4CH4 365 →−××= CD
RE (12)
where ECH4 is the total annual emissions of CH4 (t CO2 eq. ha-1 yr-1), RCH4 is the annual rate of CH4 emissions from flooded sites (t CH4-C ha-1 yr-1), DF is the number of days in the year that the land is flooded, and CCH4-C→CO2 converts CH4-C to CO2
equivalents (CCH4-C→CO2 = 30.67 CO2 eq. (CH4-C)-1; IPCC 2001). This equation does not presume that the maximum rate of CH4 emissions occurs during the flooded period; it may occur during the wetting and drying periods immediately before or after full flooding. The number of days flooded is used simply as a surrogate for the number of days when the soil is under anaerobic conditions and CH4 emissions due to the anaerobic process of methanogenesis are likely to be occurring.
The annual emissions of CO2 are calculated similarly, using the equation:
( )365
365 FCO2CO2
DRE
−×= (13)
where ECO2 is the total annual emissions of CO2 (t CO2 ha-1 yr-1), RCO2 is the annual rate of CO2 emission (t CO2 ha-1 yr-1) from drained soil, and DF is the number of days per year that the land is flooded.
The emission factors used (RCO2 and DF) differ between drained and undrained conditions. The IPCC (1997) default factors for acid bogs and fens in cool temperate zones are given in Table 2. When the soil is undrained, the period of flooding is based on the monthly mean temperature and the length of inundation. When the soil is drained, the period of flooding is assumed to be zero (DF = 0 days yr-1). If suitable topography and/or underlying impermeable layers are present, a drained site may occasionally flood due to exceptionally high rainfall. However, this is a very site-specific effect. A site-specific value for DF (the number of days flooded) can be entered if known, for example if a significant period of flooding is expected during each year. Here, the IPCC default values are used.
The generic IPCC emission factors in Table 2 are average values for cool temperate peatlands and their use precludes the entry of site-specific information such as water table depth before wind farm development. The water table may be already lowered, before any drainage associated with the wind farm occurs, for example due to site disturbance or climate change. Site-specific equations have been developed for such circumstances, using simple regression analyses of experimental data for CO2 and CH4 losses on acid bogs and fens derived from peer-reviewed literature (Bubier et al. 1993, Martikainen et al. 1995, Silvola et al. 1996, MacDonald et al. 1998, Nykänen et al. 1998, Alm et al. 1999). For each GHG, equations relating the rate of emissions to peat temperature, T (°C), and water table depth, W (m), were derived separately for acid bogs and fens.
D.R. Nayak et al. CALCULATING CARBON SAVINGS FROM WIND FARMS ON SCOTTISH PEATLANDS
Mires and Peat, Volume 4 (2008–2010), Article 09, http://www.mires-and-peat.net/, ISSN 1819-754X
© 2010 International Mire Conservation Group and International Peat Society 8
Table 2. IPCC default factors for calculation of CH4 and CO2 emissions (IPCC 1997).
Acid Bogs Fens
Number of days in the year that land is flooded, DF
178 169
Annual rate of CO2 emissions from drained soils, RCO2 (t CO2 ha-1 yr-1)
35.2 35.2
Annual rate of CH4 emissions from flooded soils, RCH4 (t CH4-C ha-1 yr-1)
4.015 x 10⁻² 0.219
The equation for CO2 emissions from acid bogs
(Equation 14) was derived from 60 measurements, and has an associated R2 value of 53%, P < 0.0001 (highly significant). Evaluation against 29 independent measurements shows a significant association (r2 = 0.21; P > 0.05) and an average error of 3.023 t CO2 ha-1 yr-1, which is non-significant (P < 0.05) and within experimental error (Smith et al. 1997). The equation for CO2 emissions from fens (Equation 16) was derived from 44 measurements and the R2 value is 42%, P <0.0001
(again highly significant). Evaluation against 18 independent measurements shows a significant association (r2 = 0.56; P > 0.05) and an average error of 2.108 t CO2 ha-1 yr-1 (significance not defined due to lack of replicates; Smith et al. 1997). The factor CCO2-C→CO2 converts the losses of CO2-C to CO2 equivalents and is given by (molecular weight of CO2 = 44) / (atomic weight of C = 12) = 3.667; dividing by 1000 converts from kg C to t C.
The equation for CH4 emissions from acid bogs (Equation 16) was derived from 57 measurements; the R2 value is 54%, P < 0.0001 (highly significant). Evaluation against seven independent measurements shows a significant association (r2 = 0.81; P > 0.05) and an average error of 0.027 t CH4-C ha-1 yr-1
(significance not defined due to lack of replicates). The equation for CH4 emissions from fens (Equation 18) was derived from 35 measurements and the R2 value is 41%, P < 0.0001 (highly significant). Evaluation against seven independent measurements shows a significant association (r2 = 0.69; P > 0.05) and an average error of 0.164 t CH4-C ha-1 yr-1 (significance not defined due to lack of replicates). The factor CCH4-C→CO2 converts CH4-C to CO2
equivalents (CCH4-C→CO2 = 30.67 CO2 eq. (CH4-C)-1; dividing by 1000 converts from kg C to t C.
For acid bogs:
)800)54.72(())))50)100((0515.0exp(26.0exp(6700((1000
222 −×+−××−×−××= →− TWCR COCCO
CO (14)
)67.36)529.3(())100()1234.0exp(500((1000
244 −×+××−××= →− TWCR COCCH
CH (15)
For fens:
)23.153())))50)100((073.0exp(175.0exp(16244((1000
222 TWCR COCCO
CO ×+−××−×−××= →− (16)
)662.0())100()097.0exp(62.56310((1000
244 TWCR COCCH
CH ×+××−×+−×= →− (17)
Loss of carbon from removed peat Where it is necessary to excavate peat to achieve firm foundations for infrastructure, C is removed directly. The impact of peat removal is estimated from the volume of peat removed. If the excavated peat is not restored, all of the C contained in the peat is assumed to be lost. If the excavated peat is later reinstated in an improved habitat, so potentially reducing the C losses from excavated peat, this is added to the area and depth of the improved site. This allows good peat preservation practices to be accounted for in the C emission savings. However, C emissions should be considered to have been
avoided only if the peat is returned to the site with complete restoration of the peatland hydrology and habitat. Losses of C during storage of the peat are accounted until full restoration is complete.
To calculate the C emissions attributable to removal of the peat only, Ldirect (t CO2 eq.), any emissions occurring if the soil had remained in situ and undrained, Lundrained (t CO2 eq.), are subtracted from the emissions occurring after removal with drainage assumed, Lremoved (t CO2 eq.):
undrainedremoveddirect LLL −= (18)
D.R. Nayak et al. CALCULATING CARBON SAVINGS FROM WIND FARMS ON SCOTTISH PEATLANDS
Mires and Peat, Volume 4 (2008–2010), Article 09, http://www.mires-and-peat.net/, ISSN 1819-754X
© 2010 International Mire Conservation Group and International Peat Society 9
Losses from the undrained soil are calculated as described in the previous section. Loss of C from the removed peat, Lremoved (t CO2), is calculated from the C content of dry peat, the dry soil bulk density and the volume of peat removed, in a similar way to losses from drained peat that is not restored on decommissioning (Equation 9). The total volume of peat removed during construction, Vdirect (m3), is calculated from the dimensions of the excavations required to accommodate the structures introduced to the site during development. If construction (i) has average length li (m), width wi (m) and depth dpeat,i (m), then:
( )∑ ××=i
ipeat,iidirect dwlV (19)
Loss of CO2 due to leaching of dissolved and particulate organic carbon Besides raising decomposition rates (due to increased aeration), lowering the water table by drainage may reduce the potential for dissolved organic C (DOC) and particulate organic C (POC) retention within the soil (e.g. Holden et al. 2004, Worrall et al. 2004). A recent study by Wallage et al. (2006) confirms that losses of DOC are higher from drained than from undrained peatland. Losses of CO2 due to leaching of DOC, LDOC (t CO2), are calculated by multiplying the sum of the gaseous losses of C from the different sources in the soil, Lgas (t C), by the percentage of the total gaseous loss of C that is leached as DOC, pDOC (%), and the percentage of the leached DOC that is eventually emitted as CO2, pDOC→CO2 (%), as follows:
)20(100 gas
DOCCO2DOCCO2CCO2DOC LCL ×
××= →
→−
ρρ
As previously, CCO2-C→CO2 converts the loss of CO2-C to CO2 equivalents and is given by (molecular weight of CO2 = 44 ) / (atomic weight of C = 12) = 3.667; dividing by 100 converts pDOC→CO2 into a fraction. Losses due to leaching of DOC are assumed to be less than 10% of total C loss from the drained and improved peatland (pDOC = 10; cf. Dillon & Molot 1997, Worrall et al. 2003), and it is assumed that 100% of the DOC is eventually emitted as CO2 (pDOC→CO2 = 100). Losses of particulate organic matter are calculated similarly, assuming the percentage loss is less than 15% of the total gaseous C losses (cf. Worrall et al. 2003). This is a necessarily simplistic approach, but is not expected to introduce large errors because leached carbon is a small component of the total losses from the system.
Loss of carbon due to erosion The Scottish Executive (2006) has established a rigorous procedure for identifying existing, potential and construction-induced peat landslide hazards which should reduce the likelihood of peat landslides actually occurring. It is assumed that all of the recommended measures are in place and effective, so that the risk of peat landslide is zero and no associated C losses will occur. However, any drainage measures that are employed to mitigate the peat landslide risk should be accounted for using the appropriate methods described above. Loss or saving of carbon due to forest clearance The presence of extensive areas of forestland on and in the vicinity of the wind farm site may significantly reduce the yield of wind energy, making it necessary to clear existing forest. If a displaced forest was in any case due to be felled with no plan to replant, the effect of the land use change is not attributable to wind farm development and should be omitted from the calculation. However, if the forest is felled solely to make way for the wind farm, the resulting changes in timber, residues and soil conditions are attributed to the wind farm. The loss of CO2 due to forest clearance, Lforest (t CO2), is obtained from the area of forest to be felled, Aforest (ha), the average rate of C sequestration in trees expected over the lifetime of the wind farm if the forest is not felled, Gforest (t CO2 ha-1 yr-1), and the lifetime of the wind farm, t (years):
tGAL ××= forestforestforest (21)
For most sites, the forest being felled will be commercial forestry, so the loss of C sequestration is assumed to be limited to the lifetime of the wind farm. This is because normal practice would be for the land to revert to forestry control after decommissioning and for the normal cycle of tree planting and felling to continue thereafter. If the land does not revert to forestry, the loss of CO2 due to forest clearance would be the quantity of C which would have been sequestered over the remaining period of the normal lifespan of the trees.
The amount of C lost from timber and residues depends upon the type of tree, the age of the crop on felling, the end use of the timber, and how quickly any stored C is returned to the atmosphere. Cannell (1999) provides the estimates for average amounts of C sequestered over the crop rotation by fast (e.g. poplar), medium (e.g. Sitka spruce), and slow (e.g. beech) growing trees shown in Table 3. These figures are for trees grown on mineral soils and the rates of sequestration may differ from those for trees grown on peat. However, in the absence of data for
D.R. Nayak et al. CALCULATING CARBON SAVINGS FROM WIND FARMS ON SCOTTISH PEATLANDS
Mires and Peat, Volume 4 (2008–2010), Article 09, http://www.mires-and-peat.net/, ISSN 1819-754X
© 2010 International Mire Conservation Group and International Peat Society 10
peat soils, they provide reasonable estimates of the sequestration rates for the different species. Table 3. Carbon sequestration rates for different tree species, from Cannell (1999).
Poplar Sitka Beech
Yield Class (m3 ha-1 yr-1) 12 16 6
Carbon sequestered, Gforest (t CO2 ha-1 yr-1) 26.8 13.2 8.8
Crop rotation (years) 26 55 92
CO2 sequestered per crop rotation (t CO2 ha-1) 694.66 724.68 808.86
The losses of C from tree biomass also depend
on the fate of wood products following felling. Forest may be felled earlier than planned due to the wind farm development, so limiting the nature and longevity of wood products. This source of loss has not been included in the calculations.
The amount of C in European forest soils is approximately the same as that in tree biomass (Smith et al. 2006). Managed arable and grassland soils store significantly less C than soils under forestry or semi-natural management (Smith et al. 2005, 2006). Although many of these observations were made on mineral soils, the work illustrates how the change in soil C stocks on tree removal will depend on subsequent land management, especially the drainage regime. These changes are calculated as described in the next section below. CO2 saving due to habitat improvement Habitat improvement refers to the improvement of degraded habitat during the lifetime of the wind farm resulting from active management measures such as blocking drains, re-introducing species and sometimes re-surfacing areas with peat. If the hydrology of a disturbed and drained site is returned to its original state and effort is made to regenerate the original peatland species composition, CO2 losses from the site can be significantly reduced (Komulainen et al. 1999, Tuittila et al. 1999).
Improvement of the habitat at disturbed sites can significantly alter C emissions by preventing further losses and increasing C storage in the improved habitat. For use of this option to be valid, the habitat management plan should demonstrate a high probability that peatland hydrology will be improved and disturbance of peat minimised. In
order to achieve habitat improvement, the developers should have put in place measures that will promote continued self-sustaining recovery of natural peatland functions (including surface carbon balance) without further intervention following decommissioning of the site. The improved habitat may not be in the vicinity of the wind turbines, but if the work to improve the habitat comprises part of the habitat management plan established in the environmental statement, any changes in greenhouse gas emissions should be attributed to the wind farm. This does not pre-judge the likelihood of successful improvement of the habitat; the user should make an informed judgement as to whether successful improvement of the habitat is likely.
To calculate the C emissions attributable to improvement only, Limprovement (t CO2 eq.), any emissions that would have occurred if the soil had remained drained are subtracted from the emissions occurring after flooding (negative, indicates a net reduction in emissions):
drainedundrainedtimprovemen LLL −= (22) Emissions from drained and undrained soils are calculated as described in Equation 9 et seq. Carbon gains due to site improvement are estimated using IPCC default values (IPCC 1997) or site-specific equations derived from the scientific literature as described above. Emissions of nitrous oxide are assumed to be negligible in unfertilised peatlands (Martikainen et al. 1993, IPCC 1997). Calculation of C payback time The C payback time for a wind farm, tpayback (years), is calculated by comparing the net loss of C from the site due to wind farm development, Ltot (t CO2 eq.), with the yearly C savings achieved by the wind farm whilst it is displacing electricity generated from grid mix or fossil fuel mix, Sfuel (tCO2 yr-1):
fuel
totpayback S
Lt = (23)
The net loss of C from the site due to wind farm development, Ltot (t CO2 eq.), is calculated as the sum of lifetime C losses (t CO2) due to infrastructure overhead, (Llife), backup power generation, (Lback), loss of C fixing capacity of peatland, (Lfix), removal of peat, (Ldirect), drainage, (Lindirect), leaching of dissolved organic C, (LDOC), forest clearance, (Lforest), and improvement, (Limprovement) (negative = gain) (Equation 24).
timprovemenforestDOCindirectdirecfixbacklifetot LLLLLLLLL t +++++++= (24)

D.R. Nayak et al. CALCULATING CARBON SAVINGS FROM WIND FARMS ON SCOTTISH PEATLANDS
Mires and Peat, Volume 4 (2008–2010), Article 09, http://www.mires-and-peat.net/, ISSN 1819-754X
© 2010 International Mire Conservation Group and International Peat Society 11
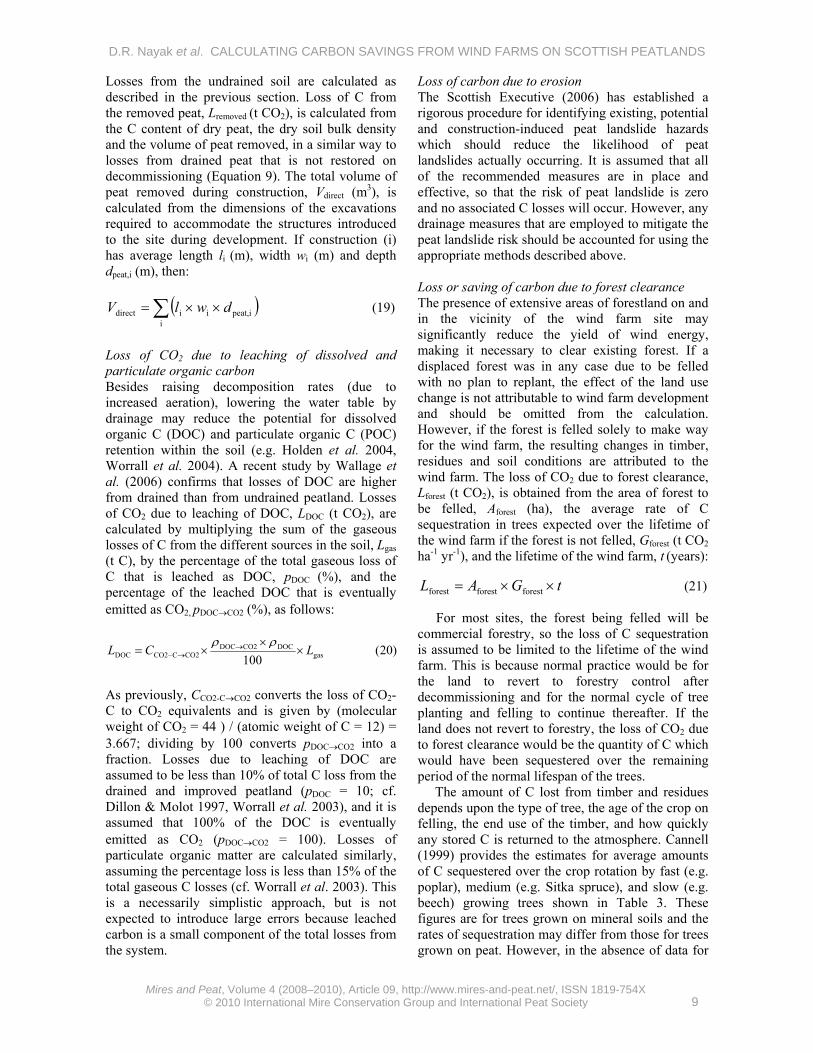
Example calculation The input sheet for an example calculation, for a real but un-named (for reasons of commercial confidentiality) wind farm in Scotland, is shown in Figure 1. It is well managed, and includes many features that might be found in a typical Scottish wind farm. However, the results should not be taken as an indication of typical losses from Scottish wind farms on peatlands as each site is different and the actual C payback time is highly dependent on site-specific features. The characteristics of the wind farm are represented graphically in Figure 2. It is located entirely on peat of average depth 2 m. The capacity factor (pcap) is 30%, and nturb = 67 x cturb = 2MW turbines are installed, each with a 15m x 15m foundation and associated 20m x 40m hard-standing area. The extent of drainage around each drainage feature is assumed to be 100m. The 24.6 km of access tracks are constructed as ‘floating roads’ and it is assumed that the roads do not sink, and so do not require drainage. The total area of forest plantation felled and not replanted due to the development is 480 ha. The habitat management plan sets out a scheme to improve the 480 ha previously under forestry plus 385 ha of degraded bog, by blocking drains and re-introducing bog plants. It is also planned that the site will be fully restored on decommissioning.
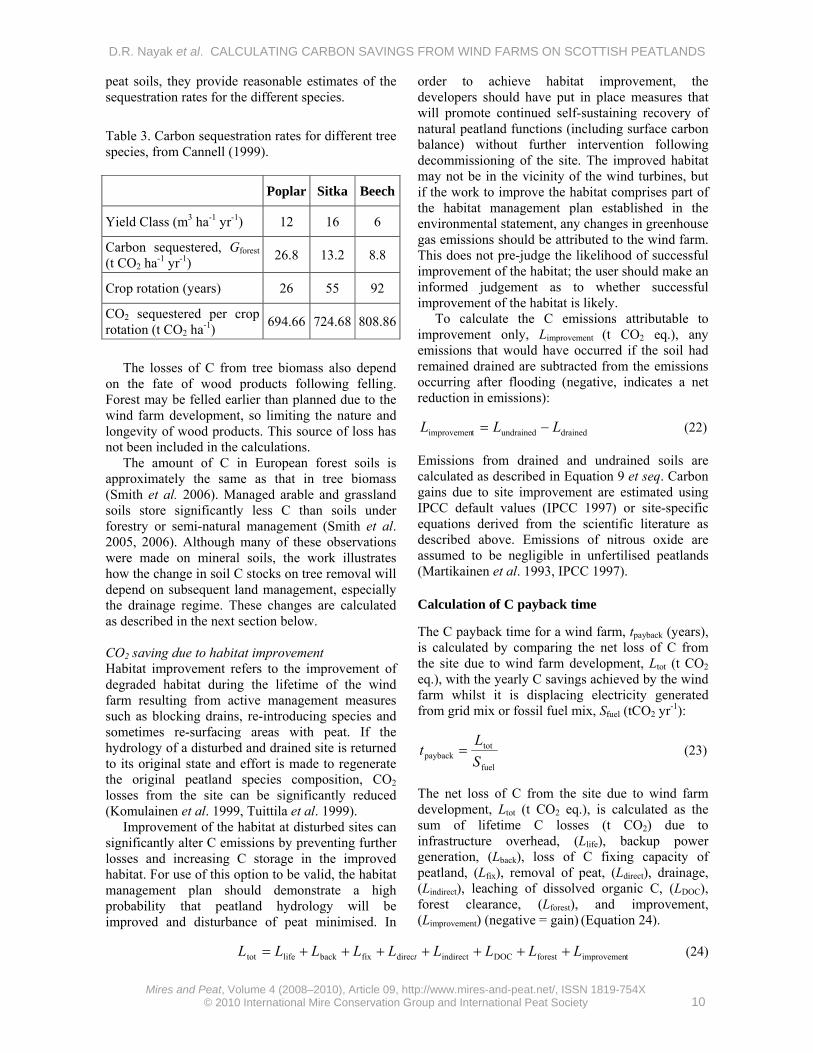
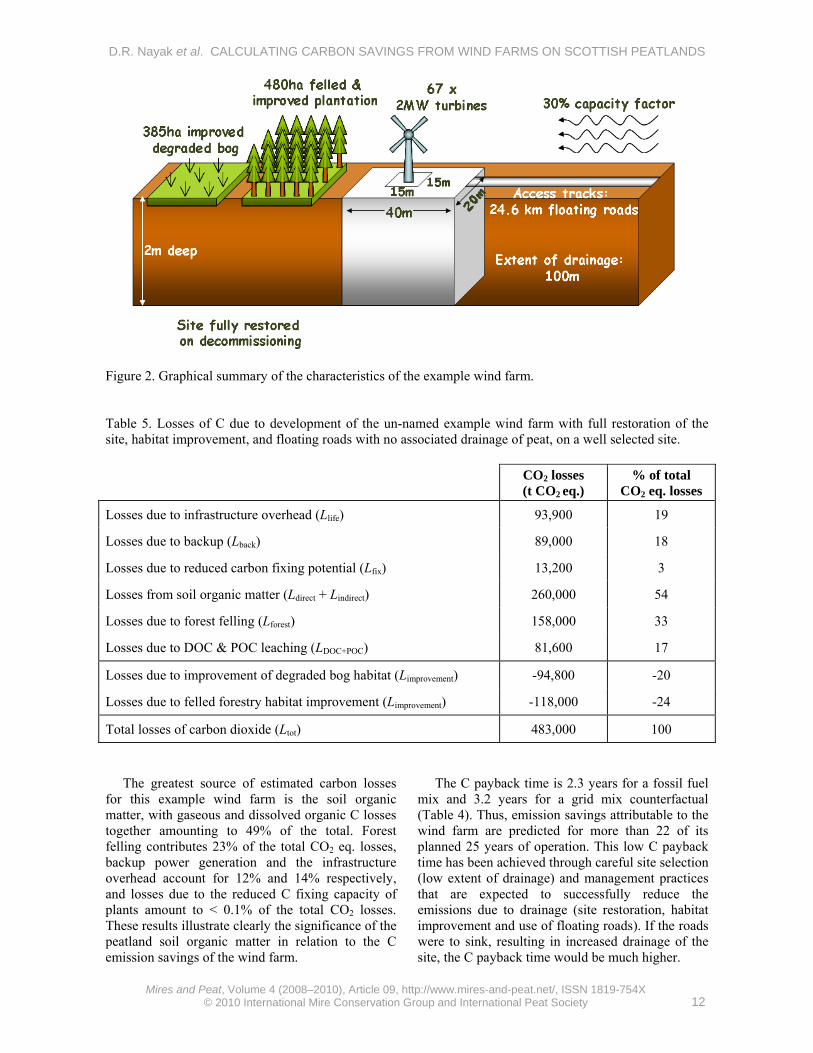
The wind farm emission savings and C payback times for the counterfactual cases of grid mix and fossil fuel mix are given in Table 4. The CO2 saving if the wind-derived energy replaces grid mix generation is 71% of the saving calculated using the fossil fuel counterfactual, in direct proportion to the emission factors given in Table 1. The fossil fuel counterfactual gives more realistic results because wind energy is not expected to substitute other components of the grid mix. The different components of CO2 losses due to the wind farm development are given in Table 5, and the contributions of the different loss processes to the overall CO2 losses due to the wind farm are shown graphically in Figure 3. Table 4. Carbon dioxide emission savings and carbon payback time for the example wind farm.
Total C payback time of wind farm Sfuel
Carbon dioxide saving
(tCO2 yr-1) (months) (years)
Grid mix 151,000 38 3.2
Fossil fuel mix 214,000 27 2.3
Figure 1. Format of the Excel input sheet for an example un-named wind farm, depicting the layout of information as it is entered into the model.
D.R. Nayak et al. CALCULATING CARBON SAVINGS FROM WIND FARMS ON SCOTTISH PEATLANDS
Mires and Peat, Volume 4 (2008–2010), Article 09, http://www.mires-and-peat.net/, ISSN 1819-754X
© 2010 International Mire Conservation Group and International Peat Society 12
Figure 2. Graphical summary of the characteristics of the example wind farm. Table 5. Losses of C due to development of the un-named example wind farm with full restoration of the site, habitat improvement, and floating roads with no associated drainage of peat, on a well selected site.
CO2 losses (t CO2 eq.)
% of total CO2 eq. losses
Losses due to infrastructure overhead (Llife) 93,900 19
Losses due to backup (Lback) 89,000 18
Losses due to reduced carbon fixing potential (Lfix) 13,200 3
Losses from soil organic matter (Ldirect + Lindirect) 260,000 54
Losses due to forest felling (Lforest) 158,000 33
Losses due to DOC & POC leaching (LDOC+POC) 81,600 17
Losses due to improvement of degraded bog habitat (Limprovement) -94,800 -20
Losses due to felled forestry habitat improvement (Limprovement) -118,000 -24
Total losses of carbon dioxide (Ltot) 483,000 100
The greatest source of estimated carbon losses for this example wind farm is the soil organic matter, with gaseous and dissolved organic C losses together amounting to 49% of the total. Forest felling contributes 23% of the total CO2 eq. losses, backup power generation and the infrastructure overhead account for 12% and 14% respectively, and losses due to the reduced C fixing capacity of plants amount to < 0.1% of the total CO2 losses. These results illustrate clearly the significance of the peatland soil organic matter in relation to the C emission savings of the wind farm.
The C payback time is 2.3 years for a fossil fuel mix and 3.2 years for a grid mix counterfactual (Table 4). Thus, emission savings attributable to the wind farm are predicted for more than 22 of its planned 25 years of operation. This low C payback time has been achieved through careful site selection (low extent of drainage) and management practices that are expected to successfully reduce the emissions due to drainage (site restoration, habitat improvement and use of floating roads). If the roads were to sink, resulting in increased drainage of the site, the C payback time would be much higher.
D.R. Nayak et al. CALCULATING CARBON SAVINGS FROM WIND FARMS ON SCOTTISH PEATLANDS
Mires and Peat, Volume 4 (2008–2010), Article 09, http://www.mires-and-peat.net/, ISSN 1819-754X
© 2010 International Mire Conservation Group and International Peat Society 13
Figure 3. The contribution of loss processes to total carbon dioxide losses due to wind farm development for the un-named example. ANALYSIS OF MODEL BEHAVIOUR Sensitivity analyses Site-specific equations for carbon dioxide and methane emissions The multiple sensitivity of Equations 14–17 to changes in the input variables temperature (T = 0–15°C) and water table depth (W = 0–2 m) was analysed using MATLAB Script (MathWorks® 2007). A global sensitivity analysis adjusts more than one input variable at a time, and multiple sensitivity analysis is a factorial analysis which runs the model for all combinations of inputs. The probability density functions (i.e. distributions of possible values) for the input variables were drawn from the pre-defined parameter space and used to generate sample combinations of input variables.
The contribution index was used to express the sensitivity of the model to the inputs (Gottschalk et al. 2007). This index represents the importance of each variable, also taking interactions between the variables into account. The contribution index was calculated by running a Monte Carlo simulation, consisting of multiple runs of the model, with all input factors sampled from the probability density function defined for each input variable. The Monte Carlo simulation was then repeated for each
variable, holding the selected variable constant at its default value and allowing the others to vary within the pre-defined ranges. The distribution of the difference in the model outputs (CO2 and CH4 emissions) from the first Monte Carlo simulation represents the global sensitivity. This gives a quantitative estimate of the contribution of each input variable to the global sensitivity. The contribution is expressed as the normalised percentage change with respect to the global sensitivity.
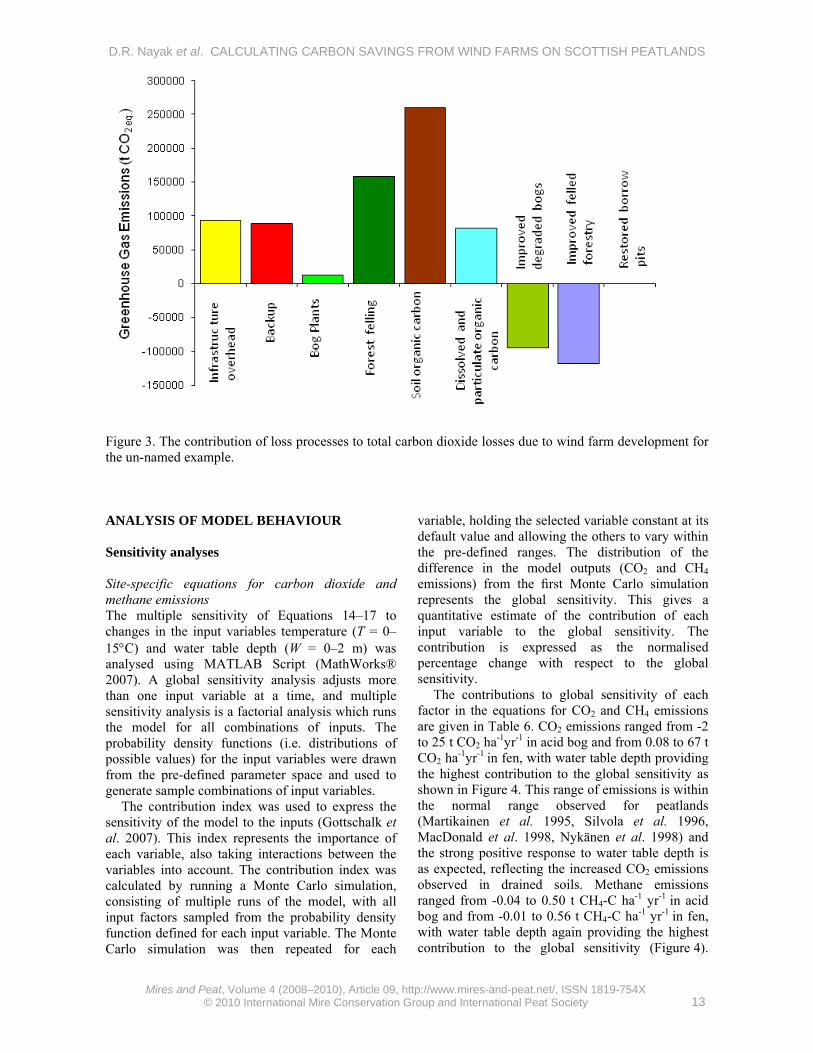
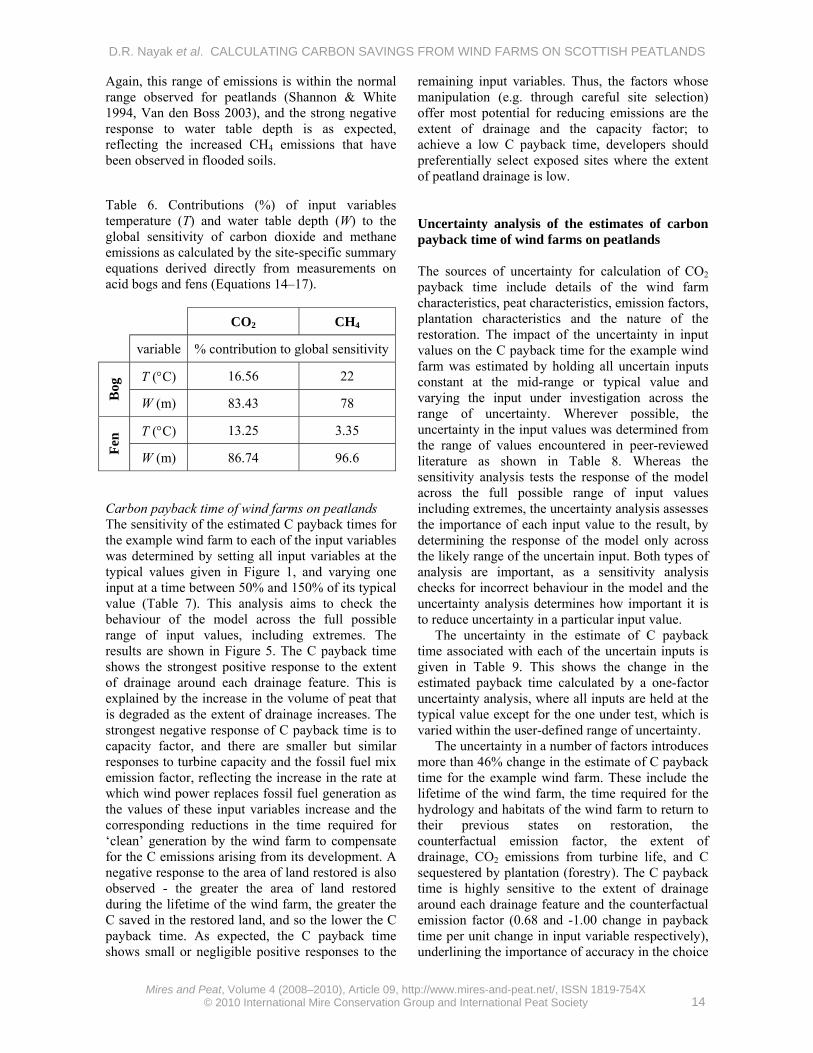
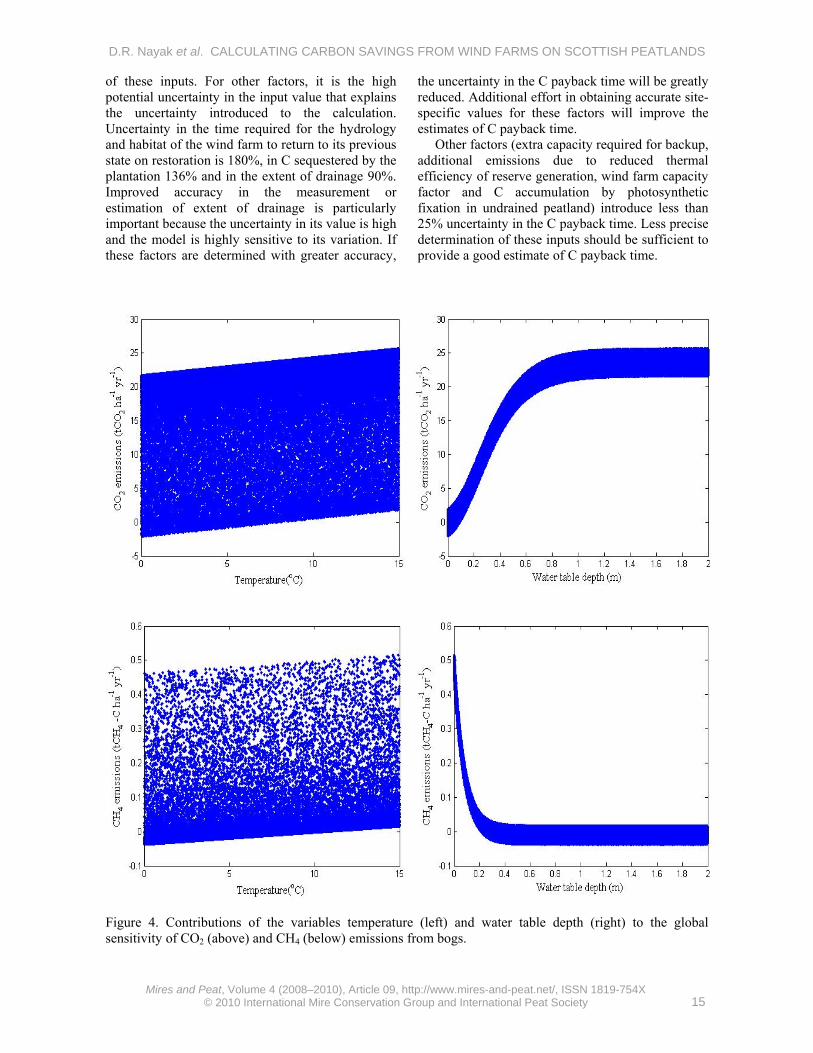
The contributions to global sensitivity of each factor in the equations for CO2 and CH4 emissions are given in Table 6. CO2 emissions ranged from -2 to 25 t CO2 ha-1yr-1 in acid bog and from 0.08 to 67 t CO2 ha-1yr-1 in fen, with water table depth providing the highest contribution to the global sensitivity as shown in Figure 4. This range of emissions is within the normal range observed for peatlands (Martikainen et al. 1995, Silvola et al. 1996, MacDonald et al. 1998, Nykänen et al. 1998) and the strong positive response to water table depth is as expected, reflecting the increased CO2 emissions observed in drained soils. Methane emissions ranged from -0.04 to 0.50 t CH4-C ha-1 yr-1 in acid bog and from -0.01 to 0.56 t CH4-C ha-1 yr-1 in fen, with water table depth again providing the highest contribution to the global sensitivity (Figure 4).
D.R. Nayak et al. CALCULATING CARBON SAVINGS FROM WIND FARMS ON SCOTTISH PEATLANDS
Mires and Peat, Volume 4 (2008–2010), Article 09, http://www.mires-and-peat.net/, ISSN 1819-754X
© 2010 International Mire Conservation Group and International Peat Society 14
Again, this range of emissions is within the normal range observed for peatlands (Shannon & White 1994, Van den Boss 2003), and the strong negative response to water table depth is as expected, reflecting the increased CH4 emissions that have been observed in flooded soils. Table 6. Contributions (%) of input variables temperature (T) and water table depth (W) to the global sensitivity of carbon dioxide and methane emissions as calculated by the site-specific summary equations derived directly from measurements on acid bogs and fens (Equations 14–17).
CO2 CH4 variable % contribution to global sensitivity
T (°C) 16.56 22
Bog
W (m) 83.43 78
T (°C) 13.25 3.35
Fen
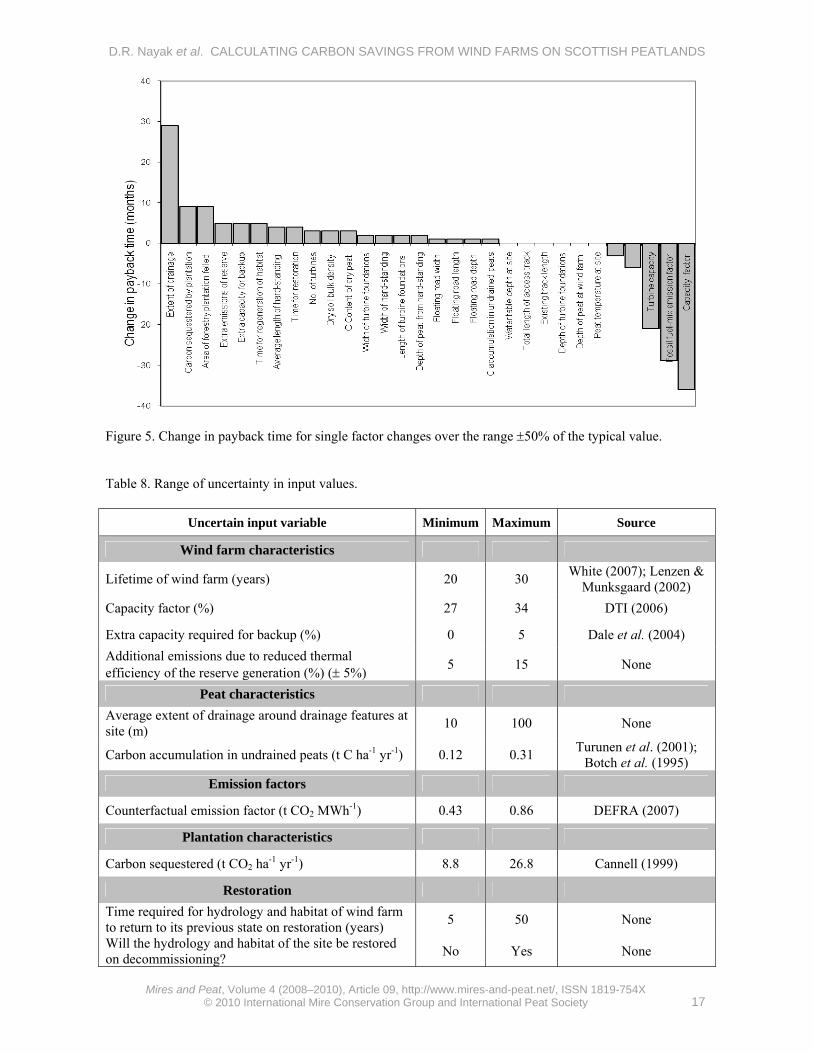
W (m) 86.74 96.6 Carbon payback time of wind farms on peatlands The sensitivity of the estimated C payback times for the example wind farm to each of the input variables was determined by setting all input variables at the typical values given in Figure 1, and varying one input at a time between 50% and 150% of its typical value (Table 7). This analysis aims to check the behaviour of the model across the full possible range of input values, including extremes. The results are shown in Figure 5. The C payback time shows the strongest positive response to the extent of drainage around each drainage feature. This is explained by the increase in the volume of peat that is degraded as the extent of drainage increases. The strongest negative response of C payback time is to capacity factor, and there are smaller but similar responses to turbine capacity and the fossil fuel mix emission factor, reflecting the increase in the rate at which wind power replaces fossil fuel generation as the values of these input variables increase and the corresponding reductions in the time required for ‘clean’ generation by the wind farm to compensate for the C emissions arising from its development. A negative response to the area of land restored is also observed - the greater the area of land restored during the lifetime of the wind farm, the greater the C saved in the restored land, and so the lower the C payback time. As expected, the C payback time shows small or negligible positive responses to the
remaining input variables. Thus, the factors whose manipulation (e.g. through careful site selection) offer most potential for reducing emissions are the extent of drainage and the capacity factor; to achieve a low C payback time, developers should preferentially select exposed sites where the extent of peatland drainage is low. Uncertainty analysis of the estimates of carbon payback time of wind farms on peatlands The sources of uncertainty for calculation of CO2 payback time include details of the wind farm characteristics, peat characteristics, emission factors, plantation characteristics and the nature of the restoration. The impact of the uncertainty in input values on the C payback time for the example wind farm was estimated by holding all uncertain inputs constant at the mid-range or typical value and varying the input under investigation across the range of uncertainty. Wherever possible, the uncertainty in the input values was determined from the range of values encountered in peer-reviewed literature as shown in Table 8. Whereas the sensitivity analysis tests the response of the model across the full possible range of input values including extremes, the uncertainty analysis assesses the importance of each input value to the result, by determining the response of the model only across the likely range of the uncertain input. Both types of analysis are important, as a sensitivity analysis checks for incorrect behaviour in the model and the uncertainty analysis determines how important it is to reduce uncertainty in a particular input value.
The uncertainty in the estimate of C payback time associated with each of the uncertain inputs is given in Table 9. This shows the change in the estimated payback time calculated by a one-factor uncertainty analysis, where all inputs are held at the typical value except for the one under test, which is varied within the user-defined range of uncertainty.
The uncertainty in a number of factors introduces more than 46% change in the estimate of C payback time for the example wind farm. These include the lifetime of the wind farm, the time required for the hydrology and habitats of the wind farm to return to their previous states on restoration, the counterfactual emission factor, the extent of drainage, CO2 emissions from turbine life, and C sequestered by plantation (forestry). The C payback time is highly sensitive to the extent of drainage around each drainage feature and the counterfactual emission factor (0.68 and -1.00 change in payback time per unit change in input variable respectively), underlining the importance of accuracy in the choice
D.R. Nayak et al. CALCULATING CARBON SAVINGS FROM WIND FARMS ON SCOTTISH PEATLANDS
Mires and Peat, Volume 4 (2008–2010), Article 09, http://www.mires-and-peat.net/, ISSN 1819-754X
© 2010 International Mire Conservation Group and International Peat Society 15
of these inputs. For other factors, it is the high potential uncertainty in the input value that explains the uncertainty introduced to the calculation. Uncertainty in the time required for the hydrology and habitat of the wind farm to return to its previous state on restoration is 180%, in C sequestered by the plantation 136% and in the extent of drainage 90%. Improved accuracy in the measurement or estimation of extent of drainage is particularly important because the uncertainty in its value is high and the model is highly sensitive to its variation. If these factors are determined with greater accuracy,
the uncertainty in the C payback time will be greatly reduced. Additional effort in obtaining accurate site-specific values for these factors will improve the estimates of C payback time.
Other factors (extra capacity required for backup, additional emissions due to reduced thermal efficiency of reserve generation, wind farm capacity factor and C accumulation by photosynthetic fixation in undrained peatland) introduce less than 25% uncertainty in the C payback time. Less precise determination of these inputs should be sufficient to provide a good estimate of C payback time.
Figure 4. Contributions of the variables temperature (left) and water table depth (right) to the global sensitivity of CO2 (above) and CH4 (below) emissions from bogs.

D.R. Nayak et al. CALCULATING CARBON SAVINGS FROM WIND FARMS ON SCOTTISH PEATLANDS
Mires and Peat, Volume 4 (2008–2010), Article 09, http://www.mires-and-peat.net/, ISSN 1819-754X
© 2010 International Mire Conservation Group and International Peat Society 16
Table 7. Typical input values and ranges used in the sensitivity analysis.
Input data Typical value
Min.value (-50%)
Max.value(+50%)
Wind farm characteristics No. of turbines 67 33 101 Turbine capacity (MW) 2.0 1.0 3.0 Lifetime of wind farm (years) 25 13 38 Capacity factor (percentage efficiency) 30 15 45 Extra capacity required for backup (%) 5.0 2.5 7.5 Extra emissions due to reduced efficiency of reserve generation (%) 10 5 15
Peat characteristics Average peat temperature at site (oC) 9 4.5 13.5 Average thickness of peat on site occupied by wind farm (m) 2.00 1.00 3.00 C Content of dry peat (% by weight) 55 27.5 82.5 Average extent of drainage around drainage features at site (m) 100 50 150 Dry soil bulk density (g cm-3) 0.1 0.05 0.15 Time required for regeneration of peatland habitat (years) 10 5 15 Carbon accumulation in undrained peats (t C ha-1 yr-1) 0.25 0.125 0.375
Counterfactual emission factors Fossil fuel- mix emission factor (t CO2 MWh-1) 0.607 0.3035 0.9105
Wind turbine foundations Average length of turbine foundations (m) 15 7.5 22.5 Average width of turbine foundations(m) 15 7.5 22.5 Average depth of peat removed from turbine foundations(m) 2.0 1.0 3.0
Hard-standing area associated with each turbine Average length of hard-standing (m) 40 20 60 Average width of hard-standing (m) 20 10 30 Average depth of peat removed from hard-standing (m) 2.0 1.0 3.0
Access tracks Total length of access track (m) 34,900 17,450 52,350 Existing track length (m) 10,300 5,150 15,450 Length of access track that is floating road (m) 24,600 12,300 36,900 Floating road width (m) 6.5 3.25 9.75 Floating road depth (m) 0.5 0.25 0.75
Plantation Characteristics Area of forestry plantation to be felled (ha) 480 240 720 Carbon sequestered (t C ha-1 yr-1) 3.60 1.80 5.40
Restoration Area of land restored during lifetime of wind farm (ha) 385 192.5 577.5 Time required for hydrology and habitat of wind farm to return to its previous state on restoration (years) 10 5 15
D.R. Nayak et al. CALCULATING CARBON SAVINGS FROM WIND FARMS ON SCOTTISH PEATLANDS
Mires and Peat, Volume 4 (2008–2010), Article 09, http://www.mires-and-peat.net/, ISSN 1819-754X
© 2010 International Mire Conservation Group and International Peat Society 17
Figure 5. Change in payback time for single factor changes over the range ±50% of the typical value. Table 8. Range of uncertainty in input values.
Uncertain input variable Minimum Maximum Source
Wind farm characteristics
Lifetime of wind farm (years) 20 30 White (2007); Lenzen & Munksgaard (2002)
Capacity factor (%) 27 34 DTI (2006)
Extra capacity required for backup (%) 0 5 Dale et al. (2004) Additional emissions due to reduced thermal efficiency of the reserve generation (%) (± 5%) 5 15 None
Peat characteristics Average extent of drainage around drainage features at site (m) 10 100 None
Carbon accumulation in undrained peats (t C ha-1 yr-1) 0.12 0.31 Turunen et al. (2001); Botch et al. (1995)
Emission factors
Counterfactual emission factor (t CO2 MWh-1) 0.43 0.86 DEFRA (2007)
Plantation characteristics
Carbon sequestered (t CO2 ha-1 yr-1) 8.8 26.8 Cannell (1999)
Restoration Time required for hydrology and habitat of wind farm to return to its previous state on restoration (years) 5 50 None
Will the hydrology and habitat of the site be restored on decommissioning? No Yes None

D.R. Nayak et al. CALCULATING CARBON SAVINGS FROM WIND FARMS ON SCOTTISH PEATLANDS
Mires and Peat, Volume 4 (2008–2010), Article 09, http://www.mires-and-peat.net/, ISSN 1819-754X
© 2010 International Mire Conservation Group and International Peat Society 18
Table 9. Relative contributions of the uncertain input variables to uncertainty in C payback time.
Input value Min. input value
Typical input value
Max. input value
Change in input
variable
Payback time for min. input
(months)
Payback time for typical
input (months)
Payback time for max. input
(months)
Change in payback
time
1Relative contribution to
payback uncertainty
Wind farm characteristics Lifetime of wind farm (years) 20 25 30 40% 28 27 27 -4% -0.10 Capacity factor (%) 27 30 34 23% 30 27 24 -23% -0.99 Extra capacity required for backup (%) 0 5 5 100% 22 27 27 25% 0.25 Additional emissions due to reduced thermal efficiency of the reserve generation (%)
5 10 15 100% 25 27 30 19% 0.19
Peat characteristics Average extent of drainage around drainage features at site (m) 10 100 100 90% 11 27 27 62% 0.68
Carbon accumulation in undrained peatland (t C ha-1 yr-1) 0.12 0.25 0.31 76% 27 27 27 0% 0.00
Emission factors Counterfactual emission factor (t CO2 MWh-1) 0.43 0.607 0.86 58% 36 27 21 -58% -1.00
Plantation characteristics Carbon sequestered (t CO2 ha-1 yr-1) 8.8 13.2 26.8 136% 24 27 36 46% 0.34
Restoration Time required for hydrology and habitat of wind farm to return to its previous state on restoration (years)
5 10 50 180% 25 27 41 37% -0.21
Is wind farm restored on decommissioning? Yes Yes No N/A 27 27 75 185% N/A 1 The relative contribution to payback uncertainty is calculated as (% change in payback time) / (% change in input variable).
D.R. Nayak et al. CALCULATING CARBON SAVINGS FROM WIND FARMS ON SCOTTISH PEATLANDS
Mires and Peat, Volume 4 (2008–2010), Article 09, http://www.mires-and-peat.net/, ISSN 1819-754X
© 2010 International Mire Conservation Group and International Peat Society 19
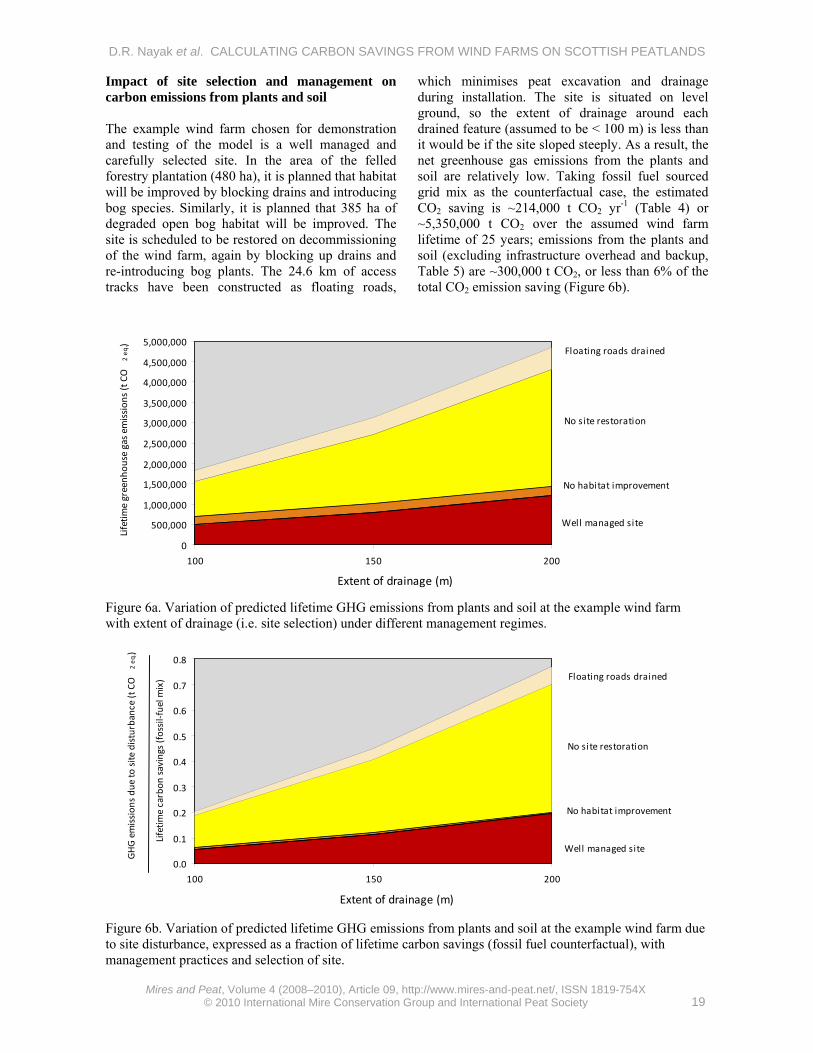
Impact of site selection and management on carbon emissions from plants and soil The example wind farm chosen for demonstration and testing of the model is a well managed and carefully selected site. In the area of the felled forestry plantation (480 ha), it is planned that habitat will be improved by blocking drains and introducing bog species. Similarly, it is planned that 385 ha of degraded open bog habitat will be improved. The site is scheduled to be restored on decommissioning of the wind farm, again by blocking up drains and re-introducing bog plants. The 24.6 km of access tracks have been constructed as floating roads,
which minimises peat excavation and drainage during installation. The site is situated on level ground, so the extent of drainage around each drained feature (assumed to be < 100 m) is less than it would be if the site sloped steeply. As a result, the net greenhouse gas emissions from the plants and soil are relatively low. Taking fossil fuel sourced grid mix as the counterfactual case, the estimated CO2 saving is ~214,000 t CO2 yr-1 (Table 4) or ~5,350,000 t CO2 over the assumed wind farm lifetime of 25 years; emissions from the plants and soil (excluding infrastructure overhead and backup, Table 5) are ~300,000 t CO2, or less than 6% of the total CO2 emission saving (Figure 6b).
0
500,000
1,000,000
1,500,000
2,000,000
2,500,000
3,000,000
3,500,000
4,000,000
4,500,000
5,000,000
100 150 200
Extent of drainage (m)
Lifetim
e greenh
ouse gas emission
s (t CO
2 eq
.)
No site restoration
No habitat improvement
Well managed site
Floating roads drained
Figure 6a. Variation of predicted lifetime GHG emissions from plants and soil at the example wind farm with extent of drainage (i.e. site selection) under different management regimes.
0.0
0.1
0.2
0.3
0.4
0.5
0.6
0.7
0.8
100 150 200
Extent of drainage (m)
GHG emission
s du
e to site
disturbance (t CO
2 eq
.)
Lifetim
e carbon
savings (fossil‐fuel m
ix)
No site restoration
No habitat improvement
Well managed site
Floating roads drained
Figure 6b. Variation of predicted lifetime GHG emissions from plants and soil at the example wind farm due to site disturbance, expressed as a fraction of lifetime carbon savings (fossil fuel counterfactual), with management practices and selection of site.
D.R. Nayak et al. CALCULATING CARBON SAVINGS FROM WIND FARMS ON SCOTTISH PEATLANDS
Mires and Peat, Volume 4 (2008–2010), Article 09, http://www.mires-and-peat.net/, ISSN 1819-754X
© 2010 International Mire Conservation Group and International Peat Society 20
If, however, the good management practices are abandoned, the habitat is no longer improved, the site is not restored and the floating roads sink and require drainage, the model indicates that greenhouse gas emissions from plants and soil will increase to 20% of the total CO2 emission savings. Of this increase, 4% is due to loss of habitat improvement, 11% to drainage of floating roads and 85% to loss of site restoration.
The site feature that has the greatest impact on C emissions is the extent of drainage. If the site selected were not level and the lateral extent of drainage around each drainage feature consequently increased from 100 m to 200 m, the total emissions from plants and soil would increase from 6% to 19% of the C saving; and if good management were not practiced, these emissions would exceed 77% of the C saving (Figure 6a). Even without taking into account turbine manufacture and backup, a wind farm development on such a poorly selected and managed site has a net payback time of more than 19 years, and a higher proportion of the lifetime emissions is attributable to neglecting site restoration on decommissioning than at the level site (50% on the sloping site compared to 12% on level ground) (Figure 6b). Thus, if the site has a high lateral extent of drainage, it is particularly important to adequately restore it on decommissioning. DISCUSSION AND CONCLUSIONS It is important that wind farm developments in Scotland should not be discouraged unnecessarily because they are a key requirement for delivery of the Scottish Government’s commitment to reduce national GHG emissions. To the same end, it is also important to understand how much of the saving in C emissions expected from wind power generation is offset due to site disturbance when the development is located on peatland. Thus, the method for calculating wind farm payback times must be sufficiently affordable, workable and valuable to be adopted by industry; and yet sufficiently comprehensive to highlight those developments that are likely to result in long C payback times or excessive loss of important C stocks. For these reasons we aimed to develop a method that requires only a small number of data inputs which are readily available to a wind farm developer or other interested party, and uses simple equations to simulate all of the important C loss processes. One process that has not yet been included adequately is peat erosion, including peatslide. This is justified by the argument that the strong existing guidelines for minimising
catastrophic peatslide risk (Scottish Executive 2006) will be followed, so that such events should not occur. However, the guidelines will not prevent non-catastrophic gully erosion, and this factor should be considered further in future work.
A disadvantage of the simple approach is that wind farm sites usually exhibit high spatial variability so that it may be difficult to estimate the averaged values required to drive the model. Indeed, separate calculations for different subsections of highly variable sites may be appropriate. Alternatively, losses of C might be more accurately estimated by using detailed site measurements to drive a dynamic simulation model of soil organic matter turnover coupled to a detailed hydrological model. This would be a more expensive option, but may prove valuable for highly controversial developments.
The calculation of C payback time for the example wind farm illustrates how the simple approach can be applied to provide rough estimates of C payback time. The sensitivity analysis demonstrates that the estimates of C payback time respond as expected to changes in the input variables. A full quantitative evaluation of the estimates would require direct comparison with measured C emissions from a site that was not used in formulating the method and, unfortunately, measurements of this kind are not currently available. The uncertainty analysis indicates that the highest potential for improving estimates of C payback time lies in obtaining more accurate measurements of the time required for the hydrology and habitat of the wind farm to return to its previous state on restoration, the extent of drainage, CO2 emissions from turbine life and C sequestration by forestry plantations.
The example shows that some of the carbon emission savings expected from electricity generation using wind power are indeed offset by increased greenhouse gas emissions when the wind farm is sited on peatland; but if the site is selected so that the extent of drainage is moderate, and if it is managed appropriately, the additional greenhouse gas losses may be as little as 9% of the total C emission savings. With poor management practices, the greenhouse gas losses can increase to 34% of the C emission savings; and with poor site selection, additional losses may almost or totally cancel out the C emission savings of the wind farm. Therefore, if a wind farm is to be sited on peatland, management practices designed to reduce emissions such as use of road designs that require neither excavation nor drainage of peat, site restoration and habitat improvement, are essential. Moreover, wind farm developments on peatlands with a high extent
D.R. Nayak et al. CALCULATING CARBON SAVINGS FROM WIND FARMS ON SCOTTISH PEATLANDS
Mires and Peat, Volume 4 (2008–2010), Article 09, http://www.mires-and-peat.net/, ISSN 1819-754X
© 2010 International Mire Conservation Group and International Peat Society 21
of drainage should be avoided. Poor management incurs high risks because a high proportion of the total greenhouse emissions then originate from the soil organic matter. Certainly, the risk that the expected saving in C emissions due to electricity generation using wind power will be offset by increased C losses associated with the development is much greater on peatlands than on mineral soils, where greenhouse gas emissions from the soil are likely to be much lower than in peatland. ACKNOWLEDGEMENTS This work was funded by the Rural and Environment Research and Analysis Directorate of the Scottish Government, Science Policy and Co-ordination Division. We are grateful for significant inputs from the steering committee, namely: Clifton Bain (Royal Society for the Protection of Birds); Andrew Coupar (Scottish Natural Heritage); Martin Mathers (Scottish Renewables Foundation); Peter Singleton (Scottish Environmental Protection Agency); Sally Baillie and James Pendlebury (Forestry Commission); and Helen Jones, Sue Kearns, Guy Winter and Geeta Wonnacott (Scottish Government). This article arises from a presentation delivered by Andrew Coupar at the IMCG symposium Wind Farms on Peatland held in Santiago de Compostela, Spain, 27–30 April 2008. REFERENCES Alm, J., Saarnio, S., Nykänen, H., Silvola, J. &
Martikainen, P.J. (1999) Winter CO, CH and NO fluxes on some natural and drained boreal peatlands. Biogeochemistry, 44 (2), 163–186.
Ardente, F., Beccali, M., Cellura, M., & Lo Brano, V. (2008) Energy performance and life cycle assessment of an Italian wind farm. Renewable and Sustainable Energy Reviews, 12, 200–217.
Baggott, S.L., Cardenas, L., Garnett, E., Jackson, J., Mobbs, D.C., Murrells, T., Passant, N., Thomson, A. & Watterson, J.D. (2007) UK Greenhouse Gas Inventory, 1990 to 2005. Annual Report for submission under the Framework Convention on Climate Change. London, HSO Report AEAT/ENV/R/2429 13/04/2007, ISBN 0-9554823-1-3, http://www.naei.org.uk/reports.php
Botch, M.S., Kobak, K.I., Vinson, T.S. & Kolchugina, T.P. (1995) Carbon pools and accumulation in peatlands of the Former Soviet Union. Global Biogeochemical Cycles, 9, 37–46.
Bradley, R.I., Milne, R., Bell J., Lilly, A., Jordan, C.
& Higgins, A. (2005) A soil carbon and land use database for the United Kingdom. Soil Use and Management. 21, 363–369.
Bubier, J., Moore, T. & Roulet, N. (1993) Methane emissions from wetlands in the mid-boreal region of northern Ontario, Canada. Ecology, 74, 2240–2254.
BWEA (2005) Wind and the UK’s 10% target. British Wind Energy Association Briefing Sheet. http://www.bwea.com/pdf/briefings/target-2005-small.pdf
Cannell, M.G.R. (1999) Growing trees to sequester carbon in the UK: answers to some common questions. Forestry, 72, 238–247.
Dale, L., Millborrow, D., Slark, R. & Strbac, G. (2004) Total cost estimates for large-scale wind scenarios in UK. Energy Policy, 32, 1949–56.
DEFRA (2007) Guidelines to DEFRA’s GHG Conversion Factors for Company Reporting. Department of Environment, Food and Rural Affairs, London, Annex 3, Table 2.
Digest of the United Kingdom Energy Statistics (2007) Department for Business, Enterprise and Regulatory Reform., HSO National Statistics Publication, London, ISBN 9780115155208. http://www.berr.gov.uk/energy/statistics/source/electricity/page18527.html
Dillon, P.J. & Molot, L.A. (1997) Effect of landscape form on export of dissolved organic carbon, iron, and phosphorus from forested stream catchments. Water Resources Research, 33, 2591–2600.
DTI (2006) Energy Trends. UK onshore wind capacity factors 1998–2004, Department of Trade and Industry, London, March 2006, 28–30. http://www.berr.gov.uk/files/file43950.pdf
Bouillon, H., Fösel, P., Neubarth, J. & Winter, W. (eds.) (2004) Windreport 2004. E.ON Netz GmbH, Bayreuth, Germany, p. 6 (in German). http://www.eon-netz.com/pages/ehn_de/EEG__KWK-G/_download_files/Informationen_Daten_und_Fakten/EON_Netz_Windreport2004_ger.pdf
Gottschalk, P., Wattenbach, M., Neftel, A., Fuhrer, J., Jones, M., Lanigan, G., Davis, P., Campbell, C., Soussana, J.F. & Smith, P. (2007) The role of measurement uncertainties for the simulation of grassland net ecosystem exchange (NEE) in Europe. Agriculture, Ecosystems & Environment, 12, 175–185.
Holden, J., Chapman, P.J., & Labadz, J.C. (2004) Artificial drainage of peatlands: hydrological and hydrochemical process and wetland restoration. Progress in Physical Geography, 28, 95–123.
IPCC (1995) Working Group I: The Science of Climate Change. Cambridge University Press, Cambridge, UK, 19–24.
IPCC (1997) Revised 1996 IPCC guidelines for
D.R. Nayak et al. CALCULATING CARBON SAVINGS FROM WIND FARMS ON SCOTTISH PEATLANDS
Mires and Peat, Volume 4 (2008–2010), Article 09, http://www.mires-and-peat.net/, ISSN 1819-754X
© 2010 International Mire Conservation Group and International Peat Society 22
national greenhouse gas inventories workbook, vol. 2. Cambridge, UK. Cambridge University Press, Cambridge, UK, 41–60.
IPCC (2001) Climate Change: The Scientific Basis. Cambridge University Press, Cambridge, UK, 351–416.
IPCC (2007) Climate Change 2007: The Physical Science Basis. Cambridge University Press, Cambridge, UK, 210–216.
Key Scottish Environment Statistics (2007) http://www.scotland.gov.uk/Publications/2007/08/20165714/0
Komulainen, V.-M., Tuittila, E.-S., Vasander, H. & Laine, J. (1999) Restoration of drained peatlands in southern Finland: initial effects on vegetation change and CO2 balance. Journal of Applied Ecology, 36, 634–648.
Lenzen, M. & Munksgaard, J. (2002) Energy and CO2 life-cycle analyses of wind turbines: review and applications. Renewable Energy, 26, 339–362.
MacDonald, J.A., Fowler, D., Hargreaves, K.J., Skiba, U., Leith, I.D. & Murray, M.B. (1998) Methane emission rates from a northern wetland: response to temperature, water table and transport. Atmospheric Environment, 32(19), 3219–3227.
Martikainen, P.J., Nykiinen, H., Alm, J. & Silvola, J. (1995) Changes in fluxes of carbon dioxide, methane and nitrous oxide due to forest drainage of mire sites of different trophy. Plant and Soil, 168, 571–577.
Martikainen, P.J., Nykänen, H., Crill, P. & Silvola, J. (1993) Effect of lowered water table on nitrous oxide fluxes from northern peatlands. Nature, 366, 51–53.
Nayak, D.R., Miller, D., Nolan, A., Smith, P. & Smith, J.U. (2008) Calculating Carbon Savings from Windfarms on Scottish Peatlands – A New Approach. Final Report, RERAD UAB-016-07. http://www.scotland.gov.uk/Publications/2008/06/25114657/0
Nykänen, H., Alm, J., Silvola, J., Tolonen, K. & Martikainen, P.J. (1998) Methane fluxes on boreal peatlands of different fertility and the effect of long-term experimental lowering of the water table on flux rates. Global Biogeochemical Cycles, 12, 53–69.
Renewable Energy Statistics Database for the UK (2008) http://www.restats.org.uk/obligations.htm
Scottish Executive (2006) Peat Landslide Hazard and Risk Assessments. Best Practice Guide for Proposed Electricity Generation Developments. Scottish Executive, Edinburgh, 34–36. Web version (26 January 2007) at: http://www.scotland.gov.uk/Publications/2006/1
2/21162303/0 SG (2007) Renewable energy potential. News
Release dated 27/11/2007, The Scottish Government, Edinburgh. Available online at: http://www.scotland.gov.uk/News/Releases/2007/11/27095600
Shannon, R.D. & White, J.R. (1994) A three year study of controls on methane emissions from two Michigan peatlands. Biogeochemistry, 27, 35–60.
Silvola, J., Alm, J., Ahlholm, U., Nykänen, H. & Martikainen, P.J. (1996) CO2 fluxes from peat in boreal mires under varying temperature and moisture conditions. Journal of Ecology, 84, 219–228.
Smith, P., Smith, J.U., Flynn, H., Killham, K., Rangel-Castro, I., Foereid, B., Aitkenhead, M., Chapman, S., Towers, W., Bell, J., Lumsdon, D., Milne, R., Thomson, A., Simmons, I., Skiba, U., Reynolds, B., Evans, C., Frogbrook, Z., Bradley, I., Whitmore, A. & Falloon, P. (2007) ECOSSE: Estimating Carbon in Organic Soils Sequestration and Emissions. Scottish Executive Environmental and Rural Affairs Department, 166pp. Available online at: http://www.scotland.gov.uk/Publications/2007/03/16170508/0
Smith, P., Smith, J.U., Powlson, D.U., McGill, W.B., Arah, J.R.M., Chertov, O.G., Coleman, K., Franko, U., Frolking, S., Gunnewiek, H.K., Jenkinson, D.S., Jensen, L.S., Kelly, R.H., Komarov, A.S., Li, C., Molina, J.A.E., Mueller, T., Parton, W.J., Thornley, J.H.M & Whitmore, A.P. (1997) A comparison of nine soil organic matter models using datasets from seven long-term experiments. In: Smith, P., Powlson, D.S., Smith, J.U. & Elliott, E.T. (eds.) Evaluation and Comparison of Soil Organic Matter Models Using Datasets From Seven Long-Term Experiments. Geoderma, 81, 153–225.
Smith, P., Smith, J.U., Wattenbach, M., Meyer, J., Lindner, M., Zaehle, S., Hiederer, R., Jones, R., Montanarella, L., Rounsevell, M., Reginster, I. & Kankaanpää, S. (2006) Projected changes in mineral soil carbon of European forests, 1990–2100. Canadian Journal of Soil Science, 86, 159–169.
Smith, J.U., Smith, P., Wattenbach, M., Zaehle, S., Hiederer, R., Jones, R.J.A., Montanarella, L., Rounsevell, M.D.A., Reginster, I. & Ewert, F. (2005) Projected changes in mineral soil carbon of European croplands and grasslands, 1990–2080. Global Change Biology, 11, 2141–2152.
SNH (2003) Wind Farms and Carbon Savings. SNH Technical Guidance Note, Scottish Natural Heritage, Perth, 11 pp.
Stewart, A.J.A. & Lance, A.N. (1991) Effects of
D.R. Nayak et al. CALCULATING CARBON SAVINGS FROM WIND FARMS ON SCOTTISH PEATLANDS
Mires and Peat, Volume 4 (2008–2010), Article 09, http://www.mires-and-peat.net/, ISSN 1819-754X
© 2010 International Mire Conservation Group and International Peat Society 23
moor-draining on the hydrology and vegetation on northern Pennine blanket bog. Journal of Applied Ecology, 28, 1105–1117.
Tuittila, E.-S., Komulainen, V.-M. & Laine, J. (1999) Restored cut-away peatland as a sink for atmospheric CO2. Oecologia, 120, 563–574.
Turunen, J., Pitkänen, A., Tahvanainen, T. & Tolonen, K. (2001) Carbon accumulation in West Siberian mires, Russia. Global Biogeochemical Cycles, 15, 285–296.
Van den Boss, R. (2003) Restoration of former wetlands in the Netherlands; effect on the balance between CO2 sink and CH4 source. Netherland Journal of Geosciences, 82, 325–332.
Vestas (2005) Life Cycle Assessment of Offshore and Onshore Wind Power Plants Based on Vestas V90-3.0 MW Turbines. Vestas Wind Systems A/S, Randers, Denmark, 59 pp. Revision (2006): http://www.vestas.com/en/about-vestas/principles/sustainability/wind-turbines-and-the-environment/life-cycle-assessment-(lca).aspx
Wallage Z.E., Holden J. & McDonald A.T. (2006) Drain blocking: an effective treatment for reducing dissolved organic carbon loss and water
discolouration in a drained peatland. Science of the Total Environment, 367, 811–821.
White, S.W. & Kulcinski, G.L. (2000) Birth to death analysis of the energy payback ratio and CO2 gas emission rates from coal, fission, wind, and DT fusion electrical power plants. Fusion Engineering Design, 48, 473–481.
White, W.S. (2007) Net energy payback and CO2 emissions from three Midwestern wind farms: an update. Natural Resources Research, 15, 271–281.
Worrall, F., Reed, M., Warburton, J. & Burt, T. (2003) Carbon budget for a British upland peat catchment. The Science of the Total Environment, 312, 133–146.
Worrall F, Harriman R, Evans CD, Watts, C., Adamson, J., Neal, C., Tipping, E., Burt, T.P., Grieve, I., Montieth, D., Naden, P.S., Nisbet, T., Reynolds, B. & Stevens, P. (2004) Trends in dissolved organic carbon in UK rivers and lakes. Biogeochemistry, 70, 369–402.
Submitted 01 Apr 2008; revision 11 Dec 2009 Editor: Olivia Bragg
_______________________________________________________________________________________ Author for correspondence: Dr Jo Smith, Institute of Biological and Environmental Sciences, School of Biological Science, University of Aberdeen, Cruickshank Building, St Machar Drive, Aberdeen, AB24 3UU, Scotland, UK. Tel: +44(0)1224 272702; Fax: +44(0)1224 272703; E-mail: [email protected]