Embed Size (px)
Citation preview
California Drought: Hydrological and
Regulatory Water Supply Issues
Betsy A. Cody
Specialist in Natural Resources Policy
Peter Folger
Specialist in Energy and Natural Resources Policy
Cynthia Brown
Legislative Attorney
August 14, 2015
Congressional Research Service
7-5700
www.crs.gov
R40979
California Drought: Hydrological and Regulatory Water Supply Issues
Congressional Research Service
Summary California is in its fourth year of drought. As of late July 2015, 47% of California was
experiencing exceptional drought—the most severe U.S. federal drought classification—and
approximately 71% of the state was experiencing extreme drought. The 2014 water year (October
2013 through September 2014) was the third driest on record. Water users that receive water
supplies from the state of California and federal water projects are experiencing unprecedented
water supply shortages due to the drought. Severe water supply shortages also hampered the state
during a recent three-year drought (2008-2010). Paleontological and tree-ring records indicate
that California has experienced many multiyear droughts over several millennia; however, some
experts estimate that the current drought may be the most severe in the past 1,200 years.
This report focuses on hydrological and regulatory compliance issues that affect operation and
management of two large water supply projects that serve farms and communities throughout
California: the federal Central Valley Project (CVP), owned and operated by the Bureau of
Reclamation (Reclamation) in the Department of the Interior, and the State Water Project (SWP),
owned and operated by the California Department of Water Resources (DWR). Reductions in
water supplied by these projects in drought years result in economic disruption across the state
such as concentrated crop and financial losses in agricultural areas throughout the Central Valley,
including portions of the San Joaquin Valley. At the same time, several fish species—one of
which may be close to extinction—whose habitat lies at the heart of California’s water supply
system and throughout its northern rivers are in decline. Declining fish species, exacerbated by
drought, also may have economic implications, resulting in job and income losses in coastal
areas. In addition, the drought and low water supplies affect recreation, power production, other
industries, and small and large communities.
With below-average snowpack and severe water shortages again in 2015, a short-term issue for
Congress is how to respond to demands for increased water deliveries given other policy
concerns, such as avoiding harm to threatened and endangered species. Other issues include how
to address water supply availability broadly and how to finance water supply or other projects.
These are challenges given fiscal constraints and policies discouraging site-specific project
authorizations and appropriations. A long-term issue for Congress is how to address federal water
delivery reliability without destabilizing the aquatic ecosystems and related resources (e.g., clean
water, commercial and recreational fisheries, etc.) upon which many communities depend.
Several bills were introduced in the 113th Congress to address short- and long-term water shortage
issues and CVP and SWP water management (e.g., H.R. 3964, H.R. 5781, and S. 2198). These
bills each passed their respective chambers but were not enacted. Legislation with similar aims—
to maximize CVP and SWP water supplies—has been introduced in the 114th Congress (H.R.
2898 and S. 1894). H.R. 2898 passed the House on July 16, 2015, and S. 1894 was introduced on
July 30, 2015. Other bills introduced in the 114th Congress that address California drought and
water management include several authorizing conservation and water H.R. 291 recycling
initiatives, among other activities (e.g., and S. 176; H.R. 2983 and S. 1837; and H.R. 3045).
Questions and debate are likely to continue as Congress considers legislation addressing CVP and
SWP management and other activities to lessen the impacts of drought. This report provides
background and analysis on factors affecting CVP and SWP water management. For information
on legislation, see CRS In Focus IF10019, H.R. 5781: Legislation Proposed to Maximize Water
Supplies to Address Drought in California; CRS Report R43820, Analysis of H.R. 5781,
California Emergency Drought Relief Act of 2014; and CRS Insight IN10308, Drought
Legislation: H.R. 2898.
California Drought: Hydrological and Regulatory Water Supply Issues
Congressional Research Service
California Drought: Hydrological and Regulatory
Water Supply Issues
Introduction ..................................................................................................................................... 1
What Is Drought? ............................................................................................................................ 6
California Drought and Hydrological Conditions ........................................................................... 8
Runoff and Storage.................................................................................................................. 10 Timing ............................................................................................................................... 13
Nature of the California Drought: Possible Causes and Consequences .................................. 14 Atmospheric Rivers .......................................................................................................... 15 Prospects for a Continuing Hydrologic Drought .............................................................. 16 Groundwater and Land Subsidence .................................................................................. 16
California’s Drought and CVP Operations .................................................................................... 22
Regulatory and Statutory Restrictions Affecting CVP and SWP Water Deliveries ................ 23 Limitations on Delta Pumping .......................................................................................... 24 Effects of Regulatory and Statutory Restrictions .............................................................. 28 Recent Delta Export Reductions: Selected Examples ....................................................... 28
How Do Recent Exports Compare to Previous Droughts? ..................................................... 33
California Water Rights: Acquisitions and Allocations ................................................................. 34
Water Rights and Allocations for Water Delivered via the CVP ............................................. 35
Issues for Congress ........................................................................................................................ 39
Outlook .......................................................................................................................................... 41
Figures
Figure 1. Sacramento-San Joaquin Delta ........................................................................................ 3
Figure 2. Major Rivers and Water Infrastructure Facilities in California ........................................ 4
Figure 3. U.S. Drought Conditions .................................................................................................. 8
Figure 4. Comparison of California Drought Conditions for April 2014 and April 2015 ............. 10
Figure 5. Major California State and Federal Reservoirs .............................................................. 12
Figure 6. Comparison of Runoff Amounts for California Between a Wet Year, Dry Year,
30-Year Average, 2014, and 2015 Through June........................................................................ 13
Figure 7. Land Subsidence in the San Joaquin Valley Southwest of Mendota Between
1925 and 1977 ............................................................................................................................ 17
Figure 8. Percentage of Wells with Groundwater Levels at or Below Historical Lows ................ 19
Figure 9. Estimated Potential for Future Land Subsidence in California ...................................... 20
Figure 10. CVP and SWP Delta Water Exports, 1976-2014........... Error! Bookmark not defined.
Figure 11. CVP and SWP Service Areas ....................................................................................... 36
Tables
Table 1. Average and Observed Statewide Precipitation, by Month ............................................. 14
California Drought: Hydrological and Regulatory Water Supply Issues
Congressional Research Service
Table 2. Central Valley Project (CVP) and State Water Project (SWP) Delta Exports,
1976-2014................................................................................................................................... 31
Table 3. CVP Contractors and 2015 Water Allocations ................................................................. 37
Table 4. CVP Contractors and 2009 Water Allocations ................................................................. 38
Contacts
Author Contact Information .......................................................................................................... 42
Acknowledgments ......................................................................................................................... 42

California Drought: Hydrological and Regulatory Water Supply Issues
Congressional Research Service 1
Introduction California is experiencing its fourth consecutive year of drought. As of late July 2015, 47% of
California was experiencing exceptional drought and more than 94% of the state was facing
drought conditions that ranged from severe to exceptional. According to the National Oceanic and
Atmospheric Administration’s (NOAA’s) Climate Prediction Center (CPC), the outlook for
California through the end of October calls for little if any chance for improvement in drought
conditions.1 Unless there is an anomalous weather event, California likely will experience
persistent drought conditions for the rest of the 2015 water year (October 2014-September 2015).2
The Congressional Research Service (CRS) has analyzed a variety of data and information on
current California hydrological conditions, regulatory factors affecting management of
California’s developed water supplies, and restrictions due to baseline water rights allocations and
delivery priorities of the Central Valley Project (CVP), a large water supply project that serves
farms and communities throughout California. This report provides a summary of California’s
2012-2015 drought with comparisons, where applicable, to previous droughts; a summary of the
key regulatory requirements that at certain times limit water deliveries (or exports) from the San
Joaquin and Sacramento Rivers’ Delta; and a brief discussion of California water rights and how
they relate to different types of federal contracts and their associated water allocations.
The report specifically addresses issues related to management of the U.S. Bureau of
Reclamation’s (Reclamation’s) CVP and to reductions in water deliveries to CVP water users—
specifically, to irrigation districts, water districts, and others that have long-term contracts for
delivery of CVP water (i.e., CVP contractors). The CVP delivers water to contractors throughout
the state, largely serving agricultural water contractors as well as some municipal and industrial
(M&I) contractors. A somewhat parallel state system, the State Water Project (SWP) serves
primarily M&I water users and some agricultural users. The CVP and SWP are operated in
conjunction under a Coordinated Operations Agreement (COA) pursuant to P.L. 99-546.3
Major CVP and SWP pumps that supply water for central and southern California are located at
the southern portion of the Sacramento and San Joaquin Rivers’ Delta confluence with San
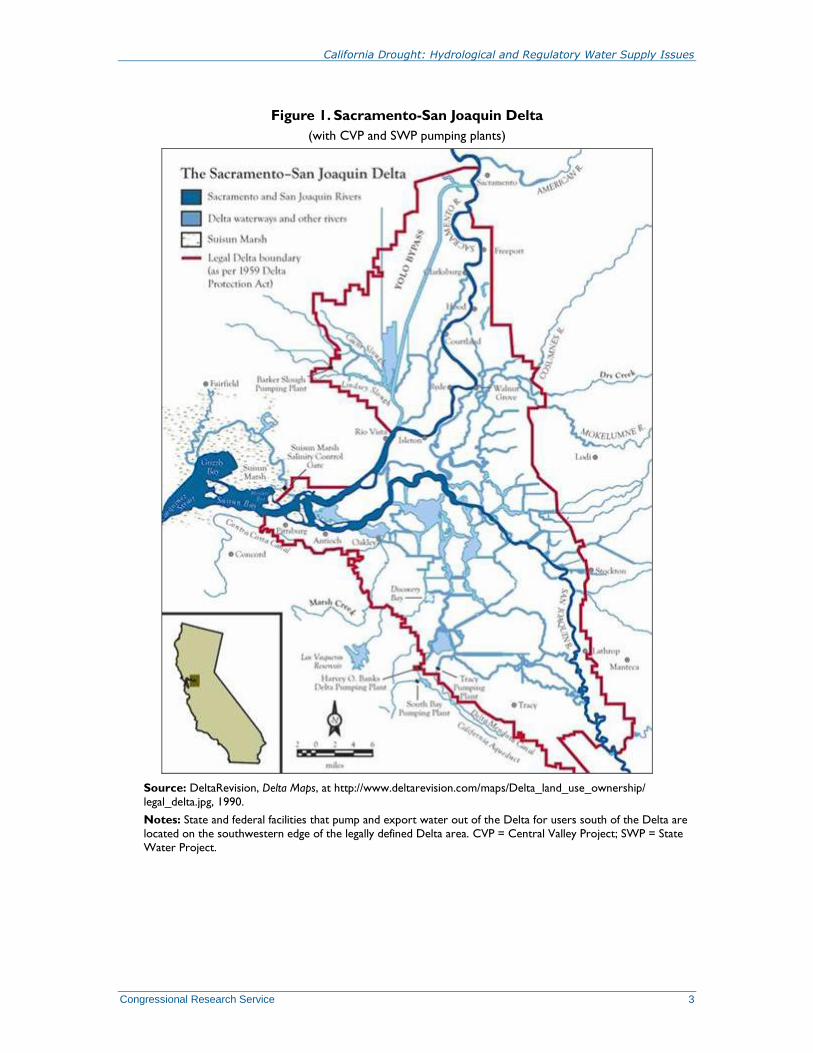
Francisco Bay (Bay-Delta, or Delta, see Figure 1). An estimated 25 million people get some, if
not all, of their drinking and agricultural water supplies from the Bay-Delta—often referred to as
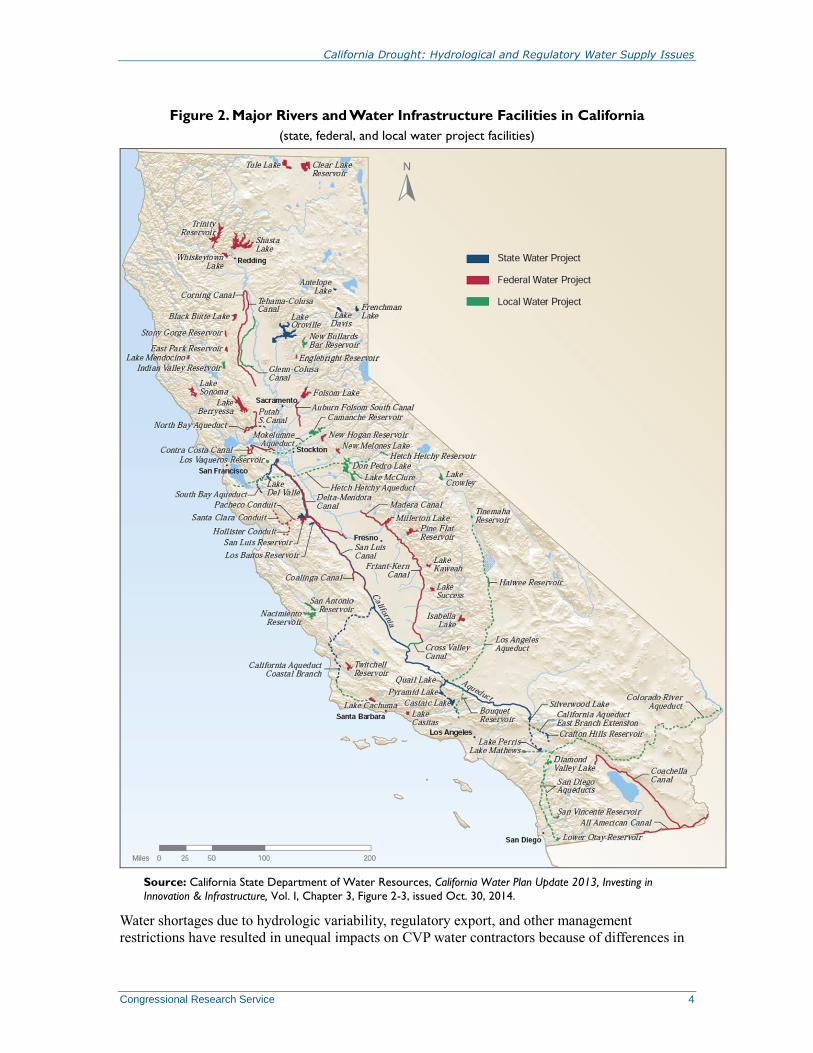
the hub of California’s water supply system.4 Figure 2 shows an overview of CVP and SWP
facilities statewide.
1 National Oceanic and Atmospheric Administration, National Weather Service Climate Prediction Center, U.S.
Seasonal Drought Outlook, (valid for July 16 – October 31, 2015), http://www.cpc.ncep.noaa.gov/products/
expert_assessment/sdo_summary.html. 2 For more information on drought generally, see CRS Report R43407, Drought in the United States: Causes and
Current Understanding, by Peter Folger and Betsy A. Cody. 3 According to the Bureau of Reclamation, “The [Coordinated Operations Agreement, or COA] defines the rights and
responsibilities of the CVP and SWP with respect to in-basin water needs and provides a mechanism to account for
those rights and responsibilities.” See U. S. Dept. of the Interior, Bureau of Reclamation, Biological Assessment on the
Continued Long-term Operations of the Central Valley Project and the State Water Project (OCAP), pp. 1-9, at
http://www.usbr.gov/mp/cvo/OCAP/sep08_docs/OCAP_BA_001_Aug08.pdf. 4 State of California, Department of Natural Resources and Department of Water Resources, Sacramento-San Joaquin
Delta Overview, Sacramento, CA (no date), p. 2, at http://baydeltaoffice.water.ca.gov/sdb/tbp/deltaoverview/
delta_overview.pdf.
California Drought: Hydrological and Regulatory Water Supply Issues
Congressional Research Service 2
Many factors affect CVP water deliveries. These include hydrologic factors, state and federal
laws and regulations, court orders implementing those laws and regulations, CVP contract and
allocations policies, and the state’s long-established state water rights system. The current
hydrological drought in California (2012-present) has lasted longer than the previous California
drought (2007-2009) and probably is more severe. For example, the 2014 water year (October
2013 through September 2014) 5 was the third driest in California since record-keeping began in
1895, and 2013 was the driest calendar year on record for the state. The human factors—laws and
regulations, water rights, and CVP allocations policies—can magnify the impacts of drought on
water deliveries to some contractors. The system of state water rights and water code, together
with CVP contract allocations and priorities, largely dictates who gets how much water and when,
particularly in times of drought or other changes in the hydrologic cycle.6 As with the previous
California drought, some stakeholders are questioning the extent to which compliance with
environmental laws such as the federal Endangered Species Act (ESA; P.L. 93-205; 16 U.S.C.
§§1531 et seq.) and with state water quality laws and regulations are worsening drought impacts
and resulting in significantly reduced project water deliveries—particularly CVP and SWP
exports of water from the Delta.
5 The California Department of Water Resources and the Bureau of Reclamation typically gather data on precipitation,
runoff, and water supply storage on a water year basis. A water year is from October 1 through September 30, as
opposed to the calendar year: January 1 through December 31. 6 For information on water rights, see CRS Legal Sidebar WSLG9, Riparian vs. Appropriated Water Rights, by Cynthia
Brown.
California Drought: Hydrological and Regulatory Water Supply Issues
Congressional Research Service 3
Figure 1. Sacramento-San Joaquin Delta
(with CVP and SWP pumping plants)
Source: DeltaRevision, Delta Maps, at http://www.deltarevision.com/maps/Delta_land_use_ownership/
legal_delta.jpg, 1990.
Notes: State and federal facilities that pump and export water out of the Delta for users south of the Delta are
located on the southwestern edge of the legally defined Delta area. CVP = Central Valley Project; SWP = State
Water Project.
California Drought: Hydrological and Regulatory Water Supply Issues
Congressional Research Service 4
Figure 2. Major Rivers and Water Infrastructure Facilities in California
(state, federal, and local water project facilities)
Source: California State Department of Water Resources, California Water Plan Update 2013, Investing in
Innovation & Infrastructure, Vol. I, Chapter 3, Figure 2-3, issued Oct. 30, 2014.
Water shortages due to hydrologic variability, regulatory export, and other management
restrictions have resulted in unequal impacts on CVP water contractors because of differences in
California Drought: Hydrological and Regulatory Water Supply Issues
Congressional Research Service 5
priority of water rights and other legal agreements underlying different water contracts and
federal and state allocation policies. Combined Delta exports have increased on average since the
1980s and early 1990s, even with implementation of several regulatory restrictions; nonetheless,
CVP water allocations for some contractors have been reduced significantly.
Controversy over CVP water supply deliveries persists in part because even in years with high
levels of precipitation and runoff,7 such as 2011, water deliveries still are often reduced below
their contract amount for some contractors—typically south-of-Delta (SOD) CVP water service
contractors.8 Due to low precipitation levels during the 2011-2012 winter months (2012 water
year), and again throughout the 2012 and 2013 calendar years, water storage levels leading into
the 2013-2014 winter were very low. The result was a low amount of water in reserve going into
the spring of 2014—an unusually warm year with below-average precipitation. CVP and SWP
contract deliveries were allocated at historic lows in 2014, and even senior water rights users
were affected. Some municipalities nearly exhausted water supplies, and some unincorporated
areas experienced wells going dry. Historically low levels of winter precipitation and snowpack
for the 2015 water year have resulted in reduced water allocations again, including zero
allocations for many agricultural water users throughout the CVP. Some communities reliant on
groundwater also have experienced dry wells.
The California State Water Resources Control Board (SWRCB) summarized 2014 drought
impacts as follows:9
$2.2 billion in total economic costs due to drought;
$1.5 billion direct loss to agriculture (3% of the state’s total agricultural
production value);
17,100 jobs lost (3.8% of farm employment);
428,000 acres idled (5%) in the Central Valley, Central Coast, and Southern
California;
$447 million in added groundwater pumping costs;
95% winter-run Chinook egg mortality due to high temperatures;
high spring-run Chinook mortality due to high temperatures;
lowest survey level of Delta smelt on record;
second-lowest level of longfin smelt on record;
population indexes of the striped bass, American shad, and threadfin shad near
record lows; and
potential (unaccounted) impacts to commercial and recreational fishing,
recreation, and other nonagricultural water-dependent industries.
7 Runoff is what occurs as a result of precipitation—rain or snow—that is in excess of evaporation from the land
surface, transpiration from vegetation, and infiltration into soils. The remaining water—runoff—makes its way into
rivers, streams, reservoirs, and possibly the ocean. USGS, California Water Science Center, “Annual Runoff Estimate
for California, at http://ca.water.usgs.gov/data/drought/runoff.html, viewed August 2014. 8 For example, even though water year 2011 was classified as a wet year and more water was pumped from the Delta
than ever before (6.52 million acre-feet, or MAF), the CVP south-of-Delta agricultural water service contractors’
allocation for 2011 started at 50% of contract supply. Although it increased monthly based on revised projections, it
never rose above 80% from April 25 through the rest of the year. Most of the water exported from the Delta in 2011
went to the SWP (3.96 million acre-feet). The CVP total for 2011 was 2.63 MAF. 9 California Water Boards, State Water Resources Control Board, Regional Water Quality Control Boards, 2015
Drought Water Project Operations, PowerPoint presentation, pp. 2-3.
California Drought: Hydrological and Regulatory Water Supply Issues
Congressional Research Service 6
The 113th Congress responded to the 2014 drought by reauthorizing several drought programs,
including the Reclamation States Emergency Drought Relief Act (RSEDR), the National
Integrated Drought Information System (NIDIS), and agricultural assistance programs (2014 farm
bill; Agricultural Act of 2014 [P.L. 113-79]). Congress also included provisions to facilitate water
banking, water transfers, and new storage projects in the FY2014 Consolidated Appropriations
Act (P.L. 113-76). In addition, the 113th Congress debated California-specific legislation,
including S. 2016, S. 2198 (which passed the Senate in May 2014), H.R. 3964 (which passed the
House in February 2014), and H.R. 5781, a compromise bill that passed the House in December
2014; however, none were enacted.
Several bills have been introduced in the 114th Congress. For example, H.R. 2898 passed the
House on July 16, 2015. The bill is similar in several aspects to previously passed House bills
(H.R. 3964 and 5781 from the 113th Congress). Several titles of H.R. 2898 focus on maximizing
CVP and SWP water deliveries, while other titles address Bureau of Reclamation project
authorization and financing throughout the West. With regard to California-specific provisions, a
key challenge for legislators is whether to increase water supplies for CVP and SWP water users,
particularly those in the San Joaquin Valley and Southern California areas (SOD), and how this
could be accomplished without further threatening or endangering the survival of several fish
species and degrading water quality for in-Delta water users. Other bills introduced in the 114th
Congress would address drought management in California more broadly by focusing on
increasing the provision of water supplies through conservation and recycling, among other
activities (e.g., H.R. 291 and S. 176; H.R. 2983 and S. 1837; and H.R. 3045). The state also has
been active in addressing the drought, including funding specific water projects and conservation
activities and calling for mandatory statewide reductions in water use.10
What Is Drought? Droughts have affected the United States, particularly the American West, for centuries. Drought
is defined in a number of ways; the simplest may be as a deficiency of precipitation over an
extended period of time, usually a season or more, resulting in a water shortage for some activity,
group, or environmental sector. 11
The deficiency usually is evaluated relative to some long-term
average condition or balance between precipitation, evaporation, and transpiration by plants.
Drought, which has a beginning and an end, is distinguished from aridity, which describes to low-
rainfall regions and is a relatively permanent feature of climate (e.g., deserts are regions of
relatively permanent aridity).12
At the national level, drought is monitored and reported in an index known as the U.S. Drought
Monitor, which synthesizes various drought indexes and impacts and represents a consensus
among academic and federal scientists of ongoing drought conditions. The U.S. Drought Monitor
uses five key indicators13
as well as expert opinion and other indexes, such as those that account
10 See “California Drought” at http://ca.gov/drought/. See also activities of local water districts at
http://www.acwa.com/content/local-agencies-find-innovative-ways-reduce-use. 11 National Drought Mitigation Center (NDMC), “What Is Drought?” at http://drought.unl.edu/DroughtBasics/
WhatisDrought.aspx. 12 Permanently arid conditions reflect the climate of the region, which is the composite of the day-to-day weather over a
longer period of time. Climatologists traditionally interpret climate as the 30-year average. See NDMC, “What Is
Climatology?” at http://www.drought.unl.edu/DroughtBasics/WhatisClimatology.aspx. 13 The five key indicators include the Palmer Drought Index, the Climate Prediction Center soil moisture model, U.S.
Geological Survey (USGS) weekly streamflow data, the Standardized Precipitation Index, and short- and long-term
(continued...)
California Drought: Hydrological and Regulatory Water Supply Issues
Congressional Research Service 7
for conditions in the West where snowpack is relatively important and those that are used mainly
during the growing season. Drought indexes typically are used to assess and classify the intensity
and type of drought. The classification of drought intensity, such as that shown in Figure 3, may
depend on a single indicator or on several indicators, often combined with expert opinion from
the academic, public, and private sectors.
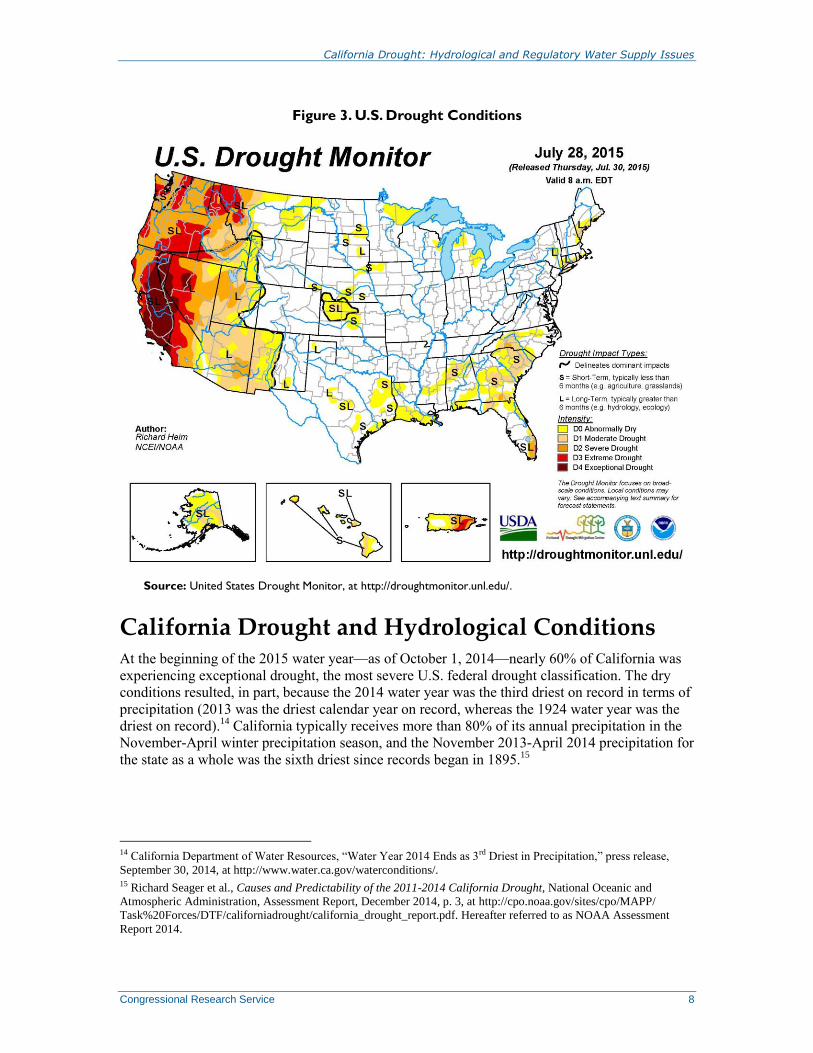
The U.S. Drought Monitor intensity scheme—D0 to D4—is used to depict broad-scale conditions
but not necessarily drought circumstances at the local scale. For example, the large regions
depicted as red and brown, most notably California and parts of Nevada, in Figure 3 faced
extreme to exceptional drought conditions for the week of July 28, 2015, but they may contain
local areas and individual communities that experienced less (or more) severe drought. The U.S.
Drought Monitor in Figure 3 does not reflect availability of water supplied by federal or state
reservoirs or projected water deliveries. It strictly represents the hydrological status of California
from factors other than deliveries of water mandated or restricted by regulation (e.g.,
precipitation, snowpack, streamflow, soil conditions, as described above). In addition to the color-
coded D0-D4 designations, U.S. Drought Monitor maps often include an S and L designation to
provide additional information about the nature of drought. The S designation indicates a
combination of drought indexes that reflect impacts that respond to precipitation over several
days up to a few months (short-term effects). These effects would include impact to agriculture,
topsoil moisture, unregulated streamflows, and aspects of wildfire danger. The L designation
approximates responses to precipitation over several months up to a few years (long-term effects).
These effects would include reservoir levels, groundwater, and lake levels. As Figure 3 shows,
some regions of the United States, such as California, include both an S and an L designation,
indicating that in late July 2015 those regions experienced both short- and long-term impacts.
(...continued)
drought indicator blends. For a discussion of drought indexes, see NDMC, http://www.droughtmonitor.unl.edu/
AboutUs/ClassificationScheme.aspx.
California Drought: Hydrological and Regulatory Water Supply Issues
Congressional Research Service 8
Figure 3. U.S. Drought Conditions
Source: United States Drought Monitor, at http://droughtmonitor.unl.edu/.
California Drought and Hydrological Conditions At the beginning of the 2015 water year—as of October 1, 2014—nearly 60% of California was
experiencing exceptional drought, the most severe U.S. federal drought classification. The dry
conditions resulted, in part, because the 2014 water year was the third driest on record in terms of
precipitation (2013 was the driest calendar year on record, whereas the 1924 water year was the
driest on record).14
California typically receives more than 80% of its annual precipitation in the
November-April winter precipitation season, and the November 2013-April 2014 precipitation for
the state as a whole was the sixth driest since records began in 1895.15
14 California Department of Water Resources, “Water Year 2014 Ends as 3rd Driest in Precipitation,” press release,
September 30, 2014, at http://www.water.ca.gov/waterconditions/. 15 Richard Seager et al., Causes and Predictability of the 2011-2014 California Drought, National Oceanic and
Atmospheric Administration, Assessment Report, December 2014, p. 3, at http://cpo.noaa.gov/sites/cpo/MAPP/
Task%20Forces/DTF/californiadrought/california_drought_report.pdf. Hereafter referred to as NOAA Assessment
Report 2014.
California Drought: Hydrological and Regulatory Water Supply Issues
Congressional Research Service 9
The state is experiencing its fourth consecutive dry year. As of July 28, 2015, 47% of California
still was experiencing exceptional drought and more than 94% of the state was facing drought
conditions that ranged from severe to exceptional.16
Water users receiving supplies from California state and federal water projects are experiencing
unprecedented water supply shortages due to the drought. Severe water supply shortages also
hampered the state during the 2007-2009 drought. Other severe droughts in the last 100 years
include a six-year drought (1987–1992); a two-year drought (1976–1977), and an extended dry
period during the 1920s and 1930s which included the single driest water year on record—1924.
(The driest winter on record was 1976-1977.) Studies of relict tree stumps, tree rings, and other
evidence indicate that parts of California have experienced numerous multiyear droughts, some of
which lasted for decades or even centuries, during the past 2,000 years.17
Whether the current
drought is the worst in California’s history is currently being debated. The role of human-induced
climate change also is being debated, in particular whether the record high temperatures in 2014
combined with low precipitation are a fingerprint of human influence on climate (see text box
below).
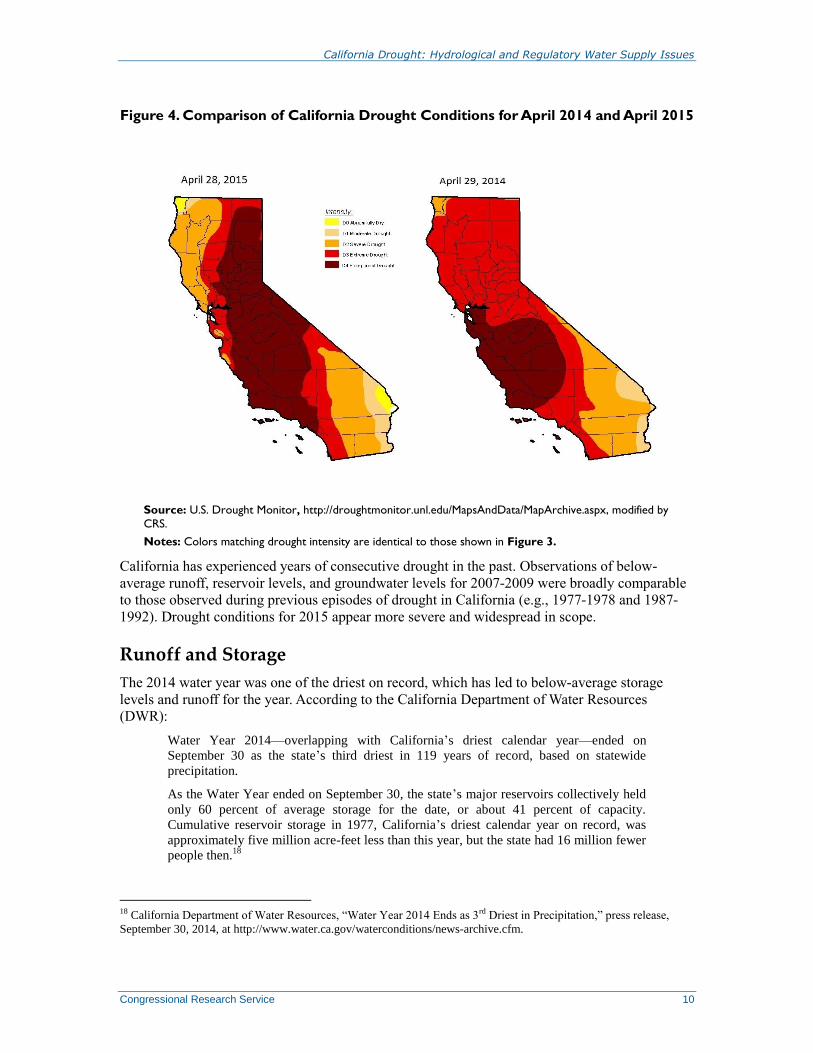
Figure 4 provides a comparison of drought conditions in California on April 29, 2014, and April
28, 2015. Figure 4 shows that the area of exceptional drought expanded considerably over the
course of the year. According to the U.S. Drought Monitor, exceptional drought nearly doubled in
a year, from 25% of California at the end of April 2014 to nearly 47% in late April 2015.
16 U.S. Drought Monitor, July 28, 2015. 17 Rachel Berkowitz, “A Dry State in the West,” Physics Today, July 2014, at http://scitation.aip.org/content/aip/
magazine/physicstoday/news/10.1063/PT.5.4004. See also Scott Stine, “Extreme and Persistent Drought in California
and Patagonia During Mediaeval Time,” Nature, vol. 369 (June 16, 1994), pp. 546-549.
California Drought: Hydrological and Regulatory Water Supply Issues
Congressional Research Service 10
Figure 4. Comparison of California Drought Conditions for April 2014 and April 2015
Source: U.S. Drought Monitor, http://droughtmonitor.unl.edu/MapsAndData/MapArchive.aspx, modified by
CRS.
Notes: Colors matching drought intensity are identical to those shown in Figure 3.
California has experienced years of consecutive drought in the past. Observations of below-
average runoff, reservoir levels, and groundwater levels for 2007-2009 were broadly comparable
to those observed during previous episodes of drought in California (e.g., 1977-1978 and 1987-
1992). Drought conditions for 2015 appear more severe and widespread in scope.
Runoff and Storage
The 2014 water year was one of the driest on record, which has led to below-average storage
levels and runoff for the year. According to the California Department of Water Resources
(DWR):
Water Year 2014—overlapping with California’s driest calendar year—ended on
September 30 as the state’s third driest in 119 years of record, based on statewide
precipitation.
As the Water Year ended on September 30, the state’s major reservoirs collectively held
only 60 percent of average storage for the date, or about 41 percent of capacity.
Cumulative reservoir storage in 1977, California’s driest calendar year on record, was
approximately five million acre-feet less than this year, but the state had 16 million fewer
people then.18
18 California Department of Water Resources, “Water Year 2014 Ends as 3rd Driest in Precipitation,” press release,
September 30, 2014, at http://www.water.ca.gov/waterconditions/news-archive.cfm.
California Drought: Hydrological and Regulatory Water Supply Issues
Congressional Research Service 11
Runoff in California has declined since 2012 and is continuing its downward trend in 2015.
According to the U.S. Geological Survey, runoff in California has shown a downward trend since
2006, despite relatively wet years in 2010 and 2011.19
Below-average runoff indicates an
underlying deficit in precipitation, which would support a common definition of drought: less rain
or snow than a region would receive compared with some long-term average (consistent with the
description of hydrological drought; see “What Is Drought?” above). California has experienced
three dry years in a row, and so far 2015 is a fourth dry year, compared with the long-term
average.
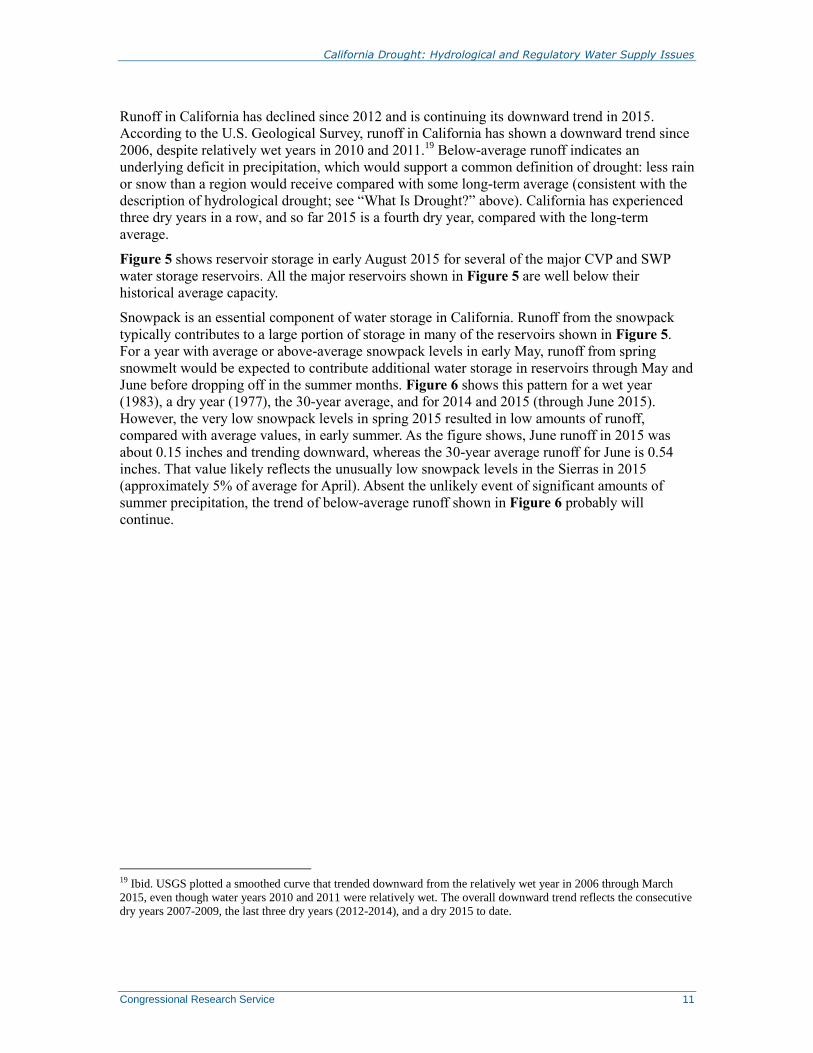
Figure 5 shows reservoir storage in early August 2015 for several of the major CVP and SWP
water storage reservoirs. All the major reservoirs shown in Figure 5 are well below their
historical average capacity.
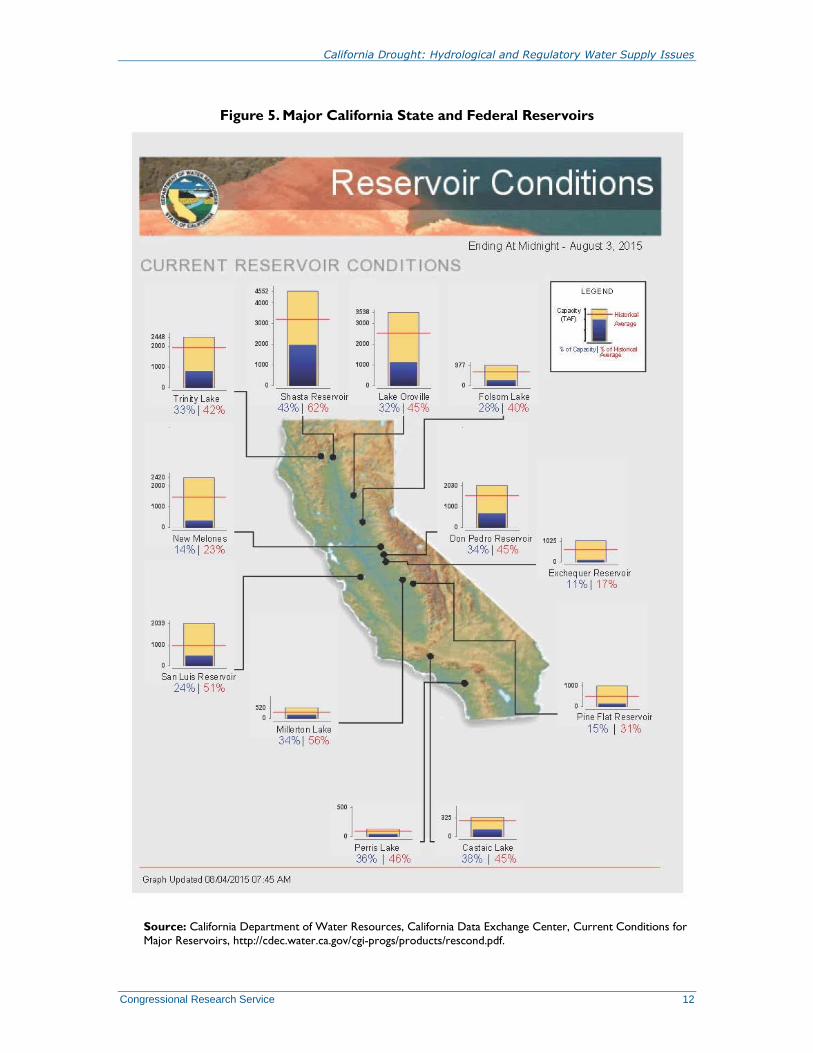
Snowpack is an essential component of water storage in California. Runoff from the snowpack
typically contributes to a large portion of storage in many of the reservoirs shown in Figure 5.
For a year with average or above-average snowpack levels in early May, runoff from spring
snowmelt would be expected to contribute additional water storage in reservoirs through May and
June before dropping off in the summer months. Figure 6 shows this pattern for a wet year
(1983), a dry year (1977), the 30-year average, and for 2014 and 2015 (through June 2015).
However, the very low snowpack levels in spring 2015 resulted in low amounts of runoff,
compared with average values, in early summer. As the figure shows, June runoff in 2015 was
about 0.15 inches and trending downward, whereas the 30-year average runoff for June is 0.54
inches. That value likely reflects the unusually low snowpack levels in the Sierras in 2015
(approximately 5% of average for April). Absent the unlikely event of significant amounts of
summer precipitation, the trend of below-average runoff shown in Figure 6 probably will
continue.
19 Ibid. USGS plotted a smoothed curve that trended downward from the relatively wet year in 2006 through March
2015, even though water years 2010 and 2011 were relatively wet. The overall downward trend reflects the consecutive
dry years 2007-2009, the last three dry years (2012-2014), and a dry 2015 to date.
California Drought: Hydrological and Regulatory Water Supply Issues
Congressional Research Service 12
Figure 5. Major California State and Federal Reservoirs
Source: California Department of Water Resources, California Data Exchange Center, Current Conditions for
Major Reservoirs, http://cdec.water.ca.gov/cgi-progs/products/rescond.pdf.
California Drought: Hydrological and Regulatory Water Supply Issues
Congressional Research Service 13
Figure 6. Comparison of Runoff Amounts for California Between a Wet Year, Dry
Year, 30-Year Average, 2014, and 2015 Through June
Source: U.S. Geological Survey (USGS), California Water Science Center, Annual Runoff Estimate for California, at http://ca.water.usgs.gov/data/drought/runoff.html, viewed August 4, 2015.
Notes: The original source is an interactive feature, enabling the user to scroll over the lines on the figure and
extract runoff amounts in inches for the midpoint of each month. All 2015 data are provisional and subject to
change.
Timing
Persistently dry or drought conditions in most of California since 2012 do not necessarily mean
that all locations throughout California have experienced similar drought conditions at all times.
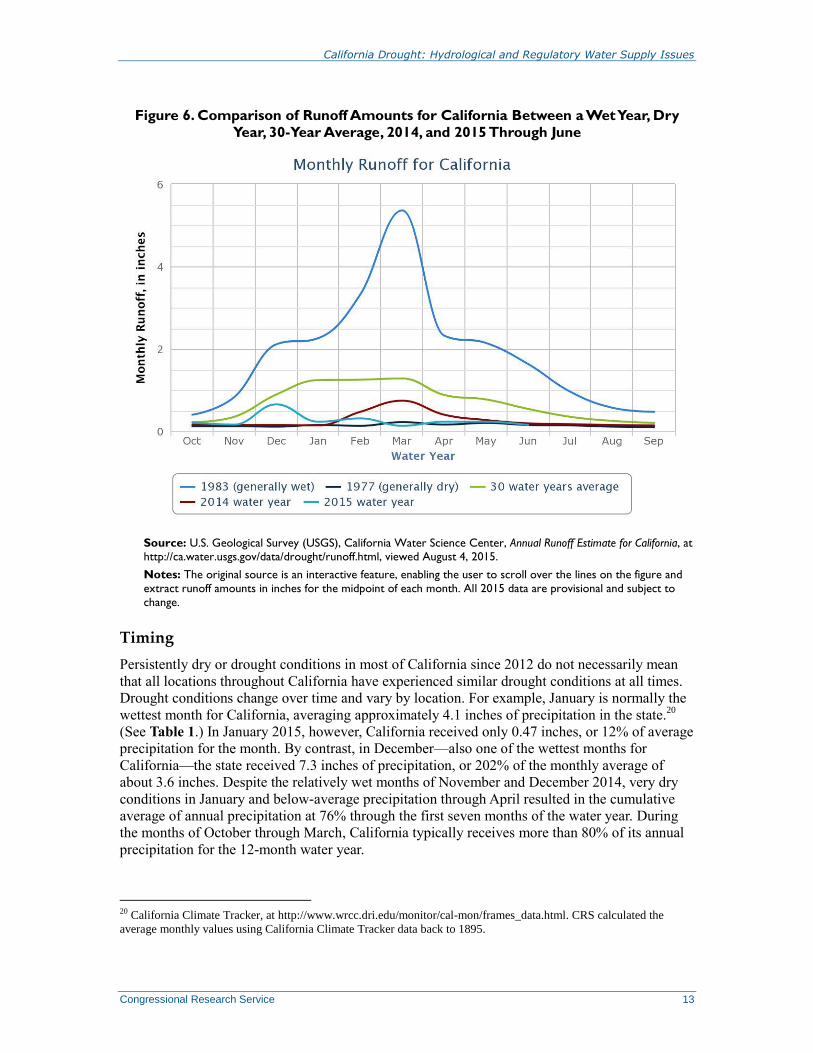
Drought conditions change over time and vary by location. For example, January is normally the
wettest month for California, averaging approximately 4.1 inches of precipitation in the state.20
(See Table 1.) In January 2015, however, California received only 0.47 inches, or 12% of average
precipitation for the month. By contrast, in December—also one of the wettest months for
California—the state received 7.3 inches of precipitation, or 202% of the monthly average of
about 3.6 inches. Despite the relatively wet months of November and December 2014, very dry
conditions in January and below-average precipitation through April resulted in the cumulative
average of annual precipitation at 76% through the first seven months of the water year. During
the months of October through March, California typically receives more than 80% of its annual
precipitation for the 12-month water year.
20 California Climate Tracker, at http://www.wrcc.dri.edu/monitor/cal-mon/frames_data.html. CRS calculated the
average monthly values using California Climate Tracker data back to 1895.
California Drought: Hydrological and Regulatory Water Supply Issues
Congressional Research Service 14
Table 1 also shows that July 2015 was an unusually wet month in California, receiving roughly
10 times the average amount of precipitation that normally falls during the month. However, the
above-average rainfall likely will not affect drought conditions significantly. Even though
California received more than 1.6 inches of precipitation averaged over the state, well above the
normal 0.16 inches, the total amount that fell was less than what the state usually receives each
month from November through March, and the total was equal to about the average precipitation
California receives in April at the end of the wet season (Table 1). Despite the relatively very wet
July, the first 10 months of the 2015 water year cumulatively were still below average (about 83%
of normal), reflecting the dry winter months in early 2015.
Timing of precipitation, and the consequent amount of runoff in the spring that flows into the
state’s reservoirs, is a critical factor leading to water delivery decisions in the spring. Where and
how precipitation occurs (e.g., snow versus rain) also are critical to water delivery decisions for
the SWP and CVP. Both projects rely on precipitation data, including data indicating the water
content of snowpack and projected runoff, to decide how much water to allocate to water users
early in the water year (February-May).
Table 1. Average and Observed Statewide Precipitation, by Month
(percentage of average by month and cumulatively for water year 2015, through July 31, 2015)
Month
Average
Precipitation
Statewide (inches)
Water Year 2015
Observed
Precipitation
(inches)
% of Average
(by month)
% of Average
(cumulative)
October 1.16 0.71 61% 61%
November 2.40 2.0 82% 75%
December 3.60 7.3 202% 139%
January 4.08 0.47 12% 93%
February 3.58 2.7 75% 88%
March 3.03 0.55 18% 77%
April 1.59 1.1 69% 76%
May 0.86 0.77 88% 76%
June 0.34 0.21 62% 76%
July 0.16 1.63 1051% 83%
Total 20.82 17.36 83% 83%
Source: California Climate Tracker, at http://www.wrcc.dri.edu/monitor/cal-mon/frames_data.html. CRS
calculated the average monthly values from using California Climate Tracker data back to 1895.
Note: Totals may not sum due to rounding.
Nature of the California Drought: Possible Causes
and Consequences
The immediate cause of the current California drought appears to be the region of persistent
atmospheric high pressure over the northeast Pacific Ocean offshore Oregon and Washington. The
resilient ridge, as it is sometimes referred to, has changed the atmospheric circulation patterns so
that the wintertime streams of intense precipitation are blocked from reaching the northern
California coastline. These weather features are referred to as atmospheric rivers (ARs) and are
California Drought: Hydrological and Regulatory Water Supply Issues
Congressional Research Service 15
extremely important contributors to California’s precipitation during the winter months. Some
shifts in the high-pressure ridge in December 2014 led to a few AR storms in northern California,
as discussed above, but since that time the resilient ridge has reestablished itself.
Atmospheric Rivers
ARs play an extremely important role in making or “busting” California droughts. The absence of
ARs in January 2014 led to precipitation levels of only 0.43 inches statewide, or 11% of average
for the month. January 2015 precipitation was 0.47 inches statewide, nearly mirroring the
previous year.21
Again, the absence of ARs was in part responsible for the lack of significant
precipitation during the crucial month of January. Further, some have speculated that up to half of
California droughts are busted by ARs that provide a significant proportion of annual
precipitation over a relatively short period.22
However, from May through September, California
typically receives less than an inch of precipitation statewide per month, so the occurrence of a
drought-busting AR in the 2015 water year is increasingly unlikely.
Did Human-Induced Climate Change Cause the 2012-2015 California Drought?
Two studies published in late 2014 provide examples of the ongoing scientific discussion about whether emissions of
heat-trapping greenhouse gases by human activities have influenced the current California drought. One study claimed
that the current drought is the most severe in the past 1,200 years of California’s history.23 The study stated that
diminished snowpack, streamflows, and reservoir levels resulted in a convergence of reduced surface water supply
with increased demand, a combination that appears unique in the state’s history. The study stated that 2014 was the
worst single drought year in at least the last 1,200 years in California but that it was not the driest year. What made
the 2012-2014 drought—and 2014 in particular—stand out was the combination of lack of precipitation and record
high temperatures, resulting in extreme dryness according to a soil-moisture metric known as the Palmer Drought
Severity Index.24 Attributing a human influence is more tenuous, according to the study, as attribution of a human
influence on California rainfall and Pacific storm tracks is equivocal. The study, however, stated that “projections for a
continued trend toward higher mean and extreme temperatures are robust.” Further, the study linked the future
warming to human activities, claiming that “future ‘hot’ droughts driven by increasing temperatures due to
anthropogenic emissions of greenhouse gases ... are assured.”
Another study also published in 2014 found that the 2012-2014 dry conditions were not without precedent in
California’s history. Even with the current drought, the study did not find a clear trend toward wetter or drier
conditions over the past 120 years in California.25 It noted that the impacts of lack of precipitation were exacerbated
by warm temperatures and that November 2013 through April 2014 was the warmest winter half-year on record.26
This second study focused on the influence of sea surface temperatures (SSTs) on atmospheric behavior (SST forcing)
and examined the role of natural atmospheric variability and SST forcing as factors influencing the California drought.
In its examination of the causes of the current drought, the study observed that generally California dry winters arise
from internal atmospheric variability, but that the past three winters also contained a component of SST forcing. In
addition, the study noted that many climate model projections show a future increase in California precipitation over
the midwinter and that “the recent severe all-winter rainfall deficit is thus not a harbinger of future precipitation
21California Climate Tracker, at http://www.wrcc.dri.edu/monitor/cal-mon/frames_data.html. CRS calculated the
average monthly values from using California Climate Tracker data back to 1895. 22Discussions at the April 20-22, 2015, American Geophysical Union Chapman Conference on California drought. 23 Daniel Griffin and Kevin J. Anchukaitis, “How Unusual is the 2012-2014 California Drought?,” Geophysical
Research Letters, published online December 3, 2014, DOI: 10.1002/2014GL062433. 24 For a description of the Palmer Drought Severity Index, see the National Drought Mitigation Center, at
http://drought.unl.edu/Planning/Monitoring/ComparisonofIndicesIntro/PDSI.aspx. 25 Richard Seager et al., Causes and Predictability of the 2011-2014 California Drought, National Oceanic and
Atmospheric Administration, Assessment Report by the NOAA Drought Task Force, December 2014, at
http://cpo.noaa.gov/sites/cpo/MAPP/Task%20Forces/DTF/californiadrought/california_drought_report.pdf. 26 California receives most of its precipitation during the winter and early spring months, November through April.
California Drought: Hydrological and Regulatory Water Supply Issues
Congressional Research Service 16
change.” However, this second study also stated that in the future California may experience a net surface moisture
deficit due to the projected increase in evapotranspiration, driven by warmer temperatures, which would exceed the
projected increase in precipitation. Both studies appear to support that prediction.
Prospects for a Continuing Hydrologic Drought
California receives the bulk of its precipitation in the late fall and winter months (see Table 1),
and it is difficult to predict with any certainty what the precipitation patterns will be going
forward. According to the National Oceanic and Atmospheric Administration’s Climate
Prediction Center (CPC), the outlook for California through the end of October calls for little if
any chance for improvement in drought conditions.27
Unless there is an anomalous weather event,
California likely will experience persistent drought conditions for the rest of the 2015 water year.
The CPC notes that August to October is a dry time in California, a fact that strongly favors
drought persistence for much of the state. Any improvement in drought conditions likely would
be limited to the southeast California desert, which might receive some rainfall associated with
the monsoon and tropical cyclone activity in the eastern Pacific.
As of July 2015, atmospheric and oceanic features reflected an ongoing and strengthening El
Niño. They also reflected a greater than 90% chance that El Niño will continue through the 2015-
2016 winter in the Northern Hemisphere and an 80% chance it will last into early spring 2016.28
Within the modeling community, there appears to be a consensus predicting a strong El Niño,
with temperature and precipitation impacts expected to increase in the late fall and winter.29
Strong El Niño conditions have been associated with a greater probability of above-normal
precipitation for California and parts of the American Southwest, whereas La Niña conditions
often appear to be correlated with drier conditions in those regions.30
However, the relationship
between El Niño-Southern Oscillation (ENSO) conditions and the atmospheric circulation
patterns and SSTs in the eastern and northeastern Pacific Ocean—which have been shown to be
the immediate cause of California’s drought—are complex and unclear.31
Groundwater and Land Subsidence
In the Central Valley, one of the typical consequences of below-average precipitation, reduced
snowpack levels, and lower reservoir levels is an increase in groundwater pumping to offset
reduced surface-water supplies. In an average year, groundwater provides about 45% of
California’s water supply; in a drought year such as 2015, it may supply as much as 65%.32
A
27 National Oceanic and Atmospheric Administration, National Weather Service Climate Prediction Center, “U.S.
Seasonal Drought Outlook,”(valid for July 16-October 31, 2015, at http://www.cpc.ncep.noaa.gov/products/
expert_assessment/sdo_summary.html. 28 Climate Prediction Center, El Nino/Southern Oscillation (ENSO) Diagnostic Discussion, July 9, 2015, at
http://www.cpc.ncep.noaa.gov/products/analysis_monitoring/enso_advisory/ensodisc.pdf. 29 Ibid. 30National Drought Mitigation Center, “ENSO and Drought Forecasting,” at http://drought.unl.edu/DroughtBasics/
ENSOandForecasting.aspx. 31 For more information on ENSO and drought, see CRS Report R43407, Drought in the United States: Causes and
Current Understanding, by Peter Folger and Betsy A. Cody. 32 Luhdorff and Scalmanini Consulting Engineers, James W. Borchers, and Michael Carpenter, Land Subsidence from
Groundwater Use in California, California Water Foundation, Summary Report, April 2014, at
http://www.californiawaterfoundation.org/uploads/1397858037-
SubsidenceShortReportFINAL%2800248030xA1C15%29.pdf.
California Drought: Hydrological and Regulatory Water Supply Issues
Congressional Research Service 17
result of increased pumping is often a decrease in groundwater storage, as indicated by lower
water table levels. (See text box for a discussion of groundwater storage and availability in the
Central Valley.) In addition to affecting groundwater storage, rapid and/or large decreases in
water table levels, especially when they decline past historical lows, may lead to land subsidence
and may pose risks to surface infrastructure such as roads, pipelines, levees, and canals. Land
subsidence has been a longtime issue in the Central Valley, with historical levels of subsidence
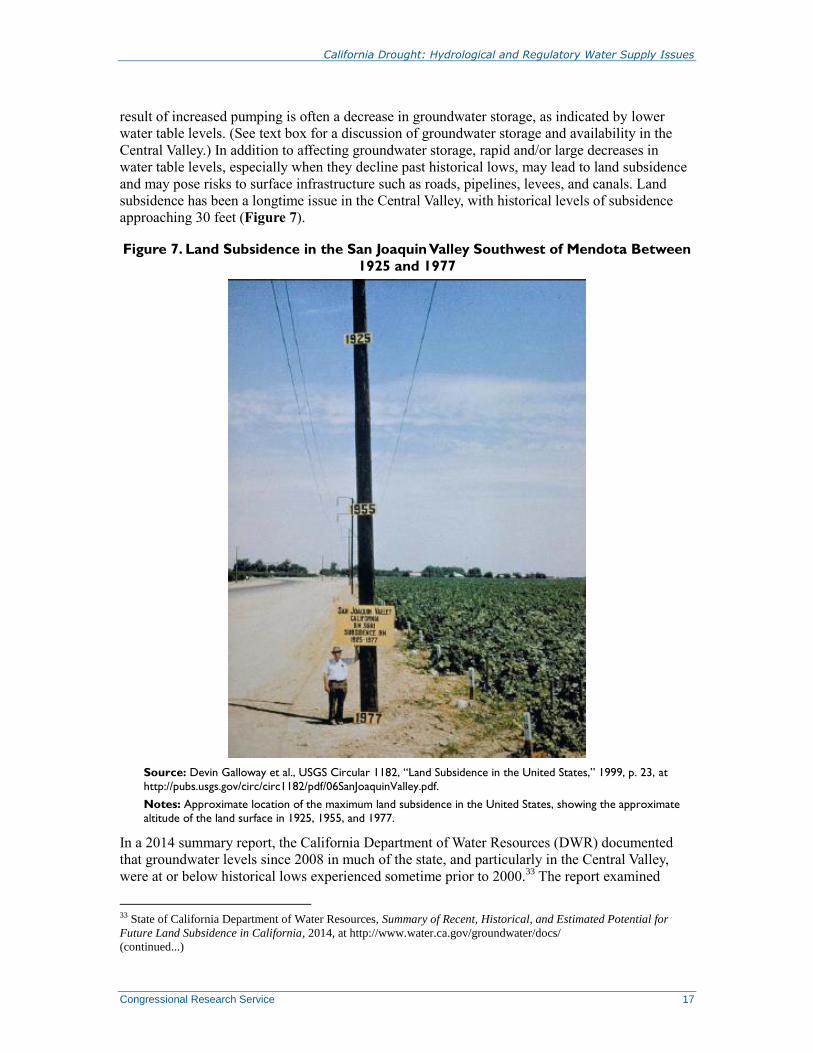
approaching 30 feet (Figure 7).
Figure 7. Land Subsidence in the San Joaquin Valley Southwest of Mendota Between
1925 and 1977
Source: Devin Galloway et al., USGS Circular 1182, “Land Subsidence in the United States,” 1999, p. 23, at
http://pubs.usgs.gov/circ/circ1182/pdf/06SanJoaquinValley.pdf.
Notes: Approximate location of the maximum land subsidence in the United States, showing the approximate
altitude of the land surface in 1925, 1955, and 1977.
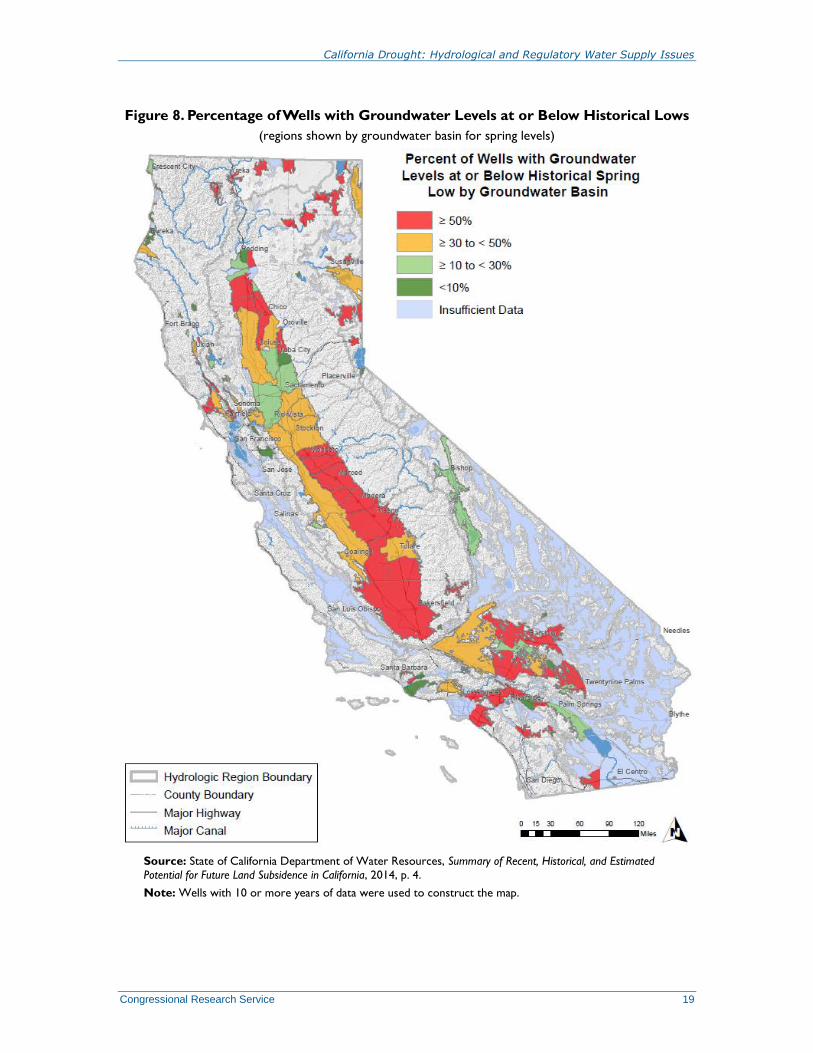
In a 2014 summary report, the California Department of Water Resources (DWR) documented
that groundwater levels since 2008 in much of the state, and particularly in the Central Valley,
were at or below historical lows experienced sometime prior to 2000.33
The report examined
33 State of California Department of Water Resources, Summary of Recent, Historical, and Estimated Potential for
Future Land Subsidence in California, 2014, at http://www.water.ca.gov/groundwater/docs/
(continued...)
California Drought: Hydrological and Regulatory Water Supply Issues
Congressional Research Service 18
water-level data from long-term wells with a record of 10 or more years. Some wells, especially
from portions of the Sacramento Valley, southern San Joaquin Valley, and a few other locations,
exhibit groundwater levels more than 50 feet below historical levels. In the Central Valley in
2014, 36% of the long-term wells in the Sacramento Valley and 55% of the long-term wells in the
San Joaquin Valley were at or below historical levels recorded during springtime conditions.34
(See Figure 8.)
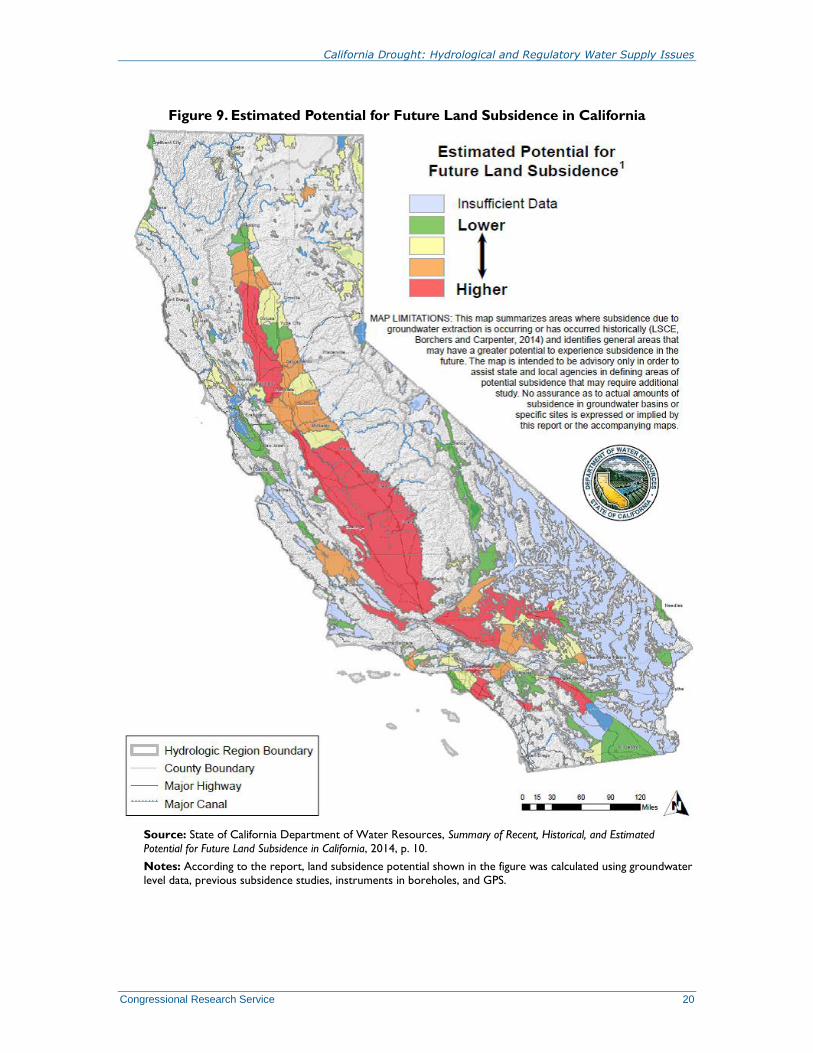
As a result of increased groundwater pumping, subsidence is occurring or reoccurring in many
portions of the state. In some cases, it has damaged land surface features (e.g., one study
indicated subsidence of 1.35 feet between 1995 and 2010 along the Coachella Branch of the All
American Canal in the Coachella Valley, causing earth fissures).35
The California DWR report
estimates that areas with the highest potential for future subsidence are in the southern San
Joaquin, Antelope, Coachella, and western Sacramento Valleys. (See Figure 9.)
(...continued)
Summary_of_Recent_Historical_Potential_Subsidence_in_CA_Final_with_Appendix.pdf. 34 Ibid. 35 Luhdorff and Scalmanini Consulting Engineers, James W. Borchers, and Michael Carpenter, 2014, p. 3.
California Drought: Hydrological and Regulatory Water Supply Issues
Congressional Research Service 19
Figure 8. Percentage of Wells with Groundwater Levels at or Below Historical Lows
(regions shown by groundwater basin for spring levels)
Source: State of California Department of Water Resources, Summary of Recent, Historical, and Estimated
Potential for Future Land Subsidence in California, 2014, p. 4.
Note: Wells with 10 or more years of data were used to construct the map.
California Drought: Hydrological and Regulatory Water Supply Issues
Congressional Research Service 20
Figure 9. Estimated Potential for Future Land Subsidence in California
Source: State of California Department of Water Resources, Summary of Recent, Historical, and Estimated
Potential for Future Land Subsidence in California, 2014, p. 10.
Notes: According to the report, land subsidence potential shown in the figure was calculated using groundwater
level data, previous subsidence studies, instruments in boreholes, and GPS.
California Drought: Hydrological and Regulatory Water Supply Issues
Congressional Research Service 21
Groundwater Availability and Storage in the Central Valley36
Groundwater has been an integral component of water supply for towns and farms in the Central Valley for over a
century. Today, groundwater is the principal supply for municipal and industrial use in the San Joaquin Valley. By
volume, however, agricultural demand for groundwater dwarfs municipal and industrial demand in the Central Valley,
which comprises three-quarters of irrigated land in California and one-sixth of all irrigated land in the United States.
The huge agricultural demand exceeds the availability of surface water or groundwater by themselves; it is met only
by a combination of surface water and groundwater supplies. According to a U.S. Geological Survey (USGS) analysis,
between 1961 and 2003 surface water supplied, on average, about 10 million acre-feet (MAF) per year for irrigation in
the Central Valley and groundwater supplied slightly less than 9 MAF per year. Groundwater pumping from Central
Valley aquifers constitutes about 20% of total U.S. groundwater demand, which makes it the second-most-pumped
aquifer system in the nation.
Groundwater Demand Increases in Dry Years
The relationship between surface water use and groundwater use for irrigation in the Central Valley is complex and
variable, but historically the proportion of groundwater use has increased during drier and drought years and has
decreased during wetter years. That is, the aquifers function to some extent as multiyear reservoirs that are tapped
more heavily when surface water is less available. In the USGS modeling analysis, for example, in a wet year
groundwater pumping may be only 4.5 MAF, about half of the surface water deliveries for irrigation, whereas in a dry
year groundwater pumping may be nearly 12 MAF and exceed the amount supplied by surface water.
Central Valley Groundwater Supply Decreases
Some question whether groundwater stored in Central Valley aquifers could be further used to help farmers meet
their irrigation demands during periods of extended drought or as a long-term substitute for decreased deliveries of
surface water as a result of regulatory requirements, legal actions, or other curtailments. The answer depends in part
on what is known as the water budget. Put simply, when the amount of groundwater pumped from the Central Valley
equals the amount of water returned to the aquifer system, the amount of groundwater held in storage remains the
same—the hydrological equivalent of a balanced budget. However, if the amount of groundwater pumped exceeds the
amount returned, then groundwater storage decreases. Over the period 1961-2003, USGS estimated that the amount
of groundwater held in storage decreased by an average of 1.4 MAF per year, signifying that pumping exceeded
recharge even though California went through cycles of wetter and drier years. Decreases in groundwater storage
typically are indicated by declines in the water table (i.e., the elevation of the groundwater surface that lies below the
land surface). Thus, if groundwater storage continues to decline, then water levels also would be expected to decline.
Increased Groundwater Use Has Consequences
How much the water table would decline is difficult to predict because the geology of the Central Valley aquifer
system is not homogenous. Different agricultural regions likely would pump groundwater at different rates depending
on a host of factors, such as cost of pumping (which depends partly on the depth to the water table), availability of
alternate supplies, groundwater quality, and others. Parts of the Central Valley, such as the western side of the San
Joaquin Valley, experienced hundreds of feet of water table decline in the 20th century because of groundwater
pumping, which in some places resulted in actual land subsidence approaching 30 feet. Reduced pumping in some of
those areas has allowed groundwater levels to recover, however, the compaction of the aquifer from land subsidence
means that the volume of groundwater storage has been permanently decreased.
The use of groundwater to offset diminished surface water supplies during droughts is therefore not without consequences. Although the absolute amount of groundwater held in storage in the Central Valley aquifer system is
likely huge (one estimate is 800 MAF in the upper 1,000 feet of sediments), increased pumping that outstrips the
amount of water returned means that water table levels likely will drop. Lower water tables generally increase
pumping costs, increase the likelihood of land subsidence, and may reduce the availability of groundwater to regions
where the aquifer sediments are thinner and less extensive or may have impaired water quality.
New California Groundwater Law
36 C. C. Faunt et al., Groundwater Availability of the Central Valley Aquifer, California, USGS Professional Paper
1766, 2009, p. 62, at http://pubs.usgs.gov/pp/1766/PP_1766.pdf; U.S. Bureau of Reclamation, The Central Valley
Project: Introduction, by Eric A. Stene, at http://www.usbr.gov/history/cvpintro.html; W. M. Alley, “Tracking U.S.
Groundwater Reserves for the Future,” Environment, vol. 48, no. 3 (2006), pp. 10-25; Devin Galloway, David R. Jones,
and S.E. Ingebritsen, Land Subsidence in the United States, San Joaquin Valley, California, USGS Circular 1182,
2005, at http://pubs.usgs.gov/circ/circ1182/; and California Department of Water Resources, California Groundwater,
Sustainable Groundwater Management, at http://www.water.ca.gov/cagroundwater/.
California Drought: Hydrological and Regulatory Water Supply Issues
Congressional Research Service 22
California Governor Brown signed three bills into law on September 16, 2014, collectively referred to as the
Sustainable Groundwater Management Act. The new law establishes a framework that requires local agencies to
manage groundwater in a sustainable manner. The law sets out a schedule that begins with the California DWR
adopting regulations for evaluating groundwater sustainability plans by June 1, 2016. It also requires formation of
regional groundwater sustainability agencies, identifies high- and medium-priority basins in critical groundwater
overdraft status, and implements the plans. It ultimately would result in sustainably groundwater management by
January 2040.
California’s Drought and CVP Operations Several factors in addition to hydrology affect the operation of the CVP and SWP. These include
protections for threatened and endangered species under the federal Endangered Species Act
(ESA; P.L. 93-205; 16 U.S.C. §§1531 et seq.); state water quality protections under state law and
the federal Clean Water Act (CWA; P.L. 92-500); and other federal and state laws, including the
state’s system of water rights.
Some observers of the 2012-2015 drought have cited regulatory compliance—particularly
restrictions on pumping and proscribed reservoir storage releases under the federal ESA—as a
key driver of reduced water supplies, referring to the drought as “Congress-made” or “man-
made.”37
The argument stems from the fact that stored water has been released to support
threatened and endangered fish species during wet years, rather than storing the water for delivery
to users in these dry times. Conversely, fish protection requirements at times require holding back
water in reservoirs to provide cold water for fish during warmer periods of the year. Thus, the
regulations do not allow that water to be released and pumped further south during the winter for
storage or for use at a later time south of the Bay-Delta. Even in above-normal precipitation
years, water deliveries have been curtailed for some water users—typically water and irrigation
districts with more junior water priorities relative to others receiving water from the CVP system.
Such actions have led some to blame federal ESA restrictions for water supply reductions. It is
not clear how much more water might have been available to CVP water users had supplies not
been restricted due to species protection requirements in prior years—particularly wet years;
however, some have estimated that it could be as high as 1.1 million acre-feet (MAF) in a wet
year, or 440,000 acre-feet (AF) annually, on average.38
Based on federal and state estimates provided for the 2014 water year—a drought year—it
appears that ESA compliance was not the predominant controlling factor in CVP and SWP
pumping restrictions.39
State water quality standards and other factors also play an important role
37 Kendall Breitman, “Carly Fiorina Blames Environmentalists for California Drought,” Politico, April 6, 2015, at
http://www.politico.com/story/2015/04/carly-fiorina-california-drought-116711.html. See also U.S. House Committee
on Natural Resources at http://naturalresources.house.gov/issues/issue/?IssueID=5921. 38 For example, see San Luis & Delta-Mendota Water Authority, et al., California Department of Water Resources v.
Kenneth Lee Salazar, et al., Natural Resources Defense Council, 1:09-cv-00407-LJO-DLB 9 (9th Cir. Court of Appeals
2014), p. 3 infra note 1. Plaintiffs refer to reports projecting that had 2009 been a wet year, the BiOps (biological
opinions) would have resulted in “water losses of 1.1 MAF, with an average annual loss over time of 440,000 acre feet”
and to a DWR report stating exports in September and October might be reduced by 70%. 39 E-mail communications from the California Department of Water Resources on May 22, 2015, noting that
Endangered Species Act (ESA) impacts to SWP for the 2014 water year are estimated to be 47,000 acre-feet; and email
communication from Reclamation on July 14, 2015, noting that ESA impacts on CVP pumping are estimated to be
62,200 acre-feet for the 2014 water year. See also CALFED Operations Group, Water Year 2014 CVPIA Section
3406(b)(2) Operations and accounting, January 28, 2015, p. 12, at http://www.usbr.gov/mp/cvo/data/
FINAL_WY14_b2_presentation.pdf.
California Drought: Hydrological and Regulatory Water Supply Issues
Congressional Research Service 23
in CVP water management, particularly in dry years, whereas ESA compliance may play a larger
role in non-drought years.40
The following sections discuss the range of factors that affect Delta pumping and CVP water
deliveries. Specifically, they discuss key regulatory and water management factors that contribute
to annual water allocation decisions (e.g., biological opinions [BiOps] under the federal ESA,
other federal laws such as the Central Valley Project Improvement Act (CVPIA), the federal
CWA and resultant state water quality requirements, and the state system of water rights and CVP
water allocation priorities). Understanding the limits of the underlying hydrological system upon
which CVP water supply allocations are based is critical to addressing short-term and long-term
water supply issues for the state. Similarly, it is important to understand the complex mix of
regulatory and statutory restrictions, water rights, and contract priorities that affect CVP water
management.
Regulatory and Statutory Restrictions Affecting CVP and SWP
Water Deliveries
There are at least four key regulatory compliance factors that affect the timing and amount of
water that is available for delivery to CVP and SWP contractors.41
The factors relate primarily to
the following:
State water quality requirements pursuant to state and federal water quality laws;
Regulations and court orders pertaining to implementation of the federal ESA;42
Implementation of the 1992 CVPIA; and
State water rights and CVP water allocation priorities.
Another compliance factor related to state water rights priorities is the contracting process for
water delivered from the CVP and SWP. Water users enter contracts with Reclamation and the
DWR that include provisions for the amount of water to be delivered and conditions under which
water may not be delivered. Specifically, these contracts include provisions noting that
contractors are not guaranteed full contracted amounts of water.43
The contracts also provide
exceptions for Reclamation to reduce the contract quantity due to hydrologic conditions and other
conditions outside the control of the contracting officer.44
Other considerations at play during
drought years include maintaining deliveries for essential human health and safety and
maintaining reservoir reserves for future years in case of long-term or extended drought.
40 See, Infra note 2. 41 For purposes of this report, regulatory compliance restrictions are defined as restrictions for which the basis in state
or federal law generally falls into three categories and has resulted in flow or other requirements restricting pumping:
(1) water quality protection; (2) fish and wildlife protection, enhancement, and restoration; and (3) threatened and
endangered species protection. 42 Requirements of the California Endangered Species Act (CESA) are currently being satisfied through
implementation of the federal ESA due to a California state determination that project operations under the federal
BiOps are consistent with requirements under CESA. Presumably, if protections afforded to threatened and endangered
species under the federal ESA were no longer in place, the state of California could invoke protections under CESA. 43 In total, the CVP has issued contracts for approximately 9 MAF of water, more water than it delivers on average (6
MAF to 7 MAF). 44 See U.S. Bureau of Reclamation, Mid-Pacific Region, Final Form of Contract,4-19-2004, Articles 3b, 11, 12a, and
12b, at http://www.usbr.gov/mp/cvpia/3404c/lt_contracts/index.html.
California Drought: Hydrological and Regulatory Water Supply Issues
Congressional Research Service 24
Limitations on Delta Pumping
An estimated 25 million people get some portion, if not all, of their drinking and agricultural
water supplies from the Sacramento and San Joaquin Rivers Delta confluence with San Francisco
Bay—often referred to as the hub of California’s water supply system.45
Water from the
Sacramento and San Joaquin Rivers enters the Bay-Delta estuary and mixes with tidally
influenced saline water from San Francisco Bay. At the southern tip of the Delta, two sets of large
pumps—one for the SWP (the Harvey O. Banks pumping station) and one for the CVP (the
William C. “Bill” Jones pumping station)—extract water from the Delta and pump it into state
and federal canals for delivery to “south-of-Delta” (SOD) water users. For decades, this transfer
of water from northern California through the Delta to supply farms and cities in southern
California has had profound impacts on fish and wildlife resources, water quality, and regional
water supplies. For example, commercial and recreational fisheries on which many north coast
fishermen depend are affected by water management and water quality in the Delta and its
tributaries, as are communities and farmers within the Delta area who divert water from the Delta
for their own use. At the same time, large agricultural areas in the southern portions of the Central
Valley and communities as far south as Los Angeles and San Diego also rely on water diverted
(or exported) from the Delta.
Over decades—particularly since the 1950s—both state and federal laws have been enacted and
implemented to protect Delta resources and the fish, wildlife, and human populations that rely on
these resources.46
More recently—since the early 1990s—state water quality requirements, ESA
requirements, and CVPIA provisions have combined to limit Delta pumping (Delta exports) and
thus deliveries to some SOD water users, even in relatively wet years.
Thus, in addition to hydrologic or drought-related restrictions on water supplies, also at issue is
how state and federal laws and regulations affect deliveries of water from the CVP and SWP. The
effects of reduced pumping—or Delta exports—can and have resulted in economic losses in some
of California’s most productive agricultural areas. Some estimate such losses for 2014 at $1.5
billion in direct agricultural losses ($800 million in the Central Valley and Tulare Basin, which
receive a significant amount of water from the CVP) and $2.2 billion in total economic costs due
to drought.47
Changes in water deliveries due to reduced water supplies can pit widespread economic losses in
some areas of central and southern California against (1) possible extinction of several species
and economic losses to north-coast communities and others dependent on salmon and recreation
industries, and (2) in-Delta farmers and communities that rely on freshwater in the Delta to
maintain reasonable salinity levels. For example, the 95% loss of winter-run Chinook salmon
reproduction and high mortality of spring-run Chinook salmon spawning may result in closures of
north-coast commercial or recreational fishing in subsequent years, as occurred during the last
45 State of California, Department of Natural Resources and Department of Water Resources, Bay-Delta Conservation
Plan, “About the Delta,” at http://baydeltaconservationplan.com/AboutTheDelta/AbouttheDelta.aspx. 46 For example, as early as 1959, the state of California enacted the Delta Protection Act to provide “assurances to
[Delta water interests] that an adequate water supply in the Delta would be maintained” and would “provide protection
to the Delta from the effects of tidal salinity.” See Craig M. Wilson, Delta Watermaster, California’s Area of Origin
Laws, a report to the State Water Resources Control Board and the Delta Stewardship Council, (no date), pp. 5-7. See
also CRS Report RL34554, California Water Law and Related Legal Authority Affecting the Sacramento-San Joaquin
Delta, by Cynthia Brown. 47 California Water Boards, State Water Resources Control Board, Regional Water Quality Control Boards, 2015
Drought Water Project Operations, PowerPoint presentation, pp. 2.
California Drought: Hydrological and Regulatory Water Supply Issues
Congressional Research Service 25
drought.48
And the situation involving reduced Delta pumping is more complex than “farms vs.
fish.” Freshwater flows and mixing in the Delta are required for a number of reasons, including
maintaining adequate water quality for in-Delta farmers and communities dependent on Delta
water supplies and maintaining a salinity barrier to avoid saltwater intrusion deep into the estuary.
Following is a brief description of some of the major regulations and statutory requirements that
sometimes restrict flows or otherwise affect Delta pumping and thus at times limit Delta exports
to SOD water contractors. Some of these requirements serve more than one purpose. For
example, the state Water Quality Control Plan (WQCP, or D-1641), discussed below, includes a
significant number of water quality and flow actions to protect or maintain in-Delta water quality
(primarily from saltwater intrusion) and to protect fish and wildlife habitat generally.
The 1995 Delta Water Quality Control Plan and Decision 1641
The WQCP was issued by the California State Water Resources Control Board (SWRCB) to
comply with state obligations under the federal CWA.49
The plan requires the SWP and CVP to
meet certain water-flow objectives in the Delta to maintain desired salinity and other water
quality objectives, including conditions and actions to support fish and wildlife habitat. These
objectives (e.g., outflow targets, export to inflow ratios, X2 and the Vernalis Adaptive
Management Program [VAMP] targets or objectives) often affect the amount and timing of water
available to be pumped, or exported, from the Delta, and thus at times result in reduced Delta
exports to CVP and SWP water users south of the Delta.50
According to Reclamation,
implementation of D-1641 significantly reduced water for export and included significant “new
‘export limitation’ criteria such as the export to inflow [E/I] ratios and San Joaquin River pulse
period export limits”51
to manage Delta salinity levels and protect fish and wildlife.
Central Valley Project Improvement Act
In 1992 (at the end of a major six-year California drought), Congress passed the CVPIA.52
The
act established fish and wildlife purposes as official project purposes of the CVP and called for a
number of actions both to protect and restore fish and wildlife resources and to mitigate CVP
damages to fish and wildlife resources. These actions included directives to double certain fish
populations by 2002 (which has not occurred), allocate 800,000 AF of project water (600,000 AF
in drought years) to fish and wildlife purposes (often referred to as (b)(2) water, after the
48 California Water Boards, State Water Resources Control Board, Regional Water Quality Control Boards, 2015
Drought Water Project Operations, PowerPoint presentation, pp. 2-3. 49 The CWA requires the states to implement water quality standards that designate water uses to be protected and
adopt water quality criteria that protect the designated uses. For application to California, see United States v. State
Water Resources Control Board (Racanelli), 182 Cal. App. 3d 82, 109 (Cal. Ct. App. 1986). Through the Porter-
Cologne Act (a state law), California implements federal CWA requirements and authorizes the State Water Resources
Control Board to adopt water quality control plans, or basin plans (see Cal. Water Code §13160). 50 Inability to reach agreement on water quality objectives through deliberation and litigation nearly shut down Delta
pumping in the early 1990s and was a significant factor in creation of the Bay-Delta Accord—a partnership between
federal and state agencies with projects, responsibilities, and activities affecting the Delta. Habitat protection
commitments in the accord were incorporated into the WQCP, as were actions called for under the Vernalis Adaptive
Management Program (VAMP), and were included by the State Water Resources Control Board in a document known
as D-1641, which amended the underlying water rights of the SWP and CVP. (See U.S. Department of the Interior,
Bureau of Reclamation, Mid-Pacific Region, Long-Term Central Valley Project Operations Criteria and Plan (CVP-
OCAP), Sacramento, CA, May 22, 2008, p. 2-6.) 51 Ibid. 52 P.L. 102-575, P.L. 102-575, Title 34, 106 Stat. 4706.
California Drought: Hydrological and Regulatory Water Supply Issues
Congressional Research Service 26
provision in the act calling for the allocation), and provide water supplies for Central Valley
refuges (full Level 4 supplies have not been fully implemented).53
The (b)(2) allocation often has
resulted in less water being exported annually from the Delta and thus has reduced the amount of
water available to some CVP water service contractors with junior priority within the CVP
system.
However, the (b)(2) allocation is sometimes also used to meet other state and federal
requirements, such as fish and wildlife aspects of the WQCP as implemented under D-1641, and
thus is not always an additional requirement.54
For example, for the 2014 water year, CVP
accounting of (b)(2) allocations note that of the 402,000 AF (b)(2) assets used, 176,300 AF (44%)
was attributed to export reductions for WQCP Delta outflow requirements.55
The remainder was
attributed to reservoir releases (163.5 MAF) for both CVPIA anadromous fish restoration and
salmonid BiOp purposes, and to export actions (62.2 MAF) under the 2009 salmonid BiOp.56
ESA Biological Opinions
Until 2004, a federal 1993 winter-run Chinook salmon Biological Opinion (BiOp) and a 1995
Delta smelt BiOp (as amended) governed Delta exports for federal ESA purposes (see text box).57
However, a proposed change in coordinated operation of the SWP and CVP in 2004 (including
increased Delta exports), known as OCAP (Operations Criteria and Plan),58
resulted in
development of new BiOps by the National Marine Fisheries Service (NMFS) in 2004 and the
Fish and Wildlife Service (FWS) in 2005 to assess the effects of increased pumping and other
proposed operations on threatened and endangered species. While the first OCAP BiOps found
“no jeopardy” to listed species, the 2005 FWS BiOp was found unlawful and inadequate by a
federal court59
and the NMFS BiOp was subsequently voluntarily withdrawn and redone.
Subsequent BiOps include a host of actions to protect listed species, including restrictions on
pumping during certain periods, prescriptions on the release and storage of cold water to support
fisheries, and other CVP management prescriptions.
Implementation of the reasonable and prudent alternatives (RPAs) contained in the federal BiOps,
which limit pumping and call for water releases from key reservoirs to support listed species, has
been modified due to temporary urgency change orders (TUCs) issued by the SWRCB in 2014
and again in 2015. These TUCs have been sanctioned by NMFS and FWS. Such changes have
53 Level 4 water supplies are defined as the increment over Level 2 supplies needed to provide the optimal amount of
water supply for the refuges, to be acquired from willing sellers or sources outside the CVP. 54 U.S. Department of the Interior, Fish and Wildlife Service and Bureau of Reclamation, Water Year 2014 Final
Accounting - Fishery and Water Quality Control Plan Actions, January 28, 2015, p. 1, at http://www.usbr.gov/mp/cvo/
data/FINAL_b2_2014_fish_action_summary.pdf. 55 CALFED Operations Group, Water Year 2014 CVPIA Section 3406(b)(2) Operations and Accounting, January 28,
2015, p. 12, at http://www.usbr.gov/mp/cvo/data/FINAL_WY14_b2_presentation.pdf. (The full 600,000 AF (b)(2)
allocation was not used in 2014.) 56 Ibid. 57 DWR has relied on federal restrictions for compliance with the California Endangered Species Act (CESA), a
decision that has been the subject of some controversy. 58 U.S. Department of the Interior, Bureau of Reclamation, Mid-Pacific Region, Long-Term Central Valley Project
Operations Criteria and Plan (CVP-OCAP), June 30, 2004. On July 31, 2015, Reclamation released a new
environmental impact statement (EIS) on implementation of the 2008 and 2009 BiOps. CRS was not able to analyze
the EIS prior to preparation of this report. 59 Natural Resources Defense Council v. Kempthorne, 506 F. Supp. 2d 322 (E.D. Cal. 2007). In 2007, a federal court
held that the 2005 Fish and Wildlife Service Delta Smelt BiOp, which found that Operations Criteria and Plan (OCAP)
posed no jeopardy to the Delta smelt, was unlawful and inadequate.
California Drought: Hydrological and Regulatory Water Supply Issues
Congressional Research Service 27
allowed more water to be pumped during certain periods based on real-time monitoring of species
and water conditions. The state DWR estimates that approximately 400,000 AF of water was
made available for export due to these orders in 2014.60
Biological Opinions Under ESA
Federal agencies are required to consult with the Fish and Wildlife Service (FWS) or the National Marine Fisheries
Service (NMFS) to determine whether an agency project might jeopardize the continued existence of species listed as
endangered or threatened pursuant to the federal Endangered Species Act (ESA) 61 or might destroy or adversely
modify a species’ critical habitat. This process is known as consultation. Consultation concludes with the appropriate
service issuing a biological opinion (BiOp) on the potential harm the project poses. If a project could jeopardize a
species, a jeopardy opinion is released, along with any reasonable and prudent alternatives (RPAs) to the agency action
that would avoid jeopardy. If no jeopardy is found, a no jeopardy opinion is issued.
FWS and NMFS each have issued federal BiOps on the effects of changes to the coordinated operation of the State Water Project (SWP) and Central Valley Project (CVP) and found that proposed changes, including increased
pumping from the Delta, would jeopardize the continued existence of several species protected under the ESA and
thus risk the extinction of these species. To avoid such jeopardy, the FWS and NMFS BiOps included RPAs for
project operations. Actions needed to avoid jeopardy to Delta smelt under the FWS BiOp issued in December
200862 resulted in restrictions on the amount of water exported via SWP and CVP Delta pumps (Delta exports). The
June 2009 NMFS BiOp on salmon and other anadromous and ocean species includes further limitations on pumping
and release of stored water.63 These restrictions, combined with reductions necessitated by drought conditions, have
resulted in some water users receiving less or no water normally supplied by the CVP.
Other Factors Affecting Pumping
In addition to the ESA, several other state and federal laws enacted to protect Delta resources have resulted in
restrictions on how much, and when, water may be pumped from the Delta by the SWP and CVP. For example, the
California Endangered Species Act (CESA) was the basis for halting pumps in 2008,64 and in 2014 California’s water
quality control plan (D-1641) often came into play restricting pumping before ESA. These restrictions, while protecting the interests of those who rely on and value Delta resources and the goods and services they provide (e.g.,
cleaner, less saline water; viable fish habitat for recreational and commercial fish species; and water supply for in-Delta
or near-Delta users), also have resulted in some water users receiving less water than they originally contracted to
receive from the SWP and CVP. Although many of these water users benefit from better-quality water than what
otherwise might be delivered, these regulatory restrictions to protect threatened and endangered species and water
quality have reduced the quantity of water available to those south-of-Delta SWP and CVP users with contracts based
on water rights junior in priority to other senior rights holders or with otherwise lower priority for CVP project
deliveries.65
60California Environmental Protection Agency and State Water Resources Control Board, March 5, 2015 Order
Modifying an Order that Approved in Part and Denied in Part a Petition for Temporary Urgency Changes to Permit
Terms and Conditions Requiring Compliance with Delta Water Quality Objectives in Response to Drought Conditions,
p. 4, at http://www.waterboards.ca.gov/waterrights/water_issues/programs/drought/docs/tucp/tucp_order030515.pdf. 61 Act of December 28, 1973, P.L. 93-205; 87 Stat. 884, codified at 16 U.S.C. §§1531 et seq. This report assumes a
basic knowledge of the act; an overview of the ESA and its major provisions may be found in CRS Report RL31654,
The Endangered Species Act: A Primer, by M. Lynne Corn and Kristina Alexander. 62 U.S. Department of the Interior, Fish and Wildlife Service, California and Nevada Region, Formal Endangered
Species Act Consultation on the Proposed Coordinated Operations of the Central Valley Project (CVP) and State Water
Project (SWP), Memorandum to Operation Manager, Bureau of Reclamation, from Regional Director, FWS Region 8,
Sacramento, CA, December 15, 2008, at http://www.fws.gov/sacramento/es/documents/SWP-CVP_OPs_BO_12-
15_final_OCR.pdf. 63 U.S. Department of Commerce, National Marine Fisheries Service, Southwest Region, Biological Opinion and
Conference Opinion on the Long-term Operations of the Central Valley Project and State Water Project, Endangered
Species Act Section & Consultation, Sacramento, CA, June 4, 2009, at http://swr.nmfs.noaa.gov/ocap/
NMFS_Biological_and_Conference_Opinion_on_the_Long-Term_Operations_of_the_CVP_and_SWP.pdf. 64 Watershed Enforcers v. California Dep’t of Natural Resources, No. RG06292124 (Sup. Ct. Alameda Co. March 22,
2007). 65 Lack of sufficient water supplies in 2014 also resulted in historically low water deliveries to senior water rights
(continued...)
California Drought: Hydrological and Regulatory Water Supply Issues
Congressional Research Service 28
Many of those adversely affected have expressed anger over export reductions and frustration with federal and state
officials who are responsible for or who implement Delta export reductions.66 Others, including Pacific Coast
fishermen’s organizations and groups concerned about the effects of increased pumping on declining fish species and
north-coast fish-dependent economies, generally oppose efforts to halt or modify implementation of the BiOps,
including recent legislative attempts to increase pumping.67
Effects of Regulatory and Statutory Restrictions
The above restrictions, combined with hydrologic conditions, contribute to reductions in pumping
from the Bay-Delta at both the CVP and SWP pumping plants and to significant reductions in
SOD water deliveries for some users. For example, CVP agricultural water service contractors
have had their deliveries reduced from full contract supplies in all but 3 of the last 25 years—
since the regulatory factors noted above have been in place—and reduced by 50% or more in 12,
or nearly half, of those 25 years, even though total combined exports rates are on average higher
than in the past (see Table 2).
It is not clear to what extent each of the above statutory and regulatory requirements
independently has contributed to Delta export reductions in any given year. In managing SWP
and CVP operations, both DWR and Reclamation must balance flow and other criteria in the
Delta with temperature requirements and other factors in disparate places within the projects’
system, including stretches of the Sacramento River. Thus, some of these requirements overlap
and at times also may conflict with one another. For example, river temperature requirements may
dictate release of water from upstream reservoirs at certain times when such releases may leave
less water available for species needs at a later date. These factors make it especially difficult to
ascertain to what extent the different water quality and/or CVPIA obligations noted above
contribute to Delta export reductions in any given year.
Recent Delta Export Reductions: Selected Examples68
Combined CVP and SWP Delta exports in the 2014 water year are estimated to have been 1.86
MAF (or 38% of total average annual exports of 4.84 MAF) from 1976-2014, the lowest
combined export recorded during that 38-year time period (see Table 2).69
Reclamation estimates
that the amount of CVP water not pumped (CVP export reduction) due to ESA restrictions was
62,200 AF (0.062 MAF) of water in 2014; approximately 2%of the total reduction in pumping
(...continued)
holders south of the Delta. Some water users argue that had these regulatory restrictions not been in place in wet water
years, there would have been more water available for use during these drought years. 66 See House Committee on Natural Resources, Oversight Field Hearing on “California Water Crisis and Its Impact:
The Need for Immediate and Long-Term Solutions,” March 19, 2014, and congressional floor debate on H.R. 2898,
July 15 and 16, 2015. 67 John McManus, Dick Pool, and Randy Repass, et al., The Impact of the California Drought on Salmon, Golden Gate
Salmon Association, handout from presentation for congressional staff, April 15, 2015, p. 1. 68 Examples are based on data supplied by Reclamation or more readily available in operations reports. 69 The annual combined exports of the SWP and CVP averaged 5.7 MAF from 1998 through 2007. However, a five-
year average (2003-2007) was 6.1 MAF, and a three-year average (2004-2006, when OCAP changes were in effect),
was 6.2 MAF. U.S. Department of the Interior, Bureau of Reclamation, Mid-Pacific Region, Biological Assessment on
the Long-Term Operations of the Central Valley Project and the State Water Project, Sacramento, CA, August 2008,
Table 2-25, p. 120, at http://www.usbr.gov/mp/cvo/OCAP/sep08_docs/OCAP_BA_Aug08.pdf (hereinafter referred to
as the 2008 BA).
California Drought: Hydrological and Regulatory Water Supply Issues
Congressional Research Service 29
from the long-term average of 4.84 MAF.70
The state estimates that SWP exports were reduced by
approximately 47,000 AF (0.047 MAF) over 29 days due to ESA restrictions in 2014.71
Combined, it appears that 0.109 MAF (109,000 acre-feet) of the total reduction in combined
exports can be attributed to pumping restrictions required to protect listed species under ESA.
The remaining reductions were most likely due to a lack of runoff and operational changes
needed to control salinity levels in the Delta.
In contrast to the estimated reductions for ESA, Reclamation estimates that CVP export
reductions made for state D-1641 habitat and fishery purposes in 2014 totaled 176,300 AF.72
As
noted earlier, Reclamation identified these state-mandated reductions as actions counting toward
CVPIA (b)(2) water allocation for (b)(2) accounting purposes. In years past, it has been noted that
up to 450,000 AF annually could be used to meet Delta D-1641 water quality and habitat
obligations from the 800,000 AF (b)(2) allocation set aside for fish and wildlife purposes under
the CVPIA.73
Thus, in some years, pumping restrictions are controlled more often by D-1641,
resulting in CVP pumping reductions for D-1641 greater than for ESA purposes. In wet years,
however, ESA restrictions may have a higher nominal impact on exports and proportionally
higher impacts in certain months.74
DWR does not account for reductions from historical levels
due to D-1641 standards.75
Reclamation estimated that restrictions for the protection of salmon and other fish species
resulted in approximately 250,000 AF of CVP export reductions in 2013. This figure represents
nearly 39% of the total CVP export reductions for 2013 (depending on agency calculations).
Reclamation noted similar reductions in 2009 during the previous drought (see below).76
For 2011
(a wet year), Reclamation estimated that pumping restrictions totaled 90,000 AF (62,000 AF for
endangered species and 28,000 AF for CVPIA purposes), or approximately 1.4% of the 6.9 MAF
that was exported from the Delta that year. Figure 10shows CVP and SWP pumping levels from
1976 through 2014. As shown in Figure 10, higher-than-average combined pumping levels were
sustained from 2000 through 2007.
Under several different scenarios (using different export baseline totals), the estimated impacts of
ESA restrictions on exports in 2009 ranged from 20% to 25% (see text box below). The 2008
70 Personal communication via email from the Bureau of Reclamation, February 11, 2015, and response of Michael C.
Connor, Deputy Secretary of the Department of the Interior at a House Interior, Environment, and Related Agencies
Subcommittee budget hearing on February 25, 2015 (See http://www.eenews.net/eedaily/2015/02/26/stories/
1060014067.) 71 Personal communication via email from the Department of Water Resources, February 10 and February 13, 2015,
and May 22, 2013. 72 CALFED Operations Group, Water Year 2014 CVPIA Section 3406(b)(2) Operations and accounting, January 28,
2015, p. 12, at http://www.usbr.gov/mp/cvo/data/FINAL_WY14_b2_presentation.pdf. 73 According to CALFED documents, the agencies, “in conjunction with the Governor’s Drought Contingency Plan ...
will use their available resources to create an insurance policy that will seek to eliminate impacts to water users, while
not adversely affecting other uses.” See CALFED Bay-Delta Program, Programmatic Record of Decision, vol. 1,
Record of Decision and Attachments 1-4, Aug. 28, 2000, p. 55. 74 San Luis & Delta-Mendota Water Authority, et al., California Department of Water Resources v. Kenneth Lee
Salazar, et al., Natural Resources Defense Council, 1:09-cv-00407-LJO-DLB 9 (9th Cir. Court of Appeals 2014), p. 3
infra note 1. Plaintiffs refer to reports projecting that had 2009 been a wet year, the BiOps would have resulted in
“water losses of 1.1 MAF, with an average annual loss over time of 440,000 acre feet” and to a DWR report stating
exports in September and October might be reduced by 70%. 75 Email communication with the California Department of Water Resources, February 10 and February 13, 2015, and
May 22, 2015. 76 U.S. Department of the Interior, Bureau of Reclamation, California Drought Response Fact Sheet, revised September
17, 2009, p. 1.

California Drought: Hydrological and Regulatory Water Supply Issues
Congressional Research Service 30
FWS Delta smelt BiOp actions initially were estimated to reduce Delta exports by 500,000 AF
(0.5 MAF). However, a district court prevented those measures from fully taking effect in 2009,77
and drought conditions affected operations such that other factors reduced pumping ability before
ESA restrictions could fully take effect. For example, at a March 31, 2009, House Committee on
Natural Resources hearing, acting Reclamation Commissioner William McDonald noted that
although FWS Delta smelt BiOp pumping restrictions became effective in early March 2009,
Reclamation at the same time needed to restrict pumping due to other statutory restrictions (i.e.,
CVPIA). The Commissioner stated: “There was actually no net reduction in pumping [from
federal pumps in early 2009] merely because of ESA.”78
Later in the year, however, ESA did
come into play resulting in restricted pumping, as discussed below.
Caveats Regarding Factors Affecting Exports
The volume of water estimated to make up the export reductions in any given year depends on assumptions
underlying calculations of the estimate (e.g., the amount of rescheduled water from a prior year that might have been moved earlier to make space available for additional storage, water that might have been hydrologically available for
pumping, etc.). (See http://www.usbr.gov/newsroom/newsrelease/detail.cfm?RecordID=42804 for information on
actions to make up for reduced pumping.)
Additionally, the export reduction as a percentage of exports will vary depending on the baseline used for the total
average export. For example, the average annual combined export level based on a selective three-year average (e.g.,
2004-2006, when Reclamation increased pumping under the new coordinated operations plan [OCAP]) is 6.2 MAF
(see Table 2). This three-year window approximates the time between the issuance of OCAP and court-imposed
restrictions on pumping levels. The estimated exports for 2009 of 3.6 MAF under this scenario represent a reduction
of 2.6 MAF for 2009, or 42% from the three-year average. Of this amount, approximately 19% (0.5 MAF) could be
attributed to Delta smelt restrictions and 81% (2.1 MAF) to drought and other factors. However, the average
pumping levels during this time were 0.05 MAF higher than the average from 1998 to 2007 and substantially higher
than in any other period except 1989 and 1990. Different baselines would yield different results. For example, if the
10-year average from 2000 through 2009 (5.4 MAF) were used, the pumping reduction would be smaller—1.8 MAF as
opposed to 2.6 MAF—but the percentage attributable to Delta smelt restrictions would be higher (28%). The
percentage reductions attributable to Delta smelt restrictions in non-dry (non-drought) years in all scenarios are
estimated to be higher than those estimated for 2009.
In sum, although the RPAs for threatened and endangered species protection under ESA affect
Delta exports, other requirements also restrict exports and contribute to RPA actions. Together
these elements are intended to provide a network of protection for species and water quality for
in-Delta uses such as farming and drinking water, and one element is not easily separated from
others. Thus, even if the ESA were waived or overridden, federal and state agencies would still be
required to comply with several state and federal laws and directives that in combination limit
Delta exports (e.g., the federal Clean Water Act and CVPIA, the state Porter-Cologne Act and its
implementing directive D-1641, the California Endangered Species Act, and the California Fish
and Game Code). Crafting congressional solutions to the water supply restrictions thus becomes
difficult and involves many interested parties and stakeholders with differing interests, as well as
interactions with state law and policies.
77 San Luis and Delta-Mendota Water Authority v. Salazar, 2009 WL 1575169 (E.O. Cal. May 29, 2009). It is not clear
what effect this decision had on the 500,000 AF estimate. 78 Statement of William McDonald, Acting Commissioner of Reclamation, during a U.S. House of Representatives
Natural Resources Committee hearing on drought conditions in California, The California Drought: Actions by Federal
and State Agencies to Address Impacts on Lands, Fisheries, and Water Users, March 31, 2009, pp. 124-125.
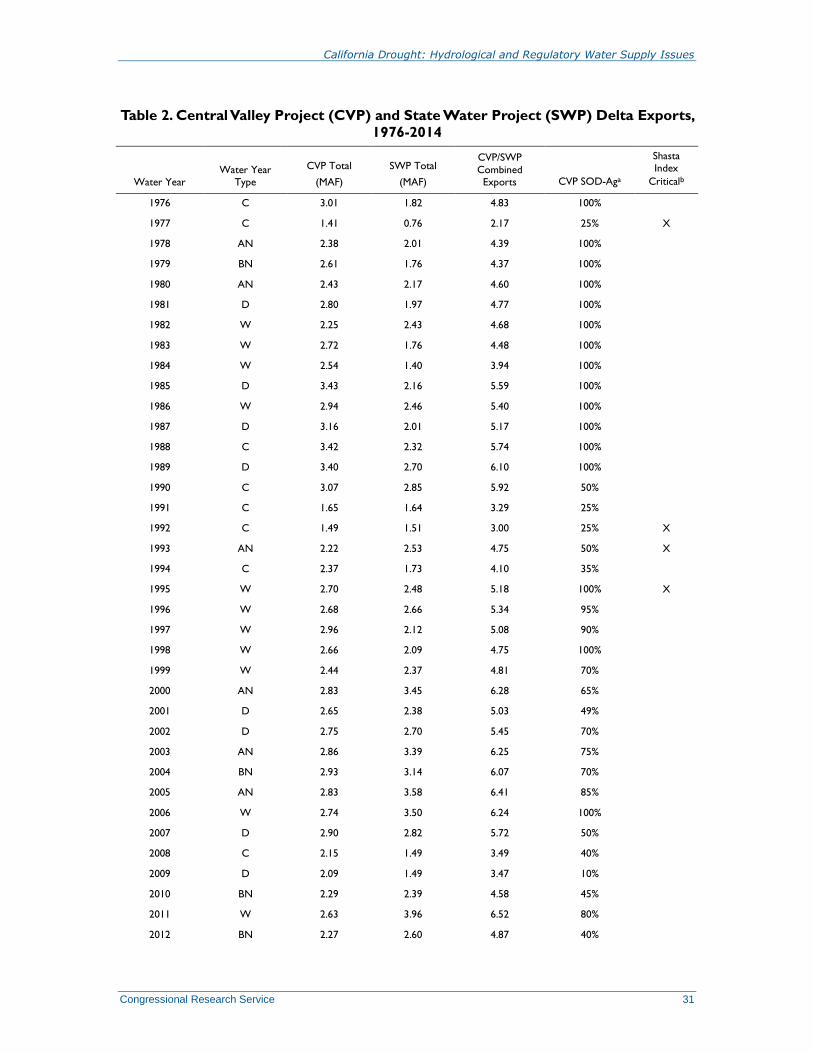
California Drought: Hydrological and Regulatory Water Supply Issues
Congressional Research Service 31
Table 2. Central Valley Project (CVP) and State Water Project (SWP) Delta Exports,
1976-2014
Water Year Water Year
Type
CVP Total
(MAF)
SWP Total
(MAF)
CVP/SWP
Combined Exports CVP SOD-Aga
Shasta Index
Criticalb
1976 C 3.01 1.82 4.83 100%
1977 C 1.41 0.76 2.17 25% X
1978 AN 2.38 2.01 4.39 100%
1979 BN 2.61 1.76 4.37 100%
1980 AN 2.43 2.17 4.60 100%
1981 D 2.80 1.97 4.77 100%
1982 W 2.25 2.43 4.68 100%
1983 W 2.72 1.76 4.48 100%
1984 W 2.54 1.40 3.94 100%
1985 D 3.43 2.16 5.59 100%
1986 W 2.94 2.46 5.40 100%
1987 D 3.16 2.01 5.17 100%
1988 C 3.42 2.32 5.74 100%
1989 D 3.40 2.70 6.10 100%
1990 C 3.07 2.85 5.92 50%
1991 C 1.65 1.64 3.29 25%
1992 C 1.49 1.51 3.00 25% X
1993 AN 2.22 2.53 4.75 50% X
1994 C 2.37 1.73 4.10 35%
1995 W 2.70 2.48 5.18 100% X
1996 W 2.68 2.66 5.34 95%
1997 W 2.96 2.12 5.08 90%
1998 W 2.66 2.09 4.75 100%
1999 W 2.44 2.37 4.81 70%
2000 AN 2.83 3.45 6.28 65%
2001 D 2.65 2.38 5.03 49%
2002 D 2.75 2.70 5.45 70%
2003 AN 2.86 3.39 6.25 75%
2004 BN 2.93 3.14 6.07 70%
2005 AN 2.83 3.58 6.41 85%
2006 W 2.74 3.50 6.24 100%
2007 D 2.90 2.82 5.72 50%
2008 C 2.15 1.49 3.49 40%
2009 D 2.09 1.49 3.47 10%
2010 BN 2.29 2.39 4.58 45%
2011 W 2.63 3.96 6.52 80%
2012 BN 2.27 2.60 4.87 40%
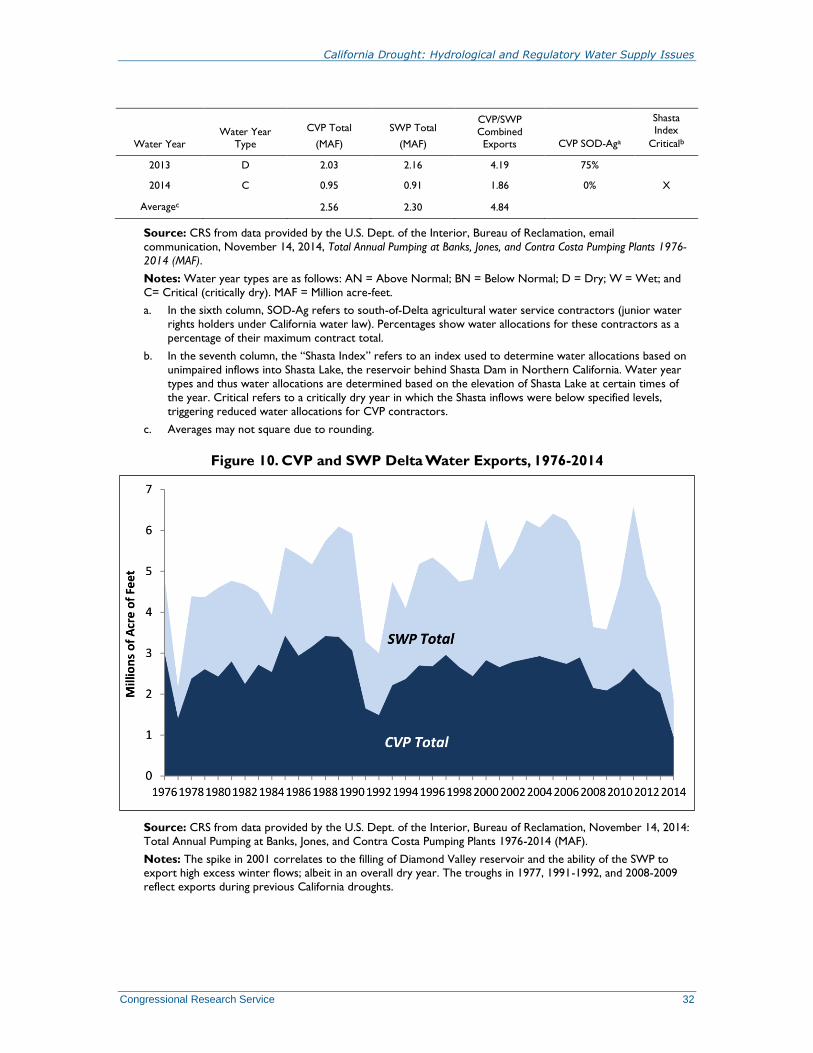
California Drought: Hydrological and Regulatory Water Supply Issues
Congressional Research Service 32
Water Year Water Year
Type
CVP Total
(MAF)
SWP Total
(MAF)
CVP/SWP Combined Exports CVP SOD-Aga
Shasta Index
Criticalb
2013 D 2.03 2.16 4.19 75%
2014 C 0.95 0.91 1.86 0% X
Averagec 2.56 2.30 4.84
Source: CRS from data provided by the U.S. Dept. of the Interior, Bureau of Reclamation, email
communication, November 14, 2014, Total Annual Pumping at Banks, Jones, and Contra Costa Pumping Plants 1976-
2014 (MAF).
Notes: Water year types are as follows: AN = Above Normal; BN = Below Normal; D = Dry; W = Wet; and
C= Critical (critically dry). MAF = Million acre-feet.
a. In the sixth column, SOD-Ag refers to south-of-Delta agricultural water service contractors (junior water
rights holders under California water law). Percentages show water allocations for these contractors as a
percentage of their maximum contract total.
b. In the seventh column, the “Shasta Index” refers to an index used to determine water allocations based on
unimpaired inflows into Shasta Lake, the reservoir behind Shasta Dam in Northern California. Water year
types and thus water allocations are determined based on the elevation of Shasta Lake at certain times of
the year. Critical refers to a critically dry year in which the Shasta inflows were below specified levels,
triggering reduced water allocations for CVP contractors.
c. Averages may not square due to rounding.
Figure 10. CVP and SWP Delta Water Exports, 1976-2014
Source: CRS from data provided by the U.S. Dept. of the Interior, Bureau of Reclamation, November 14, 2014:
Total Annual Pumping at Banks, Jones, and Contra Costa Pumping Plants 1976-2014 (MAF).
Notes: The spike in 2001 correlates to the filling of Diamond Valley reservoir and the ability of the SWP to export high excess winter flows; albeit in an overall dry year. The troughs in 1977, 1991-1992, and 2008-2009
reflect exports during previous California droughts.
California Drought: Hydrological and Regulatory Water Supply Issues
Congressional Research Service 33
How Do Recent Exports Compare to Previous Droughts?
California is experiencing its fourth significant drought in approximately 40 years, averaging one
each decade: 1976-1977; 1987-1992; 2008-2010; and 2012-the present. Combined CVP and SWP
exports were curtailed to 2.71 MAF in 1977 but reached a record high for the time in 1989 and
1990 (6.1 MAF and 5.92 MAF, respectively) in the middle of a six-year drought.79
It was not until
1991 and 1992, the last two years of the drought, that combined CVP and SWP exports were
significantly curtailed to 3.29 MAF and 3.0 MAF, respectively (see Table 2).
Reclamation estimates that during the last drought, combined 2008 water year exports totaled
3.49 MAF, a difference of +0.2 to +0.49 MAF compared with 1991 and 1992. All three water
years (1991, 1992, and 2008) were classified as critical dry. Thus, it appears that more water was
exported in 2008 than during the driest years of the 1987-1992 drought.80
Further, the relatively
large export values occurred even though post-1992 regulatory restrictions—such as the new
Delta smelt BiOp (see Figure 10), those contained in CVPIA, and D-1641—were not then in
place. Similarly, combined exports for the dry 2009 water year, the second year of the recent
three-year drought, were 3.47 MAF—higher than the end of the six-year drought in the early
1990s and with more recent regulatory restrictions in place. For the 2014 water year, however,
combined exports were only 1.86 MAF, far less than in any year since 1977, and 0.31 MAF less
than in 1977, the previous drought of record affecting CVP deliveries.
Combined exports have exceeded 6.0 MAF seven times since 1977. Six of those times have been
since 2000, and four were between 2003 and 2006. The highest combined export, 6.52 MAF,
occurred in 2011 (a very wet year). Once between 1976 and 2000 combined exports reached more
than 6.0 MAF (6.10 MAF in 1989, during the fourth year of a six-year drought). For example,
combined exports averaged 4.38 MAF for the 10-year period 1976-1985, and they averaged
roughly 5.05 MAF for the 10 year-period 1980-1989. Average combined exports during both
these periods were less than the average deliveries for the 10-year period 2000-2009 (5.44 MAF),
and they were less than the average deliveries during the last 15 years (5.10 MAF). Thus, even
with numerous restrictions, combined CVP and SWP Delta exports have in recent times averaged
more annually—they exceeded exports during the 1976-1985 and 1980-1989 timeframes—than
in any time prior to enactment of the CVPIA and other more recent regulatory restrictions (e.g. D-
1641 and ESA BiOps). CVP exports, however, have declined in proportion to SWP exports,
resulting in reduced water deliveries to some CVP contractors south of the Delta.81
Some of the differences between recent pumping levels and pre-2000 pumping levels can be
explained by successive wet years from 1995 to 1999 and other wet years in 2006 and 2011
(resulting in more water stored in reservoirs), as well as by significant increases in SWP pumping
(see Table 2) from 2003 through 2006 (reflecting increased demand SOD).82
It is not clear,
however, how much of the difference can be explained without analyzing total supplies available
79 These pumping levels have since been exceeded in 2000 (6.28 MAF), coinciding with filling of Diamond Valley
Lake in Southern California, and in 2003–2006 (ranging from 6.07 MAF to 6.25 MAF), roughly coinciding with
increased pumping under the proposed new OCAP in 2004. 80 Combined pumping during the 2009 and 2010 drought years also was higher than in 1991 and 1992; however, the
former years were classified as dry and below normal years, respectively, whereas the latter were critical dry years. 81 Some attribute the switch from CVP having the higher proportional exports to SWP having the larger share to the
SWP having larger canal capacity and being able to take on more water when more is available to be pumped. 82 Demand for water from growing urban areas in Southern California, which have experienced an increase in
population of 8 million-10 million people since the early 1990s, development of new SWP contractor storage facilities
south of the Delta, and declines in water availability to Southern California from the Colorado River have resulted in
increased pressure on Delta and Northern California supplies and increased SWP exports from the Delta.
California Drought: Hydrological and Regulatory Water Supply Issues
Congressional Research Service 34
for each year, the timing of supplies available for export, and the availability of SOD storage
capacity and canal capacity. Such analysis is beyond the scope of this report.
Regardless of the exact causes behind differences in annual pumping totals, CVP agricultural
water service contractors have received less water than contracted for in most of the last 15 years
(see “SOD-Ag” column in Table 2), even with record high combined exports. This appears to be
due to relatively static CVP pumping levels (relative to increased SWP pumping levels) as
indicated in Figure 10, restrictions affecting Delta exports, and some exported water now going
to CVPIA wildlife refuges. For example, CVP water allocations have been reduced in part
because of obligations under CVPIA to deliver water to SOD wildlife refuges. Other factors may
also limit storage at the San Luis Reservoir (SOD). Thus, although combined exports have on
average increased since the 1980s, CVP water allocations for SOD agricultural water service
contractors have been significantly reduced. In contrast, SWP exports, primarily serving SOD
municipal and industrial contractors, increased in 2000 and 2003-200683
(see Table 2 and Figure
10)—a reversal of prior proportions serving CVP and SWP contractors.
California Water Rights: Acquisitions
and Allocations Another factor affecting water allocations is state water rights. The system of state water rights
has a profound effect on who gets how much water and when, particularly during times of
drought or other restrictions on water supply. California law provides for several limits on the use
of the state’s water, and these limits have a direct effect on how much water state and federal
contractors receive both north and south of the Delta.84
Because the waters of California are
considered to be “the property of the people of the State,” anyone wishing to use those waters
must acquire a right to do so.85
California follows a dual system of water rights, recognizing both
the riparian and prior appropriation doctrines.86
Under the riparian doctrine, a person who owns
land that borders a watercourse has the right to make reasonable use of the water on that land
(riparian rights).87
Riparian rights are reduced proportionally during times of shortage.88
Under
the prior appropriation doctrine, a person who diverts water from a watercourse (regardless of his
location relative thereto) and makes reasonable and beneficial use of the water acquires a right to
that use of the water (appropriated rights).89
Appropriated rights are filled in order of seniority
during times of shortage.90
Before exercising the right to use the water, appropriative users must
83 Some contend that the increased pumping under earlier BiOps in the mid-2000s, combined with poor ocean
conditions, contributed to a sharp decline in returning adult fall run salmon in subsequent years. See, for example, John
McManus, Dick Pool, and Randy Repass, et al., The Impact of the California Drought on Salmon, Golden Gate Salmon
Association, handout from presentation for congressional staff, April 15, 2015, p. 1. 84 For a legal discussion of California’s water laws and system of allocation, see CRS Report RL34554, California
Water Law and Related Legal Authority Affecting the Sacramento-San Joaquin Delta, by Cynthia Brown. 85 Cal. Water Code §102. See National Audubon Society v. Superior Court, 33 Cal. 3d 419, 441 (Cal. 1983). 86 See In re Determination of Rights to Water of Hallett Creek Stream System, 44 Cal. 3d 448, 455 (Cal. 1988);
National Audubon Society v. Superior Court, 33 Cal. 3d 419, 441 (Cal. 1983); People v. Shirokow, 26 Cal. 3d 301, 307
(Cal. 1980). 87 A. Dan Tarlock, Law of Water Rights and Resources, ch. 3 “Common Law of Riparian Rights.” 88 Ibid. 89 See generally, Ibid. at ch. 5, “Prior Appropriation Doctrine.” 90 Ibid.
California Drought: Hydrological and Regulatory Water Supply Issues
Congressional Research Service 35
obtain permission from the state through a permit system run by the State Water Resources
Control Board (SWRCB).
Water Rights and Allocations for Water Delivered via the CVP
Both the CVP and SWP acquired appropriative rights for water use from the state of California,
receiving several permits for water diversions at various points between 1927 and 1967.91
Section
8 of the Reclamation Act of 190292
requires Reclamation to comply with state law, including
requiring the agency to acquire water rights for its projects, such as the CVP.93
If Reclamation
found it necessary to take the water rights of other users, those users would be entitled to just
compensation.94
In some cases, Reclamation found it necessary to enter into settlement or
exchange contracts with water users who had rights predating the CVP and thus were senior users
in time and right. Many of these special contracts were entered into in areas where water users
were diverting water directly from the Sacramento and San Joaquin Rivers. Figure 11 shows the
distribution of areas served under different types of CVP contracts, including senior water rights
contractors known as the Sacramento River Settlement Contractors north of the Delta and the
Exchange Contractors south of the Delta.
91 For a discussion of the projects’ permit process, see Racanelli, 182 Cal. App. 3d at 106. 92 43 U.S.C. §383. 93 The U.S. Supreme Court has held that Section 8 “requires the Secretary to comply with state law in the ‘control,
appropriation, use or distribution of water’” by a federal project. See California v. United States, 438 U.S. 645, 674-75
(1978). This requirement to comply with state law applied so long as the conditions imposed by state law were “not
inconsistent with clear congressional directives respecting the project.” See id. at 670-73; see also Ivanhoe Irrig. Dist.
v. McCracken, 357 U.S. 275 (1958); City of Fresno v. California, 372 U.S. 627 (1963). In the context of the CVP, a
court has held that the permit conditions were consistent with the project purpose of river regulation. Racanelli, 182
Cal. App. 3d at 135. See also United States v. State Water Resources Control Board, 694 F.2d 1171 (9th Cir. 1982). 94 See Int’l Paper Co. v. United States, 282 U.S. 399, 407 (1931); United States v. Gerlach Live Stock Co., 339 U.S.
725, 736-39 (1950).
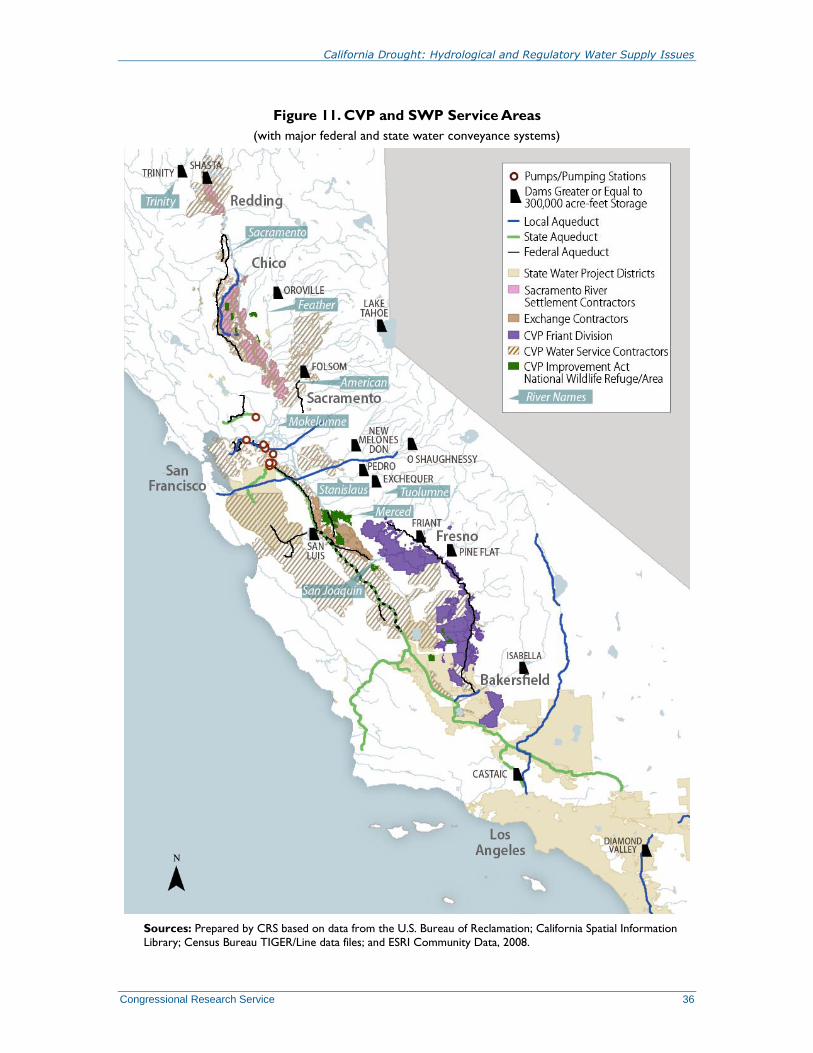
California Drought: Hydrological and Regulatory Water Supply Issues
Congressional Research Service 36
Figure 11. CVP and SWP Service Areas
(with major federal and state water conveyance systems)
Sources: Prepared by CRS based on data from the U.S. Bureau of Reclamation; California Spatial Information
Library; Census Bureau TIGER/Line data files; and ESRI Community Data, 2008.
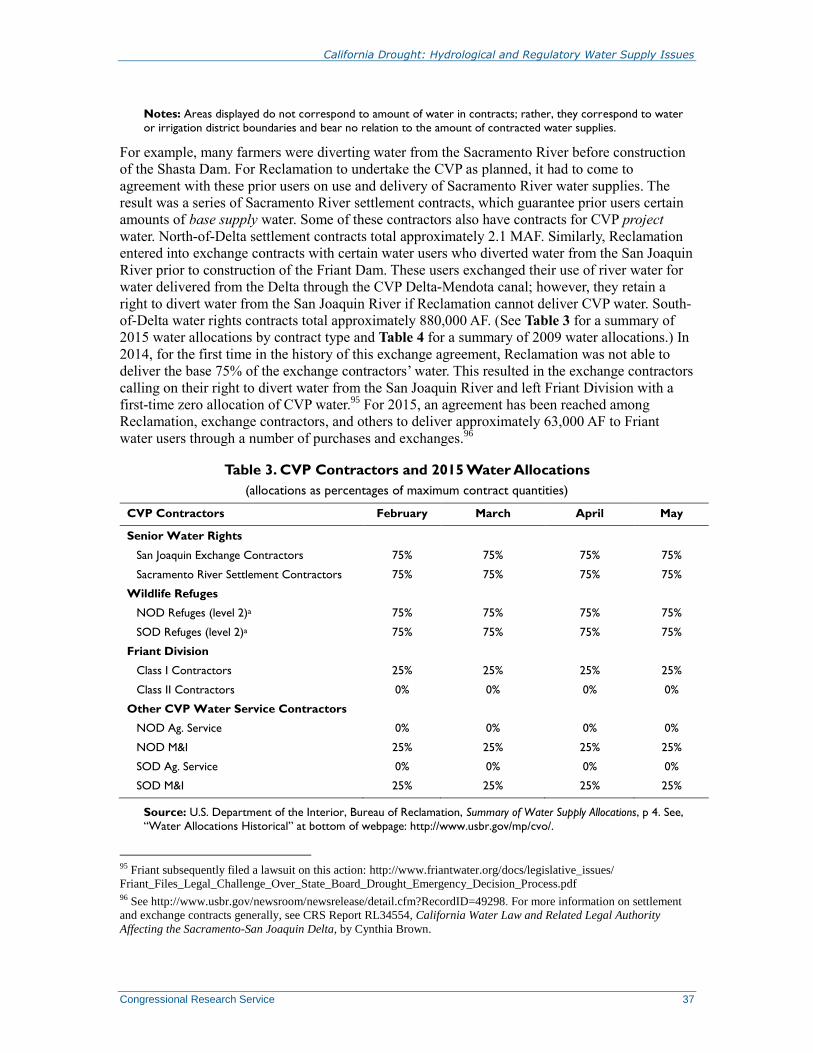
California Drought: Hydrological and Regulatory Water Supply Issues
Congressional Research Service 37
Notes: Areas displayed do not correspond to amount of water in contracts; rather, they correspond to water
or irrigation district boundaries and bear no relation to the amount of contracted water supplies.
For example, many farmers were diverting water from the Sacramento River before construction
of the Shasta Dam. For Reclamation to undertake the CVP as planned, it had to come to
agreement with these prior users on use and delivery of Sacramento River water supplies. The
result was a series of Sacramento River settlement contracts, which guarantee prior users certain
amounts of base supply water. Some of these contractors also have contracts for CVP project
water. North-of-Delta settlement contracts total approximately 2.1 MAF. Similarly, Reclamation
entered into exchange contracts with certain water users who diverted water from the San Joaquin
River prior to construction of the Friant Dam. These users exchanged their use of river water for
water delivered from the Delta through the CVP Delta-Mendota canal; however, they retain a
right to divert water from the San Joaquin River if Reclamation cannot deliver CVP water. South-
of-Delta water rights contracts total approximately 880,000 AF. (See Table 3 for a summary of
2015 water allocations by contract type and Table 4 for a summary of 2009 water allocations.) In
2014, for the first time in the history of this exchange agreement, Reclamation was not able to
deliver the base 75% of the exchange contractors’ water. This resulted in the exchange contractors
calling on their right to divert water from the San Joaquin River and left Friant Division with a
first-time zero allocation of CVP water.95
For 2015, an agreement has been reached among
Reclamation, exchange contractors, and others to deliver approximately 63,000 AF to Friant
water users through a number of purchases and exchanges.96
Table 3. CVP Contractors and 2015 Water Allocations
(allocations as percentages of maximum contract quantities)
CVP Contractors February March April May
Senior Water Rights
San Joaquin Exchange Contractors 75% 75% 75% 75%
Sacramento River Settlement Contractors 75% 75% 75% 75%
Wildlife Refuges
NOD Refuges (level 2)a 75% 75% 75% 75%
SOD Refuges (level 2)a 75% 75% 75% 75%
Friant Division
Class I Contractors 25% 25% 25% 25%
Class II Contractors 0% 0% 0% 0%
Other CVP Water Service Contractors
NOD Ag. Service 0% 0% 0% 0%
NOD M&I 25% 25% 25% 25%
SOD Ag. Service 0% 0% 0% 0%
SOD M&I 25% 25% 25% 25%
Source: U.S. Department of the Interior, Bureau of Reclamation, Summary of Water Supply Allocations, p 4. See,
“Water Allocations Historical” at bottom of webpage: http://www.usbr.gov/mp/cvo/.
95 Friant subsequently filed a lawsuit on this action: http://www.friantwater.org/docs/legislative_issues/
Friant_Files_Legal_Challenge_Over_State_Board_Drought_Emergency_Decision_Process.pdf 96 See http://www.usbr.gov/newsroom/newsrelease/detail.cfm?RecordID=49298. For more information on settlement
and exchange contracts generally, see CRS Report RL34554, California Water Law and Related Legal Authority
Affecting the Sacramento-San Joaquin Delta, by Cynthia Brown.
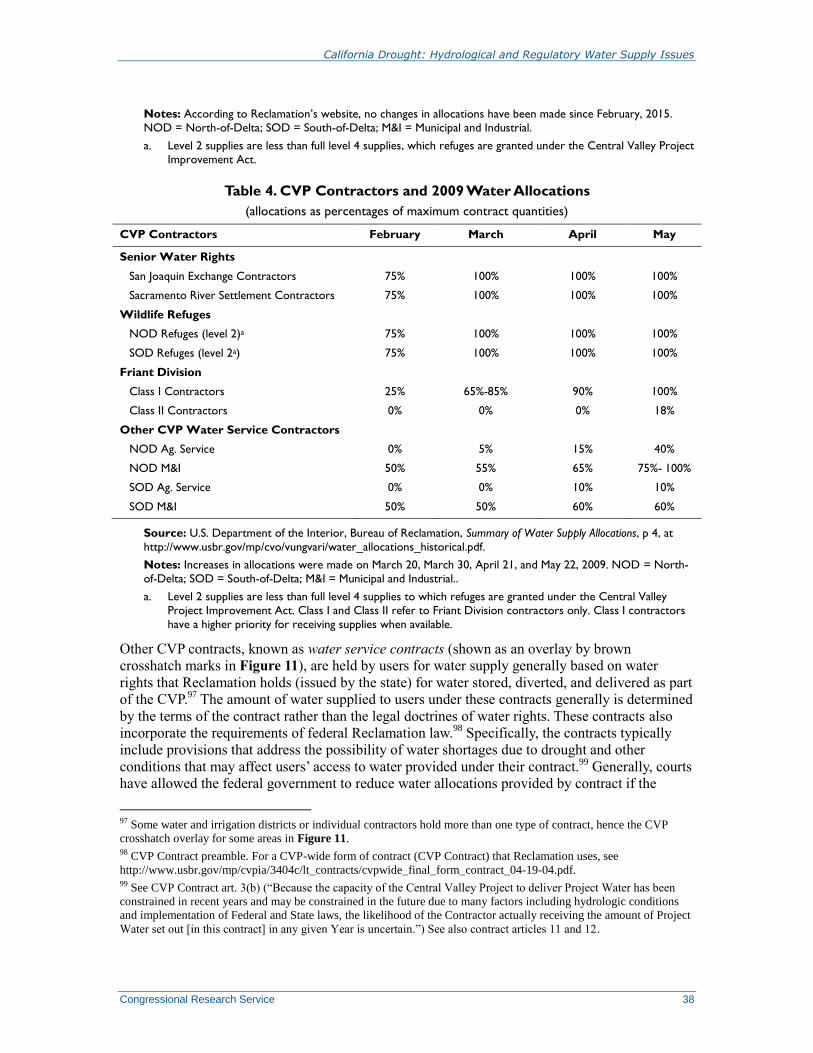
California Drought: Hydrological and Regulatory Water Supply Issues
Congressional Research Service 38
Notes: According to Reclamation’s website, no changes in allocations have been made since February, 2015.
NOD = North-of-Delta; SOD = South-of-Delta; M&I = Municipal and Industrial.
a. Level 2 supplies are less than full level 4 supplies, which refuges are granted under the Central Valley Project
Improvement Act.
Table 4. CVP Contractors and 2009 Water Allocations
(allocations as percentages of maximum contract quantities)
CVP Contractors February March April May
Senior Water Rights
San Joaquin Exchange Contractors 75% 100% 100% 100%
Sacramento River Settlement Contractors 75% 100% 100% 100%
Wildlife Refuges
NOD Refuges (level 2)a 75% 100% 100% 100%
SOD Refuges (level 2a) 75% 100% 100% 100%
Friant Division
Class I Contractors 25% 65%-85% 90% 100%
Class II Contractors 0% 0% 0% 18%
Other CVP Water Service Contractors
NOD Ag. Service 0% 5% 15% 40%
NOD M&I 50% 55% 65% 75%- 100%
SOD Ag. Service 0% 0% 10% 10%
SOD M&I 50% 50% 60% 60%
Source: U.S. Department of the Interior, Bureau of Reclamation, Summary of Water Supply Allocations, p 4, at
http://www.usbr.gov/mp/cvo/vungvari/water_allocations_historical.pdf.
Notes: Increases in allocations were made on March 20, March 30, April 21, and May 22, 2009. NOD = North-
of-Delta; SOD = South-of-Delta; M&I = Municipal and Industrial..
a. Level 2 supplies are less than full level 4 supplies to which refuges are granted under the Central Valley
Project Improvement Act. Class I and Class II refer to Friant Division contractors only. Class I contractors
have a higher priority for receiving supplies when available.
Other CVP contracts, known as water service contracts (shown as an overlay by brown
crosshatch marks in Figure 11), are held by users for water supply generally based on water
rights that Reclamation holds (issued by the state) for water stored, diverted, and delivered as part
of the CVP.97
The amount of water supplied to users under these contracts generally is determined
by the terms of the contract rather than the legal doctrines of water rights. These contracts also
incorporate the requirements of federal Reclamation law.98
Specifically, the contracts typically
include provisions that address the possibility of water shortages due to drought and other
conditions that may affect users’ access to water provided under their contract.99
Generally, courts
have allowed the federal government to reduce water allocations provided by contract if the
97 Some water and irrigation districts or individual contractors hold more than one type of contract, hence the CVP
crosshatch overlay for some areas in Figure 11. 98 CVP Contract preamble. For a CVP-wide form of contract (CVP Contract) that Reclamation uses, see
http://www.usbr.gov/mp/cvpia/3404c/lt_contracts/cvpwide_final_form_contract_04-19-04.pdf. 99 See CVP Contract art. 3(b) (“Because the capacity of the Central Valley Project to deliver Project Water has been
constrained in recent years and may be constrained in the future due to many factors including hydrologic conditions
and implementation of Federal and State laws, the likelihood of the Contractor actually receiving the amount of Project
Water set out [in this contract] in any given Year is uncertain.”) See also contract articles 11 and 12.
California Drought: Hydrological and Regulatory Water Supply Issues
Congressional Research Service 39
reduction is made necessary by federal law, but the extent of liability depends on the terms of the
specific contract used in each case.100
Senior water rights holders (i.e., settlement contractors, shown in pink, and exchange contractors,
shown in brown, in Figure 11) have a combined first priority to approximately 3.0 MAF of CVP
water. This water rights priority, together with drought and regulatory restrictions, means that
water service contractors with contracts based on CVP water rights that are junior to settlement
and exchange contractors may face significant cuts during times of water supply shortages
(particularly SOD water service contractors). For example, in dry years (indicated by certain
water levels at Shasta Lake by a certain time early in the water year), senior water rights
contractors are allocated 75% of their contract amounts, whereas CVP water service contractors
might be allocated as little as 0% of their contracted supplies. For 2015, senior water rights
contractors have been allocated 75% of their contract supplies, while M&I water service
contractors have been allocated 25%, and agricultural water service contractors north and south of
the Delta have been allocated 0% of their contracted water. 101
(See Table 3.) When water is
scarce due to hydrologic conditions, regulatory restrictions, or both, water supply reductions are
primarily a function of state water rights, legal settlements, and agreements with landowners who
were senior water rights holders. Without these agreements, construction of the CVP and
irrigation of new areas south of the Delta likely would not have been possible.
Issues for Congress As California endures its fourth year of drought, Congress faces a number of issues that confront
California in the short term. One such issue is how to respond to immediate demands for water
deliveries during the drought, given other policy concerns, such as avoiding harm to several fish
species. Other issues include how to address water supply availability in general and how to
finance any improvement or increase in water supply storage given current fiscal constraints and
congressional policies discouraging site-specific project authorizations and appropriations.
Longer-term issues for Congress include how to improve federal water delivery reliability for an
array of users and how to stabilize aquatic ecosystems to improve resilience to inevitable future
droughts. Water and power users that are part of diverse economies depend on reliable water
supplies and healthy aquatic ecosystems. California agriculture is important not only to the state
but also to the nation. At the same time, protecting, conserving, and improving habitat for
federally listed species is required under federal and state endangered species laws. Another long-
term issue is what role the federal government should play in providing or improving water
supplies nationwide.
100 See Stockton E. Water Dist. v. United States, 76 Fed. Cl. 321, 358-59 (Fed. Cl. 2007) (Bureau not liable where
reductions “occurred due to implementation of amendments to federal Reclamation law”); O’Neill v. United States, 50
F.3d 677, 682-83 (9th Cir. 1995) (contract provision relieving government of liability “for any damage ... arising from a
shortage on account of errors in operation, drought, or any other causes” included protection for shortages caused by
“the effects of subsequent Congressional mandates”). But see Tulare Lake Basin Water Storage Dist. v. United States,
49 Fed. Cl. 313 (Fed. Cl. 2001) (federal government liable when federal legislation forced reductions under state
contract to which the federal government was not a party). Six years later, the same judge that wrote the Tulare
decision repudiated the physical taking characterization, citing intervening case law and noting the absence of a
physical diversion. See Casitas Municipal Water Dist. v. United States, 76 Fed. Cl. 100 (Fed. Cl. 2007). On appeal, the
U.S. Court of Appeals for the Federal Circuit reversed the district court’s holding in Casitas, noting that the intervening
caselaw did not bear on the case. Casitas Municipal Water Dist. v. United States, 543 F.3d 1276 (Fed. Cir. 2008). 101 Historical CVP water allocations can be viewed at http://www.usbr.gov/mp/cvo/vungvari/
water_allocations_historical.pdf.
California Drought: Hydrological and Regulatory Water Supply Issues
Congressional Research Service 40
Legislation addressing the management of the CVP and SWP can generate controversy because
of the enormous complexity of the water delivery system in California. The coordinated operation
and management of the CVP and SWP involves a web of federal and state law, encompassing
state water rights priorities; water delivery contracts; federal, state, and local agency regulations
and policies; multiagency agreements and other factors, as noted above. Achieving consensus on
such legislation often is difficult because if legislation leads to a change in any of these factors, it
can affect multiple parties and interests by potentially altering the timing or amount of water
made available to such parties or to the underlying ecosystem. For example, if legislation directs
that the volume of water pumped from the Delta is to be increased beyond the status quo, a
number of questions arise: Where will the additional water come from? What effect might the
increased pumping have on other water users or species? How will the increased pumping affect
in-Delta water quality?
Similarly, legislation that prohibits involuntary reductions in water supply to those who receive
water from the CVP and SWP could affect other water users, reducing their water supplies or
changing the timing of water availability. Such legislative directions might conflict with the
declaration that the CVP must be operated in conformity with state water law. There is a question
about whether it would be possible to pump at the levels specified in certain bills without having
redirected impacts on other water users. If it is possible, the question becomes how such impacts
might be avoided. If these impacts cannot be avoided, the question then becomes who might bear
responsibility or pay for unavoidable costs.
These were some of the issues raised by legislation in the 113th Congress that specifically
addressed short- and long-term CVP and SWP water management. Three bills—H.R. 3964, H.R.
5781, and S. 2198—passed their respective chambers, but a compromise among the different
proposals was not reached before the end of the 113th Congress.
102 Legislation with similar
aims—to maximize water supplies—has been introduced in the 114th Congress (e.g., H.R. 2898,
which passed the House on July 16, 2015, and S. 1894, introduced July 30, 2015). Both bills also
include several titles that go beyond CVP and SWP water management. Other bills introduced in
the 114th Congress that address California drought and water management include several that
would authorize conservation and water recycling initiatives, among other activities (e.g., H.R.
291 and S. 176; H.R. 2983 and S. 1837; and H.R. 3045). For more information on legislation, see
CRS In Focus IF10019, H.R. 5781: Legislation Proposed to Maximize Water Supplies to Address
Drought in California; CRS Report R43820, Analysis of H.R. 5781, California Emergency
Drought Relief Act of 2014; and CRS Insight IN10308, Drought Legislation: H.R. 2898.
102 H.R. 3964, the Sacramento-San Joaquin Valley Emergency Water Delivery Act, aimed to reduce the negative
effects of environmental and other laws on CVP water deliveries. Critics contend, however, that although the bill may
have improved the water supply situation for some, it could have contributed to continued decline of threatened and
endangered fish species. Likewise, S. 2198, the Emergency Drought Relief Act of 2014, aimed to direct the Bureau of
Reclamation to “maximize water supplies” while also protecting species. Some believe that S. 2198 did not go far
enough to ensure reliable water supplies, while others feared it could effectively negate protections for threatened and
endangered species, depending on how the law would have been implemented. H.R. 5781 addressed similar issues but
would have affected CVP operations only during drought. (For information on H.R. 3964 and S. 2198, see CRS Report
R43649, Federal Response to Drought in California: An Analysis of S. 2198 and H.R. 3964, by Pervaze A. Sheikh,
Betsy A. Cody, and Charles V. Stern; CRS Report R43594, Analysis of Senate-Passed S. 2198: Emergency Drought
Relief Act of 2014, by Betsy A. Cody and Pervaze A. Sheikh; and CRS Report R43648, H.R. 3964: Analysis of Key
Provisions, by Charles V. Stern, Betsy A. Cody, and Pervaze A. Sheikh. For information on H.R. 5781, see CRS In
Focus IF10019, H.R. 5781: Legislation Proposed to Maximize Water Supplies to Address Drought in California, by
Betsy A. Cody, Pervaze A. Sheikh, and Charles V. Stern; CRS Report R43820, Analysis of H.R. 5781, California
Emergency Drought Relief Act of 2014, by Betsy A. Cody, Pervaze A. Sheikh, and Charles V. Stern.
California Drought: Hydrological and Regulatory Water Supply Issues
Congressional Research Service 41
Outlook California is in its fourth year of drought, with many areas of the state experiencing extreme to
exceptional drought conditions. The current drought has created a fundamental water supply
shortage. In addition to hydrological limitations on water supplies, several federal and state
statutes, regulations, and policies have reduced reservoir storage and water deliveries from the
federal CVP and California’s SWP. The extended drought conditions have exacerbated
controversy over water delivery restrictions from state and federal projects. Some argue that the
restrictions would not be so severe had water in wet years been allowed to be pumped or held in
storage for later use. Regulatory or court-imposed restrictions related to species and water quality,
as well as the long-established state water rights system, have intensified effects of the drought
for agricultural and urban water users. For example, even in the wettest years, some CVP
contractors have had their water deliveries cut due to environmental factors. These effects are not
always perceived as equitable or fair to those with CVP contracts based on CVP project water
rights junior in priority to senior water rights holders or to those who otherwise have lower
priority for receiving SWP and CVP water.
The effects on water deliveries resulting directly from federal ESA requirements have become a
flash point of sorts over CVP water management. For the 2014 water year, ESA compliance was
estimated to have been approximately 2% of total water delivery reductions for 2014. The
remaining water reductions presumably are due to drought and other factors, such as state water
quality control requirements. However, reductions due to compliance with the federal ESA in
other years have constituted a higher percentage of total water delivery reductions. For example,
reductions due to ESA restrictions in 2009 ranged roughly from 20% to 25% of total water
delivery reductions, depending on the time period used for estimating annual deliveries, and were
as high as 39% for 2013. It is clear that various regulatory restrictions have contributed to
reduced exports of water to water users south of the Delta; however, year over year, there appears
to be wide variation in reductions due solely to regulatory compliance versus other factors––both
in percentage and nominal terms.
In sum, although the reasonable and prudent alternatives (RPAs) for threatened and endangered
species protection under ESA affect Delta exports, other requirements also restrict exports and
contribute to RPA actions. Together, these elements provide a network of protection for species
and water quality for in-Delta uses such as farming and drinking water, and one element is not
easily separated from others. Thus, even if the ESA were waived or overridden, federal and state
agencies still would be required to comply with several state and federal laws and directives that,
in combination, limit Delta exports (e.g., the federal CWA and CVPIA, the state Porter-Cologne
Act and its implementing directive D-1641, the California Endangered Species Act, and the
California Fish and Game Code). Crafting congressional solutions to the water supply restrictions
thus becomes difficult and involves many interested parties and stakeholders with various
interests, as well as interactions with state law and policies.
California Drought: Hydrological and Regulatory Water Supply Issues
Congressional Research Service 42
Author Contact Information
Betsy A. Cody
Specialist in Natural Resources Policy
[email protected], 7-7229
Cynthia Brown
Legislative Attorney
[email protected], 7-9121
Peter Folger
Specialist in Energy and Natural Resources Policy
[email protected], 7-1517
Acknowledgments
Pervaze Sheikh and Charles Stern assisted in production of this report.


![DROUGHT MONITOR [IHP-VIII] - UNESDOC Databaseunesdoc.unesco.org/images/0023/002319/231937e.pdf · DROUGHT MONITOR [IHP-VIII] International Hydrological Programme. THE CONTEXT Drought](https://img.pdfslide.net/doc/110x75/5b99333609d3f26e678b70e8/drought-monitor-ihp-viii-unesdoc-drought-monitor-ihp-viii-international.jpg)