Embed Size (px)
Citation preview
California Dry Cleaning Industry Technical Assessment Report
Stationary Source Division Emissions Assessment Branch
Release Date: February 2006
State of California AIR RESOURCES BOARD
California Dry Cleaning Industry Technical Assessment Report
Prepared by:
Mei Fong (Lead) Hafizur R. Chowdhury
Michele Houghton Michelle Komlenic Sonia Villalobos
Reviewed by:
Richard A. Boyd II, Manager, Emissions Evaluation Section Daniel E. Donohoue, Chief, Emissions Assessment Branch
Robert D. Barham, Ph.D., Assistant Chief, Stationary Source Division Robert D. Fletcher, Chief, Stationary Source Division
February 2006
ACKNOWLEDGMENTS
We wish to acknowledge the participation and assistance of the following local air districts. Bay Area Air Quality Management District Mojave Desert Air Quality Management District Santa Barbara County Air Pollution Control District South Coast Air Quality Management District
The ARB would like to acknowledge the assistance of the following individuals, agencies, and organizations for their participation and assistance: Monitoring and Laboratory Division, ARB Micheal Orbanosky Monitoring and Laboratory Division, ARB Angus Macpherson Office of Environmental Health Hazard Assessment Dr. James Collins Department of Health Services Dr. Julia Quint Sanitation District of Los Angeles County Ann Heil Institute for Research and Technical Assistance Dr. Katy Wolf California Cleaners Association Sandra Giarde Blackburn’s Consulting & Training Bob Blackburn Halogenated Solvents Industry Alliance Stephen P. Risotto Urban & Environmental Policy Institute Peter Sinsheimer GreenEarth® Cleaning James E. Douglas ExxonMobil Chemical Arlean Medeiros Kelleher Equipment Supply, Inc. Kelly Kelleher Casares
TABLE OF CONTENTS Section Page I. INTRODUCTION......................................................................................I-1
A. Background ...................................................................................I-1 B. Industry Characteristics .................................................................I-1
II. DRY CLEANING TECHNOLOGIES .......................................................II-1
A. Perchloroethylene Cleaning .........................................................II-1 B. Hydrocarbon Solvent Cleaning.....................................................II-1
1. DF-2000 Fluid.....................................................................II-2 2. Pure Dry®..............................................................................II-2 3. Eco Solv®..............................................................................II-2
4. Shell Sol 140 HT...................................................................II-3 5. Stoddard Solvent ..................................................................II-3
C. Volatile Methyl Siloxane Cleaning ................................................II-3 D. Rynex (Propylene Glycol Ether) Cleaning ..................................II-3 E. Carbon Dioxide (CO2) Cleaning....................................................II-4 F. Professional Wet Cleaning ...........................................................II-4 G. Green Jet® ....................................................................................II-5 H. Emerging Technologies................................................................II-5
1. Cold Water Cleaning Systems..............................................II-5 2. Resolv Dry Cleaning System..............................................II-6
3. Impress Solvent..................................................................II-6 4. Hydroclene Fluids.................................................................II-6
I. Flammability and Safety ...............................................................II-6
III. EMISSION CONTROL AND VENTILATION TECHNOLOGIES............III-1 A. Emission Control Technologies ...................................................III-1 1. Primary Controls..................................................................III-1 2. Secondary Controls .............................................................III-2
3. Other Control Technologies.................................................III-2 B. Ventilation Technologies .............................................................III-2 1. Natural Ventilation ...............................................................III-3 2. Window Fans.......................................................................III-3
3. General Ventilation ..............................................................III-3 4. Local Ventilation ..................................................................III-3 5. Partial Vapor Rooms ...........................................................III-3 6. Vapor Barrier Rooms ..........................................................III-4
TABLE OF CONTENTS (continued) Section Page
IV. CURRENT DRY CLEANING STATUS ................................................. IV-1
A. Dry Cleaning Facility Survey Results.......................................... IV-1 1. Facility Survey Response and Analysis.............................. IV-1 2. Business Information .......................................................... IV-2
3. Operating Information......................................................... IV-3 4. Machine Information and Operating Schedule ................... IV-5 5. Facility Size ........................................................................ IV-8 6. Receptor Distance ............................................................. IV-9 7. Ventilation Type................................................................ IV-10 8. Maintenance Information .................................................. IV-11 9. Future Machine Purchase ............................................... IV-12
B. Site Visit Results....................................................................... IV-13 C. Machine Manufacturers Survey Results ................................... IV-16 D. Dry Cleaning Solvent Manufacturers Survey............................ IV-17 E. Perc Solvent Distributors Survey Results ................................. IV-18 F. Perc and DF-2000 Sludge Test Results ................................... IV-18 G. Leak Detector Evaluation ......................................................... IV-19 H. Emissions from Dry Cleaning Operations................................. IV-21
V. POTENTIAL HEALTH IMPACTS .......................................................... V-1
A. Perchloroethylene........................................................................ V-1 1. Pollutant-specific Health Values .......................................... V-1
B. Perc Alternatives ......................................................................... V-3 1. Hydrocarbon Solvent Cleaning (DF-2000, PureDry, EcoSolv, Shell 140, Stoddard)............................................. V-3
2. Volatile Methyl Siloxane Cleaning ....................................... V-4 3. Rynex (Propylene Glycol Ether) ........................................ V-5 4. Carbon Dioxide Cleaning..................................................... V-5 5. Professional Wet Cleaning .................................................. V-6 6. Green Jet® .......................................................................... V-7 7. 1-Propyl Bromide................................................................. V-8
C. Interim Health Values .................................................................. V-8
VI. ENVIRONMENTAL IMPACTS .............................................................. VI-1
A. Wastewater ................................................................................ VI-1 B. Groundwater Contamination....................................................... VI-2 C. Hazardous Waste....................................................................... VI-3 D. Soil ............................................................................................. VI-4
TABLE OF CONTENTS (continued) Section Page
E. Flammability ............................................................................... VI-4 F. Energy Usage............................................................................. VI-5 G. Air Pollution ................................................................................ VI-6
1. Impacts on VOC Emissions and Global Warming .............. VI-6 2. Workplace Exposure .......................................................... VI-6
VII. COST ESTIMATION ............................................................................ VII-1
A. Machine Cost ............................................................................ VII-1 B. Operating Cost .......................................................................... VII-3 C. Leak Detector Cost .................................................................... VII-7 D. Control Technology ................................................................... VII-7
VIII. EFFICACY EVALUATION .................................................................. VIII-1
A. Hydrocarbon Solvent Cleaning................................................. VIII-1 B. Rynex ..................................................................................... VIII-2 C. Water-based Cleaning Systems ............................................... VIII-2 D. Carbon Dioxide Cleaning.......................................................... VIII-2 E. GreenEarth ............................................................................. VIII-3
IX. REFERENCES...................................................................................... IX-1 APPENDICES Appendix A: Dry Cleaning Facility Survey Appendix B: Dry Cleaning Site Visit Survey Appendix C: Machine Manufacturer’s Survey Appendix D: Standard Operating Procedure for the Determination of
Tetrachloroethylene in Dry Cleaning Sludge by Gas Chromatography - FID
Appendix E: Standard Operating Procedure for the Determination of DF-2000™ in Dry Cleaning Sludge by Gas Chromatography – Mass Selective Detector Appendix F: Sludge Sampling Results
TABLE OF CONTENTS (continued) APPENDICES (continued) Appendix G: OEHHA Memorandum Appendix H: Laboratory Evaluation of Leak Detectors Appendix I: Contact Information for Alternative Solvents Appendix J: Electricity Cost Calculations Appendix K: Summary of Comments Appendix L: Glossary and Acronyms

LIST OF TABLES Table Title Page Table I-1 Statewide Estimates of Perc Dry Cleaning Operations .....................I-2 Table I-2 Statewide Estimates-California Dry Cleaning Industry ......................I-3 Table IV-1 Business Information...................................................................... IV-2 Table IV-2 Summary of Business Hours .......................................................... IV-3 Table IV-3 Comparison of Business Type........................................................ IV-3 Table IV-4 Summary of Operating Information................................................. IV-4 Table IV-5 Machine Information....................................................................... IV-6 Table IV-6 Days of Machine Operation ............................................................ IV-8 Table IV-7 Summary of Receptor Distances.................................................. IV-10 Table IV-8 Ventilation Information.................................................................. IV-11 Table IV-9 Summary of Maintenance Information.......................................... IV-12 Table IV-10 Summary of Future Machine Purchase ........................................ IV-13 Table IV-11 Comparison of Amount of Co-location and Facility Size............... IV-14 Table IV-12 Comparison of Distance to Receptors .......................................... IV-14 Table IV-13 Comparison of Facility Ventilation ................................................ IV-16 Table IV-14 Summary of Perc Usage .............................................................. IV-18 Table IV-15 Summary of Perc and DF-2000 Sludge Tests .............................. IV-19 Table IV-16 Summary of Leak Detector Evaluation ......................................... IV-21 Table IV-17 Facility Survey Summary for Emission Analysis ........................... IV-23 Table IV-18 Emissions Comparison................................................................. IV-25 Table V-1 Adopted Health Values for Perc ...................................................... V-2 Table V-2 Summary of Interim Health Values.................................................. V-8 Table VI-1 Summary of Flash Points and Classification for Commonly Used Solvents ................................................................................ VI-5 Table VI-2 Estimated Monthly Electricity Usage ............................................. VI-6 Table VI-3 Potential Health Impacts and Permissible Exposure Limit (PEL) ... VI-7 Table VII-1 Summary of Machine Cost from Survey ........................................ VII-1 Table VII-2 Machine Cost Comparison for a Typical Dry Cleaning Facility ...... VII-3 Table VII-3 Dry Cleaning Solvent Costs .......................................................... VII-4 Table VII-4 Average Machine Gas and Electricity Usage for Each Dry Cleaning Process.................................................................... VII-5 Table VII-5 Annual Cost Comparison for the First Five Years of a Typical Size Dry Cleaning Facility.............................................................. VII-6 Table VII-6 Comparison of Cost for Perc Concentration Detectors.................. VII-7 Table VIII-1 Summary of KB and Surface Tension Values and Cleaning
Performance of Dry Cleaning Solvents......................................... VIII-4
LIST OF FIGURES Figure Title Page Figure IV-1 Machine Age .................................................................................. IV-6 Figure IV-2 Machine Capacity........................................................................... IV-7 Figure IV-3 Time of Machine Operation ............................................................ IV-8 Figure IV-4 Distribution of Facility Area............................................................. IV-9 Figure IV-5 Distribution of Facility Height .......................................................... IV-9 Figure IV-6 Map of Facility Site Visit Locations ............................................... IV-15
I-1
I. INTRODUCTION A. Background
An assessment of dry cleaning technologies was performed as part of the technical evaluation of the Airborne Toxic Control Measure for Emissions of Perchloroethylene from Dry Cleaning Operations (Dry Cleaning ATCM). The purpose of the assessment was to compare perchloroethylene (Perc) dry cleaning to the available alternatives and determine whether the Dry Cleaning ATCM, which was originally adopted in 1993, continues to be adequately protective of public health. The last technology assessment was conducted from 1991 to 1993 as part of the Air Resources Board’s development of the Dry Cleaning ATCM. This report details the dry cleaning technology assessment and compares some of the results to the earlier assessment.
Information regarding the California dry cleaning industry was obtained from several surveys of the dry cleaning industry. This includes the types of machines being used, the types of machines that are available, and the amount of Perc being sold. The Dry Cleaning Facility Survey was developed by the California Air Resources Board (ARB), in cooperation with the California Cleaners Association, the Korean Dry Cleaners-Laundry Association, other industry representatives, and the local air districts. The purpose of the survey was to collect information from the dry cleaning facilities. The Machine Manufacturers Survey was used to collect information about cost and other machine information. The Perc Solvent Distributor’s Survey was used to collect information on the percentage of Perc that is used by the dry cleaning industry and to confirm Perc usage obtained from the dry cleaning facilities survey. Additionally, the Dry Cleaning Solvent Manufacturers Survey was used to obtain formulation information which was shared with the Office of Environmental Health Hazard Assessment (OEHHA). OEHHA used this information to provide input to the ARB regarding the health effects and toxicity of the solvents that are discussed in this report.
ARB staff conducted site visits of dry cleaning facilities and conducted emissions testing to enhance our understanding of the California dry cleaning industry and the dry cleaning process. Staff visited over 100 facilities around the state collecting relevant information (e.g. distance to receptors, ventilation practices, and solvent usage). Our testing included collecting and testing sludge from Perc and DF-2000™ Fluid (DF-2000) dry cleaning facilities, evaluating the effectiveness of Perc detectors, and measuring Perc concentrations around Perc dry cleaning machines and other locations in the facilities. B. Industry Characteristics
California dry cleaners are typically small businesses employing less than five employees, with over half of them employing two or less full time employees. They are usually independently owned and are often operated by the owner and/or their spouse. Over 50 percent of a facility’s income is from the dry cleaning of garments. Other
I-2
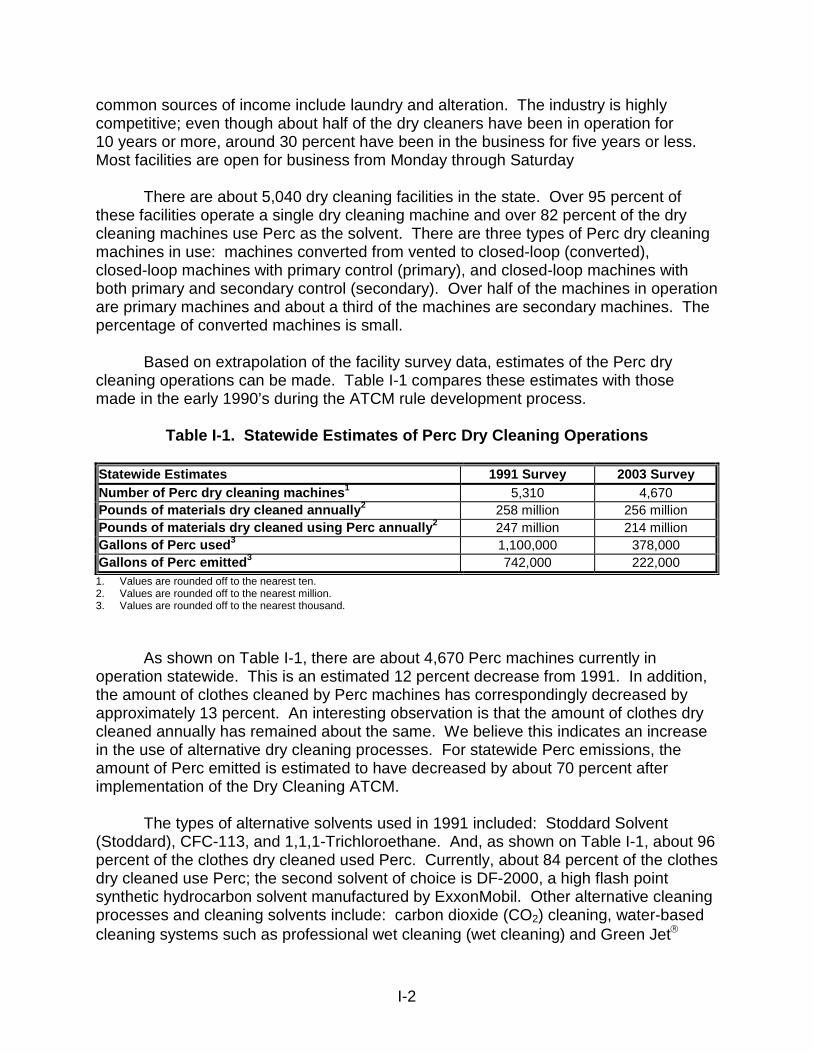
common sources of income include laundry and alteration. The industry is highly competitive; even though about half of the dry cleaners have been in operation for 10 years or more, around 30 percent have been in the business for five years or less. Most facilities are open for business from Monday through Saturday
There are about 5,040 dry cleaning facilities in the state. Over 95 percent of these facilities operate a single dry cleaning machine and over 82 percent of the dry cleaning machines use Perc as the solvent. There are three types of Perc dry cleaning machines in use: machines converted from vented to closed-loop (converted), closed-loop machines with primary control (primary), and closed-loop machines with both primary and secondary control (secondary). Over half of the machines in operation are primary machines and about a third of the machines are secondary machines. The percentage of converted machines is small.
Based on extrapolation of the facility survey data, estimates of the Perc dry cleaning operations can be made. Table I-1 compares these estimates with those made in the early 1990’s during the ATCM rule development process.
Table I-1. Statewide Estimates of Perc Dry Cleaning Operations Statewide Estimates 1991 Survey 2003 Survey Number of Perc dry cleaning machines1 5,310 4,670 Pounds of materials dry cleaned annually2 258 million 256 million Pounds of materials dry cleaned using Perc annually2 247 million 214 million Gallons of Perc used3 1,100,000 378,000 Gallons of Perc emitted3 742,000 222,000 1. Values are rounded off to the nearest ten. 2. Values are rounded off to the nearest million. 3. Values are rounded off to the nearest thousand.
As shown on Table I-1, there are about 4,670 Perc machines currently in
operation statewide. This is an estimated 12 percent decrease from 1991. In addition, the amount of clothes cleaned by Perc machines has correspondingly decreased by approximately 13 percent. An interesting observation is that the amount of clothes dry cleaned annually has remained about the same. We believe this indicates an increase in the use of alternative dry cleaning processes. For statewide Perc emissions, the amount of Perc emitted is estimated to have decreased by about 70 percent after implementation of the Dry Cleaning ATCM. The types of alternative solvents used in 1991 included: Stoddard Solvent (Stoddard), CFC-113, and 1,1,1-Trichloroethane. And, as shown on Table I-1, about 96 percent of the clothes dry cleaned used Perc. Currently, about 84 percent of the clothes dry cleaned use Perc; the second solvent of choice is DF-2000, a high flash point synthetic hydrocarbon solvent manufactured by ExxonMobil. Other alternative cleaning processes and cleaning solvents include: carbon dioxide (CO2) cleaning, water-based cleaning systems such as professional wet cleaning (wet cleaning) and Green Jet
I-3
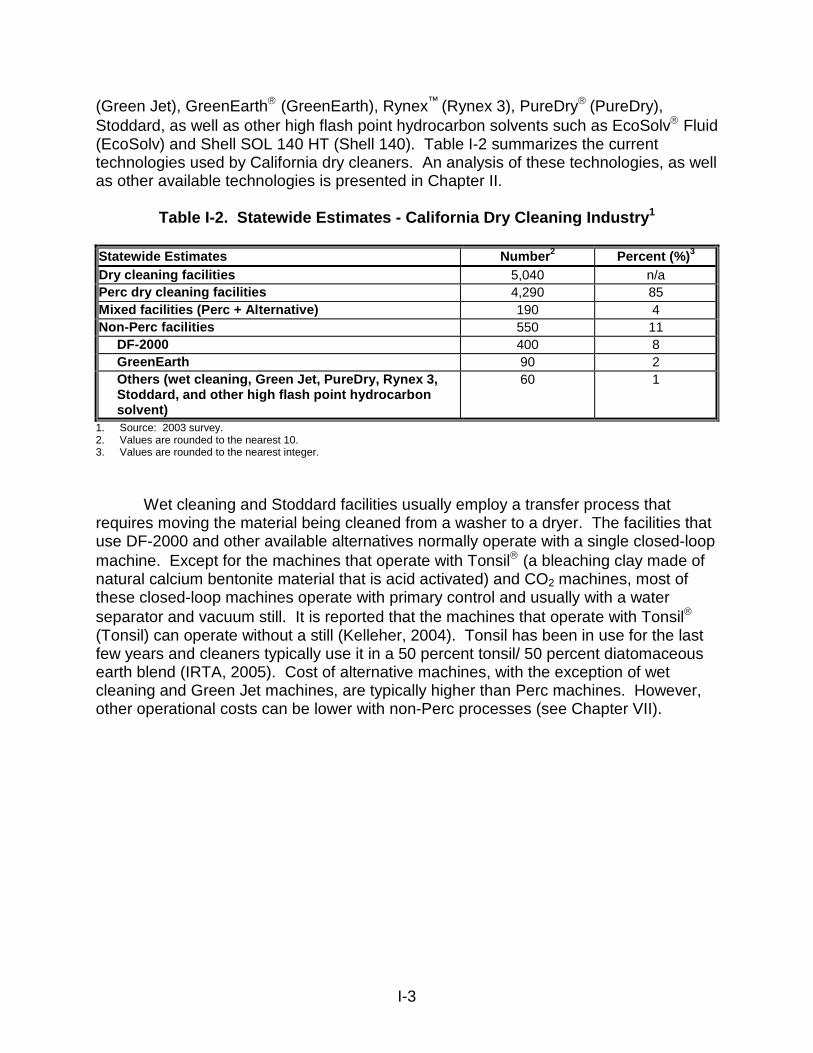
(Green Jet), GreenEarth (GreenEarth), Rynex™ (Rynex 3), PureDry (PureDry), Stoddard, as well as other high flash point hydrocarbon solvents such as EcoSolv Fluid (EcoSolv) and Shell SOL 140 HT (Shell 140). Table I-2 summarizes the current technologies used by California dry cleaners. An analysis of these technologies, as well as other available technologies is presented in Chapter II.
Table I-2. Statewide Estimates - California Dry Cleaning Industry1 Statewide Estimates Number2 Percent (%)3 Dry cleaning facilities 5,040 n/a Perc dry cleaning facilities 4,290 85 Mixed facilities (Perc + Alternative) 190 4 Non-Perc facilities 550 11 DF-2000 400 8 GreenEarth 90 2 Others (wet cleaning, Green Jet, PureDry, Rynex 3, Stoddard, and other high flash point hydrocarbon solvent)
60 1
1. Source: 2003 survey. 2. Values are rounded to the nearest 10. 3. Values are rounded to the nearest integer.
Wet cleaning and Stoddard facilities usually employ a transfer process that requires moving the material being cleaned from a washer to a dryer. The facilities that use DF-2000 and other available alternatives normally operate with a single closed-loop machine. Except for the machines that operate with Tonsil (a bleaching clay made of natural calcium bentonite material that is acid activated) and CO2 machines, most of these closed-loop machines operate with primary control and usually with a water separator and vacuum still. It is reported that the machines that operate with Tonsil (Tonsil) can operate without a still (Kelleher, 2004). Tonsil has been in use for the last few years and cleaners typically use it in a 50 percent tonsil/ 50 percent diatomaceous earth blend (IRTA, 2005). Cost of alternative machines, with the exception of wet cleaning and Green Jet machines, are typically higher than Perc machines. However, other operational costs can be lower with non-Perc processes (see Chapter VII).
II-1
II. DRY CLEANING TECHNOLOGIES
This chapter provides some background and technical information regarding the
dry cleaning technologies used in California. The economic details of these technologies are presented in Chapter VII. This chapter also briefly discusses some emerging dry cleaning technologies which are not fully commercially developed in California. A. Perchloroethylene Cleaning Perchloroethylene (Perc) is the most widely used dry cleaning solvent in California. Perc is also used in other industry sectors including degreasing operations, paints and coatings, and industrial and consumer products. The Airborne Toxic Control Measure for Emissions of Perchloroethylene from Dry Cleaning Operations (Dry Cleaning ATCM) currently permits the use of closed-loop, dry-to-dry machines when Perc is the solvent of choice. The vast majority of California dry cleaners are familiar with the operation of this technology. Vented and transfer machines have been phased out and no Perc dry cleaners should be using these systems at this time.
Closed-loop, dry-to-dry machines are equipped either with primary controls (primary control machines) or with both primary and secondary controls (secondary control machines). Primary control machines feature a refrigerated condenser which cools the hot air exhaust from the drum to at least 45 degrees Fahrenheit (°F). This allows for the recovery of at least 50 percent more Perc than in older generation machines. The cooled exhaust stream is then reheated and returned back to the drum. The reheated exhaust helps to remove residual Perc from the clothes during the drying cycle. A secondary control machine typically features one or more carbon adsorber beds in addition to the refrigerated condenser. The carbon adsorber operates during the cool-down phase and can reduce the Perc concentration to less than 300 parts per million by volume (ppmv). During regeneration of the carbon beds (usually a fixed interval based on number of loads or manufacturer’s recommendation), recovered Perc is returned to the machine’s Perc storage tank.
Many machines also feature an inductive door fan. This device, which draws air
through the loading door and drum when the door is opened, is used to minimize the release of residual solvent vapor during unloading (after cool-down). Door locks, which prevent the door from being opened when the drum concentration exceeds a set point (normally 300 ppmv), may also be installed. B. Hydrocarbon Solvent Cleaning All hydrocarbon solvents used in dry cleaning consist of aliphatic hydrocarbons, meaning they are straight-chained, branched or cyclic as opposed to aromatics, which contains stable carbon-ring structures called benzene rings. Hydrocarbon solvents are combustible. Inherent properties of petroleum-based solvents include high flammability
II-2
(more detailed discussion of flammability is presented in Chapter VI), volatility, odor, and toxicity. Toxicity varies by compound; however, none of the petroleum-based solvents have been evaluated by the California Air Resources Board (ARB) for their potential to be toxic air contaminants (toxicity of various solvents is discussed in Chapter V). All of the solvents are volatile organic compounds (VOCs). The machines predominately used for petroleum solvents mentioned below are closed-loop machines equipped with primary control. 1. DF-2000 Fluid
DF-2000 Fluid (DF-2000) was introduced in 1994 by ExxonMobil as an
alternative solvent to Stoddard and Perc. Currently, it is the most popular alternative to Perc. Consisting of C11 to C13 aliphatic hydrocarbons, it is a synthetic mix of isoparaffins and cycloparaffins (naphthenes) that boils between 185 and 211 degrees Centigrade (OEHHA, 2003). Machines designed for DF-2000 and other hydrocarbon solvents offer closed-loop, dry-to-dry operation. Most include a primary control device (refrigerated condenser) and offer computerized control.
2. PureDry PureDry (PureDry) was developed as a replacement for Perc. It is a blend of
isoparaffinic hydrocarbon and a chemical additive produced by 3M. The mixture contains about 95 percent odorless mineral spirits. The odorless mineral spirits are a mixture of aliphatic hydrocarbons (C9 to C12). Mineral spirits can cause neurotoxicity, and eye and respiratory irritation at high concentrations. It also contains HFE-7200 (a mixture of ethyl perfluoroisobutyl ether and ethyl perfluorobutyl ether), FC-43 (perfluoro compounds of primarily 12 carbons), PF-5070 (perfluoro compounds of primary seven carbons), and PF-5060 (perfluoro compounds of primarily six carbons) (OEHHA, 2003). The flash point of PureDry is 350°F with a boiling point temperature of 298°F. The flash point of a solvent is the temperature at which vapor given off will ignite when an external flame is applied under specified test conditions. A flash point is defined to minimize fire risk during normal storage and handling. Flash points for all dry cleaning solvents range from 110°F to 350°F.
3. EcoSolv Chevron Phillips Chemical Company LP manufactures EcoSolv (EcoSolv). This
dry cleaning fluid is 100 percent isoparaffin with carbon numbers ranging from C9 through C13. The manufacturer formulated this product by adding butylated hydroxytoluene at 10 parts per million (ppm) to act as an oxygen stabilizer. This solvent is a high purity aliphatic mixture with minimum in aromatics. The isoparaffin is a branched hydrocarbon that is also used for food processing, cosmetic and personal care formulations, and as a solvent for a number of industrial products. EcoSolv has a flash point between140°F and 200°F, and is classified as Class IIIA solvent. (ARB, 2004e)
II-3
4. Shell Sol 140 HT
Shell Sol 140 HT (Shell 140) is a high flash point hydrocarbon solvent.
Shell 140’s flash point is 145°F. This solvent works well in closed-loop machines. 5. Stoddard Solvent Stoddard Solvent (Stoddard), a class of petroleum solvents, consists of a blend
of C8 to C12 hydrocarbons and is similar to kerosene. Its flash point is 110°F. Stoddard contains small amounts of chemicals known to be carcinogenic but are not classified as toxic. Stoddard also contains benzene, which has been identified as a toxic air contaminant. It also gives off an irritating odor. C. Volatile Methyl Siloxane Cleaning Decamethylcyclopentasiloxane (D5) or volatile methyl siloxane is an odorless, colorless liquid that has many consumer and industrial applications. D5 is used as an ingredient in a number of personal health and beauty products, including deodorants, antiperspirants, cosmetics, shampoos, and body lotions. It is also used as a dry cleaning solvent.
D5 is present in the GreenEarth (GreenEarth) dry cleaning solvent. GreenEarth solvent is mostly being used in hydrocarbon machines and has a flash point of 170°F. Although, GreenEarth is used in some converted Perc machines, the manufacturer does not recommend this option. In order for Perc machines to be converted, the following assemblies must be installed by manufacturer: filtration system; temperature control sensors; pre-water separator filter; water separator; and electrical control panel. GreenEarth solvent is distributed by Dow Corning, General Electric, and Shin-Etsu. D. Rynex (Propylene Glycol Ether) Cleaning
Rynex(Rynex 3) is an organic and biodegradable solvent with low volatility and a high flash point (>200°F) and is classified as a Class IIIB solvent. Rynex 3 is lighter than water and, therefore, floats on water after separation. It is a mixture of substituted aliphatic glycol ethers. It is also considered a VOC.
Rynex 3 can be used in most hydrocarbon machines with some temperature and
timing adjustment. Converting Perc machines to use Rynex 3 is not recommended by the solvent manufacturer. It is not an economically prudent exercise due to the differences in physical properties of Perc and Rynex 3.
II-4
E. Carbon Dioxide (CO2) Cleaning
Carbon dioxide cleaning (CO2) is a process that has been developed for use by commercial and retail dry cleaners. CO2 is a non-flammable, non-toxic, colorless, tasteless, odorless naturally-occurring gas that, when subjected to pressure, becomes a liquid solvent. The liquid CO2 cleaning machines have a configuration which is similar to a solvent or Perc machine. The system is closed loop and comes equipped with a cleaning chamber, storage unit, filtration, distillation, and lint trap. Washing, vapor recovery, and drying are all performed in the cleaning chamber.
The CO2 machines pressurize the gas in a drum to between 700 and 800 pounds per square inch (psi). For comparison purposes, a fire extinguisher is at 800 psi and a home oxygen tank is at 2,400 psi. Liquid CO2 and detergent is circulated through the clothes via jets inside the chamber. The jets are placed such that fluid impact upon the clothes results in rotation. Next, the CO2 is pulled out to prevent the dirt from being re-deposited on the clothing. At the end of the cycle (35-40 minutes), the pressure is released and the CO2 returns to a gaseous state, with dirt and substances removed from the clothing (the dirt and debris end up in the bottom of the tank). Cooling and drying of the clothes occurs as the liquid CO2 evaporates.
The CO2 used in this process is an industrial by-product from existing operations, primarily anhydrous ammonia (fertilizer) production. There is no net increase in the amount of CO2 emitted; therefore, this process does not contribute to global warming. CO2 is naturally occurring and is also used in other applications such as carbonating soft drinks. There are three manufacturers of CO2 equipment in the United States.
F. Professional Wet Cleaning
Professional Wet Cleaning (wet cleaning), an alternative to dry cleaning that was first introduced in 1991, is different than commercial laundering in several aspects. Wet cleaning uses computer-controlled washers and dryers with detergents that have been specially formulated for the process. Specialized equipment is used because ordinary washers and dryers lack the necessary control needed to ensure that garments are processed properly. Finishing equipment includes pressing and tensioning units. The tensioning units are used in dry cleaning industry to touch-up, stretch, reform, and finish the garments.
Due to the high agitation during the wash and spin cycles, an ordinary washer can damage garments. However, the washers used in wet cleaning use a frequency-controlled motor to control the rotation of the wash drum. As a result, a gentle wash action is produced and smoother acceleration and deceleration can be created. The wash program software can determine the appropriate combination of time, water level, water temperature, extraction, and drum rotation when manual operation is not desired. Washers are also designed to mix water with cleaning agents prior to entering the drum.
II-5
Wet cleaned garments must be carefully dried in preparation for finishing. Wet
cleaning generally takes about 45 minutes from wash through drying, not including the finishing time. As with high drum agitation, prolonged tumbling in a dryer, or otherwise over drying clothes, can cause shrinkage. Ordinary dryers control the drying process based on time and temperature. The dryers used in wet cleaning are based on humidity and are able to end the cycle when the desired humidity level in the garments has been achieved.
Wet cleaning systems use non-toxic, biodegradable detergents, which are
approved for disposal into the sewer system. The detergents are designed to be pH neutral and incorporate agents which prevent the interlocking of fibers. Many stains, such as salts, sugars, and foods and drinks, are readily removed by the wet cleaning process. Wet cleaning can also clean oil-based stains with the use pre-spotting chemicals that are specifically designed for water-based cleaning. Wet cleaning systems may also be gentler on buttons and ornamental pieces on clothing. G. Green Jet
The Green Jet (Green Jet) machine cleans and dries garments in a single computer-controlled unit. The machine is designed to receive a full 45 pound load of garments. It then dehydrates the garments to remove humidity and reduce surface tension, which allows mechanical action and pulsating air jets to dislodge and remove non-soluble soil from the garments. This soil is then collected in a lint chamber. Next, a pre-determined amount of water-based cleaning solution is injected through air jet nozzles to re-hydrate the fabric. After about a pint of solution has been injected, heavy felt pads attached to the ribs and the cylinder absorb the soluble soil. After the cleaning process, the unit goes into a conventional dry cycle and then a cool-down cycle. H. Emerging Technologies There are four emerging technologies which are expected to be readily available to the dry cleaning industry within the next few years. These technologies are: 1) Cold Water Cleaning Systems; 2) the Resolve™ Dry Cleaning System; 3) the Impress™ Solvent, and 4) Hydroclene Fluids.
1. Cold Water Cleaning Systems
Cold water cleaning systems (washer and dryer) can wash and dry all fabrics, including fine fabrics. Suntech Company, Ltd. and By-For The Cleaners, Inc. are manufacturers of cold water cleaning systems. The product literature states that the system uses 100 percent water and biodegradable detergents to clean garments. Garments are washed in chilled water which ranges in temperature from 36°F to 39°F. The use of chilled water is expected to minimize shrinking and may leave the use of tensioning equipment at the discretion of the dry cleaners. (ARB, 2004f)
II-6
2. Resolve Dry Cleaning System
Resolve (Resolve) is a new dry cleaning technology that uses dipropylene glycol normal butyl ether (DPNB). DPNB is a solvent which has been commonly used for more than 20 years in consumer products. R. R. Street, who is developing this technology, claims that extensive exposure studies have shown no known adverse health effects. According to the product literature, the Resolve system is able to take advantage of the low volatility of DPNB and uses liquid CO2 in the same equipment to extract the DPNB from garments without the use of heat. The garments can then dried by depressurizing the system to a gaseous state. Resolve is considered a VOC. (ARB, 2004g)
3. Impress Solvent Impress (Impress) dry cleaning solvent is a new propylene glycol-ether-based
solution created by Lyondell Chemical Company. This solvent is readily biodegradable and compatible with hydrocarbon machines. According to the manufacturer, the solvent is gentle on fabrics. Impress has a flash point of 190°F and is classified as a Class IIIA solvent. As with any hydrocarbon or glycol ether, Impress is considered a VOC. According to Lyondell Chemical Company, Impress dry cleaning solvent is of low acute toxicity by oral and dermal (skin) exposure. Further tests for toxicity assessments are underway. (ARB, 2005e; ARB, 2005f)
4. Hydroclene Fluids
Hydroclene is a mixture of normal-, iso-, and cyclo-paraffins. It is a complex solvent with the ability to dissolve a broad range of stains. It is a clear liquid with a boiling point 368°F and a flash point of 145°F. Hydroclene is owned by Caled Chemical but the product is manufactured by Shell Chemical. (ARB, 2005f) I. Flammability and Safety Dry cleaners should be aware of the flammability and safety issues of all the technologies described above, especially for converted machines. Dry cleaners are encouraged to consult with machine manufacturers to determine if a converted machine is able to operate safely with the solvent of choice. The flammability details and the summary of flash points and classification for various commonly used solvents are presented in Chapter VI, Table VI-1. Detailed information on products, technical data, as well as material safety data sheet (MSDS) are available by contacting the manufacturers. Appendix I lists the alternative solvents manufacturers contact information.
III-1
III. EMISSION CONTROL AND VENTILATION TECHNOLOGIES
This chapter briefly describes emission control and ventilation technologies. In dry cleaning operations, the majority of solvent is lost either through emissions to the atmosphere or via waste products. Furthermore, with perchloroethylene (Perc), a very small amount is also retained in clothes (relative to the total Perc emitted from dry cleaning operations). Some of the fugitive emissions can be controlled by using proper emission control and ventilation technologies to further reduce or capture emissions. A. Emission Control Technologies Over the past several years, the use of Perc recovery devices has become common in the dry cleaning industry because of economic considerations, environmental concerns, worker exposure concerns, and regulatory actions. Emission reduction from the dry cleaning industry can be attained through the use of proper operating practices and control equipment. These greatly increase the amount of solvent being recycled while at the same time minimize the solvent loss to the atmosphere. Housekeeping measures include promptly repairing any worn or cracked gaskets, covering all solvent and waste containers, identifying and repairing any leaking equipment, and removing any lint build-up from the steam or water coils. Available control devices such as carbon adsorbers, refrigerated or chilled water condensers, and distillation units have proven to be very effective for reducing emissions and recovering the solvent for reuse.
1. Primary Controls
Primary control systems operate during the heating and cool-down phases of the drying cycle. They are designed such that they neither exhaust to the atmosphere or workroom nor generate additional solvent-contaminated waste water (where applicable). Today, the most commonly used primary control device is the refrigerated condenser. In the past, carbon adsorbers and polymeric vapor adsorbers (a largely unproven technology) were also considered but could not compete with the overall efficiency of the refrigerated condenser. Refrigerated condensers operate throughout the drying cycle, in which solvent-laden air is continually recirculated through the condenser. The condenser recovers both the solvent and water vapors from the air stream, sending a liquid solvent and water mixture to a water separator. The solvent recovered by the water separator then goes to the solvent storage tank. During the drying cycle, the air stream circulates past the refrigerated condenser, is reheated by the heating coils, circulates through the drum evaporating more solvent from the materials, and then flows through the condenser again where the solvent is recovered. (ARB, 1996) In some hydrocarbon systems, the refrigeration unit is divided into separate segments for simplified maintenance and reduced downtime. The compressor,
III-2
refrigeration coil, and heat-exchange coil can be individually serviced without removing the entire system. Sealed coils plus quick disconnects prevent Freon gas discharge. The refrigerated condenser keeps the temperature low during the drying cycle.
2. Secondary Controls
A significant source of solvent emissions from closed-loop machines is from
opening the drum at the end of the drying cycle to remove materials. For example, the concentration of Perc in the drum at the end of the drying cycle can be as high as 8600 parts per million by volume (ppmv) (ARB, 1993). The operation of a secondary control device (typically a carbon adsorber - activated carbon bed contained in a housing), which operates in series with a refrigerated condenser, can further reduce solvent vapor concentrations in the drum and, therefore, reduce fugitive emissions and solvent consumption. Secondary control devices are activated at the end of the cool down step before the machine door is opened. These devices route solvent vapors from the drum and button and lint traps through a vapor adsorber, which strips solvent vapors from the air. In order to keep operating efficiently, the carbon must be periodically regenerated. The regeneration process typically uses heat to strip and recover the adsorbed solvent. This desorption process usually occurs after a specific number of loads or according to the manufacturer’s recommended schedule. (ARB, 1996)
The Airborne Toxic Control Measure for Emissions of Perchloroethylene from Dry
Cleaning Operations (Dry Cleaning ATCM) requires that closed-loop machines with secondary control systems reduce the concentration of Perc in the drum to less than 300 ppmv at the end of the drying cycle. Based on source test results submitted to the California Air Resources Board (ARB) for the approval of the secondary control systems, some systems can reduce the Perc concentration to below 100 ppmv. There are no similar statewide requirements for other solvents.
3. Other Control Technologies Inductive door fans may be installed to further reduce fugitive emissions. This
device, which draws air through the loading door and drum when the loading door is opened, is also beneficial in protecting the machine operator from residual solvent vapor during unloading. The inductive door fan may also be paired with a regenerative carbon canister. B. Ventilation Technologies
Ventilation at dry cleaning facilities is implemented in several different ways. Ventilation is important as it affects the dispersion of solvent vapors and other airborne compounds in the facility which in turns impacts the potential health risk to nearby residences and businesses. In many cases, the type of ventilation system found at a facility is a function of its construction. The facility owner most likely had little or no input into the design and construction of the ventilation system. Newer facilities tend to
III-3
have more aggressive (or “active”) systems compared to the relatively passive implementations in older facilities.
1. Natural Ventilation Many facilities do not have active ventilation systems. This means that solvent
vapors, such as Perc, are emitted from doors, windows, roof vents, and other openings throughout the facility. Natural ventilation depends upon wind and convective forces to move air and is typically considered the least effective.
2. Window Fans
Window fans or wall fans are high flow rate propeller type fans that are installed vertically in a wall (window-type-opening). The air is exhausted horizontally, typically near ground level. These also provide an improvement to a facility with only natural ventilation.
3. General Ventilation General ventilation systems typically have one or more large capacity fans on the
roof of the facility. Capture efficiency depends on the air exchange rate inside the facility and is a function of the fan air flow rate and the size of the facility. General ventilation is considered an upgrade from natural ventilation.
4. Local Ventilation Local ventilation is a phrase used to describe a ventilation system with a high
capacity fan, exhaust stack, and physical apparatus/structure (fume hoods, shrouds, flexible walls, vertical plastic strips) near the dry cleaning machine. This system is designed to capture fugitive emissions. Emissions are then exhausted through a stack on the roof of the facility. Fume hoods typically have plastic curtains on the sides (or a combination of walls and curtains) to minimize cross-flow drafts and provide better capture of fugitive emissions.
5. Partial Vapor Rooms
A Partial Vapor Room (PVR) encloses the back of a dry cleaning machine in a
small room with the front panel and loading door exposed for convenient loading and unloading. As a result, PVRs are able to more effectively capture fugitive emissions from leaks and maintenance activities when compared to local or general ventilation systems. Maintenance doors are normally closed and can be equipped with a self-closing device or alarm. Additionally, any windows are typically constructed of Plexiglas or tempered glass (for safety reasons). PVRs are typically used in co-located situations such as multi-story commercial buildings, mixed-use (residential/commercial) buildings, and shopping centers.
III-4
6. Vapor Barrier Rooms
Improving on partial vapor rooms, vapor barrier rooms (VBR) are the most efficient vapor capture systems. A VBR is able to restrict the diffusion and transport of solvent vapors that escape from a dry cleaning machine because a ventilation fan collects virtually all the vapors and exhausts them through a stack above the building. The door(s) to vapor barrier rooms are normally equipped with a self-closing device. Design features may vary, but normally include a “swinging” design that opens both ways or a sliding door. Additionally, any windows are typically constructed of Plexiglas or tempered glass (for safety reasons). VBRs are currently required for co-residential dry cleaning facilities in the San Francisco Bay Area and for all dry cleaners in mixed-use buildings in the State of New York.
IV-1
IV. CURRENT DRY CLEANING STATUS
Current dry cleaning status was assessed based on several surveys, site visits of dry cleaning facilities, and emission testing. This chapter discusses the procedures used, and the results of the surveys, site visits, and emission testing. A. Dry Cleaning Facility Survey Results
The Dry Cleaning Facility Survey (Facility Survey) was designed to collect
information from the dry cleaning facilities. Many questions were asked on the Facility Survey to gather information concerning: operating information, facility information, potential future machine purchase/replacement, machine(s) type, solvent usage, waste produced, and maintenance information. Because of the large percentage of Korean dry cleaners, the Facility Survey and the cover letter were also translated into Korean. The Facility Survey and the cover letter are shown in Appendix A.
1. Facility Survey Response and Analysis A mailing list of dry cleaning facilities was compiled based on listings from Dun
and Bradstreet and the local air districts. The lists were combined and duplicate addresses were deleted. With the help of Antelope Valley Air Pollution Control District (APCD), Mojave Desert Air Quality Management District (AQMD), and Ventura County APCD, over 6,300 Facility Surveys were sent in September 2003. The returned Facility Surveys were checked for address accuracy via yellow pages on the Internet. When needed, the facilities were called to verify address and/or if they were a dry cleaner. Where incorrect addresses were found, it was corrected and the Facility Surveys were mailed out again. Where the address did not exist, or there was currently not a dry cleaner at the address, that address was deleted from our database.
In all, around 5,800 Facility Surveys were delivered and the response rate was
32 percent. There were 265 drop off or agency shop returns. The number of Facility Surveys returned from dry cleaning facilities with dry cleaning machine(s) on-site was 1,634. Assuming the 14 percent proportion of drop off shops to dry cleaning plants is the same for those that did not return the Facility Survey, there are about 5,040 dry cleaning plants and 816 drop off shops in the State.
During early 2004, the completed Facility Surveys were reviewed to see if they were from drop off shops or if they were from dry cleaners that operate machine(s) on-site (dry cleaning plants). The drop off shop returns were compiled and accounted for while the Facility Surveys from dry cleaning plants were reviewed for completeness. The facility operators or owners were contacted as necessary to obtain missing data, or to clarify the information submitted. Information obtained from the dry cleaning plants was then entered into a database. Each database entry was compared with the original Facility Surveys for accuracy. During survey analysis, the Facility Survey results were compared with site visit results. In most cases, the site visit results were reasonably similar to the Survey results.
IV-2
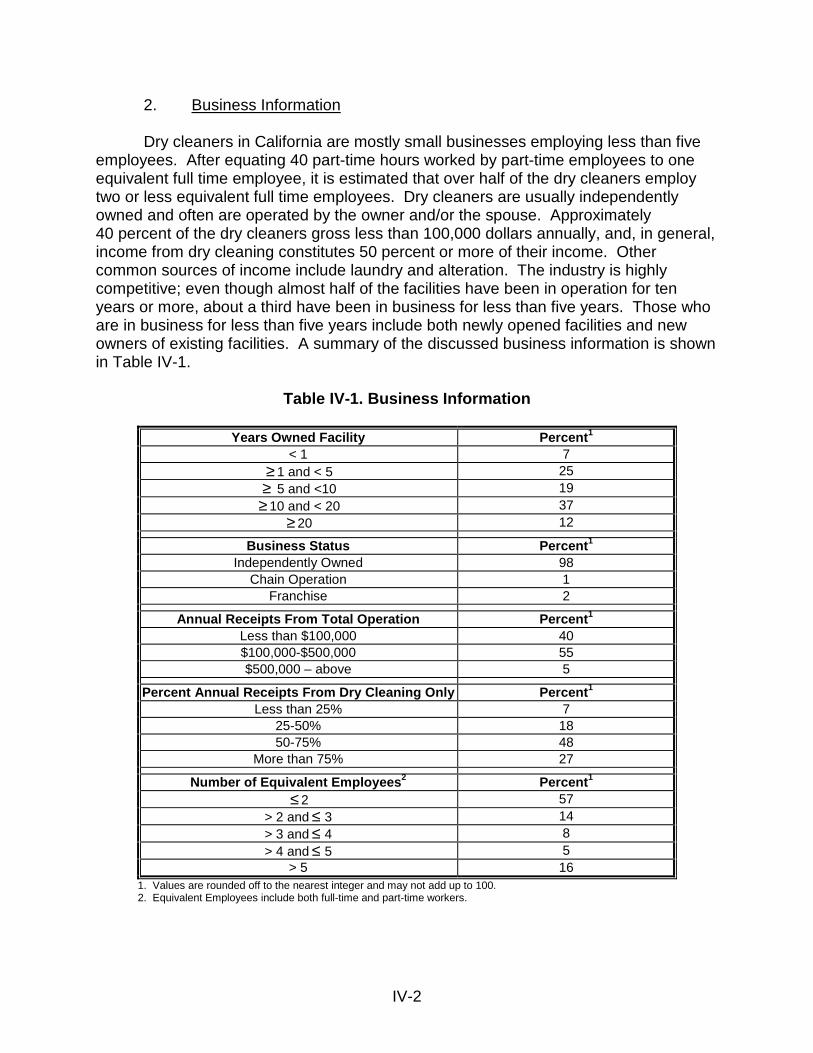
2. Business Information Dry cleaners in California are mostly small businesses employing less than five
employees. After equating 40 part-time hours worked by part-time employees to one equivalent full time employee, it is estimated that over half of the dry cleaners employ two or less equivalent full time employees. Dry cleaners are usually independently owned and often are operated by the owner and/or the spouse. Approximately 40 percent of the dry cleaners gross less than 100,000 dollars annually, and, in general, income from dry cleaning constitutes 50 percent or more of their income. Other common sources of income include laundry and alteration. The industry is highly competitive; even though almost half of the facilities have been in operation for ten years or more, about a third have been in business for less than five years. Those who are in business for less than five years include both newly opened facilities and new owners of existing facilities. A summary of the discussed business information is shown in Table IV-1.
Table IV-1. Business Information
Years Owned Facility Percent1 < 1 7
≥ 1 and < 5 25 ≥ 5 and <10 19 ≥ 10 and < 20 37
≥ 20 12 Business Status Percent1
Independently Owned 98 Chain Operation 1
Franchise 2 Annual Receipts From Total Operation Percent1
Less than $100,000 40 $100,000-$500,000 55 $500,000 – above 5
Percent Annual Receipts From Dry Cleaning Only Percent1 Less than 25% 7
25-50% 18 50-75% 48
More than 75% 27 Number of Equivalent Employees2 Percent1
≤ 2 57 > 2 and ≤ 3 14 > 3 and ≤ 4 8 > 4 and ≤ 5 5
> 5 16 1. Values are rounded off to the nearest integer and may not add up to 100. 2. Equivalent Employees include both full-time and part-time workers.
IV-3
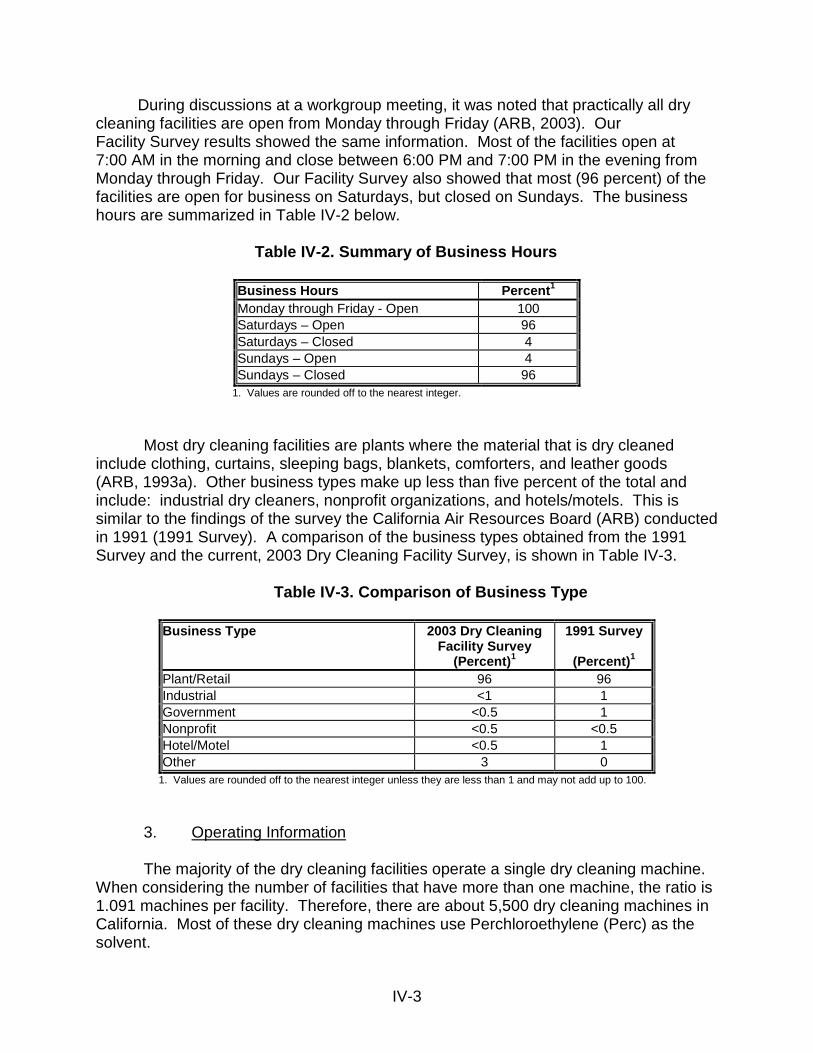
During discussions at a workgroup meeting, it was noted that practically all dry cleaning facilities are open from Monday through Friday (ARB, 2003). Our Facility Survey results showed the same information. Most of the facilities open at 7:00 AM in the morning and close between 6:00 PM and 7:00 PM in the evening from Monday through Friday. Our Facility Survey also showed that most (96 percent) of the facilities are open for business on Saturdays, but closed on Sundays. The business hours are summarized in Table IV-2 below.
Table IV-2. Summary of Business Hours
Business Hours Percent1 Monday through Friday - Open 100 Saturdays – Open 96 Saturdays – Closed 4 Sundays – Open 4 Sundays – Closed 96
1. Values are rounded off to the nearest integer.
Most dry cleaning facilities are plants where the material that is dry cleaned include clothing, curtains, sleeping bags, blankets, comforters, and leather goods (ARB, 1993a). Other business types make up less than five percent of the total and include: industrial dry cleaners, nonprofit organizations, and hotels/motels. This is similar to the findings of the survey the California Air Resources Board (ARB) conducted in 1991 (1991 Survey). A comparison of the business types obtained from the 1991 Survey and the current, 2003 Dry Cleaning Facility Survey, is shown in Table IV-3.
Table IV-3. Comparison of Business Type
Business Type 2003 Dry Cleaning
Facility Survey (Percent)1
1991 Survey
(Percent)1 Plant/Retail 96 96 Industrial <1 1 Government <0.5 1 Nonprofit <0.5 <0.5 Hotel/Motel <0.5 1 Other 3 0
1. Values are rounded off to the nearest integer unless they are less than 1 and may not add up to 100.
3. Operating Information
The majority of the dry cleaning facilities operate a single dry cleaning machine. When considering the number of facilities that have more than one machine, the ratio is 1.091 machines per facility. Therefore, there are about 5,500 dry cleaning machines in California. Most of these dry cleaning machines use Perchloroethylene (Perc) as the solvent.
IV-4
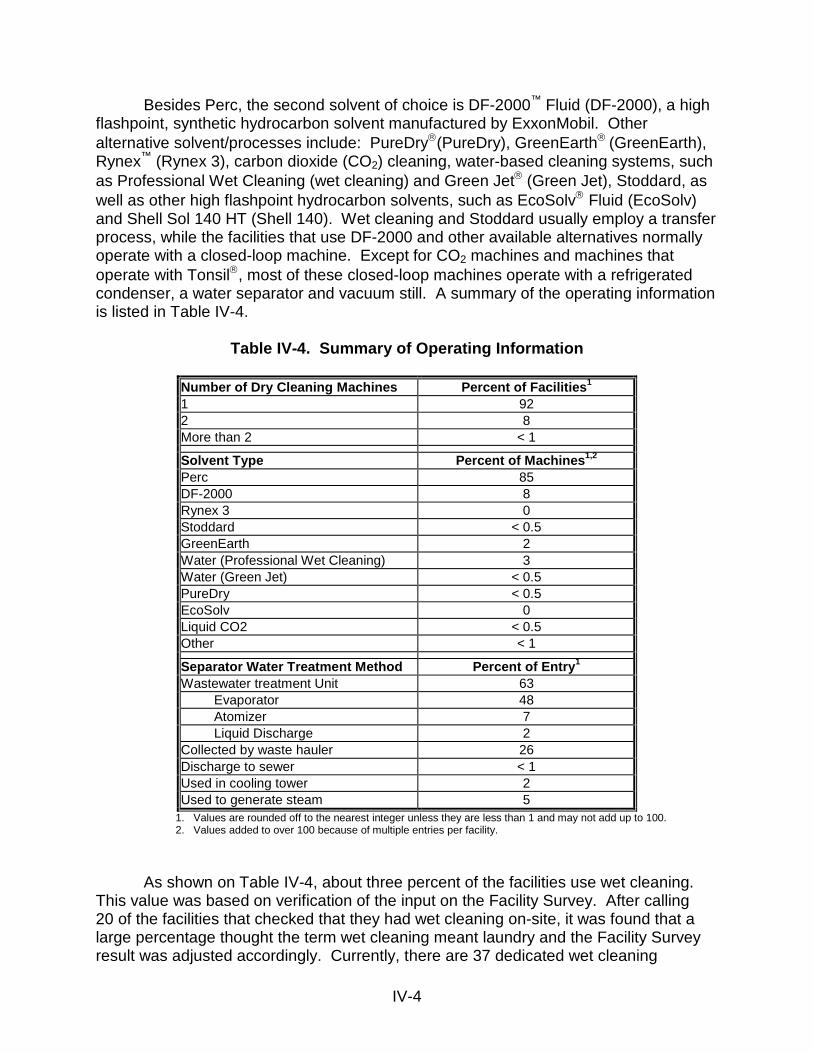
Besides Perc, the second solvent of choice is DF-2000™ Fluid (DF-2000), a high flashpoint, synthetic hydrocarbon solvent manufactured by ExxonMobil. Other alternative solvent/processes include: PureDry(PureDry), GreenEarth (GreenEarth), Rynex™ (Rynex 3), carbon dioxide (CO2) cleaning, water-based cleaning systems, such as Professional Wet Cleaning (wet cleaning) and Green Jet (Green Jet), Stoddard, as well as other high flashpoint hydrocarbon solvents, such as EcoSolv Fluid (EcoSolv) and Shell Sol 140 HT (Shell 140). Wet cleaning and Stoddard usually employ a transfer process, while the facilities that use DF-2000 and other available alternatives normally operate with a closed-loop machine. Except for CO2 machines and machines that operate with Tonsil, most of these closed-loop machines operate with a refrigerated condenser, a water separator and vacuum still. A summary of the operating information is listed in Table IV-4.
Table IV-4. Summary of Operating Information
Number of Dry Cleaning Machines Percent of Facilities1 1 92 2 8 More than 2 < 1
Solvent Type Percent of Machines1,2 Perc 85 DF-2000 8 Rynex 3 0 Stoddard < 0.5 GreenEarth 2 Water (Professional Wet Cleaning) 3 Water (Green Jet) < 0.5 PureDry < 0.5 EcoSolv 0 Liquid CO2 < 0.5 Other < 1
Separator Water Treatment Method Percent of Entry1 Wastewater treatment Unit 63 Evaporator 48 Atomizer 7 Liquid Discharge 2 Collected by waste hauler 26 Discharge to sewer < 1 Used in cooling tower 2 Used to generate steam 5
1. Values are rounded off to the nearest integer unless they are less than 1 and may not add up to 100. 2. Values added to over 100 because of multiple entries per facility.
As shown on Table IV-4, about three percent of the facilities use wet cleaning.
This value was based on verification of the input on the Facility Survey. After calling 20 of the facilities that checked that they had wet cleaning on-site, it was found that a large percentage thought the term wet cleaning meant laundry and the Facility Survey result was adjusted accordingly. Currently, there are 37 dedicated wet cleaning
IV-5
facilities and 43 facilities that use wet cleaning together with another type of dry cleaning process (mixed shops) in the South Coast AQMD (ARB 2005c). Facilities that use wet cleaning outside of the South Coast AQMD are mostly mixed shops.
In addition, as shown on Table IV-4, the Facility Survey indicated that two
percent of facilities use GreenEarth. This equates to about 100 facilities and is lower than the 146 facilities as of January 2005 that was submitted to ARB by GreenEarth. Because the Facility Survey was sent out in 2003, the difference in number may reflect an increase in the number of GreenEarth facilities since the Survey was taken, or it could be due to uncertainties associated with the Facility Survey. None of the facilities that responded to the Facility Survey use the solvents Rynex 3 and EcoSolv. Currently, we know that Rynex 3 is being used by two facilities in California. In addition, Chevron Phillips notified ARB that EcoSolv is being used by over 30 percent of the high flashpoint hydrocarbon users in California (Chevron Phillips, 2005).
Also shown on Table IV-4 is the method of separator water treatment being used
by the facilities. Besides water-based cleaning systems and CO2 cleaning, dry cleaning machines usually operate with a water separator, which generates wastewater. Because separator water from a Perc dry cleaning machine contains Perc, it must be handled properly. The two most popular methods of separator water treatment are the use of a waste water treatment unit and the hiring of a waste hauler.
Currently, there are three types of wastewater treatment units: evaporator,
atomizer, and liquid discharge. The categories specify the method of waste effluent elimination, i.e. evaporators would eliminate the waste effluent via evaporation, atomizers via atomization, and liquid discharge via discharge as a liquid. According to the Facility Survey, a majority of the dry cleaning facilities (63 percent) have a wastewater treatment unit on-site, with a majority of these facilities using an evaporator. A significant portion (26 percent) of facilities have their wastewater collected by a waste hauler. There is also a small percentage of dry cleaners (less than one percent) who discharge their wastewater into the sewer, which is not allowed if they are using a Perc machine. On closer look of these dry cleaners, they are either new facility operators or operate one of the alternative dry cleaning processes.
4. Machine Information and Operating Schedule A summary of machine information is shown on Table IV-5. There are four types
of dry cleaning machines in use: transfer machines, machines converted from vented to closed-loop (converted), closed-loop machines with primary control (primary), and closed-loop machines with both primary and secondary controls (secondary). Transfer machines in use today are for wet cleaning or for cleaning with hydrocarbon solvent, mainly Stoddard. Wet cleaning machines may either be transfer or closed-loop. The percentage of converted machines, about 2 percent, is small.
As shown on Table IV-5, about 60 percent of the machines in operation are primary machines and about a third of the machines are secondary machines. The
IV-6
median capacity of the machines is 40 pounds (lbs). The average age of the machines surveyed is 8 years, and most of them were bought new.
Table IV-5. Machine Information
Machine Information Average Age (years) 8 Bought New (percent) 89 Bought Used (percent) 11 Median Rated Capacity (lbs) 40 Machine Type Percent1 Transfer 1 Primary Control 62 Secondary Control 28 Converted (vent to no-vent) 2 Wet Cleaning 2
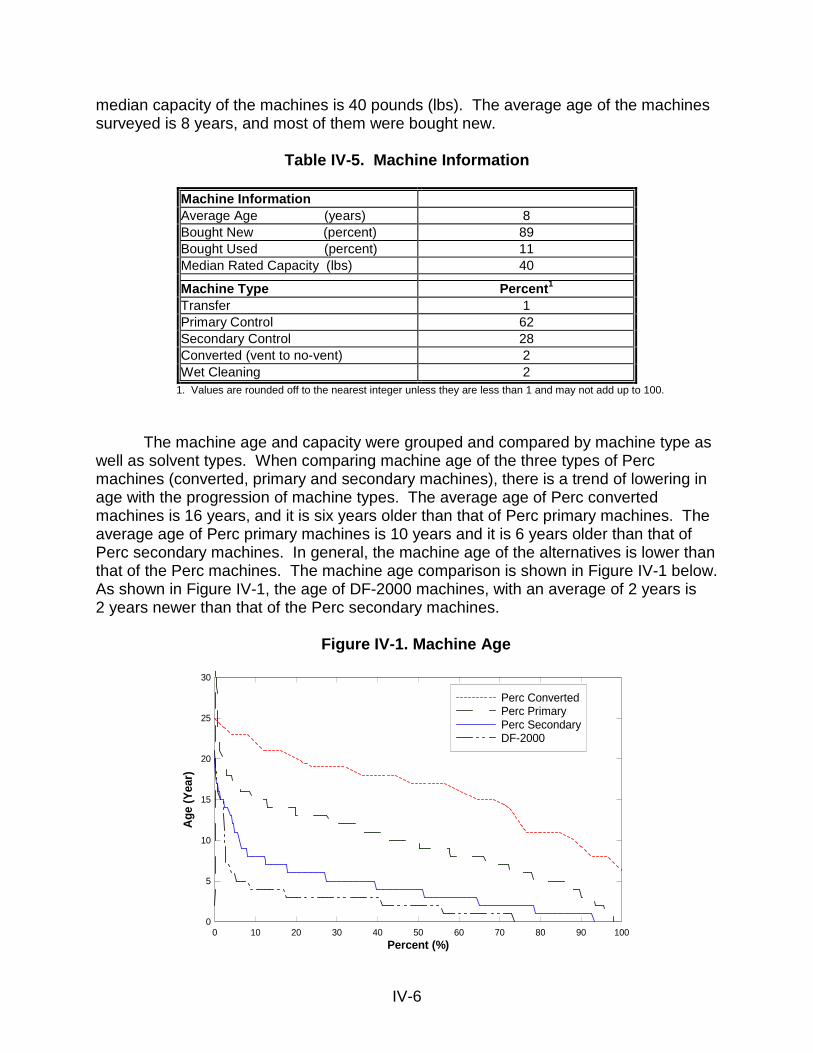
1. Values are rounded off to the nearest integer unless they are less than 1 and may not add up to 100. The machine age and capacity were grouped and compared by machine type as
well as solvent types. When comparing machine age of the three types of Perc machines (converted, primary and secondary machines), there is a trend of lowering in age with the progression of machine types. The average age of Perc converted machines is 16 years, and it is six years older than that of Perc primary machines. The average age of Perc primary machines is 10 years and it is 6 years older than that of Perc secondary machines. In general, the machine age of the alternatives is lower than that of the Perc machines. The machine age comparison is shown in Figure IV-1 below. As shown in Figure IV-1, the age of DF-2000 machines, with an average of 2 years is 2 years newer than that of the Perc secondary machines.
Figure IV-1. Machine Age
Percent (%)
Age
(Yea
r)
0 10 20 30 40 50 60 70 80 90 1000
5
10
15
20
25
30
Perc ConvertedPerc PrimaryPerc SecondaryDF-2000
IV-7
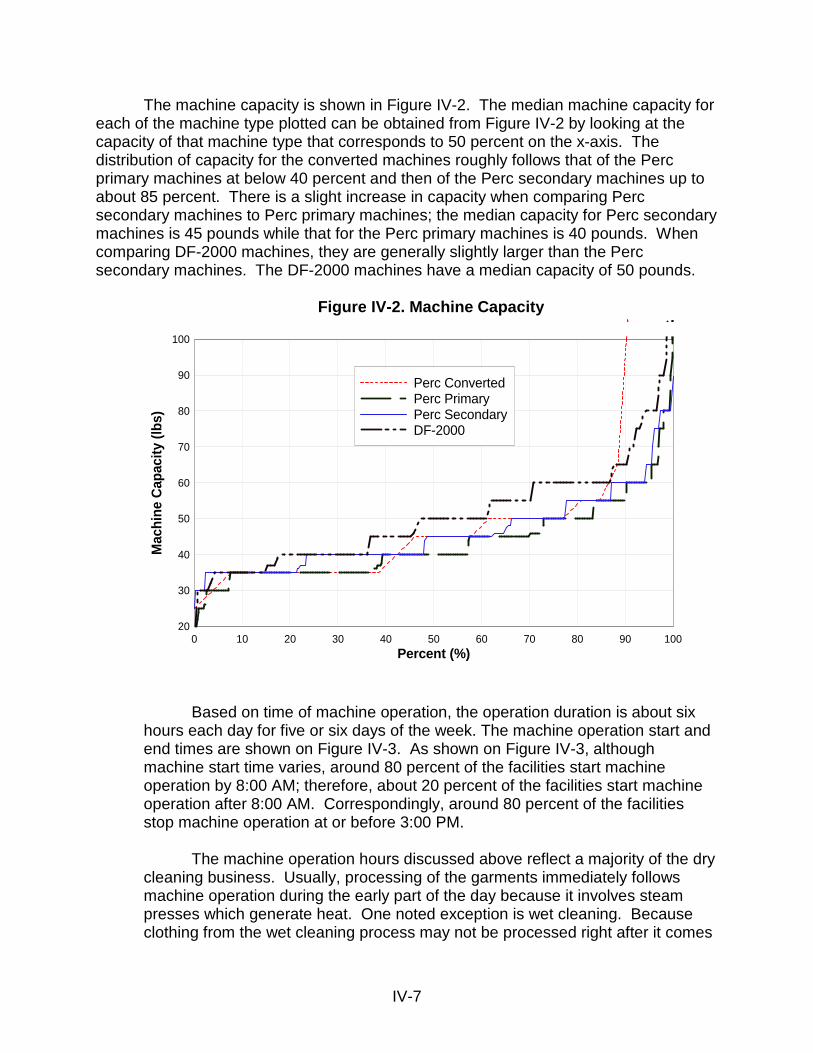
The machine capacity is shown in Figure IV-2. The median machine capacity for each of the machine type plotted can be obtained from Figure IV-2 by looking at the capacity of that machine type that corresponds to 50 percent on the x-axis. The distribution of capacity for the converted machines roughly follows that of the Perc primary machines at below 40 percent and then of the Perc secondary machines up to about 85 percent. There is a slight increase in capacity when comparing Perc secondary machines to Perc primary machines; the median capacity for Perc secondary machines is 45 pounds while that for the Perc primary machines is 40 pounds. When comparing DF-2000 machines, they are generally slightly larger than the Perc secondary machines. The DF-2000 machines have a median capacity of 50 pounds.
Figure IV-2. Machine Capacity
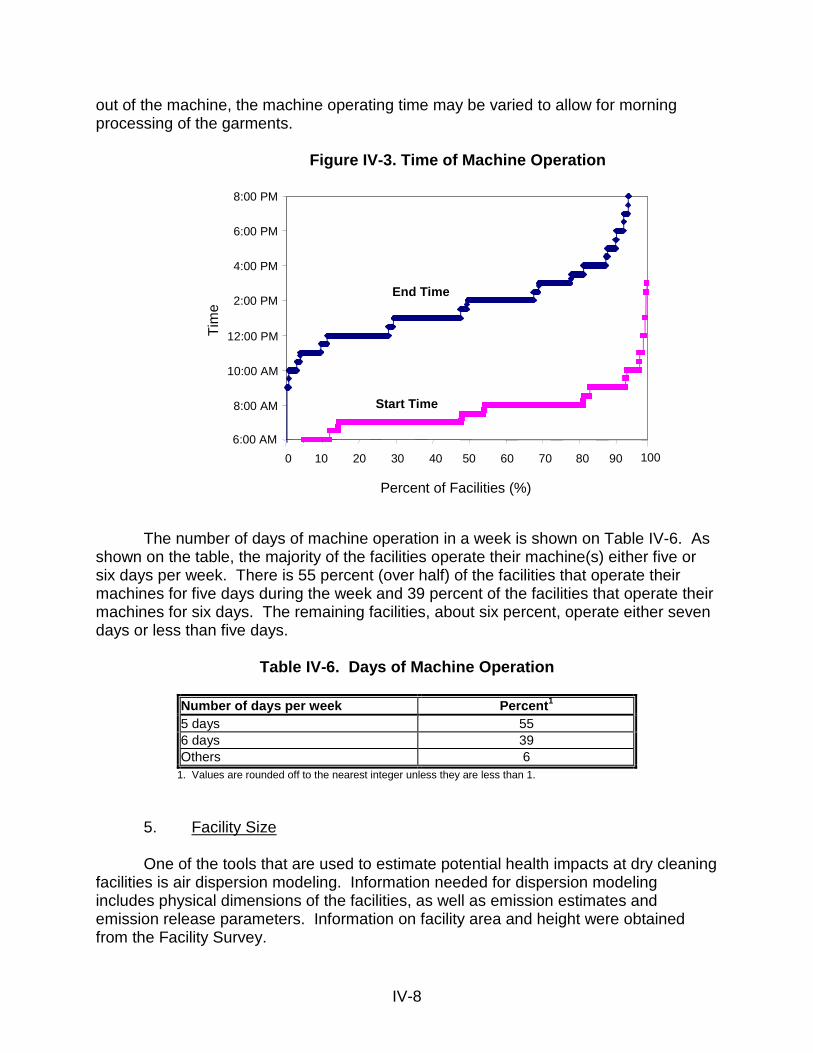
Based on time of machine operation, the operation duration is about six hours each day for five or six days of the week. The machine operation start and end times are shown on Figure IV-3. As shown on Figure IV-3, although machine start time varies, around 80 percent of the facilities start machine operation by 8:00 AM; therefore, about 20 percent of the facilities start machine operation after 8:00 AM. Correspondingly, around 80 percent of the facilities stop machine operation at or before 3:00 PM.
The machine operation hours discussed above reflect a majority of the dry
cleaning business. Usually, processing of the garments immediately follows machine operation during the early part of the day because it involves steam presses which generate heat. One noted exception is wet cleaning. Because clothing from the wet cleaning process may not be processed right after it comes
Percent (%)
Mac
hine
Cap
acity
(lbs
)
0 10 20 30 40 50 60 70 80 90 10020
30
40
50
60
70
80
90
100
Perc ConvertedPerc PrimaryPerc SecondaryDF-2000
IV-8
out of the machine, the machine operating time may be varied to allow for morning processing of the garments.
Figure IV-3. Time of Machine Operation
The number of days of machine operation in a week is shown on Table IV-6. As
shown on the table, the majority of the facilities operate their machine(s) either five or six days per week. There is 55 percent (over half) of the facilities that operate their machines for five days during the week and 39 percent of the facilities that operate their machines for six days. The remaining facilities, about six percent, operate either seven days or less than five days.
Table IV-6. Days of Machine Operation
Number of days per week Percent1 5 days 55 6 days 39 Others 6
1. Values are rounded off to the nearest integer unless they are less than 1.
5. Facility Size
One of the tools that are used to estimate potential health impacts at dry cleaning facilities is air dispersion modeling. Information needed for dispersion modeling includes physical dimensions of the facilities, as well as emission estimates and emission release parameters. Information on facility area and height were obtained from the Facility Survey.
6:00 AM
8:00 AM
10:00 AM
12:00 PM
2:00 PM
4:00 PM
6:00 PM
8:00 PM
10 20 30 40 50 60 70 80 90 1000
Percent of Facilities (%)
Tim
e
Start Time
End Time
IV-9
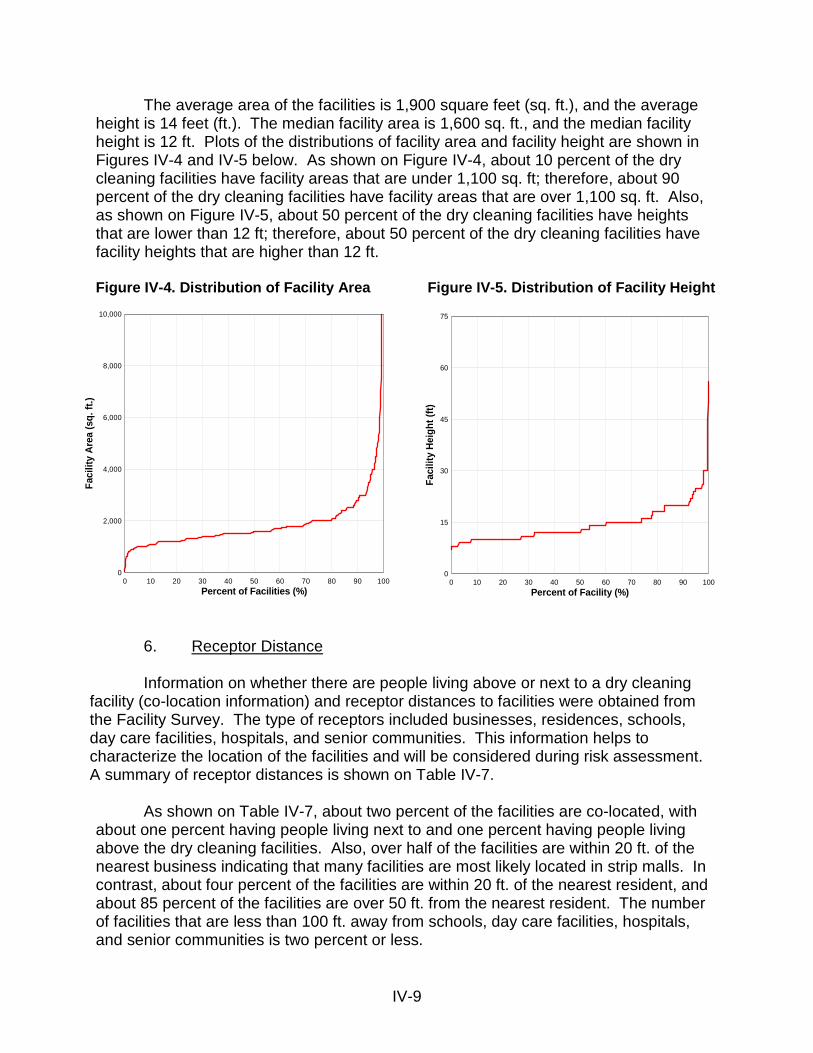
The average area of the facilities is 1,900 square feet (sq. ft.), and the average height is 14 feet (ft.). The median facility area is 1,600 sq. ft., and the median facility height is 12 ft. Plots of the distributions of facility area and facility height are shown in Figures IV-4 and IV-5 below. As shown on Figure IV-4, about 10 percent of the dry cleaning facilities have facility areas that are under 1,100 sq. ft; therefore, about 90 percent of the dry cleaning facilities have facility areas that are over 1,100 sq. ft. Also, as shown on Figure IV-5, about 50 percent of the dry cleaning facilities have heights that are lower than 12 ft; therefore, about 50 percent of the dry cleaning facilities have facility heights that are higher than 12 ft. Figure IV-4. Distribution of Facility Area Figure IV-5. Distribution of Facility Height
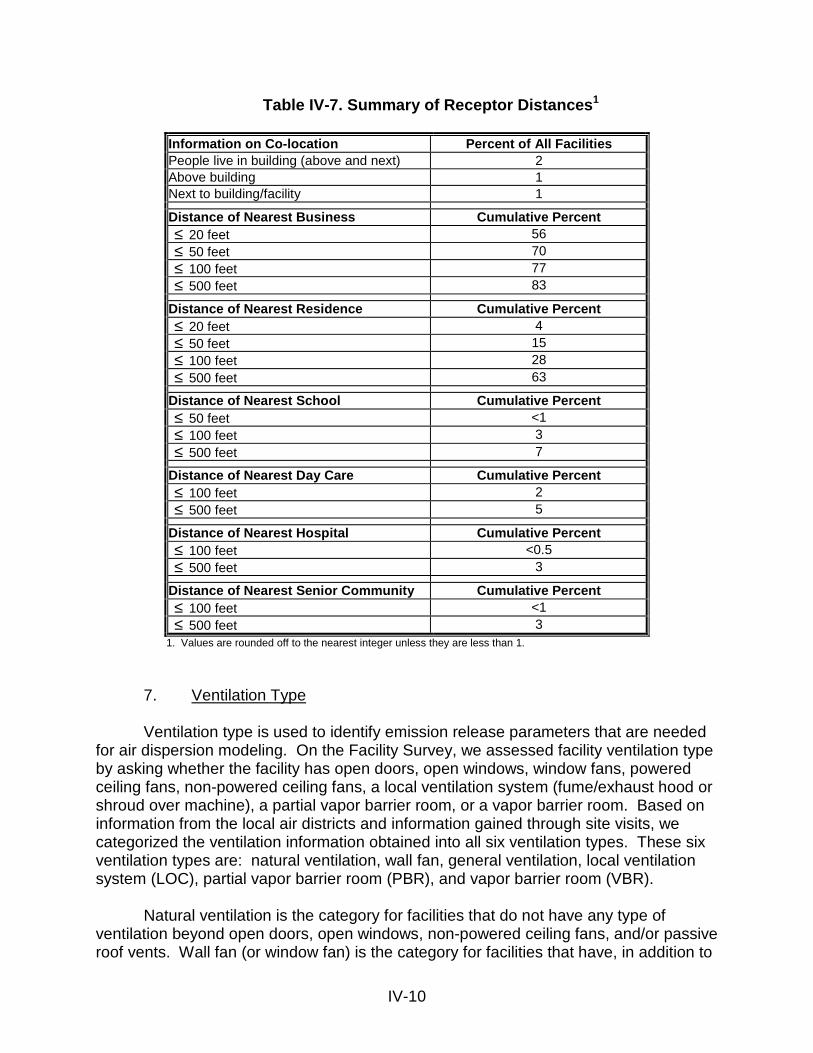
6. Receptor Distance Information on whether there are people living above or next to a dry cleaning
facility (co-location information) and receptor distances to facilities were obtained from the Facility Survey. The type of receptors included businesses, residences, schools, day care facilities, hospitals, and senior communities. This information helps to characterize the location of the facilities and will be considered during risk assessment. A summary of receptor distances is shown on Table IV-7. As shown on Table IV-7, about two percent of the facilities are co-located, with about one percent having people living next to and one percent having people living above the dry cleaning facilities. Also, over half of the facilities are within 20 ft. of the nearest business indicating that many facilities are most likely located in strip malls. In contrast, about four percent of the facilities are within 20 ft. of the nearest resident, and about 85 percent of the facilities are over 50 ft. from the nearest resident. The number of facilities that are less than 100 ft. away from schools, day care facilities, hospitals, and senior communities is two percent or less.
Percent of Facilities (%)
Faci
lity
Are
a (s
q. ft
.)
0 10 20 30 40 50 60 70 80 90 1000
2,000
4,000
6,000
8,000
10,000
Percent of Facility (%)
Faci
lity
Hei
ght (
ft)
0 10 20 30 40 50 60 70 80 90 1000
15
30
45
60
75
IV-10
Table IV-7. Summary of Receptor Distances1
Information on Co-location Percent of All Facilities People live in building (above and next) 2 Above building 1 Next to building/facility 1
Distance of Nearest Business Cumulative Percent ≤ 20 feet 56 ≤ 50 feet 70 ≤ 100 feet 77 ≤ 500 feet 83 Distance of Nearest Residence Cumulative Percent ≤ 20 feet 4 ≤ 50 feet 15 ≤ 100 feet 28 ≤ 500 feet 63 Distance of Nearest School Cumulative Percent ≤ 50 feet <1 ≤ 100 feet 3 ≤ 500 feet 7 Distance of Nearest Day Care Cumulative Percent ≤ 100 feet 2 ≤ 500 feet 5 Distance of Nearest Hospital Cumulative Percent ≤ 100 feet <0.5 ≤ 500 feet 3 Distance of Nearest Senior Community Cumulative Percent ≤ 100 feet <1 ≤ 500 feet 3
1. Values are rounded off to the nearest integer unless they are less than 1.
7. Ventilation Type Ventilation type is used to identify emission release parameters that are needed
for air dispersion modeling. On the Facility Survey, we assessed facility ventilation type by asking whether the facility has open doors, open windows, window fans, powered ceiling fans, non-powered ceiling fans, a local ventilation system (fume/exhaust hood or shroud over machine), a partial vapor barrier room, or a vapor barrier room. Based on information from the local air districts and information gained through site visits, we categorized the ventilation information obtained into all six ventilation types. These six ventilation types are: natural ventilation, wall fan, general ventilation, local ventilation system (LOC), partial vapor barrier room (PBR), and vapor barrier room (VBR).
Natural ventilation is the category for facilities that do not have any type of
ventilation beyond open doors, open windows, non-powered ceiling fans, and/or passive roof vents. Wall fan (or window fan) is the category for facilities that have, in addition to
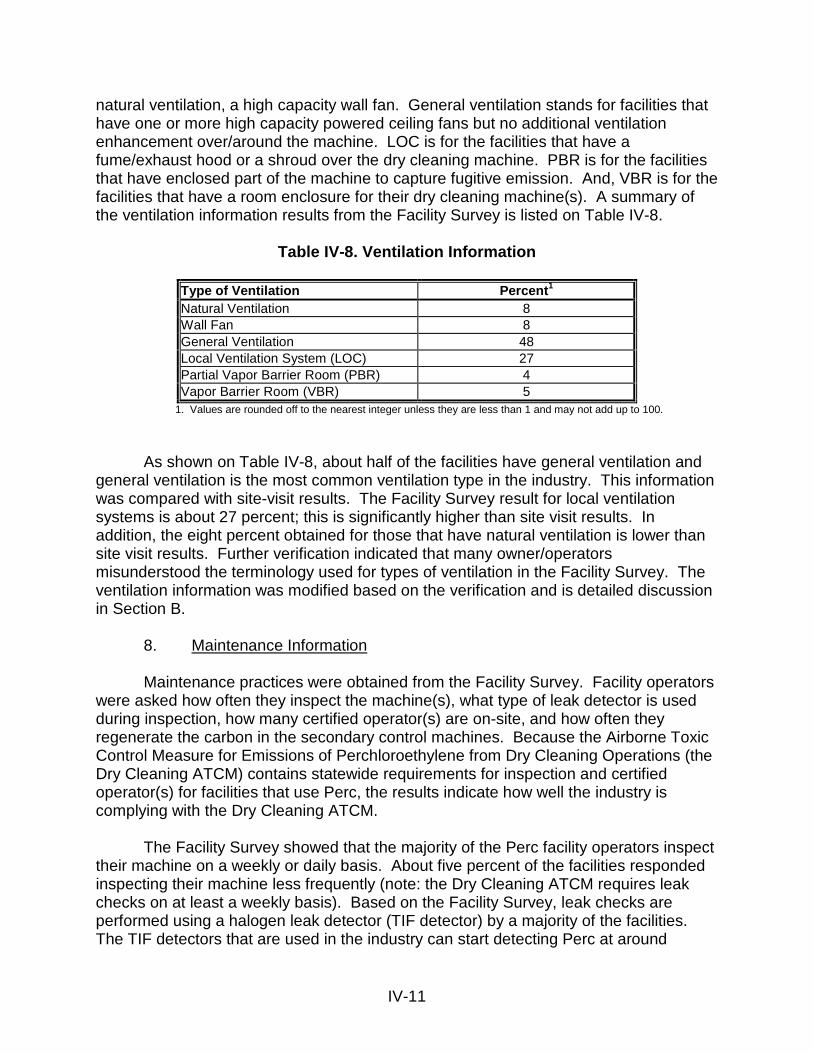
IV-11
natural ventilation, a high capacity wall fan. General ventilation stands for facilities that have one or more high capacity powered ceiling fans but no additional ventilation enhancement over/around the machine. LOC is for the facilities that have a fume/exhaust hood or a shroud over the dry cleaning machine. PBR is for the facilities that have enclosed part of the machine to capture fugitive emission. And, VBR is for the facilities that have a room enclosure for their dry cleaning machine(s). A summary of the ventilation information results from the Facility Survey is listed on Table IV-8.
Table IV-8. Ventilation Information
Type of Ventilation Percent1 Natural Ventilation 8 Wall Fan 8 General Ventilation 48 Local Ventilation System (LOC) 27 Partial Vapor Barrier Room (PBR) 4 Vapor Barrier Room (VBR) 5
1. Values are rounded off to the nearest integer unless they are less than 1 and may not add up to 100.
As shown on Table IV-8, about half of the facilities have general ventilation and general ventilation is the most common ventilation type in the industry. This information was compared with site-visit results. The Facility Survey result for local ventilation systems is about 27 percent; this is significantly higher than site visit results. In addition, the eight percent obtained for those that have natural ventilation is lower than site visit results. Further verification indicated that many owner/operators misunderstood the terminology used for types of ventilation in the Facility Survey. The ventilation information was modified based on the verification and is detailed discussion in Section B.
8. Maintenance Information Maintenance practices were obtained from the Facility Survey. Facility operators
were asked how often they inspect the machine(s), what type of leak detector is used during inspection, how many certified operator(s) are on-site, and how often they regenerate the carbon in the secondary control machines. Because the Airborne Toxic Control Measure for Emissions of Perchloroethylene from Dry Cleaning Operations (the Dry Cleaning ATCM) contains statewide requirements for inspection and certified operator(s) for facilities that use Perc, the results indicate how well the industry is complying with the Dry Cleaning ATCM.
The Facility Survey showed that the majority of the Perc facility operators inspect their machine on a weekly or daily basis. About five percent of the facilities responded inspecting their machine less frequently (note: the Dry Cleaning ATCM requires leak checks on at least a weekly basis). Based on the Facility Survey, leak checks are performed using a halogen leak detector (TIF detector) by a majority of the facilities. The TIF detectors that are used in the industry can start detecting Perc at around
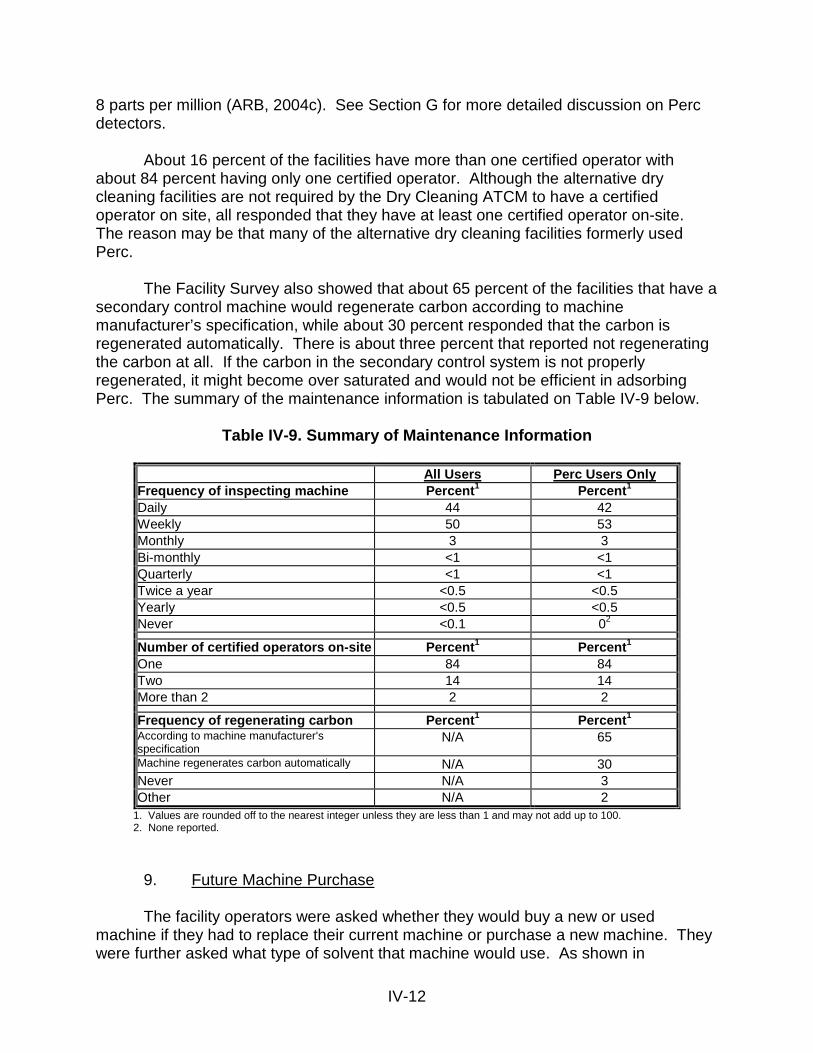
IV-12
8 parts per million (ARB, 2004c). See Section G for more detailed discussion on Perc detectors.
About 16 percent of the facilities have more than one certified operator with
about 84 percent having only one certified operator. Although the alternative dry cleaning facilities are not required by the Dry Cleaning ATCM to have a certified operator on site, all responded that they have at least one certified operator on-site. The reason may be that many of the alternative dry cleaning facilities formerly used Perc.
The Facility Survey also showed that about 65 percent of the facilities that have a secondary control machine would regenerate carbon according to machine manufacturer’s specification, while about 30 percent responded that the carbon is regenerated automatically. There is about three percent that reported not regenerating the carbon at all. If the carbon in the secondary control system is not properly regenerated, it might become over saturated and would not be efficient in adsorbing Perc. The summary of the maintenance information is tabulated on Table IV-9 below.
Table IV-9. Summary of Maintenance Information
All Users Perc Users Only Frequency of inspecting machine Percent1 Percent1 Daily 44 42 Weekly 50 53 Monthly 3 3 Bi-monthly <1 <1 Quarterly <1 <1 Twice a year <0.5 <0.5 Yearly <0.5 <0.5 Never <0.1 02
Number of certified operators on-site Percent1 Percent1 One 84 84 Two 14 14 More than 2 2 2
Frequency of regenerating carbon Percent1 Percent1 According to machine manufacturer's specification
N/A 65
Machine regenerates carbon automatically N/A 30 Never N/A 3 Other N/A 2
1. Values are rounded off to the nearest integer unless they are less than 1 and may not add up to 100. 2. None reported.
9. Future Machine Purchase
The facility operators were asked whether they would buy a new or used machine if they had to replace their current machine or purchase a new machine. They were further asked what type of solvent that machine would use. As shown in
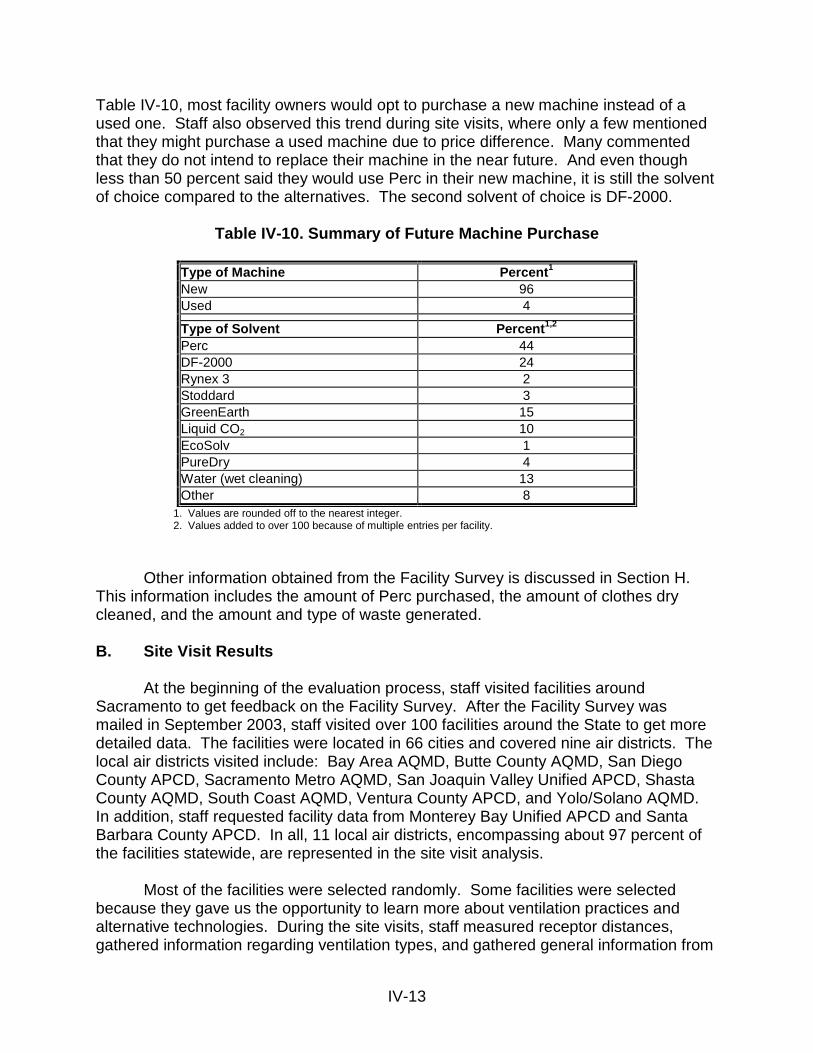
IV-13
Table IV-10, most facility owners would opt to purchase a new machine instead of a used one. Staff also observed this trend during site visits, where only a few mentioned that they might purchase a used machine due to price difference. Many commented that they do not intend to replace their machine in the near future. And even though less than 50 percent said they would use Perc in their new machine, it is still the solvent of choice compared to the alternatives. The second solvent of choice is DF-2000.
Table IV-10. Summary of Future Machine Purchase
Type of Machine Percent1 New 96 Used 4
Type of Solvent Percent1,2 Perc 44 DF-2000 24 Rynex 3 2 Stoddard 3 GreenEarth 15 Liquid CO2 10 EcoSolv 1 PureDry 4 Water (wet cleaning) 13 Other 8
1. Values are rounded off to the nearest integer. 2. Values added to over 100 because of multiple entries per facility.
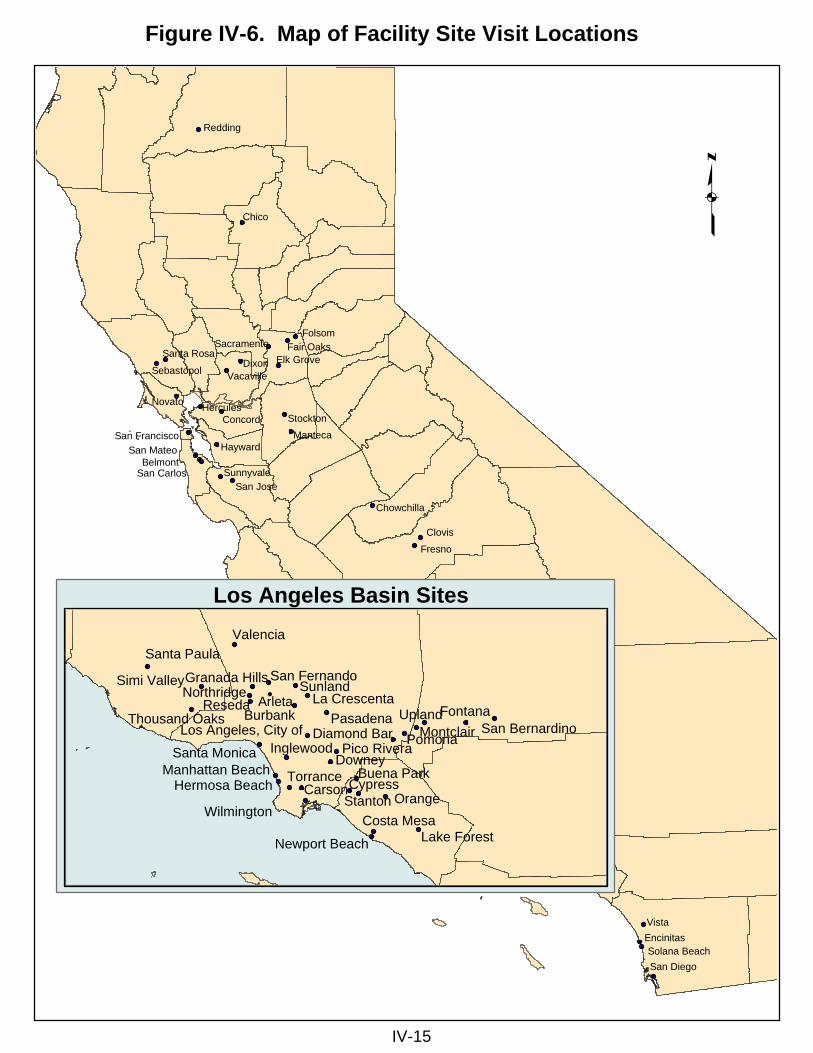
Other information obtained from the Facility Survey is discussed in Section H. This information includes the amount of Perc purchased, the amount of clothes dry cleaned, and the amount and type of waste generated. B. Site Visit Results At the beginning of the evaluation process, staff visited facilities around Sacramento to get feedback on the Facility Survey. After the Facility Survey was mailed in September 2003, staff visited over 100 facilities around the State to get more detailed data. The facilities were located in 66 cities and covered nine air districts. The local air districts visited include: Bay Area AQMD, Butte County AQMD, San Diego County APCD, Sacramento Metro AQMD, San Joaquin Valley Unified APCD, Shasta County AQMD, South Coast AQMD, Ventura County APCD, and Yolo/Solano AQMD. In addition, staff requested facility data from Monterey Bay Unified APCD and Santa Barbara County APCD. In all, 11 local air districts, encompassing about 97 percent of the facilities statewide, are represented in the site visit analysis.
Most of the facilities were selected randomly. Some facilities were selected because they gave us the opportunity to learn more about ventilation practices and alternative technologies. During the site visits, staff measured receptor distances, gathered information regarding ventilation types, and gathered general information from
IV-14
the machine operator, owner, and/or worker. A copy of the Site Visit Survey is shown in Appendix B. A map of the facilities visited is shown in Figure IV-6 on page IV-15.
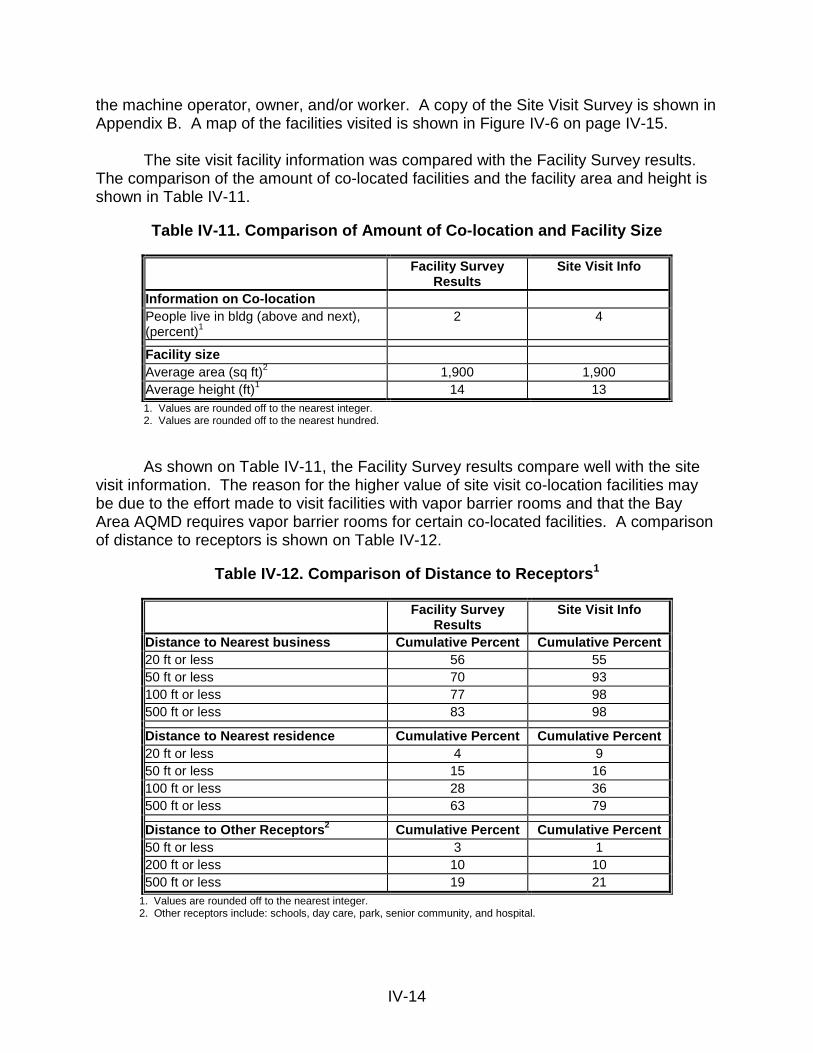
The site visit facility information was compared with the Facility Survey results. The comparison of the amount of co-located facilities and the facility area and height is shown in Table IV-11.
Table IV-11. Comparison of Amount of Co-location and Facility Size
Facility Survey
Results Site Visit Info
Information on Co-location People live in bldg (above and next), (percent)1
2 4
Facility size Average area (sq ft)2 1,900 1,900 Average height (ft)1 14 13 1. Values are rounded off to the nearest integer. 2. Values are rounded off to the nearest hundred.
As shown on Table IV-11, the Facility Survey results compare well with the site visit information. The reason for the higher value of site visit co-location facilities may be due to the effort made to visit facilities with vapor barrier rooms and that the Bay Area AQMD requires vapor barrier rooms for certain co-located facilities. A comparison of distance to receptors is shown on Table IV-12.
Table IV-12. Comparison of Distance to Receptors1
Facility Survey Results
Site Visit Info
Distance to Nearest business Cumulative Percent Cumulative Percent 20 ft or less 56 55 50 ft or less 70 93 100 ft or less 77 98 500 ft or less 83 98
Distance to Nearest residence Cumulative Percent Cumulative Percent 20 ft or less 4 9 50 ft or less 15 16 100 ft or less 28 36 500 ft or less 63 79
Distance to Other Receptors2 Cumulative Percent Cumulative Percent 50 ft or less 3 1 200 ft or less 10 10 500 ft or less 19 21
1. Values are rounded off to the nearest integer. 2. Other receptors include: schools, day care, park, senior community, and hospital.
Vista
Dixon
Chico
Novato
Fresno
Folsom
Clovis
Redding
MantecaHayward
Concord
Belmont
Stockton
San Jose
Hercules
Vacaville
Sunnyvale
San Mateo
San Diego
Fair Oaks
Encinitas
Elk GroveSebastopol
San Carlos
Sacramento
Chowchilla
Solana Beach
San Francisco
Santa Rosa
Figure IV-6. Map of Facility Site Visit Locations
IV-15
�
ArletaUpland
Reseda
Pomona
Orange
Downey
Carson
Sunland
Stanton
Fontana
Cypress
Burbank
Valencia
Torrance
Pasadena
Inglewood
Wilmington
Northridge
Costa Mesa
Buena Park
Simi Valley
Santa Paula
Lake Forest
Diamond BarSanta Monica
San Fernando
Thousand Oaks
Newport Beach
San BernardinoMontclair
La Crescenta
Granada Hills
Pico RiveraLos Angeles, City of
Manhattan BeachHermosa Beach
Los Angeles Basin Sites
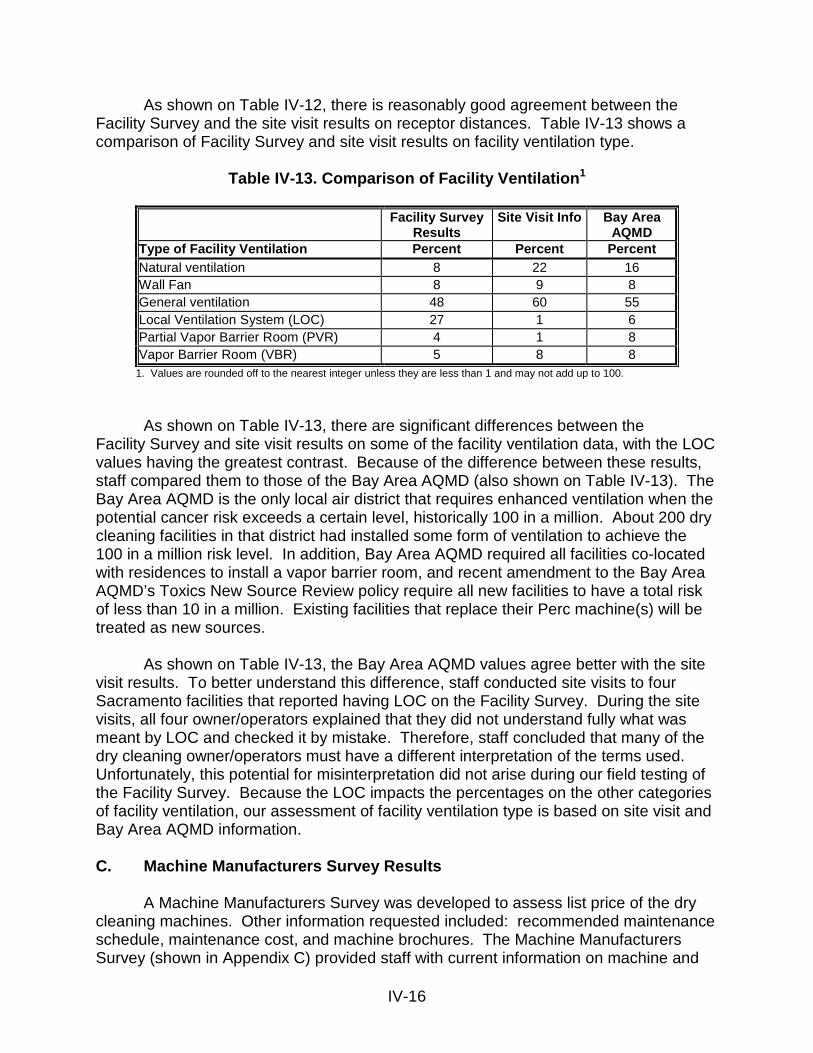
IV-16
As shown on Table IV-12, there is reasonably good agreement between the Facility Survey and the site visit results on receptor distances. Table IV-13 shows a comparison of Facility Survey and site visit results on facility ventilation type.
Table IV-13. Comparison of Facility Ventilation1
Facility Survey Results
Site Visit Info Bay Area AQMD
Type of Facility Ventilation Percent Percent Percent Natural ventilation 8 22 16 Wall Fan 8 9 8 General ventilation 48 60 55 Local Ventilation System (LOC) 27 1 6 Partial Vapor Barrier Room (PVR) 4 1 8 Vapor Barrier Room (VBR) 5 8 8
1. Values are rounded off to the nearest integer unless they are less than 1 and may not add up to 100.
As shown on Table IV-13, there are significant differences between the
Facility Survey and site visit results on some of the facility ventilation data, with the LOC values having the greatest contrast. Because of the difference between these results, staff compared them to those of the Bay Area AQMD (also shown on Table IV-13). The Bay Area AQMD is the only local air district that requires enhanced ventilation when the potential cancer risk exceeds a certain level, historically 100 in a million. About 200 dry cleaning facilities in that district had installed some form of ventilation to achieve the 100 in a million risk level. In addition, Bay Area AQMD required all facilities co-located with residences to install a vapor barrier room, and recent amendment to the Bay Area AQMD’s Toxics New Source Review policy require all new facilities to have a total risk of less than 10 in a million. Existing facilities that replace their Perc machine(s) will be treated as new sources.
As shown on Table IV-13, the Bay Area AQMD values agree better with the site visit results. To better understand this difference, staff conducted site visits to four Sacramento facilities that reported having LOC on the Facility Survey. During the site visits, all four owner/operators explained that they did not understand fully what was meant by LOC and checked it by mistake. Therefore, staff concluded that many of the dry cleaning owner/operators must have a different interpretation of the terms used. Unfortunately, this potential for misinterpretation did not arise during our field testing of the Facility Survey. Because the LOC impacts the percentages on the other categories of facility ventilation, our assessment of facility ventilation type is based on site visit and Bay Area AQMD information.
C. Machine Manufacturers Survey Results
A Machine Manufacturers Survey was developed to assess list price of the dry cleaning machines. Other information requested included: recommended maintenance schedule, maintenance cost, and machine brochures. The Machine Manufacturers Survey (shown in Appendix C) provided staff with current information on machine and
IV-17
maintenance costs, recommended maintenance schedule/practices, and latest technologies available on the machines.
When compared to the cost of a secondary Perc machine, the cost of the
commercially available water-based cleaning system is either similar or less. In contrast, all other closed-loop machines used for the alternative solvents are generally higher in cost. The most costly machine type is the one used for liquid CO2. Detailed cost information/discussion is presented in Chapter VII.
General maintenance practices for the closed-loop machines using Perc and
other alternative solvents (except water) include: cleaning of button and lint traps, cleaning of the still, draining and cleaning of the separator, and cleaning and/or changing of filters. Other maintenance practices may include proper lubrication of machine parts, checking the pressure level, and changing the carbon for certain carbon filters and for secondary control machines. Therefore, the time and effort spent on maintenance procedures are similar. For special cases where a still is not needed for some alternative solvents, there might be some decrease in maintenance time. Also, although the maintenance practices are similar, the frequency recommended for maintenance varies with the manufacturer.
Several features of the current technology on Perc machines minimize fugitive
Perc emissions. These include the use of spin disk filters, automatic cleaning of the still, and secondary control devices. Spin disk filters, when compared to cartridge filters, do not need to be replaced regularly and therefore significantly reduce fugitive emissions associated with filter replacement. Spin disk filters also allow for the recovery of the Perc that is normally embedded in the used cartridge filters. Automatic cleaning of the still eliminates the need to open it, which can expose the operator to Perc fumes and increase fugitive emissions. Secondary control devices reduce the Perc content within the machine drum to below 300 parts per million (ppm) before the clothes are removed and therefore reduce fugitive emissions. D. Dry Cleaning Solvent Manufacturers Survey
To ensure that our health and environmental impact assessment are based on the correct chemical(s), a Dry Cleaning Solvent Manufacturers Survey was sent to some of the alternative dry cleaning solvent manufacturers. This survey was primarily a request for solvent formulation and therefore we did not send out surveys to those solvent manufacturers where we already had information on solvent formulation. After the survey, staff obtained adequate formulation information associated with petroleum solvent cleaning (DF-2000™ Fluid, PureDry, EcoSolv, Shell Sol 140 HT, Stoddard), volatile methyl siloxane cleaning (GreenEarth), glycol ether cleaning (Rynex™), CO2 cleaning, and water-based cleaning systems. Several manufacturers also provided health and environmental impact data. Information gathered is used in our health/environmental impact evaluation.
IV-18
E. Perc Solvent Distributors Survey Results
A Perc Solvent Distributors Survey (Distributors Survey) was developed to assess the amount of Perc that is sold to the California dry cleaning industry. Information for years 2001, 2002, and 2003 were gathered from the distributors. A summary of the total amount of Perc bought and sold by the distributors for those three years are shown in Table IV-14. Based on Table IV-14, the majority of the Perc that was purchased was sold to the dry cleaning industry. In general, there is a continuing decrease in usage. This is most likely due to regulations that are in place and improved processes.
For comparison purposes, the amount of Perc purchased by the dry cleaning industry was calculated based on the Facility Survey. Since the estimated total number of machines around the state is about 5,500 (based on 5,040 facilities and 1.091 machines per facility), and the percent of Perc machines about 85, the usage can be estimated from facility survey. The result is compared with the Distributors Survey in Table IV-14. As shown on Table IV-14, the Distributors Survey results compare well with the facility survey results and there is a gradual decrease in the amount of Perc sold to the dry cleaning industry.
Table IV-14. Summary of Perc Usage1
Sold to Dry Cleaning
Industry In 2000 (Gallons)
Sold to Dry Cleaning
Industry In 2001 (Gallons)
Sold to Dry Cleaning
Industry In 2002 (Gallons)
Sold to Dry Cleaning
Industry In 2003
(Gallons) Distributors Survey N/A2 378,000 346,000 320,000
Facility Survey 393,000 381,000 365,000 N/A3 1. Values are rounded off to the nearest thousand. 2. Value was not obtained from the Distributor Survey. 3. Value was not obtained from the Facility Survey.
The values obtained from the Distributors Survey are low when compared to an
estimate by the Halogenated Solvents Industry Alliance, Inc. (HSIA). They estimated, based on population, that the volume sold to California dry cleaners is about 12 to 13 percent of the national volume, which in 2002 would have been 5.5 to 6 million pounds or 410,000 to 440,000 gallons (ARB, 2004h). This suggests that the California dry cleaning industry uses less Perc than the national average. In addition, current information from the Perc producers of 323,000 gallons and 236,000 gallons sold to the California dry cleaning industry in 2003 and 2004, respectively, confirmed the 320,000 gallons obtained from the Distributors Survey for 2003. (ARB, 2005e). F. Perc and DF-2000 Sludge Test Results
To support emission analysis of the dry cleaning processes, liquid sludge from Perc machines and DF-2000 machines was tested for solvent content. The standard
IV-19
operating procedures for determining Perc and DF-2000 in sludge are shown in Appendix D and E, respectively. Eight Perc sludge samples and two DF-2000 sludge samples were obtained and tested. The test results compared well with the 50 percent Perc reported to the ARB by three waste haulers in 1991. The average results are similar to data provided by the South Coast AQMD. Detailed test results are shown in Appendix F. A summary of the test data compared with South Coast AQMD data is shown in Table IV-15.
Table IV-15. Summary of Perc and DF-2000 Sludge Tests
Machine Type Number of
tests Wt%
Solvent in
Sludge1
WeightedAverage
Wt% Solvent
in Sludge1
Sludge Density (lb/gal)
Weighted Average Sludge Density (lb/gal)
Perc Primary (ARB 2004-2005) 6 35% 9.69 Perc Primary (South Coast)2 4 59%
45% 10.77
10.12
Perc Secondary (ARB 2004-2005) 2 44% 9.88 Perc Secondary (South Coast)3 20 46%
46% 9.92
9.92
DF-2000 (ARB 2005) 2 20% 7.55 DF-2000 (South Coast)2 10 46%
42% 7.71
7.68
1. Values are rounded off to the nearest integer. 2. South Coast, 2002. 3. Based on preliminary data from South Coast (3 quarters of data).
The test data shown on Table IV-15 include weight percent of solvent in sludge and sludge density. Also shown on Table IV-15 are calculated weighted average values of weight percent of solvent in sludge and sludge density. These weighted average values are used in emission calculations shown in Section H. Comparing the ARB and South Coast AQMD values for the weight percent of solvent in sludge shows the values obtained for the Perc secondary test series to differ by only two percent; however, for the Perc primary and the DF-2000 test series, the difference was 24 percent and 26 percent respectively. For the Perc Primary test series, with sample sizes of six and four and the range of the two series overlapping, the difference between the averages do not indicate systemic differences. The same is true with the DF-2000 test series. In all three cases, the weighted average of the ARB and South Coast AQMD test series combines the two sets of data to provide more representative data. G. Leak Detector Evaluation
Based on observations during site visits and conversations with ARB training staff and local air districts, Some Perc facility operators do not use their halogenated hydrocarbon detector (HHD) as often as they are required. The reason is that most of the HHDs do not give quantitative results. A majority of the Perc facilities use HHDs made by TIF™ Instruments, Inc. (TIF detectors) that would beep when Perc or other volatile organic compounds (VOCs) were detected. The threshold level for beeping to begin is around eight ppm (ARB, 2004c). The TIF detectors can not be easily used to
IV-20
accurately determine whether a facility is in violation because the Dry Cleaning ATCM requirement for the facility to fix the leak is at 50 ppm.
Staff looked at what is available in the industry for Perc detection and conducted
a limited evaluation. Ten portable detectors, in addition to a TIF detector and a photoionization detector (PID) that was available and served as reference, were evaluated. The range of technologies tested included: PID, gas sensitive semiconductor, colorimetric tube, infrared, and heated diode sensor technology. Cost information for the detectors is shown in Chapter VII. The evaluation included two phases. During the first phase, the detectors were evaluated under laboratory conditions to determine detection accuracy and response time to Perc standards. During the second phase, a TIF detector, the reference PID, and those detectors that had less than 30-second response time were selected and tested in dry cleaning facilities. The objective of this phase was to compare detector response time to Perc levels around the machines, to actual leaks, and were used to measure background Perc concentrations within the facilities.
A memorandum (memo) from ARB’s Monitoring and Laboratory Division (MLD)
detailing the laboratory evaluation effort for nine of the portable detectors is shown in Appendix H. Only one detector was not mentioned in the memo because it was tested after the memo was written. Based on laboratory evaluation results, staff tested nine detectors in dry cleaning facilities. Two of the nine detectors were modified Aeroqual detectors that included a built-in fan in the sensor head. In addition to the nine detectors, staff also tested the TIF detector and compared readings with a PID (manufactured by PE Photovac International Inc.) used by staff of the Sacramento Metropolitan AQMD.
A summary of the results is shown on Table IV-16 on page IV-21. In all cases, the PID detectors with an internal pump performed well and provided quantitative results. The Aeroqual 200 Leak Detector (different from the Aeroqual 200 used for monitoring purposes) was also deemed suitable for leak checks and provided quantitative results within 10 percent uncertainty at a 50 ppm Perc level. With the exception of TIF-5100, the detectors that used diffusion for sample delivery had response times of 5 seconds or more in the field and were deemed not suitable for leak detection. The Tek-Mate and the TIF-5100 were sensitive to Perc and will indicate leaks at levels below 50 ppm. The facility background concentrations were mostly non-detectable with the limit of detection of the PID detectors at around 1 or 2 ppm; the largest background concentration reading was between 5 to 10 ppm.
IV-21
Table IV-16. Summary of Leak Detector Evaluation
Model and (Manufacturer)
Detection Principle
Sample Delivery
Display Response Time1 (sec)
Leak Check Suitability2
Gas Alert Micro 5 (BW Technologies)
Photoionization Diffusion LCD with audio and visual alarms
5 – 10
No
PhoCheck 1000 (Ion Science)
Photoionization Internal pump LCD <5 Yes
MiniRAE 2000 (Rae Systems)
Photoionization Internal pump LCD with visual alarms
<5 Yes
Aeroqual 200 Leak Detector (Aeroqual)
Gas Sensitive Semiconductor
Internal fan LCD with audible alarms
<5
Yes
Aeroqual 500 (Aeroqual)
Gas Sensitive Semiconductor
Diffusion LCD with audio alarm
20 – 30 No
Aeroqual 500 with build-in fan3
(Aeroqual)
Gas Sensitive Semiconductor
Internal fan LCD with audio alarm
5 – 10
No
C-21 (Eco Sensors,Inc.)
Gas Sensitive Semiconductor
Diffusion LED bar with audible alarm
No Response4 No
D-Tek (Inficon)
Infrared Internal pump Audible with LED bar
No Response No
Tek-Mate (Inficon)
Heated Diode Sensor Technology
Internal pump Audible with low and high
sensitivity options
<5 Yes
TIF-5100 (TIF Instruments)
Heated Diode Sensor Technology
Diffusion Audible <5 Yes
Draeger CMS (Draeger)
Colorimetric Internal pump LCD 110 No
HW 101 reference analyzer (h-nu Systems)
Photoionization Internal pump Analog Potentiometer
<5 No
1. Response time is the approximate time needed for the detector to display a stable concentration. 2. Leak check suitability based on response time of less than 5 seconds in the field. 3. Laboratory testing done after the memorandum in Appendix H was written. 4. No response to calibrated standards, may require humidified gas sample.
H. Emissions from Dry Cleaning Operations
Emissions from dry cleaning operations are calculated based on a material balance approach. The amount of solvent that is consumed by a dry cleaning operation is either emitted into the air or is embedded in the waste or in clothes that are removed from the facility. Equation 1 shows the material balance relationship. (1) Solve = Solvc - Solvw - Solvclothes
where: Solve = volume in gallons of solvent emitted to the atmosphere from
a dry cleaning facility, Solvc = volume in gallons of solvent consumed in a dry cleaning facility,
IV-22
Solvw = volume in gallons of solvent that exit a dry cleaning facility in the waste products, such as still bottom, separator water, and used cartridge filters, and
Solvclothes = volume in gallons of solvent that exit a dry cleaning facility in clothes.
Information from our workgroup and from our site visits showed that a three-year
average of solvent purchased is a good indication of the amount of solvent used by a machine each year. The exception will be newly purchased machines because they initially use more solvent during the first year of operation due to the initial fill (ARB, 2004a). Therefore, the average volume of solvent used by a dry cleaning machine in California can be estimated from purchase amounts after excluding the newly purchased machines. For example, the three year average Perc purchased for a Perc primary machine is about 80 gallons per year, which happened to be the same as the amount consumed per year is estimated by calculating the three year average without newly purchased machines.
The three-year average method works well with Perc facilities; however, it did not
work well with DF-2000 facilities because approximately 60 percent of the machines are two years or newer. If the newly purchased DF-2000 machines for the three years for which we had solvent usage data were not used, we would be left with a small subset of data. Since the difference in solvent usage from newly purchased machines occur during the first year of machine operation, it is assumed that excluding machines that were purchased in 2002 and using average 2002 solvent purchases would be a good approximation of average solvent consumption for DF-2000 machines. The average DF-2000 consumption calculated is 89 gallons per year. This assumption was compared with Perc secondary machine data and the calculated amount of Perc purchased during 2002 without machines purchased in 2002 was 68 gallons, the same as the value calculated using a three year average excluding newly purchased machines.
Table IV-17 on page IV-23 shows the amount of solvent consumed, three-year
average of clothes dry cleaned, solvent consumed, still bottoms generated, and the number of filters used for facilities that used Perc primary machines, Perc secondary machines and DF-2000 machines. As shown on Table IV-17, there are three types of cartridge filters that are used in the machines. These are standard, split, and jumbo cartridge filters. A majority of the machines that use cartridge filters only use standard cartridges. Some of the machines have a combination of the three types of cartridge filters and they are designated as such on the table. In addition to cartridge filters, a portion of the machines have spin-disk filters. There are two types of spin-disk filters, powdered and non-powdered. As shown on Table IV-17, less than half of a percent of the Perc machines have both a powdered and a non-powered spin-disk. The machines that have cartridge filters may also have spin-disk filters; therefore, the sum of all the values on Table IV-17 under proportion of filters used is greater than 100.
The volume of Perc that is in the still bottoms is calculated from the average
amount of still bottoms produced (from Facility Survey data) and the weight percent of
IV-23
Perc in still bottoms. The weight percent of Perc that is in the still bottom was measured previously by ARB as well as by South Coast staff. The results compared well with a test series conduced by ARB staff in 2004-2005 (see Section F) and average values from the two test series are used for the calculation. For example, the annual average amount of still bottoms produced by a primary Perc machine is about 75 gallons. With an estimated average solvent weight percent for primary machines of 45 percent and an average density of 10.12 pounds (lbs) per gallon, the annual average amount of Perc in the sludge of a primary machine is about 25 gallons.
The amount of Perc in separator water may be calculated from the volume of separator water produced by a facility and the Perc content in separator water. For example, the average volume of separator water produced by a primary machine is about 141 gallons (from Facility Survey, Table VI-17). The Perc content in separator water was measured during an ARB test program in 1997 and by an affiliate of ATC Associates Inc. (AVES). The average Perc content in separator water is about 150 ppm or 3.9 grams per gallon (gm/gallon) (AVES, 2000). Therefore, on average, about 1.2 lbs of Perc or less than 0.1 gallons of Perc is present in the separator water coming out of a primary machine in one year.
Table IV-17. Facility Survey Summary for Emission Analysis Emission Analysis Information Perc Facilities
Primary Machines Secondary Machines DF-2000 Facilities
Amount of clothes cleaned Pounds1 Pounds1 Pounds1 Average 44,000 52,000 53,000
Yearly solvent usage and waste produced Gallons2,3 Gallons2,3 Gallons2,4 Solvent consumed 80 68 89 Average Still Bottom Removed 75 88 90 Average Separator Water Produced 141 191 210
Amount of Filters Used Per Year Count2,3 Count2,3 Count2,4 Average number of Standard cartridge used 15 10 7 Average number of Split cartridges used 13 7 11 Average number of Jumbo cartridges used 7 5 9 Proportion of Filters Used Percent3,5 Percent3,5 Percent4,5 Machine using Standard cartridge only 58 46 39 Machine using Split cartridge only 7 11 4 Machine using Jumbo cartridge only 5 10 6 Machine using a combination of Standard, Split, and Jumbo cartridges
4 8 9
Machine using non-powdered spin-disk 31 55 42 Machine using powdered spin-disk 13 11 27 Combo (non-powdered and powdered) <0.5 <0.5 None 1. Values are rounded off to the nearest thousand. 2. Values are rounded off to the nearest integer, unless it is less than one. 3. Values are averaged from three years of data, excluding newly purchased Perc machines. 4. Value is obtained from 2002 data excluding data for machines purchased in 2002. 5. Values are rounded off to the nearest integer unless they are less than one and may not add up to 100 because of combined
usage of spin-disk and cartridge filters.
IV-24
The amount of Perc in clothes is estimated based on available test data. AVES conducted a study in 1997 which showed the average amount of Perc in clothes was about 99 milligram per kilogram of clothes (AVES, 2000). For example, the amount of Perc in 52,000 lbs of clothes is about 0.3 gallons of Perc. This is higher than the 0.006 weight percent relative to the total Perc emitted from dry cleaning found in the Source Reduction Research Partnership in 1990 (ARB, 1993a).
The amount of Perc in standard and split filters is estimated to be 0.5 gallons and
the amount of Perc in a jumbo cartridge filter is estimated to be one gallon (ARB, 2004a). For example, for a facility that uses 13 standard filters a year, the amount of Perc that is disposed of in the filters is about seven gallons.
A detailed look into machine types and amount of emissions shows that
secondary machines are more efficient in Perc use compared to primary machines and converted machines. Because the number of converted machines is low (two percent of the total), it was not further divided into categories based on filter types. Within the categories of primary machines and secondary machines, the type(s) of filters used were identified and checked for difference in performance. There are three categories based on filter types: spin disk only, cartridge only, and combo. The category of spin disk only represent machines that operate with spin disk filtration and do not have any cartridge filters. The category of cartridge only represent machines that operate with cartridge filters only and do not have any spin disk filters. The combo category represents machines that have a combination of spin disk and cartridge filters. The percentage of each category is obtained from Facility Survey data and is shown on Table IV-18.
The amount of sludge, separator water, and number of filters used for converted
machines and for each of the categories of primary and secondary machines was obtained from the Facility Survey. The emissions are then calculated based on Equation 1 and are then normalized to the same amount of material dry-cleaned (46,600 pounds per year). A comparison of the normalized emissions for each of the categories is shown on Table IV-18 on page IV-25.
As shown on Table IV-18, the results show that Perc emissions calculated for the converted machines are the highest, with primary machines having lower emissions, and the secondary machines emitting the least amount of Perc for the same amount of clothes cleaned. When comparing primary machines, there is a distinct difference in emissions between machines that use spin disk filters and a combination of spin disk and cartridge filters versus those that use cartridge filters only. Primary machines that operate with only cartridge filters emit about 41 percent more Perc when compared with those that have a spin disk filter. The difference in emissions between filter types for secondary machines is relatively small. Comparing average Perc secondary machine to DF-2000 machines, the weight percent of solvent emitted is very close, with 50 percent and 49 percent, respectively. However, the actual amount in pounds per year emitted is higher for the Perc secondary machines when compared to DF-2000 machines (410 pounds per year versus 230 pounds per year) because Perc is higher in density.
IV-25
Table IV-18. Emissions Comparison1
Machine Type Percent
of Machine
in Category
Solvent Usage (gal/yr)
Sludge Amt (gal/yr)
Amt Solvent
in Sludge (Wt %)
No. of
Filter
Solvent Emitted (gal/yr)
SolventEmitted (Wt %)
Solvent Ems
(lb/yr)
Converted 100 106 46 45 22 79 75 1073 Primary (Spin Disk Only) 28 73 86 45 0 44 60 589 Primary (Cartridge Only) 55 97 65 45 18 66 68 889 Primary (Combo) 17 79 78 45 14 45 57 613 Primary (Average) 100 86 74 45 10 56 65 759 Secondary (Spin Disk Only) 32 65 90 46 0 28 48 383 Secondary (Cartridge Only) 29 60 67 46 10 35 55 469 Secondary (Combo) 39 59 85 46 6 17 34 227 Secondary (Average) 100 61 81 46 5 30 50 410 DF-2000 100 78 79 42 4 36 46 230 1. Values are normalized to 46,600 pounds of material cleaned per year and rounded off to the nearest integer.
V-1
V. POTENTIAL HEALTH IMPACTS A. Perchloroethylene
Perchloroethylene (Perc) is the most common solvent currently being used in the dry cleaning industry. Exposure to Perc may result in both cancer and non-cancer effects. There are many human and animal studies which have been used to identify potential health impacts for exposure to Perc. Many of the human studies have been conducted among populations of dry cleaning workers. The Office of Environmental Health Hazard Assessment (OEHHA) staff has performed an extensive assessment of the adverse health effects of Perc, including available carcinogenicity data. Summary information on human and animal studies can be found in OEHHA’s Air Toxics Hot Spots Program Risk Assessment Guidelines, Part II, Technical Support Document for Describing Available Cancer Potency Factors, April 1999.
The Air Resources Board (ARB) formally identified Perc as a toxic air contaminant in 1991. OEHHA concluded that Perc is a possible human carcinogen with no identifiable threshold below which no carcinogenic effects are likely to occur. Under Proposition 65, the Safe Drinking Water and Toxic Enforcement Act of 1986, the State of California listed Perc as a carcinogen in April 1988. In 1990, the United States Congress listed Perc as a hazardous air pollutant in subsection (b) of Section 112 of the federal Clean Air Act (42 U.S.C. 7412). The International Agency for Research on Cancer (IARC) has classified Perc in Group 2A, as a probable human carcinogen. The United States Environmental Protection Agency (U.S. EPA) is currently reevaluating Perc for carcinogenicity.
In addition to cancer effects, there are short-term (acute) and long-term (chronic) non-cancer health effects associated with exposure to Perc. Acute toxic effects resulting from short term exposure to high levels of Perc may include headaches, dizziness, rapid heartbeat, and irritation or burns on the skin, eyes, or respiratory tract. Chronic exposure to lower Perc concentration levels may result in dizziness, diminished cognitive ability, and damage to the liver and kidney (ARB, 1993). Workers have shown signs of liver toxicity following chronic exposure to Perc, as well as kidney dysfunction and neurological effects. Effects on the liver, kidney, and central nervous systems from chronic inhalation exposure to Perc have been reported in animal studies (ARB, 1997).
1. Pollutant-specific Health Values Dose-response or pollutant-specific health values are developed to characterize the relationship between a person’s exposure to a pollutant and the incidence or occurrence of an adverse health effect. A cancer potency
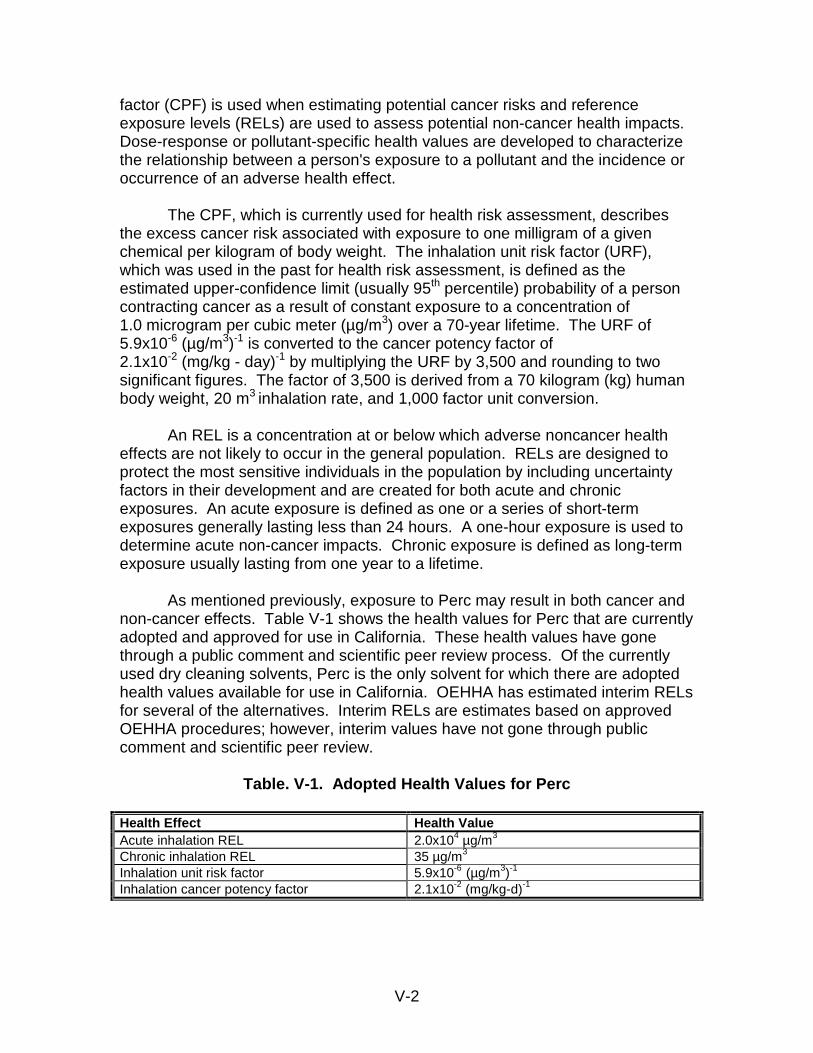
V-2
factor (CPF) is used when estimating potential cancer risks and reference exposure levels (RELs) are used to assess potential non-cancer health impacts. Dose-response or pollutant-specific health values are developed to characterize the relationship between a person's exposure to a pollutant and the incidence or occurrence of an adverse health effect.
The CPF, which is currently used for health risk assessment, describes
the excess cancer risk associated with exposure to one milligram of a given chemical per kilogram of body weight. The inhalation unit risk factor (URF), which was used in the past for health risk assessment, is defined as the estimated upper-confidence limit (usually 95th percentile) probability of a person contracting cancer as a result of constant exposure to a concentration of 1.0 microgram per cubic meter (µg/m3) over a 70-year lifetime. The URF of 5.9x10⁻⁶ (µg/m3)-1 is converted to the cancer potency factor of 2.1x10⁻² (mg/kg - day)-1 by multiplying the URF by 3,500 and rounding to two significant figures. The factor of 3,500 is derived from a 70 kilogram (kg) human body weight, 20 m3 inhalation rate, and 1,000 factor unit conversion.
An REL is a concentration at or below which adverse noncancer health
effects are not likely to occur in the general population. RELs are designed to protect the most sensitive individuals in the population by including uncertainty factors in their development and are created for both acute and chronic exposures. An acute exposure is defined as one or a series of short-term exposures generally lasting less than 24 hours. A one-hour exposure is used to determine acute non-cancer impacts. Chronic exposure is defined as long-term exposure usually lasting from one year to a lifetime.
As mentioned previously, exposure to Perc may result in both cancer and non-cancer effects. Table V-1 shows the health values for Perc that are currently adopted and approved for use in California. These health values have gone through a public comment and scientific peer review process. Of the currently used dry cleaning solvents, Perc is the only solvent for which there are adopted health values available for use in California. OEHHA has estimated interim RELs for several of the alternatives. Interim RELs are estimates based on approved OEHHA procedures; however, interim values have not gone through public comment and scientific peer review.
Table. V-1. Adopted Health Values for Perc Health Effect Health Value Acute inhalation REL 2.0x10⁴ µg/m3 Chronic inhalation REL 35 µg/m3 Inhalation unit risk factor 5.9x10⁻⁶ (µg/m3)-1 Inhalation cancer potency factor 2.1x10⁻² (mg/kg-d)-1
V-3
B. Perc Alternatives
There is relatively little health data available on the alternatives and no California health values have been adopted. As a result, ARB staff requested OEHHA to review the health effects of alternative dry cleaning solvents as they are used in the dry cleaning industry. Appendix G is a copy of OEHHA’s December 2002 memorandum to ARB which provides both a summary of their literature review and toxicity data summaries for many of these compounds. Based on their literature review, OEHHA has estimated several interim RELs and is continuing to follow the peer-reviewed literature on toxicity studies for the alternative solvents.
1. Hydrocarbon Solvent Cleaning (DF-2000, PureDry, EcoSolv, Shell 140, Stoddard)
Hydrocarbon solvents, sometimes referred to as mineral spirits and
petroleum solvents, are mixtures of hydrocarbons with or without other materials. Hydrocarbons have been used in the dry cleaning industry for many years and are some of the more common alternatives to Perc dry cleaning. The hydrocarbon solvents are a unique mixture of carbon and hydrogen molecules that co-exist as linear and branched chains, as well as in cyclic forms (U.S. EPA,1998).
For Stoddard solvent, the American Conference of Governmental Hygienists set a Threshold Limit Value (TLV) of 525 mg/m3. The National Institute for Occupational Safety and Health (NIOSH) REL is 350 mg/m3 time-weighted average (TWA). Stoddard solvent can be irritating to the eyes, nose, throat, and can also have effects on the nervous system. (U.S. EPA, 1998)
A recent two-year inhalation study of Stoddard solvent conducted by the
National Toxicology Program (NTP) concluded that there was some evidence of carcinogenic activity in male rats (NTP, 2004). In general, this study confirmed previous studies on toxicity for Stoddard. Most of the studies found in the literature for short and long-term toxicity identified the kidney and liver as the major target organs (NTP, 2004).
There is also very limited health information on other hydrocarbon mixtures. DF-2000 Fluid (DF-2000) contains C11 to C13 synthetic isoparaffin aliphatic hydrocarbons. PureDry (PureDry) contains 95 percent mineral spirits, which can cause neurotoxicity, and eye and respiratory irritation at high concentrations (OEHHA, 2003). EcoSolv (EcoSolv) and Shell Sol 140 HT have similar hydrocarbon properties.
Most information is lacking on the environmental persistence of these and
other hydrocarbon mixtures, however the manufacturer of DF-2000 indicated that
V-4
their solvent can exhibit moderate rates of biodegradation (ExxonMobil, 2003). The manufacturer of EcoSolv indicated their solvent can exhibit moderate to rapid rates of biodegradation (Chevron Phillips, 2005).
For hydrocarbon mixtures, OEHHA has developed an interim chronic REL of 1,200 µg/m3. The development of this interim value, which has not been through scientific peer review, is based on a study by Phillips and Egan on male and female rats. Additional information on this study can be found in Appendix G. The scarcity of health information for hydrocarbon solvents is a concern. Although the limited data available indicates relatively low toxicity, there are no comprehensive studies which indicate that toxicity and carcinogenicity should not be a concern. More research in this area is needed before a better assessment of the health impacts from hydrocarbon emissions can be made. An occupational exposure limit (OEL) can be calculated for various hydrocarbon solvents. Guidance values for individual hydrocarbon constituents or groups of constituents were recently published in an article A Proposed Methodology for Setting Occupational Exposure Limits for Hydrocarbon Solvents in the Journal of Occupational and Environmental Hygiene, October 2005. (JOEH, 2005). Information on calculating OELs and guidance values for other substance groups can be found in the article. Note however, these guidance values have not been approved for use in California’s regulatory programs.
2. Volatile Methyl Siloxane Cleaning
Decamethylcyclopentasiloxane, or D5, is a cyclosiloxane which is now being used as a dry cleaning solvent. Historically, it has been used as an ingredient in many personal health and beauty products. D5 is present in GreenEarth (GreenEarth) solvent. Dow-Corning, who manufacturers the solvent, conducted a two-year study with rats in which preliminary data showed an increase in tumors of the uterine endometrium. Preliminary findings may indicate that there is a potential carcinogenic hazard associated with D5 (U.S. EPA, 2003). The observance of adverse effects on the uterus by D5 is of concern (OEHHA, 2003). Because D5 is lipophilic there is also concern that D5 may bioaccumulate in the food chain.
A study by Burns-Naas et al. (1998) evaluated the subchronic toxicity of
D5. This study showed there were several minor changes observed in clinical biochemistry parameters; the most notable was an increase in gamma glutamyl transferase (a liver enzyme) in both sexes at the high dose. This study also showed that there was an increase in liver weight in rats. McKim et al. (1999) investigated the effects of D5 on the expression and activity of selected rat hepatic phase I and phase II enzymes. Additional information on the Burns-Naas et al. and McKim et al. studies can be found in Appendix G.
V-5
In June 2005, D5 manufacturers submitted final toxicity testing data to ARB, OEHHA, Department of Health Services (DHS), and U.S. EPA. According to D5 manufacturers, this data supports their conclusion that D5 is safe when used as intended. After ARB, OEHHA, DHS and U.S. EPA review the data, a better assessment of the public health impacts from GreenEarth emissions can be made.
3. Rynex™ (Propylene Glycol Ether)
Rynex™ (Rynex 3) is a form of propylene glycol ether and water. This solvent had some changes in formulation since its inception. Rynex 3 represents the current formulation for Rynex 3. Currently, there is limited toxicity data on Rynex 3.
Based on a recent study by NTP on a previous formulation for Rynex 3,
propylene glycol t-butyl ether, OEHHA expressed concerns over its toxicity and carcinogenic potential. Of particular concern was the presence of tumors in mice. OEHHA has developed an interim chronic REL for propylene glycol t-butyl ether of 200 µg/m3 to prevent adverse effects in the respiratory system. In addition, an interim inhalation unit risk factor for cancer was estimated to be 5.2x10⁻⁷ (µg/m3)-1, about one-tenth that of Perc. There are no developmental or reproductive studies on the chemical. Appendix G has more detailed information on the toxicological studies for the previous formulation of Rynex 3, propylene glycol t-butyl ether. The manufacturer of Rynex 3 has indicated that Rynex 3 is not carcinogenic and has low toxicity. A Rynex 3 fact sheet states that, based on laboratory animal studies, propylene glycol ethers do not cause the type of toxicological effects that are associated with exposure to ethylene glycol ethers (Rynex, 2005a). However, neither ARB nor OEHHA staff has verified this or has received these toxicological studies. 4. Carbon Dioxide Cleaning
As discussed in Chapter II, carbon dioxide (CO2) cleaning uses liquid CO2. The CO2 used in this process is an industrial by-product. There is no net increase in the amount of CO2 emitted; therefore, this process does not contribute to global warming. CO2 is naturally occurring and is routinely ingested in food products such as soft drinks. CO2 is also used in packaging for many foods such as salads, potato chips, and cookies.
Design for the Environment (DfE), a cooperative project between the U.S. EPA and the garment and textile care industry, recognizes the CO2 cleaning process as one example of environmentally preferable technology that can effectively clean garments. The DfE conducted a case study on a Micell Technologies, Inc., CO2 system that uses CO2 in conjunction with a cleaning
V-6
agent that enhances the cleaning ability of the liquid CO2. In the case study, Micell Technologies asserts that their cleaning system offers excellent cleaning performance across most garment components and a wide range of stains and soils. This system uses the same beverage-grade bulk CO2 that is distributed to more than 50,000 restaurants and other fountain beverage dispensers located in the United States. (U.S. EPA, 1999) 5. Professional Wet Cleaning
Most detergents used in Professional Wet Cleaning (wet cleaning) are a complex mixture of water and a variety of chemicals. Most formulations are trade secrets. Because there are a wide variety of formulations, there is difficulty with determining toxicity of these substances. Chemicals used in wet cleaning process commonly include spotting agents, detergents, fabric conditioners and sizing products. Other products may be used for cleaning leather and suede including water repellants.
In general, detergents are approved for disposal into the sewer system by
the sanitation districts. U.S. EPA examined the human health and environmental hazards of surfactants because they are the primary components of detergents. In general, they found that there was no expected health risk to the general public. (U.S. EPA, 1998). In addition, the draft report by Institute for Research and Technical Assistance, Evaluation of New and Emerging Technologies for Textile Cleaning, indicates that detergents are low in toxicity (IRTA, 2005).
In U.S. EPA’s Cleaner Technologies Substitute Assessment: Professional Fabricare Processes (CTSA), U.S. EPA provided health hazard summaries on surfactants and surfactant aids for some example detergents. The following surfactants were included in their example detergents: cellulose gum (CG), cocamidopropyl betaine (CAPB), ethoxylated sorbitan monodecanoate (P-20), lauric acid diethanolamide (Lauramide DEA), sodium laureth sulfate (SLS), sodium lauryl isethionate (SLI). Surfactant aids include: acetic acid, citric acid, sodium citrate, and sodium carbonate. It is unknown how representative these example detergents were for detergents currently being used. Below is some health information on some of the surfactant and surfactant aids presented in the CTSA. a. Surfactants
Several studies have been conducted on CG, a water-soluble cellulose ether. This and other water-soluble cellulose ethers exhibit very low oral toxicity, and no neurologic, reproductive, or mutagenic effects. (U.S. EPA, 1998)
CAPB is reported as a potentially irritating substance. CAPB does not
appear to have undergone any studies of reproductive or developmental toxicity or neurotoxicity or chronic studies of systemic effects. Results of one study,
V-7
suggest that CAPB does not increase systemic tumors above background, but are not enough to be conclusive. (U.S. EPA, 1998)
In both animals and humans, P-20 has been found to be essentially
nontoxic following acute and long-term oral ingestion and to exhibit little or no potential for skin irritation and sensitization. (U.S. EPA, 1998)
No human studies were located regarding the potential toxicity of
lauramide DEA following oral or inhalation exposure. Lauramide DEA was not found to be mutagenic. The carcinogenic potential of lauramide DEA is currently being investigated. (U.S. EPA, 1998)
SLS, following oral exposures, was found to be “moderately to slightly
toxic” in acutely exposed animals and virtually non-toxic in chronically exposed animals. SDS does not appear to exhibit any reproductive, developmental, or carcinogenic effects in animals. (U.S. EPA, 1998)
Limited information on SLI suggests that this chemical may not be a skin
irritant and is not mutagenic. (U.S. EPA, 1998)
b. Surfactant Aids
At high concentrations, acetic acid can result in severe irritation in both humans and animals. Based on short-term mutagenicity tests, acetic acid does not interact with genetic material. Although no direct information on the carcinogenicity of acetic acid was located, one chronic study in rats found no evidence of tumors. (U.S. EPA, 1998)
Citric acid is generally considered to be innocuous except in the case of
ingestion of large quantities or chronic exposures. Citric acid has been shown to be a mild to moderate skin and eye irritant in humans following inhalation or dermal exposure. No information has been located discussing neurotoxic, mutagenic, or carcinogenic effects associated with citric acid exposures in animals or humans. Sodium citrate is expected to behave chemically like citric acid systemically, but may not have the irritant properties. (U.S. EPA, 1998)
Sodium carbonate is a skin and eye irritant. Sodium carbonate is not
developmentally toxic to mice, rats, or rabbits. No information was available discussing reproductive, neurotoxic, mutagenic, or carcinogenic toxicity from exposure to humans or animals. (U.S. EPA, 1998) 6. Green Jet
The detergent used in the Green Jet (Green Jet) system is called
DWX-44. The Material Safety Data Sheet (MSDS) states that the product is 100 percent biodegradable. It also states that it contains no petroleum solvents,
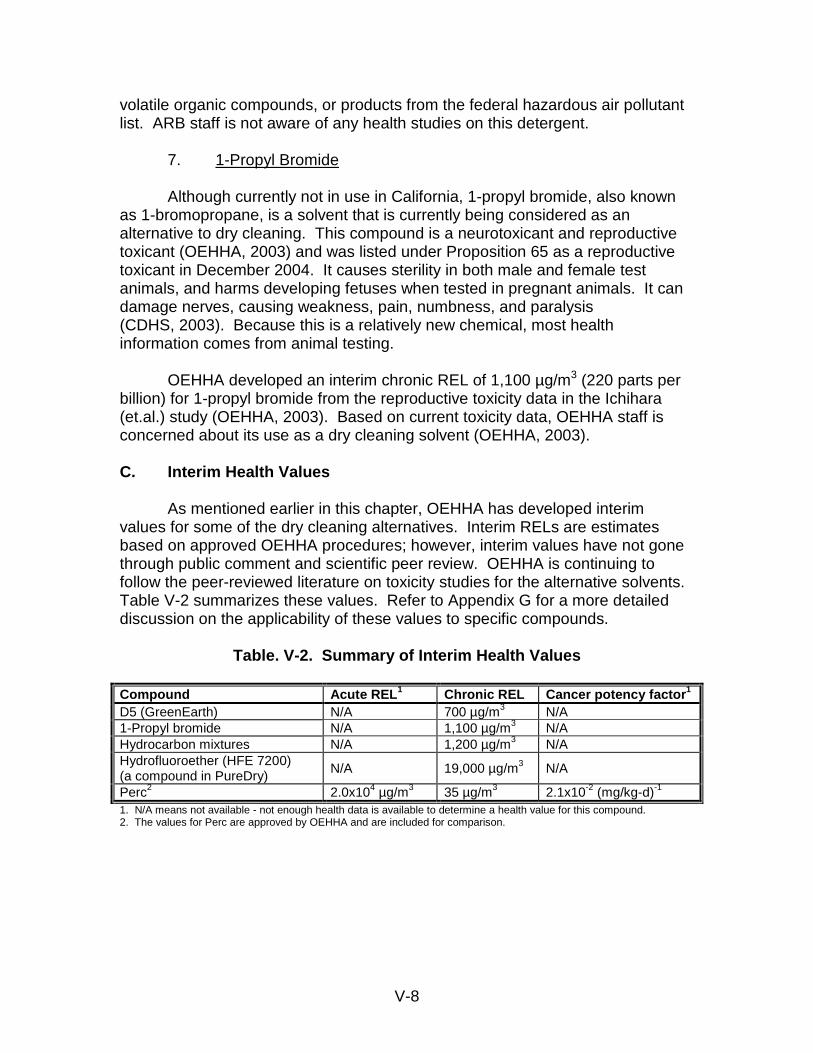
V-8
volatile organic compounds, or products from the federal hazardous air pollutant list. ARB staff is not aware of any health studies on this detergent.
7. 1-Propyl Bromide
Although currently not in use in California, 1-propyl bromide, also known as 1-bromopropane, is a solvent that is currently being considered as an alternative to dry cleaning. This compound is a neurotoxicant and reproductive toxicant (OEHHA, 2003) and was listed under Proposition 65 as a reproductive toxicant in December 2004. It causes sterility in both male and female test animals, and harms developing fetuses when tested in pregnant animals. It can damage nerves, causing weakness, pain, numbness, and paralysis (CDHS, 2003). Because this is a relatively new chemical, most health information comes from animal testing.
OEHHA developed an interim chronic REL of 1,100 µg/m3 (220 parts per billion) for 1-propyl bromide from the reproductive toxicity data in the Ichihara (et.al.) study (OEHHA, 2003). Based on current toxicity data, OEHHA staff is concerned about its use as a dry cleaning solvent (OEHHA, 2003). C. Interim Health Values
As mentioned earlier in this chapter, OEHHA has developed interim values for some of the dry cleaning alternatives. Interim RELs are estimates based on approved OEHHA procedures; however, interim values have not gone through public comment and scientific peer review. OEHHA is continuing to follow the peer-reviewed literature on toxicity studies for the alternative solvents. Table V-2 summarizes these values. Refer to Appendix G for a more detailed discussion on the applicability of these values to specific compounds.
Table. V-2. Summary of Interim Health Values Compound Acute REL1 Chronic REL Cancer potency factor1 D5 (GreenEarth) N/A 700 µg/m3 N/A 1-Propyl bromide N/A 1,100 µg/m3 N/A Hydrocarbon mixtures N/A 1,200 µg/m3 N/A Hydrofluoroether (HFE 7200) (a compound in PureDry)
N/A 19,000 µg/m3 N/A
Perc2 2.0x10⁴ µg/m3 35 µg/m3 2.1x10⁻² (mg/kg-d)-1 1. N/A means not available - not enough health data is available to determine a health value for this compound. 2. The values for Perc are approved by OEHHA and are included for comparison.
VI-1
VI. ENVIRONMENTAL IMPACTS
Several potential environmental impacts have been identified that are associated
with the use of dry cleaning alternatives and perchloroethylene (Perc). This chapter discusses the impacts on wastewater, groundwater contamination, hazardous waste disposal, soil, flammability, energy usage and air pollution.
A. Wastewater
Sanitation districts have been concerned about the amount of chlorinated compounds found in the waste effluent at treatment plants and the potential for illegal disposal of Perc dry cleaning wastes down the sewers. Many treatment plants do not have the equipment necessary to process industrial wastes such as chlorinated solvents that have been detected at elevated levels at some facilities. However, Perc dry cleaners are not expected to significantly add to this burden. The impact of influent concentrations of Perc from the dry cleaning industry appears to be low due to the changes in dry cleaning operations and the implementation of environmental regulations (NC, 2001). Based on information gathered from the Dry Cleaning Facility Survey (Facility Survey), dry cleaning facilities using Perc either use a wastewater treatment unit to recycle their Perc or they have their wastewater picked up by a registered hazardous waste transporter (in California, all hazardous waste must be managed offsite by a transporter that is registered with the California Department of Toxic Substances Control). It should be noted that spotting chemicals can also be a source of Perc.
In general, it is prudent to check with the local publicly owned treatment works in
the State before discharging any wastewater into the sewer. However, potential wastewater impacts of the alternative solvents were assessed based on available information. The carbon dioxide (CO2) cleaning process does not generate wastewater and would not have an impact. Dry cleaners that use other alternative solvents, including GreenEarth (GreenEarth), hydrocarbon, and glycol ether, can release the solvents to water, mainly in separator wastewater. Separator water was analyzed in a project conducted by the Institute for Research and Technical Assistance (IRTA) and the Los Angeles County Sanitation District (LACSD). Separator water from three facilities, each using one of the alternative solvents mentioned, was analyzed for certain metals, toxic organics and aquatic toxicity (IRTA, 2005). In all cases, the metal concentrations and the toxic organic concentrations were below detection limits. Additionally, in all three cases, the separator water did not exhibit aquatic toxicity (IRTA, 2005).
In addition, IRTA and LACSD analyzed the wash and rinse effluents from four
wet cleaning facilities for certain metals, toxic organics, and aquatic toxicity. None of the samples contained metal concentrations that exceeded hazardous waste levels. Perc and/or trichloroethylene (TCE) were found in the effluent from three of the wet cleaning facilities. In some cases, the concentrations of these toxics exceeded
VI-2
hazardous waste levels. The origin of the TCE and at least some of the Perc is most likely spotting chemicals that are used to pre-spot garments. A few of the facilities had both wet cleaning and Perc machines and the Perc may have been entrained in garments cleaned in the wet cleaning machine. The analysis indicated that effluent samples from all four facilities did not exhibit aquatic toxicity despite the presence of Perc and/or TCE. (IRTA, 2005) B. Groundwater Contamination
One of the concerns with the use of Perc is groundwater contamination. Perc is known to pass through porous surfaces, such as building walls, sewer lines, and cement floors (ARB, 1993). Therefore, Perc usage poses a significant threat to the safety of our groundwater. Perc has been detected in both wastewater and groundwater in the South Coast basin, with some levels in excess of the current drinking water standard of five parts per billion (South Coast, 2002). Perc has also been detected in 968 wells or approximately ten percent of the 9,500 wells tested in California as of March 1996, creating a need for an estimated three billion dollar state cleanup (CFCA, 2002). The implementation of environmental regulations and changes in the dry cleaning industry will help minimize the impact on groundwater contamination from Perc.
Based on information available for the alternative solvents, groundwater
contamination is not as large of an issue compared to Perc. When DF-2000™ Fluid (DF-2000) is released into the environment, volatilization from water to the air is calculated to occur in a few days. Non-volatized product in the natural environment will biodegrade at a moderate rate and not persist. (ExxonMobil, 2003) Other high flash point hydrocarbon solvents are expected to behave similarly.
The GreenEarth solvent is unlikely to leach into groundwater because it is not very soluble in water and readily sticks to soil particles (GreenEarth, 2003). Based on conclusive test data with other silicone materials, if spilled on the ground, Decamethylcyclopentasiloxane, or D5, is expected to decompose to carbon dioxide, silicon dioxide (sand), and water. According to a study conducted by the International Fabricare Institute (IFI), GreenEarth solvent has low solubility in water (<100 parts per billion (ppb)) and is very close in density to water; therefore, if it is discharged to water, it will initially form a surface film and then will rapidly evaporate into the air. The half-life for GreenEarth in surface water is estimated at between one to five days. Acute studies with trout, daphnia, and algae show no significant effects at the highest doses prescribed by the test methodology. If larger amounts of GreenEarth solvent are kept in contact with soil, it will also be expected to decompose to carbon dioxide, silicon dioxide (sand), and water. (IFI, 2002) Groundwater contamination is not a concern using the CO2 process. At room temperature, CO2 can exist as a liquid if kept in a closed system at an elevated pressure. The cleaning systems used for CO2 are able to efficiently convert CO2 from a gas to a liquid. One of these systems permits 98 percent of the CO2 to be recycled
VI-3
(U.S. EPA, 1999). In general, only a nominal amount of CO2 is then vented to the atmosphere. Environmental fate on the Rynex™ (Rynex 3) solvent is not readily available, but the Rynex 3 formulation is a type of propylene glycol ether. Proplylene glycol ethers are known to be biodegradable. All propylene glycol ethers are liquid at room temperature and all are water-soluble. Propylene glycol ethers are unlikely to persist in the environment. Two specific types of glycol ethers, proplylene methyl ether and propylene glycol methyl ether acetate, have shown rapid biodegradation in soil. (SIDS, 2003) C. Hazardous Waste
Hazardous waste is regulated in California by a federally authorized State program. Under this program, Perc is classified as hazardous waste. In California, all hazardous waste at a facility must be transported off-site by a registered hazardous waste transporter. In general, it is the facility owner’s responsibility to determine whether the waste from the facility is hazardous.
Waste generated by the use of Perc in dry cleaning includes the still bottoms
from solvent distillation and the spent cartridge filters used to remove lint and insoluble soil from the extracted Perc. Cartridge filters are typically replaced every six months or less, depending on workload and manufacturer recommendation. Reusable spin disc filters are also used and the removed lint and dirt from the spin disc filters generate perc-contaminated waste. (JE, 2004)
According to the Facility Survey the change in the amount of waste generated from hydrocarbon and GreenEarth technologies is relatively small compared to Perc. In terms of waste volume, the CO2 and Rynex 3 cleaning processes are expected to generate the least amount of waste compared to Perc and the other alternative technologies. In general, wastes from the mentioned alternative processes include spent filters and still bottoms. The still bottoms from four dry cleaning facilities that used hydrocarbon, GreenEarth, Rynex 3 and CO2, were analyzed in a study IRTA conducted with LACSD. The results of these tests showed excess levels of lead for one of the still bottom samples and three out of four of the still bottom samples exhibited aquatic toxicity (IRTA, 2005). Because none of the solvents contain lead and are not expected to exhibit aquatic toxicity, the results indicate that the spotting chemicals and detergents used may alter the characteristics of the waste streams. Alternately, waste streams from alternative processes can be handled as hazardous waste. Currently, registered hazardous waste transporters remove the wastes from hydrocarbon dry cleaning facilities as hazardous waste (ARB, 2004i).
The water-based cleaning technologies also generate spent filters. Again, in the
absence of contamination from hazardous compounds, handling as municipal solid waste is an option (JE, 2004). Additionally, the detergents that are used are
VI-4
biodegradable and designed for discharge via the sanitary sewer. These detergents should be readily removed at the local treatment plant (JE, 2004).
D. Soil
Soil contamination has been a problem with Perc use. According to one report, Perc is found in more than 50 percent of the Superfund sites in the country (CFCA, 2002). However, there is always concern of soil contamination in all dry cleaning processes. Soil contamination can occur through accidental releases, such as spills, or during the distillation process from a boil-over. Although federal, state, and local environmental regulations have been developed to help minimize soil contamination, dry cleaners should take all necessary steps to contain spills and clean them up quickly. E. Flammability
Flammable and combustible liquids are listed in different classes. The combustible liquids used in the dry cleaning industry are listed under classifications based on their flash point. Flash point is defined as the temperature at which a flame will ignite the solvent vapors. These combustible liquids are classified as Class II, Class IIIA, or Class IIIB. The use of these combustible liquids may require the issuance of fire permits. Class II liquids, like the Stoddard Solvent (Stoddard), have a flash point at or above 100 degrees Fahrenheit (°F) and below 140°F. Class IIIA liquids have a flash point at or above 140°F and below 200°F. The hydrocarbon solvents are an example of the Class IIIA liquids. Class IIIB liquids, like the Rynex 3 solvent, have a flash point at or above 200°F. Class IV liquids, such as Perc, are considered noncombustible and, therefore, are not potential fire hazards. (JE, 2004)
Stoddard has been a popular dry cleaning solvent that saw a significant usage
decrease based on fire hazard concerns. As mentioned above, this solvent is classified as a Class II liquid and has a flash point of 110°F. This hazard encouraged the petroleum industry to develop a new group of solvents that have a higher flash point. These new solvents are classified as Class IIIA and IIIB liquids and have a flash point above 140°F. It is important to know that these hydrocarbon solvents are still considered hazardous materials by California Occupational Safety and Health Act (CAL/OSHA) standards because they are classified as combustible liquids. This group of solvents includes DF-2000™ Fluid (DF-2000), PureDry (PureDry), Shell Sol 140 HT (Shell 140), and EcoSolv (EcoSolv). DF-2000, with a flash point of 147°F, is currently the most popular hydrocarbon solvent being used. (South Coast, 2002) There are a few other alternative solvents being used in the garment industry today. They are GreenEarth, Rynex 3, and CO2. The GreenEarth solvent is classified as a Class IIIA liquid and has a flash point of 170°F. Like the hydrocarbon solvents, GreenEarth is considered a combustible liquid. Rynex 3, which has a flash point greater than 200°F, is classified as a Class IIIB liquid which is also considered a combustible liquid. (JE, 2004) Based on a study conducted by the North Carolina
VI-5
Department of Environment and Natural Resources, CO2 is a weak solvent; therefore, a detergent mixture is used as a supplement to the base solvent. The detergent mixture contains hydrocarbon chemicals in order to dissolve certain soils. The hydrocarbon compound used in the detergent mixture has a flash point above 140°F and is classified as a Class IIIA liquid. While the CO2/detergent mixture is not expected to be a fire safety hazard, the detergent mixture by itself is a fire safety hazard. (NC, 2001)
The water-based cleaning processes use detergents that are not considered a fire hazard. Therefore, there is no potential flammability risk involved with these processes. For comparison purposes, Table VI-1 below gives you a summary of the flash points and classifications of the commonly used solvents in the dry cleaning industry.
Table VI-1. Summary of Flash Points and Classification
for Commonly Used Solvents1
Solvent Flash Point Classification Perc N/A IV Stoddard 110°F II
DF-2000 147°F IIIA
PureDry2 350°F IIIB/IIIA
Shell 140 >143°F IIIA
EcoSolv >140°F IIIA
Rynex 3 >200°F IIIB
GreenEarth3 170°F IIIA
CO24 N/A N/A
1. Source: Material Safety Data Sheet, unless otherwise noted. 2. Dry cleaners and vendors have reported that the flash point can decline to the 140°F range during use because of the
perfluorocarbon that is in the Pure Dry mixture. If this is the case, it is classified as a IIIA solvent. 3. Source: Cleaners Family, Volume 4. 4. The detergent mixture used as a supplement with the CO2 solvent is a hydrocarbon and is classified as a IIIA solvent,
but when used together with the CO2 it is not considered a fire hazard.
F. Energy Usage
According to a report prepared by Jacobs Engineering for the City of Los Angeles, the overall amount of electricity used by a shop running either a new Perc system or a solvent-based technology (hydrocarbon, GreenEarth, Rynex 3) is about 1,100 Kilowatt-hour (kWh) per month. For water-based technologies, tests conducted by the Pollution Prevention Education and Research Center (PPERC) at a facility that switched from Perc to professional wet cleaning found a reduction in electricity use (to approximately 600 kWh per month). The CO2 system requires a 70 to 150-amp service to operate the refrigeration system necessary to maintain the CO2 in a liquid state. Peak load for the pumps and compressor could be up to 20 kWh. This is twice the peak load reported for the other alternative technologies and it could result in increased peak load demand charges. Therefore, the assumption is made that a CO2 shop will utilize
VI-6
30 percent more power than a shop using Perc. Based on available information, Table VI-2 shows monthly energy usage for Perc dry cleaning and alternatives. (JE, 2004)
Table VI-2. Estimated Monthly Electricity Usage1
Process Electricity Usage (kWh) Perc 1,100 DF-2000 1,100 GreenEarth 1,100 Wet Cleaning 600 CO2 1,430
1. Source: JE, 2004. Chapter VII gives additional information on electricity usage for each machine used in each dry cleaning process. G. Air Pollution
1. Impacts on VOC Emissions and Global Warming Tropospheric ozone (“bad” ozone) formation requires a mix of ozone-forming chemicals, also known as volatile organic compounds (VOCs), nitrogen oxides, oxygen, and sunlight. Any reduction in VOC emissions is expected to provide a beneficial environmental impact on air quality by reducing tropospheric ozone formation. The hydrocarbon solvents and the Rynex 3 solvent are classified as VOCs. An increase in the usage of these solvents may cause an environmental impact. For example, if the industry was to switch to the whole hydrocarbon dry cleaning process there would be a significant increase of about 1.7 tons per day of VOCs Statewide. Greenhouse gases alter the amount of heat, or infrared radiation, that can escape the Earth’s surface and have been linked to a gradual warming of the Earth’s surface and lower atmosphere. While CO2 has been the traditional focus of greenhouse gas concerns, the CO2 used in the dry cleaning process is an industrial by-product from other industrial operations and does not contribute to global warming. In the United States, the largest source of greenhouse gas emissions is from fossil fuel combustion, which accounted for approximately 81 percent of greenhouse emissions in 1996. (JE, 2004)
2. Workplace Exposure CAL/OSHA regulates the concentration of many toxic air contaminants and VOCs in the workplace environment. CAL/OSHA has established a permissible exposure limit (PEL) for several of these compounds (the PEL is the maximum, eight-hour, time-weighted average concentration for occupational exposure). Perc has
VI-7
a PEL of 25 parts per million (ppm) and Stoddard has a PEL of 100 ppm. Although the remaining solvents do not have PELs, Table VI-3 gives a summary of any known acute and chronic health impacts.
Table VI-3. Potential Health Impacts and Permissible Exposure Limit (PEL)
Solvent Acute Chronic PEL
Perc central nervous system; irritation to eyes, skin, and respiratory tract
kidney, liver, and gastrointestinal system
25 ppm
Stoddard central nervous system; irritation to eyes, skin, nose, and throat1
Unknown 100 ppm
DF-2000 central nervous system; irritation to eyes, skin, and respiratory tract2
unknown N/A
PureDry central nervous system; irritation to eyes, skin, nose, throat, and
respiratory tract2
unknown N/A
EcoSolv central nervous system; irritation to eyes, skin, and respiratory tract2
unknown N/A
Shell 140 central nervous system; irritation to skin, nose, throat, and respiratory
tract2
unknown N/A
GreenEarth (D5) mild eye irritation increase in liver weight3 N/A Rynex 3 headaches; irritation to eyes, nose,
and throat1 unknown N/A
CO2 irritation to skin and eyes,4 frostbite5 unknown N/A 1. Source: U.S. EPA, 1998. 2. Information taken from Material Safety Data Sheets. 3. See Appendix G. 4. Due to exposure to detergents used with the CO2 process. 5. Due to exposure to liquid CO2.
VII - 1
VII. COST ESTIMATION
The data used in the cost analysis of the various dry cleaning processes was based on information collected from equipment manufacturers and distributors as well as from publicly available information. The categories covered in this analysis include estimates on the cost of machines, operation, installation, leak detectors, and control technology. A. Machine Cost
Estimated machine costs are based on the Machine Manufacturers Survey and are presented in Table VII-1. As there are a variety of sizes and models that affect the actual price of each machine, costs are given in ranges for each technology.
Table VII-1. Summary of Machine Cost from Survey1
Solvent Type Machine Type Rated Capacity (lbs)
Cycle Time
(minutes) List Price ($)2
Water (wet cleaning)
Washer (soft mount) 15-42 12-35 8,800-30,400
Water (wet cleaning)
Washer (hard mount) 20-85 12-35 8,700-23,300
Water (wet cleaning Dryer 15-135 12-30 2,100-12,900
Water (Green Jet) Dry-to-Dry 45 32 30,000 Perc Secondary Control 35-90 45-55 38,000-83,000
Hydrocarbon Dry-to-Dry 30-90 45-60 36,000-98,000 Stoddard Solvent Transfer 50-110 40 29,000-40,000 Stoddard Solvent Dryer/Claimer 55-110 55 29,000-35,000
GreenEarth3 Dry-to-Dry 35-90 45-60 43,000-98,000 CO2
4 Dry-to-Dry 60 35-40 140,000 1. From Machine Manufacturers Survey, unless otherwise noted. 2. This reflects manufacture list price, machines can cost less. Also, does not include installation costs. 3. This does not include the annual GreenEarth “Affiliation Fee.” 4. Source: ARB, 2005c.
Professional wet cleaning (wet cleaning) systems consist of a separate washer and dryer and require tensioning equipment. The two most common tensioning equipment pieces used are the form finisher, with an average cost of $11,000, and the pants topper, with an average cost of approximately $9,900 (PPERC, 2004). When selecting a wet cleaning washer, a dry cleaner needs to choose between a hard mount washer and a soft mount washer. Hard mount washers are less expensive than soft mount washers, but require a custom concrete foundation and are not suitable for
VII - 2
upper-floor or above-basement installations (PPERC, 2004). According to the Machine Manufacturers Survey a 35-pound soft mount washer is approximately $15,100 whereas a 40-pound hard mount washer is about $14,200. The cost of a wet cleaning dryer with a 50-pound capacity is estimated at $4,500. Dry cleaners can expect to pay between $39,600 and $40,500 for a “typical” wet cleaning system (including tensioning equipment). Costs will be higher if a larger capacity washer or dryer is selected.
The Green Jet (Green Jet) system uses one piece of equipment for cleaning and drying. According to the Machine Manufacturers Survey the cost of the machine is $30,000 for a 45-pound capacity. This process does not require tensioning equipment because it intermittently rotates the garments to minimize shrinkage (as well as wrinkles) at the end of the cleaning cycle.
The GreenEarth (GreenEarth) dry cleaning machines with the capacity range of
35-pounds to 90-pounds are list priced at $43,000 to $98,000 according to the Machine Manufacturers Survey. There is also an annual GreenEarth “Affiliation Fee” of $2,500 per machine. If a facility has more than one machine, there is an annual “Affiliation Fee” of $1,250 for each additional machine. (ARB, 2005d)
According to the Dry Cleaning Facility Survey (Facility Survey) results, a typical
perchloroethylene (Perc) dry cleaning facility has an average machine capacity of 40 to 45 pounds. If a Perc machine were to be replaced with an alternative dry cleaning machine, it would typically be replaced with a slightly larger machine. Table VII-2 gives a cost comparison of Perc secondary control machines and the alternatives, including hydrocarbon, GreenEarth, water-based cleaning, and carbon dioxide (CO2).
Also shown on Table VII-2 are installation costs. The cost of installation varies
according to the machine type. A Perc dry cleaning machine can be installed for $2,500 to $3,000 unless the facility needs to have a chiller or water tower included in the installation. If this were the case, the installation cost would range from $3,000 to $5,000. The installation cost for a hydrocarbon machine and a GreenEarth machine is basically the same. The installation cost range for these two types of machines is $5,000 to $6,000. The current installation cost for a CO2 machine with a chiller is $50,000. As for wet cleaning, the installation cost for a complete wet cleaning process will range from $2,000 to 2,500. If a facility owner is replacing just one piece of equipment (e.g. the washer), the installation cost will be about $750 per piece. There is an increase in cost if the owner chooses to relocate the piece of equipment within the facility. If this were the case, this “relocation” cost would be $850 per piece. This increased cost is due to the installation of new lines and traps. (ARB, 2004a; ARB, 2004b; ARB, 2005c)
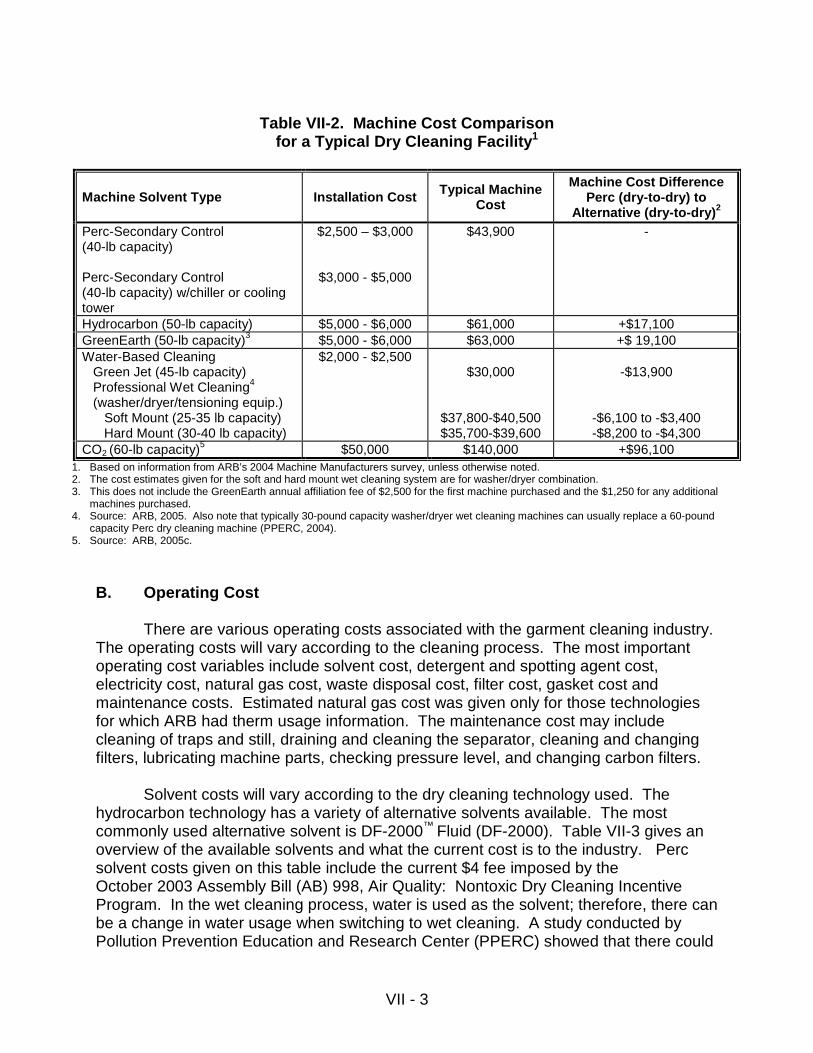
VII - 3
Table VII-2. Machine Cost Comparison
for a Typical Dry Cleaning Facility1
Machine Solvent Type Installation Cost Typical Machine Cost
Machine Cost Difference Perc (dry-to-dry) to
Alternative (dry-to-dry)2 Perc-Secondary Control (40-lb capacity) Perc-Secondary Control (40-lb capacity) w/chiller or cooling tower
$2,500 – $3,000
$3,000 - $5,000
$43,900 -
Hydrocarbon (50-lb capacity) $5,000 - $6,000 $61,000 +$17,100 GreenEarth (50-lb capacity)3 $5,000 - $6,000 $63,000 +$ 19,100 Water-Based Cleaning Green Jet (45-lb capacity) Professional Wet Cleaning4 (washer/dryer/tensioning equip.) Soft Mount (25-35 lb capacity) Hard Mount (30-40 lb capacity)
$2,000 - $2,500
$30,000
$37,800-$40,500 $35,700-$39,600
-$13,900
-$6,100 to -$3,400 -$8,200 to -$4,300
CO2 (60-lb capacity)5 $50,000 $140,000 +$96,100 1. Based on information from ARB’s 2004 Machine Manufacturers survey, unless otherwise noted. 2. The cost estimates given for the soft and hard mount wet cleaning system are for washer/dryer combination. 3. This does not include the GreenEarth annual affiliation fee of $2,500 for the first machine purchased and the $1,250 for any additional
machines purchased. 4. Source: ARB, 2005. Also note that typically 30-pound capacity washer/dryer wet cleaning machines can usually replace a 60-pound
capacity Perc dry cleaning machine (PPERC, 2004). 5. Source: ARB, 2005c.
B. Operating Cost There are various operating costs associated with the garment cleaning industry. The operating costs will vary according to the cleaning process. The most important operating cost variables include solvent cost, detergent and spotting agent cost, electricity cost, natural gas cost, waste disposal cost, filter cost, gasket cost and maintenance costs. Estimated natural gas cost was given only for those technologies for which ARB had therm usage information. The maintenance cost may include cleaning of traps and still, draining and cleaning the separator, cleaning and changing filters, lubricating machine parts, checking pressure level, and changing carbon filters.
Solvent costs will vary according to the dry cleaning technology used. The
hydrocarbon technology has a variety of alternative solvents available. The most commonly used alternative solvent is DF-2000™ Fluid (DF-2000). Table VII-3 gives an overview of the available solvents and what the current cost is to the industry. Perc solvent costs given on this table include the current $4 fee imposed by the October 2003 Assembly Bill (AB) 998, Air Quality: Nontoxic Dry Cleaning Incentive Program. In the wet cleaning process, water is used as the solvent; therefore, there can be a change in water usage when switching to wet cleaning. A study conducted by Pollution Prevention Education and Research Center (PPERC) showed that there could
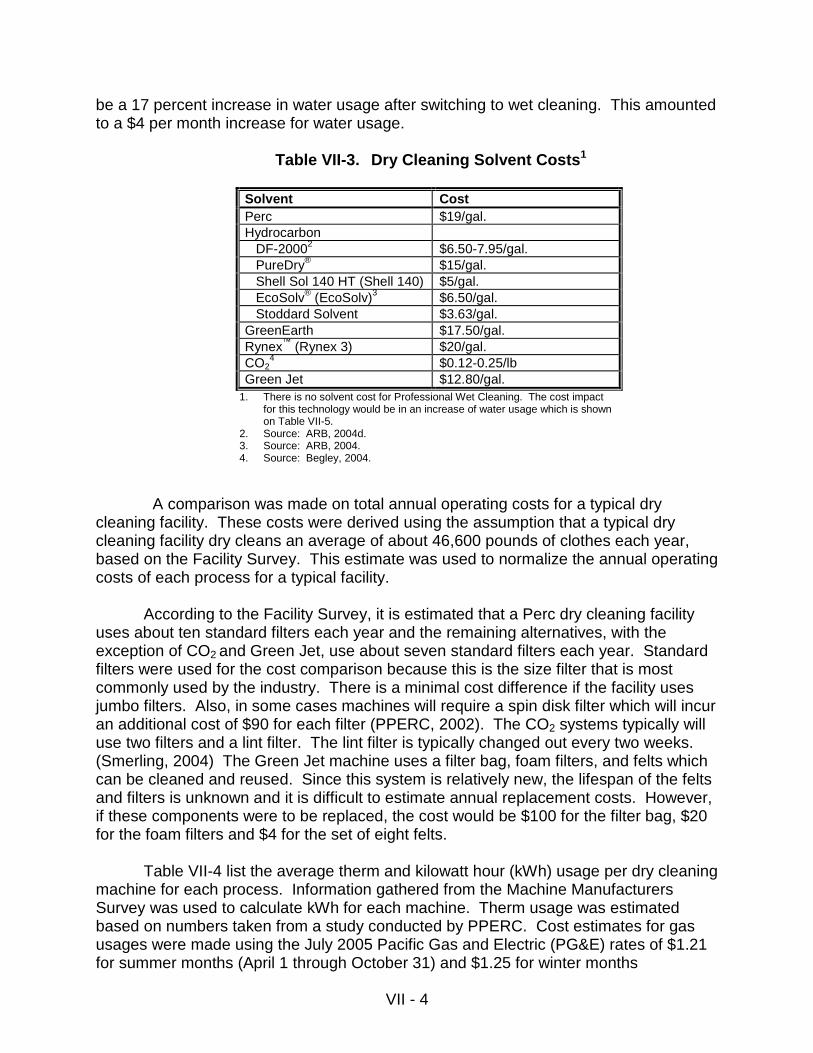
VII - 4
be a 17 percent increase in water usage after switching to wet cleaning. This amounted to a $4 per month increase for water usage.
Table VII-3. Dry Cleaning Solvent Costs1
Solvent Cost Perc $19/gal. Hydrocarbon DF-20002 $6.50-7.95/gal. PureDry® $15/gal. Shell Sol 140 HT (Shell 140) $5/gal. EcoSolv® (EcoSolv)3 $6.50/gal. Stoddard Solvent $3.63/gal. GreenEarth $17.50/gal. Rynex™ (Rynex 3) $20/gal. CO2
4 $0.12-0.25/lb Green Jet $12.80/gal.
1. There is no solvent cost for Professional Wet Cleaning. The cost impact for this technology would be in an increase of water usage which is shown on Table VII-5.
2. Source: ARB, 2004d. 3. Source: ARB, 2004. 4. Source: Begley, 2004.
A comparison was made on total annual operating costs for a typical dry
cleaning facility. These costs were derived using the assumption that a typical dry cleaning facility dry cleans an average of about 46,600 pounds of clothes each year, based on the Facility Survey. This estimate was used to normalize the annual operating costs of each process for a typical facility.
According to the Facility Survey, it is estimated that a Perc dry cleaning facility
uses about ten standard filters each year and the remaining alternatives, with the exception of CO2 and Green Jet, use about seven standard filters each year. Standard filters were used for the cost comparison because this is the size filter that is most commonly used by the industry. There is a minimal cost difference if the facility uses jumbo filters. Also, in some cases machines will require a spin disk filter which will incur an additional cost of $90 for each filter (PPERC, 2002). The CO2 systems typically will use two filters and a lint filter. The lint filter is typically changed out every two weeks. (Smerling, 2004) The Green Jet machine uses a filter bag, foam filters, and felts which can be cleaned and reused. Since this system is relatively new, the lifespan of the felts and filters is unknown and it is difficult to estimate annual replacement costs. However, if these components were to be replaced, the cost would be $100 for the filter bag, $20 for the foam filters and $4 for the set of eight felts.
Table VII-4 list the average therm and kilowatt hour (kWh) usage per dry cleaning
machine for each process. Information gathered from the Machine Manufacturers Survey was used to calculate kWh for each machine. Therm usage was estimated based on numbers taken from a study conducted by PPERC. Cost estimates for gas usages were made using the July 2005 Pacific Gas and Electric (PG&E) rates of $1.21 for summer months (April 1 through October 31) and $1.25 for winter months
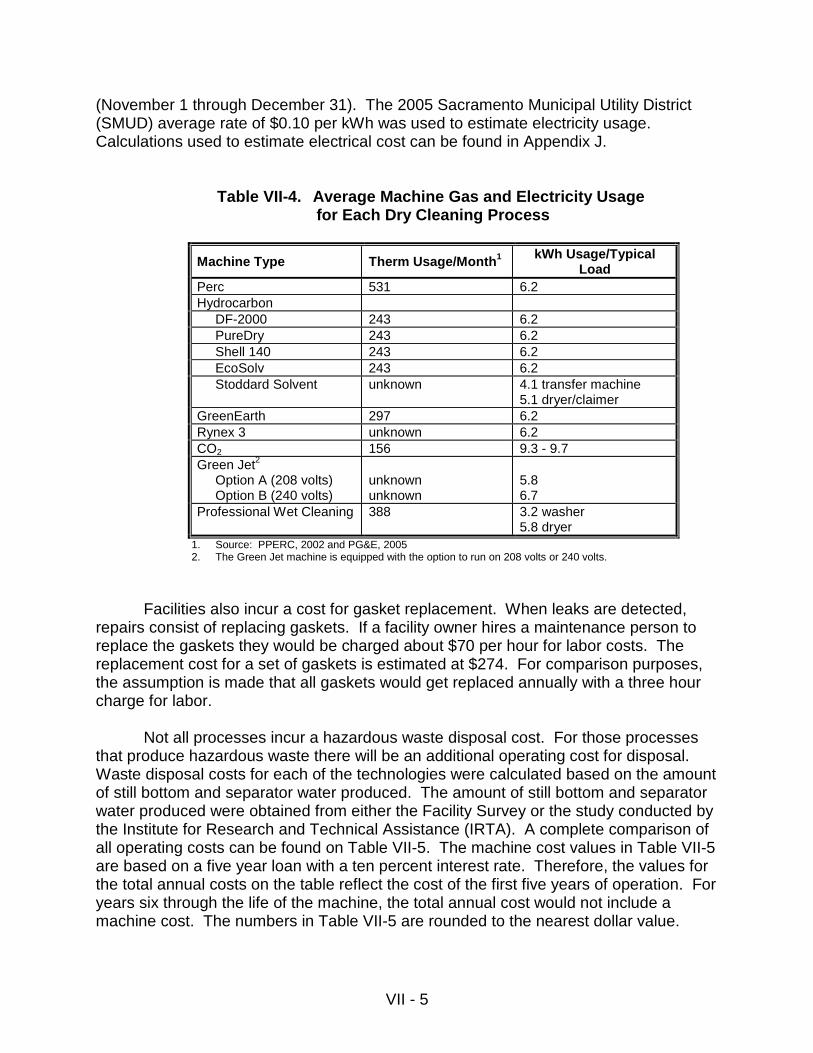
VII - 5
(November 1 through December 31). The 2005 Sacramento Municipal Utility District (SMUD) average rate of $0.10 per kWh was used to estimate electricity usage. Calculations used to estimate electrical cost can be found in Appendix J.
Table VII-4. Average Machine Gas and Electricity Usage for Each Dry Cleaning Process
Machine Type Therm Usage/Month1 kWh Usage/Typical Load
Perc 531 6.2 Hydrocarbon DF-2000 243 6.2 PureDry 243 6.2 Shell 140 243 6.2 EcoSolv 243 6.2 Stoddard Solvent unknown 4.1 transfer machine
5.1 dryer/claimer GreenEarth 297 6.2 Rynex 3 unknown 6.2 CO2 156 9.3 - 9.7 Green Jet2 Option A (208 volts) Option B (240 volts)
unknown unknown
5.8 6.7
Professional Wet Cleaning 388 3.2 washer 5.8 dryer
1. Source: PPERC, 2002 and PG&E, 2005 2. The Green Jet machine is equipped with the option to run on 208 volts or 240 volts.
Facilities also incur a cost for gasket replacement. When leaks are detected, repairs consist of replacing gaskets. If a facility owner hires a maintenance person to replace the gaskets they would be charged about $70 per hour for labor costs. The replacement cost for a set of gaskets is estimated at $274. For comparison purposes, the assumption is made that all gaskets would get replaced annually with a three hour charge for labor.
Not all processes incur a hazardous waste disposal cost. For those processes
that produce hazardous waste there will be an additional operating cost for disposal. Waste disposal costs for each of the technologies were calculated based on the amount of still bottom and separator water produced. The amount of still bottom and separator water produced were obtained from either the Facility Survey or the study conducted by the Institute for Research and Technical Assistance (IRTA). A complete comparison of all operating costs can be found on Table VII-5. The machine cost values in Table VII-5 are based on a five year loan with a ten percent interest rate. Therefore, the values for the total annual costs on the table reflect the cost of the first five years of operation. For years six through the life of the machine, the total annual cost would not include a machine cost. The numbers in Table VII-5 are rounded to the nearest dollar value.
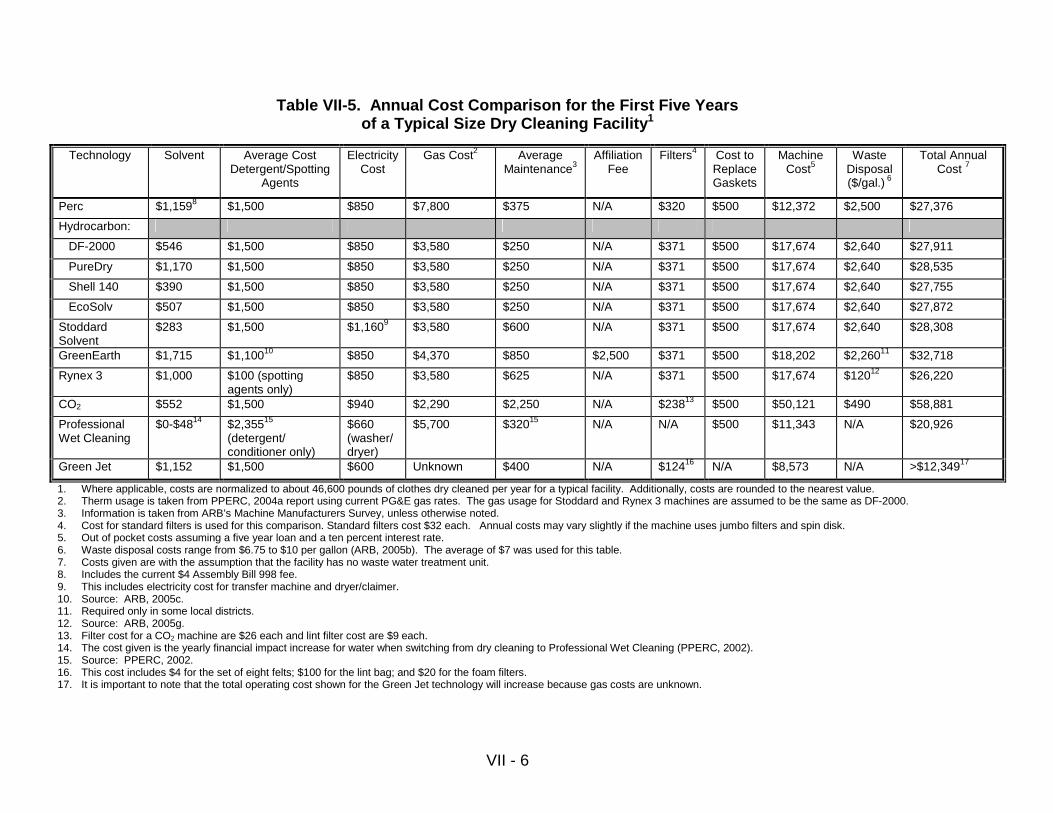
VII - 6
Table VII-5. Annual Cost Comparison for the First Five Years of a Typical Size Dry Cleaning Facility1
1. Where applicable, costs are normalized to about 46,600 pounds of clothes dry cleaned per year for a typical facility. Additionally, costs are rounded to the nearest value. 2. Therm usage is taken from PPERC, 2004a report using current PG&E gas rates. The gas usage for Stoddard and Rynex 3 machines are assumed to be the same as DF-2000. 3. Information is taken from ARB’s Machine Manufacturers Survey, unless otherwise noted. 4. Cost for standard filters is used for this comparison. Standard filters cost $32 each. Annual costs may vary slightly if the machine uses jumbo filters and spin disk. 5. Out of pocket costs assuming a five year loan and a ten percent interest rate. 6. Waste disposal costs range from $6.75 to $10 per gallon (ARB, 2005b). The average of $7 was used for this table. 7. Costs given are with the assumption that the facility has no waste water treatment unit. 8. Includes the current $4 Assembly Bill 998 fee. 9. This includes electricity cost for transfer machine and dryer/claimer. 10. Source: ARB, 2005c. 11. Required only in some local districts. 12. Source: ARB, 2005g. 13. Filter cost for a CO2 machine are $26 each and lint filter cost are $9 each. 14. The cost given is the yearly financial impact increase for water when switching from dry cleaning to Professional Wet Cleaning (PPERC, 2002). 15. Source: PPERC, 2002. 16. This cost includes $4 for the set of eight felts; $100 for the lint bag; and $20 for the foam filters. 17. It is important to note that the total operating cost shown for the Green Jet technology will increase because gas costs are unknown.
Technology Solvent
Average Cost Detergent/Spotting
Agents
Electricity Cost
Gas Cost2 Average Maintenance3
Affiliation Fee
Filters4 Cost to Replace Gaskets
Machine Cost5
Waste Disposal ($/gal.) 6
Total Annual Cost 7
Perc $1,1598 $1,500 $850 $7,800 $375 N/A $320 $500 $12,372 $2,500 $27,376
Hydrocarbon:
DF-2000 $546 $1,500 $850 $3,580 $250 N/A $371 $500 $17,674 $2,640 $27,911
PureDry $1,170 $1,500 $850 $3,580 $250 N/A $371 $500 $17,674 $2,640 $28,535
Shell 140 $390 $1,500 $850 $3,580 $250 N/A $371 $500 $17,674 $2,640 $27,755
EcoSolv $507 $1,500 $850 $3,580 $250 N/A $371 $500 $17,674 $2,640 $27,872
Stoddard Solvent
$283 $1,500 $1,1609 $3,580 $600 N/A $371 $500 $17,674 $2,640 $28,308
GreenEarth $1,715 $1,10010 $850 $4,370 $850 $2,500 $371 $500 $18,202 $2,26011 $32,718
Rynex 3 $1,000 $100 (spotting agents only)
$850 $3,580 $625 N/A $371 $500 $17,674 $12012 $26,220
CO2 $552 $1,500 $940 $2,290 $2,250 N/A $23813 $500 $50,121 $490 $58,881
Professional Wet Cleaning
$0-$4814 $2,35515 (detergent/ conditioner only)
$660 (washer/ dryer)
$5,700 $32015 N/A N/A $500 $11,343 N/A $20,926
Green Jet $1,152 $1,500 $600 Unknown $400 N/A $12416 N/A $8,573 N/A >$12,34917
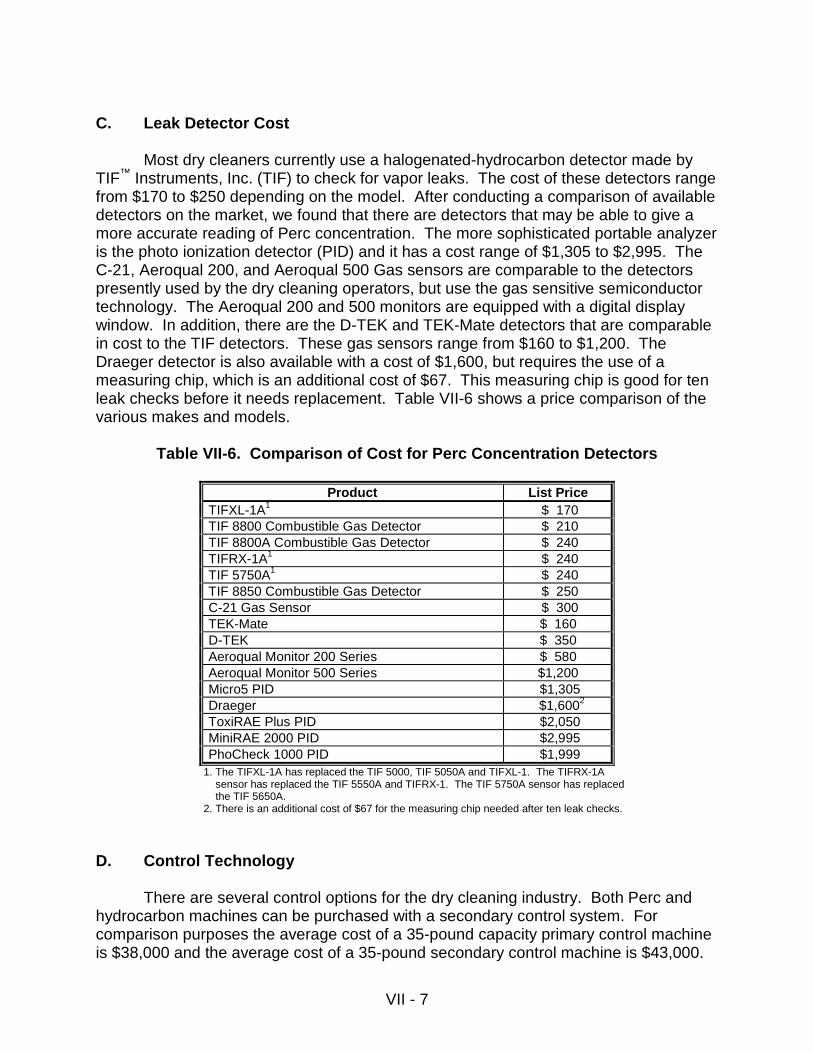
VII - 7
C. Leak Detector Cost
Most dry cleaners currently use a halogenated-hydrocarbon detector made by TIF™ Instruments, Inc. (TIF) to check for vapor leaks. The cost of these detectors range from $170 to $250 depending on the model. After conducting a comparison of available detectors on the market, we found that there are detectors that may be able to give a more accurate reading of Perc concentration. The more sophisticated portable analyzer is the photo ionization detector (PID) and it has a cost range of $1,305 to $2,995. The C-21, Aeroqual 200, and Aeroqual 500 Gas sensors are comparable to the detectors presently used by the dry cleaning operators, but use the gas sensitive semiconductor technology. The Aeroqual 200 and 500 monitors are equipped with a digital display window. In addition, there are the D-TEK and TEK-Mate detectors that are comparable in cost to the TIF detectors. These gas sensors range from $160 to $1,200. The Draeger detector is also available with a cost of $1,600, but requires the use of a measuring chip, which is an additional cost of $67. This measuring chip is good for ten leak checks before it needs replacement. Table VII-6 shows a price comparison of the various makes and models.
Table VII-6. Comparison of Cost for Perc Concentration Detectors
Product List Price TIFXL-1A1 $ 170 TIF 8800 Combustible Gas Detector $ 210 TIF 8800A Combustible Gas Detector $ 240 TIFRX-1A1 $ 240 TIF 5750A1 $ 240 TIF 8850 Combustible Gas Detector $ 250 C-21 Gas Sensor $ 300 TEK-Mate $ 160 D-TEK $ 350 Aeroqual Monitor 200 Series $ 580 Aeroqual Monitor 500 Series $1,200 Micro5 PID $1,305 Draeger $1,6002 ToxiRAE Plus PID $2,050 MiniRAE 2000 PID $2,995 PhoCheck 1000 PID $1,999
1. The TIFXL-1A has replaced the TIF 5000, TIF 5050A and TIFXL-1. The TIFRX-1A sensor has replaced the TIF 5550A and TIFRX-1. The TIF 5750A sensor has replaced the TIF 5650A.
2. There is an additional cost of $67 for the measuring chip needed after ten leak checks.
D. Control Technology
There are several control options for the dry cleaning industry. Both Perc and hydrocarbon machines can be purchased with a secondary control system. For comparison purposes the average cost of a 35-pound capacity primary control machine is $38,000 and the average cost of a 35-pound secondary control machine is $43,000.
VII - 8
Secondary control can be added to an existing machine with primary control for about $6,000. However, these retrofits do not typically perform as well as machines with secondary control installed at the factory (ARB, 2004b). Spin disks are also used as secondary control and can also be added on to a machine. The 1998 and newer machines are equipped with convertible filters, which means that the housing can be changed from cartridge to spin disk. The cost for this would be under $1,000, but for machines older than 1998 it would most likely be more (ARB, 2004b).
Some local air districts require dry cleaning facilities to install room enclosures with ventilation systems. In a July 2000 report prepared by ATC Associates, Inc. (AVES) for the ARB, costs associated with room enclosures were identified. There are three different types of enclosure/ventilation systems: vapor barrier rooms (VBRs), partial vapor barrier rooms (PVRs), and local ventilation systems (LOCs). The capital costs between the three different types vary according to the size of the machine and how the machine is constructed and installed. Some rooms may need to be custom built to fit in a corner of a room or as a stand-alone structure. Cost of construction will vary due to dry cleaner’s needs and local air district requirements. Construction may include walls or the installation of a blower, exhaust system, foil, or fan. AVES contacted several construction companies and found that VBR construction varies between $5,300 to $8,500. The construction of a PVR would cost about $4,800, and the LOC would be about $3,100 to $4,300. (AVES, 2000; BLS, 2004)
VIII-1
VIII. EFFICACY EVALUATION Efficacy, or the ability to effectively clean clothes, is an important factor to consider when considering dry cleaning alternatives. Properties to consider include: cleaning ability, evaporation rate, and ease of purification through distillation. The solvent should not cause fabric to unnecessarily fade, shrink, weaken, or bleed color, and should be compatible with detergents.
The overall cleaning ability of a process depends on soil chemistry, textile fabric type, transport medium (aqueous vs. non-aqueous), chemistry of the additives (detergents, surfactants), the use of spotting agents, and process considerations (e.g., time, temperature, and mechanical actions) (U.S. EPA, 1998). Over 95 percent of all the soils are water soluble (Cleaners Family, 2004). The Kauri Butanol (KB) number is used to estimate the degreasing efficiency or cleaning ability of a solvent. High KB values generally indicate a strong cleaning ability, whereas a low KB value indicates a weaker cleaning ability. Higher KB values are usually more efficient in removing oil and grease stains, but a lower KB value may be safer on some dyes, adhesives, and trim fabrics. Therefore, a solvent with a high KB value may not be suitable for all applications. Table VIII-1 on page VIII-4 lists KB values and summarizes cleaning performance for perchloroethylene (Perc) and the alternatives. A. Hydrocarbon Solvent Cleaning
Typically, solvents are more effective in cleaning oil stains, and water-based chemicals are more effective in cleaning sugar, salt, and perspiration stains. The cleaning process can be enhanced with the use of spotting agents, alternative detergents, surfactant additives, and other process modifications such as cleaning time, temperature, or mechanical action (U.S. EPA, 1998). With the use of specially formulated detergents it is believed that hydrocarbon solvents have a cleaning capability almost equal to Perc.
Hydrocarbon solvents include: DF-2000™ Fluid (DF-2000), PureDry (PureDry), Stoddard, EcoSolv (EcoSolv) and Shell SOL 140 HT (Shell 140). Many operators who have switched from Perc to hydrocarbon solvents have reported that fabrics come out fresher with no odor and that they could clean a wide range of items. Some operators have complained that clothes feel oily; however, that could be due to improper drying. Some users also report that the clothes felt softer, were easier to press, and have a better finish than clothes cleaned in Perc. (JE, 2004)
PureDry is a blend of isoparaffinic hydrocarbon with a chemical additive produced
by 3M. Efficacy testing for PureDry was done at Walt Disney World Textile Services. The clothes were cleaned to exceptional standards and without residual solvent odor in the finished garment (JE, 2004).
VIII-2
B. Rynex™ The Air Resources Board (ARB) staff was not able to locate any independent
efficacy testing for Rynex™ (Rynex 3). However, the manufacturer claims that Rynex 3 is a superior, gentle cleaner (when compared to Perc) that can handle a wide variety of fabrics. The manufacturer has indicated that Rynex 3 has been field tested and has determined that it has outstanding cleaning properties and removes more stains during normal cycling so that less pre- and post-spotting is required. They also claim that it removes water soluble stains better than other solvents (Rynex, 2005). These claims, however, have not been verified with independent testing.
C. Water-based Cleaning Systems
Several tests have been conducted on water-based cleaning systems. In 1999, the Pollution Prevention Education and Research Center (PPERC) published a study on the performance evaluation of a facility converting from Perc dry cleaning to Professional Wet Cleaning (wet cleaning). The performance evaluation showed that over 99.5 percent of the garments that would have been dry cleaned were able to be wet cleaned. Claims for ruined garments were the same for both Perc dry cleaning and wet cleaning. Although the rate for additional work (redos) initially increased when the facility switched to wet cleaning, the rate dropped after a three-month transition period (PPERC, 1999). This may indicate that operator training has a considerable impact on the reported efficacy of this technology.
In 2003, the PPERC published an assessment of the Green Jet (Green Jet)
System. The assessment consisted of interviews and site visits with facility owners using Green Jet. Several advantages and disadvantages were identified. The shop owner indicated that the advantages of the system were that Green Jet did not require as much experience or skill as the hydrocarbon equipment and that there was minimum wrinkling and shrinkage. Some of the disadvantages pointed out by the owner were that: 1) stain removal was difficult; 2) heavily soiled garments could not be processed; and, 3) additional technology was required for garments with a high level of oil or water based stains, or for heavily soiled items. Overall, the assessment indicated that although Green Jet does a good job removing surface soils, it may need to be supplemented by another cleaning system to handle the full range of textiles, particularly in situations where heavily-soiled garments need to be processed. (PPERC, 2003) D. Carbon Dioxide Cleaning
Although ARB staff was not able to locate any independent efficacy testing on CO2 cleaning, one CO2 machine manufacturer performed testing that was published by the United States Environmental Protection Agency’s (U.S. EPA) Design for the Environment. Design for the Environment is a cooperative project between U.S. EPA and the garment and textile care industry garment and textile care partnership. One advantage, according to the manufacturer, is that the color retention can meet or
VIII-3
exceed that of Perc dry cleaning. One exception to this is certain triacetate and acetate fabrics with specific yellow dispersive dyes. There was some shrinkage for garments that were triacetate-based only. However, these garments are quite rare. Triacetate based garments may be better handled by professional wet cleaning. (U.S. EPA, 1999)
E. GreenEarth
The International Fabricare Institute (IFI) conducted testing on the efficacy of
GreenEarth (GreenEarth) solvent under a contract to GreenEarth (IFI, 2002). This solvent contains decamethylcyclopentasiloxane (D5), which is the primary cleaning agent in GreenEarth. GreenEarth was ranked in several different categories including: cleaning performance, the ability to handle garments that dry cleaners currently process, affordability, capital costs, health issues, and contamination issues.
Based on the testing, IFI concluded that stain removal was comparable to Perc,
although not quite as effective in removing solvent soluble stains. For the purpose of the testing, solvent soluble stains included ball point ink, vegetable oil, and shoe polish. Overall, IFI found that GreenEarth cleaning is a viable alternative to Perc.
Table VIII-1 on the following page lists KB values and summarizes cleaning
performance for Perc and the alternatives.
VIII-4
Table. VIII-1. Summary of KB Values and Cleaning Performance of Dry Cleaning Solvents
Solvent KB Value Cleaning Performance Perc 92 Oil-based stains, most
water-based stains, silks, wools, rayons. Not good for delicates.
Stoddard 32-39 Less aggressive than Perc for oil-based stains. Can handle
delicate garments. PureDry 37-40 Less aggressive than Perc for oil-
based stains. Can handle delicate garments.
Shell 140 N/A Less aggressive than Perc for oil-based stains. Can handle
delicate garments. EcoSolv 26-27 Less aggressive than Perc for oil-
based stains. Can handle delicate garments.
DF-2000 27 Less aggressive than Perc for oil-based stains. Can handle
delicate garments Green Jet (DWX-44 detergent)
N/A Less aggressive than Perc. More effective in cleaning sugar, salt, perspiration stains. Good
for delicates. Not good for heavily soiled garments.
Rynex 3 70 Aggressive, cleans water-soluble and oil-based stains.
GreenEarth <20 Less aggressive than Perc for oil-based stains. Good for
water-based stains, delicates. CO2 <101 Good for all stains and most
fabrics. Very effective in removing oils, greases, sweats.
Wet cleaning N/A Aggressive, good for both oil and water-based stains. Can handle
delicate garments. 1. KB value depends on machine. Lowering temperature provides for a higher KB value.
IX-1
IX. REFERENCES ARB, 1993. Staff Report: Proposed Airborne Toxic Control Measure and Proposed Environmental Training Program for Perchloroethylene Dry Cleaning Operations. California Air Resources Board, August 27, 1993. ARB, 1993a. Technical Support Document: Proposed Airborne Toxic Control Measure and Proposed Environmental Training Program for Perchloroethylene Dry Cleaning Operations, California Air Resources Board, August 27, 1993. ARB, 1996. Curriculum for the Environmental Training Program for Perchloroethylene Dry Cleaning Operations, California Air Resources Board, April 1996. ARB, 1997. Toxic Air Contaminant Identification List – Summaries, California Air Resources Board, September 1997. ARB, 2003. Dry Cleaning ATCM Evaluation Workgroup Meeting, July 10, 2003. ARB, 2004. E-mail from Greg Collins, Chevron Phillips Chemical Company to Sonia Villalobos, ARB, August 16, 2004. ARB, 2004a. Dry Cleaning ATCM Evaluation Workgroup Meeting, September 21, 2004. ARB, 2004b. E-mails from Kelly Kelleher, Kelleher Equipment to Sonia Villalobos, ARB, October 2004. ARB, 2004c. CAPCOA Enforcement Manager's Meeting, April 15, 2004. ARB, 2004d. Telephone conversation with Workgroup Supply representative and Sonia Villalobos, ARB, 2004. ARB, 2004e. E-mail from Dr. Nancy W. Eilerts, Chevron Philips Chemical Company to Mei Fong, ARB, January 2004. ARB, 2004f. Feori Wet Cleaning System brochure from Future Clean U.S.A. ARB, 2004g. Resolve Drycleaning System company presentation, summary document for U.S. EPA and an e-mail from Eileen Sheehan, U.S. EPA to Mei Fong, ARB, March 19, 2004. ARB, 2004h. E-mail from Steve Risotto, Halogenated Solvents Industry Alliance, February 4, 2004. ARB, 2004i. Telephone conversation with Katy Wolf, January 4, 2004.
IX-2
ARB, 2005. E-mail from Peter Sinsheimer, Director of Pollution Prevention Education and Research Center, February 11, 2005. ARB, 2005a. Dry Cleaning ATCM Evaluation Workgroup Meeting, June 16, 2005. ARB, 2005b. Telephone Conversations with Technichem and Safety Kleen representatives, June 21, 2005. ARB, 2005c. Dry Cleaning ATCM Evaluation Workgroup Meeting, July 13, 2005. ARB, 2005d. E-mail from James Douglas, GreenEarth, July 20, 2005. ARB, 2005e. E-mail from Steve Risotto, Halogenated Solvents Industry Alliance, August 5, 2005. ARB, 2005f. Lyondell Chemical Company, Impress Solvent Questions and Answers (2652), 2004. Website at http://www.lyondell.com/html/products/techlit/2652.pdf ARB, 2005g. Telephone Conversation with Bob Blackburn, October 18, 2005. AVES, 2000. The Assessment of the Effectiveness of Room Enclosures with Ventilation Systems in Reducing Risk at Dry Cleaning Facilities Using Perchloroethylene. AVES, an Affiliated of ATC Associates Inc., July 14, 2000. Begley, 2004. E-mail from Reg Begley, Sail Star, October 20, 2004. BLS, 2004. Bureau of Labor Statistics, U.S. Department of Labor, Consumer Price Index, 2004. CDHS, 2003. California Department of Health Services (CDHS), 2003 Health Hazard Alert, Hazard Evaluation System and Information System, 1-Bromopropane, July 2003. CFCA, 2002. Coalition for Clean Air, Hung Out to Dry: How the Use of Perchloroethylene in Dry Cleaning Endangers You and Your Family’s Health, October 2002. Chevron Phillips, 2005. Letter to Ms. Mei Fong regarding California Dry Cleaning Industry Technical Assessment Rport. November 22, 2005. Cleaners Family, 2004. Cleaners Family, Miracle Solvents? Evaluation of Hydrocarbon, GreenEarth, PureDry vs Perc; The Secrete of the Amazing Cleaning Results by Alternative Solvents, Volume 4, No. 1, February 2004. ExxonMobil, 2003. Product Environmental Profile, DF-2000TM Fluid, ExxonMobile Chemical, January 9, 2003.
IX-3
GreenEarth, 2003. Memo from Jim Barry, Chairman of GreenEarth Cleaning to Affiliates, Friends and Associates regarding GreenEarth Cleaning Safety Update. March 19, 2003. IFI, 2002. Research Fellowship, GreenEarth Fellowship, Copyright International Fabricare Institute, No. F-47, September 2002. IRTA, 2005. Evaluation of New and Emerging Technologies for Textile Cleaning, Institute for Research and Technical Assistance, August 2005. JE, 2004. Viable Alternatives to Perchloroethylene in Dry Cleaning, Jacobs Engineering, Prepared for City of Los Angeles, December 30, 2004. JOEH, 2005. A Proposed Methodology for Setting Occupational Exposure Limits for Hydrocarbon Solvents, Journal of Occupational and Environmental Hygiene, Richard H. McKee, et al., October 2005. Kelleher, 2004. A Technical and Practical Study of Tonsil Filter Aid, Everett Childers, 2004. Material Safety Data Sheets for Rynex (2004), Stoddard (1997), PureDry (2002), Shell 140 (1992), DF-2000 (2000), and EcoSolv (2003). NC, 2001. Alternatives to the Predominant Dry Cleaning Processes, North Carolina Department of Environment and Natural Resources, October 2001. NTP, 2004. NTP Technical Report on the Toxicology and Carcinogenesis Studies of Stoddard Solvent IIC In F344/N Rats and B6C3F1 Mice, National Toxicology Program. September, 2004. OEHHA, 2003. Memo from George Alexeeff to Peter Venturini regarding health effects of exposure to alternative dry cleaning solvents, December 2, 2003. PG&E, 2005. Pacific Gas and Electric Company rates for June 2005. PPERC, 1999. Switching to Pollution Prevention, Prevention Education and Research Center, April 1999. PPERC, 2002. Commercialization of Professional Wet Cleaning: An Evaluation of the Opportunities and Factors Involved in Switching to a Pollution Prevention Technology in the Garment Care Industry, Pollution Prevention Education and Research Center, October 28, 2002. PPERC, 2003. Memorandum, Subject: Current Assessment of Green Jet Garment Cleaning System, Pollution Prevention Education and Research Center, April 11, 2003.

IX-4
PPERC, 2004. Professional Wet Cleaning Equipment Report, Pollution Prevention Education and Research Center, March 11, 2004. PPERC, 2004a. Evaluating Energy Efficiency in the Garment Care Industry: A Comparison of Five Garment Care Technologies, Pollution Prevention Education and Research Center, September, 2004. Rynex, 2005. Rynex Environmental Dry Cleaning Solutions Website, www.rynex.com. Rynex 2005a. The Facts about Rynex the Proven Alternative Solvent, www.rynex.com SIDS, 2003. SIDS Initial Assessment Report For SIAM 17, November 2003. Smerling, 2004. Telephone conversation with Bob Smerling, October 29, 2004. SMUD, 2005. General Service Rate Schedules, Sacramento Municipal Utility District, March 3, 2005. South Coast, 2002. Final Staff Report - Proposed Amendment Rule 1421 - Control of Perchloroethylene Emissions from Dry Cleaning Systems, South Coast Air Quality Management District, October, 2002. U.S. EPA, 1998. Cleaner Technologies Substitutes Assessment: Professional Fabricare Processes. Design for the Environment, June 1998. U.S. EPA, 1999. Case Study: Liquid Carbon Dioxide (CO2) Surfactant System for Garment Care, Design for the Environment. www.epa.gov/opptintr/dfe/pubs/garment/lcds/micell.htm. May 1999. U.S. EPA, 2003. Siloxane D5 in Drycleaning Applications, Fact Sheet, August 2003.

Appendix A
Dry Cleaning Facility Survey
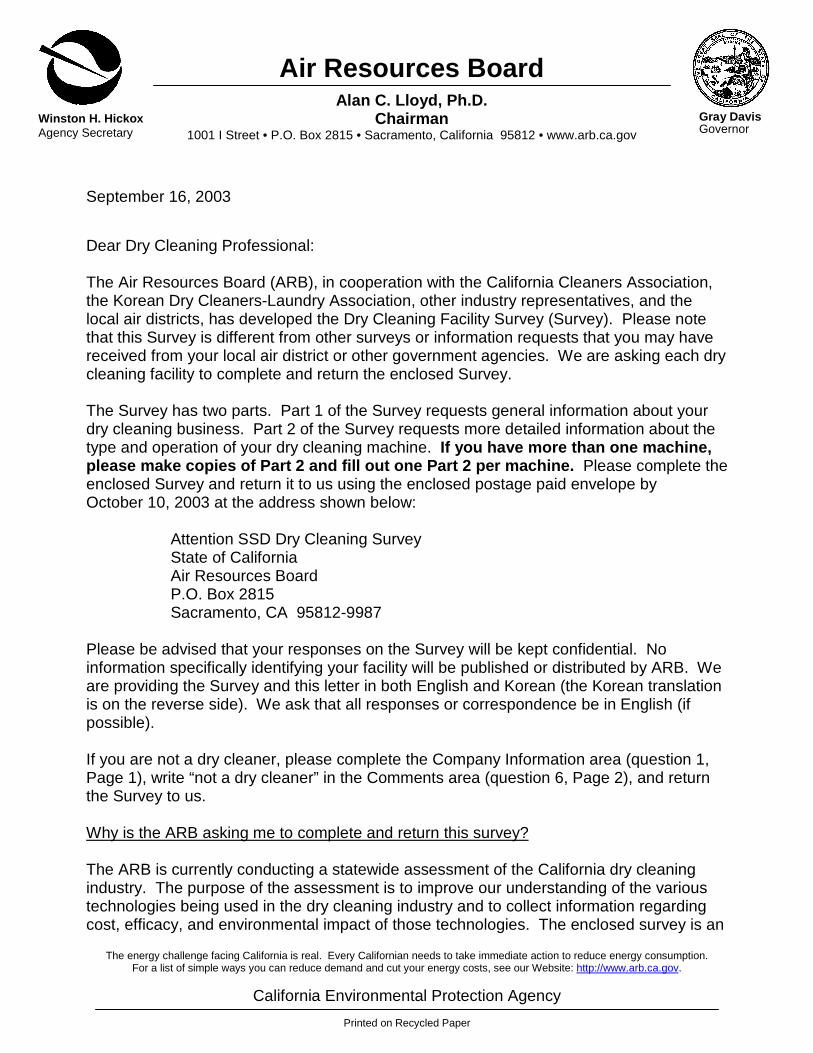
Winston H. HickoxAgency Secretary
The energy challenge facing California is real. Every Californian needs to take immediate action to reduce energy consumption.For a list of simple ways you can reduce demand and cut your energy costs, see our Website: http://www.arb.ca.gov.
California Environmental Protection Agency
Printed on Recycled Paper
Air Resources BoardAlan C. Lloyd, Ph.D.
Chairman1001 I Street • P.O. Box 2815 • Sacramento, California 95812 • www.arb.ca.gov
Gray DavisGovernor
September 16, 2003
Dear Dry Cleaning Professional:
The Air Resources Board (ARB), in cooperation with the California Cleaners Association,the Korean Dry Cleaners-Laundry Association, other industry representatives, and thelocal air districts, has developed the Dry Cleaning Facility Survey (Survey). Please notethat this Survey is different from other surveys or information requests that you may havereceived from your local air district or other government agencies. We are asking each drycleaning facility to complete and return the enclosed Survey.
The Survey has two parts. Part 1 of the Survey requests general information about yourdry cleaning business. Part 2 of the Survey requests more detailed information about thetype and operation of your dry cleaning machine. If you have more than one machine,please make copies of Part 2 and fill out one Part 2 per machine. Please complete theenclosed Survey and return it to us using the enclosed postage paid envelope byOctober 10, 2003 at the address shown below:
Attention SSD Dry Cleaning Survey State of California Air Resources Board P.O. Box 2815 Sacramento, CA 95812-9987
Please be advised that your responses on the Survey will be kept confidential. Noinformation specifically identifying your facility will be published or distributed by ARB. Weare providing the Survey and this letter in both English and Korean (the Korean translationis on the reverse side). We ask that all responses or correspondence be in English (ifpossible).
If you are not a dry cleaner, please complete the Company Information area (question 1,Page 1), write “not a dry cleaner” in the Comments area (question 6, Page 2), and returnthe Survey to us.
Why is the ARB asking me to complete and return this survey?
The ARB is currently conducting a statewide assessment of the California dry cleaningindustry. The purpose of the assessment is to improve our understanding of the varioustechnologies being used in the dry cleaning industry and to collect information regardingcost, efficacy, and environmental impact of those technologies. The enclosed survey is an
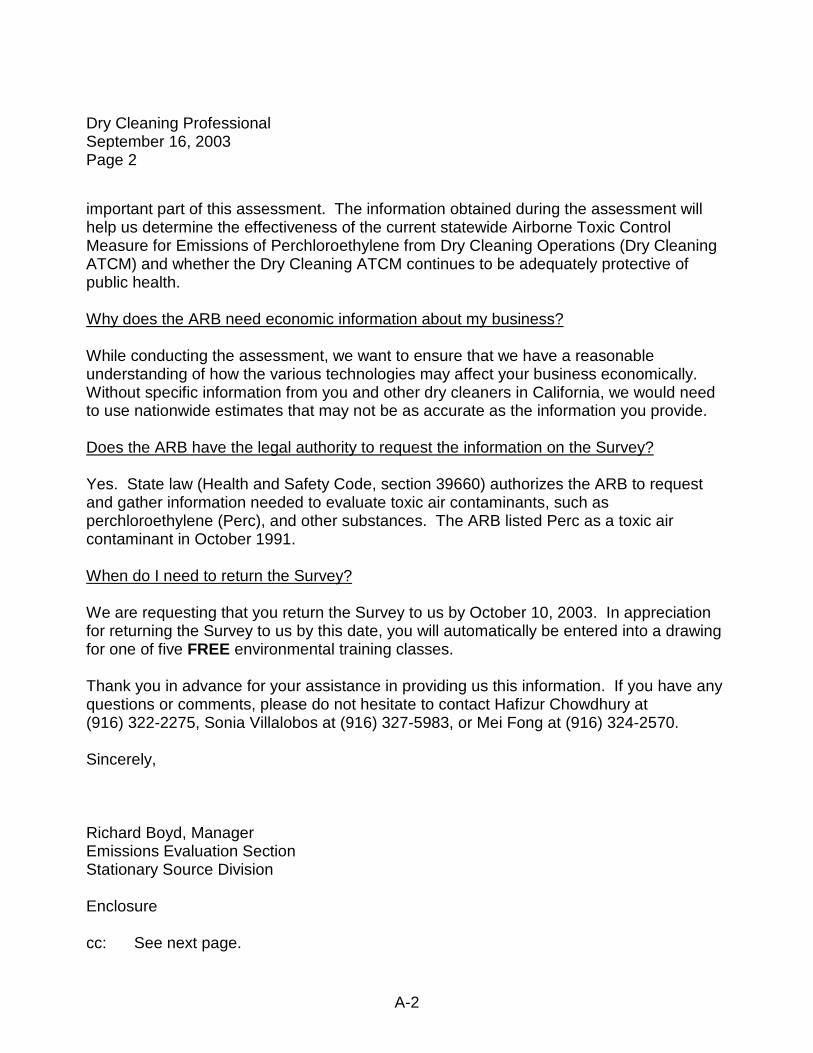
A-2
Dry Cleaning ProfessionalSeptember 16, 2003Page 2
important part of this assessment. The information obtained during the assessment willhelp us determine the effectiveness of the current statewide Airborne Toxic ControlMeasure for Emissions of Perchloroethylene from Dry Cleaning Operations (Dry CleaningATCM) and whether the Dry Cleaning ATCM continues to be adequately protective ofpublic health.
Why does the ARB need economic information about my business?
While conducting the assessment, we want to ensure that we have a reasonableunderstanding of how the various technologies may affect your business economically.Without specific information from you and other dry cleaners in California, we would needto use nationwide estimates that may not be as accurate as the information you provide.
Does the ARB have the legal authority to request the information on the Survey?
Yes. State law (Health and Safety Code, section 39660) authorizes the ARB to requestand gather information needed to evaluate toxic air contaminants, such asperchloroethylene (Perc), and other substances. The ARB listed Perc as a toxic aircontaminant in October 1991.
When do I need to return the Survey?
We are requesting that you return the Survey to us by October 10, 2003. In appreciationfor returning the Survey to us by this date, you will automatically be entered into a drawingfor one of five FREE environmental training classes.
Thank you in advance for your assistance in providing us this information. If you have anyquestions or comments, please do not hesitate to contact Hafizur Chowdhury at(916) 322-2275, Sonia Villalobos at (916) 327-5983, or Mei Fong at (916) 324-2570.
Sincerely,
Richard Boyd, ManagerEmissions Evaluation SectionStationary Source Division
Enclosure
cc: See next page.
A-3
Dry Cleaning ProfessionalSeptember 16, 2003Page 3
cc: Hafizur ChowdhuryAir Resources EngineerEmissions Evaluation Section
Sonia VillalobosAir Pollution SpecialistEmissions Evaluation Section
Mei FongAir Resources EngineerEmissions Evaluation Section
Winston H. HickoxAgency Secretary
The energy challenge facing California is real. Every Californian needs to take immediate action to reduce energy consumption. For alist of simple ways you can reduce demand and cut your energy costs, see our Website: http://www.arb.ca.gov.
California Environmental Protection Agency
A-4
Air Resources BoardAlan C. Lloyd, Ph.D.
Chairman1001 I Street • P.O. Box 2815 • Sacramento, California 95812 • www.arb.ca.gov
Gray DavisGovernor
September 12, 2003
드라이 크리닝업 종사자 분들께:
대기자원 관리국(ARB)에서는, 켈리포니아주 세탁협회, 한인 드라이 크리너-세탁협회, 그 외 관계 된 기타 업계 대표, 그리고 대기 관리 지역사무소의 협조아래여기 동봉하는 질문서를 제작하였음니다. 이 질문서는 대기 관리 지역사무소나 다른정부기관에서 실시한 질문서나 정보 요청서와는 다릅니다. 저희는 크리닝업 종사자분들께서 이 질문서에 답변 후 제출하여주시기를 부탁드립니다.
여기에 동봉하는 드라이 크리닝에 관한 질문서는 두 부분으로 나누어저있읍니다.첫 부분은 귀 업소에 관한 일반적인 질문입니다. 두번째 부분은 현 기계의 종류및 가동상태에 대한 좀더 세부적인 질문입니다. 만약만약만약만약 세탁기게를세탁기게를세탁기게를세탁기게를 하나하나하나하나 이상이상이상이상소유하고소유하고소유하고소유하고 계실경우계실경우계실경우계실경우, , , , 질문서의질문서의질문서의질문서의 두번째두번째두번째두번째 부분을부분을부분을부분을 복사하여복사하여복사하여복사하여 각각각각 세탁기계당세탁기계당세탁기계당세탁기계당 하나씩하나씩하나씩하나씩제출해주십시요제출해주십시요제출해주십시요제출해주십시요. . . . 동봉한 질문서에 답변하여서 October 10, 2003 까지 아래주소로제출하여 주시기를 부탁드립니다.
Attention SSD Dry Cleaning SurveyState of CaliforniaAir Resources BoardP.O. Box 2815Sacramento, CA 95812-9987
귀하의 답변내용은 기밀로 보장됩니다. ARB는 귀하의 업소가 타인에게밝혀질만한 자료는 발표하거나 분포하지 않을것입니다. 영어와 한국어로 번역된질문서와 편지를 보내드립니다 (한국어 번역은 뒷면). 대기자원관리국으로 보내는모든 편지와 답변은 가능한 영어로 작성해 주시기바랍니다.
귀하의 업소에서 드라이 크리닝을하지않을 경우, 첫번째 페이지 1번 업소조사 란에답하신 후, 두번째 페이지 6번 기타사항 란에 “드라이 크리닝을하지않음.” 이라고 쓰신후에 제출하여주시기를 부탁드립니다.
대기자원관리국에서 나의 도움이 필요한 이유는 무엇입니까?
ARB는 현제 켈리포니아 드라이 크리닝업소를 평가하려합니다. 이번 평가의목적은, 드라이 크리닝업소에서 사용하는 기술에대한 저희의 이해를높이고 또, 그런기술에 드는 비용과 효율성에대한 정보를 얻기위합입니다. 동봉한 질문서는 이번
A-5
드라이 크리닝업 종사자 분들께
Page 2
평가에 쓰일 중요한 자료입니다. 이번 평가 자료는 현제의 드라이크리닝업체로부터 대기에 유출되는 독성 물질 펄크 규제법안 (Dry CleaningATCM)의 유효성과, 또 이 법안 이 적합한 공중보건안으로 계속 쓰일수 있는지결정하는데 도움이 될것입니다.
대기자원관리국은 왜 나의 업소 경영정보를 필요로 합니까?
저희는 이번 평가를 통하여, 여러가지 다양한 기술이 귀하의 사업에 미치는 경제적영향에 대하여 저희가 잘 알고있는지 확인하고자 합니다. 귀하와 기타켈리포니아에서 드라이 크리닝업에 종사하시는 분들로부터의 자료없이는 전국으로통용되는 예산치를 기준으로 사용하게됨으로 귀하께서 제공하는 자료만큼 정확한정보가 될수 없을 것입니다.
대기자원관리국이 질문서에서 요구하는 정보를 요청할수있는 법적인 근거를 가지고있읍니까?
네. 켈리포니아주 법률(보건 및 안전에 관한 법 제 39660 조) 에 의하여 ARB 는펄크 (Perc)와 같은 유해한 대기오염물질을 관리규정하는데 필요한 정보를 요구하고수집할 권한이 있읍니다. 대기자원관리국은 펄크 (Perc) 를 유해한 대기오염물질로1991년 10월에 지정하였읍니다.
이 질문서는 언제까지 제출하여야 합니까?
October 10, 2003 까지보내 주시기를 바랍니다. 날짜안에 제출하여 주시는것에 대한감사의 뜻에서, 제출하신분 중 다섯 분을 추첨하여 드라이 크리닝 환경 연수교육을무료로 드림니다.
저희의 자료수집에 도움 주신것에대하여 미리 감사드립니다. 이 드라이크리닝질문서에대해 의문이 있거나 작성에 도움이 필요할경우, 주저없이 Hafizur Chowdhury(916) 322-2275, Sonia Villalobos (916) 327-5983 또는, Mei Fong (916) 324-2570 에게연락해주십시요.
Sincerely,
Richard Boyd, ManagerEmissions Evaluation SectionStationary Source Division
A-6
드라이 크리닝업 종사자 분들께
Page 3
Enclosure
cc: Hafizur ChowdhuryAir Resources EngineerEmissions Evaluation Section
Sonia VillalobosAir Pollution SpecialistEmissions Evaluation Section
Mei FongAir Resources EngineerEmissions Evaluation Section
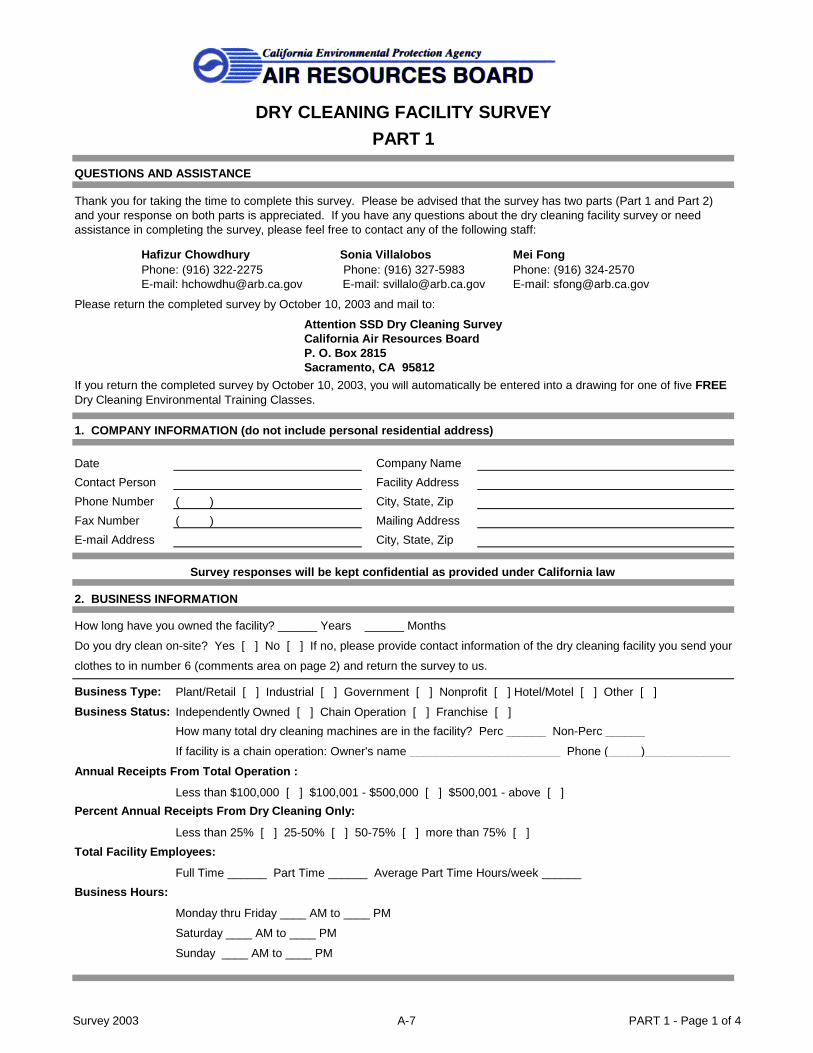
QUESTIONS AND ASSISTANCE
Hafizur Chowdhury Sonia Villalobos Mei FongPhone: (916) 322-2275 Phone: (916) 327-5983 Phone: (916) 324-2570E-mail: [email protected] E-mail: [email protected] E-mail: [email protected]
Please return the completed survey by October 10, 2003 and mail to:
Attention SSD Dry Cleaning SurveyCalifornia Air Resources BoardP. O. Box 2815Sacramento, CA 95812
1. COMPANY INFORMATION (do not include personal residential address)
Company Name
Contact Person Facility Address
Phone Number City, State, Zip
Fax Number Mailing Address
E-mail Address City, State, Zip
How long have you owned the facility? ______ Years ______ Months
Do you dry clean on-site? Yes [ ] No [ ] If no, please provide contact information of the dry cleaning facility you send your
clothes to in number 6 (comments area on page 2) and return the survey to us.
How many total dry cleaning machines are in the facility? Perc ______ Non-Perc ______
If facility is a chain operation: Owner's name _______________________ Phone (_____)_____________
Annual Receipts From Total Operation :
Percent Annual Receipts From Dry Cleaning Only:
Less than 25% [ ] 25-50% [ ] 50-75% [ ] more than 75% [ ]
Total Facility Employees:
Business Hours:
Saturday ____ AM to ____ PM
Sunday ____ AM to ____ PM
PART 1
Date
If you return the completed survey by October 10, 2003, you will automatically be entered into a drawing for one of five FREE Dry Cleaning Environmental Training Classes.
DRY CLEANING FACILITY SURVEY
( )
Business Status: Independently Owned [ ] Chain Operation [ ] Franchise [ ]
Survey responses will be kept confidential as provided under California law
Thank you for taking the time to complete this survey. Please be advised that the survey has two parts (Part 1 and Part 2) and your response on both parts is appreciated. If you have any questions about the dry cleaning facility survey or need assistance in completing the survey, please feel free to contact any of the following staff:
Less than $100,000 [ ] $100,001 - $500,000 [ ] $500,001 - above [ ]
Full Time ______ Part Time ______ Average Part Time Hours/week ______
Monday thru Friday ____ AM to ____ PM
( )
2. BUSINESS INFORMATION
Business Type: Plant/Retail [ ] Industrial [ ] Government [ ] Nonprofit [ ] Hotel/Motel [ ] Other [ ]
Survey 2003 A-7 PART 1 - Page 1 of 4
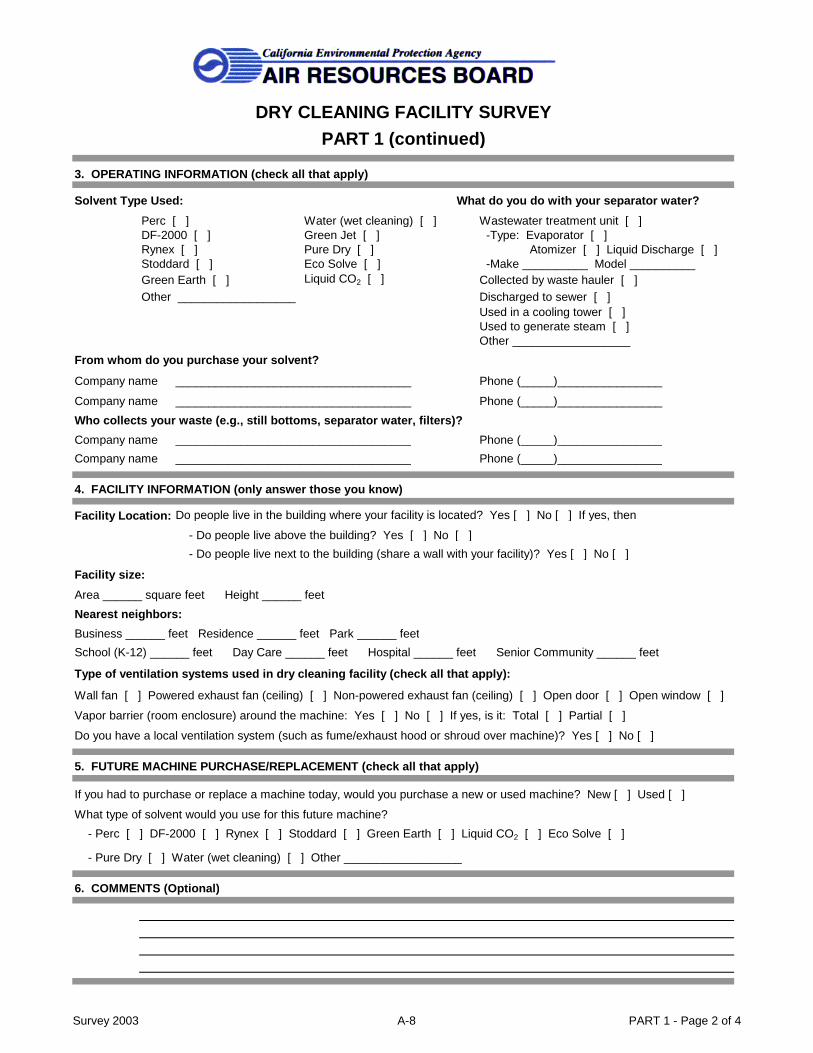
DRY CLEANING FACILITY SURVEY
Solvent Type Used: What do you do with your separator water?
Perc [ ] Water (wet cleaning) [ ] Wastewater treatment unit [ ]DF-2000 [ ] Green Jet [ ] -Type: Evaporator [ ]Rynex [ ] Pure Dry [ ] Atomizer [ ] Liquid Discharge [ ]Stoddard [ ] Eco Solve [ ] -Make __________ Model __________Green Earth [ ] Liquid CO2 [ ] Collected by waste hauler [ ]Other __________________ Discharged to sewer [ ]
Used in a cooling tower [ ]Used to generate steam [ ]Other __________________
From whom do you purchase your solvent?
Company name ____________________________________ Phone (_____)________________
Company name ____________________________________ Phone (_____)________________
Who collects your waste (e.g., still bottoms, separator water, filters)?
Company name ____________________________________ Phone (_____)________________
Company name ____________________________________ Phone (_____)________________
4. FACILITY INFORMATION (only answer those you know)
Do people live in the building where your facility is located? Yes [ ] No [ ] If yes, then
- Do people live above the building? Yes [ ] No [ ]
- Do people live next to the building (share a wall with your facility)? Yes [ ] No [ ]
Facility size:
Area ______ square feet Height ______ feet
Nearest neighbors:
Business ______ feet Residence ______ feet Park ______ feet
School (K-12) ______ feet Day Care ______ feet Hospital ______ feet Senior Community ______ feet
Type of ventilation systems used in dry cleaning facility (check all that apply):
Wall fan [ ] Powered exhaust fan (ceiling) [ ] Non-powered exhaust fan (ceiling) [ ] Open door [ ] Open window [ ]
Vapor barrier (room enclosure) around the machine: Yes [ ] No [ ] If yes, is it: Total [ ] Partial [ ]
Do you have a local ventilation system (such as fume/exhaust hood or shroud over machine)? Yes [ ] No [ ]
5. FUTURE MACHINE PURCHASE/REPLACEMENT (check all that apply)
If you had to purchase or replace a machine today, would you purchase a new or used machine? New [ ] Used [ ]
What type of solvent would you use for this future machine?
- Perc [ ] DF-2000 [ ] Rynex [ ] Stoddard [ ] Green Earth [ ] Liquid CO2 [ ] Eco Solve [ ]
- Pure Dry [ ] Water (wet cleaning) [ ] Other __________________
6. COMMENTS (Optional)
Facility Location:
3. OPERATING INFORMATION (check all that apply)
PART 1 (continued)
Survey 2003 A-8 PART 1 - Page 2 of 4
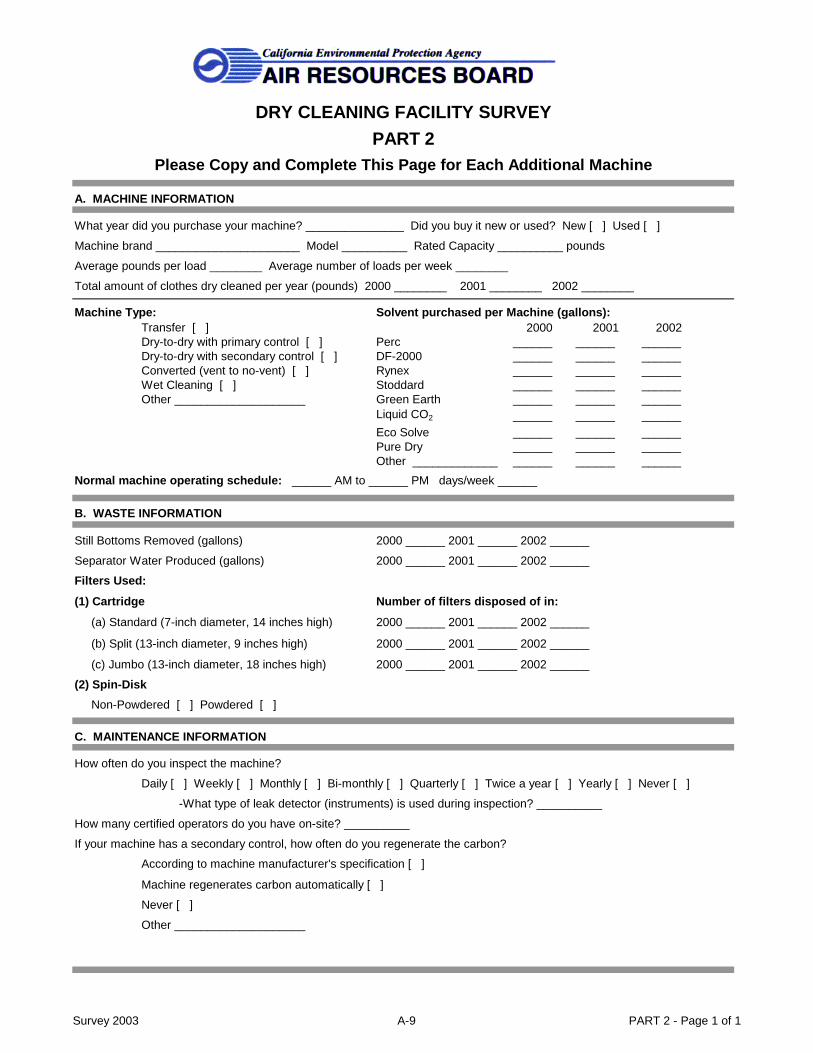
What year did you purchase your machine? _______________ Did you buy it new or used? New [ ] Used [ ]
Machine brand ______________________ Model __________ Rated Capacity __________ pounds
Average pounds per load ________ Average number of loads per week ________
Total amount of clothes dry cleaned per year (pounds) 2000 ________ 2001 ________ 2002 ________
Machine Type: Solvent purchased per Machine (gallons):Transfer [ ]Dry-to-dry with primary control [ ] Perc ______ ______ ______Dry-to-dry with secondary control [ ] DF-2000 ______ ______ ______Converted (vent to no-vent) [ ] Rynex ______ ______ ______Wet Cleaning [ ] Stoddard ______ ______ ______Other ____________________ Green Earth ______ ______ ______
Liquid CO2 ______ ______ ______Eco Solve ______ ______ ______Pure Dry ______ ______ ______Other _____________ ______ ______ ______
Normal machine operating schedule: ______ AM to ______ PM days/week ______
B. WASTE INFORMATION
Still Bottoms Removed (gallons) 2000 ______ 2001 ______ 2002 ______
Separator Water Produced (gallons) 2000 ______ 2001 ______ 2002 ______
Filters Used:
(1) Cartridge Number of filters disposed of in:
(a) Standard (7-inch diameter, 14 inches high) 2000 ______ 2001 ______ 2002 ______
(b) Split (13-inch diameter, 9 inches high) 2000 ______ 2001 ______ 2002 ______
(c) Jumbo (13-inch diameter, 18 inches high) 2000 ______ 2001 ______ 2002 ______
(2) Spin-Disk
Non-Powdered [ ] Powdered [ ]
How often do you inspect the machine?
Daily [ ] Weekly [ ] Monthly [ ] Bi-monthly [ ] Quarterly [ ] Twice a year [ ] Yearly [ ] Never [ ]
-What type of leak detector (instruments) is used during inspection? __________
How many certified operators do you have on-site? __________
If your machine has a secondary control, how often do you regenerate the carbon?
According to machine manufacturer's specification [ ]
Machine regenerates carbon automatically [ ]
Never [ ]
Other ____________________
C. MAINTENANCE INFORMATION
2000 2001 2002
DRY CLEANING FACILITY SURVEY
A. MACHINE INFORMATION
Please Copy and Complete This Page for Each Additional Machine
PART 2
Survey 2003 A-9 PART 2 - Page 1 of 1
문의사항과 도움 문의사항과 도움 문의사항과 도움 문의사항과 도움
Hafizur Chowdhury Sonia Villalobos Mei FongPhone: (916) 322-2275 Phone: (916) 327-5983 Phone: (916) 324-2570E-mail: [email protected] E-mail: [email protected] E-mail: [email protected]
질문서에 답변하여서 October 10, 2003 까지 아래주소로 제출하여주시기를 부탁드립니다.
Attention SSD Drycleaning SurveyCalifornia Air Resources BoardP. O. Box 2815Sacramento, CA 95812
1. 업소 조사 (개인거주지 주소는 쓰지말아주십시요). 업소 조사 (개인거주지 주소는 쓰지말아주십시요). 업소 조사 (개인거주지 주소는 쓰지말아주십시요). 업소 조사 (개인거주지 주소는 쓰지말아주십시요).
업소 이름
연락처 사람 이름 업소 주소
전화번호 시, 주, 짚 코드
팩스 번호 우편물 배달 주소
이메일 주소 시, 주, 짚 코드
현 상업 소유기간은 얼마나 됩니까? ______ 년 ______ 월
현 장소에 드라이 크리닝기계가 있읍니까? 네 [ ] 아니요 [ ] "아니요" 일 경우드라이 크리닝을보내는 거래 연락처를 6번 질문칸(기타 사항) 에 써서 이 질문서를 제출해 주십시요.
현 업소에 있는 총 드라이 크리닝 기계는 몇대입니까? 펄크사용기계 ______ 펄크외 사용 기계 ______
체인형태업소일 경우, 소유주의 이름 _______________________ 전화번호 (_____)_____________
총 연수입: 총 연수입: 총 연수입: 총 연수입:
총 연수입중 드라이 크리닝수입이 차지하는 비율:총 연수입중 드라이 크리닝수입이 차지하는 비율:총 연수입중 드라이 크리닝수입이 차지하는 비율:총 연수입중 드라이 크리닝수입이 차지하는 비율:
25%이하 [ ] 25-50% 사이 [ ] 50-75% 사이 [ ] 75% 이상 [ ]
종업원 수 종업원 수 종업원 수 종업원 수 :
영업시간 영업시간 영업시간 영업시간 :
토요일 ____ AM 부터 ____ PM 까지
일요일 ____ AM 부터 ____ PM 까지
2. 사업경영 조사 사업경영 조사 사업경영 조사 사업경영 조사
업체 종류: 업체 종류: 업체 종류: 업체 종류: 공장/소매 [ ] 산업체 [ ] 관영 [ ] 비영리법인 [ ] 호텔/모텔 [ ] 기타 [ ]
( )
$100,000 이하 [ ] $100,001 - $500,000 사이 [ ] $500,001 이상 [ ]
풀타임 ______명 파트타임______ 명 평균 파트타임 시간 주 ___ 시간
월요일 - 금요일 ____ AM 부터 ____ PM 까지
드라이크리닝 업소 질문서 드라이크리닝 업소 질문서 드라이크리닝 업소 질문서 드라이크리닝 업소 질문서
( )
업체소유형태: 업체소유형태: 업체소유형태: 업체소유형태: 개인소유 [ ] 체인형태 소유 [ ] 푸렌차이스 [ ]
답변내용은 켈리포니아 법에의하여 기밀로 보장됩니다. 답변내용은 켈리포니아 법에의하여 기밀로 보장됩니다. 답변내용은 켈리포니아 법에의하여 기밀로 보장됩니다. 답변내용은 켈리포니아 법에의하여 기밀로 보장됩니다.
시간를 내주셔서 감사합니다. 이 질문서는 두 파트로 나누어저있음을 유의하시고, 두 파트(파트1 과 파트2) 모두에 응답하여주시기를 부탁드립니다. 이 드라이크리닝 질문서에대해 의문이 있거나 작성에 도움이 필요할경우, 아래 직원에게 연락해주십시요.
파트 파트 파트 파트 1
오늘날짜
이 질문서에 답변하셔서 October 10, 2003 까지 제출하시면, 그중 다섯 분을 추첨하여 드라이 크리닝 환경 연수교육을 무료로 드림니다.
Survey 2003 A-10 PART 1 - Page 1 of 2
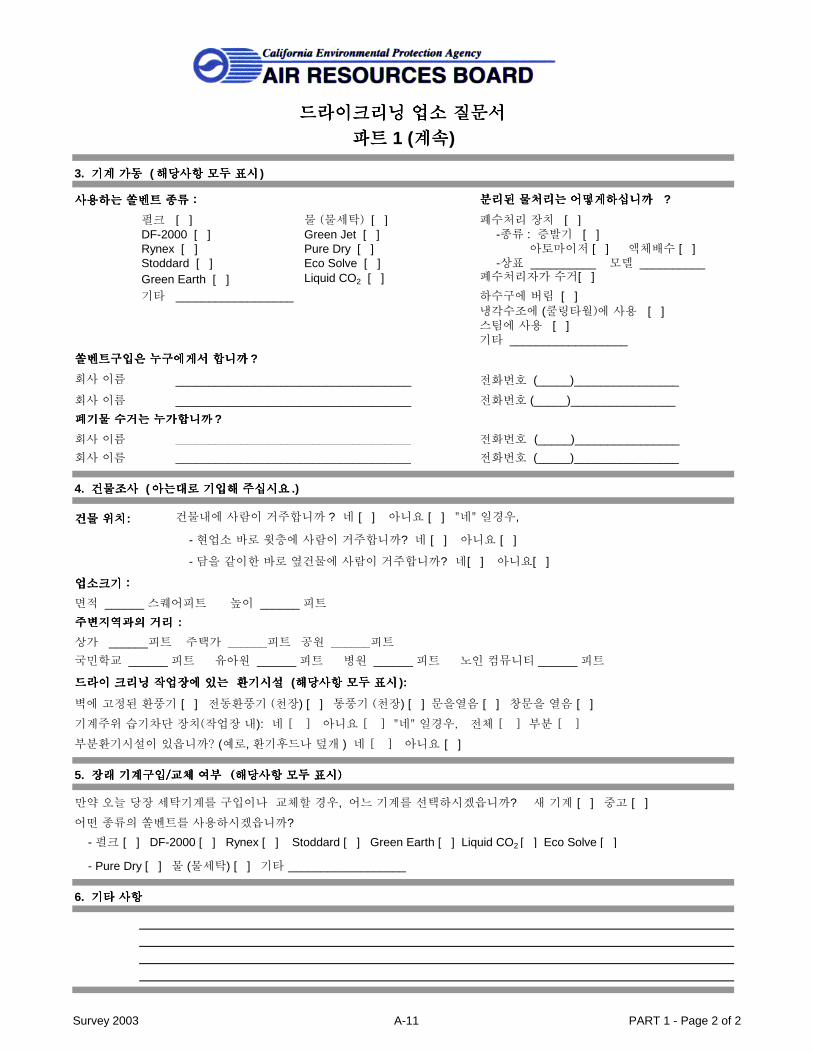
드라이크리닝 업소 질문서 드라이크리닝 업소 질문서 드라이크리닝 업소 질문서 드라이크리닝 업소 질문서
사용하는 쏠벤트 종류 : 사용하는 쏠벤트 종류 : 사용하는 쏠벤트 종류 : 사용하는 쏠벤트 종류 : 분리된 물처리는 어떻게하십니까 분리된 물처리는 어떻게하십니까 분리된 물처리는 어떻게하십니까 분리된 물처리는 어떻게하십니까 ?
펄크 [ ] 물 (물세탁) [ ] 폐수처리 장치 [ ]DF-2000 [ ] Green Jet [ ] -종류 : 증발기 [ ]Rynex [ ] Pure Dry [ ] 아토마이저 [ ] 액체배수 [ ]Stoddard [ ] Eco Solve [ ] -상표 __________ 모델 __________Green Earth [ ] Liquid CO2 [ ] 폐수처리자가 수거[ ]
기타 __________________ 하수구에 버림 [ ]냉각수조에 (쿨링타월)에 사용 [ ]스팀에 사용 [ ]기타 __________________
쏠벤트구입은 누구에게서 합니까쏠벤트구입은 누구에게서 합니까쏠벤트구입은 누구에게서 합니까쏠벤트구입은 누구에게서 합니까 ?
회사 이름 ____________________________________ 전화번호 (_____)________________
회사 이름 ____________________________________ 전화번호 (_____)________________
폐기물 수거는 누가합니까폐기물 수거는 누가합니까폐기물 수거는 누가합니까폐기물 수거는 누가합니까 ?
회사 이름 ____________________________________ 전화번호 (_____)________________
회사 이름 ____________________________________ 전화번호 (_____)________________
4. 건물조사건물조사건물조사건물조사 ( 아는대로 기입해 주십시요아는대로 기입해 주십시요아는대로 기입해 주십시요아는대로 기입해 주십시요 .)
건물내에 사람이 거주합니까 ? 네 [ ] 아니요 [ ] "네" 일경우,
- 현업소 바로 윗층에 사람이 거주합니까? 네 [ ] 아니요 [ ]
- 담을 같이한 바로 옆건물에 사람이 거주합니까? 네[ ] 아니요[ ]
업소크기 : 업소크기 : 업소크기 : 업소크기 :
면적 ______ 스퀘어피트 높이 ______ 피트
주변지역과의 거리주변지역과의 거리주변지역과의 거리주변지역과의 거리 :
상가 ______피트 주택가 ______피트 공원 ______피트
국민학교 ______ 피트 유아원 ______ 피트 병원 ______ 피트 노인 컴뮤니티 ______ 피트
드라이 크리닝 작업장에 있는 환기시설 드라이 크리닝 작업장에 있는 환기시설 드라이 크리닝 작업장에 있는 환기시설 드라이 크리닝 작업장에 있는 환기시설 (해당사항 모두 표시해당사항 모두 표시해당사항 모두 표시해당사항 모두 표시 ):
벽에 고정된 환풍기 [ ] 전동환풍기 (천장) [ ] 통풍기 (천장) [ ] 문을열음 [ ] 창문을 열음 [ ]
기계주위 습기차단 장치(작업장 내): 네 [ ] 아니요 [ ] "네" 일경우, 전체 [ ] 부분 [ ]
부분환기시설이 있읍니까? (예로, 환기후드나 덮개 ) 네 [ ] 아니요 [ ]
5. 장래 기계구입/교체 여부장래 기계구입/교체 여부장래 기계구입/교체 여부장래 기계구입/교체 여부 (해당사항 모두 표시)(해당사항 모두 표시)(해당사항 모두 표시)(해당사항 모두 표시)
만약 오늘 당장 세탁기계를 구입이나 교체할 경우, 어느 기계를 선택하시겠읍니까? 새 기계 [ ] 중고 [ ]
어떤 종류의 쏠벤트를 사용하시겠읍니까?
- 펄크 [ ] DF-2000 [ ] Rynex [ ] Stoddard [ ] Green Earth [ ] Liquid CO2 [ ] Eco Solve [ ]
- Pure Dry [ ] 물 (물세탁) [ ] 기타 __________________
6. 기타 사항 기타 사항 기타 사항 기타 사항
파트파트파트파트 1 (계속계속계속계속)
건물 위치건물 위치건물 위치건물 위치:
3. 기계 가동기계 가동기계 가동기계 가동 ( 해당사항 모두 표시해당사항 모두 표시해당사항 모두 표시해당사항 모두 표시 )
Survey 2003 A-11 PART 1 - Page 2 of 2
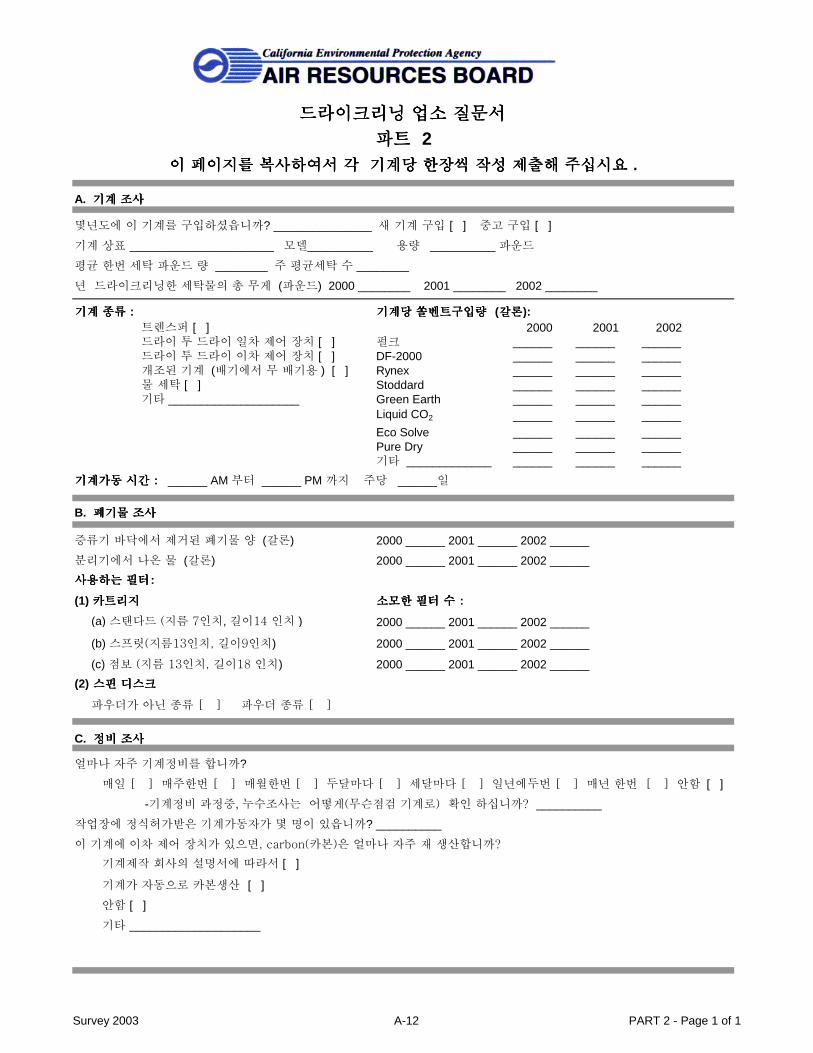
몇년도에 이 기계를 구입하셨읍니까? _______________ 새 기계 구입 [ ] 중고 구입 [ ]
기계 상표 ______________________ 모델__________ 용량 __________ 파운드
평균 한번 세탁 파운드 량 ________ 주 평균세탁 수 ________
년 드라이크리닝한 세탁물의 총 무게 (파운드) 2000 ________ 2001 ________ 2002 ________
기계 종류기계 종류기계 종류기계 종류 : 기계당 쏠벤트구입량기계당 쏠벤트구입량기계당 쏠벤트구입량기계당 쏠벤트구입량 (갈론갈론갈론갈론):트렌스퍼 [ ]드라이 투 드라이 일차 제어 장치 [ ] 펄크 ______ ______ ______드라이 투 드라이 이차 제어 장치 [ ] DF-2000 ______ ______ ______개조된 기계 (배기에서 무 배기용 ) [ ] Rynex ______ ______ ______물 세탁 [ ] Stoddard ______ ______ ______기타 ____________________ Green Earth ______ ______ ______
Liquid CO2 ______ ______ ______Eco Solve ______ ______ ______Pure Dry ______ ______ ______기타 _____________ ______ ______ ______
기계가동 시간기계가동 시간기계가동 시간기계가동 시간 : ______ AM 부터 ______ PM 까지 주당 ______일
B. 폐기물 조사폐기물 조사폐기물 조사폐기물 조사
증류기 바닥에서 제거된 폐기물 양 (갈론) 2000 ______ 2001 ______ 2002 ______
분리기에서 나온 물 (갈론) 2000 ______ 2001 ______ 2002 ______
사용하는 필터사용하는 필터사용하는 필터사용하는 필터:
(1) 카트리지 카트리지 카트리지 카트리지 소모한 필터 수소모한 필터 수소모한 필터 수소모한 필터 수 :
(a) 스탠다드 (지름 7인치, 길이14 인치 ) 2000 ______ 2001 ______ 2002 ______
(b) 스프릿(지름13인치, 길이9인치) 2000 ______ 2001 ______ 2002 ______
(c) 점보 (지름 13인치, 길이18 인치) 2000 ______ 2001 ______ 2002 ______
(2) 스핀 디스크 스핀 디스크 스핀 디스크 스핀 디스크
파우더가 아닌 종류 [ ] 파우더 종류 [ ]
얼마나 자주 기계정비를 합니까?
매일 [ ] 매주한번 [ ] 매월한번 [ ] 두달마다 [ ] 세달마다 [ ] 일년에두번 [ ] 매년 한번 [ ] 안함 [ ]
-기계정비 과정중, 누수조사는 어떻게(무슨점검 기계로) 확인 하십니까? __________
작업장에 정식허가받은 기계가동자가 몇 명이 있읍니까? __________
이 기계에 이차 제어 장치가 있으면, carbon(카본)은 얼마나 자주 재 생산합니까?
기계제작 회사의 설명서에 따라서 [ ]
기계가 자동으로 카본생산 [ ]
안함 [ ]
기타 ____________________
C. 정비 조사 정비 조사 정비 조사 정비 조사
2000 2001 2002
드라이크리닝 업소 질문서 드라이크리닝 업소 질문서 드라이크리닝 업소 질문서 드라이크리닝 업소 질문서
A. 기계 조사 기계 조사 기계 조사 기계 조사
이 페이지를 복사하여서 각 기계당 한장씩 작성 제출해 주십시요이 페이지를 복사하여서 각 기계당 한장씩 작성 제출해 주십시요이 페이지를 복사하여서 각 기계당 한장씩 작성 제출해 주십시요이 페이지를 복사하여서 각 기계당 한장씩 작성 제출해 주십시요 .
파트 파트 파트 파트 2
Survey 2003 A-12 PART 2 - Page 1 of 1
Appendix B
Dry Cleaning Site Visit Survey
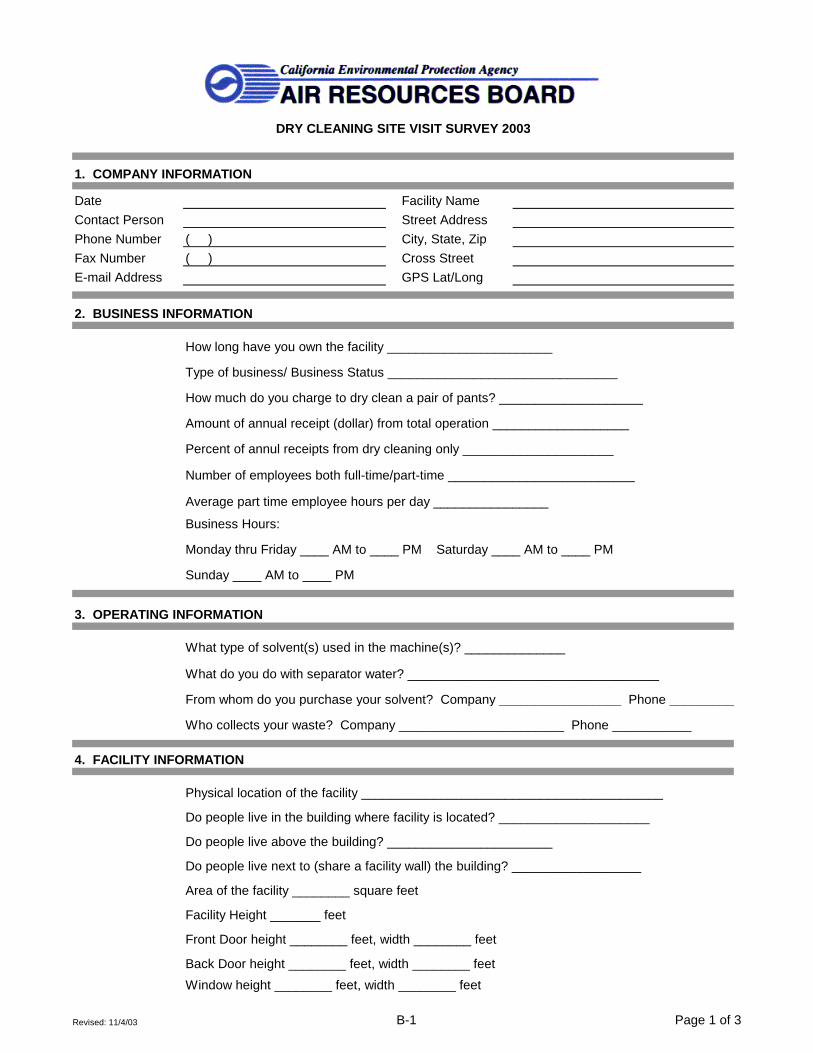
Facility Name
Contact Person Street Address
Phone Number City, State, Zip
Fax Number Cross Street
E-mail Address GPS Lat/Long
How long have you own the facility _______________________
Type of business/ Business Status ________________________________
How much do you charge to dry clean a pair of pants? ____________________
Percent of annul receipts from dry cleaning only _____________________
Number of employees both full-time/part-time __________________________
Average part time employee hours per day ________________
Business Hours:
Monday thru Friday ____ AM to ____ PM Saturday ____ AM to ____ PM
Sunday ____ AM to ____ PM
What type of solvent(s) used in the machine(s)? ______________
What do you do with separator water? ___________________________________
From whom do you purchase your solvent? Company _________________ Phone _________
Who collects your waste? Company _______________________ Phone ___________
Do people live in the building where facility is located? _____________________
Do people live above the building? _______________________
Do people live next to (share a facility wall) the building? __________________
Area of the facility ________ square feet
Facility Height _______ feet
Front Door height ________ feet, width ________ feet
Back Door height ________ feet, width ________ feet
Window height ________ feet, width ________ feet
Amount of annual receipt (dollar) from total operation ___________________
2. BUSINESS INFORMATION
3. OPERATING INFORMATION
4. FACILITY INFORMATION
( )
( )
Date
DRY CLEANING SITE VISIT SURVEY 2003
1. COMPANY INFORMATION
Physical location of the facility __________________________________________
Revised: 11/4/03 B-1 Page 1 of 3

DRY CLEANING SITE VISIT SURVEY 2003
Is the facility a part of a larger building? ________________ Stand alone building? ________
Dimension of the building: Length ______ feet Width _______ feet Height _______ feet
Does the facility have a stack? ______
Stack height ______ feet Stack diameter ______ feet
Does the stack has a raincap/horizontal release? _____ Stack airflow ______ cfm
Does each machine have separate stacks or do they combine into single stack? ______
Distance measured from door to door:
Nearest business _____________ feet Residence ______________ feet
Nearest (School/Day Care/Hospital/Park/Senior Community) _______________________ feet
What type of fan(s) do you have in your facility? ___________________________
Is there a vapor barrier (room enclosure) around the machine? _________________
Do you still keep your doors open when the weather is bad? _______
If you had to purchase or replace a machine today, would you purchase a new or
used machine? __________________
What type of solvent would you use for this future machine? _________________
What do you think of the alternative solvents? (write in comments, section 9)
What year did you purchase your machine? ________ Did you buy it new or used ________
Machine brand type ______________________ Model ________
Rated Capacity ________ pounds Machine age ________
Average pounds per load ______ Average number of loads per week ______
Total amount of clothes dry cleaned per year (pounds) 2000 _____ 2001 _____ 2002 _____
Have you done any retrofit to the machine? ________________________
Does machine have a shroud? _________ Does machine have a lock-out device? _________
How much solvent used per machine(gallons) in year 2000 _____ 2001 _____ 2002 _____
What is your normal machine operating hours? ______ AM to ______ PM
How many days do you operate the machine per week? _____________
In a year, how many times do you have a minor spill of solvent? _________________
In a year, how many times do you have a major spill of solvent?____________________
6. MACHINE INFORMATION
4. FACILITY INFORMATION (continued)
5. FUTURE MACHINE PURCHASE/REPLACEMENT
Revised: 11/4/03 B-2 Page 2 of 3

DRY CLEANING SITE VISIT SURVEY 2003
How much still bottoms (gallons) removed in year 2000 ______ 2001 ______ 2002 ______
How much separator water (gallons) produced in year 2000 _____ 2001 ______ 2002 ______
What type of cartridges do you use in your machine? (e.g.: standard, split or jumbo) ________
What do you do in preparation to changing the filters? ______________________________
How do you dispose of the filters? ____________________________________________
How many filters disposed in year 2000 _____ 2001 _____ 2002 _____
If your machine needs Spin-Disk filter, then is it powdered or non powdered? _________
How often do you inspect the machine? ______________
What type of leak detector used during inspection? ________________________
In a year, how many time is a leak being detected? ______________________
Do you have extra gaskets handy?_________
How often do you replace gaskets? _________________________
How many certified operators do you have on-site? ___________
If your machine has a secondary control, how often do you regenerate the carbon? ________
9. COMMENTS
8. MAINTENANCE INFORMATION
7. WASTE INFORMATION
Revised: 11/4/03 B-3 Page 3 of 3
Appendix C
Machine Manufacturer’s Survey
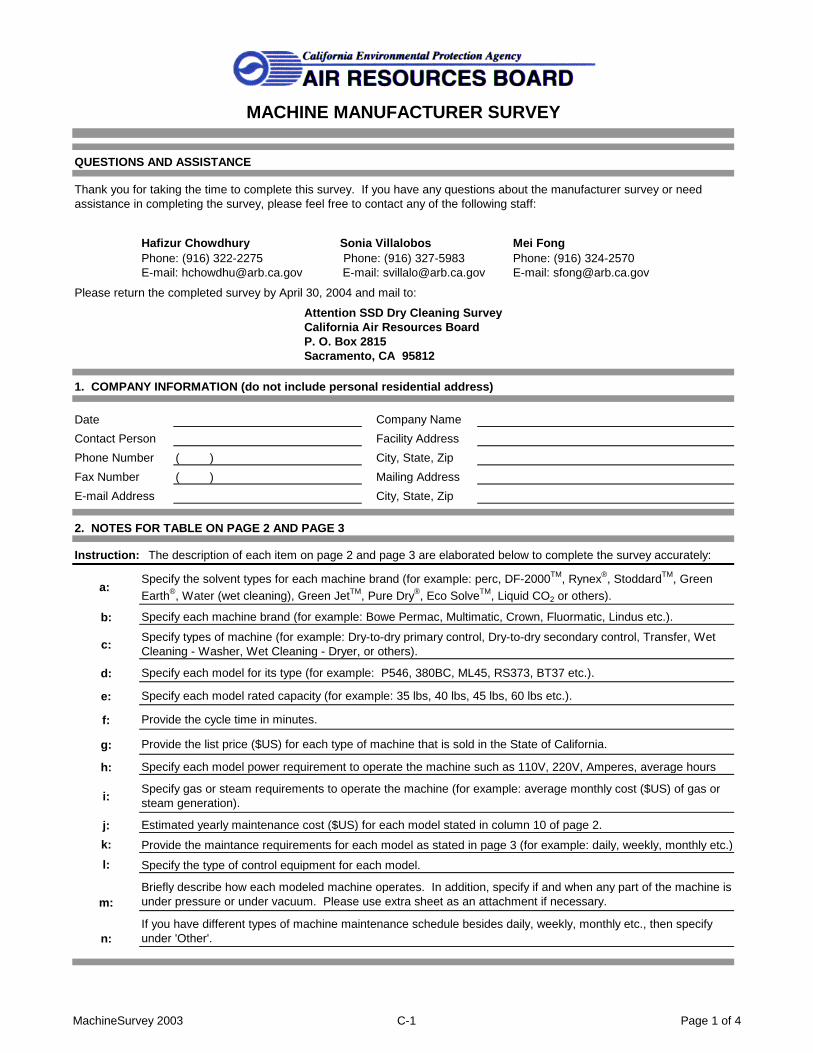
QUESTIONS AND ASSISTANCE
Hafizur Chowdhury Sonia Villalobos Mei FongPhone: (916) 322-2275 Phone: (916) 327-5983 Phone: (916) 324-2570E-mail: [email protected] E-mail: [email protected] E-mail: [email protected]
Please return the completed survey by April 30, 2004 and mail to:
Attention SSD Dry Cleaning SurveyCalifornia Air Resources BoardP. O. Box 2815Sacramento, CA 95812
1. COMPANY INFORMATION (do not include personal residential address)
Company Name
Contact Person Facility Address
Phone Number City, State, Zip
Fax Number Mailing Address
E-mail Address City, State, Zip
a:
b:
c:
d:
e:
f:
g:
h:
i:
j:
k:
l:
m:
n:
Date
Briefly describe how each modeled machine operates. In addition, specify if and when any part of the machine is under pressure or under vacuum. Please use extra sheet as an attachment if necessary.
MACHINE MANUFACTURER SURVEY
( )
Thank you for taking the time to complete this survey. If you have any questions about the manufacturer survey or need assistance in completing the survey, please feel free to contact any of the following staff:
Specify types of machine (for example: Dry-to-dry primary control, Dry-to-dry secondary control, Transfer, Wet Cleaning - Washer, Wet Cleaning - Dryer, or others).
Specify gas or steam requirements to operate the machine (for example: average monthly cost ($US) of gas or steam generation).
Instruction: The description of each item on page 2 and page 3 are elaborated below to complete the survey accurately:
Specify the solvent types for each machine brand (for example: perc, DF-2000TM, Rynex®, StoddardTM, Green Earth®, Water (wet cleaning), Green JetTM, Pure Dry®, Eco SolveTM, Liquid CO2 or others).
Specify each machine brand (for example: Bowe Permac, Multimatic, Crown, Fluormatic, Lindus etc.).
Specify each model power requirement to operate the machine such as 110V, 220V, Amperes, average hours
Specify each model for its type (for example: P546, 380BC, ML45, RS373, BT37 etc.).
Specify each model rated capacity (for example: 35 lbs, 40 lbs, 45 lbs, 60 lbs etc.).
Provide the cycle time in minutes.
Provide the list price ($US) for each type of machine that is sold in the State of California.
If you have different types of machine maintenance schedule besides daily, weekly, monthly etc., then specify under 'Other'.
2. NOTES FOR TABLE ON PAGE 2 AND PAGE 3
( )
Estimated yearly maintenance cost ($US) for each model stated in column 10 of page 2.
Provide the maintance requirements for each model as stated in page 3 (for example: daily, weekly, monthly etc.).
Specify the type of control equipment for each model.
MachineSurvey 2003 C-1 Page 1 of 4
Solventa
TypeMachineb
BrandMachinec
Types Modeld
Ratede
Capacity (lbs)
Cyclef
Time (minutes)
Listg
Machine Price ($)
Electricalh
RequirementGas/Steami
Requirement
Yearlyj
Maintenance Cost ($)
.
MACHINE MANUFACTURER SURVEY
MachineSurvey 2003 C-2 Page 2 of 4
ModeldEvery 4th
Load Daily Weekly MonthlyEvery 3 Months
Every 6 Months
Every 12 Months
Othern ____ Othern ____Othern ____ Othern ____Othern ____Othern ____ Othern ____
.
Maintenance Requirementsk
Controll
Equipments
Short Description of Equipment Operationm
MACHINE MANUFACTURER SURVEY
MachineSurvey 2003 C-3 Page 3 of 4
COMMENTS
MACHINE MANUFACTURER SURVEY
MachineSurvey 2003 C-4 Page 4 of 4
Appendix D
Standard Operating Procedurefor the Determination of Tetrachloroethylene in
Dry Cleaning Sludge by Gas Chromatograhy - FID
D-1
Special Analysis SectionNorthern Laboratory Branch
Monitoring and Laboratory Division
STANDARD OPERATING PROCEDURE FOR THEDETERMINATION OF TETRACHLOROETHYLENE IN DRYCLEANING SLUDGE BY GAS CHROMATOGRAPHY-FID
January 31, 2005, Revision 1.0
DISCLAIMER: Mention of any trade name or commercial product in Method 310 andassociated Standard Operating Procedures does not constitute endorsement orrecommendation of this product by the Air Resources Board. Specific brand names andinstrument descriptions listed in the Standard Operating Procedures are equipment usedby the ARB laboratory. Any functionally equivalent instrumentation can be used.
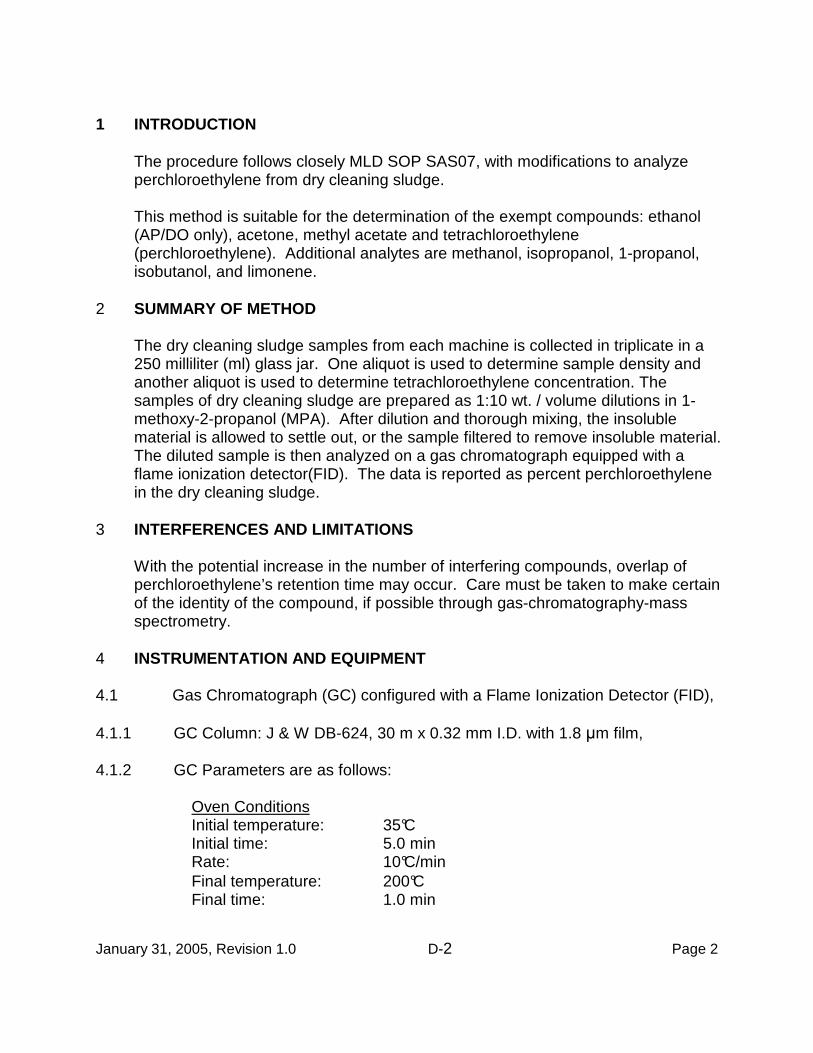
January 31, 2005, Revision 1.0 D-2 Page 2
1 INTRODUCTION
The procedure follows closely MLD SOP SAS07, with modifications to analyzeperchloroethylene from dry cleaning sludge.
This method is suitable for the determination of the exempt compounds: ethanol(AP/DO only), acetone, methyl acetate and tetrachloroethylene(perchloroethylene). Additional analytes are methanol, isopropanol, 1-propanol,isobutanol, and limonene.
2 SUMMARY OF METHOD
The dry cleaning sludge samples from each machine is collected in triplicate in a250 milliliter (ml) glass jar. One aliquot is used to determine sample density andanother aliquot is used to determine tetrachloroethylene concentration. Thesamples of dry cleaning sludge are prepared as 1:10 wt. / volume dilutions in 1-methoxy-2-propanol (MPA). After dilution and thorough mixing, the insolublematerial is allowed to settle out, or the sample filtered to remove insoluble material.The diluted sample is then analyzed on a gas chromatograph equipped with aflame ionization detector(FID). The data is reported as percent perchloroethylenein the dry cleaning sludge.
3 INTERFERENCES AND LIMITATIONS
With the potential increase in the number of interfering compounds, overlap ofperchloroethylene’s retention time may occur. Care must be taken to make certainof the identity of the compound, if possible through gas-chromatography-massspectrometry.
4 INSTRUMENTATION AND EQUIPMENT
4.1 Gas Chromatograph (GC) configured with a Flame Ionization Detector (FID),
4.1.1 GC Column: J & W DB-624, 30 m x 0.32 mm I.D. with 1.8 µm film,
4.1.2 GC Parameters are as follows:
Oven ConditionsInitial temperature: 35°C Initial time: 5.0 minRate: 10°C/minFinal temperature: 200°C Final time: 1.0 min
January 31, 2005, Revision 1.0 D-3 Page 3
Run time: 22.5 minOven equilibration: 0.3 minInjector temperature: 250°C Detector temperature: 250°CCarrier gas (He): 10 psi (26 cm/sec)DET B FID: ONEPP B: 9.5 psi @ 35oCSplit Flow: 100 mL/min
4.2 Volumetric Flasks:
4.2.1 10 and 500 ml,
4.3 Rainin Pipettors:
4.3.1 250 µL, 1.0 ml, 2.5 ml with tips,
4.4 Vials and Jars:
4.4.1 20 mL, for standards,
4.4.2 8 mL with PTFE-lined cap, for standards and dilutions,
4.4.3 2 mL with caps, for GC analysis,
4.4.4 250 ml widemouth glass jars with PTFE –lined caps,
4.4.5 15 ml graduated disposable polypropylene conical tubes,
4.5 Analytical Balance:
4.5.1 Sartorious ME215S,
4.5.2 Sartorious MC1,
4.5.3 Sartorious LC6201S,
4.6 Vortex Mixer, variable speed.
5 REAGENTS
5.1 1-Methoxy-2-propanol (MPA), 98%,
5.2 Analyte, tetrachloroethylene, spectrophotometric grade,
January 31, 2005, Revision 1.0 D-4 Page 4
5.3 Stock Standards: The 80 mg/mL stock standard is prepared gravimetrically.
5.4 Control/Check Stock Solution: A control/check stock solution is preparedusing acetone in MPA. The analyte is weighed in the preparation of thestock, so the concentration is in g/mL.
5.5 Helium, grade 5,
5.6 Air, compressed, ultra high purity,
5.7 Hydrogen Generator, Whatman, model 75-32 or equivalent.
6 PROCEDURE
6.1 Sample Collection:
6.1.1 Samples are collected in triplicate from each dry cleaning machine.
6.1.2 Using a long wooden or metal stirring rod, stir the collected sludge toresuspend the solid material as much as possible.
6.1.3 Using a cup or jar fill a 250 ml jar with the stirred dry cleaning sludge.
6.1.4 Clean the jar, seal the container, and attach the sample identification label.
6.1.5 Repeat this process two more times making sure the sludge is remixedbetween each sampling.
6.1.6 Place the triplicate samples in a travel container (such as an ice chest) atambient temperature for transport back to the laboratory.
6.2 Sample Preparation:
6.2.1 The collected samples are given a unique identification number andentered into the laboratory information management system (LIMS).
6.2.2 The samples are stored at ambient temperature prior to analysis.
6.2.3 Density Determination:
6.2.3.1 Tare a polypropylene conical tube (Becton-Dickinson 15 ml) on a toploading balance.
6.2.3.2 For the determination of water density as a control check, fill the conical
January 31, 2005, Revision 1.0 D-5 Page 5
tube with water and cap making sure no air bubbles are present.
6.2.3.3 Weigh the tube to the nearest 0.00 grams. The tubes will holdapproximately 16 ml when filled to capacity
6.2.3.4 Repeat the water density determination two more times. The averagewater density should be 1.0 g/ml.
6.2.3.5 Mix the sludge samples well and aliquot into a pouring beaker. Pour intoa 15 ml conical tube as described in 6.2.3.2.
6.2.3.6 Weigh the tube and record the weight.
6.2.3.7 Repeat the sludge density determination two more times using a cleantube for each determination.
6.2.3.8 Enter weights in the dry cleaning ATCM spreadsheet. The density iscalculated as weight per 16 mls and recorded in g/ml.
6.2.3.9 The tubes should be disposed in the hazardous waste container.
6.2.4 Tetrachloroethylene Determination:
6.2.4.1 Weigh a one (1) milliliter aliquot of sludge into a 10 ml volumetric flask.
6.2.4.2 Fill to the mark with 1-methoxy-2-propanol.
6.2.4.3 Mix well and transfer into an eight (8) ml disposable vial with a PFTElined cap.
6.2.4.4 Transfer an aliquot to a 1.8 ml autoinjector vial.
6.3 Instrument Preparation:
6.3.1 Turn on the main valve for the air cylinder; verify cylinder pressure is above500 psi.
6.3.2 Verify helium cylinder pressure is above 500 psi.
6.3.3 Check that the water level in hydrogen generator is above the refill line.
6.3.4 Press the FID igniter on the front of the GC.
January 31, 2005, Revision 1.0 D-6 Page 6
6.4 Analysis Preparation:
6.4.1 Solvent Blank: Prepare solvent blank by filling a GC vial with the sameMPA used to make the dilutions in steps 6.2.2 – 6.2.4. Cap the vial.
6.4.2 Calibration Standards: Prepare the five calibration standards in 10 mLvolumetric flasks as follows:
Concentration Volume of Stock Standard1.0 mg/mL 0.125 mL10 mg/mL 1.2520 mg/mL 2.5040 mg/mL 5.080 mg/mL ----
Bring to volume with MPA, mix thoroughly and place in dilution vials.
6.4.3 Transfer an aliquot of each standard into a GC vial and cap.
6.4.4 Control/Check: Prepare the control/check by diluting 1.0 mL of thecontrol/check stock standard to 10 mL with MPA. The control is analyzedafter the calibration. The check is run after every ten samples and at theend of the run.
6.4.5 Transfer an aliquot of each control/check and sample into appropriatelylabeled GC vials and cap.
6.5 Sample Analysis:
6.5.1 Place vials in the autosampler in the following order: MPA blank,calibration standards, control/check, and diluted samples. The checkstandard is run every tenth sample and at the end of the run. Additionalblanks between standards and samples maybe used if carryover issuspected.
6.5.2 Calculate the value for each analyte found by dividing the amount from thereport (mg/mL) by the sample dilution weight (see Section 8).
7 QUALITY CONTROL
7.1 An MPA solvent blank must be analyzed for each batch of samples. Theanalyte concentration in the blank must be less than 0.1% wt./volume. AnMPA blank is run before the control and each check to prevent carry overfrom the previous sample.
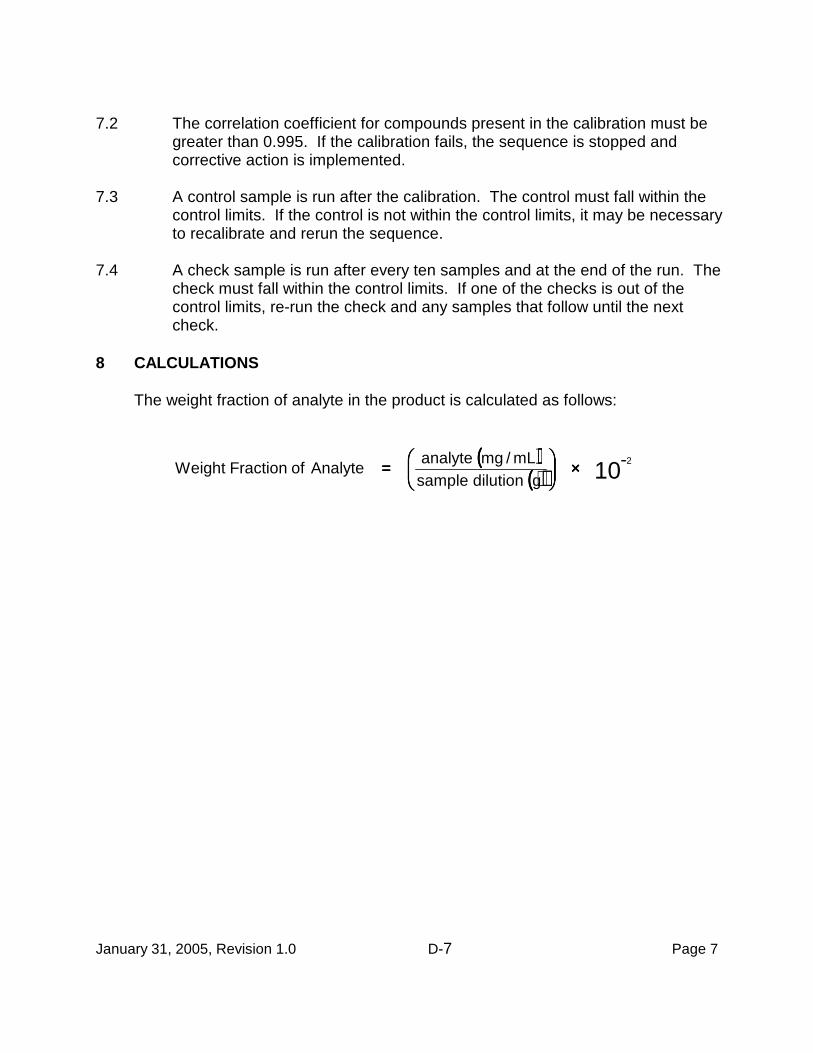
January 31, 2005, Revision 1.0 D-7 Page 7
7.2 The correlation coefficient for compounds present in the calibration must begreater than 0.995. If the calibration fails, the sequence is stopped andcorrective action is implemented.
7.3 A control sample is run after the calibration. The control must fall within thecontrol limits. If the control is not within the control limits, it may be necessaryto recalibrate and rerun the sequence.
7.4 A check sample is run after every ten samples and at the end of the run. Thecheck must fall within the control limits. If one of the checks is out of thecontrol limits, re-run the check and any samples that follow until the nextcheck.
8 CALCULATIONS
The weight fraction of analyte in the product is calculated as follows:
(((( ))))(((( )))) 10
2
gdilutionsamplemL/mganalyte
AnalyteofFractionWeight−−−−××××
====
Appendix E
Standard Operating ProcedureFor the Determination of DF2000 TM in Dry Cleaning Sludge
by Gas Chromatography – Mass Selective Detector
E-1
Special Analysis SectionNorthern Laboratory Branch
Monitoring and Laboratory Division
STANDARD OPERATING PROCEDURE FOR THEDETERMINATION OF DF2000™ IN DRY CLEANING SLUDGE
BY GAS CHROMATOGRAPHY-MASS SELECTIVE DETECTOR
May 24, 2005
DISCLAIMER: Mention of any trade name or commercial product in Method 310 andassociated Standard Operating Procedures does not constitute endorsement orrecommendation of this product by the Air Resources Board. Specific brand names andinstrument descriptions listed in the Standard Operating Procedures are equipment usedby the ARB laboratory. Any functionally equivalent instrumentation can be used.
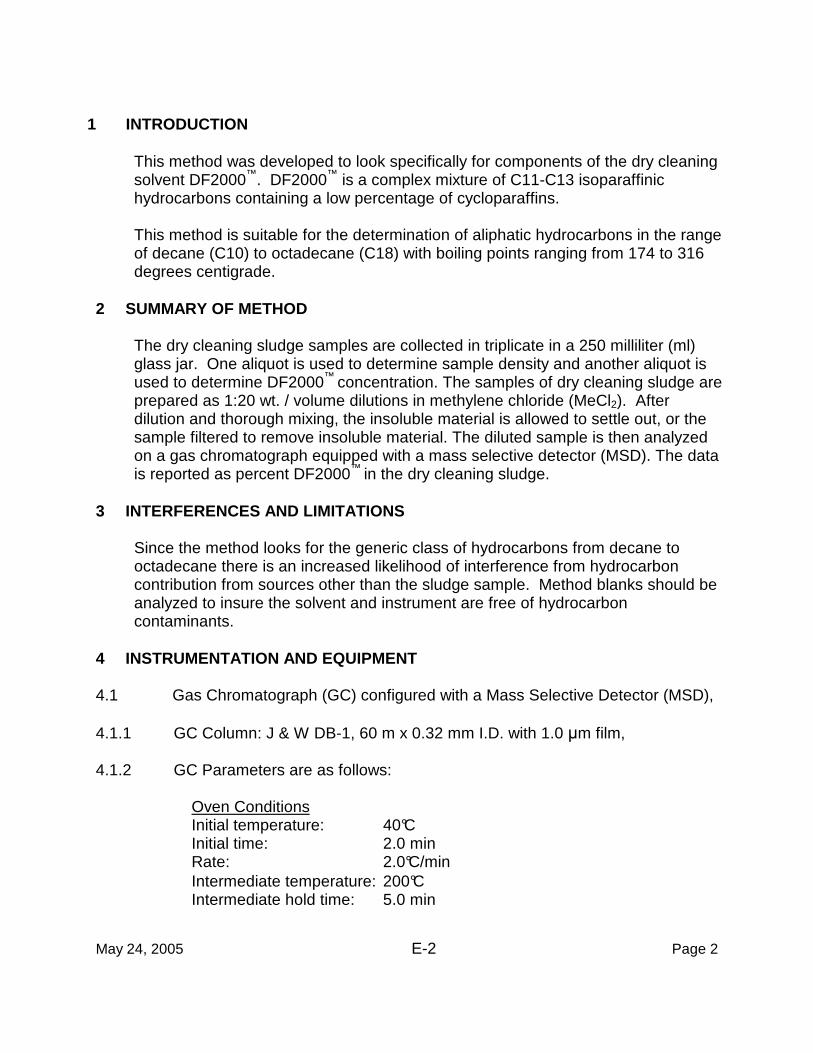
May 24, 2005 E-2 Page 2
1 INTRODUCTION
This method was developed to look specifically for components of the dry cleaningsolvent DF2000™. DF2000™ is a complex mixture of C11-C13 isoparaffinichydrocarbons containing a low percentage of cycloparaffins.
This method is suitable for the determination of aliphatic hydrocarbons in the rangeof decane (C10) to octadecane (C18) with boiling points ranging from 174 to 316degrees centigrade.
2 SUMMARY OF METHOD
The dry cleaning sludge samples are collected in triplicate in a 250 milliliter (ml)glass jar. One aliquot is used to determine sample density and another aliquot isused to determine DF2000™ concentration. The samples of dry cleaning sludge areprepared as 1:20 wt. / volume dilutions in methylene chloride (MeCl2). Afterdilution and thorough mixing, the insoluble material is allowed to settle out, or thesample filtered to remove insoluble material. The diluted sample is then analyzedon a gas chromatograph equipped with a mass selective detector (MSD). The datais reported as percent DF2000™ in the dry cleaning sludge.
3 INTERFERENCES AND LIMITATIONS
Since the method looks for the generic class of hydrocarbons from decane tooctadecane there is an increased likelihood of interference from hydrocarboncontribution from sources other than the sludge sample. Method blanks should beanalyzed to insure the solvent and instrument are free of hydrocarboncontaminants.
4 INSTRUMENTATION AND EQUIPMENT
4.1 Gas Chromatograph (GC) configured with a Mass Selective Detector (MSD),
4.1.1 GC Column: J & W DB-1, 60 m x 0.32 mm I.D. with 1.0 µm film,
4.1.2 GC Parameters are as follows:
Oven ConditionsInitial temperature: 40°C Initial time: 2.0 minRate: 2.0°C/minIntermediate temperature: 200°C Intermediate hold time: 5.0 min
May 24, 2005 E-3 Page 3
Rate: 40° C/minFinal Temperature: 320°CFinal Hold Time: 1.0 minRun time: 91.0 minOven equilibration: 0.3 minInjector temperature: 300°C Interface temperature: 300°CCarrier gas (He): 1.46 ml/minSource Temperature: 150°CMSD scan range: 40 to 500 amuSplit Flow: Splitless for 1.0 min
4.2 10 ml Volumetric Flasks,
4.3 Rainin Pipettors: 250 µl, 1.0 ml, 2.5 ml with tips,
4.4 Vials and Jars:
4.4.1 8 mL with PTFE-lined cap, for standards and dilutions,
4.4.2 2 mL with caps, for GC-MSD analysis,
4.4.3 250 ml widemouth glass jars with PTFE –lined caps,
4.4.4 15 ml graduated disposable polypropylene conical tubes,
4.5 Analytical Balance capable weighing to 0.1 milligram,
4.6 Vortex Mixer, variable speed.
5 REAGENTS
5.1 Dichloromethane, Pesticide grade or better,
5.2 DF2000™ directly from the manufacturer or the dry cleaners supply,
5.3 Stock Standards: The 15 mg/mL stock standard is prepared gravimetrically,
5.4 Helium, grade 5.
6 PROCEDURE
6.1 Sample Collection:
May 24, 2005 E-4 Page 4
6.1.1 Samples are collected from eight (8) liter buckets of dry cleaning sludgewhich represents the total contents of the dry cleaning machine sump.
6.1.2 Using a long wooden or metal stirring rod, stir the collected sludge toresuspend the solid material as much as possible.
6.1.3 Using a cup or jar fill a 250 ml jar with the stirred dry cleaning sludge.
6.1.4 Clean the jar, seal the container, and attach the sample identification label.
6.1.5 Repeat this process two more times making sure the sludge is remixedbetween each sampling.
6.1.6 If the aliquoted samples are not to be analyzed immediately store either ina laboratory hood or in a refrigerator.
6.2 Sample Preparation:
6.2.1 The collected samples are entered into the laboratory informationmanagement system (LIMS) and given a unique identification number.
6.2.2 If the samples were stored in the refrigerator allow them to warm toambient temperature prior to analysis.
6.2.3 Density Determination:
6.2.3.1 Tare a polypropylene conical tube (Becton-Dickinson 15 ml) on a toploading balance.
6.2.3.2 For the determination of water density as a control check, fill the conicaltube with water and cap making sure no air bubbles are present.
6.2.3.3 Weigh the tube to the nearest hundreth of a gram. The tubes will hold16 ml when filled to capacity
6.2.3.4 Repeat the water density determination two more times. The averagewater density should be 1.0 g/ml.
6.2.3.5 Mix the sludge samples well and aliquot into a pouring beaker. Pour intoa 15 ml conical tube as described in 6.2.3.2.
6.2.3.6 Weigh the tube and record the weight.
6.2.3.7 Repeat the sludge density determination two more times using a cleantube for each determination.
May 24, 2005 E-5 Page 5
6.2.3.8 Enter weights in the dry cleaning ATCM spreadsheet. The density iscalculated as weight per 16 mls and recorded in g/ml.
6.2.3.9 The tubes should be disposed in the hazardous waste container.
6.2.4 DF2000™ Determination:
6.2.4.1 Weigh approximately 0.5 ml of sludge into a 10 ml volumetric flask.
6.2.4.2 Fill to the mark with MeCl2.
6.2.4.3 Mix well and transfer into an eight (8) ml disposable vial with a PFTElined cap. Allow the solids to settle out before analysis.
6.2.4.4 Make a serial dilution such that the final concentration of sludge is in thethree (3) to five (5) milligram per milliliter range.
6.2.4.5 Transfer an aliquot to a 1.8 ml autoinjector vial.
6.3 Instrument Preparation:
6.3.1 Verify helium cylinder pressure is above 500 psi.
6.3.2 Load the Exxon method into the GC/MSD.
6.3.3 After system equilibrates TUNE the MSD using the Standard Tunecommand.
6.3.4 After tuning the MSD check to insure the calibration is acceptable.
6.4 Analysis Preparation:
6.4.1 Solvent Blank: Prepare solvent blank by filling a GC vial with the sameMeCl2 used to make the dilutions in steps 6.2.2 – 6.2.4. Cap the vial.
6.4.2 Calibration Standards: Prepare the five DF2000™ calibration standards in10 mL volumetric flasks as follows:
Concentration Volume of Stock Standard0.1 mg/mL 0.0665 mL0.2 mg/mL 0.1330.5 mg/mL 0.3331.0 mg/mL 0.6672.0 mg/mL 1.333
May 24, 2005 E-6 Page 6
Bring to volume with MeCl2, mix thoroughly and place in dilution vials.
6.4.3 Transfer an aliquot of each standard into a GC vial and cap.
6.5 Sample Analysis:
6.5.1 Place vials in the autosampler in the following order: MeCl2 blank,calibration standards, continuing calibration verification, and dilutedsamples. The continuing calibration verifcation standard is run every tenthsample and at the end of the run. Additional blanks between standardsand samples maybe used if carryover is suspected.
6.5.2 Calculate the value for each analyte found by dividing the amount from thereport (mg/mL) by the sample dilution weight (see Section 8).
7 QUALITY CONTROL
7.1 An MeCl2 solvent blank must be analyzed for each batch of samples. Theanalyte concentration in the blank must be less than 0.1 mg/ml. An MeCl2blank is run before the control and each check to prevent carry over from theprevious sample.
7.2 The correlation coefficient for compounds present in the calibration must begreater than 0.995. If the calibration fails, the sequence is stopped andcorrective action is implemented.
7.3 A continuing calibration verification (CCV) sample is run after every tensamples and at the end of the run. The CCV must fall within +/- 25% of thetrue value. If one of the CCV’s is out of the control limits, re-run the CCV andany samples that follow until the next acceptable CCV.
8 QUANTIFICATION
8.1 Because DF2000™ is a complex mixture, seven (7) peaks are used torepresent the entire complex mixture during quantitation. The peaks areidentified as Peaks 1 through 7.
8.2 Peaks 1 through 7 are identified by retention times which are listed in Table 1.
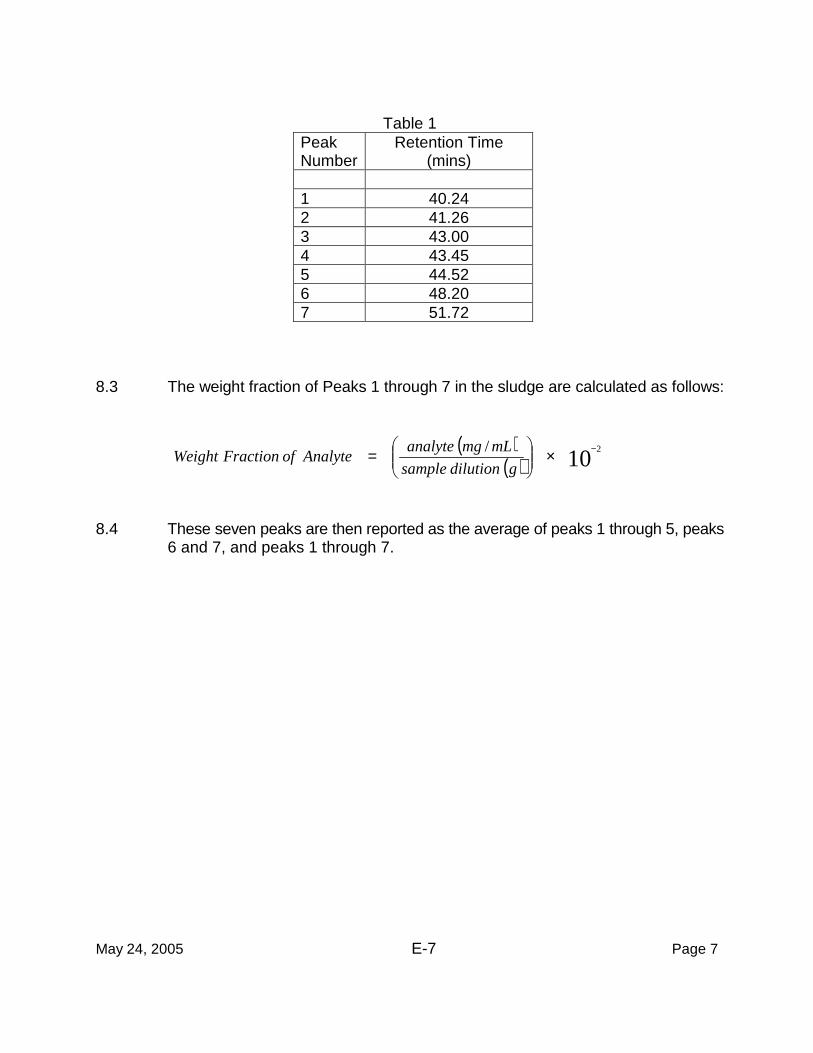
May 24, 2005 E-7 Page 7
Table 1PeakNumber
Retention Time(mins)
1 40.242 41.263 43.004 43.455 44.526 48.207 51.72
8.3 The weight fraction of Peaks 1 through 7 in the sludge are calculated as follows:
8.4 These seven peaks are then reported as the average of peaks 1 through 5, peaks6 and 7, and peaks 1 through 7.
( )( ) 10
2/ −×
=
gdilutionsample
mLmganalyteAnalyteofFractionWeight
Appendix F
Sludge Sampling Results
F-1
Table F-1. Perc Sludge Test Results (Primary Machines)
Machine TestNo.
Make ModelYear
SludgeDensity(g/ml)
SludgeDensity(lb/gal)
%solvent
insludge
# offilter
Machine A 1 Bowe Permac 1994 1.20 10.00 44 0Machine A 2 Bowe Permac 1994 1.13 9.39 17 0Machine A 3 Bowe Permac 1994 1.08 9.03 18 0Machine B 1 Bowe Permac 1991 1.08 9.03 21 0Machine B 2 Bowe Permac 1991 1.07 8.95 14 0Machine B 3 Bowe Permac 1991 1.07 8.92 11 0Machine C 1 Bowe Permac 1999 1.02 8.50 14 0Machine C 2 Bowe Permac 1999 1.16 9.70 29 0Machine D 1 Midwest 1988 1.37 11.45 67 0Machine D 2 Midwest 1988 1.20 10.00 41 0Machine D 3 Midwest 1988 1.33 11.06 69 0Machine E 1 Columbia 1993 1.26 10.50 61 0Machine E 2 Columbia 1993 1.17 9.78 39 0Machine E 3 Columbia 1993 1.30 10.81 65 0Machine F 1 Columbia 2000 1.18 9.84 40 0Machine F 2 Columbia 2000 1.09 9.09 31 0Machine F 3 Columbia 2000 1.11 9.25 33 0
F-2
Table F-2. Perc Sludge Test Results (Secondary Machines)
Machine TestNo.
Make ModelYear
SludgeDensity(g/ml)
SludgeDensity(lb/gal)
%solvent
insludge
# offilter
Machine A,B1 1 Columbia 1997 1.19 9.92 43 0Machine A,B1 2 Columbia 1997 1.21 10.09 51 0Machine A,B1 3 Columbia 1997 1.20 9.98 41 0Machine C 1 Victory 1996 1.20 10.00 45 3Machine C 2 Victory 1996 1.17 9.75 38 3Machine C 1 Victory 1986 1.15 9.56 44 3
1. Machines A and B have a common still.
F-3
Table F-3. DF-2000 Sludge Test Results
Machine ID TestNo.
Make ModelYear
SludgeDensity(g/ml)
SludgeDensity(lb/gal)
%solvent
insludge
# offilter
Machine A 1 Realstar 1997 0.898 7.49 26 12Machine A 2 Realstar 1997 0.892 7.44 29 12Machine A 3 Realstar 1997 0.891 7.43 24 12Machine B 1 Realstar 2003 0.920 7.67 12 10Machine B 2 Realstar 2003 0.922 7.68 11 10Machine B 3 Realstar 2003 0.913 7.61 15 10

Appendix G
OEHHA Memorandum
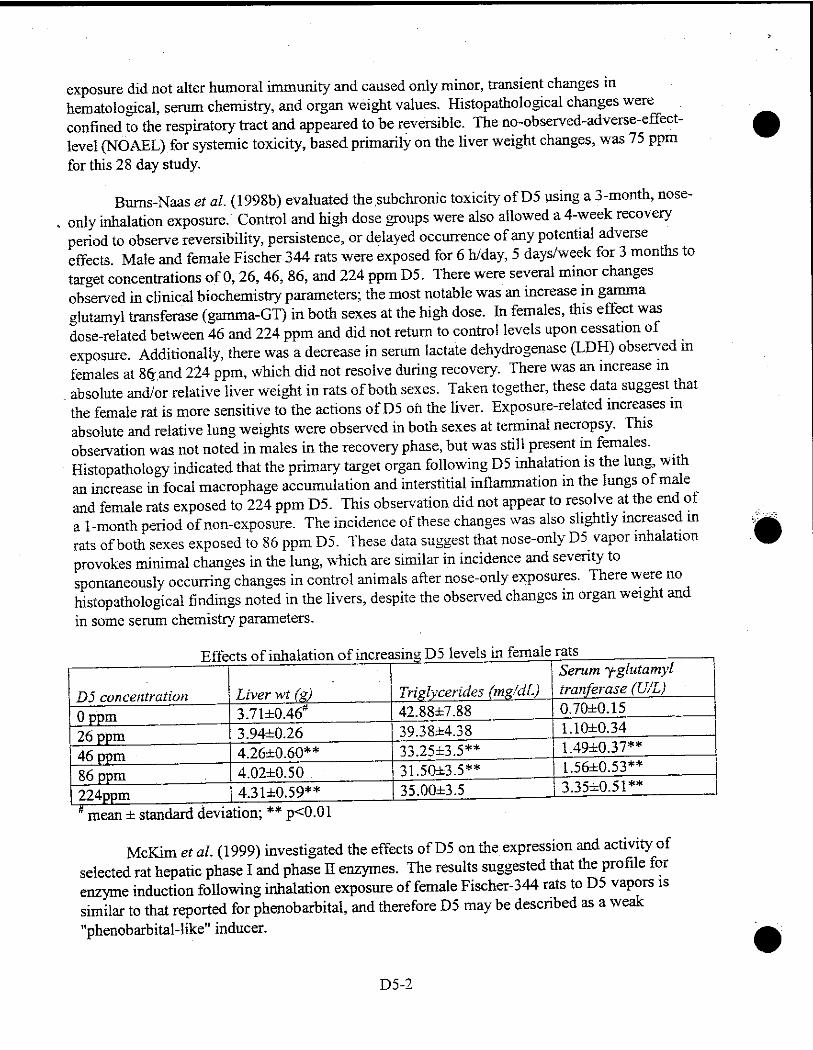
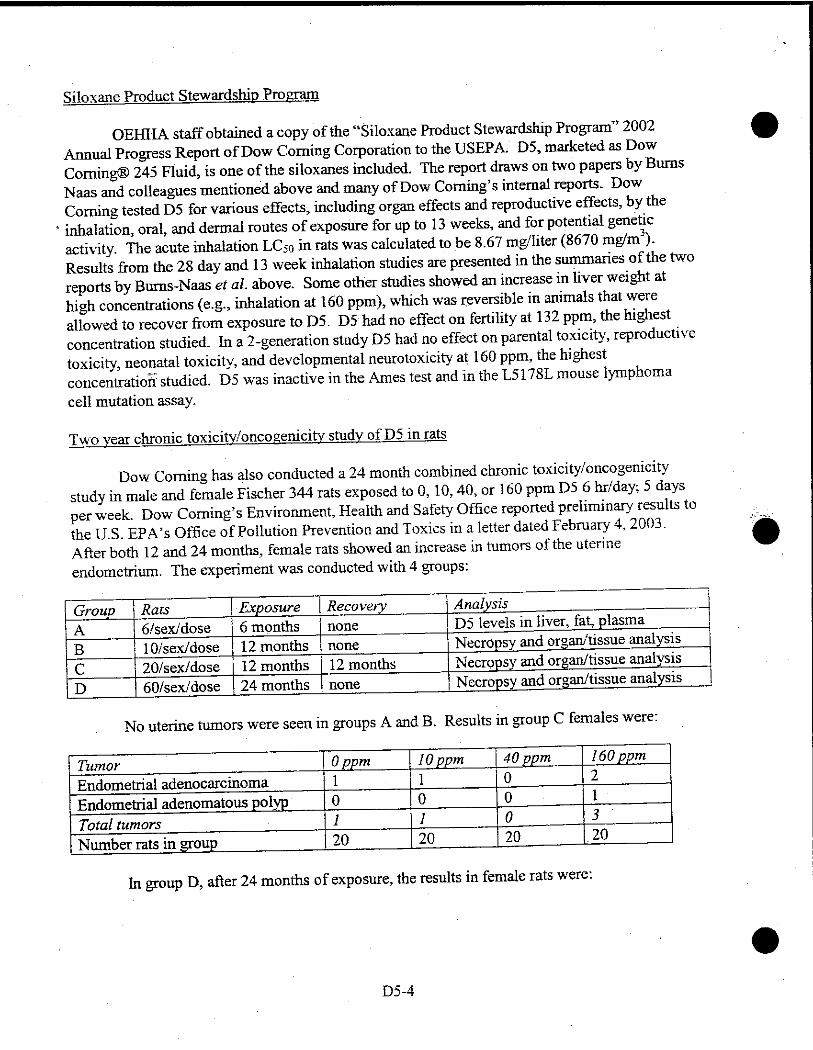
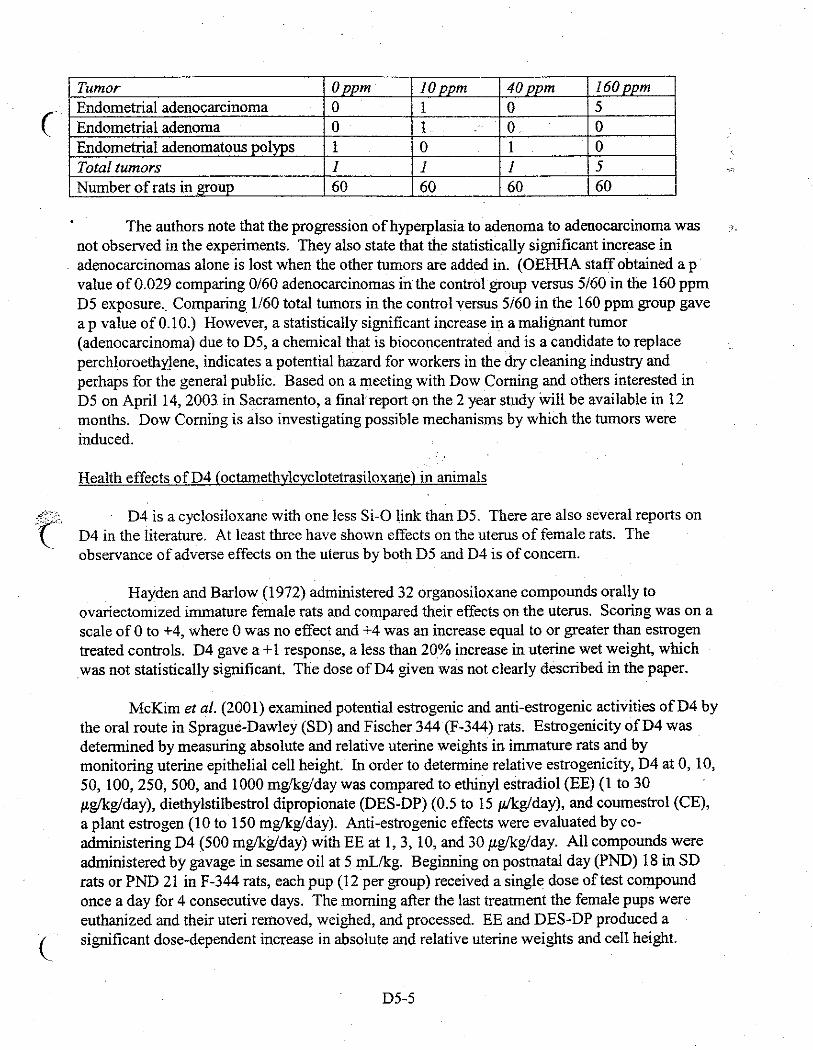
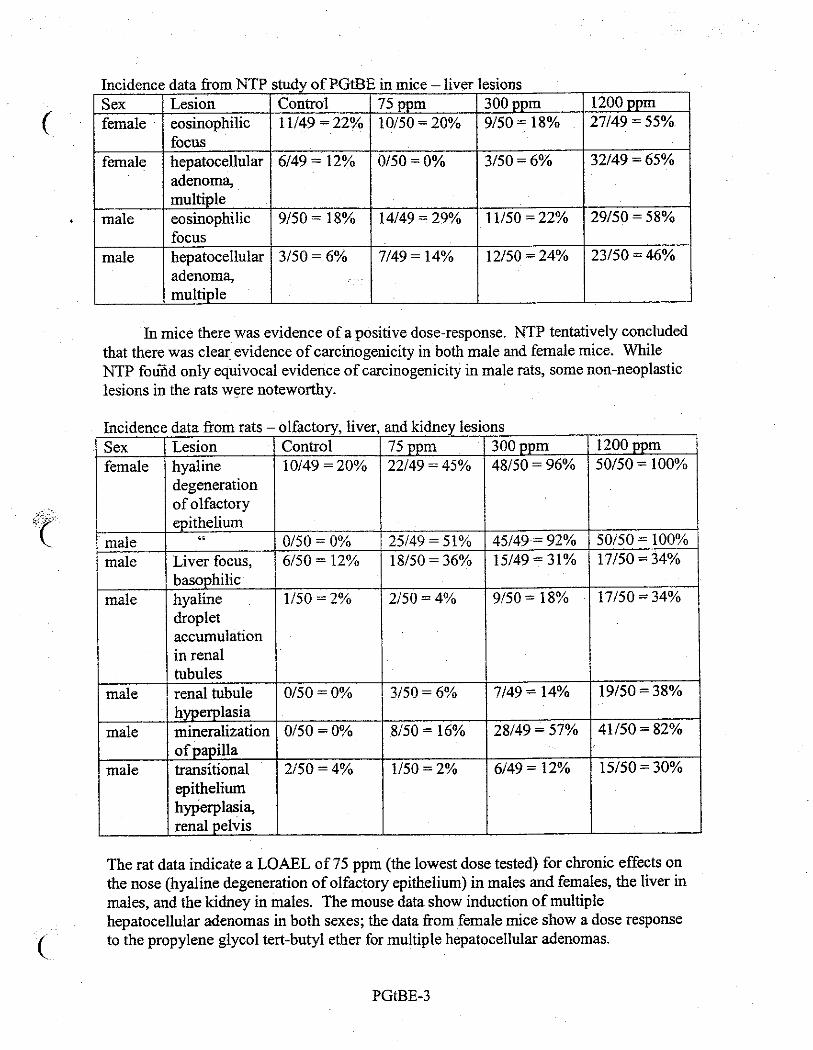
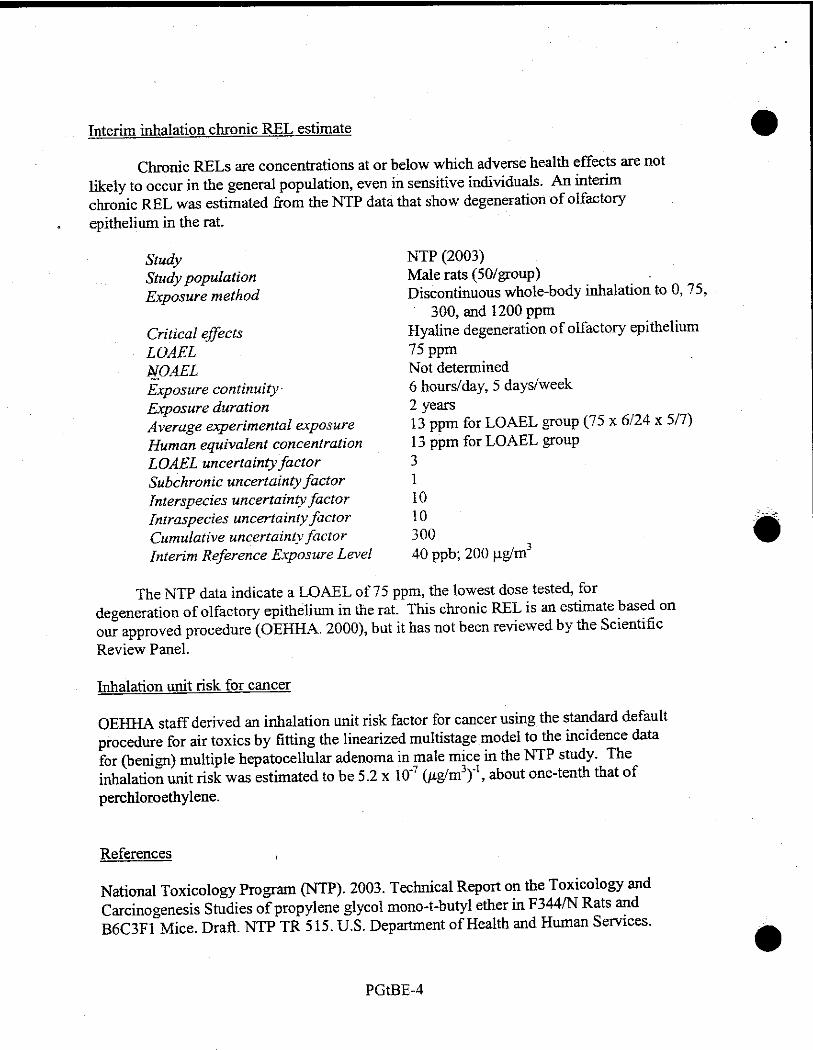
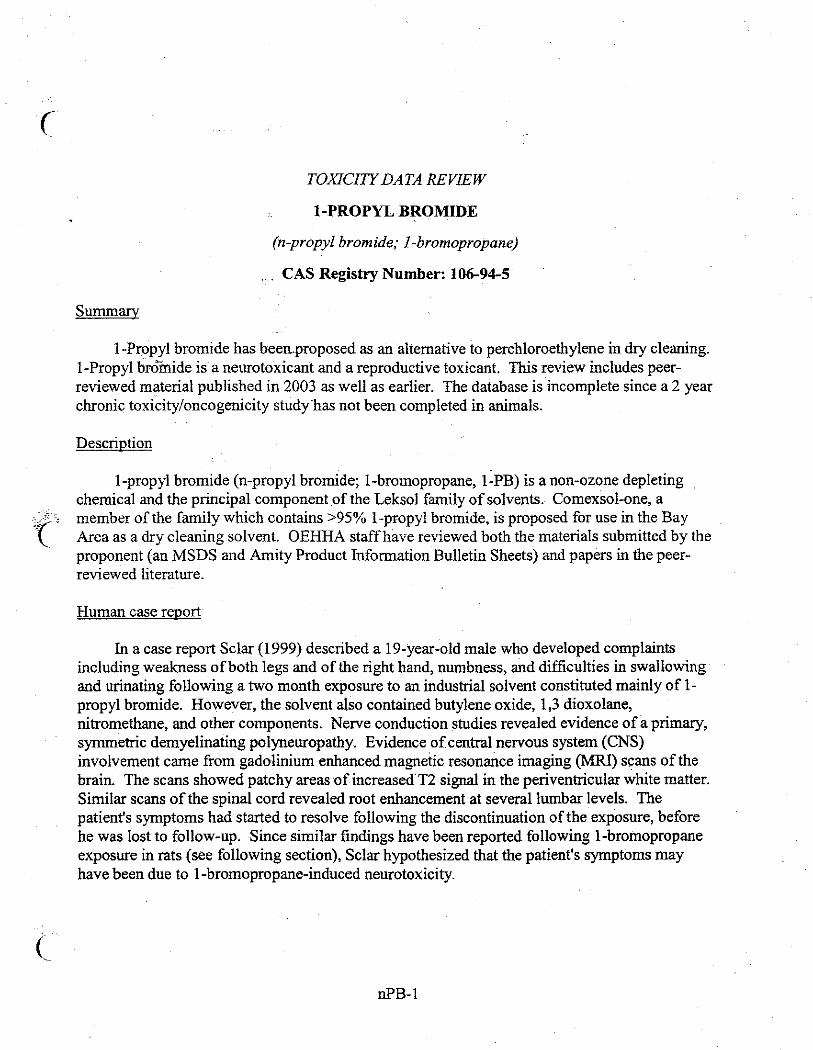
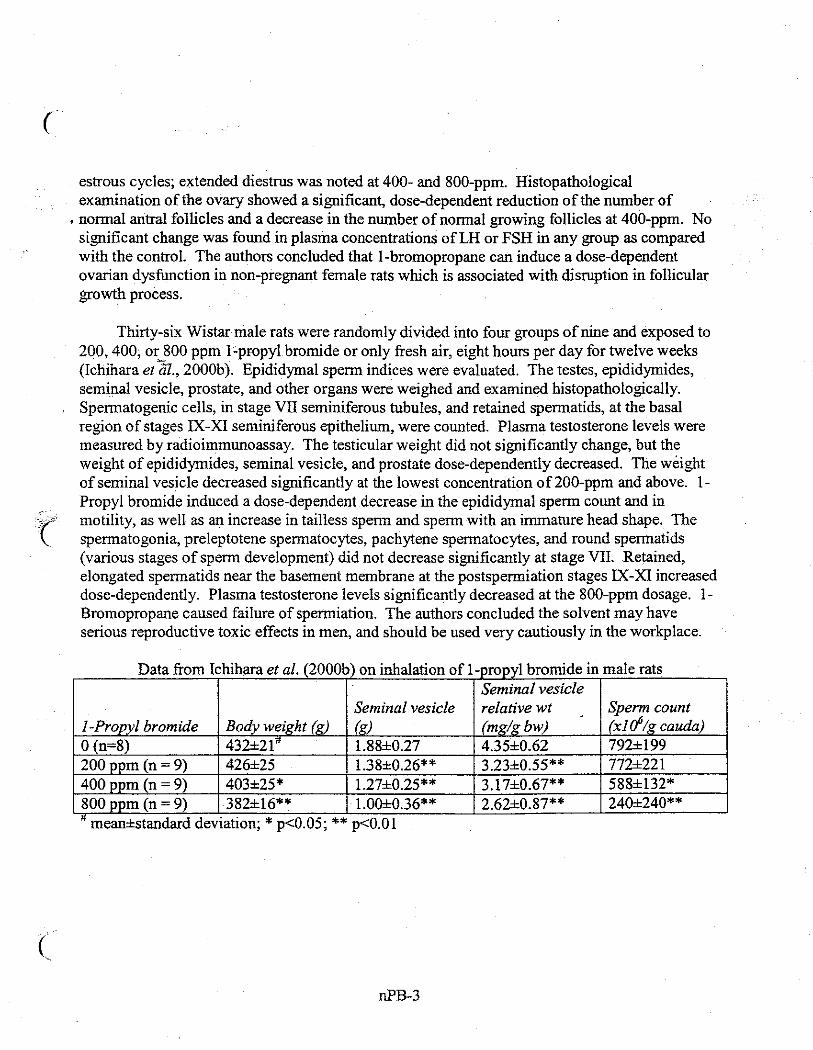
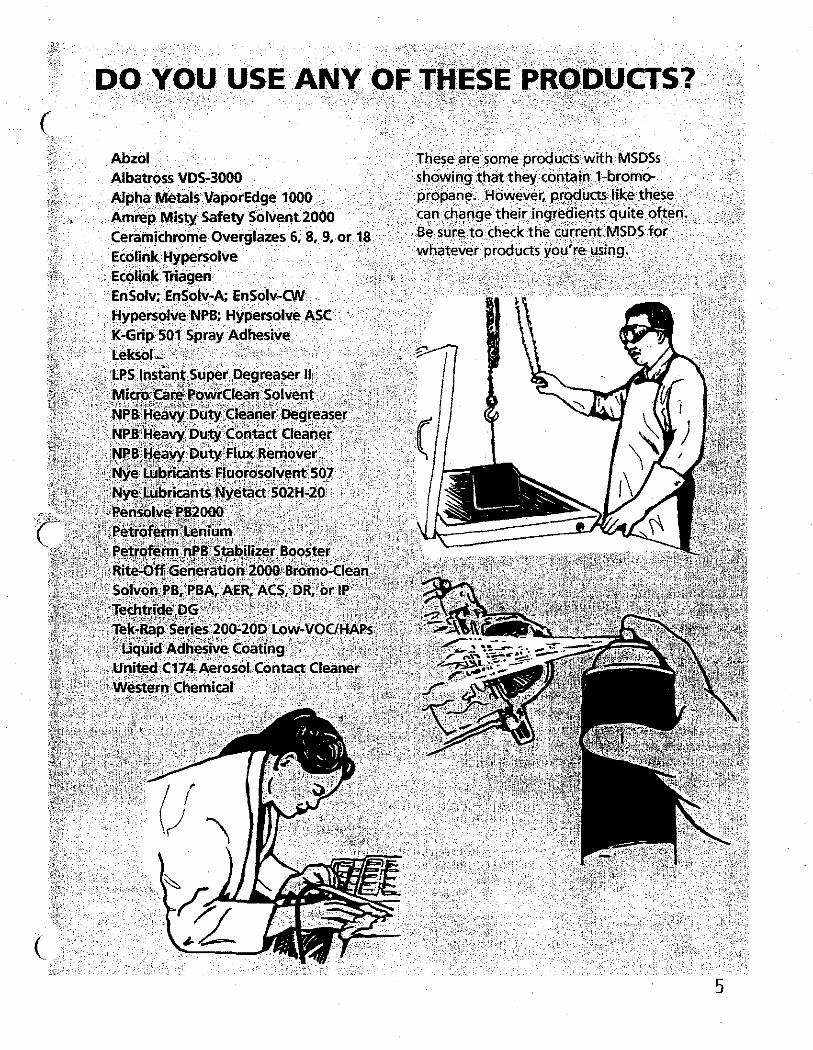
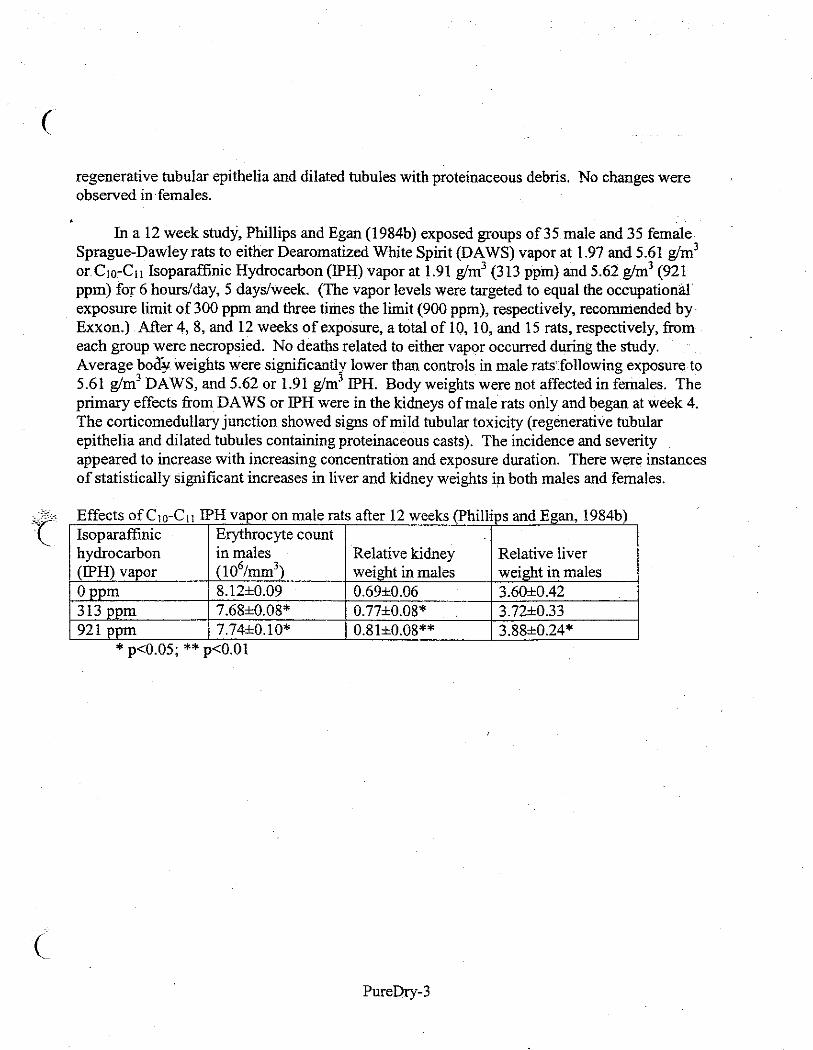
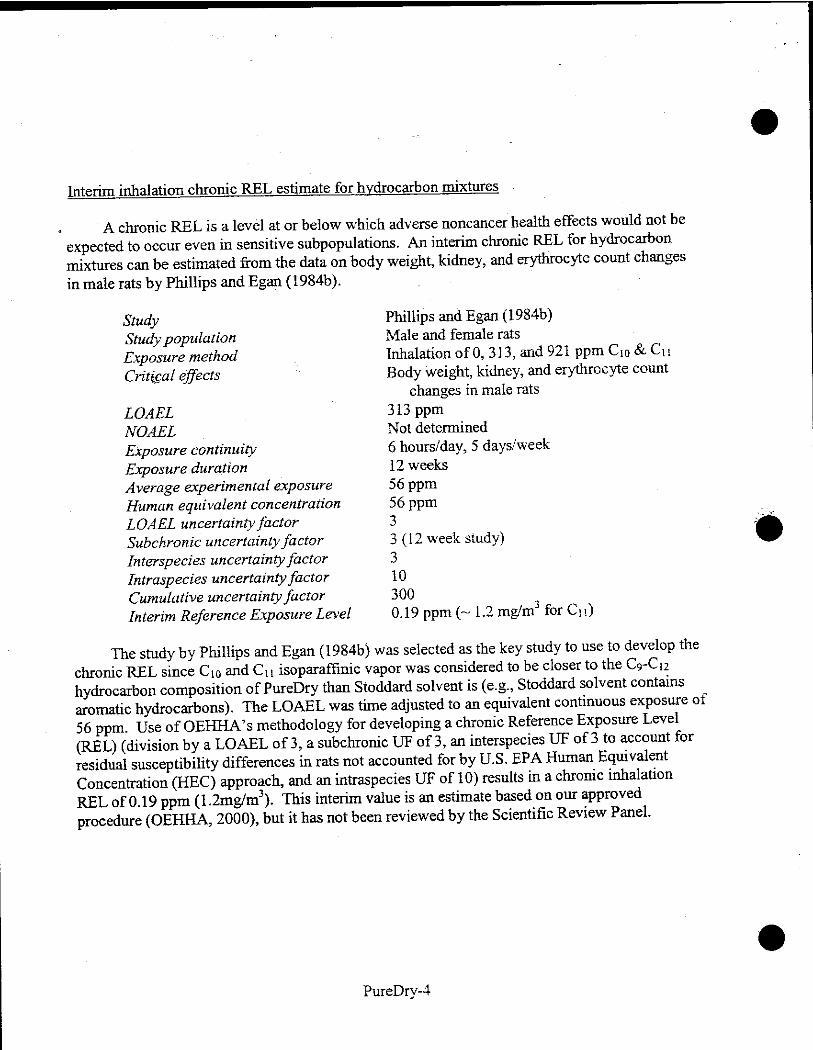
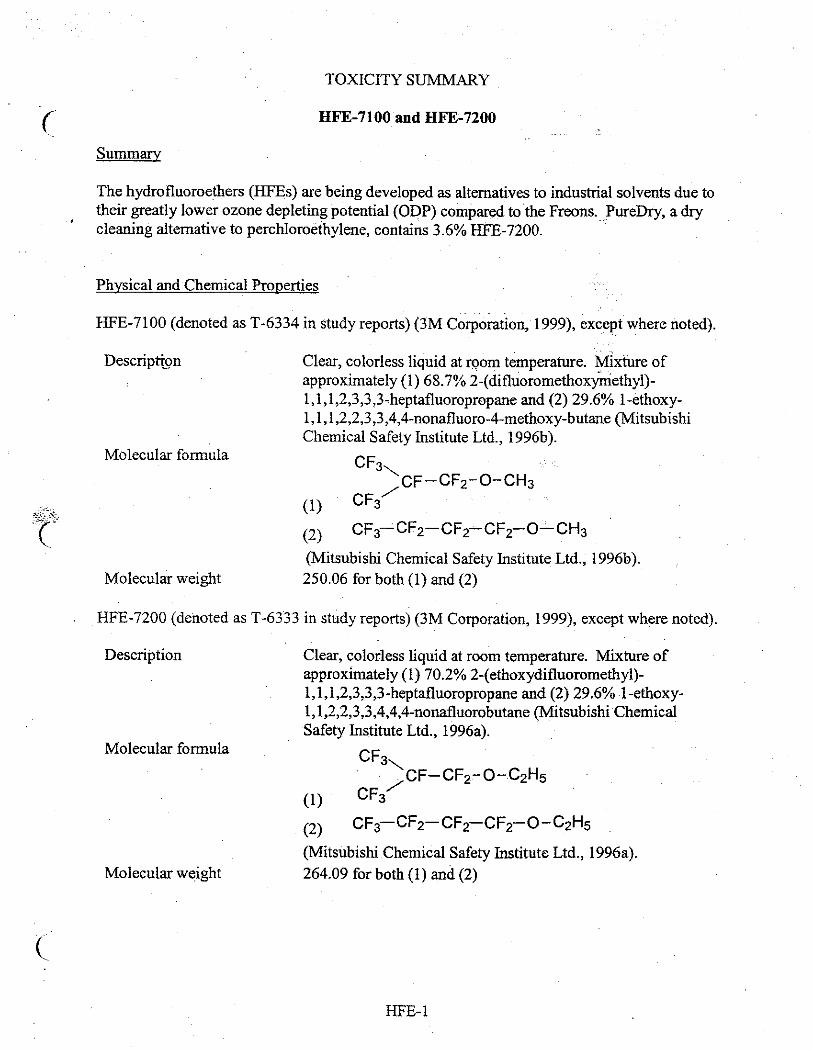
Appendix H
Laboratory Evaluation of Leak Detectors
Alan C. Lloyd, Ph.D. Agency Secretary
The energy challenge facing California is real. Every Californian needs to take immediate action to reduce energy consumption. For a list of simple ways you can reduce demand and cut your energy costs, see our Website: http://www.arb.ca.gov.
California Environmental Protection Agency
Printed on Recycled Paper
Air Resources Board
1001 I Street • P.O. Box 2815 Sacramento, California 95812 • www.arb.ca.gov
Arnold Schwarzenegger Governor
MEMORANDUM
TO: Richard Boyd, Manager Emissions Evaluation Section Stationary Source Division FROM: Dennis Goodenow, Manager Source Testing Section Monitoring and Laboratory Division DATE: October 3, 2005 SUBJECT: Portable VOC Analyzer Evaluations
At the request of the Emissions Evaluation Section (EES), the Monitoring and Laboratory Division Source Testing Section (STS) is engaged in ongoing evaluations of portable VOC analyzers. The evaluations are intended to compare responses from analyzers of varying cost and detection principles to perchloroethylene (PERC) gas calibration standards. Stationary Source Division is considering amendment of the vapor leak threshold in the ATCM for PERC emissions from dry cleaning operations. An initial, qualitative evaluation of two low cost analyzers was performed October 4, 2004 at the Source Testing Section facility at 1301 V Street in Sacramento. Results for this evaluation were reported to the Emissions Evaluation Section in an October 28, 2004 memorandum. However, the results are of questionable validity because they were produced using a non-traceable PERC standard with an assumed concentration of 50 ppmv. STS has since procured certified, traceable dry calibration standards of 25 ppmv PERC, 50 ppmv PERC and 100 ppmv isobutylene. EES has also identified eight additional portable analyzers and presented them to STS for evaluation. The analyzers range in sophistication from semiconductor sensors with audible alarms costing approximately $200.00 to photoionization detectors with LCD displays costing in excess of $3,000.00. The ten analyzers and their respective principles of operation are identified in Table 1. The h⋅nu Systems HW-101 was the designated reference analyzer for this survey based on its availability and photoionization detector (PID). The other PID analyzers used in the survey were available to EES on a temporary basis. The HW-101 analog display is also motion sensitive, making it impractical for field use as a leak detection tool. Although the HW-101 display is a relatively unsophisticated analog potentiometer, it
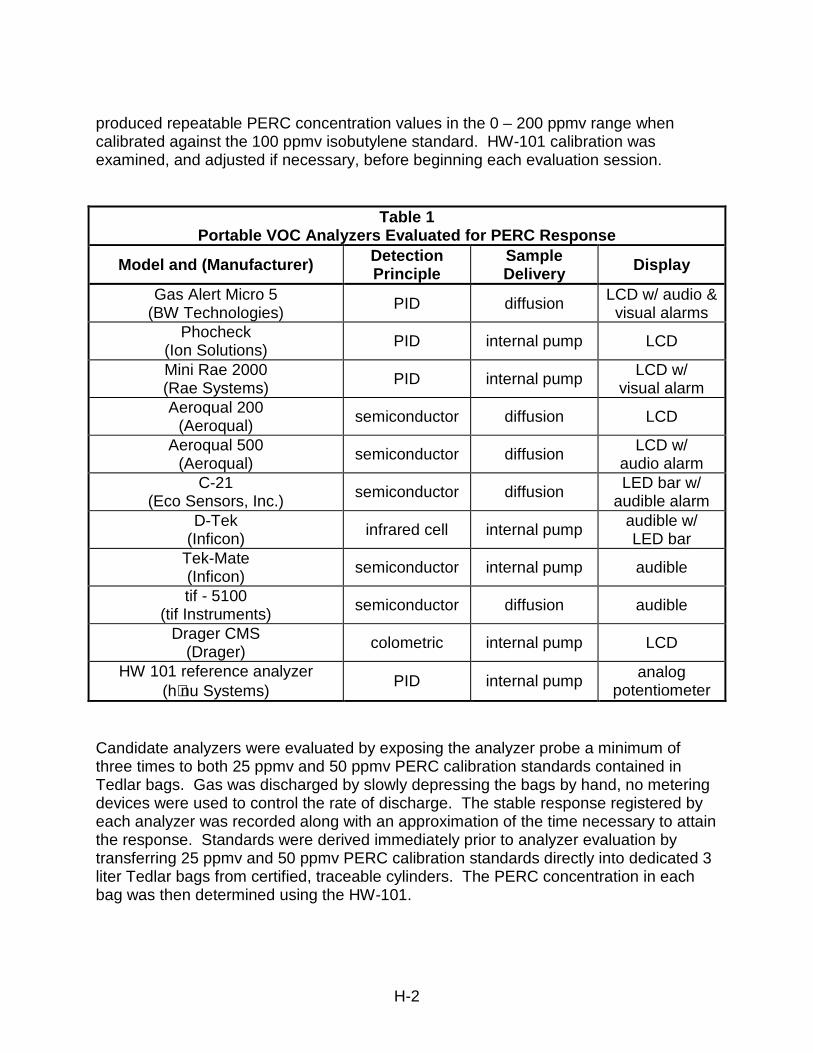
H-2
produced repeatable PERC concentration values in the 0 – 200 ppmv range when calibrated against the 100 ppmv isobutylene standard. HW-101 calibration was examined, and adjusted if necessary, before beginning each evaluation session.
Table 1 Portable VOC Analyzers Evaluated for PERC Response
Model and (Manufacturer) Detection Principle
Sample Delivery Display
Gas Alert Micro 5 (BW Technologies)
PID diffusion LCD w/ audio & visual alarms
Phocheck (Ion Solutions)
PID internal pump LCD
Mini Rae 2000 (Rae Systems)
PID internal pump LCD w/ visual alarm
Aeroqual 200 (Aeroqual)
semiconductor diffusion LCD
Aeroqual 500 (Aeroqual)
semiconductor diffusion LCD w/ audio alarm
C-21 (Eco Sensors, Inc.)
semiconductor diffusion LED bar w/ audible alarm
D-Tek (Inficon)
infrared cell internal pump audible w/ LED bar
Tek-Mate (Inficon)
semiconductor internal pump audible
tif - 5100 (tif Instruments)
semiconductor diffusion audible
Drager CMS (Drager)
colometric internal pump LCD
HW 101 reference analyzer (h⋅nu Systems)
PID internal pump analog potentiometer
Candidate analyzers were evaluated by exposing the analyzer probe a minimum of three times to both 25 ppmv and 50 ppmv PERC calibration standards contained in Tedlar bags. Gas was discharged by slowly depressing the bags by hand, no metering devices were used to control the rate of discharge. The stable response registered by each analyzer was recorded along with an approximation of the time necessary to attain the response. Standards were derived immediately prior to analyzer evaluation by transferring 25 ppmv and 50 ppmv PERC calibration standards directly into dedicated 3 liter Tedlar bags from certified, traceable cylinders. The PERC concentration in each bag was then determined using the HW-101.
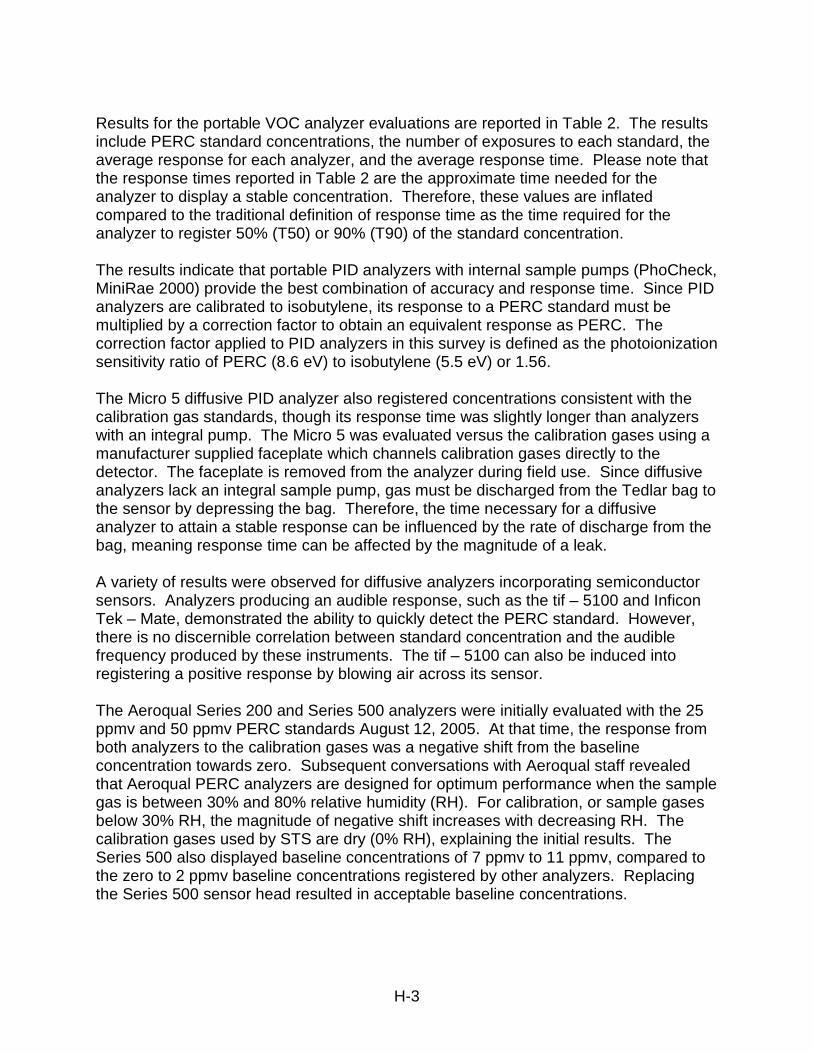
H-3
Results for the portable VOC analyzer evaluations are reported in Table 2. The results include PERC standard concentrations, the number of exposures to each standard, the average response for each analyzer, and the average response time. Please note that the response times reported in Table 2 are the approximate time needed for the analyzer to display a stable concentration. Therefore, these values are inflated compared to the traditional definition of response time as the time required for the analyzer to register 50% (T50) or 90% (T90) of the standard concentration. The results indicate that portable PID analyzers with internal sample pumps (PhoCheck, MiniRae 2000) provide the best combination of accuracy and response time. Since PID analyzers are calibrated to isobutylene, its response to a PERC standard must be multiplied by a correction factor to obtain an equivalent response as PERC. The correction factor applied to PID analyzers in this survey is defined as the photoionization sensitivity ratio of PERC (8.6 eV) to isobutylene (5.5 eV) or 1.56. The Micro 5 diffusive PID analyzer also registered concentrations consistent with the calibration gas standards, though its response time was slightly longer than analyzers with an integral pump. The Micro 5 was evaluated versus the calibration gases using a manufacturer supplied faceplate which channels calibration gases directly to the detector. The faceplate is removed from the analyzer during field use. Since diffusive analyzers lack an integral sample pump, gas must be discharged from the Tedlar bag to the sensor by depressing the bag. Therefore, the time necessary for a diffusive analyzer to attain a stable response can be influenced by the rate of discharge from the bag, meaning response time can be affected by the magnitude of a leak. A variety of results were observed for diffusive analyzers incorporating semiconductor sensors. Analyzers producing an audible response, such as the tif – 5100 and Inficon Tek – Mate, demonstrated the ability to quickly detect the PERC standard. However, there is no discernible correlation between standard concentration and the audible frequency produced by these instruments. The tif – 5100 can also be induced into registering a positive response by blowing air across its sensor. The Aeroqual Series 200 and Series 500 analyzers were initially evaluated with the 25 ppmv and 50 ppmv PERC standards August 12, 2005. At that time, the response from both analyzers to the calibration gases was a negative shift from the baseline concentration towards zero. Subsequent conversations with Aeroqual staff revealed that Aeroqual PERC analyzers are designed for optimum performance when the sample gas is between 30% and 80% relative humidity (RH). For calibration, or sample gases below 30% RH, the magnitude of negative shift increases with decreasing RH. The calibration gases used by STS are dry (0% RH), explaining the initial results. The Series 500 also displayed baseline concentrations of 7 ppmv to 11 ppmv, compared to the zero to 2 ppmv baseline concentrations registered by other analyzers. Replacing the Series 500 sensor head resulted in acceptable baseline concentrations.
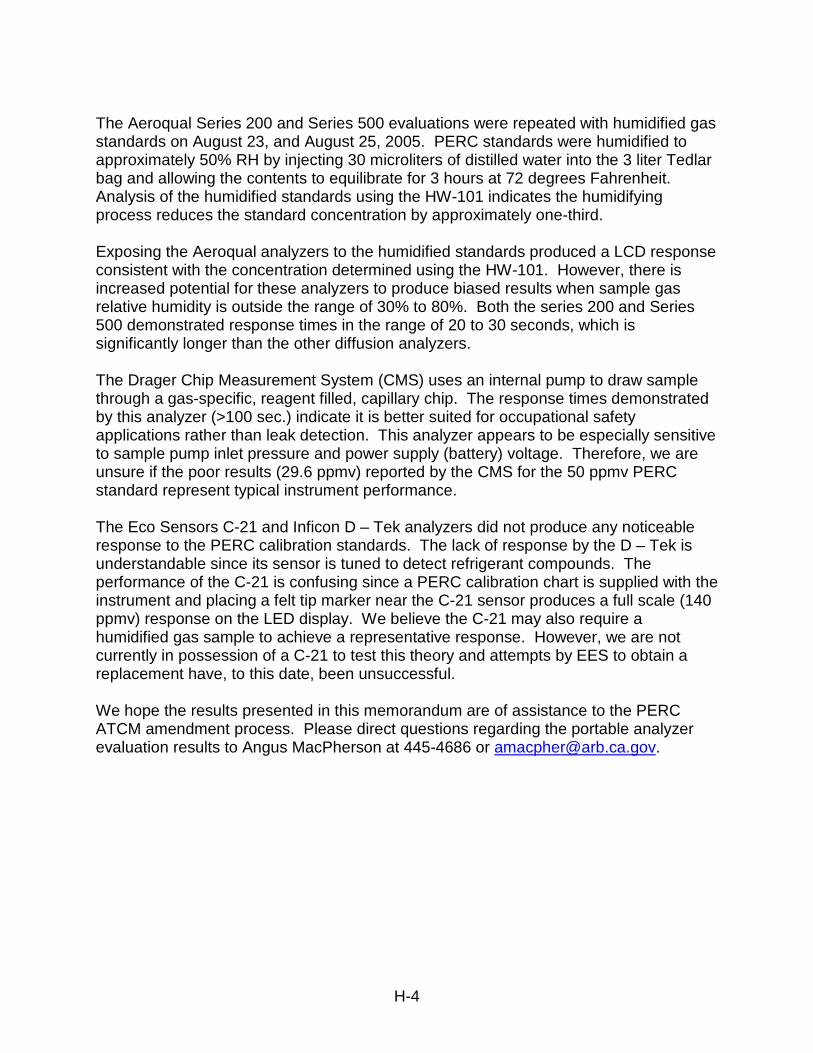
H-4
The Aeroqual Series 200 and Series 500 evaluations were repeated with humidified gas standards on August 23, and August 25, 2005. PERC standards were humidified to approximately 50% RH by injecting 30 microliters of distilled water into the 3 liter Tedlar bag and allowing the contents to equilibrate for 3 hours at 72 degrees Fahrenheit. Analysis of the humidified standards using the HW-101 indicates the humidifying process reduces the standard concentration by approximately one-third. Exposing the Aeroqual analyzers to the humidified standards produced a LCD response consistent with the concentration determined using the HW-101. However, there is increased potential for these analyzers to produce biased results when sample gas relative humidity is outside the range of 30% to 80%. Both the series 200 and Series 500 demonstrated response times in the range of 20 to 30 seconds, which is significantly longer than the other diffusion analyzers. The Drager Chip Measurement System (CMS) uses an internal pump to draw sample through a gas-specific, reagent filled, capillary chip. The response times demonstrated by this analyzer (>100 sec.) indicate it is better suited for occupational safety applications rather than leak detection. This analyzer appears to be especially sensitive to sample pump inlet pressure and power supply (battery) voltage. Therefore, we are unsure if the poor results (29.6 ppmv) reported by the CMS for the 50 ppmv PERC standard represent typical instrument performance. The Eco Sensors C-21 and Inficon D – Tek analyzers did not produce any noticeable response to the PERC calibration standards. The lack of response by the D – Tek is understandable since its sensor is tuned to detect refrigerant compounds. The performance of the C-21 is confusing since a PERC calibration chart is supplied with the instrument and placing a felt tip marker near the C-21 sensor produces a full scale (140 ppmv) response on the LED display. We believe the C-21 may also require a humidified gas sample to achieve a representative response. However, we are not currently in possession of a C-21 to test this theory and attempts by EES to obtain a replacement have, to this date, been unsuccessful. We hope the results presented in this memorandum are of assistance to the PERC ATCM amendment process. Please direct questions regarding the portable analyzer evaluation results to Angus MacPherson at 445-4686 or [email protected].
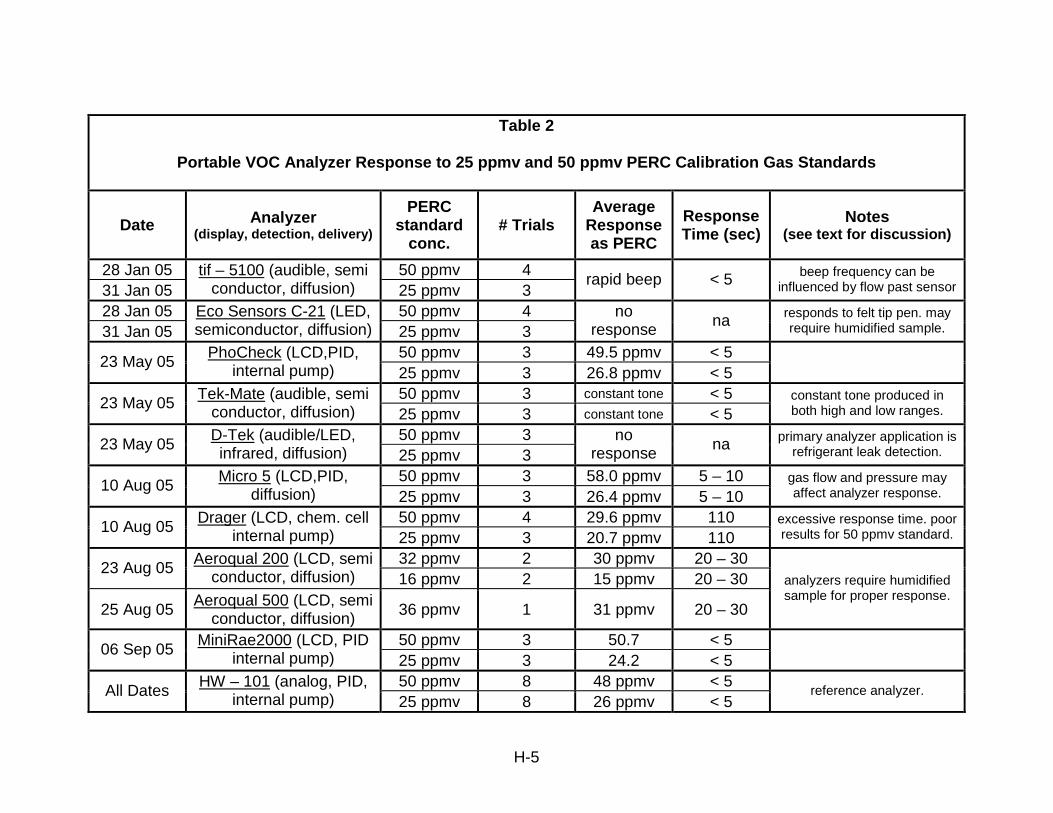
H-5
Table 2
Portable VOC Analyzer Response to 25 ppmv and 50 ppmv PERC Calibration Gas Standards
Date Analyzer (display, detection, delivery)
PERC standard
conc. # Trials
Average Response as PERC
Response Time (sec)
Notes (see text for discussion)
28 Jan 05 50 ppmv 4 31 Jan 05
tif – 5100 (audible, semi conductor, diffusion) 25 ppmv 3
rapid beep < 5 beep frequency can be influenced by flow past sensor
28 Jan 05 50 ppmv 4 31 Jan 05
Eco Sensors C-21 (LED, semiconductor, diffusion) 25 ppmv 3
no response na responds to felt tip pen. may
require humidified sample.
50 ppmv 3 49.5 ppmv < 5 23 May 05
PhoCheck (LCD,PID, internal pump) 25 ppmv 3 26.8 ppmv < 5
50 ppmv 3 constant tone < 5 23 May 05
Tek-Mate (audible, semi conductor, diffusion) 25 ppmv 3 constant tone < 5
constant tone produced in both high and low ranges.
50 ppmv 3 23 May 05
D-Tek (audible/LED, infrared, diffusion) 25 ppmv 3
no response na primary analyzer application is
refrigerant leak detection.
50 ppmv 3 58.0 ppmv 5 – 10 10 Aug 05
Micro 5 (LCD,PID, diffusion) 25 ppmv 3 26.4 ppmv 5 – 10
gas flow and pressure may affect analyzer response.
50 ppmv 4 29.6 ppmv 110 10 Aug 05
Drager (LCD, chem. cell internal pump) 25 ppmv 3 20.7 ppmv 110
excessive response time. poor results for 50 ppmv standard.
32 ppmv 2 30 ppmv 20 – 30 23 Aug 05
Aeroqual 200 (LCD, semi conductor, diffusion) 16 ppmv 2 15 ppmv 20 – 30
25 Aug 05 Aeroqual 500 (LCD, semi
conductor, diffusion) 36 ppmv 1 31 ppmv 20 – 30
analyzers require humidified sample for proper response.
50 ppmv 3 50.7 < 5 06 Sep 05
MiniRae2000 (LCD, PID internal pump) 25 ppmv 3 24.2 < 5
50 ppmv 8 48 ppmv < 5 All Dates
HW – 101 (analog, PID, internal pump) 25 ppmv 8 26 ppmv < 5
reference analyzer.
Appendix I
Contact Information for Alternative Solvents
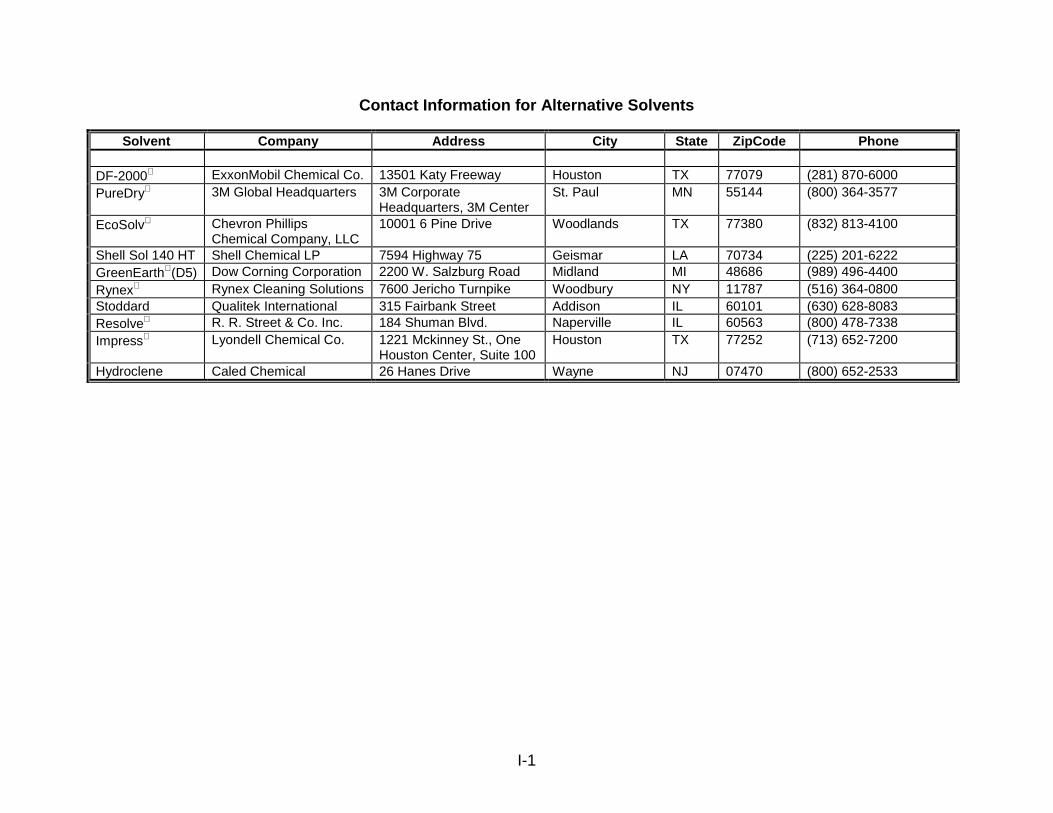
I-1
Contact Information for Alternative Solvents
Solvent Company Address City State ZipCode Phone DF-2000 ExxonMobil Chemical Co. 13501 Katy Freeway Houston TX 77079 (281) 870-6000 PureDry 3M Global Headquarters 3M Corporate
Headquarters, 3M Center St. Paul MN 55144 (800) 364-3577
EcoSolv Chevron Phillips Chemical Company, LLC
10001 6 Pine Drive Woodlands TX 77380 (832) 813-4100
Shell Sol 140 HT Shell Chemical LP 7594 Highway 75 Geismar LA 70734 (225) 201-6222 GreenEarth(D5) Dow Corning Corporation 2200 W. Salzburg Road Midland MI 48686 (989) 496-4400 Rynex Rynex Cleaning Solutions 7600 Jericho Turnpike Woodbury NY 11787 (516) 364-0800 Stoddard Qualitek International 315 Fairbank Street Addison IL 60101 (630) 628-8083 Resolve R. R. Street & Co. Inc. 184 Shuman Blvd. Naperville IL 60563 (800) 478-7338 Impress Lyondell Chemical Co. 1221 Mckinney St., One
Houston Center, Suite 100 Houston TX 77252 (713) 652-7200
Hydroclene Caled Chemical 26 Hanes Drive Wayne NJ 07470 (800) 652-2533
Appendix J
Electricity Cost Calculations
J-1
Electricity Cost Calculation
Equation 1 was used in combination with the information provided to us from the Machine Manufacturer Survey to calculate maximum operating load in kW for each machine.
(1) Maximum = (V)(A)(Power Factor)(Square Root of Phase)/1000
Operating Load
Where: V = machine voltage A = amperage of machine Power = power factor in percent, usually about 0.8 for single phase Factor and 0.9 for three phase. Assuming a typical load draws a 30 percent average of the maximum
operating load then Equation 2 was used to determine the kW that a typical load would draw. (JE, 2003)
(2) Typical Load kW = (Maximum Operating Load)(30 percent)
To calculate the hours that the machine runs Equation 3 was used.
(3) Hours Ran = (cycles/day)(minutes/cycle)(60 minutes/hour) Where: Hours Ran = the hours that the machine runs for one day Cycles/day = 6 cycles per day for a typical dry cleaner Minutes/ = the time each machine takes to run one cycle cycle
Equation 4 was used to determine what the cost per day would be to run the dry cleaning machine. (4) Cost Per Day = (typical load)(hours ran)(cost per kW)
Where:
Typical = kilowatts that a typical load draws, see Equation (2). Load Hours ran = the hours ran, see Equation (3). Cost per = the current cost for kWh, which is $0.10. kW
Typically a facility will dry clean 5 days a week. Equation 5 was used to determine the annual electricity cost for a facility to run their machine. (4) Cost Per Year = (cost per day)(5 days/week)(52 weeks/year)
Appendix K
Summary of Comments
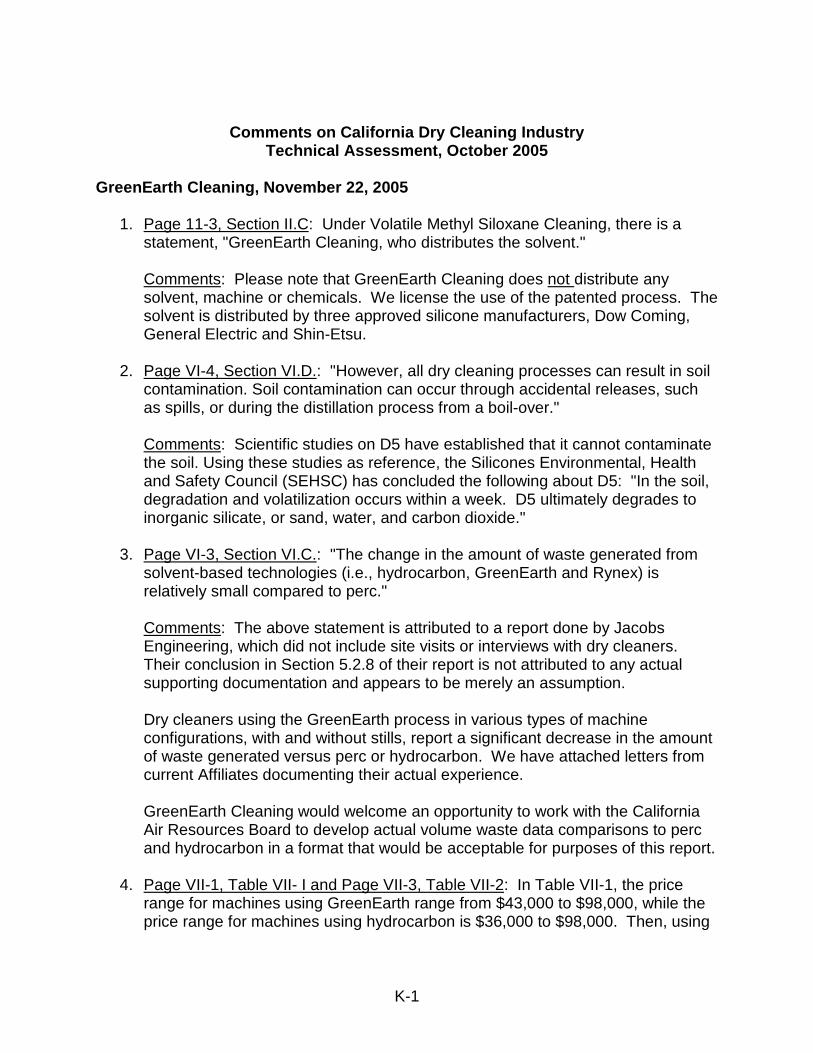
K-1
Comments on California Dry Cleaning Industry Technical Assessment, October 2005
GreenEarth Cleaning, November 22, 2005
1. Page 11-3, Section II.C: Under Volatile Methyl Siloxane Cleaning, there is a statement, "GreenEarth Cleaning, who distributes the solvent."
Comments: Please note that GreenEarth Cleaning does not distribute any solvent, machine or chemicals. We license the use of the patented process. The solvent is distributed by three approved silicone manufacturers, Dow Coming, General Electric and Shin-Etsu.
2. Page VI-4, Section VI.D.: "However, all dry cleaning processes can result in soil
contamination. Soil contamination can occur through accidental releases, such as spills, or during the distillation process from a boil-over."
Comments: Scientific studies on D5 have established that it cannot contaminate the soil. Using these studies as reference, the Silicones Environmental, Health and Safety Council (SEHSC) has concluded the following about D5: "In the soil, degradation and volatilization occurs within a week. D5 ultimately degrades to inorganic silicate, or sand, water, and carbon dioxide."
3. Page VI-3, Section VI.C.: "The change in the amount of waste generated from
solvent-based technologies (i.e., hydrocarbon, GreenEarth and Rynex) is relatively small compared to perc."
Comments: The above statement is attributed to a report done by Jacobs Engineering, which did not include site visits or interviews with dry cleaners. Their conclusion in Section 5.2.8 of their report is not attributed to any actual supporting documentation and appears to be merely an assumption.
Dry cleaners using the GreenEarth process in various types of machine configurations, with and without stills, report a significant decrease in the amount of waste generated versus perc or hydrocarbon. We have attached letters from current Affiliates documenting their actual experience.
GreenEarth Cleaning would welcome an opportunity to work with the California Air Resources Board to develop actual volume waste data comparisons to perc and hydrocarbon in a format that would be acceptable for purposes of this report.
4. Page VII-1, Table VII- I and Page VII-3, Table VII-2: In Table VII-1, the price
range for machines using GreenEarth range from $43,000 to $98,000, while the price range for machines using hydrocarbon is $36,000 to $98,000. Then, using
K-2
an average machine price range for each, Table VII-2 shows that a machine using GreenEarth Cleaning costs $2,000 more than one using hydrocarbon.
Comments: We understand that this information came from the Machine Manufacturer Survey. However, in reality a dry cleaner cannot purchase a machine that uses only hydrocarbon that is less expensive than a machine that will use either hydrocarbon or GreenEarth. We are not sure about the source of the price ranges, but we do not believe that they reflect reality. To support this, we have attached a letter from Jim Carroll, National Sales Manager of Union Dry Cleaning Products, one of the largest dry cleaning machine manufacturers in the world.
5. Page VII-5, Table VII-4: Therm usage is taken from a study by PPERC, with
GreenEarth data obtained from Cleaner By Nature in Los Angeles.
Comments:
• The study by PPERC includes finishing, which makes the data collection much more subjective and less reflective of the actual cleaning process itself. Such factors as experience of the finisher, relative quality of the finished product, and other individual factors do not allow for an "apples-to-apples" comparison of gas usage of the various cleaning solvents.
• The therm usage for GreenEarth reflected in this one study is not
representative of reports from actual GreenEarth Affiliates.
6. Page VII-6, Table VII-5: The annual operating cost for GreenEarth Cleaning is reported as higher than actual operating costs reported by GreenEarth dry cleaners due to (a) machine cost, (b) therm usage, and (c) maintenance cost.
Comments: Machine cost is addressed in Item 3 above and therm usage is addressed in Item 4 above. Maintenance costs for GreenEarth are shown at $850 versus $250 for hydrocarbon. This is puzzling since the machines used and the recommended maintenance schedules are virtually identical for both solvents. This information apparently came from the Machine Manufacturer Survey, and the actual reports are not included in this draft for our review. Therefore, we are unable to address the reasons for this discrepancy. However, we have attached a letter from a major dry cleaning machine manufacturer that confirms that the cost of maintenance should be the same for GreenEarth and hydrocarbon.
7. Appendix 1, Contact Information for Alternative Solvents: Dow Coming is listed
as the contact for GreenEarth Cleaning.
Comments: In addition to Dow Coming, there are two other approved suppliers of D5, the GreenEarth Cleaning Solvent. Contact information for the other two is:
K-3
• General Electric Advanced Materials, 187 Danbury Rd., Wilton, CT 06897. • Shin-Etsu Chemical, 115 0 Damar Dr., Akron, OH 44035.
Silicones Environmental Health and Safety Council of North America (SEHSC) November 23, 2005
1. In its report, the ARB has acknowledged the extensive health research submitted by the silicones industry in June 2005 to ARB, other California regulatory agencies, and U.S. EPA. However, we are concerned that by failing to specifically include or discuss the results of the additional research, the Draft Report fails to accurately and completely portray the current state of the knowledge regarding the safety of D5. Because the additional research specifically addresses the uncertainties that are mentioned in the Draft Report and further documents the safety of D5, it would be inappropriate for ARB to retain and rely on the information in Appendix G pertaining to cyclic siloxanes. SEHSC urges ARB to either update the Draft Report to reflect the current state of the knowledge regarding the safety of D5, or remove from Appendix G any information that pertains to D5 and, correspondingly, any reference to such information in Draft Report. Readers will be given an incomplete and inaccurate picture of the safety of D5 if the Draft Report is left as currently written. A summary of those studies in included in the comments.
2. SEHSC recommends that the Draft Report be based on information currently
available to ARB and OEHHA. SEHSC also recommends that OEHHA be given an opportunity to update the OEHHA memo under Appendix G as it has been superseded by subsequent research. This is particularly important as the additional research addresses ARB’s and OEHHA’s concerns. A majority of SEHSC’s specific comments address how the post-2003 research will change the conclusions of the December 2003 OEHHA evaluation.
3. SEHSC would like to call to the attention of ARB that D5 is a nonsmog-forming
material, which is a requirement for any alternative dry cleaning technology under California Assembly Bill 998. D5 has been classified as VOC exempt and is not listed as a hazardous air pollutant by the State of California.
4. Section V.B.2. Page V-4. Potential Health Impacts—Volatile Methyl Siloxanes;
The Draft Report states “The observance of adverse effects on the uterus by D5 [in the D5 two-year study] is of concern (OEHHA 2003).” Mode-of-action research submitted to U.S. EPA and California regulatory agencies by SEHSC in June 2005 indicates that the uterine findings are specific to the rat and do not represent a hazard to humans.
5. Section V.B.2. Page V-4. Potential Health Impacts—Volatile Methyl Siloxanes;
The Draft Report states: “Because D5 is lipophilic there is also concern that D5 may bioaccumulate in the food chain.” The silicones industry has conducted
K-4
extensive adsorption, metabolism, and excretion studies with D5 (Reddy et al. In Progress, Smith 2005, Plotzke 2001, Plotzke In Progress). These studies clearly show that D5 does not bioaccumulate in the food chain as research has shown that it does not bioaccumulate in mammals (Andersen et al. 2005).
6. Section V.B.2. Page V-4. Potential Health Impacts—Volatile Methyl Siloxanes;
The Draft Report notes a liver weight increase in a subchronic study with D5. Additional research on this effect, including chronic studies, show that this effect of D5 in rat liver is an indication of a non-adverse metabolic adaptation, not a toxic effect.
7. Table V-2. Page V-8. Summary of Interim Health Values: The State of California
has an established procedure for calculating a chronic REL from subchronic data. The chronic REL established for D5 by OEHHA was based on a subchronic study and used liver weight increase as the endpoint. Because the liver weight increase is related to D5’s phenobarbital-like activity, it has little or no relevance to humans (Whysner et al. 1996, Roberts et al. 1976, Parkinson 1995, Diwan et al. 1986, Olsen et al. 1989). In addition, a chronic study has been completed with D5, and this study should be used preferentially over the 90-day study. Therefore, to do a risk characterization or risk assessment and to assign a chronic REL for phenobarbital-like compounds based solely on liver enlargement in rodents is not appropriate, especially from a 90-day subchronic study. Furthermore, there is reference in the OEHAA toxicity data review that the chronic REL also was based on spleen changes in the subchronic study of Burns-Naas et al. There were no effects seen on the spleen in this subchronic study.
We believe it would be inappropriate for OEHHA to set any exposure limits until the D5 two-year, combined chronic/carcinogenicity study and accompanying mode-of-action work provided in June 2005 are thoroughly assessed by the State of California. Using this approach would allow for a complete evaluation of all of the hazard data available on D5 and, if needed, would allow for the setting of an exposure limit based on sound scientific data.
8. Section VI.A. Page VI-2. Groundwater Contamination: The Draft Report states “Based on preliminary findings from a study conducted by [SEHSC], the GreenEarth solvent is unlikely to leach into groundwater because it is not soluble and readily sticks to soil particles (GreenEarth 2003).” It should be noted that GreenEarth 2003 actually states “Based on conclusive test data with other silicone materials, if spilled on the ground, D5 is expected to decompose to carbon dioxide, silicon dioxide (sand), and water.” SEHSC does not have a study specifically looking at the ability of D5 to leach into groundwater. However, D5 has very low water solubility and will readily evaporate from water or bind to particles in water. In addition, if D5 is released to soil, it will readily evaporate (within ~2 days) from moist soil and will undergo degradation (within one week) in dry soil; ultimately degrading to inorganic silicate (sand), water, and carbon dioxide (Xu and Chandra 1999). In the atmosphere, the majority of D5 will
K-5
breakdown within 10 days (half-life of 7-10 days) (Atkinson 1991). Therefore, D5 is unlikely to leach into groundwater.
9. Section VI.D. Page VI-4. Environmental Impacts—Soil: The Draft Report notes
all dry cleaning processes can result in soil contamination through accidental spills or releases. ARB should be aware that any D5 accidentally released to the environment in a spill will readily evaporate or undergo degradation in soil (Xu and Chandra 1999). When D5 enters the atmosphere, it undergoes degradation and is ultimately converted to inorganic silicate (sand), water, and carbon dioxide. In the atmosphere, a majority of D5 will break down within 10 days (half-life of 7-10 days) (Atkinson 1991).
10. Table VI-3. Page VI-7. Potential Health Impacts and Permissible Exposure Limit
(PEL): Table VI-3 indicates that D5 causes an increase in liver weight. This reported liver effect is an indication of metabolic adaptation in the rat and is not an indication of toxicity. This finding is widely recognized as not relevant to humans, and would be an inappropriate endpoint for the development of a Permissible Exposure Level (PEL).
11. Appendix G provides an outdated and therefore inappropriate toxicological
assessment of D5 and should be replaced with an updated review.
12. Appendix G - Health effects of D4 (Octamethylcyclotetrasiloxane) in animals: SEHSC recommends that ARB remove the discussion of D4 from Appendix G, as D4 is not used as a dry cleaning solvent. Should these irrelevant references to D4 be retained, they should be amended to reflect the comments previously submitted by SEHSC (SEHSC 2004). These comments will not be repeated here.
13. Appendix G - Chemical and Physical Properties: D5 is not listed as a hazardous
air pollutant (HAP). D5 is considered VOC exempt by the U.S. EPA and by all 50 states as well as by most of the air districts within the State of California.
14. Appendix G - Health effects information on D5 in the peer-reviewed literature:
D5 does not have estrogenic or anti-estrogenic activity. Reference to the work of Hayden and Barlow (1972) is not appropriate. The cyclic phenyl-containing siloxanes assessed by Hayden and Barlow are not structurally analogous to D5. D5 does not have estrogenic or anti-estrogenic activity. There were no effects seen in the D5 two-generation reproductive study (WIL Research 1999). D5 was negative in the rat and mouse uterotrophic assay (Quinn et al. 2004, He et al. 2003) and it does not bind to the estrogen receptor (Quinn 2004). Furthermore, data indicate that D5 does not cause estrogen receptor activation using the MCF-7 cell line (Quinn 2005).
15. Appendix G - Health effects information on D5 in the peer-reviewed literature:
Liver Effects in Rats. As for the liver effects seen with D5, it has been well
K-6
known since the early 1990s that exposure of some, but not all, experimental animal species to D5 produces hepatomegaly.
16. Appendix G - Health effects information on D5 in the peer-reviewed literature:
D5 does not bioaccumulate in mammalian species and therefore would not magnify. Examination of the work by Kala et al. (1998) reveals that authors did not conduct a mass balance determination of D5 and were unfamiliar with sample preparation and analytical techniques for siloxanes. As a result, the data reported by these authors in this paper are misleading.
17. Appendix G - Health effects information on D5 in the peer-reviewed literature:
D5 is non-genotoxic. Studies conducted with D5 include Salmonella typhimurium and Escherichia coli reverse mutation assays, an in vitro chromosome aberration test, and a combined in vivo rat micronucleus and UDS Assay (OECD 474, OECD 486). All of these studies on D5 were negative for genotoxicity activity (Sokolowski 2003, Schultz 2003, Honavar 2004).
18. Appendix G - Health effects information on D5 in the peer-reviewed literature:
Uterine Tumors in Rats. As noted above, the increased incidence of uterine tumors was not accompanied by an increase in incidence or severity of uterine endometrial hyperplasia. Post- 2003 mode-of-action studies have shown that D5 acts as a dopamine agonist causing a reduction in prolactin. This reduction in prolactin causes a reduction in the estrogen:progesterone ratio leading to estrogen dominance. This effect is considered ratspecific since this pathway does not occur in humans (SEHSC et al. 2005).
19. Appendix G - Interim inhalation chronic Reference Exposure Level (REL):
SEHSC recommends that ARB remove the discussion of D4 from Appendix G, as D4 is not used as a dry cleaning solvent. In any future review of data on D4 or D5, SEHSC requests that the State of California keep the data reviews on D4 and D5 separate. Although these two materials are structurally similar (D4 has four Si-O units and D5 has five Si-O units), they have very different biological activities and different hazard profiles. Consideration of the two materials together may lead to false conclusions.
20. Appendix G - Interim inhalation chronic Reference Exposure Level (REL): The
State of California has an established procedure for calculating a chronic REL from subchronic data. The chronic REL established for D5 by OEHHA was based on a subchronic study and used liver weight increase as the endpoint. Because the liver weight increase is related to D5’s phenobarbital-like activity, it has little or no relevance to humans (Whysner et al. 1996, Roberts et al. 1976, Parkinson 1995, Diwan et al. 1986, Olsen et al. 1989). In addition, a chronic study has been completed with D5, and this study should be used preferentially over the 90-day study. Therefore, to do a risk characterization or risk assessment and to assign a chronic REL for phenobarbital-like compounds based solely on liver enlargement in rodents is not appropriate, especially from a
K-7
90-day subchronic study. Furthermore, there is reference in the OEHAA toxicity data review that the chronic REL also was based on spleen changes in the subchronic study of Burns-Naas et al. There were no effects seen on the spleen in this subchronic study.
We believe it would be inappropriate for OEHHA to set any exposure limits until the D5 two-year, combined chronic/carcinogenicity study and accompanying mode-of-action work provided in June 2005 are thoroughly assessed by the State of California. Using this approach would allow for a complete evaluation of all of the hazard data available on D5 and, if needed, would allow for the setting of an exposure limit based on sound scientific data.
Lyondell Chemical Company, November 22, 2005
1. Lyondell Chemical Company is the manufacturer of ImpressTM solvent for dry cleaning. Impress solvent is a proprietary composition containing prdominantly dipropylene glycol n-propyl ether (DPnP). Lyondell is providing additional information on mammalian toxicity and ecological studies done on DPnP. Because Impress solvent is predominantly DPnP, the toxicity of IMPRESS dry cleaning solvent is expected to be very similar to the DPnP.
Chevron Phillips Chemical Company LP, November 22, 2005
1. II-B-3, Page II-2: Advise to replace this paragraph with the following: Chevron Phillips Chemical Company LP manufactures EcoSolv® Fluid (EcoSolv). This dry cleaning fluid is predominantly a mixture of synthetic isoparaffins with carbon numbers ranging from C9 to C13. The manufacturer formulated this product by adding butylated hydroxytoluene at 10 parts per million (ppm) to act as an oxygen stabilizer. This solvent is a high purity aliphatic mixture very low in aromatics. EcoSolv® fluid has been approved by the New York State Department of Environmental Conservation as a solvent meeting their HAP requirements. Isoparaffin solvents are also used for food processing, cosmetic and personal care formulations, and as solvents for a number of industrial products. EcoSolv has a flash point between 140 oF and 200 oF, and is classified as Class IIIA solvent per NFPA 32. (ARB, 2004h)
2. IV-A-3, Page IV-5: The text states that the group was not aware of any cleaners
using EcoSolv® fluid in California. Chevron Phillips currently has approximately 50% of the market in Northern California and 30-40% of the market in Southern California.
3. Section V-B-1, Page V-3: The Report states that the environmental persistence
of EcoSolv® DCF is not known. The environmental fate of our product has been evaluated and data submitted to the OECD SIDS HPV Initiative with US EPA as Sponsor. Biodegradation data available show that C10-C13 isoparaffinic hydrocarbons can exhibit a moderate to rapid rate of biodegradation. In a Ready
K-8
Biodegradability test, a C10-C13 aliphatic compound showed a 69.8% biodegradation in 28 days.
4. For trademark protection purposes, we would like our product to be referred to as
EcoSolv® Dry Cleaning Fluid or EcoSolv® DCF through out the report.
5. There are two predominant products/manufacturers of synthetic or isoparaffinic hydrocarbon solvents; they are DF-2000 from Exxon and EcoSolv® DCF from Chevron Phillips. We recommend modifying the generic references to DF-2000 to synthetic/Isoparaffinic solvents which include both DF-2000 and EcoSolv® DCF.
6. The page numbers in section I might have been numbered wrongly. They should
read I-1, I-2, I-3, etc. Bill Hayday (Rynex), November 15, 2005
1. All of the solvents listed excluding Perc are both flammable and combustible. Rynex should not be listed as hazardous because it’s combustible since they are all combustible. Please change this and also remove the carcinogenic reference since Rynex is non-carcinogenic. Petroleum’s and silicones cannot make this claim.
ExxonMobil Chemical Company, November 29, 2005
1. Page II-2: Include Flash point for DF-2000 Fluid of 144 oF.
2. Page IV-7: The REL for DF-2000 Fluid is 171 ppm or 1200 mg/m3 with footnote to reference published method JOEH 2005.
3. December 2003 memo from Alexeeff to OEHHA needs to be revised/updated to reflect current data on DF-2000 fluid. Are the units on the REL correct?
4. Pure-Dry-4 references the Phillips and Egan study (1984). Please note that the effects were related to male rat kidney effects that U.S. EPA has determined to be species/sex specific. Is it appropriate to use this study?
5. Page V-3, 5th paragraph: DF-2000 Fluid contains C11-C13 synthetic isoparaffin aliphatic hydrocarbons.
6. Page V-4, 1st sentence: Check the last word in the first sentence of the page; should be rats and not rates?
Aeroqual Limited, November 18, 2005
1. Aeroqual has provided for testing their new perchloroethylene leak detector sensor head with Aeroqual Series 200 handheld monitor. After testing they would like ARB to add the test results to the final ATCM report.
K-9
2. Table IV-16, Summary of Leak Detector Evaluation: After testing the new leak detector please add the following information to Table IV-16:
Model and Manufacturer: Aeroqual 200 Leak Detector
Detection Principle: Gas sensitive semiconductor
Sample Delivery: Internal fan
Display: LCD with audible alarms
Response Time: < 5 seconds
Leak Check Suitability: Yes
3. There will be no change to Table VII-6. Comparison of Cost for Perc Concentration Detectors because the cost of the Aeroqual Series 200 Leak Detector is the same as the standard Series 200 handheld monitor ($580).
ION Science, October 21, 2005
1. Table IV-16: The PhoCheck 1000 (ION Solutions) should actually read PhoCheck 1000 (ION Science).
2. Table VII-6: The cost of the PhoCheck 1000 should be changed from $2,745 to $1,999.
Turlock Dry Cleaning, November 19, 2005
1. I am the owner of Turlock Dry Cleaning in Turlock, CA. I personally like the strength and effectiveness of Perc and am willing to stick with it. No other product that I have tried has compared to perc, and changing it will cause a considerable drop in the quality of my dry cleaning. If anything else is required of me please inform me via email.
HSIA, November 22, 2005
1. Page I-2, 2nd to last paragraph – In addition to noting that PERC emissions have decreased by about 70 percent, it would be helpful to note that the industry’s efficiency has more than doubled (lbs per gal increased from 224 in 1992 to 566 in 2003).
2. Page II-2, B. Hydrocarbon Solvent Cleaning – To avoid confusion and improve clarity, the discussion of Hydroclene Fluids (page II-6) can be included in the Hydrocarbon section. These fluids are similar to the other hydrocarbons discussed in this section, and already are available to the industry.
3. Page II-3, D. Rynex Cleaning – This section should be retitled “Propylene Glycol Ether Solvent Cleaning” and the discussion of Impress Solvent (page II-6) should be included. Both Impress and Rynex are P-series glycol ethers and have similar properties. Impress also is already available to the industry.
K-10
4. Page V-1, 1st paragraph – The fourth sentence of the paragraph should be rephrased to read “Many of the human studies have been conducted among populations of dry cleaning workers.” The current language suggests that toxicological studies were conducted on the workers.
Bob Blackburn, November 1, 2005
1. Page II-3(D) – Rynex™ (Propylene Glycol Ether) Cleaning. Suggest changing the language in the first paragraph, 4th statement, to “It is considered to be non-hazardous under OSHA Hazardous Communication Standards because it is a non-combustible liquid. It is also considered a non-regulated VOC because of its low volatility rating.”
2. Page V-4(3) Rynex™ (Propylene Glycol Ether): Please remove the statement pertaining to no toxicity data on Rynex.
3. Page V-5 (top of page): Either omit the entire paragraph and replace it with this one or add this one at the bottom of the one you have. This paragraph MUST be included for correct current information.
“The current formulation of Rynex™ is not regulated under California Prop 65, the Clean Air Act, the Clean Water Act, the Safe Drinking Water Act or as a hazardous air pollutant (HAP). It is noncarcinogenic, biodegradable and has low toxicity. It is also not classified as hazardous waste material.
Most reporting and special paperwork is eliminated because Rynex™ has not been designated as a hazardous chemical by the Federal EPA. Rynex™ can be used in any hydrocarbon machine with minor modifications. Most manufacturers now offer Rynex™ ready machines in capacities to meet every need. Rynex™ has been field tested in California for 2 years and it has been determined that it has outstanding cleaning properties. It cleans as well or better than perc on a wider range of garment fabrics. Rynex™ also removes more stains during normal cycling so that less pre- and post-spotting is required. It is safe for use on most beads, sequins, buttons, leather and trim.”
4. Appendix G, Page PGtBE-1: At the top under the heading of PROPYLENE GLYCOL TERT-BUTYL ETHER must have this disclaimer, “The following report is based on a previous Rynex™ formulation.
Bob Blackburn, November 10, 2005
1. Page VI-4: E. Flammability: Paragraph 3: (statement as it reads now) - Rynex™ which has a flashpoint of greater than 200 degrees F is classified as a 3B liquid and a potential fire safety hazard. It SHOULD read: Rynex™ which has a flashpoint of greater than 200 degrees F is classified as a 3B liquid and is not a potential fire safety hazard.
K-11
2. Page VII-6: Chart: Under Rynex™ it now reads: Average cost for detergents/spotting agents $1500.00 per year. It should say: Average cost for detergents/spotting agents $100.00 (spotting agents only) no detergents used.
3. Page VIII-2: B: Rynex - now reads: The Air Resources Board (ARB) staff was not able to locate any independent efficacy testing for Rynex™. However, the manufacturer claims that Rynex™ is a superior, gentler cleaner (when compared to Perc) that can handle a wide variety of fabrics. They also claim that it removes water soluble stains better than other solvents (Ryenx, 2005), although this has not been verified with independent testing.
It should read: The manufacturer claims that Rynex™ is a superior, gentler cleaner (when compared to Perc) that can handle a wide variety of fabrics. They also claim that it removes water soluble stains better than other solvents, this has been verified with those cleaners using Rynex™ as a true statement (Please delete the beginning and ending statements regarding the independent testing and unverified documentation).

Appendix L
Glossary and Acronyms
L-1
Glossary Acute Exposure: One or a series of short-term exposures generally lasting less
than 24 hours. Agency Shop: Same as drop off shop. Facility with no dry cleaning machine
on-site. Airborne Toxic Section 39655 of the Health and Safety Code, defines an Control Measure: “Airborne Toxic Control Measure” means either of the
following:
1) Recommended methods, and, where appropriate, a range of methods, that reduce, avoid, or eliminate the emissions of a toxic air contaminant. Airborne toxic control measures include, but are not limited to, emission limitations, control technologies, the use of operational and maintenance conditions, closed system engineering, design equipment, or work practice standards, and the reduction, avoidance, or elimination of emissions through process changes, substitution of materials, or other modifications.
2) Emission standards adopted by the U.S. Environmental Protection Agency pursuant to section 112 of the federal act (42 U.S.C. Sec. 7412).
Air Dispersion A mathematical model or computer simulation used to Model: estimate the concentration of toxic air pollutants at specific
locations as a result of mixing in the atmosphere. Chronic Exposure: Long-term exposure usually lasting from one year to a lifetime. Drop off Shop: Same as agency shop. Facility with no dry cleaning machine
on-site. Flash Point: The lowest temperature at which a liquid can form an ignitable
mixture in air near the surface of the liquid. The lower the flash point, the easier it is to ignite the material.
Hazardous Air A substance that the U.S. Environmental Protection Pollutant (HAP): Agency has listed in, or pursuant to, section 112 subsection
(b) of the federal Clean Air Act Amendments of 1990 (42 U.S. Code, section 7412(b)).
Mixed Shop: A dry cleaning facility that employs more than one type of dry
cleaning process.
L-2
Permissible Exposure The maximum amount or concentration of a chemical that a Limit (PEL): worker may be exposed to under the Occupational Safety and
Health Administration (OSHA) regulations. Risk: The possibility of injury or disease, which may result from exposure to toxic air contaminants. Scientific Review A nine-member panel appointed to advise the Air Resources Panel on Toxic Air Board and the Department of Pesticide Regulation in their Contaminants (SRP): evaluation of the adverse health effects toxicity of substances
being evaluated as Toxic Air Contaminants. TIF Detector Halogen leak detector made by TIFTM Instruments, Inc. Toxic Air Section 39655 of the Health and Safety Code, defines a TAC Contaminant (TAC): as an air pollutant which may cause or contribute to an
increase in mortality or an increase in serious illness, or which may pose a present or potential hazard to human health. A substance that is listed as a hazardous air pollutant pursuant to subsection (b) of section 112 of the federal act (42 U.S.C. Sec. 7412(b)) is a TAC. TACs that are pesticides are regulated in their pesticidal use by the Department of Pesticide Regulation.
Volatile Organic Means any compound containing at least one atom of carbon, Compound (VOC) excluding carbon monoxide, carbon dioxide, carbonic acid,
metallic carbides or carbonates, and ammonium carbonate, and excluding the following:
(A) methane, methylene chloride (dichloromethane),
1,1,1-trichloroethane (methyl chloroform), trichlorofluoromethane (CFC-11), dichlorodifluoromethane (CFC-12), 1,1,2-trichloro-1,2,2-trifluoroethane (CFC-13), 1,2-dichloro-1,1,2,2-tetrafluoroethane (CFC-14), chloropentafluoroethane (CFC-115), chlorodifluoromethane (HCFC-22), 1,1,1-trifluoro-2,2-dichloroethane (HCFC-123), 1,1-dichloro-1-fluoroethane (HCFC-141b), 1-chloro-1,1-difluoroethane (HCFC-142b), 2-chloro-1,1,1,2-tetrafluoroethane (HCFC-124), trifluoromethane (HFC-23), 1,1,2,2-tetrafluoroethane (HFC-134), 1,1,1,2-tetrafluoroethane (HFC-134a), pentafluoroethane (HFC-125), 1,1,1-trifluoroethane (HFC-143a), 1,1-difluoroethane (HFC-152a), cyclic,
L-3
branched, or linear completely methylated siloxanes, the following classes of perfluorocarbons:
1. cyclic, branched, or linear, completely fluorinated
alkanes; 2. cyclic, branched, or linear, completely fluorinated
ethers with no unsaturations; 3. cyclic, branched, or linear completely fluorinated
tertiary amines with no unsaturations; and 4. sulfur-containing perfluorocarbons with no
unsaturations and with the sulfur bonds to carbon and fluorine, and
(B) the following low-reactive organic compounds which have been exempted by the U.S. EPA: acetone, ethane, methyl acetate, parachlorobenzotrifluoride (1-chloro-4-trifluoromethyl benzene), perchloroethylene (tetrachloroethylene).
L-4
ACRONYMS
APCD Air Pollution Control District APCO Air Pollution Control Officer AQMD Air Quality Management District ARB California Air Resources Board ATCM Airborne Toxic Control Measure BACT Best Available Control Technology Cal/EPA California Environmental Protection Agency Cal/OSHA California Occupational Safety and Health Administration CAPB Cocamidopropyl betaine CAPCOA California Air Pollution Control Officers Association CAS Chemical Abstract Service CG Cellulose gum CEQA California Environmental Quality Act CO2 Carbon Dioxide CTSI U.S. EPA’s Cleaner Technologies Substitute Assessment :
Professional Fabricare Processes D5 Decamethylcyclopentasiloxane DfE Design for the Environment DHS California Department of Health Services Districts Local Air Pollution Control and Air Quality Management Districts DOF California Department of Finance DPNB Dipropylene Glycol Normal Butyl Ether DTSC California Department of Toxics Substances Control °F Degrees Fahrenheit HAP Hazardous Air Pollutant HHD Halogenated Hydrocarbon Detector H&SC Health and Safety Code HSIA Halogenated Solvent Industry Alliance IARC International Agency for Research on Cancer IFI International Fabricare Institute IRTA Institute for Research and Technical Assistance KB Kauri Butanol Kg Kilogram kWh Kilowatt-hour Lauramide DEA lauric acid diethanolamide LOC Local ventilation system
L-5
m3 Cubic meter MDL Minimum Detection Limit µg/m3 Microgram per cubic meter MSDS Material Safety Data Sheets NESHAP National Emissions Standards for Hazardous Air Pollutants NIOSH National Institute for Occupational Safety and Health NTP National Toxicology Program OEHHA Office of Environmental Health Hazard Assessment OSHA Occupational Safety and Health Administration P-20 Ethoxylated sorbitan monodecanoate PBR Partial vapor barrier room PEL Permissible Exposure Limit Perc Perchloroethylene pH A logarithmic measure of hydrogen ion concentration PID Photoionization Detector POTW Publicly Owned Treatment Works PPERC Pollution Prevention Education and Research Center ppm Parts per Million ppmv Parts per Million by Volume psi Pound Per Square Inch PVR Partial Vapor Room REL Reference exposure level SEHSC Silicones Environmental, Health & Safety Council of North America SLI Sodium lauryl isethionate SLS Sodium laureth sulfate SRP Scientific Review Panel on Toxic Air Contaminants TAC Toxic Air Contaminant TLV Threshold Limit Value TSCA Toxic Substances Control Act of 1976 TWA Time-weighted average UCLA University of California, Los Angeles URF Unit risk factor U.S. United States U.S. EPA United States Environmental Protection Agency VBR Vapor Barrier Room VOC Volatile Organic Compound