Embed Size (px)
Citation preview
California Environmental Protection Agency
Air Resources Board
PROCEDURE FOR THE DETERMINATION OF POLYNUCLEAR AROMATIC HYDROCARBONS IN
VEHICULAR EXHAUST USING GAS CHROMATOGRAPHY/MASS SPECTROMETRY
SOP MV-AEROSOL-144 Version 2.0
Effective Date: June, 2014
Chemical Analysis and Emissions Research Branch Emissions Compliance, Automotive Regulations and Science Division
State of California Haagen-Smit Laboratory
9528 Telstar Avenue El Monte, CA 91731
This procedure has been reviewed by the staff of the Air Resources Board and approved for publication. Approval does not signify that the contents necessarily reflect the views and policies of the Air Resources Board, nor does the mention of trade names or commercial products constitute endorsement or recommendation for use.
Table of Contents 1. Scope…........................................................................................ 1 2. Summary of Test Method………………………………………… 1
3. Terminology (Definitions)………………………………………….. 1
4. Limitations and Interferences…………………………………….. 2
5. Safety…………………………………………………………………… 2
6. Equipments and Apparatus………………………………………. 2
7. Reagents and Materials………………………………………….. . 4
8. Preparation of Apparatus …………………………………………….. 4
9. Preparation of sampling materials…………………………………… 5
10. Preparation of Standards for PAH Analysis…………………… 6
11. Procedures for PAH Quantification……………………………… 9
12. Quality Control (QC) ……………………………………………….. 13
13. Calculation…………………………………………………………… 15
14. Report ……………………………………………………………….. 17
15. Reference Documents …………………………………………… 17
16. Revision History …………………………………………………… 17
Standard Operating Procedure for the Determination of Polynuclear Aromatic Hydrocarbons in Vehicular Exhaust using Gas
Chromatography/Mass Spectrometry
1. Scope
1.1 This Standard Operating Procedure (SOP) describes the identification and quantification of polynuclear aromatic hydrocarbons (PAHs) in motor vehicle exhaust. The PAHs are extracted from vehicle exhaust particulate matter (PM) collected on filters or with XAD/polyurethane foam (PUF) and are analyzed using gas chromatography/mass spectrometry (GC/MS).
1.2 The target analytes in this GC/MS method are listed in Table 1.
1.3 The individual PAH detection limit for the extract is equal to or less than 0.1 ng/mL depending on the extent of interference and the sensitivity of each PAH’s. The detection limit for the mass of each PAH on the filter and in the PUF/XAD/PUF cartridge can range from 0.03 ng to 5 ng depending upon the solvent purity, background interferences, and analytical conditions (variation of final extraction volume and GC injection volume).
2. Summary of Test Method
2.1 PAHs from vehicular emissions are collected on different types of sample media, including Teflon coated glass fiber filter, quartz fiber filter, polyurethane foam, and XAD resins.
2.2 PAHs on the sample media are solvent extracted and analyzed by gas chromatography/mass spectrometry (GC/MS).
2.3 Prior to extraction, known amounts of recovery standards (RS) are added to the sample. The sample is then extracted either with an accelerated solvent extraction (ASE) or a Soxhlet extractor using dichloromethane.
2.4 PAHs are identified by their GC retention times and characteristic mass peaks. These recovery standards and target analytes are quantified using an internal standard method.
2.5 The PAH mass (ng) is calculated by multiplying the extract volume and its concentration, and is corrected for its recovery efficiency.
2.6 A flow chart of this method is shown in Figure 1.
3. Terminology (Definitions)
3.1 Amu (Atomic mass unit) - Unit of mass to express atomic or molecular masses.
3.2 Internal Standard (IS) – Internal Standard is usually a deuterated compound added to a sample extract in a known amount and is used to calibrate concentrations of other sample analytes. The internal standard must not be the target analytes.
SOP 144 v 2.0 Effective Date: June, 2014 Page 1 of 38
3.3 Method Detection Limit (MDL) – the minimum concentration of a substance that can be measured and reported with confidence and the value is above zero.
3.4 Polynuclear Aromatic Hydrocarbons (PAHs) – aromatic hydrocarbons with two or more fused aromatic rings.
3.5 Recovery Standard (RS) – Recovery Standard is usually a deuterated compound added to a sample in known amount prior to solvent extraction. The measured amount of the recovery standard after extraction is compared to its theoretical (calculated) value to establish the extraction efficiency and a correction factor for a specified analyte.
4. Limitations and Interferences
4.1 The target analytes are not limited to those listed in Table 1, but can increase or decrease, depending on the availability of National Institute of Standards and Technology (NIST) reference materials or traceable standards.
4.2 The GC/MS analysis is not limited to PAHs collected on filter or in PUF/XAD/PUF cartridge. With proper extraction and sample preparation, the GC/MS method can identify and quantify PAHs from other sample collection media and emission sources.
4.3 Quantification of the target analyte is subject to interference from compounds that have the same m/z with the same retention time region in the analysis.
4.4 Closely eluting compounds with the same quantification ions may not have enough peak resolution for quantification.
4.5 Teflon filters can only be extracted by Soxhlet extraction. The Accelerated Solvent Extraction (ASE) dissolves the support ring and causes contamination.
5. Safety
5.1 Many chemicals, especially PAHs, are toxic and/or carcinogenic. These chemicals must be handled extremely carefully with proper protection in the fume hood.
5.2 Solvents such as acetone and hexane are flammable and harmful. Handle these solvents in the fume hood.
5.3 Dichloromethane (DCM) is a potential carcinogen and can penetrate gloves. Handle DCM in the fume hood and avoid direct contact with skin.
5.4 The ASE is under high pressure (~ 1,600 psi) during operation and must remain inside the fume hood.
6. Equipments and Apparatus
6.1 Accelerated Solvent Extractor (or pressurized fluid extractor)
SOP 144 v 2.0 Effective Date: June, 2014 Page 2 of 38
The PAH extraction is performed with the Dionex Accelerated Solvent Extractor (ASE) Model 350. The extractor is capable of using different sizes of extraction cells and allows automatic mixing and delivery of up to two separate solvents.
6.2 Soxhlet Extraction
The Soxhlet extraction apparatus is shown in Figure 2. The extractor must include the following components:
6.2.1 A chiller to control the coolant temperature to as low as 5 ºC.
6.2.2 A heating mantle with a Variac to control solvent distillation rate.
6.2.3 A magnetic stirring bar or boiling chips to prevent solvent from superheating.
6.3 GC/MS Analytical System
The GC/MS analytical system includes a Thermo Electron Gas chromatograph (GC) model TraceGC or equivalent and a Mass Spectrometer (MS) model DSQ II or equivalent. The system includes the following components:
6.3.1 Autosampler
The autosampler, Thermo Electron autosampler TriPlus model TP 100 or equivalent is capable of delivering consistent volumes for the sample and the internal standard (IS). The autosampler can add IS to the sample prior to sample injection to the GC.
6.3.2 Gas Chromatograph (GC)
6.3.2.1 The GC oven is temperature programmable.
6.3.2.2 The sample inlet includes a large volume injector capable of injecting sample volume in the range of 1µL to 100µL, at a controlled rate (for example, 2µL/sec). The injector must be temperature-programmable and must be equipped with a solvent valve for venting volatile solvents.
6.3.2.3 The column is a 30 meter long x 0.25mm ID fused silica capillary column coated with a cross-linked phenyl methyl silicone. Any column with a similar separation capability can also be used.
6.3.3 Mass Spectrometry (MS)
The DSQ II MS is capable of producing electron impact spectra at +70 eV (nominal) and scanning the range of the specified quantification masses or m/z. A scan range of 40 to 500 m/z is adequate for PAH analysis.
6.3.3.1 Data Acquisition
The data acquisition is controlled by Xcalibur (Thermo Electron software), which searches any GC/MS runs for specific ions or reconstructed ions, and plots the intensity of the ions with respect to retention time or scan number.
SOP 144 v 2.0 Effective Date: June, 2014 Page 3 of 38
7. Reagents and Materials
7.1 Gases
7.1.1 Helium, a carrier gas for GC/MS, at least 99.9995 % purity.
7.1.2 Nitrogen, at least 99.999% purity and free of PAHs contamination.
7.1.3 Compressed Zero Air, for ASE valve switching. It can be substituted by nitrogen gas.
7.2 Reagents
7.2.1 Dichloromethane (DCM), at least 99.8% purity. The PAHs levels in this DCM must be less than the method detection limits and suitable for PAH trace analysis at or below the part-per-billion.
7.2.2 Acetone, at least 99.9% purity.
7.2.3 Hexane, at least 99% purity.
7.2.4 Methanol, at least 99% purity.
7.2.4 NIST Reference Materials. Any NIST reference materials containing the target analytes can be used for calibration, for example, SRM 1491.
7.2.5 Deionized water, at least 5Ωm resistance.
7.2.6 PAH solution, 2000 µg/mL in DCM, Absolute Standards, Inc. Solutions from other sources are also acceptable as long as they contain PAHs of interest.
7.2.7 Deuterated PAHs
Deuterated PAHs are used as recovery and internal standards. The purity of these compounds shall be the highest whenever it is possible. The purities of these deuterated PAHs purchased from CDN are sufficient for the purposes.
7.3 Filters
Quartz fiber filter, glass fiber filter, and/or Teflon coated glass fiber filter such as Pallflex 7213 T60A20 are used for PM sampling.
7.4 Silica gel, 1 gram pre-cleaned silica gel packed in a 6 mL glass tube.
7.5 PUF, polyurethane foam
7.6 Amberite XAD4, surface area: 725m2/g and average pore diameter: 40A.
8. Preparation of Apparatus
8.1 ASE Extractor Cell Cleaning
SOP 144 v 2.0 Effective Date: June, 2014 Page 4 of 38
8.1.1 Inspect the integrity of the extraction cell, such as the Teflon O-ring. Replace the seals when necessary.
8.1.1 If necessary, clean the cells. Rinse the cell parts with DI water and acetone. Air dry the cell parts or oven dry at 100ºC. Cell disposable filters can be cleaned with DCM via Soxhlet or by ASE extraction (dummy extraction) to ensure there is no PAH contamination in the disposable filters.
8.1.2 Sonicate the borosilicate glassballs (cell fillings) with DI water in a clean beaker for at least 30 minutes. Discard and drain the water. Repeat the procedure for the second time. Rinse the borosilicate glassballs with DI water, followed by acetone, hexane, and dichloromethane. Air dry or oven dry at 100ºC in a PAH contamination free environment.
8.2 Glassware cleaning
All glassware can be cleaned by the following procedures:
8.2.1 Wash with detergent (Extran AP12. residue free or equivalent) and rinse with DI water during washing cycles in a washing machine.
8.2.2 Rinse the washed glassware three times with acetone, hexane and dichloromethane, in that order.
8.2.3 Dry the cleaned glassware in an oven at approximately 100 ºC.
8.2.4 Alternative cleaning procedures can be used if the background concentrations for PAHs are below the method detection limits.
8.3 Soxhlet extractor cleaning
8.3.1 Assemble the Soxhlet extraction apparatus, as shown in Figure 2, with a thimble (if needed) in the extraction tube.
8.3.2 Set the temperature of the chiller at approximately 6 ºC for condensing DCM.
8.3.3 Adjust the Variac to control the DCM distillation rate at approximately 3 cycles per hour. Continue distilling for at least 6 cycles.
8.3.4 Discard the solvent and dry the apparatus in the oven if desired.
9. Preparation of Sampling Materials
9.1 Filter cleaning
9.1.1 Filters for PAH analysis are pre-cleaned with DCM via Soxhlet extraction prior to sample collection.
9.1.2 Load the filters in the cleaned Soxhlet extraction tube and clean the filters according to the procedure in section 8.3. Continue distilling for 16 hours.
SOP 144 v 2.0 Effective Date: June, 2014 Page 5 of 38
9.1.3 Remove the extraction tube. Purge the filters at room temperature with nitrogen gas till dry.
9.2 PUF cleaning
9.2.1 PUF for PAH analysis is pre-cleaned with DCM via accelerating solvent extraction (ASE) following typical ASE conditions:
Pressure: 1500 psi
Temperature: 100OC
Static time: 5min
Flush volume: 60%
Purge time: 100 sec
Static cycles: 3
Solvent: DCM
9.2.2 Use vacuum oven to complete remove the residual solvent. The vacuum oven temperature is set at 31oC.
9.2.3 If the size of the PUF is reduced too much, soak the PUF in DCM. Squeeze the PUF to remove excess solvent then use the vacuum oven to ensure complete removal of the DCM.
9.2.4 This will allow the plug to come back approximately to its original shape and size.
9.2.5 Store the cleaned PUF in a jar at ~ 4oC.
9.3 XAD4 cleaning
9.3.1 The XAD4 resin is cleaned with methanol and DCM by ASE following the conditions listed in section 9.2.1.
9.3.2 Use vacuum oven to removed residual solvent at ~ 31oC.
9.3.3 Store the XAD4 in a jar at ~ 4oC for later use.
9.3.4 Analyze the last DCM wash to confirm the cleanness of the XAD4 resin.
10. Preparation of Standards for PAH Analysis
10.1 Preparation of Recovery Standards (RS)
The recovery standards (RS) consist of several deuterated PAHs for assessing the extraction efficiency. Each PAH is assigned with one of the RS. Each PAH species and its
SOP 144 v 2.0 Effective Date: June, 2014 Page 6 of 38
corresponding RS are listed in Table 2. Depending upon the availability of the deuterated compounds, the PAH’s RS can be reassigned.
10.1.1 Accurately weigh each RS (approximately 0.01g).
10.1.2 Add all the weighed compounds to a 100 mL volumetric flask.
10.1.3 Dissolve the RS with DCM (< 100 mL) in the flask.
10.1.4 Add DCM to the 100mL mark to make a 100 µg/mL stock solution.
10.1.5 Pipet 1 mL of the 100 µg/mL stock solution, and dilute with DCM to the 100 mL mark. The dilution results in a 1 µg/mL solution and can be used for spiking the PUF/XAD/PUF samples before extraction.
10.1.6 Pipet 4 mL of the1µg/mL solution and dilute to 100 mL to make a 40 ng/mL recovery standard solution for spiking the filter sample prior to extraction.
10.1.6.1 Continue pipetting 0.5, 1, 2, 3, and 6 to five individual 100 mL flasks to prepare 0.5, 1.0, 2.0, 3.0, and 6.0 ng/mL solutions. Use the 0.5 ng/mL solution to perform 1:10 dilution to make a 0.05 ng/mL solution.
10.1.7 Use the 40 ng/mL recovery standard to spike the filter samples if the sample extract needs to be concentrated more than four times. To calculate the volume of a recovery standard solution for spiking the filters, determine the desired concentrations of recovery standards in the extract including the final extract volume. The final concentrations should be within the calibration range of the calibration standards. Use the 1 µg/mL recovery standard to spike the XAD/puff samples.
10.1.8 The integrity of the recovery standard requires frequent checking against calibration standards. The concentration of the recovery standard may change due to solvent evaporation, degradation, and any other reasons that can shorten its life.
10.1.9 Prior to extraction, check the concentration agreement between the deuterated PAH calibration standards and spiking solution by analyzing a freshly prepared QC solution of ~ 1 ng/mL from a spiking solution. If the results fall within 20 % of the expected values of each recovery standard, extract PM filters and XAD/PUF by following the procedures in section 11.
10.1.10 If the results exceed the 20% limit, correct the problems prior to extraction. If it is due to deterioration of deuterated compounds, prepare a new spiking solution and calibration standards from stock solution and repeat procedure listing in 10.1.9.
10.2 Preparation of PAH and deuterated PAH Calibration Standards
The calibration standards are obtained following a series dilution of the NIST Reference Material, for example, SRM 1491, consists of 23 certified PAHs and one non-certified PAH. The compounds along with their concentrations for each level of PAH calibration standards are listed in Table 3. Other calibration standards including gravimetrically prepared standards from pure compounds are acceptable.
SOP 144 v 2.0 Effective Date: June, 2014 Page 7 of 38
10.2.1 The PAH calibration concentrations diluted from SRM 1491 range from 0.05 to 5.0 ng/mL. The actual PAHs’ concentrations may vary, depending on the SRMs being used. Table 3 lists the diluted concentration from SRM 1491.
10.2.2 Use a syringe to take out 250 µL of SRM 1491 solution. Insert the solution to a 100 mL flask and dilute with DCM to prepare a stock solution.
10.2.3 Pipet 2, 3, 5, 10, 15, and 30 mL of SRM 1491 stock solution and 0.5, 0.5, 1,2,3 and 6 mL of the 1µg/mL recovery standard solution to 6 individual 100 mL flask, respectively, and dilute with DCM to the mark. The procedure will yield 6 calibration standards (Cal 2-7, respectively). Use Cal 3 solution to performing 1:10 dilution to make Cal 1 solution. The concentrations of these standards are listed in Table 3 for target PAHs and Table 4 for deuterated PAHs. The procedure and actual concentrations may vary due to availability of SRMs.
10.3 Preparation of deuterated PAH Internal standards (IS)
Five deuterated PAHs are selected as IS for the determination of PAH concentrations. Each analyte has one, in some cases two, of the IS assigned for quantification. The area of the analyte’s quantification ion is a ratio to that of the IS to determine the concentration of the analyte. The corresponding IS for each analyte is listed in Table 5.
10.3.1 The ISs used in this method are: acenaphthene-d10, phenanthrene-d10, pyrene-d10, chrysene-d12, and perylene-d12.
10.3.2 Should interference be found in the quantification ions of any IS (such as chrysene-d12 and pyrene-d10), use another deuterated PAH which has retention time close to the analyte’s.
10.3.3 The following procedure is a typical way of preparing the IS solution. Weigh the four ISs individually (approximately 0.05 g) and add all weighed ISs into a 100 mL flask.
10.3.4 Dissolve the ISs with DCM. When the solid compound is dissolved completely, add more DCM to the 100 mL mark to prepare a ~ 500 µg/mL stock solution.
10.3.5 Pipet 1 mL of the stock solution into a 100 mL flask and dilute with DCM to make a 5 µg/mL solution. Pipet 2 mL of the 5 µg/mL into a 100 mL flask and dilute with DCM to make a 100 ng/mL solution.
10.3.6 Pipet 5 mL of the 100 ng/ mL solution into a 100 mL flask and dilute with DCM to the mark to prepare an IS solution at a concentration of 5 ng/mL for each compound.
10.4 Preparation of QC standards
QC standards can be volumetrically diluted from a commercially available or a NIST SRM PAH standard. The PAH component’s QC concentration shall be in the mid range of the prepared GC/MS calibration standards. The suggested QC standard concentration is approximately 1.0 ng/mL.
SOP 144 v 2.0 Effective Date: June, 2014 Page 8 of 38
10.4.1 To prepare the QC solution for the PAH analysis, a series of dilutions are needed. The actual dilution procedure is dependent upon the concentration of the solution. The following procedure is an example for diluting a 2 mg/mL PAH solution.
10.4.2 Use a syringe and take a 250 µL aliquot of the 2 mg/mL PAH standard into a 100 mL flask. Dilute the solution to the mark with DCM to make a 5.0 µg/mL solution.
10.4.3 Pipet 1mL of the 5 µg/mL solution and dilute to the 100 mL mark with DCM to prepare a 50ng/mL solution.
10.4.4 Continue pipetting 2 mL of the 50 ng/mL solution and dilute to the 100 mL mark with DCM to prepare a 1.0 ng/mL QC solution.
11. Procedures for PAH Quantification
11.1 Sample Extraction
The following section describes the procedures to operate the Dionex ASE350 and extract PAHs collected on PM filter and XAD/PUF samples. The procedures should be modified if different sample collection media are used.
11.1.1 Visually examine the integrity of the cell parts, including Teflon O-ring, frits, and disposable filters. These parts provide seals needed for the pressurized and heated extraction cells.
11.1.2 Place the sample filter in the cell with tools (for example, forceps). Avoid direct contact between the forceps and the sample collection side of the filter to reduce potential losses of the analytes and to avoid cross contamination among samples. Should direct contact occur, rinse the forceps with acetone followed by hexane and DCM prior to next use, or use a clean forceps.
11.1.3 Spike the sample filter with the RS. The RS volume and concentration varies, depending upon the “estimated” amount of the PAHs collected on the filters. If such an estimate can not be made, assume the extract will not be concentrated. For example, spike 25µL of a 1 µg/ mL RS solution resulting in RS concentration of 0.5 ng/ mL in the 50 mL extract. Spike 50 µL of 100 ng/mL RS solution resulting in RS concentration of 1.0 ng/mL in the 5 mL final extract solution if the volume of ASE extract, typically ~ 50 mL, is reduced 10 times.
11.1.4 Pack the cells with borosilicate glass balls. Do not over-pack the cells. Provide good seals for the cells to reduce potential extraction failure. Keep the threads and sealing surface clean.
11.1.5 Open the cylinder gas valves. Load the extract bottles. Use the ASE extraction software to set up the extraction schedule and method (section 9.2.1). Start the extraction.
11.1.6 PAHs can be photosensitive and volatile. After extraction, measure the sample extract volume. Transfer the sample extracts to an amber bottle and store the bottle of extract in a refrigerator until analysis.
11.1.7 Extracting PAHs from the PUF/XAD/PUF can be performed directly if the Dionex SOP 144 v 2.0 Effective Date: June, 2014 Page 9 of 38
extraction cell tube are used for packing the sampling media.
11.1.8 Spike the PUF/XAD/PUF with the RS. The RS volume and concentration varies, depending upon the “estimated” amount of the PAHs collected. Because of high
concentrations of the naphthalenes in the sample, dilution of the resulting extract can occur.
11.1.9 Complete the extraction by following the procedures list in11.1.5-6.
11.2 Solvent Reduction and Clean-up
Solvent reduction is used to concentrate the extract after the solvent extraction and to increase the method sensitivity. If the concentration is needed, estimate Recovery Standard’s (RS) final concentration prior to spiking. The expected RS final concentration shall be in the linear range of the calibration standards. Perform dilution if the analytical results are outside the calibration range.
11.2.1 Nitrogen blow-down
The filter extract is concentrated by flowing nitrogen gas on top of the extract solution. This will evaporate the excess DCM and thus reduce the volume of the extract.
11.2.2 Connect the mini-vap to the nitrogen gas source and allow nitrogen to flow through. The nitrogen can be either from a liquid nitrogen boiloff or from a zero nitrogen cylinder as long as the nitrogen gas is free of PAH contamination.
11.2.3 The following procedure is an example for concentrating an extract 4 times.
11.2.3.1 Pipet 4 mL of the filter extract to a conical interior bottom vial with graduations. Start the nitrogen flow slowly to avoid splashing the solution.
11.2.3.2 Stop nitrogen flow when the solution is below the 1.0 mL mark. Never allow the solution to dry out.
11.2.3.3 DCM to wash down any deposit and increase the total volume to the 1.0 mL mark.
11.2.3.4 Other concentration ratios are acceptable as long as the PAH interference in the DCM is below the filter extract’s detection limits. If DCM interference becomes a problem, blank subtraction may be necessary. Carefully analyze 3 blank solutions to determine the PAH concentrations.
11.2.3.5 The concentrated filter extract is ready for GC/MS analysis.
11.2.4 Clean-up
Perform a clean-up procedure if matrix interference becomes problems for PAH quantification. This method utilizes silica-gel to eliminate interferences. An example for the cleaning procedure is as follows:
12.2.4.1 Condition silica-gel (1 gram silica-gel packed in 6 mL glass tube) with SOP 144 v 2.0 Effective Date: June, 2014 Page 10 of 38
2 mL of DCM and followed by hexane filled to the top of the tube.
12.2.4.2 Add 250 uL sample extract to the silica-gel when hexane is almost completely eluting out of the top of the tube.
12.2.4.3 Immediately add 2 mL of hexane to the solution and when the solution is almost disappearing from the top, add 3 mL of DCM.
12.2.4.4 Collect the PAHs fraction when the DCM is eluting from the silica-gel tube.
12.2.4.5 Follow the procedure as described in section 12.2.1 to concentrate the DCM solution and the concentrated filter extract is ready for GC/MS analysis.
11.3 GC/MS Tuning
The following sections describe the procedures and conditions of conducting GC/MS analysis for PAHs.
11.3.1 Prior to the GC/MS analysis, the MS must pass its auto-tuning criteria with FC-43 to demonstrate that the instrument passes all tuning criteria. The criteria include ion abundance, mass resolution, and mass calibration.
11.3.2 Auto-tune also automatically adjusts ion source parameters for optimum performance.
11.4 GC Operating Conditions
11.4.1 Typical autosampler parameters include:
Internal standard volume: 5.0 µL Sample volume: 30.0 µL Injection speed: 3.0 µL/sec Syringe size: 100 µL
11.4.2 Typical GC operating conditions include the following:
GC column: 30 meter long x 0.25mm ID, DB-5 fused silica capillary column Oven method: initial temperature: 40 ºC for 2 minutes Temperature ramping rate: 10 oC/min Final temperature: 300 ºC and hold for 10 mins. Carrier gas: helium with a constant flow rate at 1.20 mL/min.
11.4.3 Sample introduction is operated on a Programmable temperature and volume (PTV) large volume injection mode. A typical sample inlet method includes an initial condition and four phases. The Injection phase allows the sample to be introduced into the inlet at a low temperature with a vent valve open to reduce the excess DCM vapor volume and concentrates the analytes inside the injector. Evaporation phase allows further reduction of the solvent volume. Transfer phase transfers the sample to the GC column at a higher temperature. Finally, the inlet undergoes the Cleaning phase. The following is a typical sample injection method:
Initial conditions:
SOP 144 v 2.0 Effective Date: June, 2014 Page 11 of 38
Base temperature: 35 ºC Split flow rate: 150 mL/min Solvent valve temperature: 140 ºC. Constant purge: on
Injection phase:
Injection time: 0.3 min Vent flow: 150 mL/min
Evaporation phase:
Evaporation temperature ramping rate: 10ºC/sec Evaporation temperature: 40 ºC Evaporation time: 0.2 min
Transfer phase:
Transfer temperature ramping rate: 14.5 ºC/sec Transfer temperature: 300 ºC Transfer time: 0.2 min
Cleaning Phase:
Clean rate: 14.5 ºC/ min Clean temperature: 325 ºC Clean time: 25.0 min Clean flow: 30 mL/min
11.5 MS Operation Conditions
11.5.1 The mass spectrometer is operated on a positive electron impact (EI+) mode. The typical settings for the MS include:
Source temperature: 250 ºC GC interface temperature: 300 ºC Emission current 350 µA Electron Energy: 70.0 V (nominal) Detector voltage: 350.0 V
11.5.2 The MS can be operated under either Selective Ion Monitoring Mode (SIM) or Full Scan Mode. SIM is usually used for quantification and Full Scan can be used for both compound identification and quantification. The primary (or quantifier) and secondary (or qualifier) ions for quantifying each analyte and each internal standard in the SIM mode are listed in Tables 5 and 6, respectively. For the Full Scan, the mass scan range is 50 to 500 amu at a scan rate of one second per scan.
11.6 PAH Analysis
11.6.1 Prior to PAH analysis, allow the calibration standards (or RS if assessing recovery efficiency), the extract samples, the IS, and the QC solutions to reach room temperature.
11.6.2 Clean and fill the GC pre-cleaning and post-cleaning vials for the autosampler with DCM. All sample vial septa for GC analysis must be Teflon to avoid PAH contamination.
SOP 144 v 2.0 Effective Date: June, 2014 Page 12 of 38
11.6.3 Tune the mass spectrometer according to manufacturer’s instructions, as described in Section 11.3. Target tune can be of help and be used for this analysis.
11.6.4 Set GC/MS operation conditions in accordance with sections 11.4 and 11.5.
11.6.5 Load the DCM blank, calibration standards, sample extracts, IS, and QC samples to the GC/MS autosampler. Start the analysis with the DCM blank followed by calibration standards to establish GC/MS background and performance.
11.6.6 Analyze at least one QC and one duplicate sample for every 10 sample extracts.
11.6.7 Set up the sequence for sample analysis.
11.7 Calibration Curve Construction
Construct the calibration curves using SIM and internal standard method according to Section 13.1and 13.2. Check the r2 of linear regression. If the r2 is not greater than the specified value (0.99), recalibrate the GC/MS system or correct any problem.
12. Quality Control (QC)
12.1 Calibration
12.1.1 GC/MS requires frequent calibration. Calibration is needed when starting an analysis or any QC failure, as described in section 12.4.
12.1.2 Check the correlation r2 value for each PAH calibration curve. The r2 value must be at least 0.99.
12.2 Failure to achieve the linearity requirement will require re-calibrating the GC/MS. If it fails after recalibration, the problems causing the failures should be corrected before any analysis can be reported.
12.3 Method detection limit for filter extract by GC/MS
Method detection limit (MDL) for a filter extract is defined as follows:
MDL(i) = t * SD (i)
where:
MDL(i) = method detection limit of PAH i t = student’s t value associated with a 98% confidence interval (section 12.3.1) SD (i) = standard deviation of a replicate analysis of the lowest concentration standard for PAH component i
12.3.1 The Student’s t value is dependent upon the degrees of freedom associated with the analysis. The degree of freedom of the analysis is equal to the number of replicate measurements, n, of the lowest concentration standard, minus one. An
SOP 144 v 2.0 Effective Date: June, 2014 Page 13 of 38
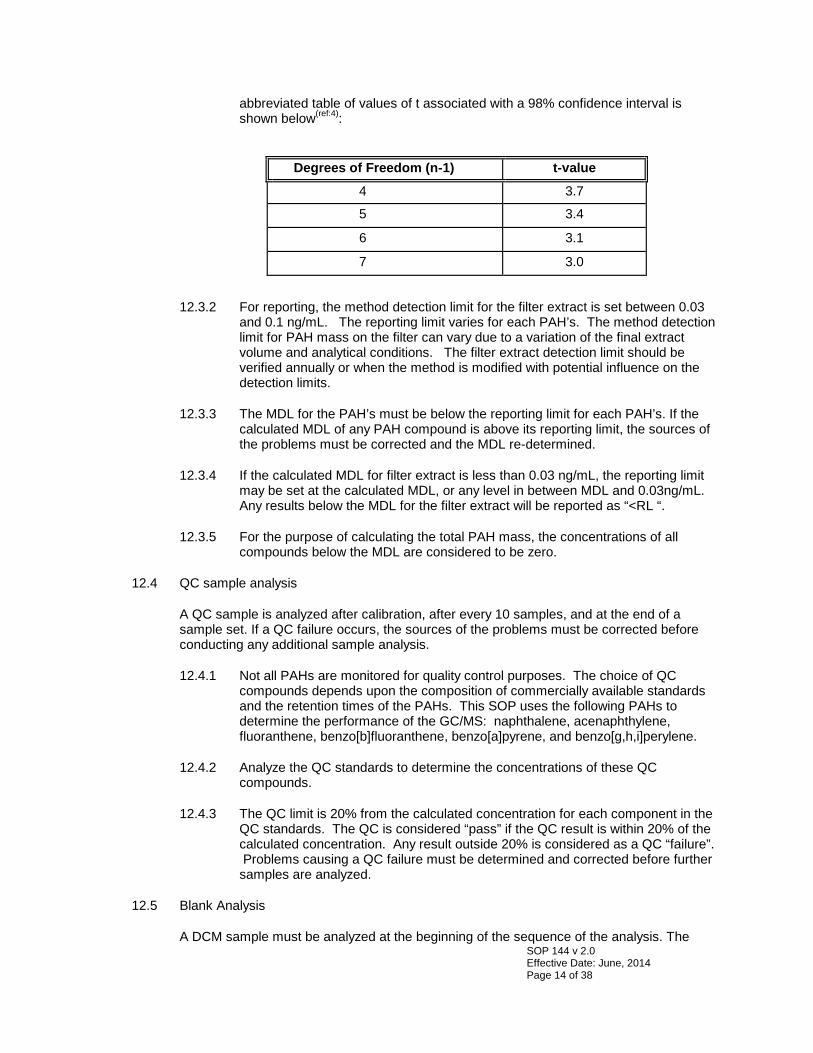
abbreviated table of values of t associated with a 98% confidence interval is shown below(ref:4):
Degrees of Freedom (n-1) t-value
4 3.7
5 3.4
6 3.1
7 3.0
12.3.2 For reporting, the method detection limit for the filter extract is set between 0.03 and 0.1 ng/mL. The reporting limit varies for each PAH’s. The method detection limit for PAH mass on the filter can vary due to a variation of the final extract volume and analytical conditions. The filter extract detection limit should be verified annually or when the method is modified with potential influence on the detection limits.
12.3.3 The MDL for the PAH’s must be below the reporting limit for each PAH’s. If the calculated MDL of any PAH compound is above its reporting limit, the sources of the problems must be corrected and the MDL re-determined.
12.3.4 If the calculated MDL for filter extract is less than 0.03 ng/mL, the reporting limit may be set at the calculated MDL, or any level in between MDL and 0.03ng/mL. Any results below the MDL for the filter extract will be reported as “<RL “.
12.3.5 For the purpose of calculating the total PAH mass, the concentrations of all compounds below the MDL are considered to be zero.
12.4 QC sample analysis
A QC sample is analyzed after calibration, after every 10 samples, and at the end of a sample set. If a QC failure occurs, the sources of the problems must be corrected before conducting any additional sample analysis.
12.4.1 Not all PAHs are monitored for quality control purposes. The choice of QC compounds depends upon the composition of commercially available standards and the retention times of the PAHs. This SOP uses the following PAHs to determine the performance of the GC/MS: naphthalene, acenaphthylene, fluoranthene, benzo[b]fluoranthene, benzo[a]pyrene, and benzo[g,h,i]perylene.
12.4.2 Analyze the QC standards to determine the concentrations of these QC compounds.
12.4.3 The QC limit is 20% from the calculated concentration for each component in the QC standards. The QC is considered “pass” if the QC result is within 20% of the calculated concentration. Any result outside 20% is considered as a QC “failure”. Problems causing a QC failure must be determined and corrected before further samples are analyzed.
12.5 Blank Analysis
A DCM sample must be analyzed at the beginning of the sequence of the analysis. The SOP 144 v 2.0 Effective Date: June, 2014 Page 14 of 38
PAH level in the DCM must be below the PAH’s MDL before proceeding to instrumental calibration or sample analysis.
12.6 Replicate Analysis
For each set of samples, perform a replicate sample analysis at least once or after every 10 sample analyses. The difference of the two replicate results for QC compounds listed in section 12.4.1 must be within 10% of their mean.
12.7 PAH identification
Identify the various PAHs in Table 1 from their retention times and mass spectra. Confirmation of a PAH can be obtained by matching the retention time and full scan MS of the GC/MS analysis with a calibration analysis. When comparing the criteria below must be met:
12.7.1 All characteristic ion peaks for the same PAH must have retention times within 0.01 min of one another.
12.7.2 The area ratio of the secondary to primary ion for the PAH must be within 5% when compared to the same ion area ratio from a calibration standard at approximately the same concentration. If such agreement cannot be made, choose secondary ions for calibration assuming the secondary ions are free of interferences or flag for “possible interference” in the final reports.
12.7.3 The GC retention time (from total ion chromatogram) must be within 0.03 min of that obtained for the same calibration standard.
13. Calculation
13.1 Calibration calculations:
13.1.1 After analysis of the standards, integrate the characteristic ion’s (Table 5 and 6) peak area for each calibration compound and internal standard at the expected retention time. Figure 3 shows the chemical structure and the mass spectrum of each PAH compound in this analysis (Table 1). Figure 4 shows the total ion chromatogram (TIC) of a calibration standard.
13.1.2 Plot the response area ratio Rsp(i) (y-axis) versus the amount ratio Amt(i) (x-axis) to generate calibration curves for each PAH compound listed in Table 1:
Where:
Rsp(i) = A(i)/A(is)
A(i) = area of compound i, and A(is)= area of internal standard.
and Amt(i) = C(i)/C(is) C(i) = concentration of compound i in the calibration standard, C(is)= concentration of the IS.
An example for a calibration curve is shown in Figure 5.
13.2 Linear least squares fit calculation SOP 144 v 2.0 Effective Date: June, 2014 Page 15 of 38
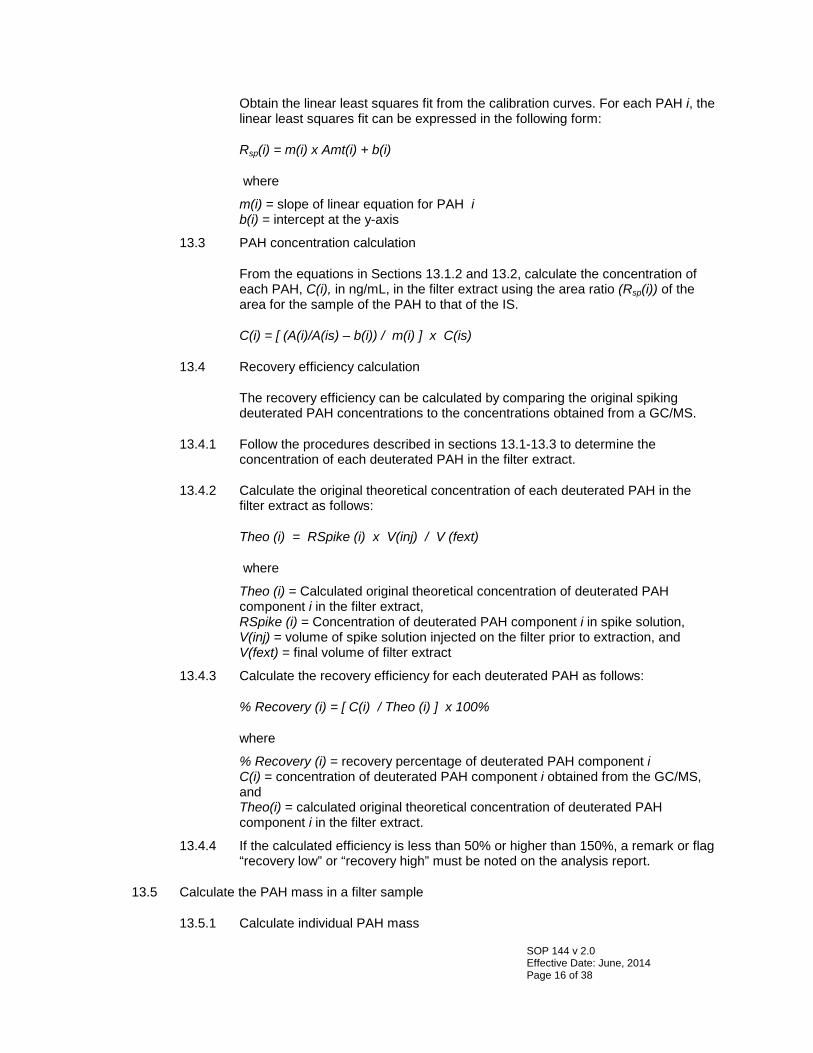
Obtain the linear least squares fit from the calibration curves. For each PAH i, the linear least squares fit can be expressed in the following form:
Rsp(i) = m(i) x Amt(i) + b(i)
where
m(i) = slope of linear equation for PAH i b(i) = intercept at the y-axis
13.3 PAH concentration calculation
From the equations in Sections 13.1.2 and 13.2, calculate the concentration of each PAH, C(i), in ng/mL, in the filter extract using the area ratio (Rsp(i)) of the area for the sample of the PAH to that of the IS.
C(i) = [ (A(i)/A(is) – b(i)) / m(i) ] x C(is)
13.4 Recovery efficiency calculation
The recovery efficiency can be calculated by comparing the original spiking deuterated PAH concentrations to the concentrations obtained from a GC/MS.
13.4.1 Follow the procedures described in sections 13.1-13.3 to determine the concentration of each deuterated PAH in the filter extract.
13.4.2 Calculate the original theoretical concentration of each deuterated PAH in the filter extract as follows:
Theo (i) = RSpike (i) x V(inj) / V (fext)
where
Theo (i) = Calculated original theoretical concentration of deuterated PAH component i in the filter extract, RSpike (i) = Concentration of deuterated PAH component i in spike solution, V(inj) = volume of spike solution injected on the filter prior to extraction, and V(fext) = final volume of filter extract
13.4.3 Calculate the recovery efficiency for each deuterated PAH as follows:
% Recovery (i) = [ C(i) / Theo (i) ] x 100%
where
% Recovery (i) = recovery percentage of deuterated PAH component i C(i) = concentration of deuterated PAH component i obtained from the GC/MS, and Theo(i) = calculated original theoretical concentration of deuterated PAH component i in the filter extract.
13.4.4 If the calculated efficiency is less than 50% or higher than 150%, a remark or flag “recovery low” or “recovery high” must be noted on the analysis report.
13.5 Calculate the PAH mass in a filter sample
13.5.1 Calculate individual PAH mass
SOP 144 v 2.0 Effective Date: June, 2014 Page 16 of 38
The individual PAH mass measured from each sample can be calculated by multiplying the extract volume and corrected for its extraction recovery efficiency.
13.5.2 The PAH mass can be calculated as follows:
PAH(i) = C(i) * V (fext) / % Recovery (i)
where
PAH(i) = measured mass (in ng) of PAH component i on filter, C(i) = concentration( in ng/mL, or ppb[w/v]) of PAH i obtained from GC/MS
analysis, V(fext) = Final filter sample’s extraction volume (in mL) prior to GC/MS analysis,
and % Recovery (i) = recovery percentage of PAH i.
13.5.3 For PAHs that have recovery efficiency greater than 100%, the recovery efficiency of 100% will be used to calculate the PAH mass.
14. Report
The report for each filter sample shall contain the identified PAH names and their individual measured masses, flags for high or low recovery efficiency, and flags for any possible interference for concentration determination. An example of the report is shown in Figure 6.
15. Reference Documents
1. California Environmental Protection Agency, Air Resources Board, Method 429: Determination of Polycyclic Aromatic Hydrocarbon (PAH) Emissions from Stationary Sources.
2. US Environmental Protection Agency, Analytical Method for the Analysis of Semi-volatile Organic Compounds, Exhibit D
3. Desert Research Institute Compendium Method TO-13A: Determination of Polycyclic Aromatic Hydrocarbons (PAHs) in Ambient Air Using gas Chromatography/mass Spectrometry (GC/MS).
4. Harris, Daniel C., “Quantitative Chemical Analysis”, W.H. Freeman & Co., 4th ed., 1995.
16. Revision History
1. SOP NO. MLD 144 V 1.0 was approved in November 2006.
2. To reflect the CARB division realignments, SOP NO. MLD 144 changes its convention to MV-AEROSL-144. The version 2.0 was approved in June, 2014.
2.1 The procedure for determination the semi-volatile PAHs were added to Version 2.0.
2.2 Version 2.0 also incorporates editorial changes.
SOP 144 v 2.0 Effective Date: June, 2014 Page 17 of 38
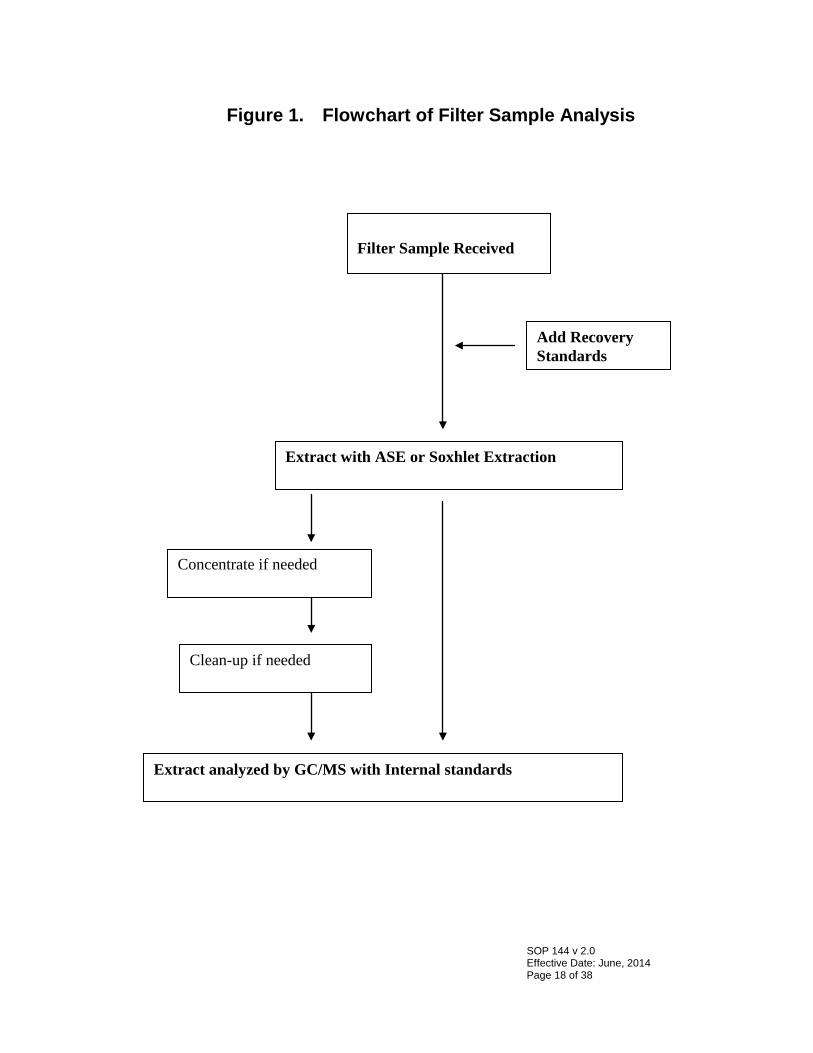
Figure 1. Flowchart of Filter Sample Analysis
Filter Sample Received
Add Recovery Standards
Extract with ASE or Soxhlet Extraction
Concentrate if needed
Clean-up if needed
Extract analyzed by GC/MS with Internal standards
SOP 144 v 2.0 Effective Date: June, 2014 Page 18 of 38
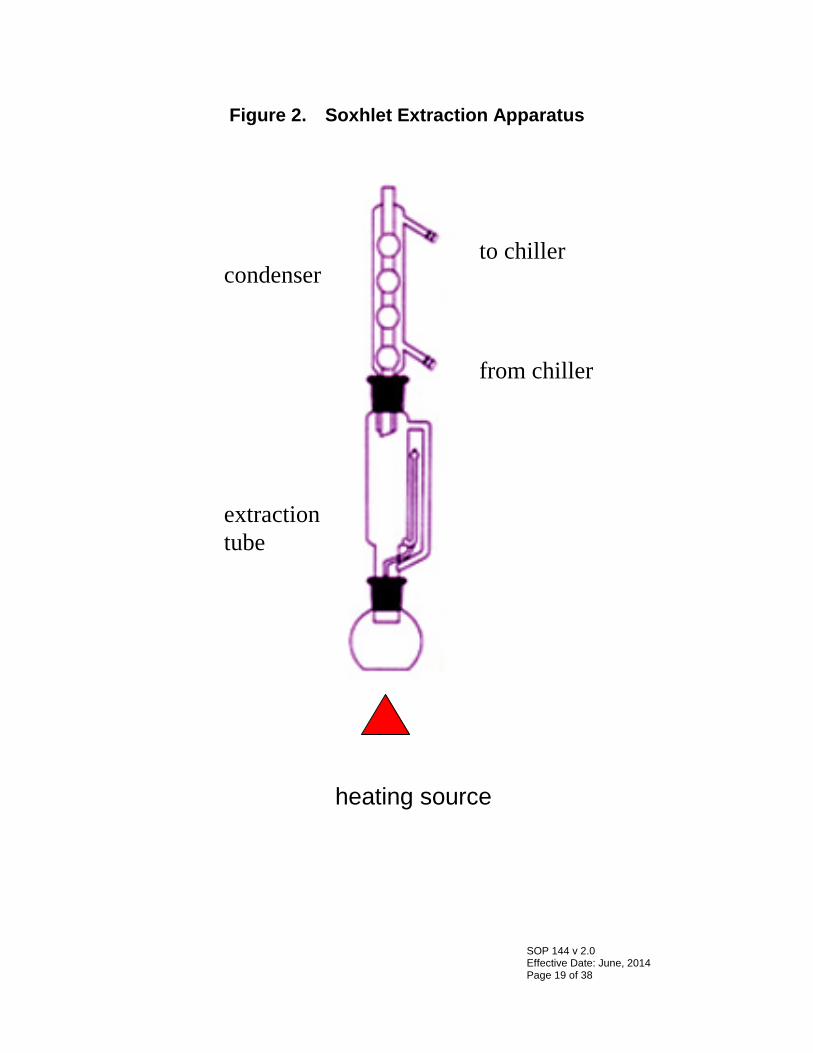
Figure 2. Soxhlet Extraction Apparatus
heating source
to chiller
from chiller
condenser
extraction tube
SOP 144 v 2.0 Effective Date: June, 2014 Page 19 of 38
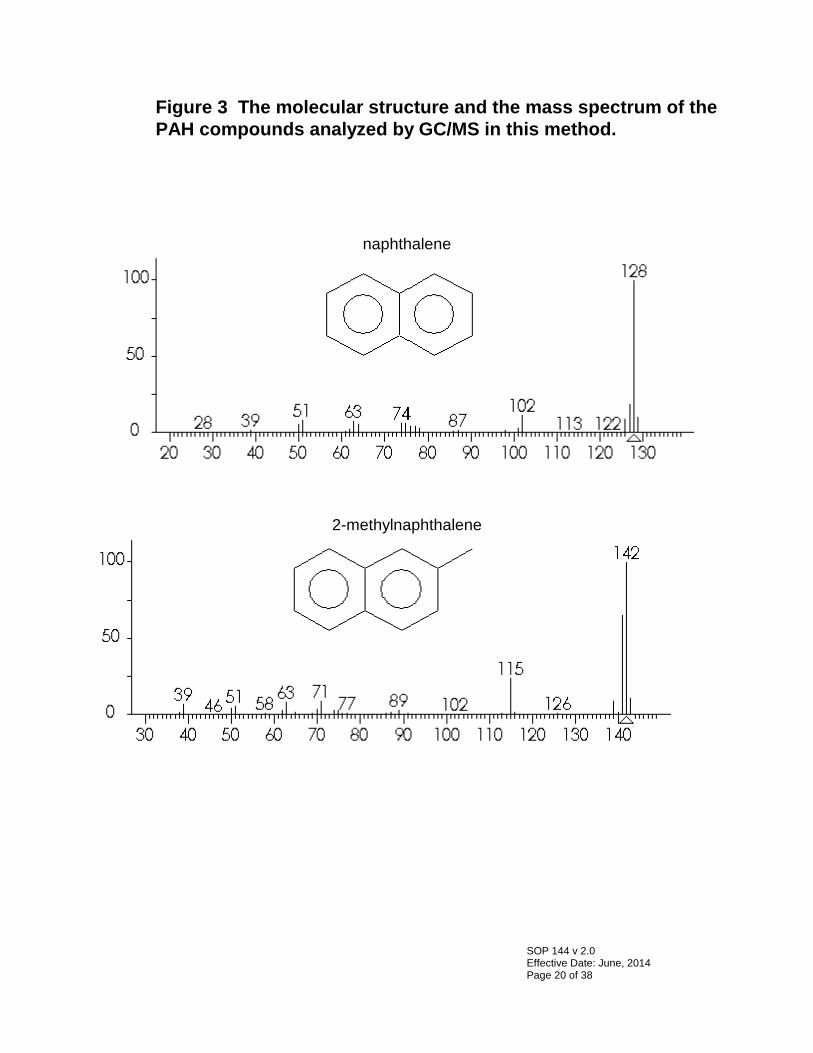
Figure 3 The molecular structure and the mass spectrum of the PAH compounds analyzed by GC/MS in this method.
naphthalene
2-methylnaphthalene
SOP 144 v 2.0 Effective Date: June, 2014 Page 20 of 38
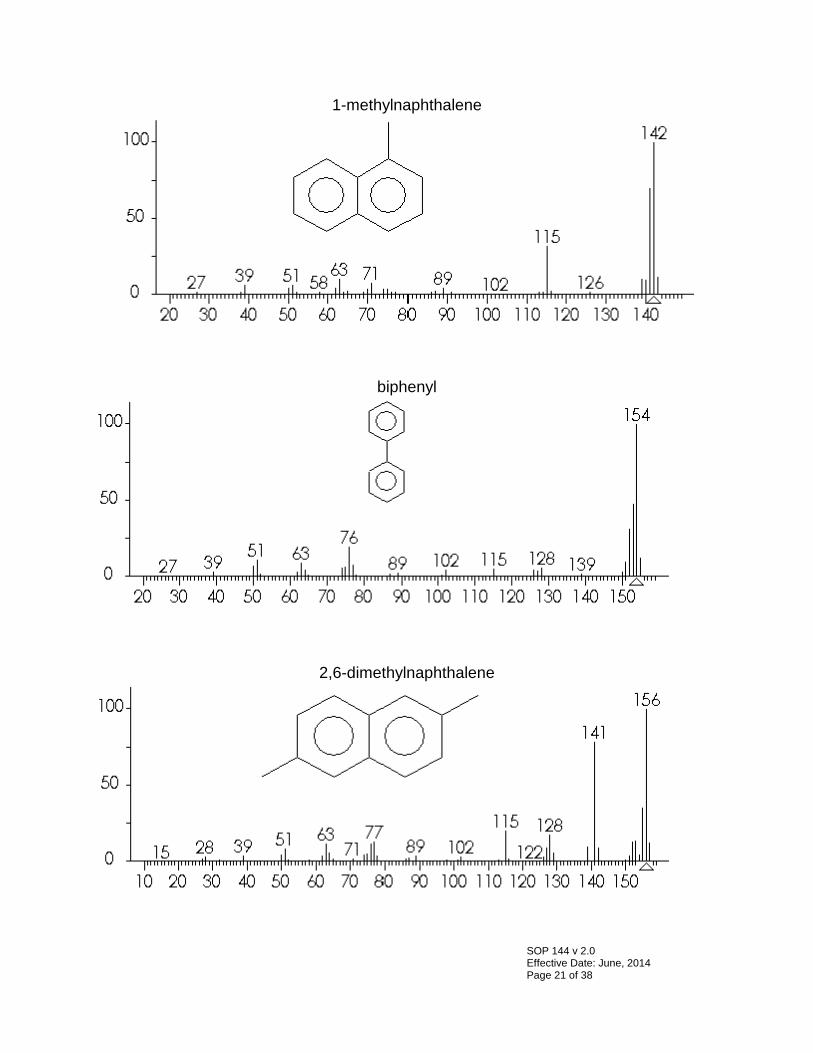
1-methylnaphthalene
biphenyl
2,6-dimethylnaphthalene
SOP 144 v 2.0 Effective Date: June, 2014 Page 21 of 38
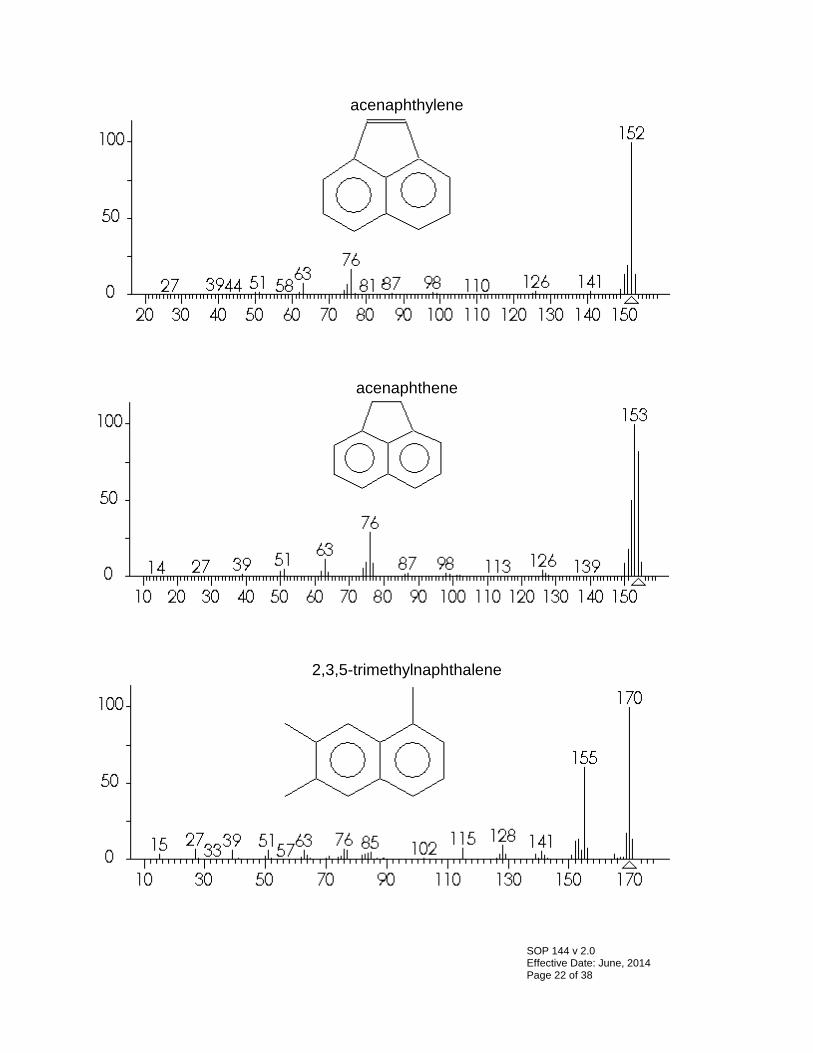
acenaphthylene
acenaphthene
2,3,5-trimethylnaphthalene
SOP 144 v 2.0 Effective Date: June, 2014 Page 22 of 38
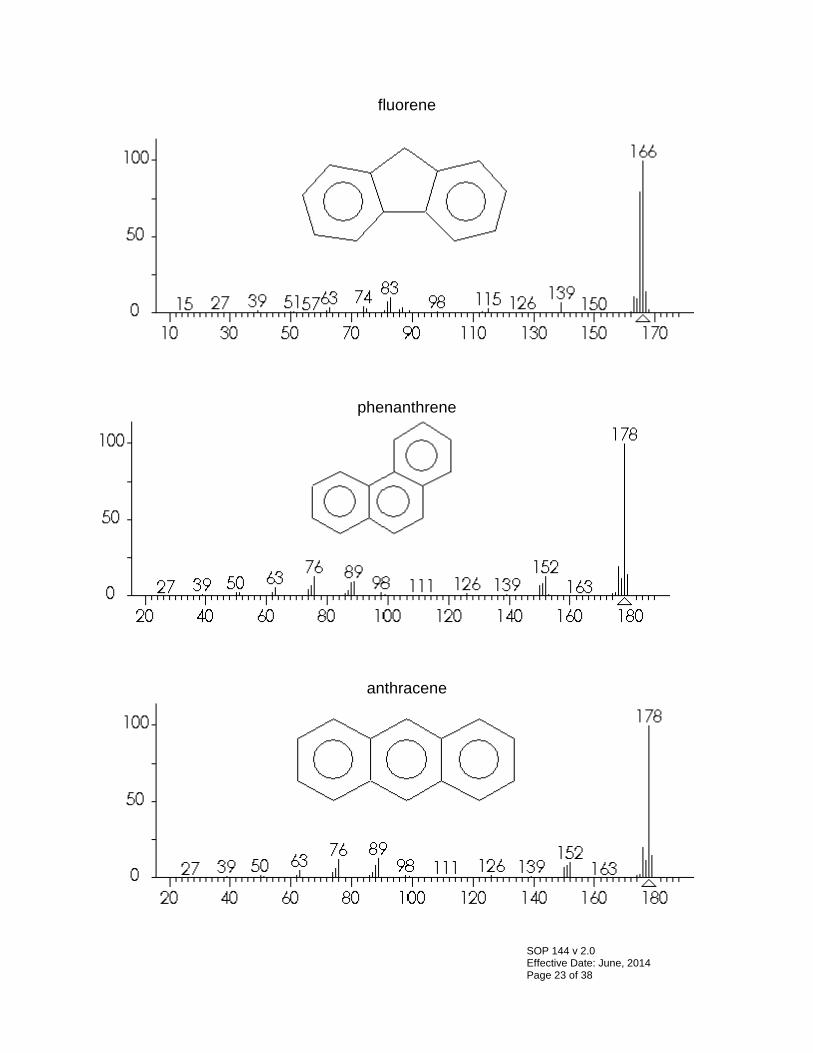
fluorene
phenanthrene
anthracene
SOP 144 v 2.0 Effective Date: June, 2014 Page 23 of 38
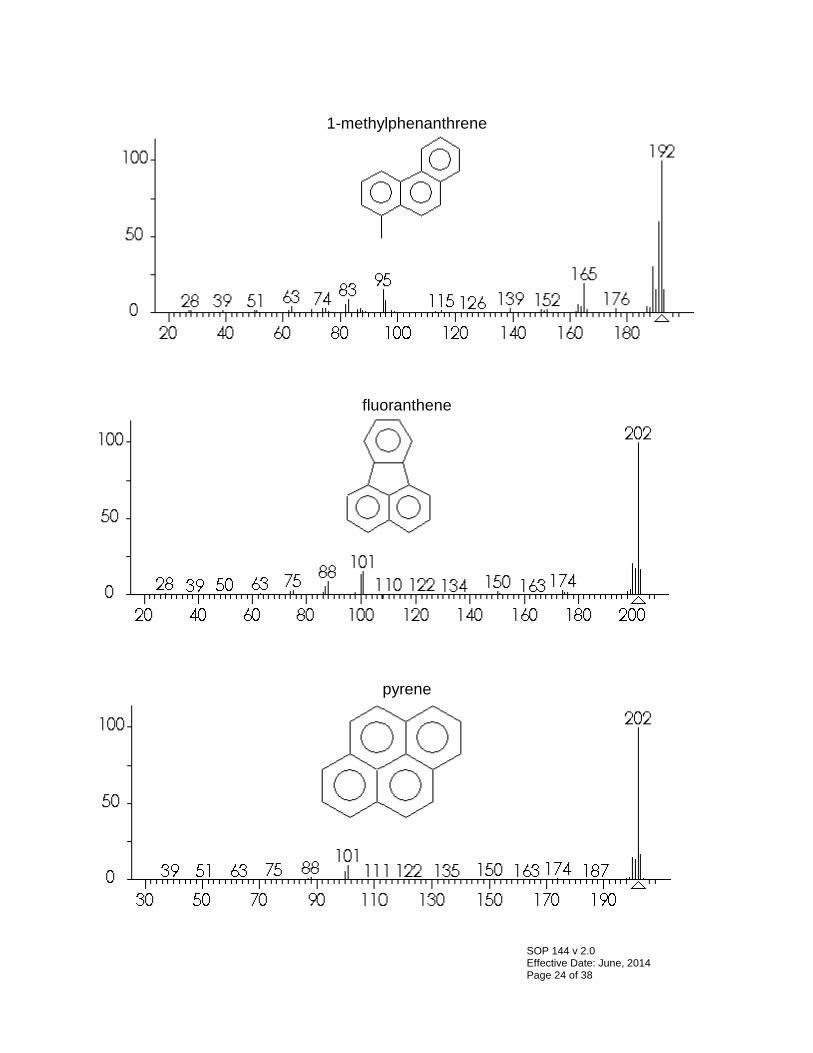
1-methylphenanthrene
fluoranthene
pyrene
SOP 144 v 2.0 Effective Date: June, 2014 Page 24 of 38
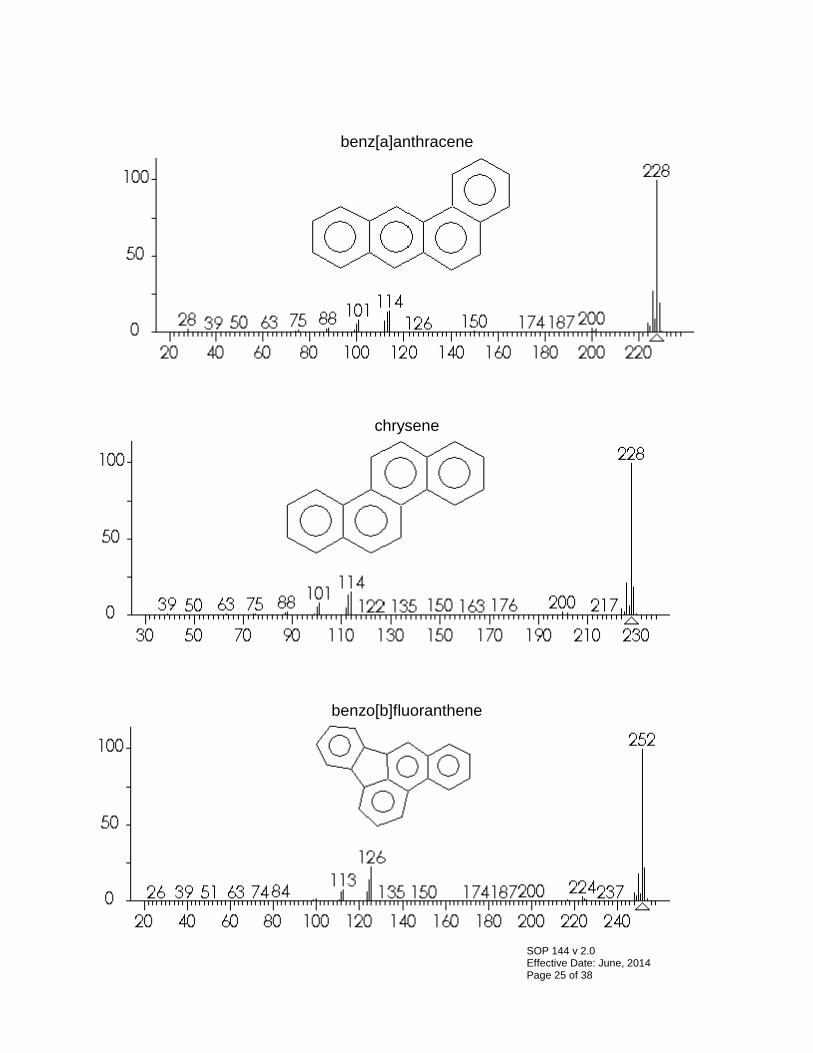
benz[a]anthracene
chrysene
benzo[b]fluoranthene
SOP 144 v 2.0 Effective Date: June, 2014 Page 25 of 38
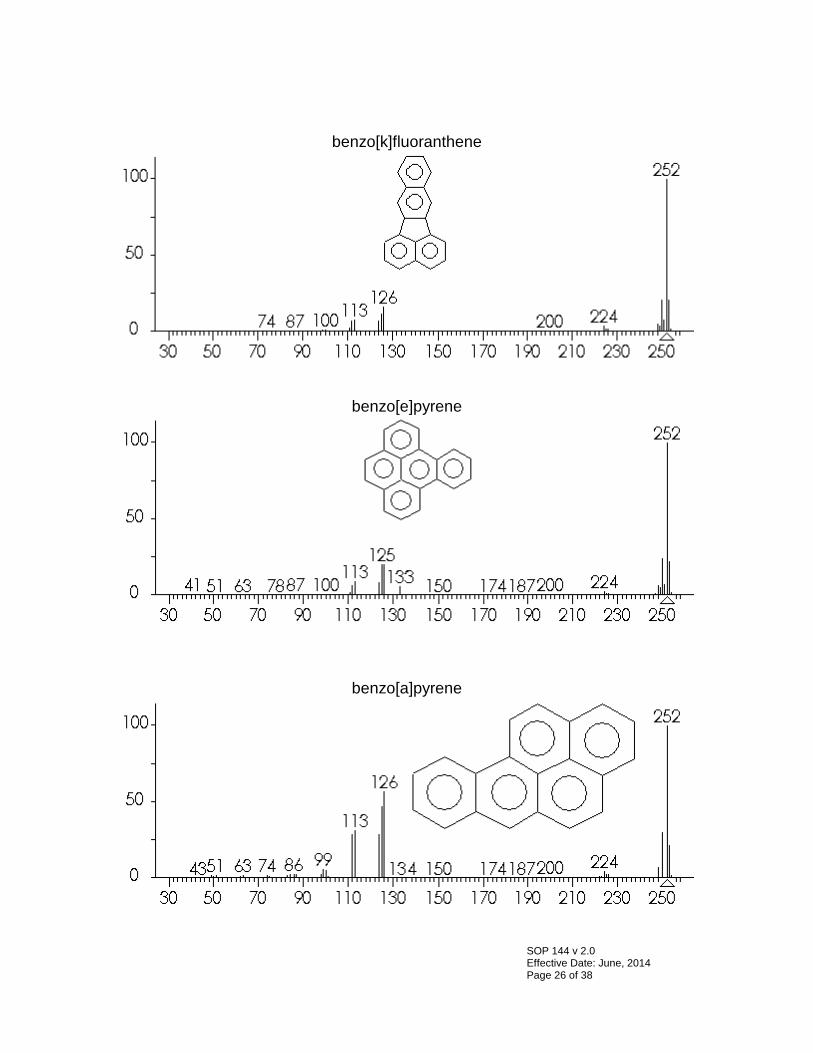
benzo[k]fluoranthene
benzo[e]pyrene
benzo[a]pyrene
SOP 144 v 2.0 Effective Date: June, 2014 Page 26 of 38
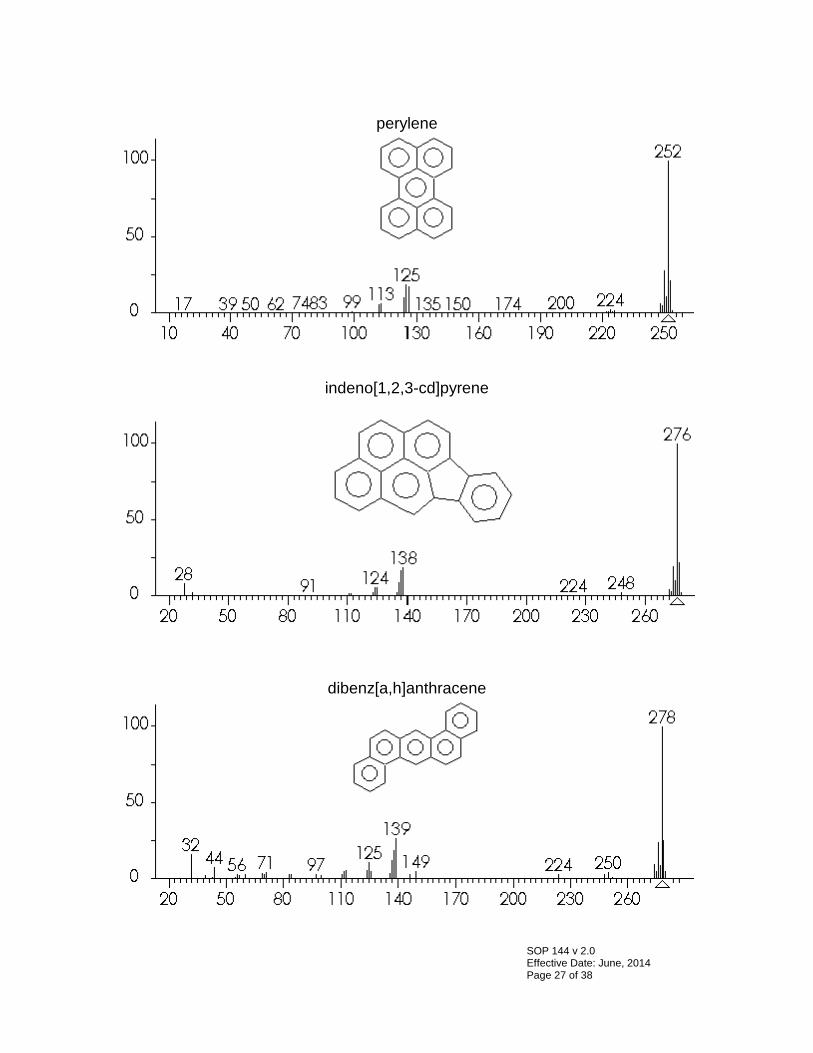
perylene
indeno[1,2,3-cd]pyrene
dibenz[a,h]anthracene
SOP 144 v 2.0 Effective Date: June, 2014 Page 27 of 38
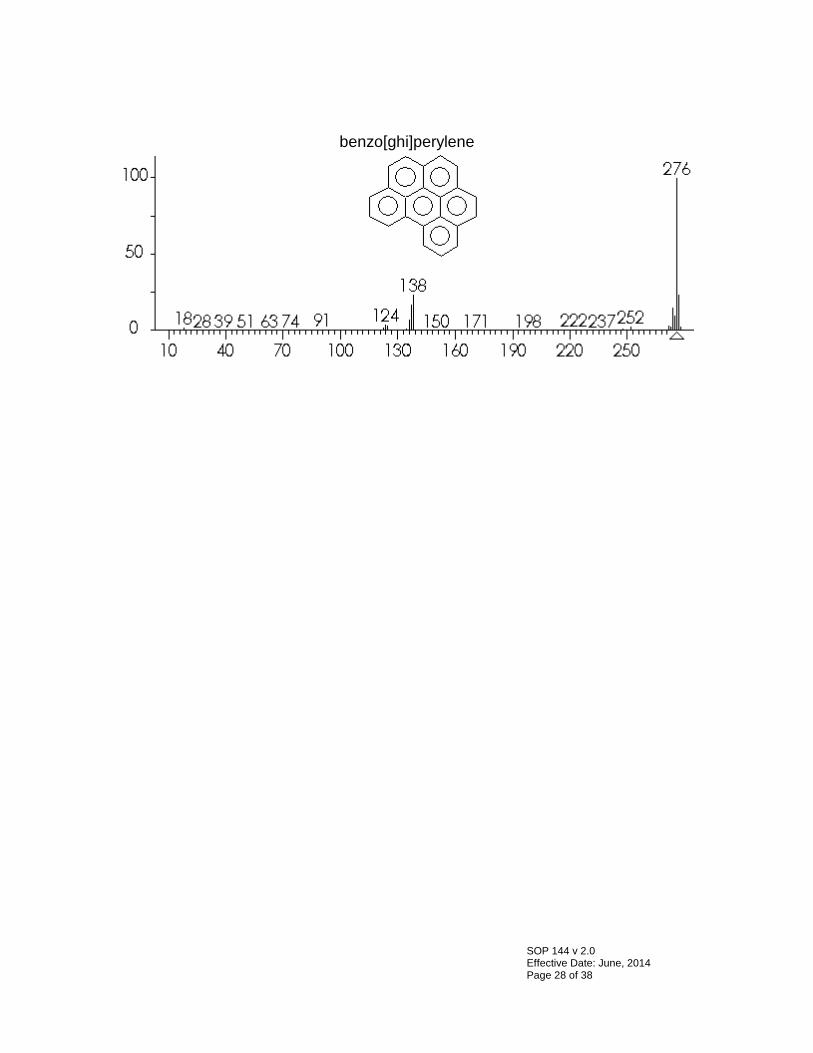
benzo[ghi]perylene
SOP 144 v 2.0 Effective Date: June, 2014 Page 28 of 38
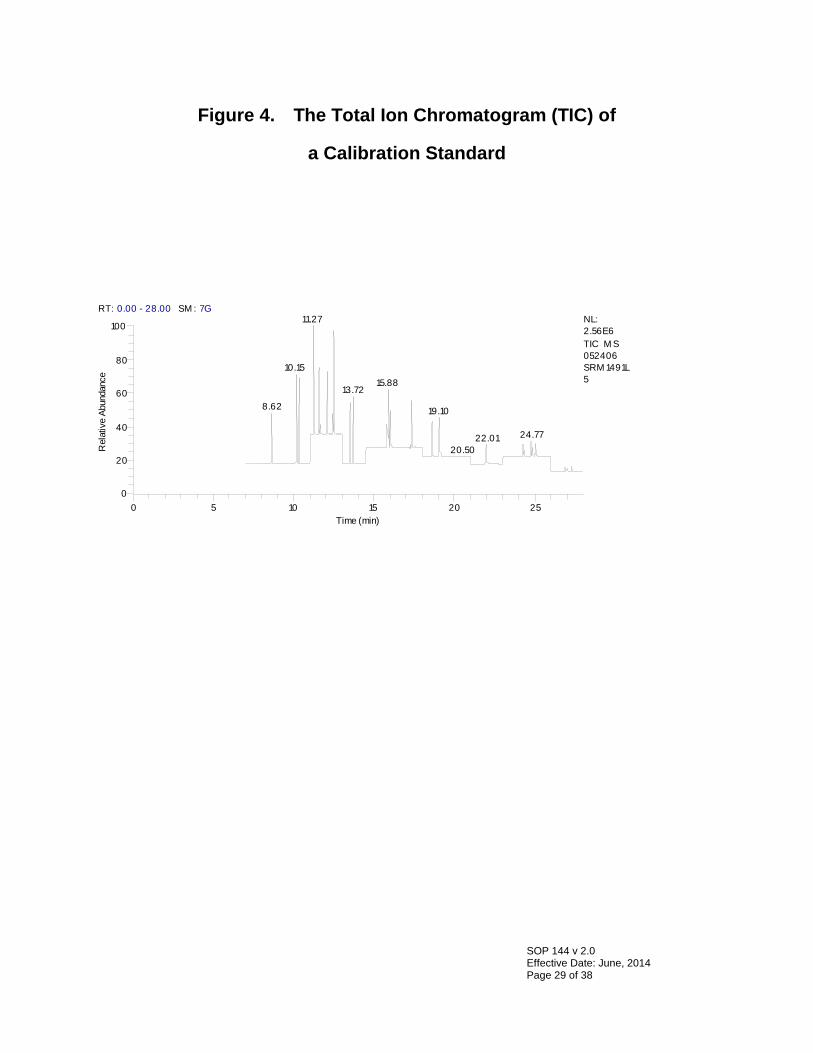
Figure 4. The Total Ion Chromatogram (TIC) of
a Calibration Standard
RT: 0.00 - 28.00 SM : 7G
0 5 10 15 20 25Time (min)
0
20
40
60
80
100
Rel
ativ
e Ab
unda
nce
11.27
10.1515.88
13.72
8.62 19.10
24.7722.0120.50
NL:2.56E6TIC M S 052406 SRM 1491L5
SOP 144 v 2.0 Effective Date: June, 2014 Page 29 of 38
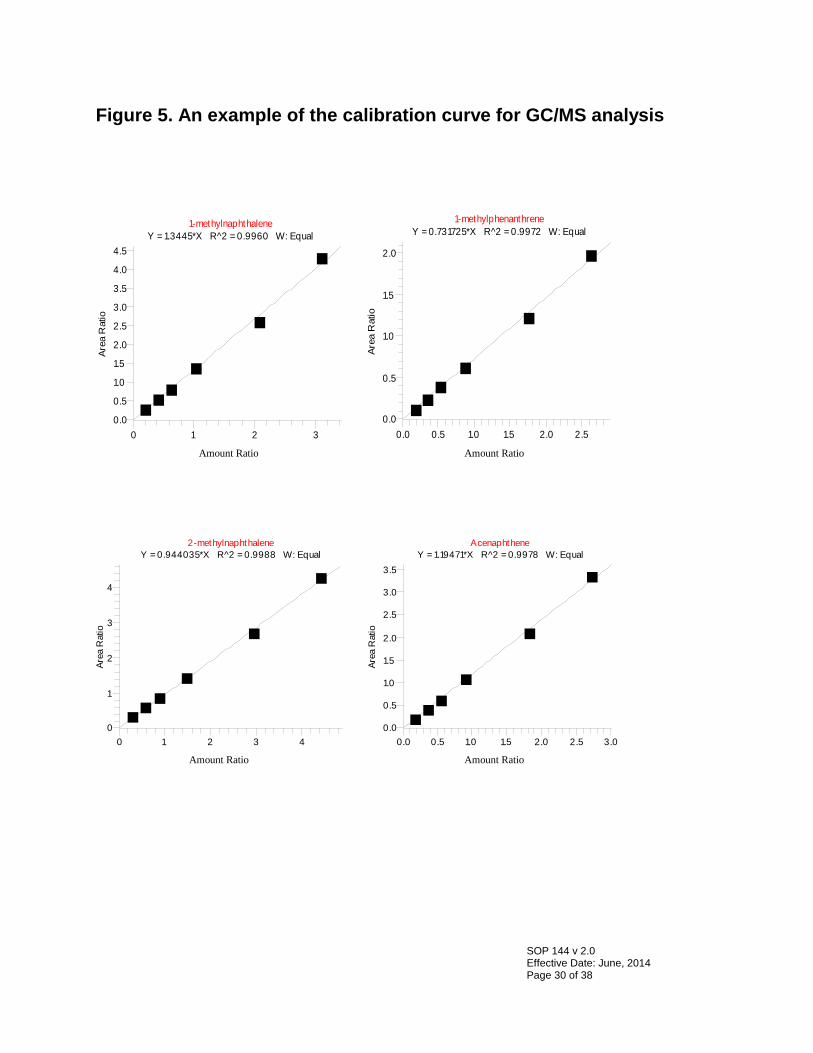
Figure 5. An example of the calibration curve for GC/MS analysis
1-methylnaphthalene
Y = 1.3445*X R^2 = 0.9960 W: Equal
0 1 2 3ppb
0.0
0.5
1.0
1.5
2.0
2.5
3.0
3.5
4.0
4.5
Area
Rat
io
1-methylphenanthreneY = 0.731725*X R^2 = 0.9972 W: Equal
0.0 0.5 1.0 1.5 2.0 2.5ppb
0.0
0.5
1.0
1.5
2.0
Are
a R
atio
2-methylnaphthaleneY = 0.944035*X R^2 = 0.9988 W: Equal
0 1 2 3 4ppb
0
1
2
3
4
Area
Rat
io
AcenaphtheneY = 1.19471*X R^2 = 0.9978 W: Equal
0.0 0.5 1.0 1.5 2.0 2.5 3.0ppb
0.0
0.5
1.0
1.5
2.0
2.5
3.0
3.5
Area
Rat
io
Amount Ratio Amount Ratio
Amount Ratio Amount Ratio
SOP 144 v 2.0 Effective Date: June, 2014 Page 30 of 38
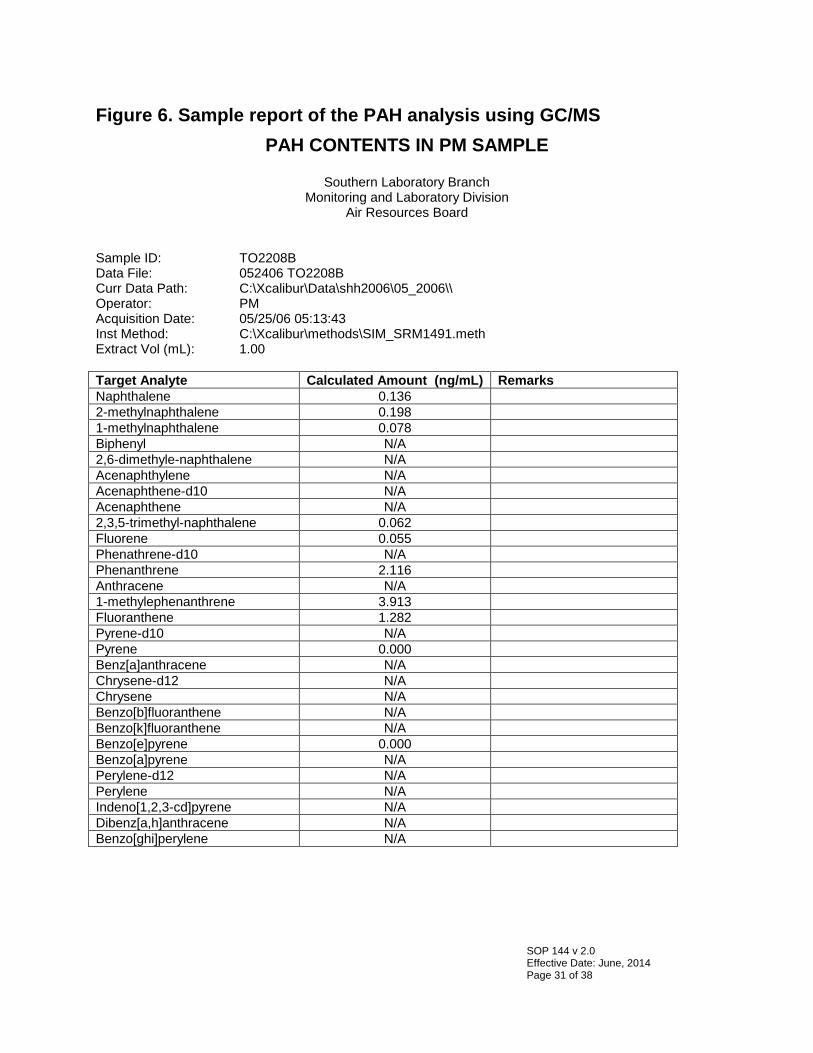
Figure 6. Sample report of the PAH analysis using GC/MS PAH CONTENTS IN PM SAMPLE
Southern Laboratory Branch
Monitoring and Laboratory Division Air Resources Board
Sample ID: TO2208B Data File: 052406 TO2208B Curr Data Path: C:\Xcalibur\Data\shh2006\05_2006\\ Operator: PM Acquisition Date: 05/25/06 05:13:43 Inst Method: C:\Xcalibur\methods\SIM_SRM1491.meth Extract Vol (mL): 1.00 Target Analyte Calculated Amount (ng/mL) Remarks Naphthalene 0.136 2-methylnaphthalene 0.198 1-methylnaphthalene 0.078 Biphenyl N/A 2,6-dimethyle-naphthalene N/A Acenaphthylene N/A Acenaphthene-d10 N/A Acenaphthene N/A 2,3,5-trimethyl-naphthalene 0.062 Fluorene 0.055 Phenathrene-d10 N/A Phenanthrene 2.116 Anthracene N/A 1-methylephenanthrene 3.913 Fluoranthene 1.282 Pyrene-d10 N/A Pyrene 0.000 Benz[a]anthracene N/A Chrysene-d12 N/A Chrysene N/A Benzo[b]fluoranthene N/A Benzo[k]fluoranthene N/A Benzo[e]pyrene 0.000 Benzo[a]pyrene N/A Perylene-d12 N/A Perylene N/A Indeno[1,2,3-cd]pyrene N/A Dibenz[a,h]anthracene N/A Benzo[ghi]perylene N/A
SOP 144 v 2.0 Effective Date: June, 2014 Page 31 of 38
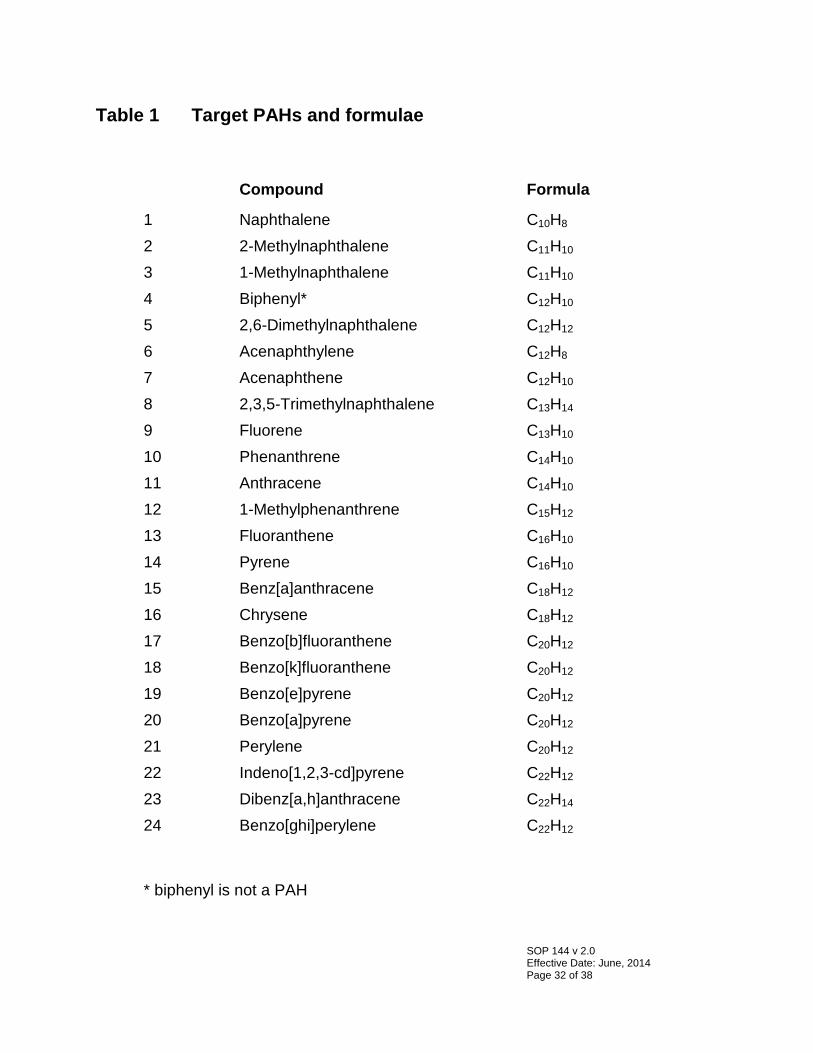
Table 1 Target PAHs and formulae
Compound Formula
1 Naphthalene C10H8 2 2-Methylnaphthalene C11H10 3 1-Methylnaphthalene C11H10 4 Biphenyl* C12H10 5 2,6-Dimethylnaphthalene C12H12 6 Acenaphthylene C12H8 7 Acenaphthene C12H10 8 2,3,5-Trimethylnaphthalene C13H14 9 Fluorene C13H10 10 Phenanthrene C14H10 11 Anthracene C14H10 12 1-Methylphenanthrene C15H12 13 Fluoranthene C16H10 14 Pyrene C16H10 15 Benz[a]anthracene C18H12 16 Chrysene C18H12 17 Benzo[b]fluoranthene C20H12 18 Benzo[k]fluoranthene C20H12 19 Benzo[e]pyrene C20H12 20 Benzo[a]pyrene C20H12 21 Perylene C20H12 22 Indeno[1,2,3-cd]pyrene C22H12 23 Dibenz[a,h]anthracene C22H14 24 Benzo[ghi]perylene C22H12
* biphenyl is not a PAH
SOP 144 v 2.0 Effective Date: June, 2014 Page 32 of 38
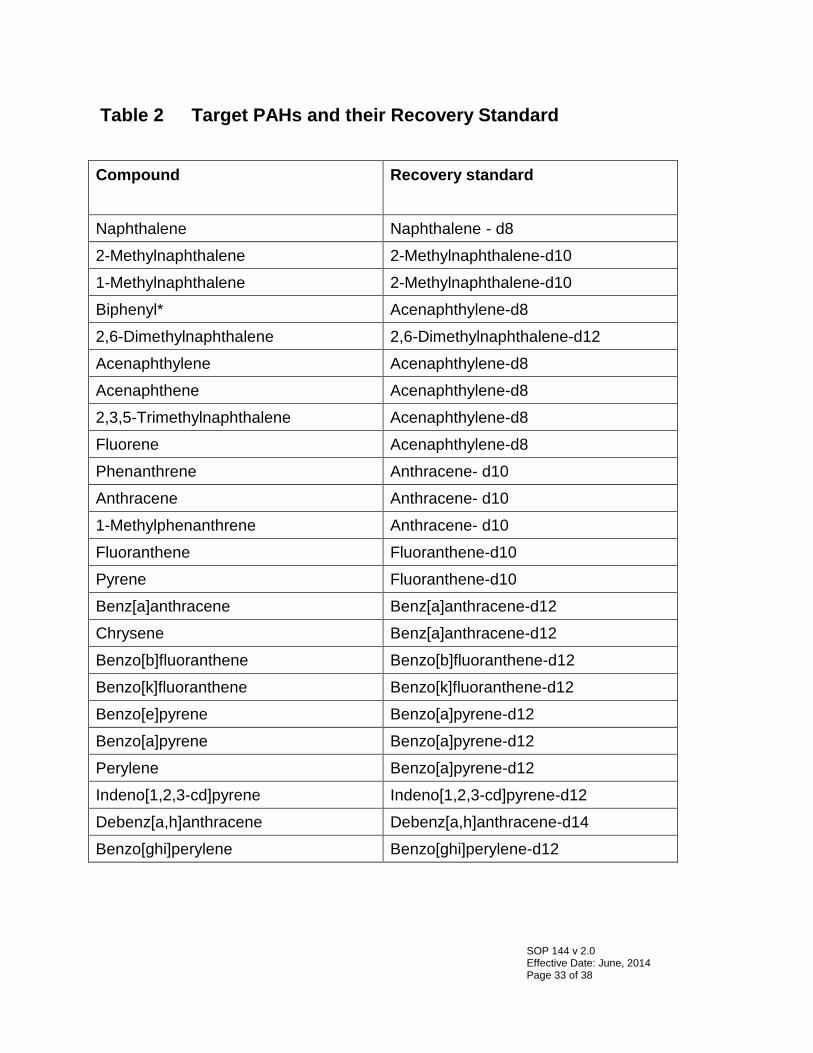
Table 2 Target PAHs and their Recovery Standard Compound Recovery standard
Naphthalene Naphthalene - d8 2-Methylnaphthalene 2-Methylnaphthalene-d10 1-Methylnaphthalene 2-Methylnaphthalene-d10 Biphenyl* Acenaphthylene-d8 2,6-Dimethylnaphthalene 2,6-Dimethylnaphthalene-d12 Acenaphthylene Acenaphthylene-d8 Acenaphthene Acenaphthylene-d8 2,3,5-Trimethylnaphthalene Acenaphthylene-d8 Fluorene Acenaphthylene-d8 Phenanthrene Anthracene- d10 Anthracene Anthracene- d10 1-Methylphenanthrene Anthracene- d10 Fluoranthene Fluoranthene-d10 Pyrene Fluoranthene-d10 Benz[a]anthracene Benz[a]anthracene-d12 Chrysene Benz[a]anthracene-d12 Benzo[b]fluoranthene Benzo[b]fluoranthene-d12 Benzo[k]fluoranthene Benzo[k]fluoranthene-d12 Benzo[e]pyrene Benzo[a]pyrene-d12 Benzo[a]pyrene Benzo[a]pyrene-d12 Perylene Benzo[a]pyrene-d12 Indeno[1,2,3-cd]pyrene Indeno[1,2,3-cd]pyrene-d12 Debenz[a,h]anthracene Debenz[a,h]anthracene-d14 Benzo[ghi]perylene Benzo[ghi]perylene-d12
SOP 144 v 2.0 Effective Date: June, 2014 Page 33 of 38
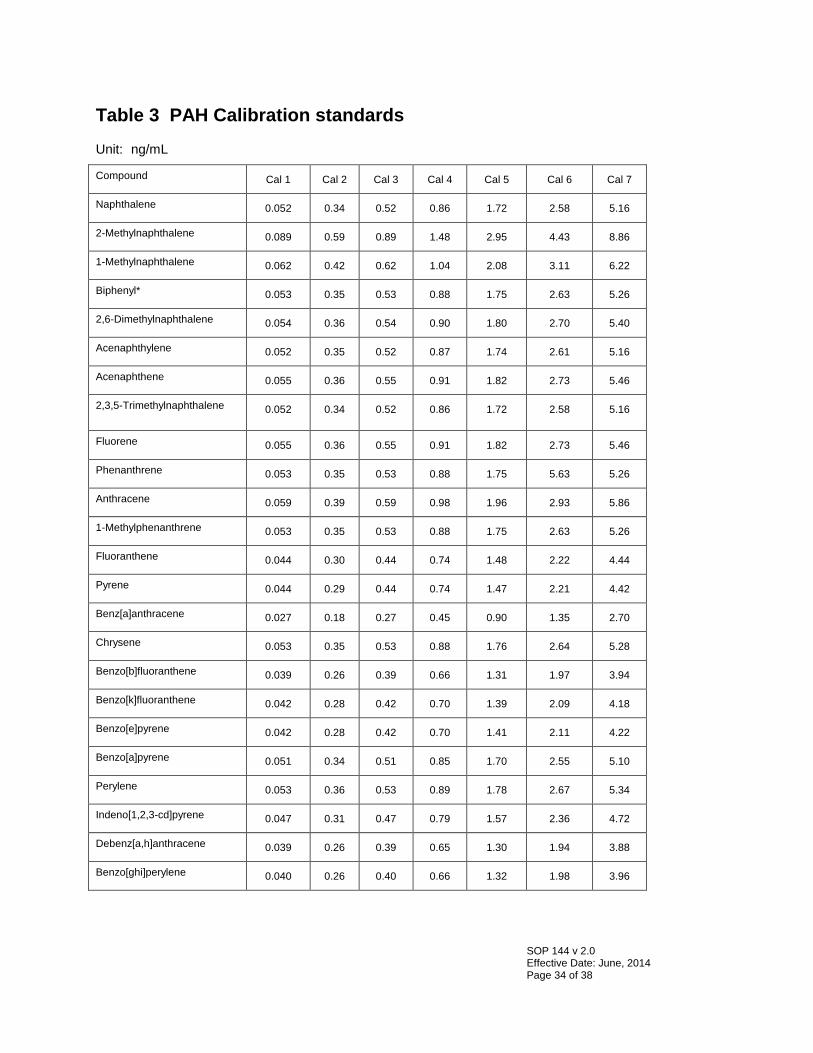
Table 3 PAH Calibration standards
Unit: ng/mL
Compound Cal 1 Cal 2 Cal 3 Cal 4 Cal 5 Cal 6 Cal 7
Naphthalene 0.052 0.34 0.52 0.86 1.72 2.58 5.16
2-Methylnaphthalene 0.089 0.59 0.89 1.48 2.95 4.43 8.86
1-Methylnaphthalene 0.062 0.42 0.62 1.04 2.08 3.11 6.22
Biphenyl* 0.053 0.35 0.53 0.88 1.75 2.63 5.26
2,6-Dimethylnaphthalene 0.054 0.36 0.54 0.90 1.80 2.70 5.40
Acenaphthylene 0.052 0.35 0.52 0.87 1.74 2.61 5.16
Acenaphthene 0.055 0.36 0.55 0.91 1.82 2.73 5.46
2,3,5-Trimethylnaphthalene 0.052 0.34 0.52 0.86 1.72 2.58 5.16
Fluorene 0.055 0.36 0.55 0.91 1.82 2.73 5.46
Phenanthrene 0.053 0.35 0.53 0.88 1.75 5.63 5.26
Anthracene 0.059 0.39 0.59 0.98 1.96 2.93 5.86
1-Methylphenanthrene 0.053 0.35 0.53 0.88 1.75 2.63 5.26
Fluoranthene 0.044 0.30 0.44 0.74 1.48 2.22 4.44
Pyrene 0.044 0.29 0.44 0.74 1.47 2.21 4.42
Benz[a]anthracene 0.027 0.18 0.27 0.45 0.90 1.35 2.70
Chrysene 0.053 0.35 0.53 0.88 1.76 2.64 5.28
Benzo[b]fluoranthene 0.039 0.26 0.39 0.66 1.31 1.97 3.94
Benzo[k]fluoranthene 0.042 0.28 0.42 0.70 1.39 2.09 4.18
Benzo[e]pyrene 0.042 0.28 0.42 0.70 1.41 2.11 4.22
Benzo[a]pyrene 0.051 0.34 0.51 0.85 1.70 2.55 5.10
Perylene 0.053 0.36 0.53 0.89 1.78 2.67 5.34
Indeno[1,2,3-cd]pyrene 0.047 0.31 0.47 0.79 1.57 2.36 4.72
Debenz[a,h]anthracene 0.039 0.26 0.39 0.65 1.30 1.94 3.88
Benzo[ghi]perylene 0.040 0.26 0.40 0.66 1.32 1.98 3.96
SOP 144 v 2.0 Effective Date: June, 2014 Page 34 of 38
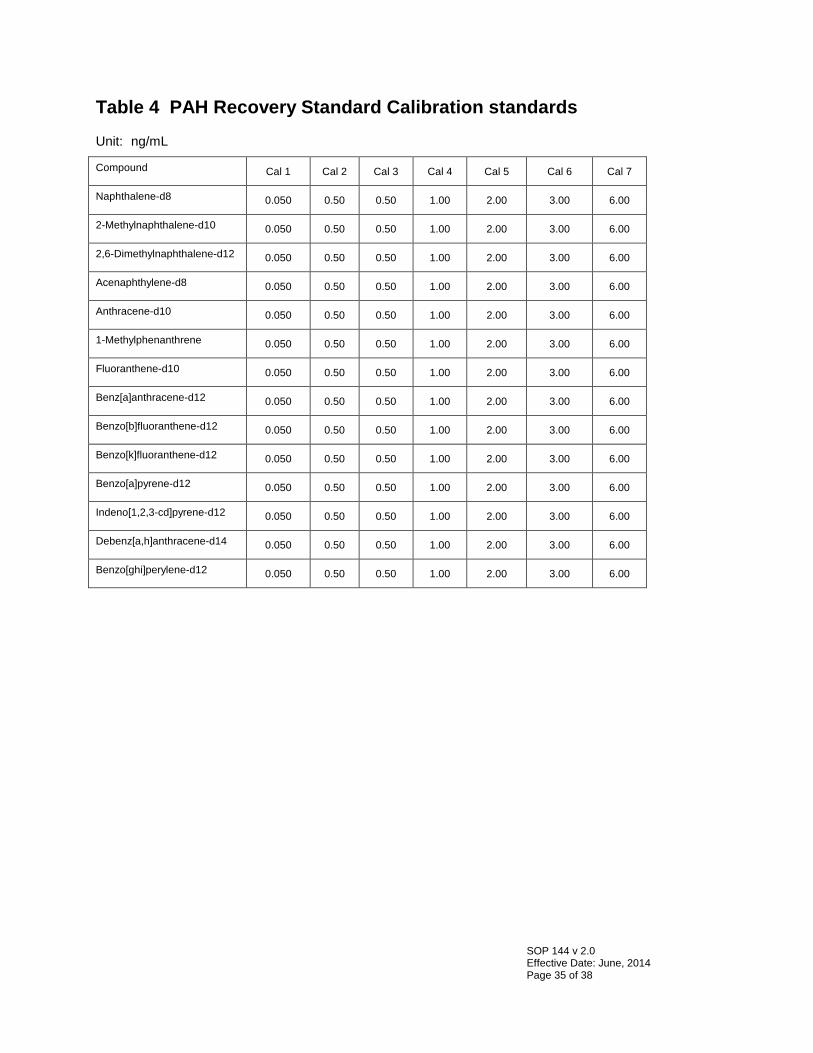
Table 4 PAH Recovery Standard Calibration standards
Unit: ng/mL
Compound Cal 1 Cal 2 Cal 3 Cal 4 Cal 5 Cal 6 Cal 7
Naphthalene-d8 0.050 0.50 0.50 1.00 2.00 3.00 6.00
2-Methylnaphthalene-d10 0.050 0.50 0.50 1.00 2.00 3.00 6.00
2,6-Dimethylnaphthalene-d12 0.050 0.50 0.50 1.00 2.00 3.00 6.00
Acenaphthylene-d8 0.050 0.50 0.50 1.00 2.00 3.00 6.00
Anthracene-d10 0.050 0.50 0.50 1.00 2.00 3.00 6.00
1-Methylphenanthrene 0.050 0.50 0.50 1.00 2.00 3.00 6.00
Fluoranthene-d10 0.050 0.50 0.50 1.00 2.00 3.00 6.00
Benz[a]anthracene-d12 0.050 0.50 0.50 1.00 2.00 3.00 6.00
Benzo[b]fluoranthene-d12 0.050 0.50 0.50 1.00 2.00 3.00 6.00
Benzo[k]fluoranthene-d12 0.050 0.50 0.50 1.00 2.00 3.00 6.00
Benzo[a]pyrene-d12 0.050 0.50 0.50 1.00 2.00 3.00 6.00
Indeno[1,2,3-cd]pyrene-d12 0.050 0.50 0.50 1.00 2.00 3.00 6.00
Debenz[a,h]anthracene-d14 0.050 0.50 0.50 1.00 2.00 3.00 6.00
Benzo[ghi]perylene-d12 0.050 0.50 0.50 1.00 2.00 3.00 6.00
SOP 144 v 2.0 Effective Date: June, 2014 Page 35 of 38
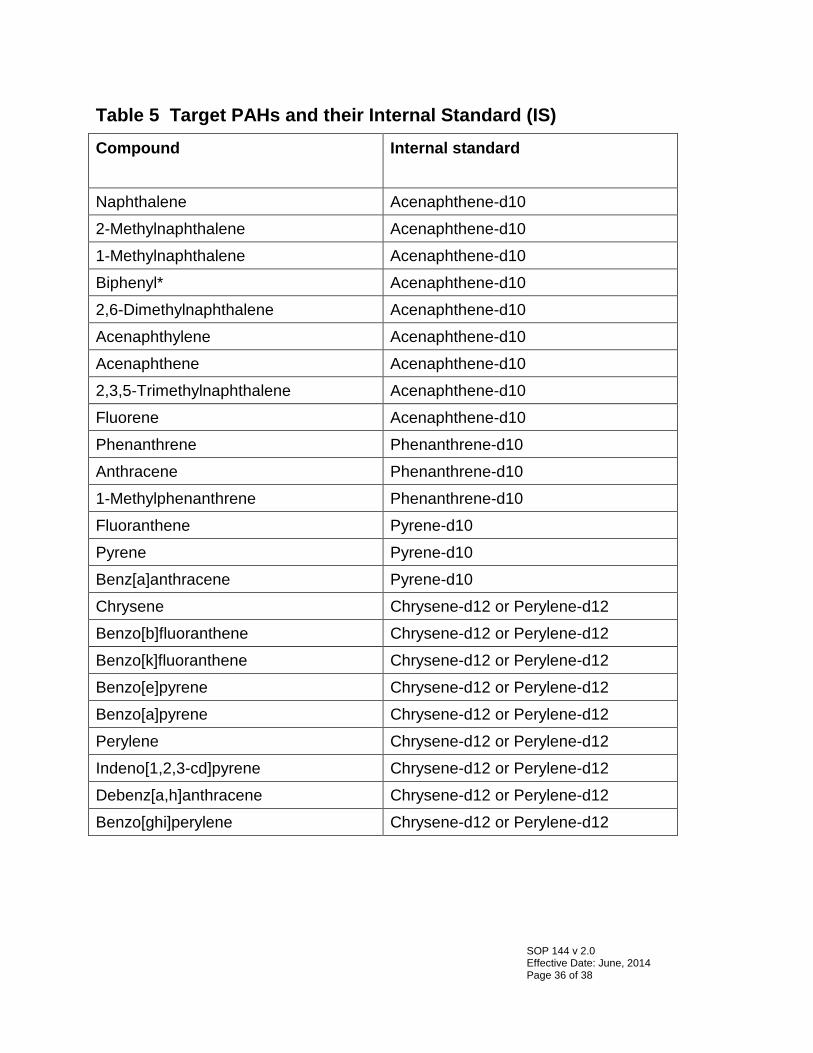
Table 5 Target PAHs and their Internal Standard (IS) Compound Internal standard
Naphthalene Acenaphthene-d10 2-Methylnaphthalene Acenaphthene-d10 1-Methylnaphthalene Acenaphthene-d10 Biphenyl* Acenaphthene-d10 2,6-Dimethylnaphthalene Acenaphthene-d10 Acenaphthylene Acenaphthene-d10 Acenaphthene Acenaphthene-d10 2,3,5-Trimethylnaphthalene Acenaphthene-d10 Fluorene Acenaphthene-d10 Phenanthrene Phenanthrene-d10 Anthracene Phenanthrene-d10 1-Methylphenanthrene Phenanthrene-d10 Fluoranthene Pyrene-d10 Pyrene Pyrene-d10 Benz[a]anthracene Pyrene-d10 Chrysene Chrysene-d12 or Perylene-d12 Benzo[b]fluoranthene Chrysene-d12 or Perylene-d12 Benzo[k]fluoranthene Chrysene-d12 or Perylene-d12 Benzo[e]pyrene Chrysene-d12 or Perylene-d12 Benzo[a]pyrene Chrysene-d12 or Perylene-d12 Perylene Chrysene-d12 or Perylene-d12 Indeno[1,2,3-cd]pyrene Chrysene-d12 or Perylene-d12 Debenz[a,h]anthracene Chrysene-d12 or Perylene-d12 Benzo[ghi]perylene Chrysene-d12 or Perylene-d12
SOP 144 v 2.0 Effective Date: June, 2014 Page 36 of 38
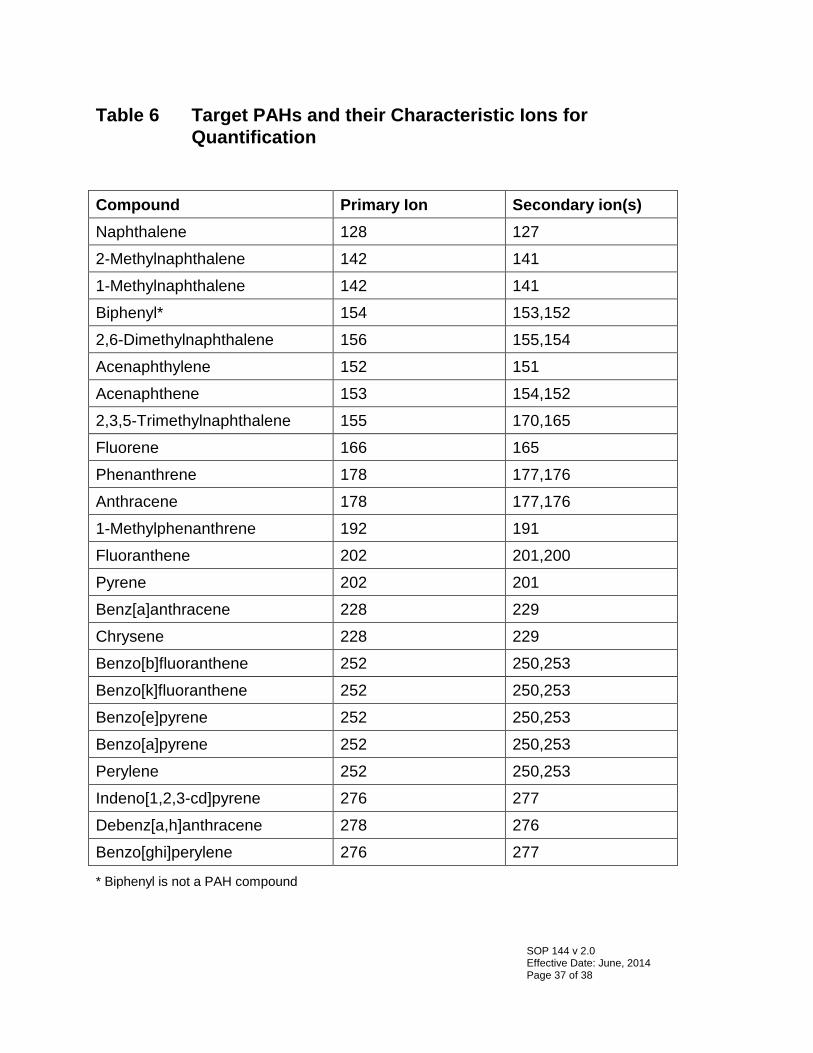
Table 6 Target PAHs and their Characteristic Ions for Quantification
Compound Primary Ion Secondary ion(s) Naphthalene 128 127
2-Methylnaphthalene 142 141
1-Methylnaphthalene 142 141
Biphenyl* 154 153,152
2,6-Dimethylnaphthalene 156 155,154
Acenaphthylene 152 151
Acenaphthene 153 154,152
2,3,5-Trimethylnaphthalene 155 170,165
Fluorene 166 165
Phenanthrene 178 177,176
Anthracene 178 177,176
1-Methylphenanthrene 192 191
Fluoranthene 202 201,200
Pyrene 202 201
Benz[a]anthracene 228 229
Chrysene 228 229
Benzo[b]fluoranthene 252 250,253
Benzo[k]fluoranthene 252 250,253
Benzo[e]pyrene 252 250,253
Benzo[a]pyrene 252 250,253
Perylene 252 250,253
Indeno[1,2,3-cd]pyrene 276 277
Debenz[a,h]anthracene 278 276
Benzo[ghi]perylene 276 277
* Biphenyl is not a PAH compound
SOP 144 v 2.0 Effective Date: June, 2014 Page 37 of 38
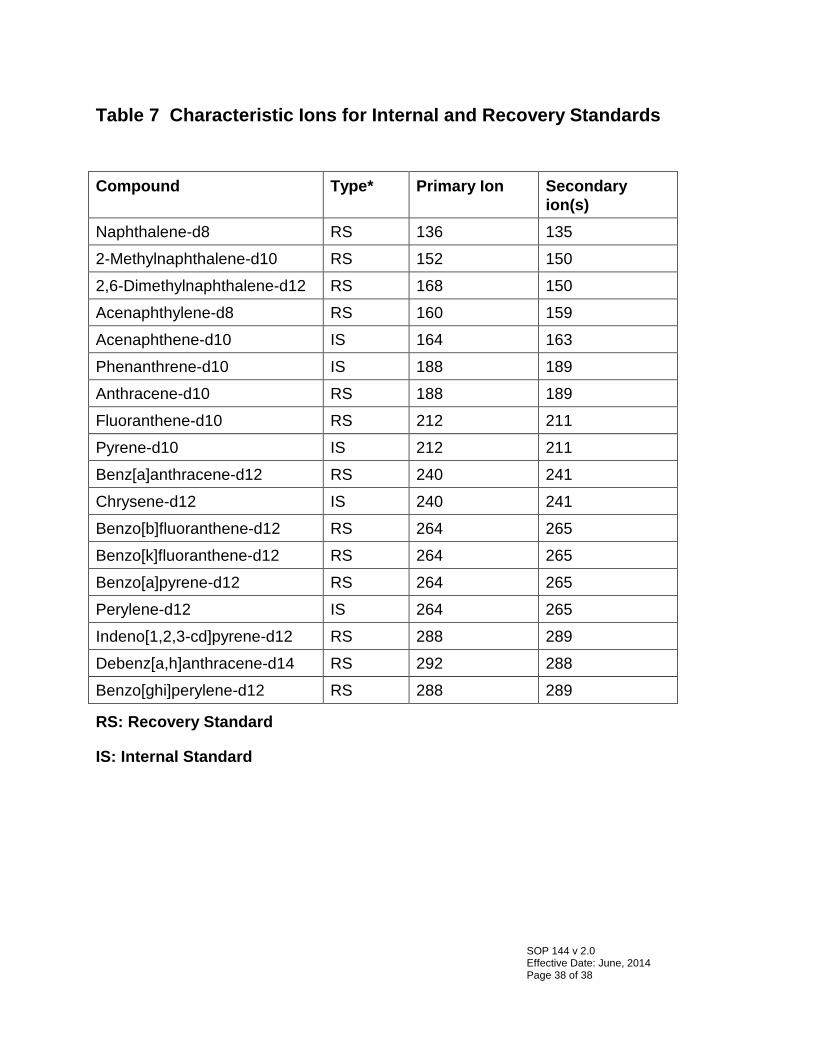
Table 7 Characteristic Ions for Internal and Recovery Standards
Compound Type* Primary Ion Secondary
ion(s) Naphthalene-d8 RS 136 135
2-Methylnaphthalene-d10 RS 152 150
2,6-Dimethylnaphthalene-d12 RS 168 150
Acenaphthylene-d8 RS 160 159
Acenaphthene-d10 IS 164 163
Phenanthrene-d10 IS 188 189
Anthracene-d10 RS 188 189
Fluoranthene-d10 RS 212 211
Pyrene-d10 IS 212 211
Benz[a]anthracene-d12 RS 240 241
Chrysene-d12 IS 240 241
Benzo[b]fluoranthene-d12 RS 264 265
Benzo[k]fluoranthene-d12 RS 264 265
Benzo[a]pyrene-d12 RS 264 265
Perylene-d12 IS 264 265
Indeno[1,2,3-cd]pyrene-d12 RS 288 289
Debenz[a,h]anthracene-d14 RS 292 288
Benzo[ghi]perylene-d12 RS 288 289
RS: Recovery Standard
IS: Internal Standard
SOP 144 v 2.0 Effective Date: June, 2014 Page 38 of 38