Embed Size (px)
Citation preview
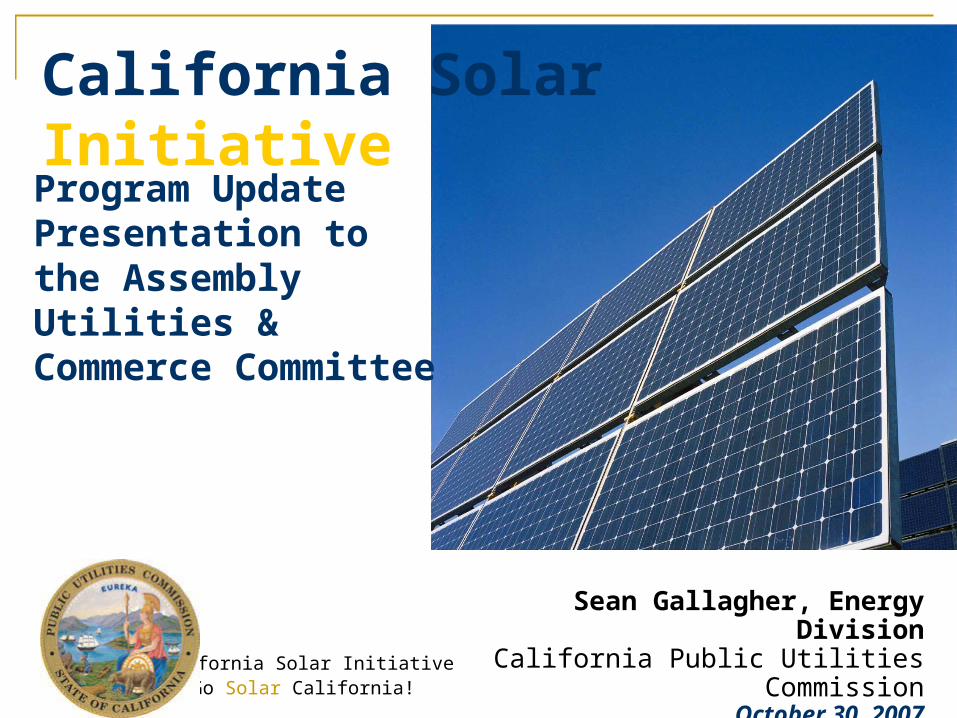
California Solar InitiativeGo Solar California!
Program Update Presentation to the Assembly Utilities & Commerce Committee
Sean Gallagher, Energy DivisionCalifornia Public Utilities Commission
October 30, 2007
California Solar Initiative
2
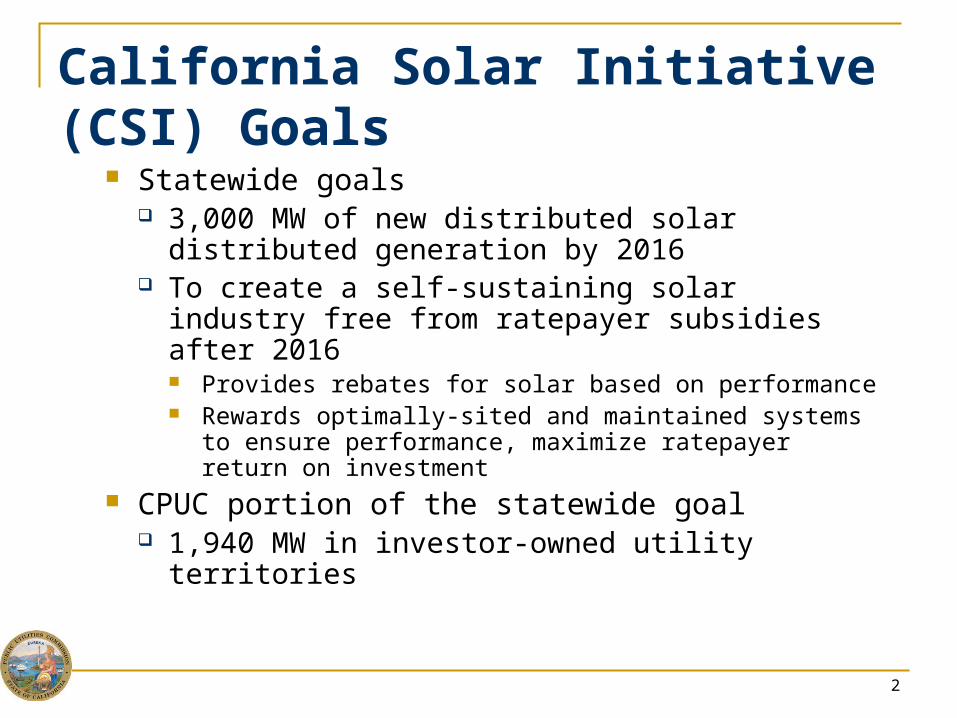
California Solar Initiative (CSI) Goals
Statewide goals 3,000 MW of new distributed solar distributed
generation by 2016 To create a self-sustaining solar industry free
from ratepayer subsidies after 2016 Provides rebates for solar based on performance Rewards optimally-sited and maintained systems to
ensure performance, maximize ratepayer return on investment
CPUC portion of the statewide goal 1,940 MW in investor-owned utility territories
3
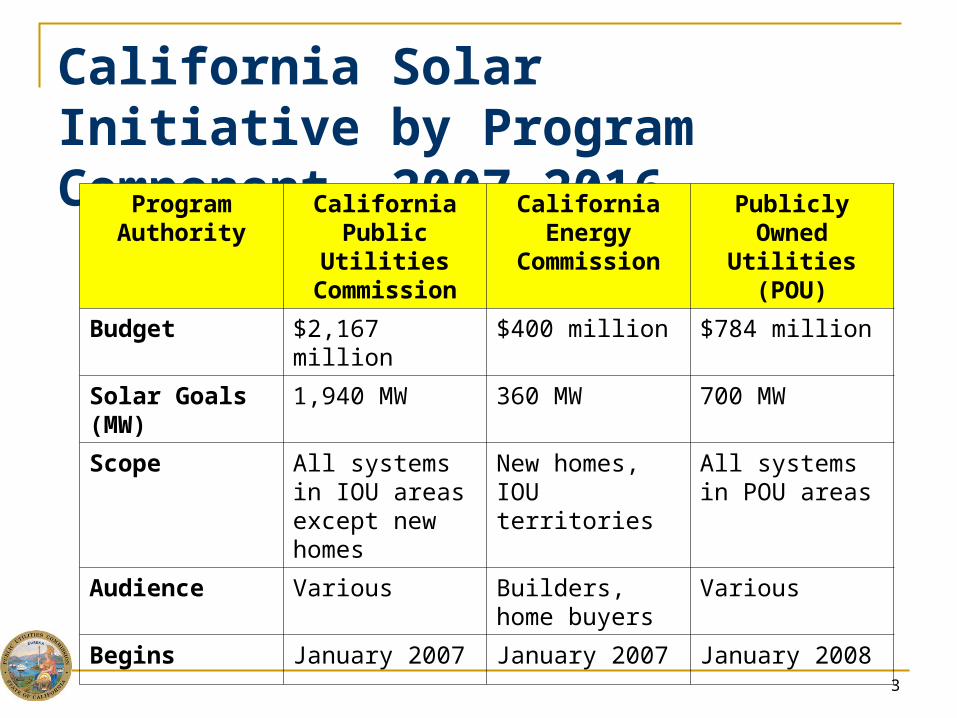
California Solar Initiative by Program Component, 2007-2016Program
AuthorityCalifornia
Public Utilities Commission
California Energy
Commission
Publicly Owned Utilities (POU)
Budget $2,167 million $400 million $784 million
Solar Goals (MW)
1,940 MW 360 MW 700 MW
Scope All systems in IOU areas except new homes
New homes, IOU territories
All systems in POU areas
Audience Various Builders, home buyers
Various
Begins January 2007 January 2007 January 2008
4
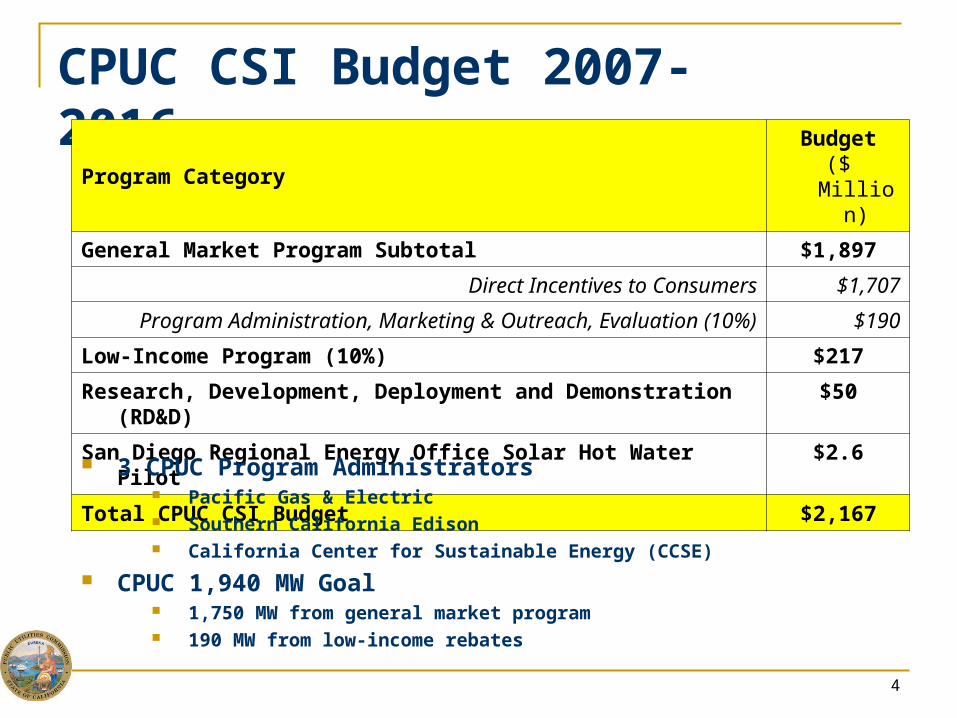
CPUC CSI Budget 2007-2016
Program CategoryBudget
($ Million)
General Market Program Subtotal $1,897
Direct Incentives to Consumers $1,707
Program Administration, Marketing & Outreach, Evaluation (10%) $190
Low-Income Program (10%) $217
Research, Development, Deployment and Demonstration (RD&D) $50
San Diego Regional Energy Office Solar Hot Water Pilot $2.6
Total CPUC CSI Budget $2,167
3 CPUC Program Administrators Pacific Gas & Electric Southern California Edison California Center for Sustainable Energy (CCSE)
CPUC 1,940 MW Goal 1,750 MW from general market program 190 MW from low-income rebates
5
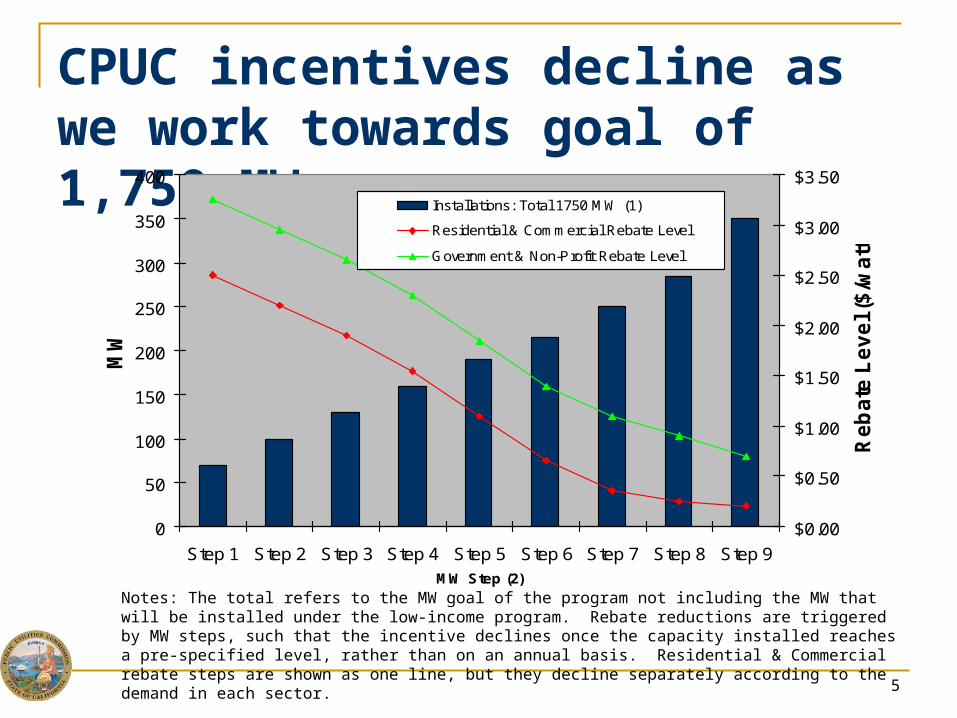
Notes: The total refers to the MW goal of the program not including the MW that will be installed under the low-income program. Rebate reductions are triggered by MW steps, such that the incentive declines once the capacity installed reaches a pre-specified level, rather than on an annual basis. Residential & Commercial rebate steps are shown as one line, but they decline separately according to the demand in each sector.
CPUC incentives decline as we work towards goal of 1,750 MW
0
50
100
150
200
250
300
350
400
Step 1 Step 2 Step 3 Step 4 Step 5 Step 6 Step 7 Step 8 Step 9MW Step (2)
MW
$0.00
$0.50
$1.00
$1.50
$2.00
$2.50
$3.00
$3.50
Re
ba
te L
ev
el (
$/w
att
)
Installations: Total 1750 MW (1)
Residential & Commercial Rebate Level
Government & Non-Profit Rebate Level
6
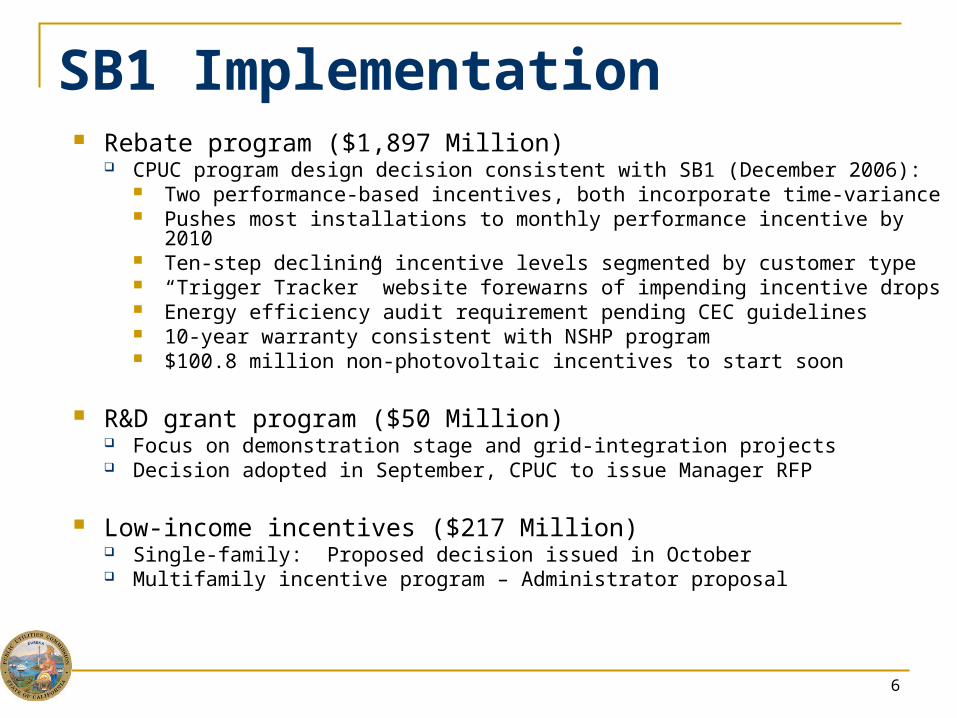
SB1 Implementation Rebate program ($1,897 Million)
CPUC program design decision consistent with SB1 (December 2006): Two performance-based incentives, both incorporate time-variance Pushes most installations to monthly performance incentive by 2010 Ten-step declining incentive levels segmented by customer type “Trigger Tracker” website forewarns of impending incentive drops Energy efficiency audit requirement pending CEC guidelines 10-year warranty consistent with NSHP program $100.8 million non-photovoltaic incentives to start soon
R&D grant program ($50 Million) Focus on demonstration stage and grid-integration projects Decision adopted in September, CPUC to issue Manager RFP
Low-income incentives ($217 Million) Single-family: Proposed decision issued in October Multifamily incentive program – Administrator proposal
7
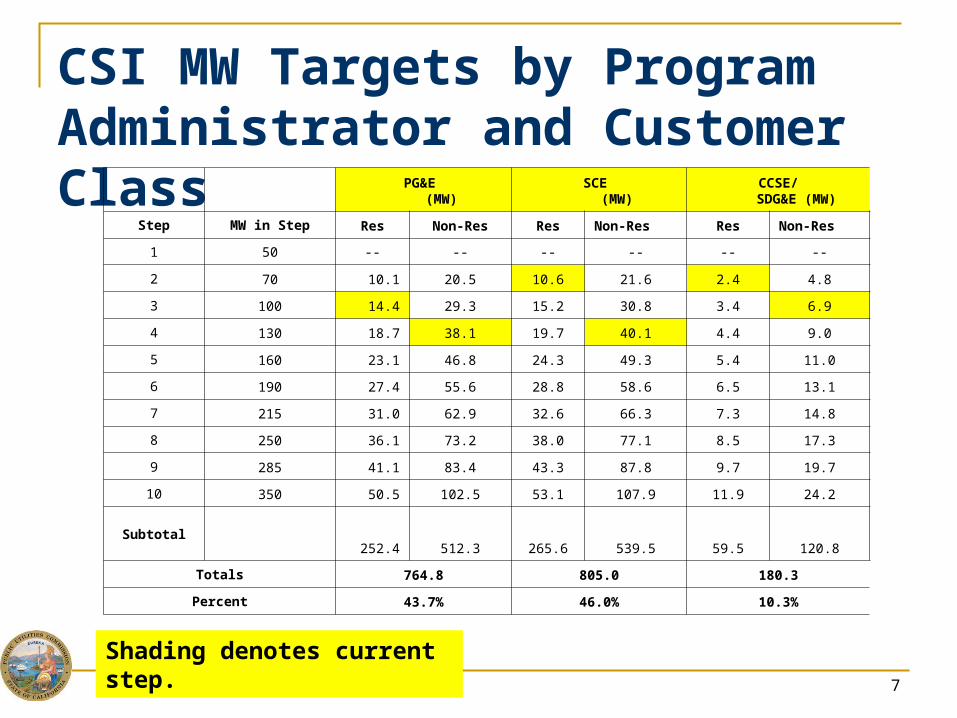
CSI MW Targets by Program Administrator and Customer Class
PG&E (MW)
SCE (MW)
CCSE/SDG&E (MW)
Step MW in Step Res Non-Res Res Non-Res Res Non-Res
1 50 -- -- -- -- -- --
2 70 10.1 20.5 10.6 21.6 2.4 4.8
3 100 14.4 29.3 15.2 30.8 3.4 6.9
4 130 18.7 38.1 19.7 40.1 4.4 9.0
5 160 23.1 46.8 24.3 49.3 5.4 11.0
6 190 27.4 55.6 28.8 58.6 6.5 13.1
7 215 31.0 62.9 32.6 66.3 7.3 14.8
8 250 36.1 73.2 38.0 77.1 8.5 17.3
9 285 41.1 83.4 43.3 87.8 9.7 19.7
10 350 50.5 102.5 53.1 107.9 11.9 24.2
Subtotal252.4 512.3 265.6 539.5 59.5 120.8
Totals 764.8 805.0 180.3
Percent 43.7% 46.0% 10.3%
Shading denotes current step.

8
Here Comes the Sun… The CSI program started slow, but demand is now robust.
From Jan 1- Sept 18, 2007, we received 5,230 applications (5,109 active) 175 MW (160 MW active) $363 Million in rebates ($320 million active)
In the first 9 months alone, requests are nearing CA’s total installed solar from the previous 26 years (198 MW).
9
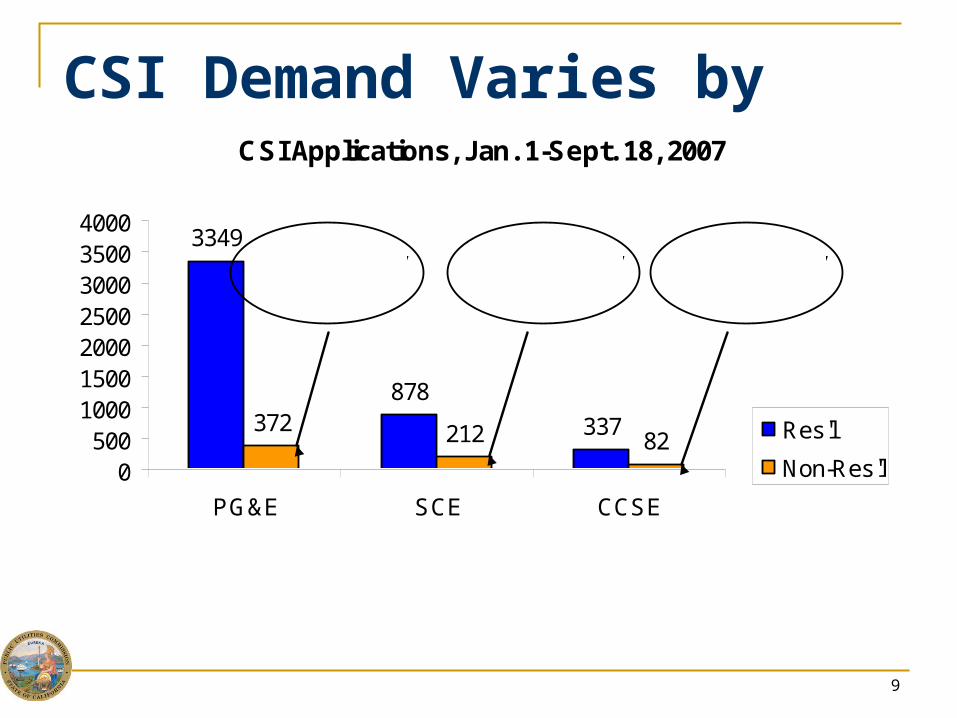
CSI Demand Varies by TerritoryCSI Applications, Jan. 1-Sept. 18, 2007
3349
878
337372 212 820
5001000150020002500300035004000
PG&E SCE CCSE
Res'l
Non-Res'l
% of CSI Budget: 43.7% 46% 10.3%
72 MW total,but 67 MW
Non-res
20 MW total,but 18 MW
Non-res
84 MW total, but 69 MW
Non-res
10
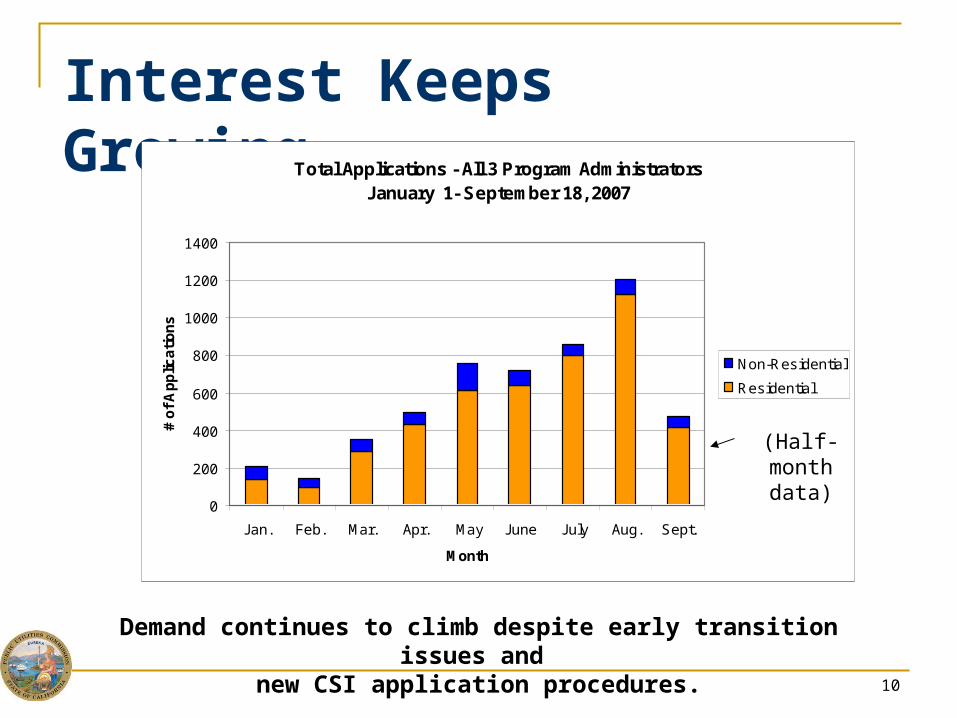
Interest Keeps Growing
Demand continues to climb despite early transition issues and new CSI application procedures.
Total Applications - All 3 Program AdministratorsJanuary 1- September 18, 2007
0
200
400
600
800
1000
1200
1400
Jan. Feb. Mar. Apr. May June July Aug. Sept.
Month
# o
f A
pp
lica
tio
ns
Non-Residential
Residential
(Half-month data)
11
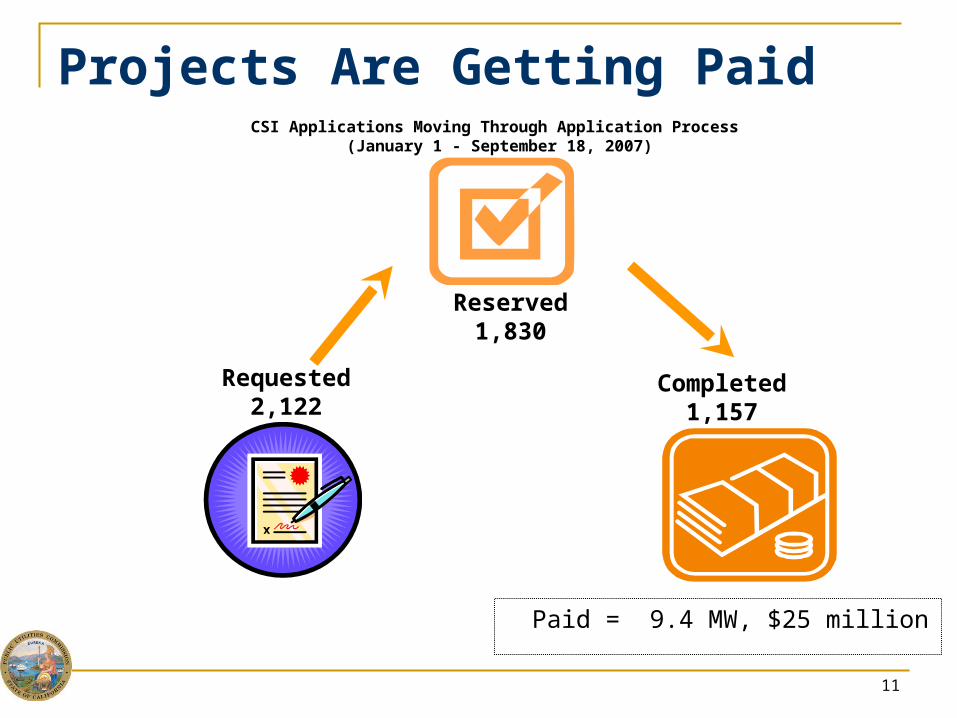
Projects Are Getting Paid
Paid = 9.4 MW, $25 million
Reserved1,830
Requested2,122
Completed1,157
CSI Applications Moving Through Application Process (January 1 - September 18, 2007)
12
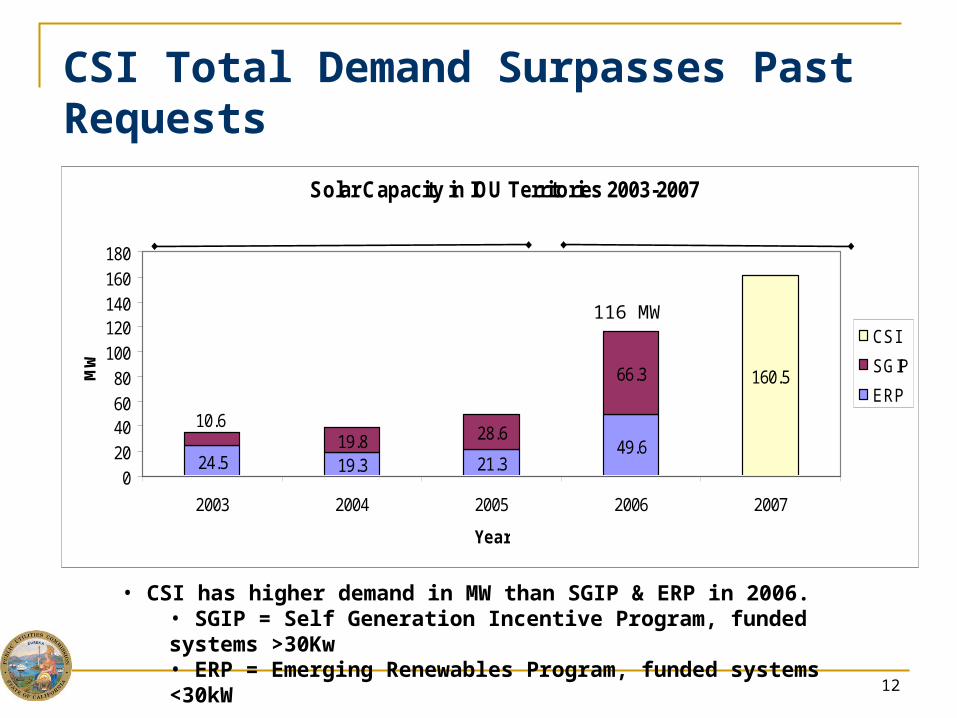
CSI Total Demand Surpasses Past Requests
• CSI has higher demand in MW than SGIP & ERP in 2006. • SGIP = Self Generation Incentive Program, funded systems >30Kw• ERP = Emerging Renewables Program, funded systems <30kW
Solar Capacity in IOU Territories 2003-2007
24.5 19.3 21.349.619.8 28.6
66.3 160.5
10.6
020406080
100120140160180
2003 2004 2005 2006 2007
Year
MW
CSI
SGIP
ERP
2003-2005Installations Completed
2006-2007Installations in Progress or Completed
116 MW
13
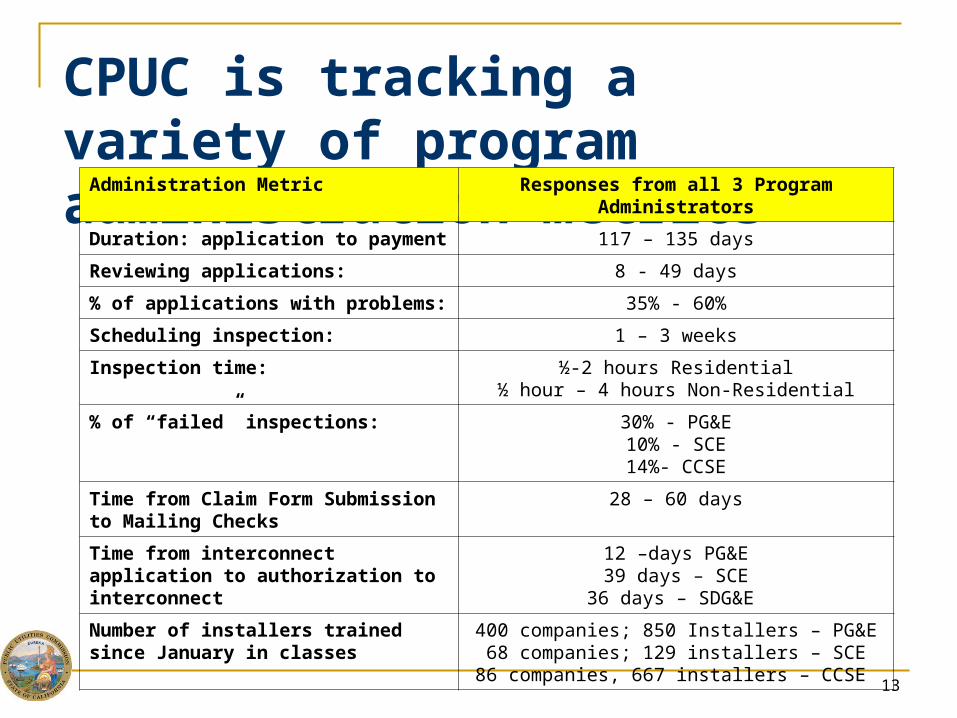
CPUC is tracking a variety of program administration metrics
Administration Metric Responses from all 3 Program Administrators
Duration: application to payment 117 – 135 days
Reviewing applications: 8 - 49 days
% of applications with problems: 35% - 60%
Scheduling inspection: 1 – 3 weeks
Inspection time: ½-2 hours Residential½ hour – 4 hours Non-Residential
% of “failed” inspections: 30% - PG&E10% - SCE14%- CCSE
Time from Claim Form Submission to Mailing Checks
28 – 60 days
Time from interconnect application to authorization to interconnect
12 –days PG&E39 days – SCE
36 days – SDG&E
Number of installers trained since January in classes
400 companies; 850 Installers – PG&E68 companies; 129 installers – SCE
86 companies, 667 installers – CCSE
14
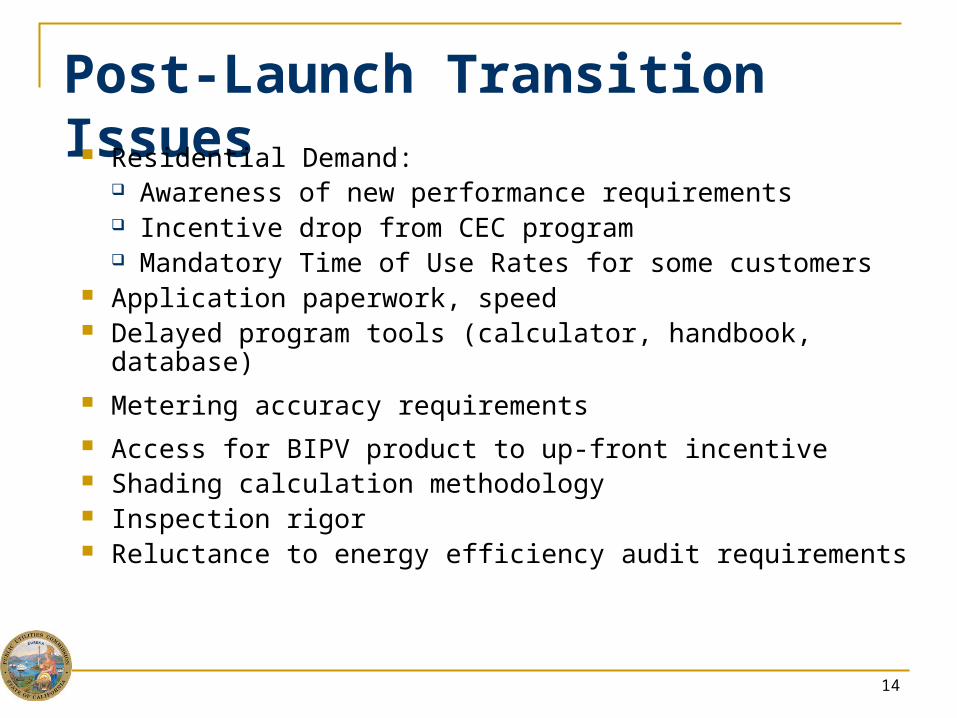
Post-Launch Transition Issues Residential Demand:
Awareness of new performance requirements Incentive drop from CEC program Mandatory Time of Use Rates for some customers
Application paperwork, speed Delayed program tools (calculator, handbook, database)
Metering accuracy requirements Access for BIPV product to up-front incentive Shading calculation methodology Inspection rigor Reluctance to energy efficiency audit requirements
15
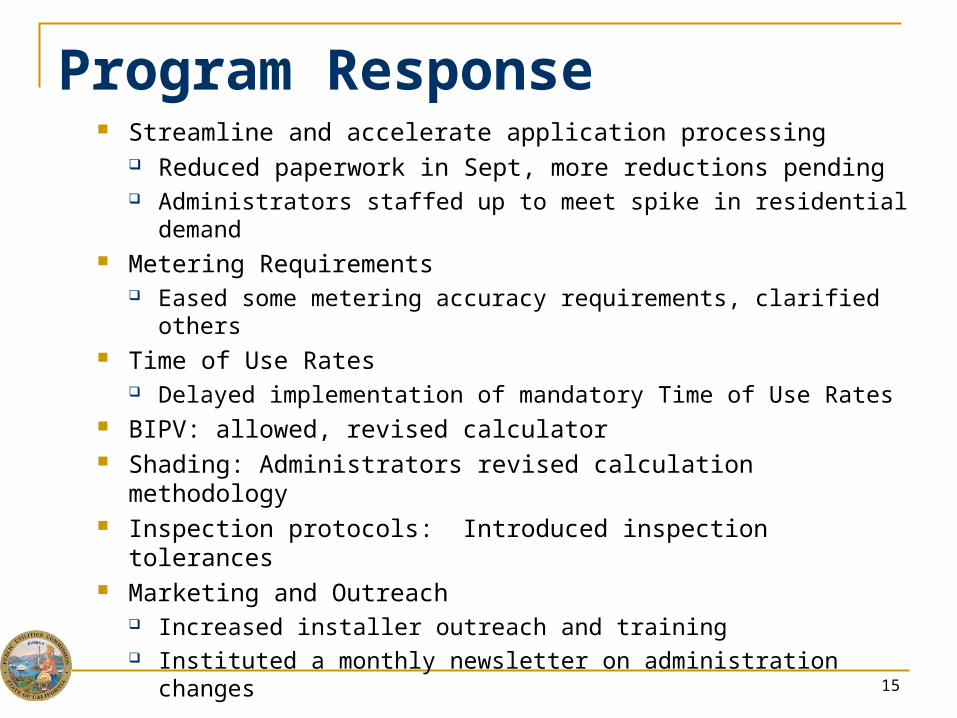
Streamline and accelerate application processing Reduced paperwork in Sept, more reductions pending Administrators staffed up to meet spike in residential demand
Metering Requirements Eased some metering accuracy requirements, clarified others
Time of Use Rates Delayed implementation of mandatory Time of Use Rates
BIPV: allowed, revised calculator Shading: Administrators revised calculation methodology Inspection protocols: Introduced inspection tolerances Marketing and Outreach
Increased installer outreach and training Instituted a monthly newsletter on administration changes
Program Response
16
Upcoming Issues for CSI Program
Streamline and accelerate application process Implement SB1 Eligibility Guidelines Monitor rate cases, mandatory TOU rates for impacts on
solar economics Monitor demand by sectors & “drop-outs” Improve database and reporting tools Evaluate trends in market costs against incentive levels Solar Hot Water Pilot
Underway, runs through 2008 Will inform implementation of AB 1470 (Huffman,
2007)
17
California Solar Initiative Resources The statewide consumer website
www.GoSolarCalifornia.ca.gov The CSI Program Handbook includes eligibility information and
application information: www.GoSolarCalifornia.ca.gov/documents/index.html
The CSI Program Administrators developed a tool to calculate the up-front EPBB incentive, known as the EPBB Calculator:www.csi-epbb.com
The CSI Program Administrators launched an online application tool and reporting database, known as Powerclerk:csi.powerclerk.com
Up-to-date information about the program's current incentive level, or "step" can be found on the online CSI Trigger Tracker:www.csi-trigger.com
Information about the CPUC regulatory proceeding that deals with the CSI program can be found online at:www.cpuc.ca.gov/static/energy/solar/_index.htm
California Solar Initiative: Resources