Embed Size (px)
Citation preview
HAL Id: hal-00669016https://hal.archives-ouvertes.fr/hal-00669016
Submitted on 13 Feb 2012
HAL is a multi-disciplinary open accessarchive for the deposit and dissemination of sci-entific research documents, whether they are pub-lished or not. The documents may come fromteaching and research institutions in France orabroad, or from public or private research centers.
L’archive ouverte pluridisciplinaire HAL, estdestinée au dépôt et à la diffusion de documentsscientifiques de niveau recherche, publiés ou non,émanant des établissements d’enseignement et derecherche français ou étrangers, des laboratoirespublics ou privés.
CALPHAD formalism for Portland clinker:thermodynamic models and databases
Marie-Noëlle De Noirfontaine, Sandrine Tusseau-Nenez, CarolineGirod-Labianca, V. Pontikis
To cite this version:Marie-Noëlle De Noirfontaine, Sandrine Tusseau-Nenez, Caroline Girod-Labianca, V. Pontikis. CAL-PHAD formalism for Portland clinker: thermodynamic models and databases. Journal of MaterialsScience, Springer Verlag, 2012, 47 (3), pp.1471-1479. <10.1007/s10853-011-5932-7>. <hal-00669016>
1
CALPHAD formalism for Portland clinker: thermodynamic models and databases
M.-N. de Noirfontaine1,2,∗, S. Tusseau-Nenez2,3, C. Girod-Labianca2,4, V.
Pontikis2
1 LSI, CNRS UMR 7642 - Ecole Polytechnique, 91128 Palaiseau, France 2 CECM, CNRS UPR 2801, 94407 Vitry-sur-Seine, France 3 ICMPE, CNRS UMR 7182 – Université Paris XII, 94320 Thiais, France 4 CTG-Italcementi Group, les Technodes, 78931 Guerville, France
Abstract (150-250 words): 239 words
The so-called CALPHAD method is widely used in metallurgy to predict phase diagrams
of multi-component systems. The application of the method to oxide systems is much more recent,
because of the difficulty of modelling the ionic liquid phase. Since the 1980s, several models have
been proposed by various communities. Thermodynamic databases for oxides are available and
still under development.
The purpose of this article is to discuss the distinct approaches of the method for the
calculation of multi-component systems for Portland cement elaboration. The article gives a state
of the art of the most recent experimental data and the various calculations for the CaO-Al2O3-
SiO2 phase diagram. A literature review of the three binary sub-systems leads to main conclusions:
(i) discrepancies are found in the literature for the selected experimental data, (ii) the phase
diagram data in the reference books are not complete and up to date and (iii) the two-sublattices
model and the modified quasichemical model can be equally used for the modelling of the
aluminates liquid. The predictive feature of the CALPHAD method is illustrated using the CaO-
Al2O3-SiO2 system with the two-sublattices model: extrapolated (predicted) and fully-assessed
phase diagrams are compared in the clinkering zone of interest. The recent application of the
predictive method for the calculations of high-order systems (taking into account Fe2O3, SO3,
CaF2, P2O5) shows that the databases developed with the two-sublattices model and the modified
quasichemical model are no longer equivalent.
∗ Corresponding author. Laboratoire des Solides Irradiés, CNRS UMR 7642, Ecole Polytechnique, 91128 Palaiseau Cedex, France Tel.: +33 1 69 33 44 83; fax: +33 1 69 33 45 54 e-mail address: [email protected]
2
Keywords: Phase diagrams; thermodynamic calculations; CALPHAD method;
Portland cement; clinker
1. Introduction
Portland cement is obtained by grinding an artificial rock, called the
clinker, with a small amount of gypsum (~5%) added in order to delay the setting
time of cement. The clinker is produced by heating a mixture of limestone (~80
wt%) and clay (~20 wt%) up to the so-called clinkering temperature (Tc) in the
range of 1400-1500 °C. The clinker contains four compounds at least. The two
major phases are solid solutions of two calcium silicates, Ca3SiO5 and Ca2SiO4,
referred to as alite and belite, respectively. The two other phases are solid
solutions of two calcium aluminates, Ca3Al2O6 and Ca4Al2Fe2O10. Hereafter, we
use the compact mineralogical notation: C=CaO, S=SiO2, A=Al2O3, F=Fe2O3. The
four compounds are designated as C3S, C2S, C3A and C4AF.
Understanding the quaternary phase diagram CaO-SiO2-Al2O3-Fe2O3
(hereafter referred to as ‘CASF’ system) is the basis of the chemistry in the kiln.
Table 1 summarises the four main zones and successive reactions between 400 °C
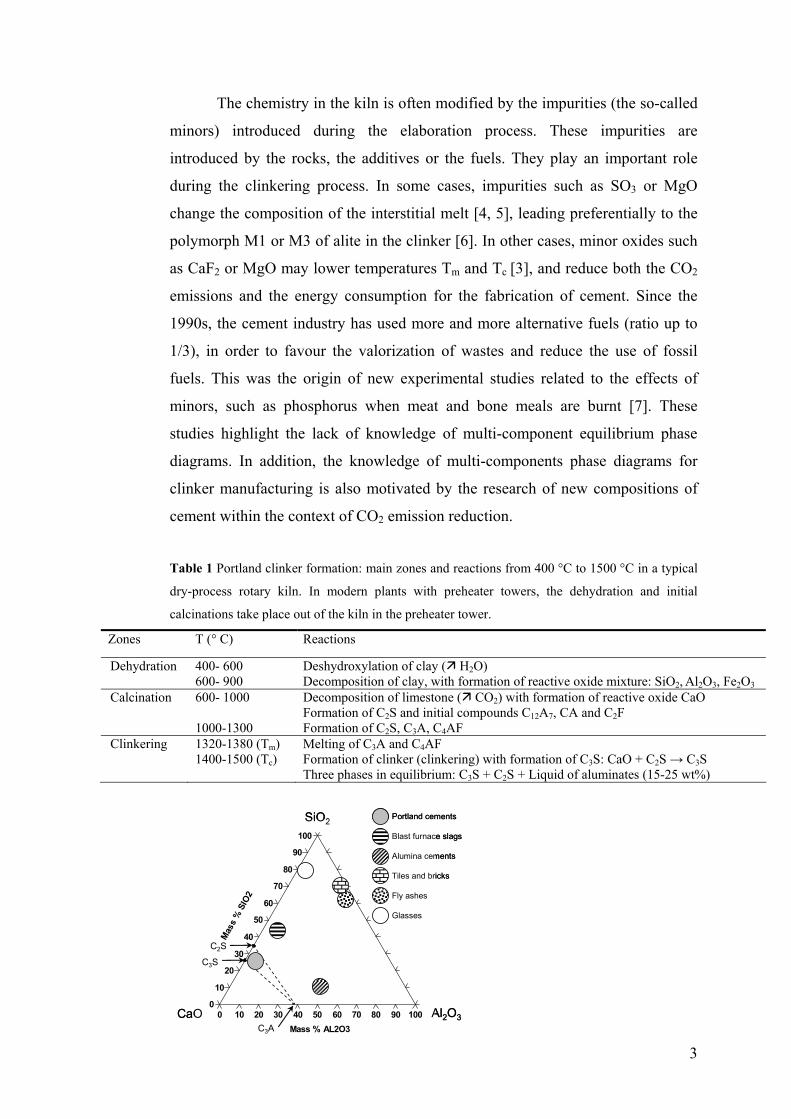
and Tc. The ternary phase diagram CaO-Al2O3-SiO2 (referred to as ‘CAS’ phase
diagram) is often used for a preliminary understanding of Portland cements.
Rankin was the first to determine such a diagram [1]. It is particularly relevant for
the fabrication of white cements that are characterised by a very small Fe2O3
content. Figure 1 shows the composition area of Portland cements in the ‘CAS’
system. For white cements, melting temperatures (Tm) and clinkering
temperatures (Tc) are about 1380 °C and 1500 °C, respectively. At Tc=1500 °C,
the three phases in equilibrium are C3S, α-C2S and the aluminates liquid of
composition Lc. The respective Lc compositions for 1500 and 1400 °C are: CaO
(~59 wt%), Al2O3 (~32 wt%), SiO2 (~9 wt%) and CaO (~55 wt%), Al2O3 (~37
wt%), SiO2 (~8 wt%). In the quaternary ‘CASF’ system, the temperature of the
liquidus is reduced down to Tm=1338 °C. The composition and the proportion of
liquid depend on the weight ratio A/F. The proportion of liquid rises up to 15-25
wt% [2]. The Fe2O3 proportion in the liquid is in the 5-14 wt% range, for A/F
values in the 6.06-0.64 wt% range [3].
The chemistry in the kiln is often modified by the impurities (the so-called
minors) introduced during the elaboration process. These impurities are
introduced by the rocks, the additives or the fuels. They play an important role
during the clinkering process. In some cases, impurities such as SO3 or MgO
change the composition of the interstitial melt [4, 5], leading preferentially to the
polymorph M1 or M3 of alite in the clinker [6]. In other cases, minor oxides such
as CaF2 or MgO may lower temperatures Tm and Tc [3], and reduce both the CO2
emissions and the energy consumption for the fabrication of cement. Since the
1990s, the cement industry has used more and more alternative fuels (ratio up to
1/3), in order to favour the valorization of wastes and reduce the use of fossil
fuels. This was the origin of new experimental studies related to the effects of
minors, such as phosphorus when meat and bone meals are burnt [7]. These
studies highlight the lack of knowledge of multi-component equilibrium phase
diagrams. In addition, the knowledge of multi-components phase diagrams for
clinker manufacturing is also motivated by the research of new compositions of
cement within the context of CO2 emission reduction.
Table 1 Portland clinker formation: main zones and reactions from 400 °C to 1500 °C in a typical
dry-process rotary kiln. In modern plants with preheater towers, the dehydration and initial
calcinations take place out of the kiln in the preheater tower.
Zones T (° C) Reactions
Dehydration 400- 600 Deshydroxylation of clay ( H2O) 600- 900 Decomposition of clay, with formation of reactive oxide mixture: SiO2, Al2O3, Fe2O3Calcination 600- 1000 Decomposition of limestone ( CO2) with formation of reactive oxide CaO
Formation of C2S and initial compounds C12A7, CA and C2F 1000-1300 Formation of C2S, C3A, C4AF Clinkering 1320-1380 (Tm) Melting of C3A and C4AF 1400-1500 (Tc) Formation of clinker (clinkering) with formation of C3S: CaO + C2S → C3S
Three phases in equilibrium: C3S + C2S + Liquid of aluminates (15-25 wt%)
0
10
20
30
40
50
60
70
80
90
100
Mas
s %
SIO
2
0 10 20 30 40 50 60 70 80 90 100 Mass % AL2O3
C3S
C2S
C3ACaO Al2O3
SiO2 Portland cements
Blast furnace slags
Alumina cements
Tiles and bricks
Fly ashes
Glasses
0
10
20
30
40
50
60
70
80
90
100
Mas
s %
SIO
2
0 10 20 30 40 50 60 70 80 90 100 Mass % AL2O3
C3S
C2S
C3ACaO Al2O3
SiO2 Portland cements
Blast furnace slags
Alumina cements
Tiles and bricks
Fly ashes
Glasses
3
4
Fig. 1. Zone of Portland cements in the ‘CAS’ system (white cements). Composition of the three
arrowed phases: C3S (wt% SiO2 = 26.16), C2S (wt% SiO2 = 34.88) and C3A (wt% Al2O3 = 37.74).
The most usual approach to determine equilibrium phase diagrams is the
experimental route, involving syntheses of samples of various compositions, heat
treatments and structural characterisations. Such experimental studies are
expensive and time consuming, especially when the number of components of the
systems increases. Since the 1970s, an alternative route is to use the
computational CALPHAD method (CALculation of PHAse Diagrams) for the
modelling of phase diagrams [8, 9].
The CALPHAD method is a semi-empirical method used for the
modelling of thermodynamic properties and for the calculation of equilibrium
phase diagrams. As far as the molar Gibbs free energies Gm(x,T,P) of all the
phases of a given system are known, it becomes possible to calculate the phase
diagram by minimising the total Gibbs energy. The molar Gibbs energies of the
different phases are given by theoretical thermodynamic models. Then, the
parameters of the models are determined by refining a critical set of experimental
data using a least-square method and subsequently used for calculating phase
diagrams. The determination of the coefficients is often called assessment or
optimisation of a system. Since the 1990s, a major effort of the thermodynamic
community was to gather data for pure elements and binary mixtures in databases
[10]. Even if the determination of the coefficients of binary systems is still time-
consuming, the strength of the CALPHAD method lies in its ability to predict
ternary or high order systems from the extrapolation of the thermodynamic excess
quantities of the sub-systems. With this method, the calculation of high order
systems can be reduced down to few minutes. The predominant method, as
recommended by Hillert [11], uses an equation developed by Muggianu [12].
Other geometric methods are suitable such as Kohler and Toop’s [11, 12].
At the present time, extensive databases exist for metallurgy. The
CALPHAD technique is already a routine method for the development of new
alloys in metallurgy. Its application to oxide systems is much more recent, mainly
because of the difficulty to model the liquid phase. Indeed, ionic liquids exhibit a
strong short-range order (SRO) around given compositions. For example, the
5
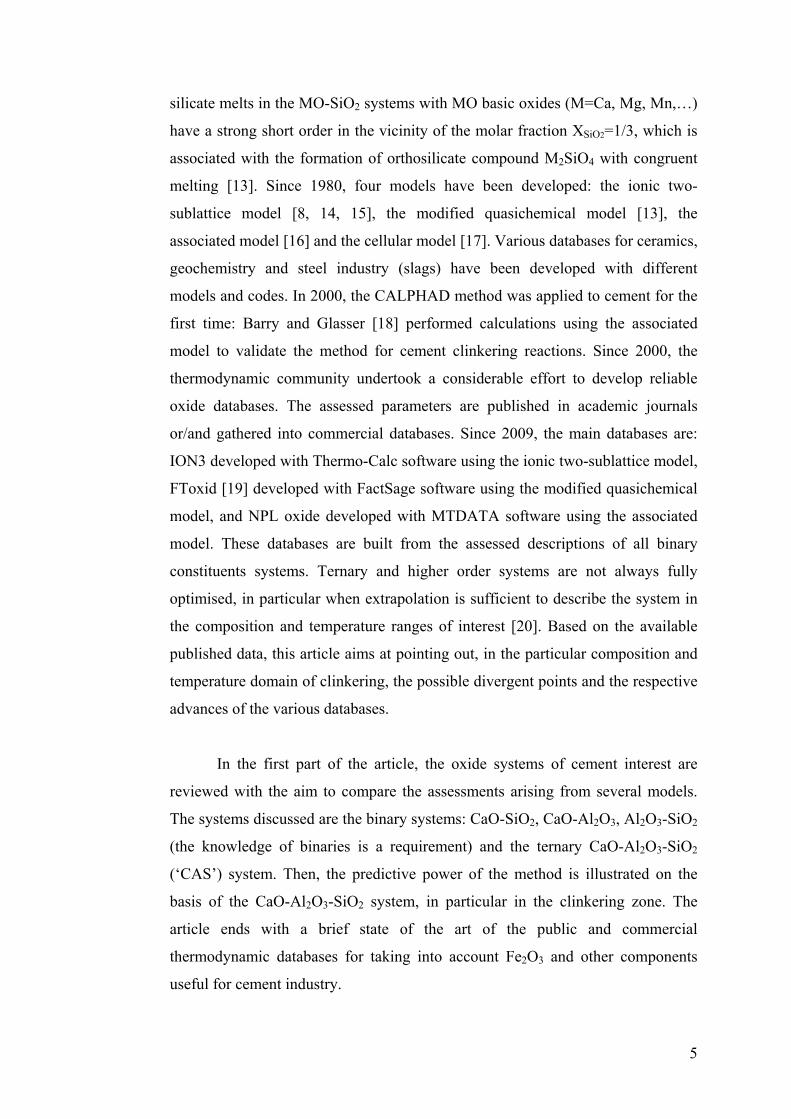
silicate melts in the MO-SiO2 systems with MO basic oxides (M=Ca, Mg, Mn,…)
have a strong short order in the vicinity of the molar fraction XSiO2=1/3, which is
associated with the formation of orthosilicate compound M2SiO4 with congruent
melting [13]. Since 1980, four models have been developed: the ionic two-
sublattice model [8, 14, 15], the modified quasichemical model [13], the
associated model [16] and the cellular model [17]. Various databases for ceramics,
geochemistry and steel industry (slags) have been developed with different
models and codes. In 2000, the CALPHAD method was applied to cement for the
first time: Barry and Glasser [18] performed calculations using the associated
model to validate the method for cement clinkering reactions. Since 2000, the
thermodynamic community undertook a considerable effort to develop reliable
oxide databases. The assessed parameters are published in academic journals
or/and gathered into commercial databases. Since 2009, the main databases are:
ION3 developed with Thermo-Calc software using the ionic two-sublattice model,
FToxid [19] developed with FactSage software using the modified quasichemical
model, and NPL oxide developed with MTDATA software using the associated
model. These databases are built from the assessed descriptions of all binary
constituents systems. Ternary and higher order systems are not always fully
optimised, in particular when extrapolation is sufficient to describe the system in
the composition and temperature ranges of interest [20]. Based on the available
published data, this article aims at pointing out, in the particular composition and
temperature domain of clinkering, the possible divergent points and the respective
advances of the various databases.
In the first part of the article, the oxide systems of cement interest are
reviewed with the aim to compare the assessments arising from several models.
The systems discussed are the binary systems: CaO-SiO2, CaO-Al2O3, Al2O3-SiO2
(the knowledge of binaries is a requirement) and the ternary CaO-Al2O3-SiO2
(‘CAS’) system. Then, the predictive power of the method is illustrated on the
basis of the CaO-Al2O3-SiO2 system, in particular in the clinkering zone. The
article ends with a brief state of the art of the public and commercial
thermodynamic databases for taking into account Fe2O3 and other components
useful for cement industry.
6
2. Calculation of the three binary sub-systems of the CaO-Al2O3-SiO2 system: state-of-art
2.1. A review of the evaluations for the ‘CAS’ system
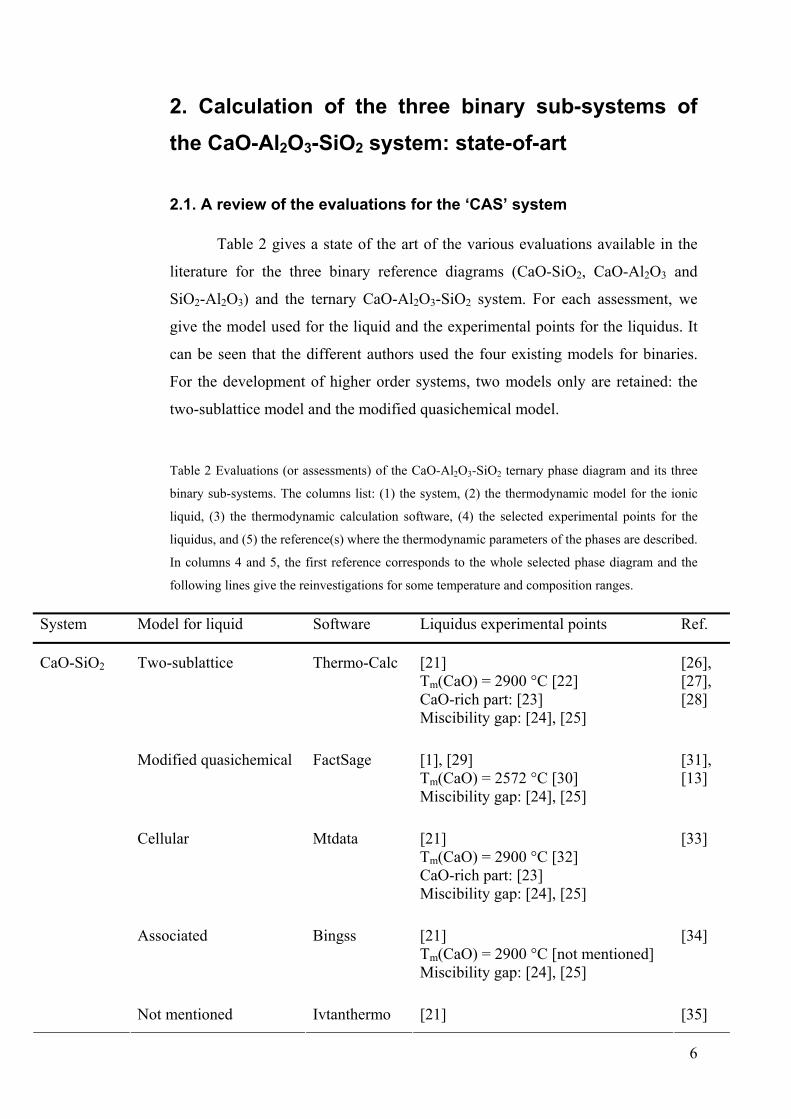
Table 2 gives a state of the art of the various evaluations available in the
literature for the three binary reference diagrams (CaO-SiO2, CaO-Al2O3 and
SiO2-Al2O3) and the ternary CaO-Al2O3-SiO2 system. For each assessment, we
give the model used for the liquid and the experimental points for the liquidus. It
can be seen that the different authors used the four existing models for binaries.
For the development of higher order systems, two models only are retained: the
two-sublattice model and the modified quasichemical model.
Table 2 Evaluations (or assessments) of the CaO-Al2O3-SiO2 ternary phase diagram and its three
binary sub-systems. The columns list: (1) the system, (2) the thermodynamic model for the ionic
liquid, (3) the thermodynamic calculation software, (4) the selected experimental points for the
liquidus, and (5) the reference(s) where the thermodynamic parameters of the phases are described.
In columns 4 and 5, the first reference corresponds to the whole selected phase diagram and the
following lines give the reinvestigations for some temperature and composition ranges.
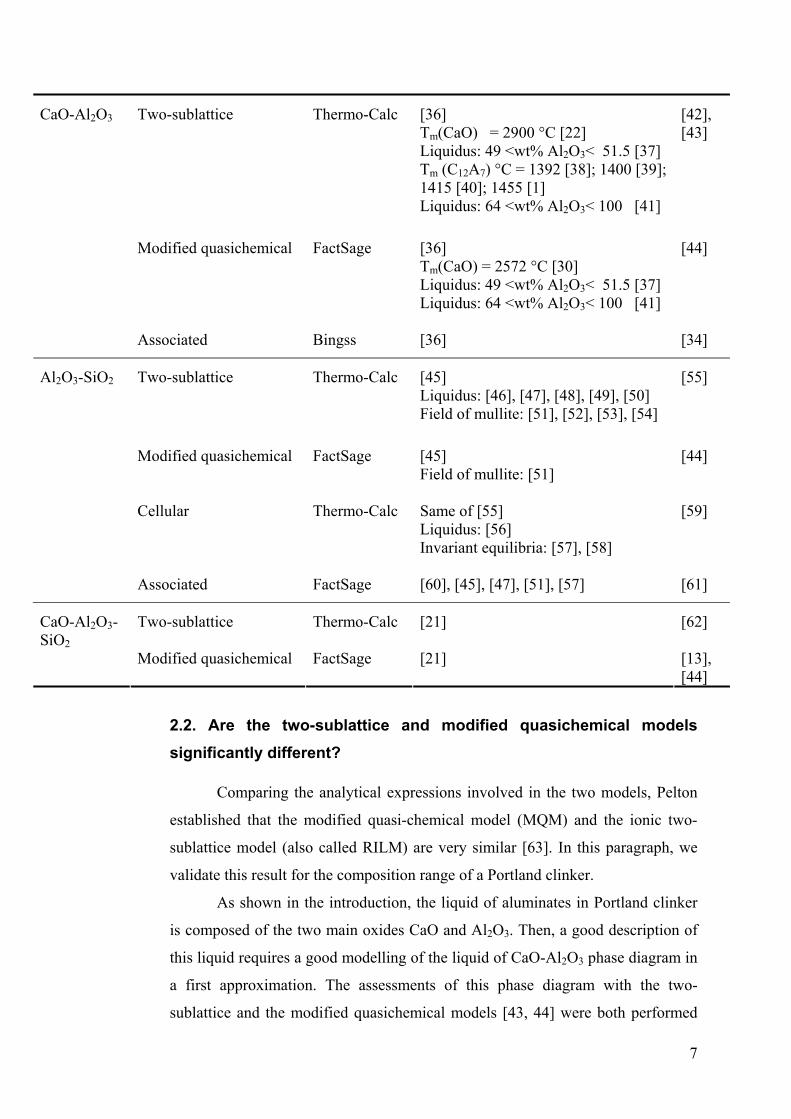
System Model for liquid Software Liquidus experimental points Ref.
Two-sublattice
Thermo-Calc
[21] Tm(CaO) = 2900 °C [22] CaO-rich part: [23] Miscibility gap: [24], [25]
[26], [27], [28]
Modified quasichemical FactSage [1], [29] Tm(CaO) = 2572 °C [30] Miscibility gap: [24], [25]
[31], [13]
Cellular Mtdata [21] Tm(CaO) = 2900 °C [32] CaO-rich part: [23] Miscibility gap: [24], [25]
[33]
Associated Bingss [21] Tm(CaO) = 2900 °C [not mentioned] Miscibility gap: [24], [25]
[34]
CaO-SiO2
Not mentioned
Ivtanthermo [21] [35]
7
Two-sublattice
Thermo-Calc
[36] Tm(CaO) = 2900 °C [22] Liquidus: 49 <wt% Al2O3< 51.5 [37] Tm (C12A7) °C = 1392 [38]; 1400 [39]; 1415 [40]; 1455 [1] Liquidus: 64 <wt% Al2O3< 100 [41]
[42], [43]
Modified quasichemical FactSage [36] Tm(CaO) = 2572 °C [30] Liquidus: 49 <wt% Al2O3< 51.5 [37] Liquidus: 64 <wt% Al2O3< 100 [41]
[44]
CaO-Al2O3
Associated
Bingss [36] [34]
Two-sublattice
Thermo-Calc
[45] Liquidus: [46], [47], [48], [49], [50] Field of mullite: [51], [52], [53], [54]
[55]
Modified quasichemical FactSage [45] Field of mullite: [51]
[44]
Al2O3-SiO2
Cellular
Thermo-Calc Same of [55] Liquidus: [56] Invariant equilibria: [57], [58]
[59]
Associated FactSage [60], [45], [47], [51], [57] [61]
Two-sublattice
Thermo-Calc
[21]
[62]
CaO-Al2O3-SiO2
Modified quasichemical FactSage [21] [13], [44]
2.2. Are the two-sublattice and modified quasichemical models significantly different?
Comparing the analytical expressions involved in the two models, Pelton
established that the modified quasi-chemical model (MQM) and the ionic two-
sublattice model (also called RILM) are very similar [63]. In this paragraph, we
validate this result for the composition range of a Portland clinker.
As shown in the introduction, the liquid of aluminates in Portland clinker
is composed of the two main oxides CaO and Al2O3. Then, a good description of
this liquid requires a good modelling of the liquid of CaO-Al2O3 phase diagram in
a first approximation. The assessments of this phase diagram with the two-
sublattice and the modified quasichemical models [43, 44] were both performed
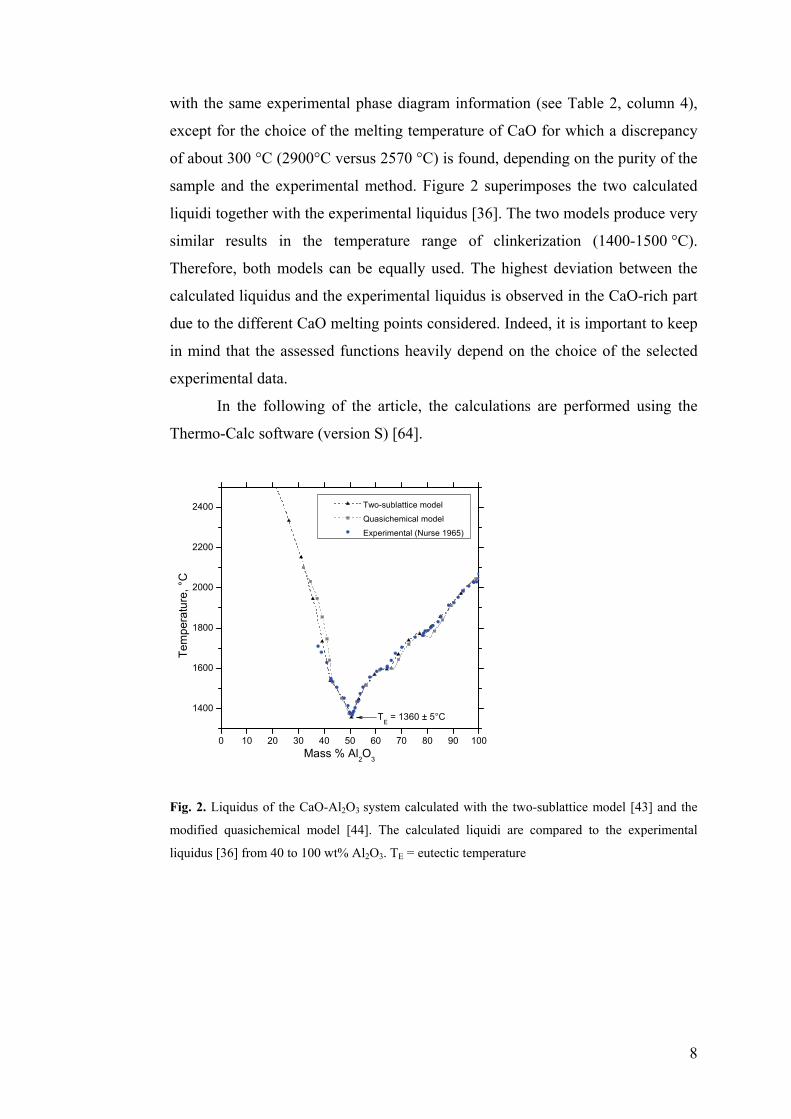
with the same experimental phase diagram information (see Table 2, column 4),
except for the choice of the melting temperature of CaO for which a discrepancy
of about 300 °C (2900°C versus 2570 °C) is found, depending on the purity of the
sample and the experimental method. Figure 2 superimposes the two calculated
liquidi together with the experimental liquidus [36]. The two models produce very
similar results in the temperature range of clinkerization (1400-1500 °C).
Therefore, both models can be equally used. The highest deviation between the
calculated liquidus and the experimental liquidus is observed in the CaO-rich part
due to the different CaO melting points considered. Indeed, it is important to keep
in mind that the assessed functions heavily depend on the choice of the selected
experimental data.
In the following of the article, the calculations are performed using the
Thermo-Calc software (version S) [64].
8
00 10 20 30 40 50 60 70 80 90 10
1400
1600
1800
2000
2200
2400
Tem
pera
ture
, °C
Mass % Al2O3
Two-sublattice model
Quasichemical model
Experimental (Nurse 1965)
TE = 1360 ± 5°C
Fig. 2. Liquidus of the CaO-Al2O3 system calculated with the two-sublattice model [43] and the
modified quasichemical model [44]. The calculated liquidi are compared to the experimental
liquidus [36] from 40 to 100 wt% Al2O3. TE = eutectic temperature
9
2.3. Critical analysis of the ‘CAS’ binary sub-systems
Based on the a ssessed Gibbs energies available in literature (Table 2,
column 5), Figs. 3, 4 and 5 show the calculated phase diagrams1 of CaO-SiO2,
CaO-Al2O3, SiO2-Al2O3 systems, compared with the experimental data for the
liquidi (Table 2, column 4) and the solid phase equilibria. Data from cement
reference books are also superimposed. In the following discussion, we point out
some experimental disagreements in the literature.
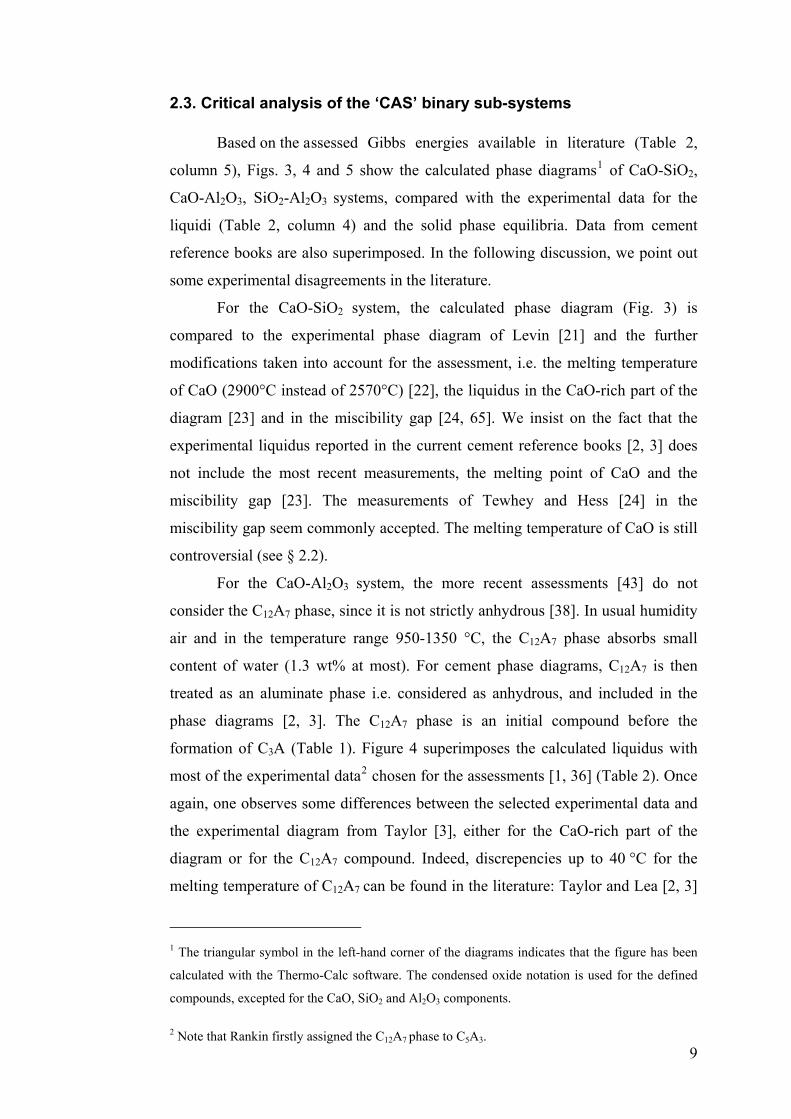
For the CaO-SiO2 system, the calculated phase diagram (Fig. 3) is
compared to the experimental phase diagram of Levin [21] and the further
modifications taken into account for the assessment, i.e. the melting temperature
of CaO (2900°C instead of 2570°C) [22], the liquidus in the CaO-rich part of the
diagram [23] and in the miscibility gap [24, 65]. We insist on the fact that the
experimental liquidus reported in the current cement reference books [2, 3] does
not include the most recent measurements, the melting point of CaO and the
miscibility gap [23]. The measurements of Tewhey and Hess [24] in the
miscibility gap seem commonly accepted. The melting temperature of CaO is still
controversial (see § 2.2).
For the CaO-Al2O3 system, the more recent assessments [43] do not
consider the C12A7 phase, since it is not strictly anhydrous [38]. In usual humidity
air and in the temperature range 950-1350 °C, the C12A7 phase absorbs small
content of water (1.3 wt% at most). For cement phase diagrams, C12A7 is then
treated as an aluminate phase i.e. considered as anhydrous, and included in the
phase diagrams [2, 3]. The C12A7 phase is an initial compound before the
formation of C3A (Table 1). Figure 4 superimposes the calculated liquidus with
most of the experimental data2 chosen for the assessments [1, 36] (Table 2). Once
again, one observes some differences between the selected experimental data and
the experimental diagram from Taylor [3], either for the CaO-rich part of the
diagram or for the C12A7 compound. Indeed, discrepencies up to 40 °C for the
melting temperature of C12A7 can be found in the literature: Taylor and Lea [2, 3]
1 The triangular symbol in the left-hand corner of the diagrams indicates that the figure has been
calculated with the Thermo-Calc software. The condensed oxide notation is used for the defined
compounds, excepted for the CaO, SiO2 and Al2O3 components.
2 Note that Rankin firstly assigned the C12A7 phase to C5A3.
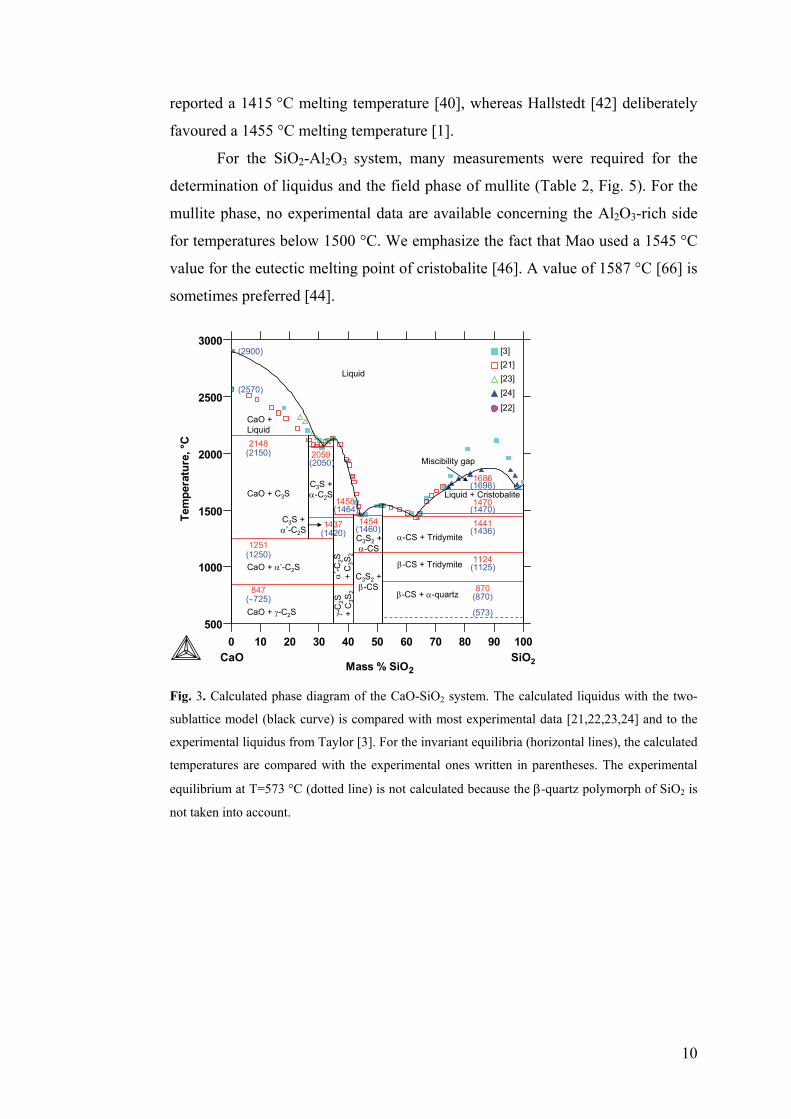
reported a 1415 °C melting temperature [40], whereas Hallstedt [42] deliberately
favoured a 1455 °C melting temperature [1].
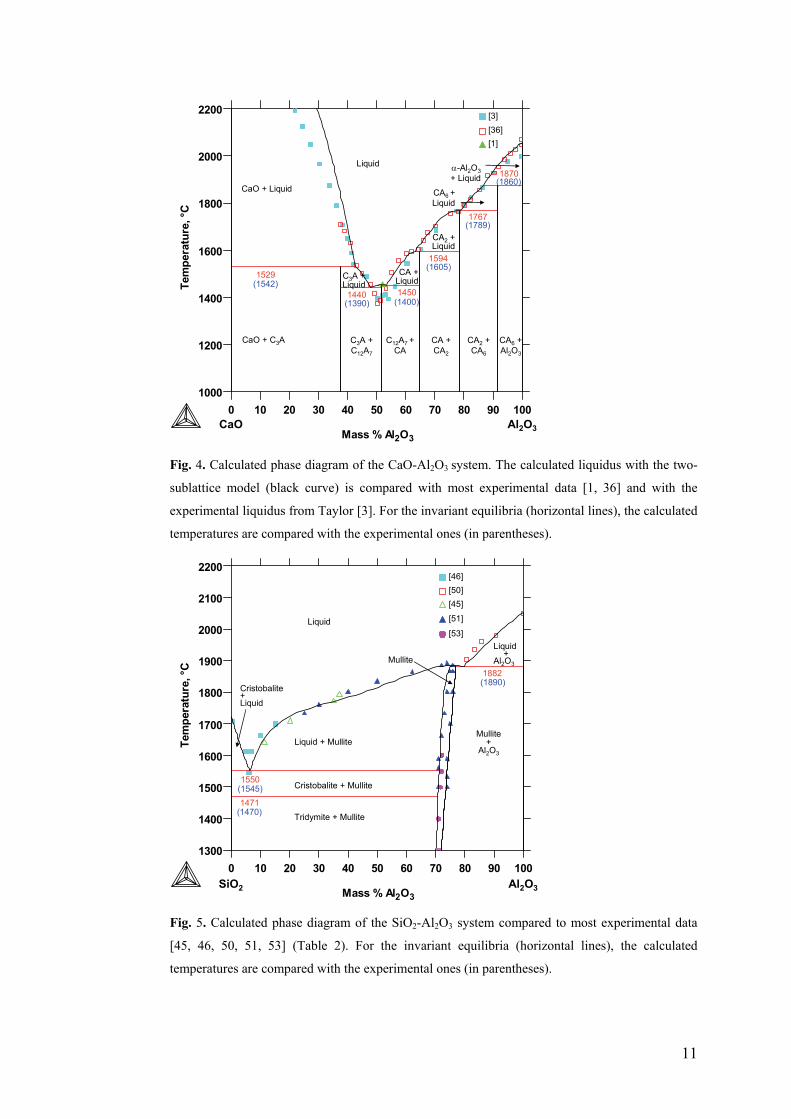
For the SiO2-Al2O3 system, many measurements were required for the
determination of liquidus and the field phase of mullite (Table 2, Fig. 5). For the
mullite phase, no experimental data are available concerning the Al2O3-rich side
for temperatures below 1500 °C. We emphasize the fact that Mao used a 1545 °C
value for the eutectic melting point of cristobalite [46]. A value of 1587 °C [66] is
sometimes preferred [ ]. 44
500
1000
1500
2000
2500
3000
Tem
pera
ture
, °C
0 10 20 30 40 50 60 70 80 90 100
Mass % SiO2
Taylor, 1997
10
Levin, 1964 Levin, 1975 Tewhey, 1979 Yamada, 1986
847
1124
1454 1441
870
1470
1686
20592148
1251
1437
1458
(2150)
(1460)
(1125)
(1464)
(1420)
(∼725)
(1250)
(2050)
(1470)
(1436)
(870)
(1698)
(2570)
(573)
Liquid + Cristobalite
Liquid
CaO + C3S
CaO + α’-C2S
CaO + γ-C2S γ-C
2S+
C3S
2
α’-C
2S+
C3S
2
C3S +α-C2S
C3S +α’-C2S
C3S2 +α-CS
C3S2 +β-CS
α-CS + Tridymite
β-CS + Tridymite
β-CS + α-quartz
CaO + Liquid
(2900)
CaO SiO2
Miscibility gap
[3]1]
[23][24]
[22]
[2
500
1000
1500
2000
2500
3000
Tem
pera
ture
, °C
0 10 20 30 40 50 60 70 80 90 100
Mass % SiO2
Taylor, 1997 Levin, 1964 Levin, 1975 Tewhey, 1979 Yamada, 1986
847
1124
1454 1441
870
1470
1686
20592148
1251
1437
1458
(2150)
(1460)
(1125)
(1464)
(1420)
(∼725)
(1250)
(2050)
(1470)
(1436)
(870)
(1698)
(2570)
(573)
Liquid + Cristobalite
Liquid
CaO + C3S
CaO + α’-C2S
CaO + γ-C2S γ-C
2S+
C3S
2
α’-C
2S+
C3S
2
C3S +α-C2S
C3S +α’-C2S
C3S2 +α-CS
C3S2 +β-CS
α-CS + Tridymite
β-CS + Tridymite
β-CS + α-quartz
CaO + Liquid
(2900)
CaO SiO2
Miscibility gap
[3]1]
[23][24]
[22]
[2
Fig. 3. Calculated phase diagram of the CaO-SiO2 system. The calculated liquidus with the two-
sublattice model (black curve) is compared with most experimental data [21,22,23,24] and to the
experimental liquidus from Taylor [3]. For the invariant equilibria (horizontal lines), the calculated
temperatures are compared with the experimental ones written in parentheses. The experimental
equilibrium at T=573 °C (dotted line) is not calculated because the β-quartz polymorph of SiO2 is
not taken into account.
11
1000
1200
1400
1600
1800
2000
2200
Tem
pera
ture
, °C
0 10 20 30 40 50 60 70 80 90 100
Mass % Al2O3
Taylor, 1997 Nurse, 1965 Rankin, 1915
1529
1450
1594
1767
1870(1860)
(1789)
(1605)
(1390) (1400)
(1542)1440
CA2 +Liquid
CA2 +CA6
CA +CA2
CA + Liquid
C3A + C12A7
C3A +Liquid
CaO + C3A
Liquid
CaO + Liquid
C12A7 +CA
CA6 +Al2O3
CA6 +Liquid
α-Al2O3+ Liquid
CaO Al2O3
[3]6]
[1][3
1000
1200
1400
1600
1800
2000
2200
Tem
pera
ture
, °C
0 10 20 30 40 50 60 70 80 90 100
Mass % Al2O3
Taylor, 1997 Nurse, 1965 Rankin, 1915
1529
1450
1594
1767
1870(1860)
(1789)
(1605)
(1390) (1400)
(1542)1440
CA2 +Liquid
CA2 +CA6
CA +CA2
CA + Liquid
C3A + C12A7
C3A +Liquid
CaO + C3A
Liquid
CaO + Liquid
C12A7 +CA
CA6 +Al2O3
CA6 +Liquid
α-Al2O3+ Liquid
CaO Al2O3
1000
1200
1400
1600
1800
2000
2200
Tem
pera
ture
, °C
0 10 20 30 40 50 60 70 80 90 100
Mass % Al2O3
Taylor, 1997 Nurse, 1965 Rankin, 1915
1529
1450
1594
1767
1870(1860)
(1789)
(1605)
(1390) (1400)
(1542)1440
CA2 +Liquid
CA2 +CA6
CA +CA2
CA + Liquid
C3A + C12A7
C3A +Liquid
CaO + C3A
Liquid
CaO + Liquid
C12A7 +CA
CA6 +Al2O3
CA6 +Liquid
α-Al2O3+ Liquid
CaO Al2O3
[3]6]
[1][3
Fig. 4. Calculated phase diagram of the CaO-Al2O3 system. The calculated liquidus with the two-
sublattice model (black curve) is compared with most experimental data [1, 36] and with the
experimental liquidus from Taylor [3]. For the invariant equilibria (horizontal lines), the calculated
temperatures are compared with the experimental ones (in parentheses).
1300
1400
1500
1600
1700
1800
1900
2000
2100
2200
Tem
pera
ture
, °C
0 10 20 30 40 50 60 70 80 90 100
Mass % Al2O3
Bowen, 1924 Toropov, 1951 Aramaki, 1962 Klug, 1987 Okada, 1987
Liquid+
Al2O3Mullite
Mullite+
Al2O3
Liquid
1882(1890)
1550(1545)1471
(1470)
Cristobalite + Mullite
Cristobalite+Liquid
Liquid + Mullite
Tridymite + Mullite
SiO2 Al2O3
[46]50][45]
[51]
[53]
[
1300
1400
1500
1600
1700
1800
1900
2000
2100
2200
Tem
pera
ture
, °C
0 10 20 30 40 50 60 70 80 90 100
Mass % Al2O3
Bowen, 1924 Toropov, 1951 Aramaki, 1962 Klug, 1987 Okada, 1987
Liquid+
Al2O3Mullite
Mullite+
Al2O3
Liquid
1882(1890)
1550(1545)1471
(1470)
Cristobalite + Mullite
Cristobalite+Liquid
Liquid + Mullite
Tridymite + Mullite
SiO2 Al2O3
1300
1400
1500
1600
1700
1800
1900
2000
2100
2200
Tem
pera
ture
, °C
0 10 20 30 40 50 60 70 80 90 100
Mass % Al2O3
Bowen, 1924 Toropov, 1951 Aramaki, 1962 Klug, 1987 Okada, 1987
Liquid+
Al2O3Mullite
Mullite+
Al2O3
Liquid
1882(1890)
1550(1545)1471
(1470)
Cristobalite + Mullite
Cristobalite+Liquid
Liquid + Mullite
Tridymite + Mullite
SiO2 Al2O3
[46]50][45]
[51]
[53]
[
Fig. 5. Calculated phase diagram of the SiO2-Al2O3 system compared to most experimental data
[45, 46, 50, 51, 53] (Table 2). For the invariant equilibria (horizontal lines), the calculated
temperatures are compared with the experimental ones (in parentheses).
12
3. The CALPHAD method: a predictive tool for the thermodynamics of clinkers?
The main interest of the CALPHAD method is its ability to predict a
ternary system from well-evaluated binary sub-systems. The efficiency of this
method is illustrated here for the prediction of the ‘CAS’ system in the
temperature and composition ranges of the clinkering zone (Table 1). In this
section, we compare the phase diagram calculated by means of the extrapolation
method of Muggianu to the fully optimized phase diagram evaluated by Mao et al.
(Table 2). The results are shown as isothermal sections at T=1400 and 1500 °C.
The calculations are carried out without taking into account the C12A7 phase, to
better compare our results to those of Mao et al. [62].
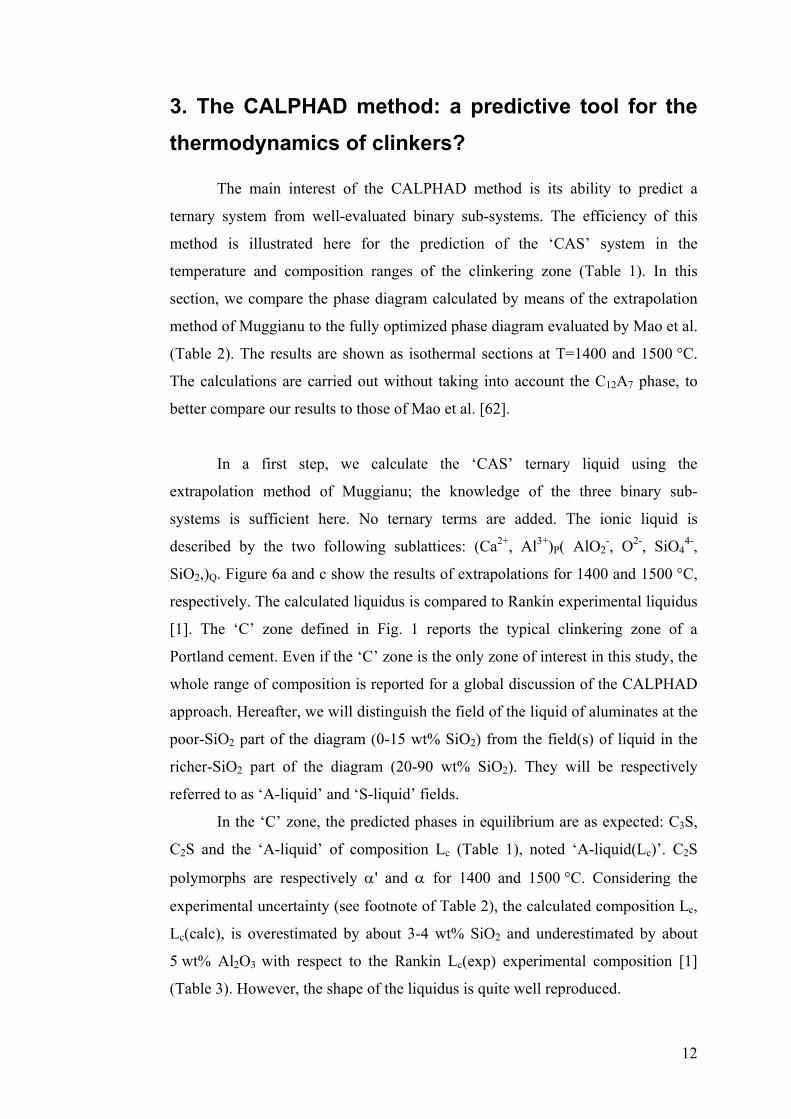
In a first step, we calculate the ‘CAS’ ternary liquid using the
extrapolation method of Muggianu; the knowledge of the three binary sub-
systems is sufficient here. No ternary terms are added. The ionic liquid is
described by the two following sublattices: (Ca2+, Al3+)P( AlO2-, O2-, SiO4
4-,
SiO2,)Q. Figure 6a and c show the results of extrapolations for 1400 and 1500 °C,
respectively. The calculated liquidus is compared to Rankin experimental liquidus
[1]. The ‘C’ zone defined in Fig. 1 reports the typical clinkering zone of a
Portland cement. Even if the ‘C’ zone is the only zone of interest in this study, the
whole range of composition is reported for a global discussion of the CALPHAD
approach. Hereafter, we will distinguish the field of the liquid of aluminates at the
poor-SiO2 part of the diagram (0-15 wt% SiO2) from the field(s) of liquid in the
richer-SiO2 part of the diagram (20-90 wt% SiO2). They will be respectively
referred to as ‘A-liquid’ and ‘S-liquid’ fields.
In the ‘C’ zone, the predicted phases in equilibrium are as expected: C3S,
C2S and the ‘A-liquid’ of composition Lc (Table 1), noted ‘A-liquid(Lc)’. C2S
polymorphs are respectively α' and α for 1400 and 1500 °C. Considering the
experimental uncertainty (see footnote of Table 2), the calculated composition Lc,
Lc(calc), is overestimated by about 3-4 wt% SiO2 and underestimated by about
5 wt% Al2O3 with respect to the Rankin Lc(exp) experimental composition [1]
(Table 3). However, the shape of the liquidus is quite well reproduced.
13
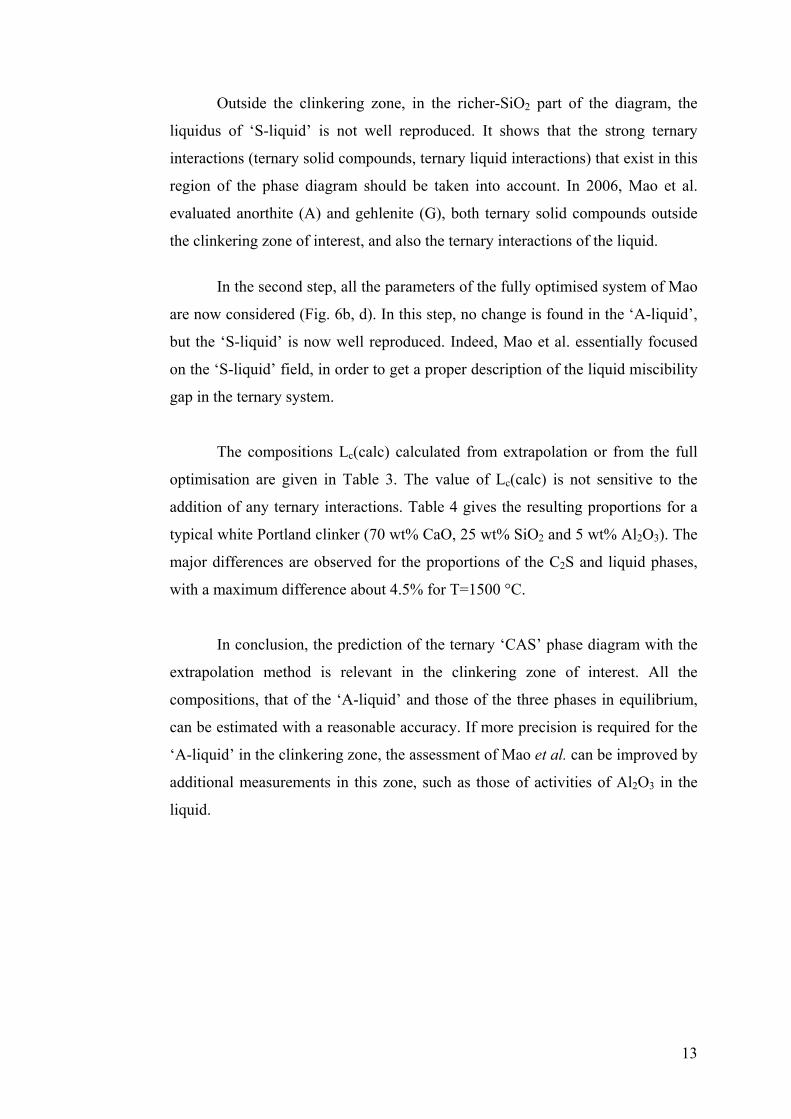
Outside the clinkering zone, in the richer-SiO2 part of the diagram, the
liquidus of ‘S-liquid’ is not well reproduced. It shows that the strong ternary
interactions (ternary solid compounds, ternary liquid interactions) that exist in this
region of the phase diagram should be taken into account. In 2006, Mao et al.
evaluated anorthite (A) and gehlenite (G), both ternary solid compounds outside
the clinkering zone of interest, and also the ternary interactions of the liquid.
In the second step, all the parameters of the fully optimised system of Mao
are now considered (Fig. 6b, d). In this step, no change is found in the ‘A-liquid’,
but the ‘S-liquid’ is now well reproduced. Indeed, Mao et al. essentially focused
on the ‘S-liquid’ field, in order to get a proper description of the liquid miscibility
gap in the ternary system.
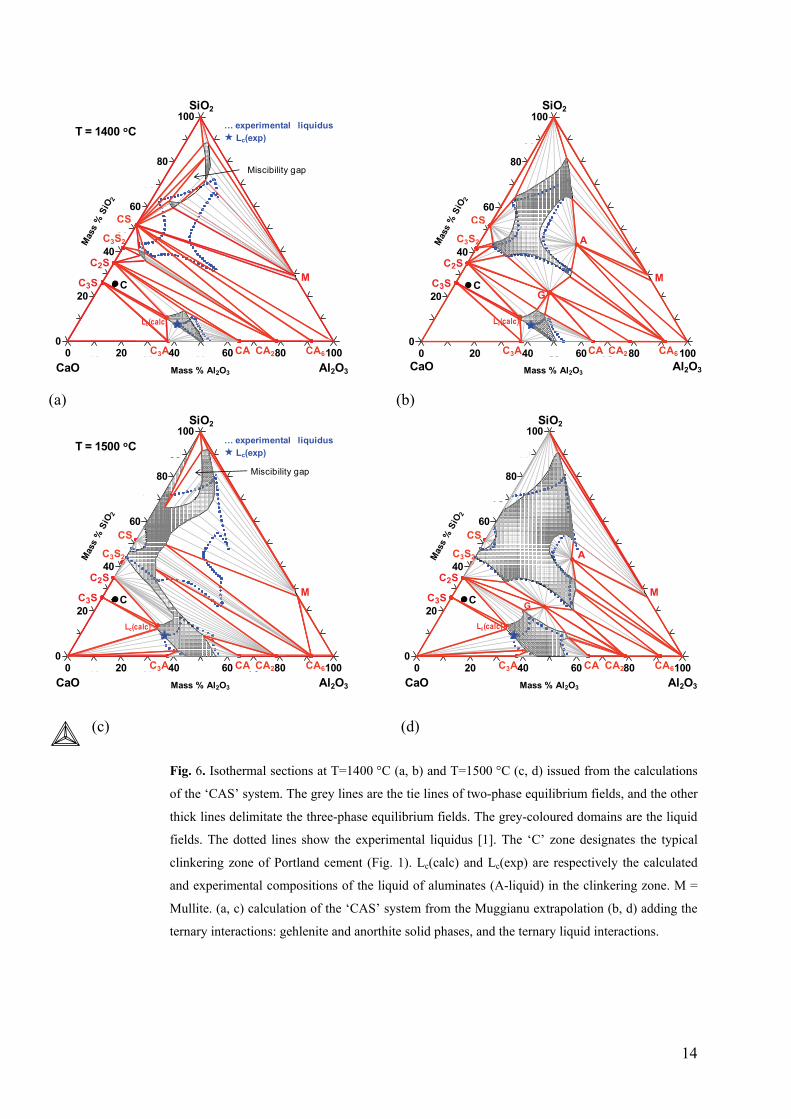
The compositions Lc(calc) calculated from extrapolation or from the full
optimisation are given in Table 3. The value of Lc(calc) is not sensitive to the
addition of any ternary interactions. Table 4 gives the resulting proportions for a
typical white Portland clinker (70 wt% CaO, 25 wt% SiO2 and 5 wt% Al2O3). The
major differences are observed for the proportions of the C2S and liquid phases,
with a maximum difference about 4.5% for T=1500 °C.
In conclusion, the prediction of the ternary ‘CAS’ phase diagram with the
extrapolation method is relevant in the clinkering zone of interest. All the
compositions, that of the ‘A-liquid’ and those of the three phases in equilibrium,
can be estimated with a reasonable accuracy. If more precision is required for the
‘A-liquid’ in the clinkering zone, the assessment of Mao et al. can be improved by
additional measurements in this zone, such as those of activities of Al2O3 in the
liquid.
14
0
10
20
30
40
50
60
70
80
90
100
Ma
ss %
SiO 2
0 10 20 30 40 50 60 70 80 90 100 Mass % Al2O3
CC3S
C2SM
CS
C3S2
Mass % Al2O3
T = 1400 oC … experimental liquidusLc(exp)
CaO Al2O3
SiO2
0
10
20
30
40
50
60
70
80
90
100
Ma
ss %
SiO 2
0 10 20 30 40 50 60 70 80 90 100 Mass % Al2O3
C
Lc(calc)
C3A CA CA2 CA6
Miscibility gap
C3S
C2S
G
A
M
Mass % Al2O3CaO Al2O3
SiO2
Lc(calc)
CS
C3S2
C3A CA CA2 CA6
(a) (b)
0
10
20
30
40
50
60
70
80
90
100
M
ass %
SiO 2
0 10 20 30 40 50 60 70 80 90 100 Mass % Al2O3
CC3S
C2SM
Mass % Al2O3
T = 1500 oC … experimental liquidusLc(exp)
CaO Al2O3
SiO2
0
10
20
30
40
50
60
70
80
90
100
Mass
% S
iO 2
0 10 20 30 40 50 60 70 80 90 100 Mass % Al2O3
C
Lc(calc)
CA CA2 CA6C3A
CS
C3S2
Miscibility gap
C3S
C2S
G
A
M
Mass % Al2O3CaO Al2O3
SiO2
Lc(calc)
CA CA2 CA6C3A
CS
C3S2
G
(c) (d)
Fig. 6. Isothermal sections at T=1400 °C (a, b) and T=1500 °C (c, d) issued from the calculations
of the ‘CAS’ system. The grey lines are the tie lines of two-phase equilibrium fields, and the other
thick lines delimitate the three-phase equilibrium fields. The grey-coloured domains are the liquid
fields. The dotted lines show the experimental liquidus [1]. The ‘C’ zone designates the typical
clinkering zone of Portland cement (Fig. 1). Lc(calc) and Lc(exp) are respectively the calculated
and experimental compositions of the liquid of aluminates (A-liquid) in the clinkering zone. M =
Mullite. (a, c) calculation of the ‘CAS’ system from the Muggianu extrapolation (b, d) adding the
ternary interactions: gehlenite and anorthite solid phases, and the ternary liquid interactions.
15
Table 3
Calculated composition Lc(calc) of the liquid of aluminates in equilibrium with C3S and C2S at
T=1400 °C and T=1500 °C, with the two steps of calculations of Fig. 6. The last column gives the
Rankin experimental composition Lc(exp) deduced graphically [1].
Lc(calc) Lc(exp) Step (extrapolation) (assessment)
T=1400 °C wt% CaO 57.7 57.7 55 wt% Al2O3 31.8 31.8 37 wt% SiO2 10.5 10.5 8
T=1500 °C wt% CaO 59.5 59.5 59 wt% Al2O3 26.9 26.9 32 wt% SiO2 13.6 13.6 9
Table 4
Calculated and experimental proportions (wt%) of the three phases in equilibrium Liquid(Lc) +
C2S + C3S at T=1400 °C and T=1500 °C, for a given white Portland clinker of composition
70 wt% CaO, 25 wt% SiO2 and 5 wt% Al2O3. The experimental proportions are estimated with the
lever rule from the Rankin experimental diagram [1].
wt% Calc. Exp. T=1400 °C Liquid (Lc) 15.7 13
α’-C2S 14.8 16 C3S 69.5 71
T=1500 °C Liquid (Lc) 18.6 14 α-C2S 12.1 16 C3S 69.3 70
5. Towards thermodynamic databases for cement materials
This last part compares advances of the available oxide databases
developed with the three models (associated, modified quasichemical and ionic
two-sublattice models) to compute the quaternary system CaO-SiO2-Al2O3-Fe2O3
(‘CASF’) and to take into account minor oxides such as MgO, SO3, P2O5 and
alkalis.
The calculation of the quaternary phase diagram ‘CASF’ requires the
knowledge of the ‘CAS’ system and the three other ternary phase diagrams: CaO-
Al2O3-Fe2O3, CaO-SiO2-Fe2O3, and Al2O3-Fe2O3-SiO2. All the three binary sub-
systems (CaO-Fe2O3, Al2O3-Fe2O3, and SiO2-Fe2O3) have been fully optimized
16
with the three models [18, 67-69] except the Al2O3-Fe2O3 system that has not
been evaluated yet with the two-sublattice model (ION3 database). FToxid
database recently included Fe2O3: the ternary solid compound C4AF is modelled
and the ternary and higher order liquids are well extrapolated. NPL oxide database
takes into account Fe2O3 as well as for C4AF as for the liquid.
For the case of MgO oxide, data are available in the literature. The three
ternary systems Al2O3-CaO-MgO, Al2O3-MgO-SiO2 and CaO-MgO-SiO2 have
been fully assessed, both with the two-sublattice model [28, 70, 71] and the
modified quasichemical model [72, 73]. As far as there is no quaternary solid
compound stabilized in the Portland clinker zone, extrapolation to the quaternary
system CaO-Al2O3-SiO2-MgO is applied in the various databases.
For the other minor oxides of interest, the situation is very different.
Because the modelling of oxides and commercial interests are still recent, no
optimized data for the binary phase diagrams of CaO, SiO2 or Al2O3 with SO3,
CaF2 or P2O5 have been published. However, FT-oxid database has recently
included SO3 [19], CaF2 and alkalis (Na2O, K2O) and can be used for cement
industry. The Gibbs energy modelling of phosphate phases is already in progress
and need further investigations.
6. Conclusion
Based on a literature review, we have pointed out that some
discrepancies still remain concerning several melting points and that the phase
diagram data in the current cement reference books are not complete and up to
date. We have also shown that both the two-sublattices model and the modified
quasi-chemical model for liquids are relevant up to the calculation of the ternary
CaO-Al2O3-SiO2 (‘CAS’) system. Differences between the calculations depend on
the choice of the selected experimental data for the assessments. The predictive
feature of the CALPHAD method for the calculation of multi-component phase
diagrams is illustrated on the ‘CAS’ ternary phase diagram. As there are no strong
17
ternary interactions in the clinkering zone of interest, a relevant preliminary phase
diagram can be obtained from extrapolation. This predictive method appears as a
useful tool to estimate the composition Lc and the proportion of liquid in the
clinkering zone. For the time being, the composition Lc can be obtained with
average deviations from experiments of about 3-4 wt% SiO2 and 5 wt% Al2O3.
Additional assessments ought to be performed for a better accuracy around the Lc
composition.
The CALPHAD methodology is applied in commercial databases (NPL
oxide, FToxid and ION3) for further calculations of higher order systems, in
particular including Fe2O3, MgO, SO3, P2O5 and alkalis. Considering the data
published up to now, the thermodynamic modelling of iron (or other minor
elements)-containing liquids have not reached the same level of relevance for the
three models. Since a decade, Factsage and MTDATA communities develop the
most extensive databases for cement industry, based on the associated and
modified quasichemical models.
Acknowledgements
CTG-Italcementi Group financially supported this study, within the research collaboration
framework between the CECM (CNRS, France) and CTG (Italcementi Group, France)
laboratories. The authors acknowledge B. Bollotte, E. Moudilou and F. Amin (CTG) for valuable
discussions. Many thanks to G. Inden, Bo Sundman, J.-M. Joubert and P. Chartrand for fruitful
discussions about Calphad method, models and softwares. The authors also express their sincere
thanks to H. Szwarc and R. Céolin for advice and are warmly thankful to F. Dunstetter for his
critical reading of the manuscript.
References
1. Rankin GA, Wright FE (1915) The ternary system CaO-Al2O3-SiO2. American Journal of Sciences 39:1-79 2. Lea F (1998) Lea's Chemistry of Cement and Concrete. Fourth edition. P.C. Hewlett, London 3. Taylor HFW (1997) Cement Chemistry. 2nd edition, Thomas Telford Edition, London 4. Butt YM, Timashev VV The mechanism of clinker formation processes and the modification of its structure. In: 6th International Congress on the Chemistry of Cement, Moscow, September 1974 1974. pp 2-43
18
5. Timashev VV Cinétique de la clinkérisation. Structure et composition du clinker et ses phases. In: 7th International Congress on the Chemistry of Cement, Paris, 1980. pp 1-19 6. Maki I, Goto K (1982) Factors influencing the phase constitution of alite in Portland cement clinker. Cement and Concrete Research 12:301-308 7. de Noirfontaine M-N, Tusseau-Nenez S, Signes-Frehel M, Gasecki G, Girod-Labianca C (2009) Effect of Phosphorus Impurity on Tricalcium Silicate T1: From Synthesis to Structural Characterization. Journal of the American Ceramic Society 92 (10):2337-2344 8. Saunders N, Miodownik AP (1998) CALPHAD (Calculation of the Phase Diagrams): A comprehensive Guide. Pergamon materials series, Oxford 9. Lukas HL, Fries SG, Sundman B (2007) Computational Thermodynamics. The Calphad method. Cambridge University Press, New-York 10. Special issue of Calphad journal (1995), vol 19 (4): 433-575 11. Hillert M (1980) Empirical methods of predicting and representing thermodynamic properties of ternary solution phases. Calphad 4 (1):1-12 12. Muggianu Y-M, Gambino M, Bros J-P (1975) Enthalpies de formation des alliages liquides bismuth-étain-gallium à 723 K. Choix d'une représentation analytique des grandeurs d'excès intégrales et partielles de mélange. Journal de Chimie Physique 72:83-88 13. Pelton AD, Blander M (1986) Thermodynamic analysis of ordered liquid solutions by a modified quasichemical approach - Application to the silicate slags. Metallurgical Transactions B 17:805-815 14. Hillert M, Jansson B, Sundman B, Agren J (1985) A two-sublattice model for molten solutions with different tendency for ionization. Metallurgical Transactions A 16:261-266 15. Sundman B (1991) Modification of the two-sublattice model for liquids. Calphad 15 (2):109-119 16. Sommer F (1982) Association model for the description of the thermodynamic functions of liquid alloys. Zeitschrift für Metallkunde 73 (2):72-76 17. Gaye H, Welfringer J Modelling of the thermodynamic properties of complex metallurgical slags. In: Metallurgical slags and fluxes, 2nd International Symposium, Warrendale, 1984. pp 357-375 18. Barry TI, Glasser FP (2000) Calculations of Portland cement clinkering reactions. Advances in Cement Research 12 (1):19-28 19. Decterov SA, Kang Y-B, Jung I-H (2009) Thermodynamic Database for the Al-Ca-Co-Cr-Fe-Mg-Mn-Ni-Si-O-P-S System and Applications in Ferrous Process Metallurgy. Journal of Phase Equilibria and Diffusion 30 (5):443–461 20. Kattner UR, Handwerker CA (2001) Calculation of phase equilibria in candidate solder alloys. Zeitschrift für Metallkunde 92 (7):740-746 21. Levin EM, Robbins CR, McMurdie HF (1964) Phase diagrams for ceramists. The American Ceramic Society, Columbus, Ohio 22. Yamada T, Yoshimura M, Somiya S (1986) Reinvestigation of the solidification point of CaO by digital pyrometry. Journal of the American Ceramic Society 69 (10):C243-245 23. Levin EM, McMurdie HF (1975) Phase diagrams for ceramists 1975 supplement. The American Ceramic Society, Columbus, Ohio 24. Tewhey JD, Hess PC (1979) The two phase region in the CaO-SiO2 system: experimental data and thermodynamic analysis. Physics and Chemistry of Glasses 20 (3):41-52
19
25. Hageman VBM, Van den Berg GJK, Janssen HJ, Oonk HAJ (1986) A reinvestigation of liquid immiscibility in the SiO2-CaO system. Physics and Chemistry of Glasses 27 (2):100-105 26. Hillert M, Sundman B, Wang X (1990) An assessment of the CaO-SiO2 System. Metallurgical Transactions B 21:303-312 27. Hillert M, Sundman B, Wang X (1991) A reevaluation of the rankinite phase in the CaO-SiO2 system. Calphad 15 (1):53-58 28. Huang WL, Hillert M, Wang X (1995) Thermodynamic assessment of the CaO-MgO-SiO2 system. Metallurgical Transactions A 26:2293-2310 29. Tromel G, Fix W, Heinke R (1969) Hochtemperaturuntersuchungen bis 1900°C an Calciumorthosilikat und Tricalciumsilikat Tonindustrie-Zeitung 93-1:1-8 30. Elliott JF, Gleiser M (1960) Thermochemistry for steelmaking. Addison-Wesley, MA, United States 31. Eriksson G, Wu P, Blander M, Pelton AD (1994) Critical Evaluation and Optimization of the Thermodynamic Properties and Phase Diagrams of the MnO-SiO2 and CaO-SiO2. Canadian Metallurgical Quarterly 33 (1):13-21 32. Somiya S. Unpublished work, Tokyo Inst. Technology, Yokahama 33. Taylor JR, Dinsdale AT (1990) Thermodynamic and phase diagram data for the CaO-SiO2 system. Calphad 14 (1):71-88 34. Ball RGJ, Mignanelli MA, Barry TI, Gisby JA (1993) The calculation of phase equilibria of oxide core-concrete systems. Journal of Nuclear Materials 201:238-249 35. Zaitsev AI, Zemchenko M, Litvina AD, Mogutnov BM (1993) Thermodynamic calculation of phase equilibria in the CaF2-SiO2-CaO system. Journal of Materials Science 3 (5):541-546 36. Nurse RW, Welch JH, Majumdar AJ (1965) The CaO-Al2O3 System in a Moisture-free Atmosphere. Transactions and Journal of the British Ceramic Society 64:409-418 37. Nityanand N, Fine HA (1983) The effect of TiO2 additions and oxygen potential on liquidus temperatures of some CaO-Al2O3 melts. Metallurgical and Materials Transactions B 14 (4):685-692 38. Nurse RW, Welch JH, Majumdar AJ (1965) The 12CaO.7Al2O3 phase in the CaO-Al2O3 System. Transactions and Journal of the British Ceramic Society 64:323-332 39. Muan A, Osborn EF (1965) Phase equilibria among oxides in steel-making. Addison-Wesley, Reading, Massachusetts 40. Chatterjee AK, Zhmoidin GI (1972) The phase equilibrium diagram of the system CaO-Al2O3-CaF2. Journal of Material Science 7:93-97 41. Rolin M, Thanh PH (1965) Les diagrammes de phases des mélanges ne réagissant pas avec le molybdène. Revue des Hautes Températures et Réfractaires 2:175-185 42. Hallstedt B (1990) Assessment of the CaO-Al2O3 System. Journal of the American Ceramic Society 73 (1):15-23 43. Mao H, Selleby M, Sundman B (2004) A re-evaluation of the liquid phases in the CaO-Al2O3 and MgO-Al2O3. Calphad 28:307-312 44. Eriksson G, Pelton AD (1993) Critical evaluation and optimization of the thermodynamic properties and phase diagrams of the CaO-Al2O3, Al2O3-SiO2, and CaO-Al2O3-SiO2 systems. Metallurgical Transactions B 24:807-816 45. Aramaki S, Roy R (1962) Revised Phase Diagram for the System Al2O3-SiO2. Journal of the American Ceramic Society 45 (5):229-242
20
46. Bowen NL, Greig JW (1924) The system: Al2O3.SiO2. Journal of the American Ceramic Society 7 (4):238-254 47. Aksay IA, Pask JA (1975) Stable and metastable equilibria in the system SiO2-Al2O3. Journal of the American Ceramic Society 58 (11-12):507-512 48. Davis RF, Pask JA (1972) Diffusion and reaction studies in the system Al2O3-SiO2. Journal of the American Ceramic Society 55 (10):525-531 49. Konopicky K (1956) Remarques relatives au diagramme d'equilibre SiO2-Al2O3. Bulletin de la Société française de Céramiques 33:3-6 50. Toropov NA, Galakhov FY (1951) New data on the system Al2O3-SiO2. Doklady Akademii Nauk SSSR 78 (2):299-302 51. Klug FJ, Prochazka S, Doremus RH (1987) Alumina-silica phase diagram in the mullite region. Journal of the American Ceramic Society 70 (10):750-759 52. Hamano K, Sato T, Nakagawa Z (1986) Properties of mullite powder prepared by coprecipitation and microstructure of fired bodies. Yogyo-Kyokai-Shi 94 (8):818-822 53. Okada K, Otsuka N (1987) Change in chemical composition of mullite formed from 2SiO2.3Al2O3 xerogel during the formation progress. Journal of the American Ceramic Society 70 (10):C245–247 54. Prochazka S, Klug FJ (1983) Infrared-transparent mullite ceramic. Journal of the American Ceramic Society 66 (12):874-880 55. Mao H, Selleby M, Sundman B (2005) Phase equilibria and thermodynamics in the Al2O3-SiO2 system - Modelling of mullite and liquid. Journal of the American Ceramic Society 88 (9):2544-2551 56. Risbud SH, Pask JA (1978) Mullite crystallization from SiO2-Al2O3 melts. Journal of the American Ceramic Society 61 (1-2):63-67 57. Horibe T, Kuwabara S (1967) Thermo-analytical investigation of the phase equilibria in the Al2O3-SiO2 system. Bull. Chem. Soc. Jpn. 40 (4):972-982 58. Staronka A, Pham H, Rolin M (1968) Etude du système silice-alumine par la méthode des courbes de refroidissement. Revue Internationale des Hautes Températures et des Réfractaires 5:111-115 59. Fabrichnaya OB, Costa e Silva A, Aldinger F (2004) Assessment of thermodynamic functions in the MgO-Al2O3-SiO2 system. Zeitschrift für Metallkunde 95 (9):793-805 60. Welch JH (1960) A new interpretation of the mullite problem. Nature 186:545-546 61. Yazhenskikh E, Hack K, Müller M (2008) Critical thermodynamic evaluation of oxide systems relevant to fuel ashes and slags. Part 3: Silica–alumina system. Calphad 32:195-205 62. Mao H, Hillert M, Selleby M, Sundman B (2006) Thermodynamic assessment of the CaO-Al2O3-SiO2 system. Journal of the American Ceramic Society 89 (1):298-308 63. Pelton AD (2005) Thermodynamic models and databases for slags, fluxes and salts. Mineral Processing and Extractive Metallurgy (Trans. Inst. Min. Metall. C) 114:C172-180 64. Andersson JO, Helander T, Hoglund L, Shi P, Sundman B (2002) Thermo-Calc & Dictra, Computational Tools for Materials Science. Calphad 26 (2):273-312 65. Roth RS, Dennis JR, McMurdie HF, Clevinger MA, Ondik HM, Schenk PK (1987) Phase diagrams for ceramists. The American Ceramic Society, Westerville, Ohio
21
66. Schairer JF, Bowen NL (1955) The system K2O-Al2O3-SiO2. American Journal of Science 253:681-746 67. Hillert M, Selleby M, Sundman B (1990) An assessment of the Ca-Fe-O System. Metallurgical Transactions A 21:1990-2759 68. Fabrichnaya OB, Sundman B (1997) The assessment of thermodynamic parameters in the Fe-O and Fe-Si-O systems. Geochimica et Cosmochimica Acta 61 (21):4539-4555 69. Decterov SA, Jung IH, Jak E, Kang YB, Hayes P, Pelton AD Thermodynamic modelling of the Al2O3-CaO-CoO-CrO-Cr2O3-FeO-Fe2O3-MgO-MnO-NiO-SiO2-S system and applications in ferrous process metallurgy. In: VII International Conference on Molten Slags Fluxes and Salts, 2004. The South African Institute of Mining and Metallurgy, pp 839-850 70. Hallstedt B (1995) Thermodynamic Assessment of the CaO-MgO-Al2O3. Journal of the American Ceramic Society 78 (1):193-198 71. Mao H, Fabrichnaya OB, Selleby M, Sundman B (2005) Thermodynamic assessment of the MgO-Al2O3-SiO2 system. Journal of Material Research 20 (4):975-986 72. Jung IH, Decterov SA, Pelton AD (2004) Critical thermodynamic evaluation and optimisation of the MgO-Al2O3, CaO-MgO-Al2O3, and MgO-Al2O3-SiO2 systems. Journal of Phase Equilibria and Diffusion 25 (4):329-345 73. Jung IH, Decterov SA, Pelton AD (2005) Critical thermodynamic evaluation and optimization of the CaO-MgO-SiO2 system. Journal of the European Ceramic Society 25:313-333