Embed Size (px)
Citation preview

Cambridge Checkpoint
Feedback
www.XtremePapers.com
Contents
Introduction
The purposes of feedback 2When will feedback be provided? 2The examples in this document 2The Checkpoint scale 3
Examples of feedback reports
Feedback on an individual student 4Feedback on a teaching group 8Feedback on a Centre 14End of session report 16
Appendix
List of main topics and sub-topics in each subject 22
1
Introduction
The purposes of feedback
Detailed, diagnostic feedback is a central feature of Cambridge Checkpoint.The feedback has two main purposes.
• Firstly, by providing information on students’ areas of strength and weakness, the feedback enables the future teaching of those students to be effectively focused. The strengths can be consolidated and the areas of weakness can be tackled.
• Secondly, the feedback may be used to review the parts of the curriculum where teaching has been most effective and the parts where it has been less effective. This can help teachers to learn lessons about the teaching approaches that work well, and to improve their teaching of future groups of students.
When will feedback be provided?
The feedback is despatched to Centres in two stages.
• The first set of feedback reports is despatched within four weeks of the completed scripts being received in Cambridge. This set of feedback is in three parts:
1. Reports on the performance of individual students
2. Reports on the performance of teaching groups
3. A report on the performance of the Centre as a whole
• The second set of feedback is the End of Session Report, despatched once the results from all schools have been processed. The End of Session Report is in four parts for each subject:
1. The Principal Examiner’s report on the question papers and students’ responses.
2. The demographic breakdown of the whole entry showing the average performance of students of different ages and language backgrounds.
3. Block diagrams to illustrate the performance of students by age and language background.
4. Cumulative frequency graphs illustrating the performance of students by age and language background.
The examples in this document
Examples of the different types of report are shown, with explanatory notes, on the pages thatfollow. The school and student names are fictitious.
The example reports are for Science, but reports in English and Mathematics will be identicalapart from the names of the main topics and sub-topics in the curriculum. A list of the maintopics and sub-topics for each subject is included in the Appendix.
2
The Checkpoint scale
Performance in Checkpoint tests is not reported as raw scores (simple numbers of marks). Thisis because raw scores are not suitable for making direct comparisons between different sets ofquestions. For example, if a student achieves a higher raw score on the Biology questionsthan on the Chemistry questions, this might be because:
• The student is stronger in Biology
• The Biology questions were easier
• There were more marks available in Biology
• Or a combination of these reasons
Similarly, it is not possible to directly compare raw scores year-on-year.
In order to make direct comparisons, it is necessary to convert raw scores into scores on astandardised scale of achievement. The Checkpoint scale is one such scale. The scale takes thedifficulty of the questions into account, so that if a student achieves a higher Checkpoint scorein Biology than in Chemistry, this can only mean that student is better at Biology thanChemistry.
The Checkpoint scale runs from 0.0 to 6.0, with 0.0 being the lowest possible score and 6.0 thehighest.
3
4
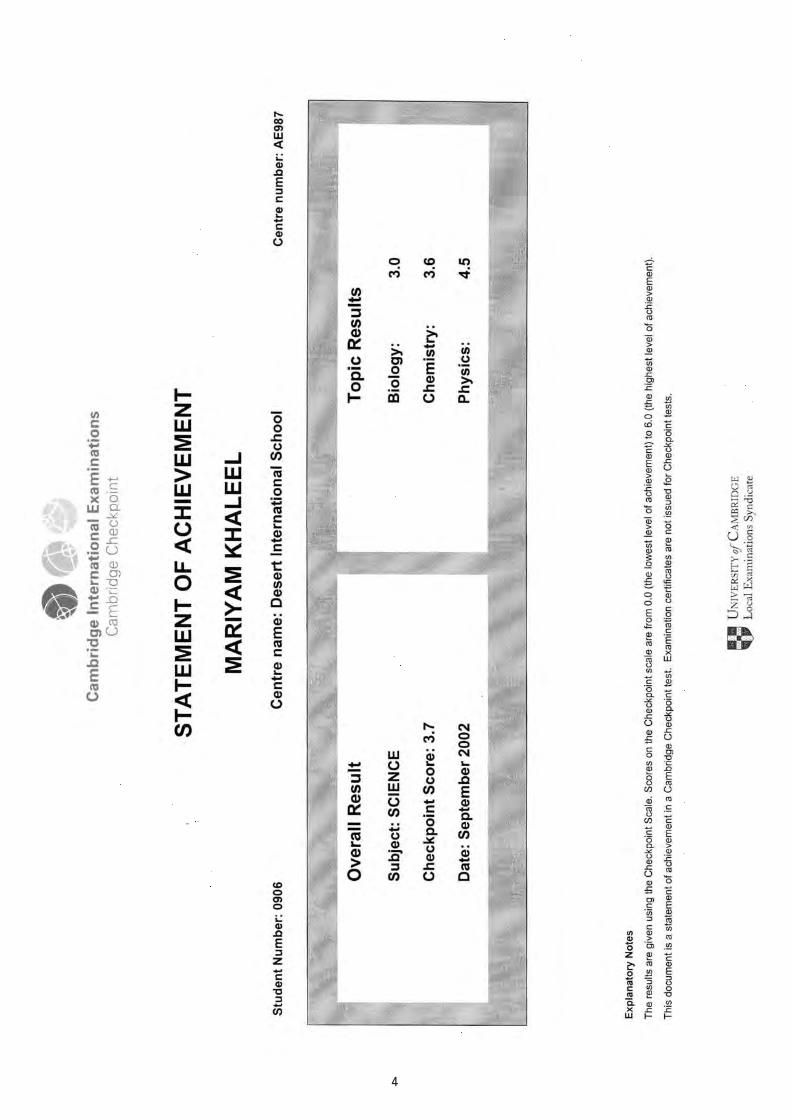
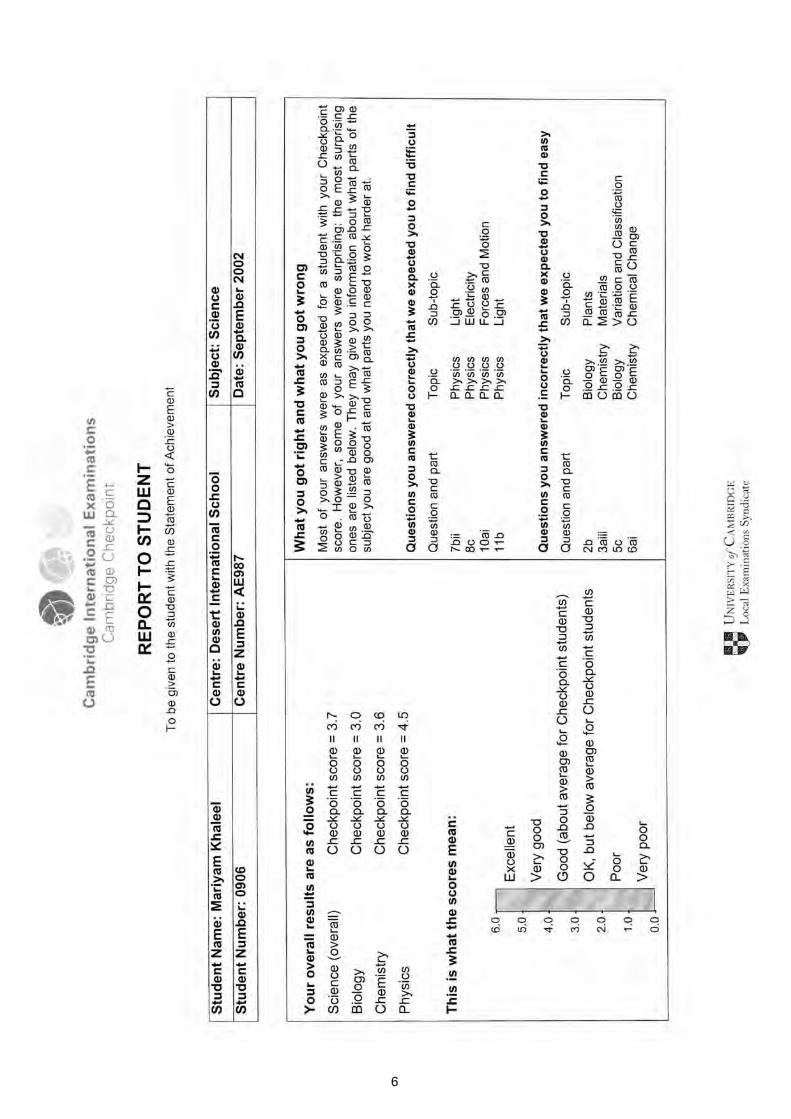
Feedback on an individual student: Statement of Achievement
The feedback on individual students comes in two parts: a Statement of Achievement and aReport to Student. It is intended that both parts should be given to the student.
The Statement of Achievement reflects:
• The level of achievement reached by the student across the whole test. This is expressedas a score on the Checkpoint scale.
• The level of achievement reached in each of the three main topics, expressed on theCheckpoint scale. In this particular example, the student is much stronger in Physics thanin Biology. A list of the main topic areas in each subject is given in the Appendix
There is no certificate for Checkpoint. If it were a certificated qualification, then it would not bepossible to have flexibility in the timetable and in the curriculum. However, the Statement of Achievement is an attractively presented statement of how well a student has performed.
5
6
Feedback on an individual student: Report to Student
This is the second part of the feedback on individual students, and provides more informationthan the Statement of Achievement.
The Report to Student covers:
• Checkpoint scores for the subject as a whole and for the three main topics within thesubject. These figures are the same as on the Statement of Achievement.
• A brief and easily understood explanation of the Checkpoint scale.
• A list of the four most difficult part-questions that the student answered correctly, togetherwith the main topics and sub-topics assessed by those part-questions. This informationgives an indication of the sub-topics in which the student is particularly strong.
• A list of the four easiest part-questions that the student answered incorrectly, together withthe main topics and sub-topics assessed by those part-questions. This information givesan indication of the sub-topics in which the student is particularly weak.
7
8
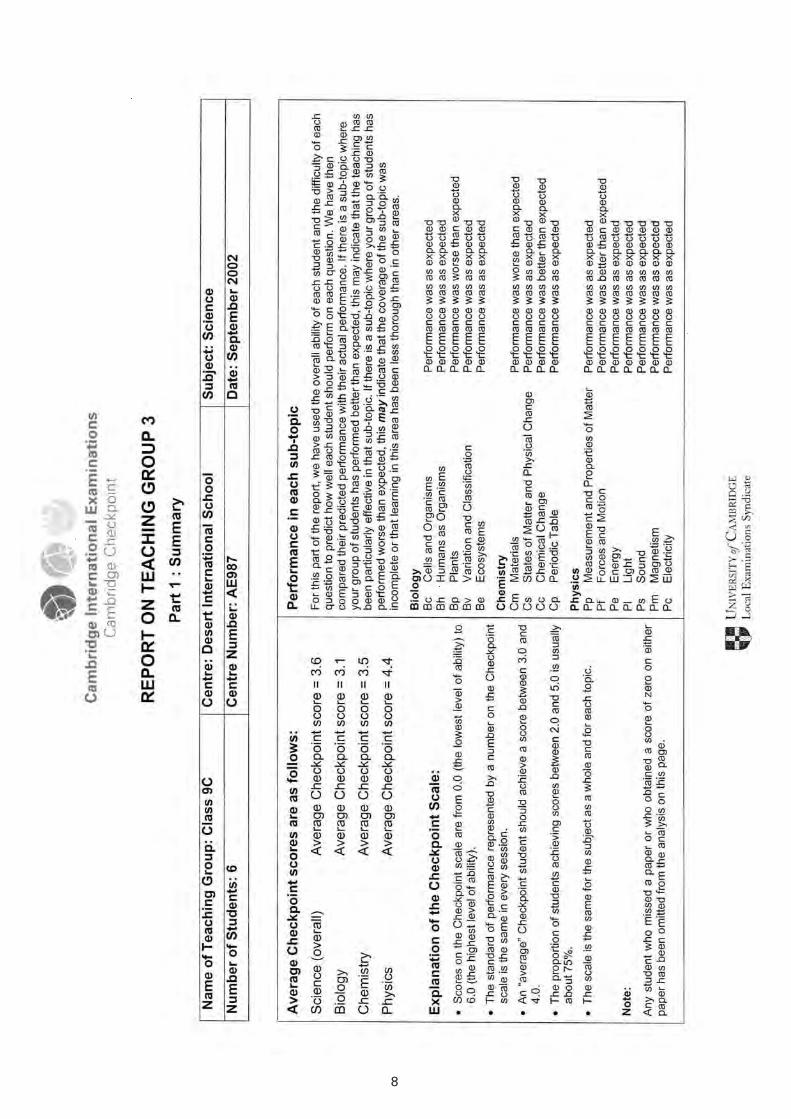
Feedback on a teaching group: Part 1
The feedback on each teaching group comes in three parts, of which this report is the first.
The Summary document covers the following:
• The Checkpoint score for the subject as a whole, averaged over all the students in theteaching group.
• The Checkpoint scores for each of the main topic areas, averaged over all the students inthe teaching group. In this particular example, the group as a whole has performed betterin Physics than in Biology. For a list of the main topic areas in each subject, please see theAppendix.
• The Checkpoint scale explained for teachers.
• The performance of the teaching group in each sub-topic. This analysis reports on whetherthe performance of the group on the sub-topic was better than expected, worse thanexpected or as expected. The analysis takes into account both the difficulties of thequestions on the sub-topic and the overall ability of the students. In this particularexample, when the difficulties of the questions are taken into account, and given theoverall level of ability of the students, they performed better than expected in ChemicalChange and in Forces and Motion, but worse than expected in Plants and in Materials.This helps to explain the pattern described in note 2, and helps to identify more preciselythe group’s areas of strength and weakness.
9
10

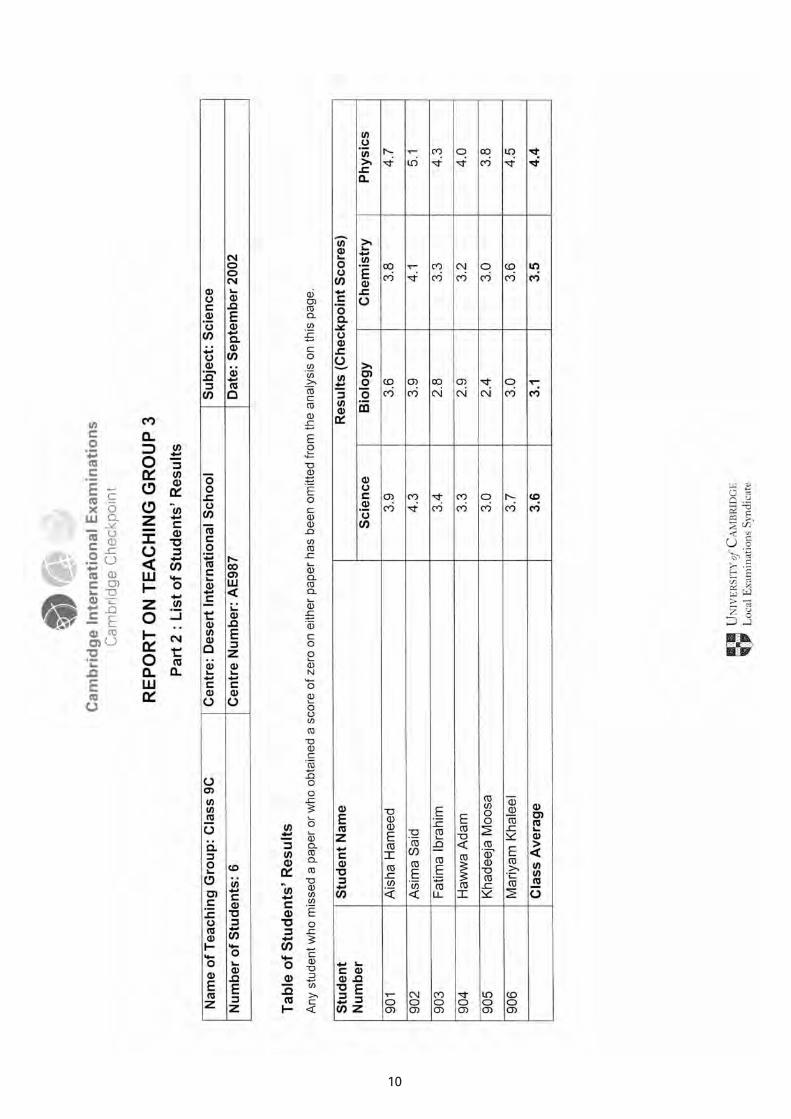
Feedback on a teaching group: Part 2
This is the second part of the feedback on a teaching group. It provides the teacher with thesame information that is on the students’ Statements of Achievement.
The List of Students’ Results covers:
• The individual student’s Checkpoint scores on the subject as a whole and on each of themain topics within the subject.
• The averages for the whole teaching group: these figures are the same as on Part 1 of thereport on the teaching group.
11
12
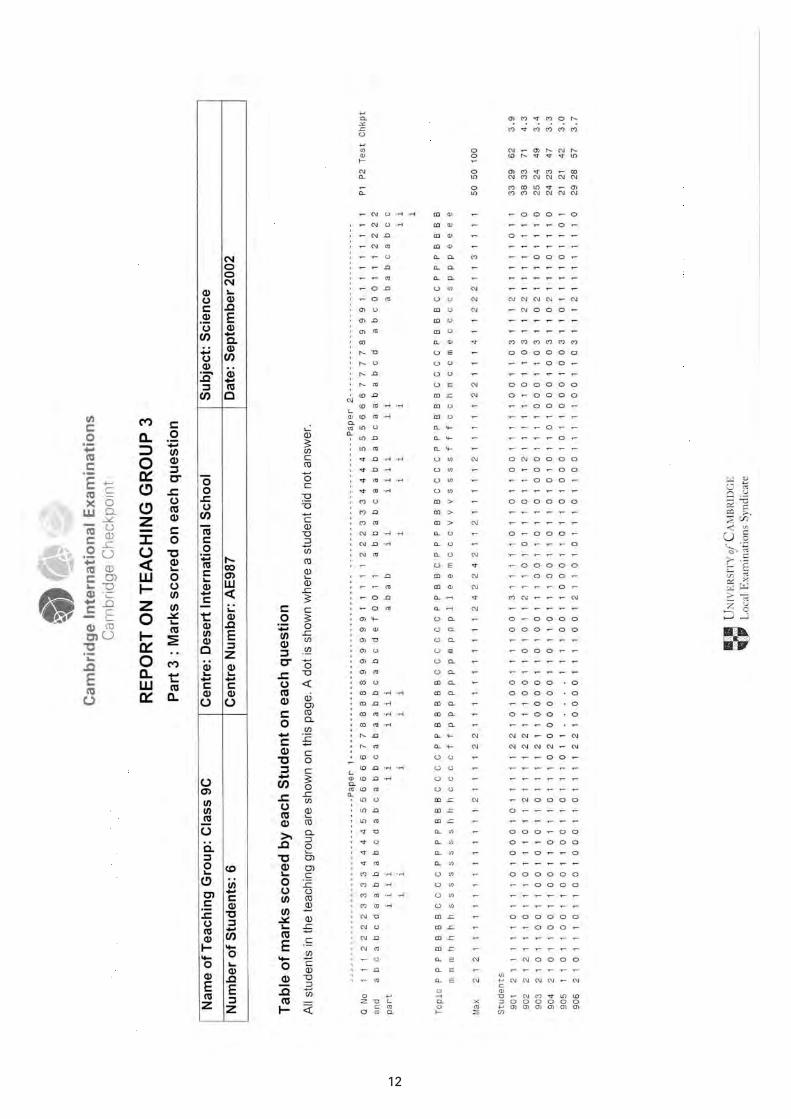
Feedback on a teaching group: Part 3
This is the third part of the feedback report on a teaching group. It provides the teacher withinformation about the raw marks scored by each student on each part of each question.
• Each column in the report represents a part-question. The top few rows are columnheadings, giving the paper number, question number, and identifying the question part.
• Below the column headings, the table shows the codes for the main topic and sub-topicassessed by each part-question. A list of the codes for all three subjects is given in theAppendix. There is also a list on Part 1 of the report on a teaching group.
• The next row of the table shows the maximum number of marks available for each part-question.
• The main part of the report shows the marks scored by each student on each part-question.Where the student has not attempted to answer, the mark is given by a dot. In thisparticular example, it can be seen that student 905 has not attempted to answer any part ofPaper 1 Question 8. This report can be used to identify particular questions that havecaused difficulties for the students, particularly in areas where their performance has beenidentified as worse than expected (see Part 2 of the report on a teaching group). In thisparticular example, plants (Bp) was identified as an area where performance was worsethan expected, and it can be seen from this part of the report that there are parts of Paper 1Question 8 that none of the students was able to answer correctly. The teacher might thenwant to look at these question parts to see if there is a reason for this difficulty, such as anaspect of the topic assessed in this question that was not included in the teaching.
• The last few columns on the right-hand side of the report show the total scores of eachstudent on each paper and on the test as a whole, together with the Checkpoint scoresachieved by the students.
13
14

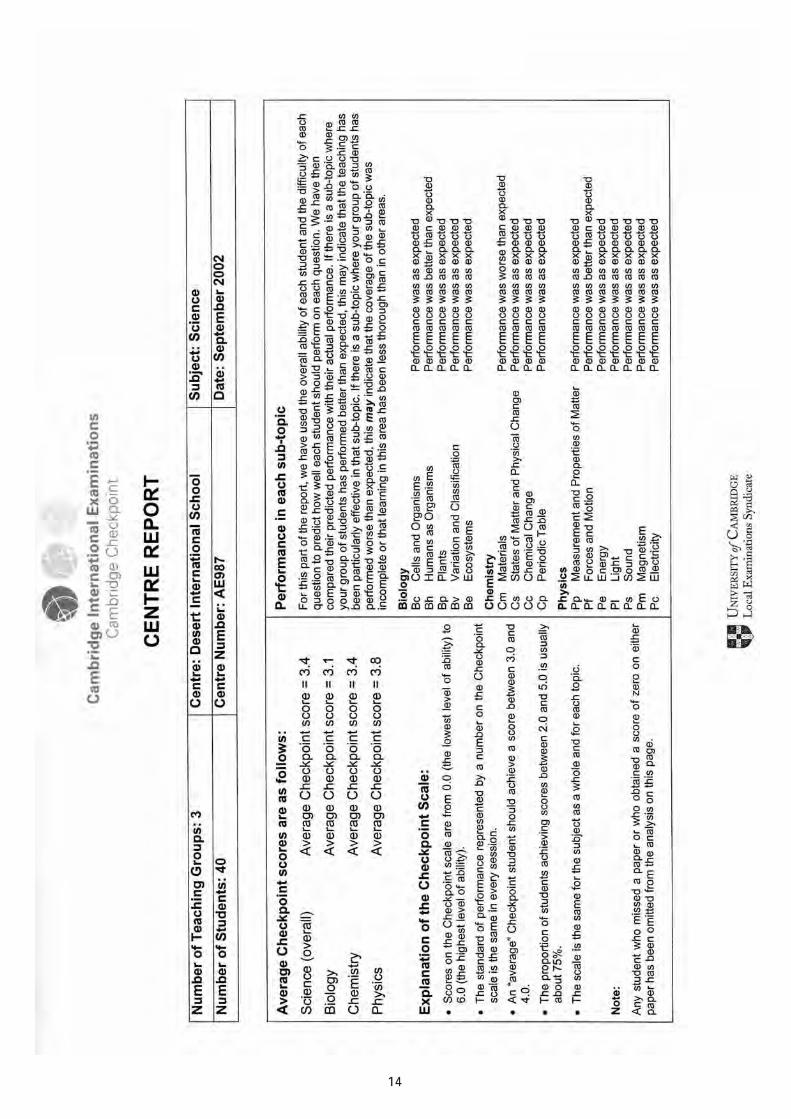
Feedback on a Centre
The feedback on a Centre occupies a single sheet of paper, and is intended for the Head ofDepartment. Its format is almost identical to that of the report on a teaching group Part 1: themain difference is that the average scores and the pattern of performance in sub-topics arecalculated for all students in the Centre rather than for one teaching group.
15
16
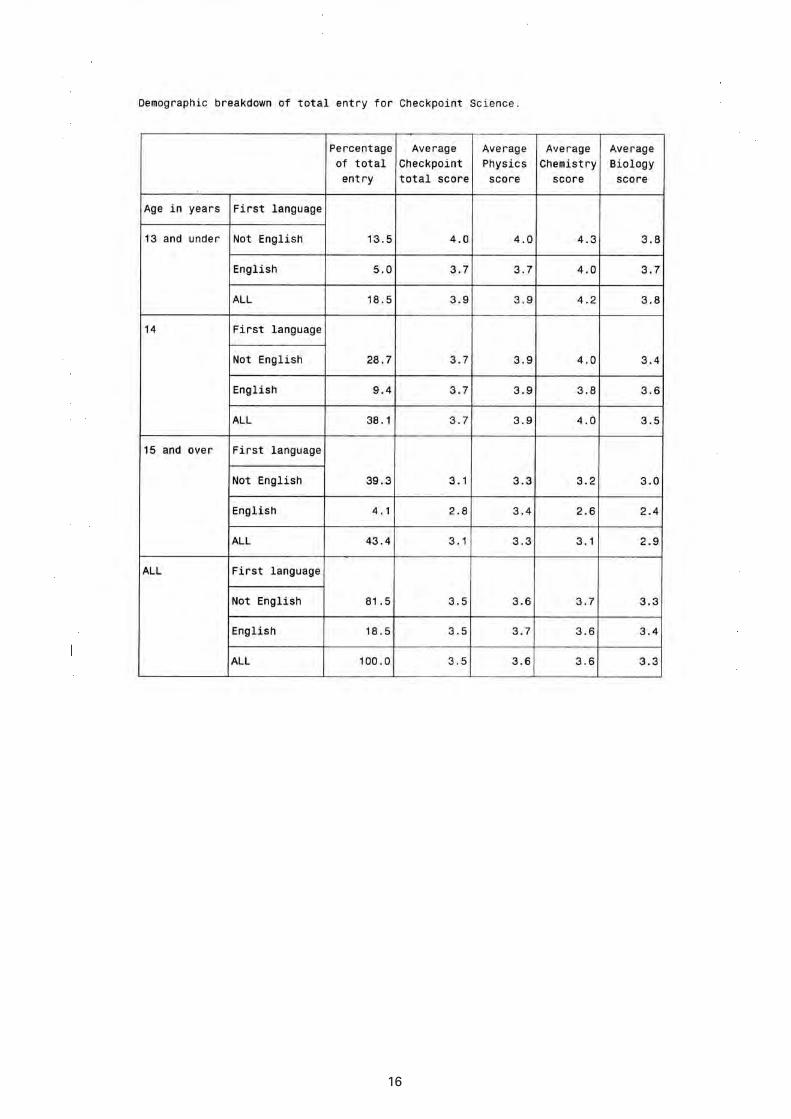
End of Session Report: Principal Examiner’s Report and demographic
breakdown of entry
The End of Session Reports for all three subjects are sent out together.
For each subject, the first part of the End of Session Report is the Principal Examiner’s Report, a report describing the students’ performance on each question. An example of a PrincipalExaminer’s report is not shown here because they may vary in format and style.
The second part of the End of Session Report is the demographic breakdown of the entry,shown above.
• The whole cohort of Checkpoint students, from all Centres, is broken down into three agecategories (13 and under, 14, 15 and over) and into two language categories (first languageEnglish, first language not English). This enables Centres to compare their ownperformance with that of other schools with similar students.
• For each category, the number of students is shown as a percentage of the total entry.
• For each category of student, the average Checkpoint score on the subject as a whole andon each of the main topics is shown.
17
18

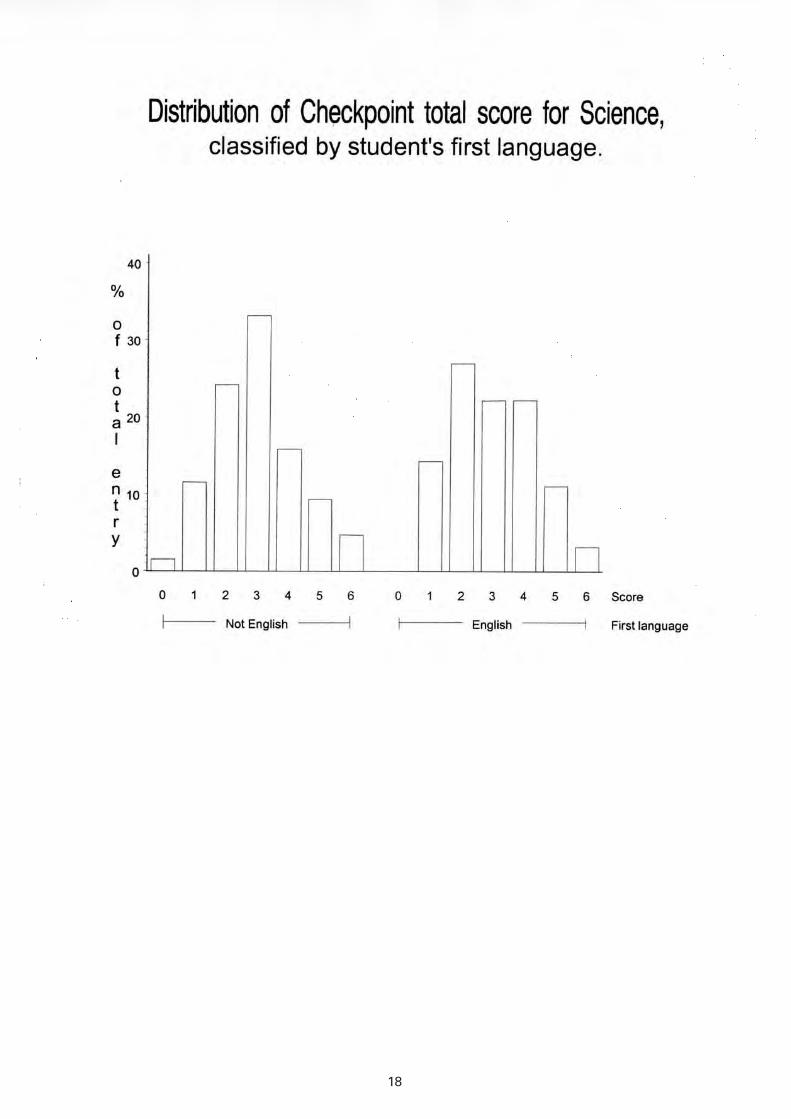
End of Session Report: block diagrams
The third part of the End of Session Report is a series of block charts similar to the exampleshown above.
• Each block chart shows the distributions of Checkpoint scores achieved by the students.
• The block charts break the students into categories so that the distributions for thecategories may be compared. In this particular example, the categories are the two first-language categories: a separate block diagram will show the distributions for the differentage categories.
• The example shows the distribution of Checkpoint scores for the subject as a whole. Thereare also block diagrams showing the distributions for each of the main topic areas.
19
20

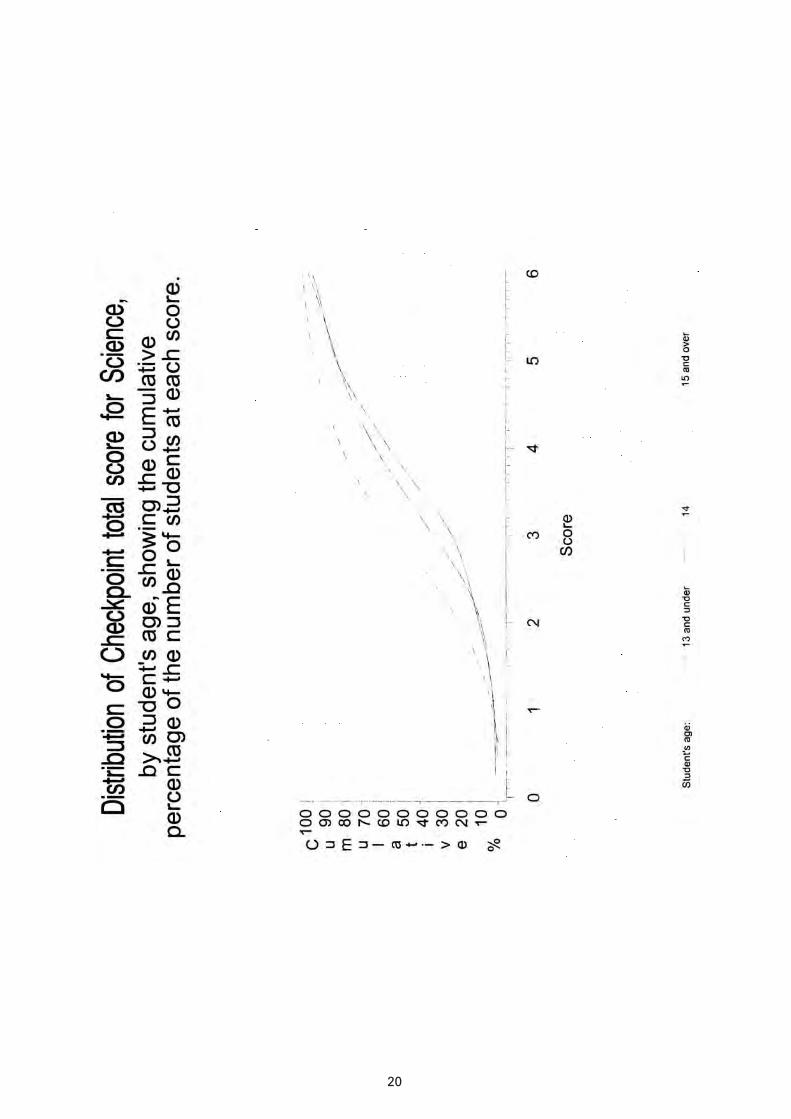
End of Session Report: cumulative frequency graphs
The fourth section of the End of Session Report is a series of cumulative frequency graphs.These show the percentage of students who achieved a particular Checkpoint score or less. Allthe curves therefore start at 0 per cent of students scoring 0.0 or less, and end at 100 per centof students scoring 6.0 or less.
• The graphs show the students broken down into categories. In the example shown, thecategories are by age, and consequently there are three curves shown. The End of SessionReport will also include a cumulative frequency graph with two curves for the studentscategorised by their first language.
• The example shows the cumulative frequencies of Checkpoint scores for the subject as awhole. Separate graphs are provided showing the Checkpoint scores on each of the maintopic areas.
21
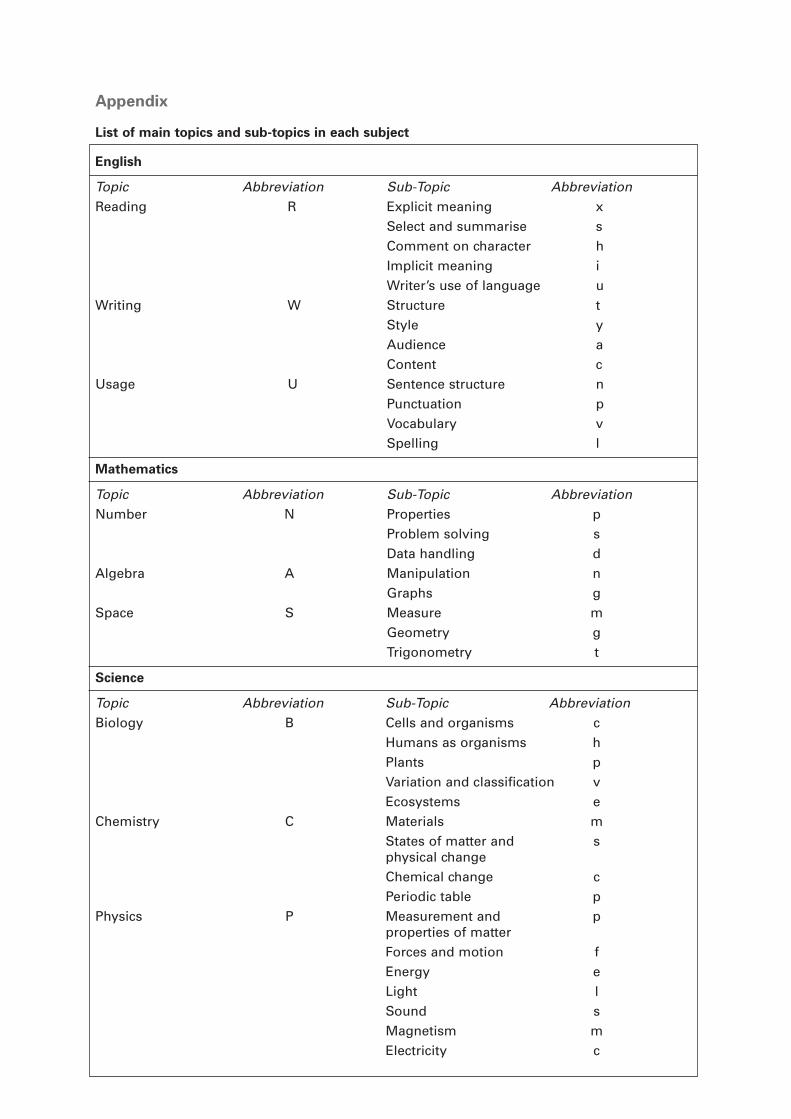
Appendix
List of main topics and sub-topics in each subject
English
Topic Abbreviation Sub-Topic AbbreviationReading R Explicit meaning x
Select and summarise sComment on character hImplicit meaning iWriter’s use of language u
Writing W Structure tStyle yAudience aContent c
Usage U Sentence structure nPunctuation pVocabulary vSpelling l
Mathematics
Topic Abbreviation Sub-Topic AbbreviationNumber N Properties p
Problem solving sData handling d
Algebra A Manipulation nGraphs g
Space S Measure mGeometry gTrigonometry t
Science
Topic Abbreviation Sub-Topic AbbreviationBiology B Cells and organisms c
Humans as organisms hPlants pVariation and classification vEcosystems e
Chemistry C Materials mStates of matter and sphysical changeChemical change cPeriodic table p
Physics P Measurement and pproperties of matterForces and motion fEnergy eLight lSound sMagnetism mElectricity c

University of Cambridge International Examinations
1 Hills Road, Cambridge, CB1 2EU, UKTel: +44 1223 553554 Fax: +44 1223 553558
Email: [email protected] Website: www.cie.org.uk
© University of Cambridge International Examinations 2005


![Cambridge Checkpoint [1113] 2009 April, P2](https://img.pdfslide.net/doc/110x75/577c7e791a28abe054a14c85/cambridge-checkpoint-1113-2009-april-p2.jpg)