Embed Size (px)
Citation preview
This document consists of 23 printed pages and 1 blank page.
DC (RW/SG) 112062/2© UCLES 2016 [Turn over
Cambridge International ExaminationsCambridge Ordinary Level
*5500826079*
ENVIRONMENTAL MANAGEMENT 5014/12
Paper 1 May/June 2016
2 hours 15 minutes
Candidates answer on the Question Paper.
No Additional Materials are required.
READ THESE INSTRUCTIONS FIRST
Write your Centre number, candidate number and name on all the work you hand in.Write in dark blue or black pen.You may use an HB pencil for any diagrams or graphs.Do not use staples, paper clips, glue or correction fluid.DO NOT WRITE IN ANY BARCODES.
Answer all questions.
Electronic calculators may be used.You may lose marks if you do not show your working or if you do not use appropriate units.
Write your answers in the spaces provided on the Question Paper.
All questions in Section A carry 10 marks.Both questions in Section B carry 40 marks.
At the end of the examination, fasten all your work securely together.The number of marks is given in brackets [ ] at the end of each question or part question.
2
5014/12/M/J/16© UCLES 2016
Section A
Answer all the questions.
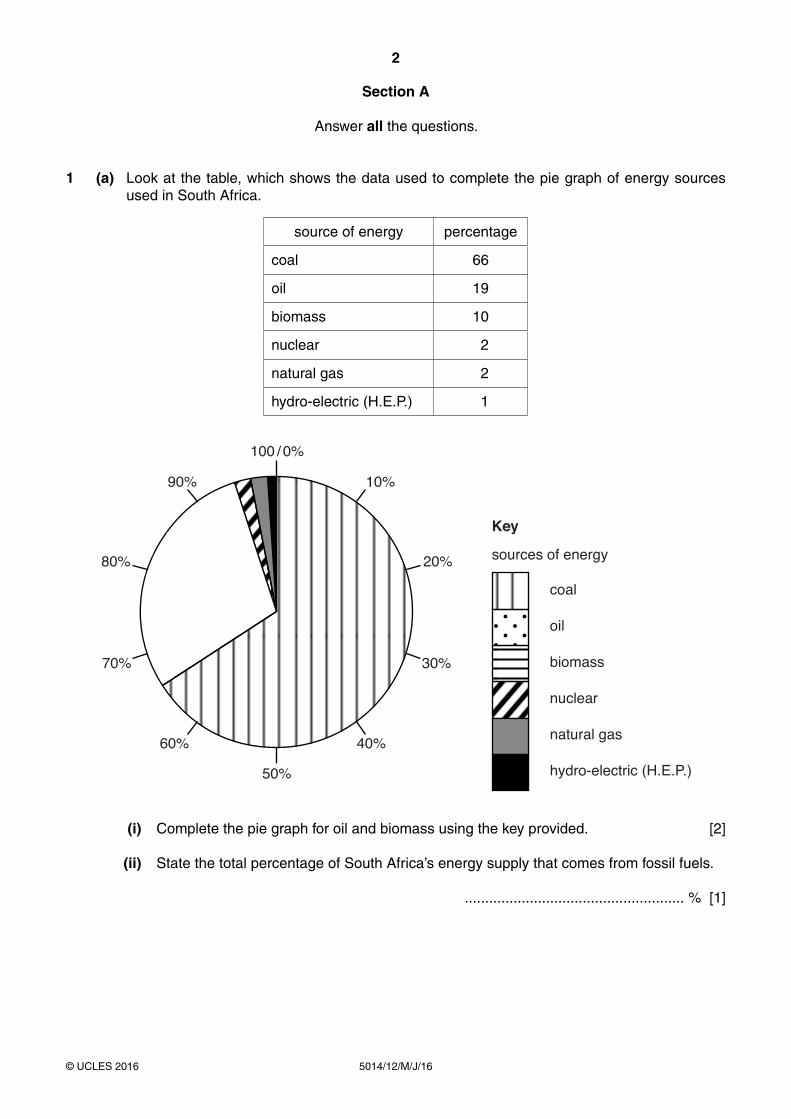
1 (a) Look at the table, which shows the data used to complete the pie graph of energy sources used in South Africa.
source of energy percentage
coal 66
oil 19
biomass 10
nuclear 2
natural gas 2
hydro-electric (H.E.P.) 1
100 / 0%
50%
60%
70%
80%
90%
40%
30%
20%
10%
Key
sources of energy
coal
oil
biomass
nuclear
natural gas
hydro-electric (H.E.P.)
(i) Complete the pie graph for oil and biomass using the key provided. [2]
(ii) State the total percentage of South Africa’s energy supply that comes from fossil fuels.
...................................................... % [1]
3
5014/12/M/J/16© UCLES 2016 [Turn over
(iii) Suggest why only a small percentage of South Africa’s energy supply is from hydro-electric power (H.E.P.).
...........................................................................................................................................
...........................................................................................................................................
...........................................................................................................................................
.......................................................................................................................................[2]
(b) In a recent six-year period, South Africa’s energy demand increased by 10 percent, but its carbon dioxide emissions increased by only one percent.
Suggest a reason for each of these changes.
reason for increase in energy demand .....................................................................................
...................................................................................................................................................
...................................................................................................................................................
reason for low increase in carbon dioxide emissions ................................................................
...................................................................................................................................................
...............................................................................................................................................[2]
(c) Explain how deep-shaft coal mining affects the local surface environment.
...................................................................................................................................................
...................................................................................................................................................
...................................................................................................................................................
...................................................................................................................................................
...................................................................................................................................................
...............................................................................................................................................[3]
4
5014/12/M/J/16© UCLES 2016
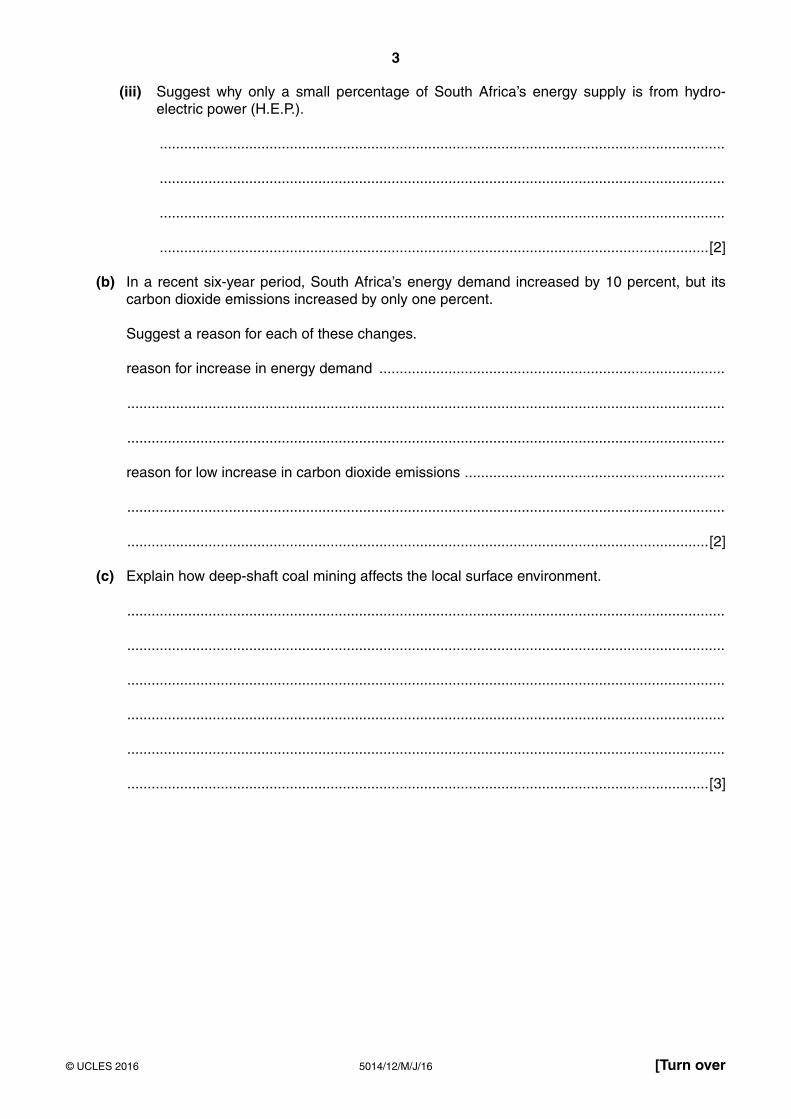
2 Look at the diagram, which shows processes in the water cycle.
lake
(a) Complete the table using letters from the diagram.
process letter
condensation................
evaporation................
infiltration................
interception................
run-off................
[4]
(b) (i) Suggest why water might be needed in large quantities in a rural area with a low population density.
...........................................................................................................................................
...........................................................................................................................................
...........................................................................................................................................
.......................................................................................................................................[2]
(ii) Suggest why fresh water may be available in an area but be of little use.
...........................................................................................................................................
.......................................................................................................................................[1]
5
5014/12/M/J/16© UCLES 2016 [Turn over
(c) (i) Explain what is meant by the term desalination.
...........................................................................................................................................
.......................................................................................................................................[1]
(ii) Explain why desalination is not widely used to provide drinking water.
...........................................................................................................................................
...........................................................................................................................................
...........................................................................................................................................
.......................................................................................................................................[2]
6
5014/12/M/J/16© UCLES 2016
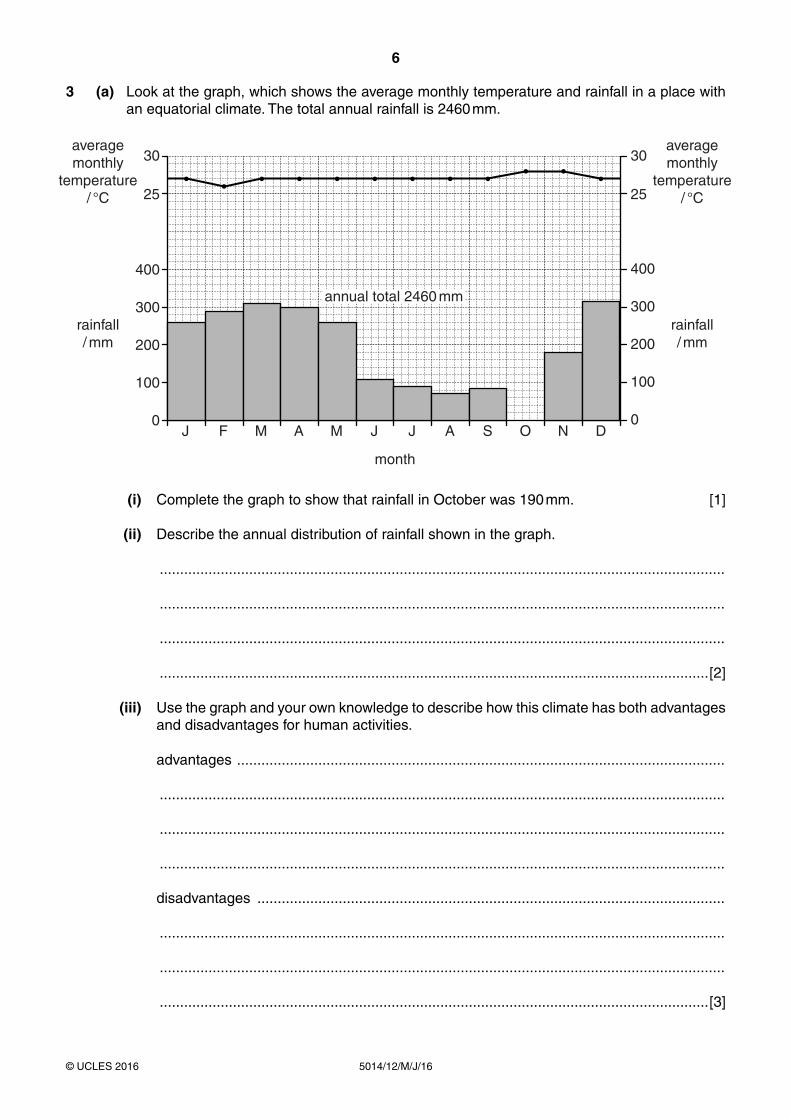
3 (a) Look at the graph, which shows the average monthly temperature and rainfall in a place with an equatorial climate. The total annual rainfall is 2460 mm.
400
25
30
25
30
300
200
100
0
400
300
200
100
0J F M A M J J A S O N D
rainfall/ mm
rainfall/ mm
averagemonthly
temperature/ °C
averagemonthly
temperature/ °C
annual total 2460 mm
month
(i) Complete the graph to show that rainfall in October was 190 mm. [1]
(ii) Describe the annual distribution of rainfall shown in the graph.
...........................................................................................................................................
...........................................................................................................................................
...........................................................................................................................................
.......................................................................................................................................[2]
(iii) Use the graph and your own knowledge to describe how this climate has both advantages and disadvantages for human activities.
advantages ........................................................................................................................
...........................................................................................................................................
...........................................................................................................................................
...........................................................................................................................................
disadvantages ...................................................................................................................
...........................................................................................................................................
...........................................................................................................................................
.......................................................................................................................................[3]
7
5014/12/M/J/16© UCLES 2016 [Turn over
(b) (i) Give reasons why it is difficult to grow crops in the tundra climate.
...........................................................................................................................................
...........................................................................................................................................
...........................................................................................................................................
.......................................................................................................................................[2]
(ii) Describe an artificial environment that would allow crops to grow in the tundra climate.
...........................................................................................................................................
...........................................................................................................................................
...........................................................................................................................................
.......................................................................................................................................[2]
8
5014/12/M/J/16© UCLES 2016
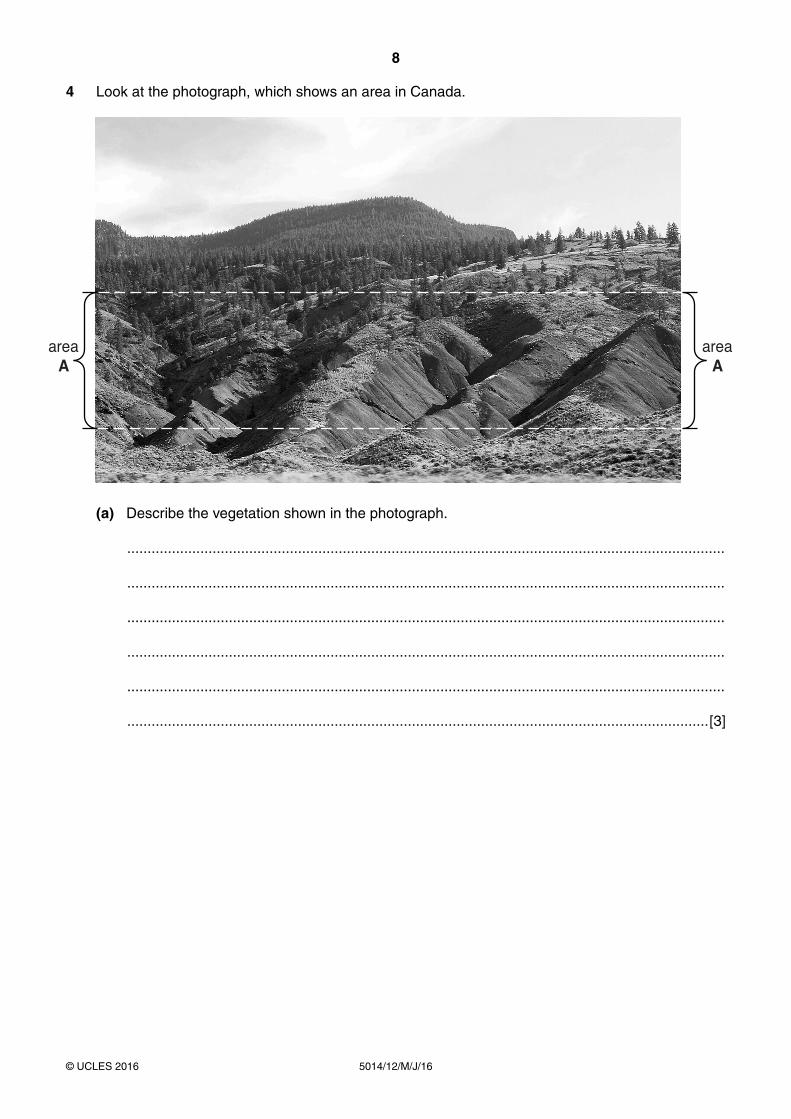
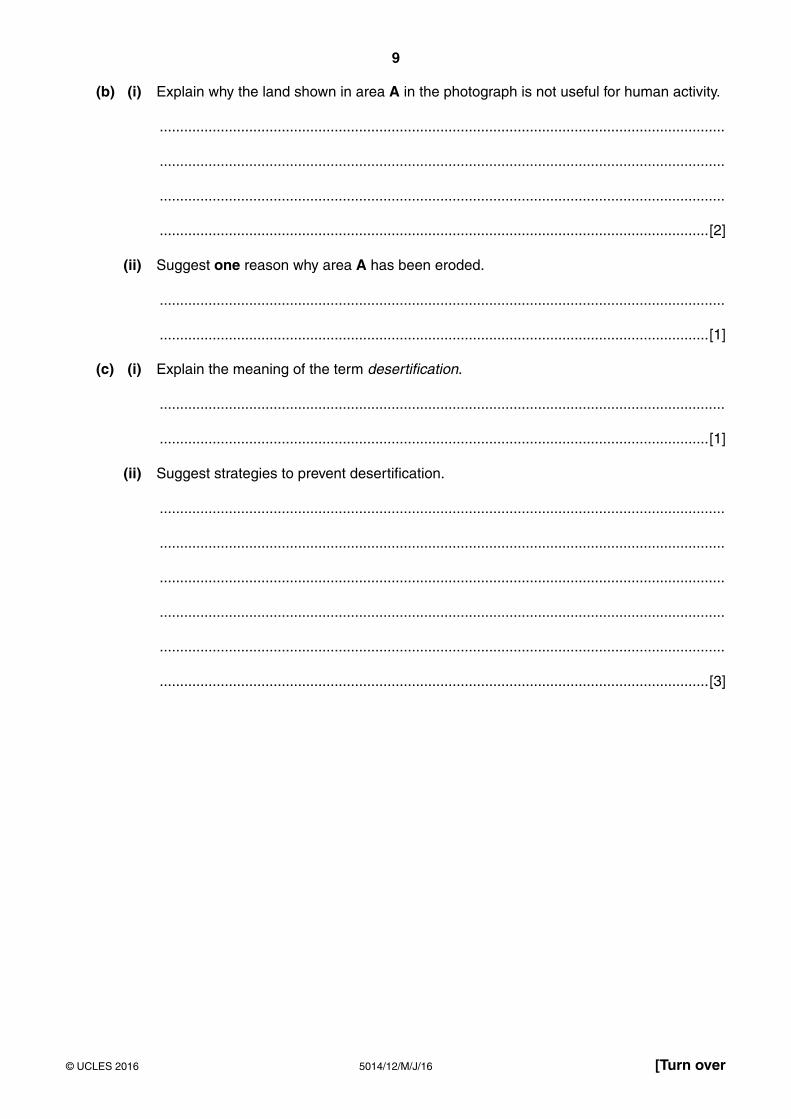
4 Look at the photograph, which shows an area in Canada.
areaA
areaA
(a) Describe the vegetation shown in the photograph.
...................................................................................................................................................
...................................................................................................................................................
...................................................................................................................................................
...................................................................................................................................................
...................................................................................................................................................
...............................................................................................................................................[3]
9
5014/12/M/J/16© UCLES 2016 [Turn over
(b) (i) Explain why the land shown in area A in the photograph is not useful for human activity.
...........................................................................................................................................
...........................................................................................................................................
...........................................................................................................................................
.......................................................................................................................................[2]
(ii) Suggest one reason why area A has been eroded.
...........................................................................................................................................
.......................................................................................................................................[1]
(c) (i) Explain the meaning of the term desertification.
...........................................................................................................................................
.......................................................................................................................................[1]
(ii) Suggest strategies to prevent desertification.
...........................................................................................................................................
...........................................................................................................................................
...........................................................................................................................................
...........................................................................................................................................
...........................................................................................................................................
.......................................................................................................................................[3]
10
5014/12/M/J/16© UCLES 2016
Section B
Answer both questions.
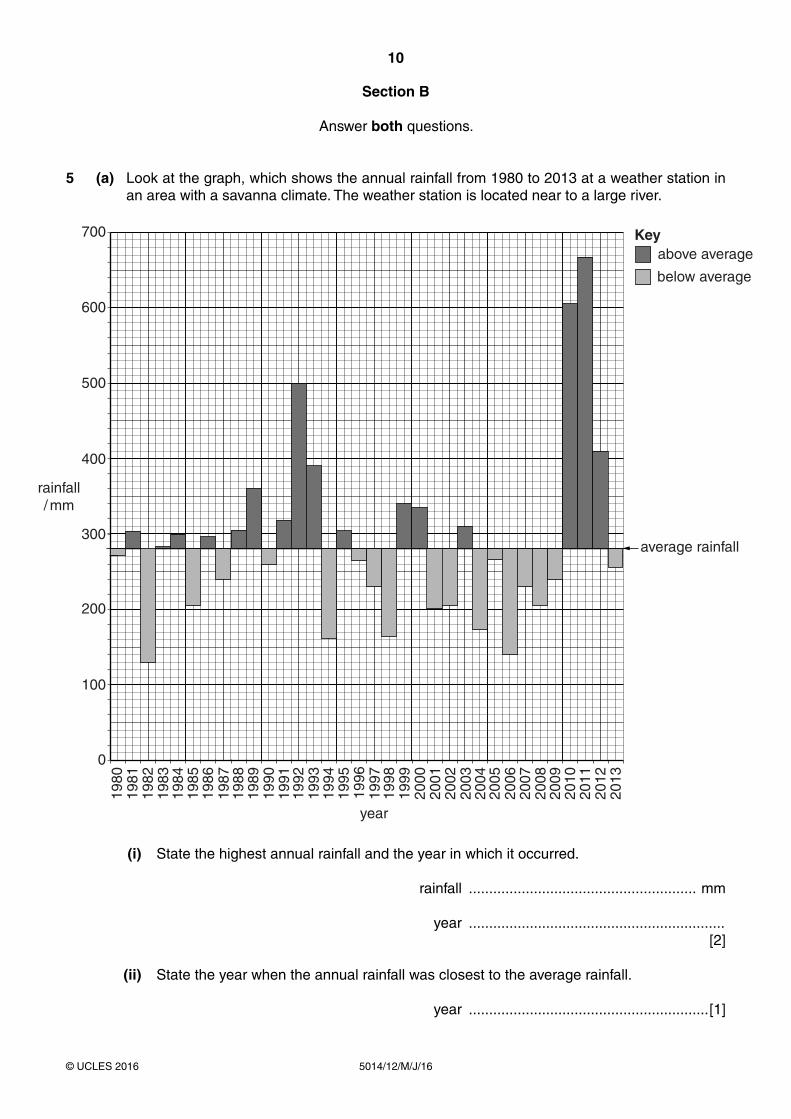
5 (a) Look at the graph, which shows the annual rainfall from 1980 to 2013 at a weather station in an area with a savanna climate. The weather station is located near to a large river.
100
0
1980
1981
1982
1983
1984
1985
1986
1987
1988
1989
1990
1991
1992
1993
1994
1995
1996
1997
1998
1999
2000
2001
2002
2003
2004
2005
2006
2007
2008
2009
2010
2011
2012
2013
200
300
400
500
600
700 Key
year
rainfall/ mm
below average
above average
average rainfall
(i) State the highest annual rainfall and the year in which it occurred.
rainfall ........................................................ mm
year ............................................................... [2]
(ii) State the year when the annual rainfall was closest to the average rainfall.
year ...........................................................[1]
11
5014/12/M/J/16© UCLES 2016 [Turn over
(iii) State the number of years that rainfall was below average over the period shown on the graph.
................................................. years [1]
(iv) Suggest one problem the people close to the river may have experienced in 2010 and 2011.
...........................................................................................................................................
.......................................................................................................................................[1]
(b) The weather station is in an agricultural area. The land close to the river is used for intensive fruit and vegetable farming. The land away from the river is used for extensive cattle farming.
(i) Explain why the land close to the river is used for intensive fruit and vegetable farming, but the land further away is used for extensive cattle farming.
...........................................................................................................................................
...........................................................................................................................................
...........................................................................................................................................
.......................................................................................................................................[2]
(ii) Describe two problems for cattle farmers from the year 2004 until 2009.
...........................................................................................................................................
...........................................................................................................................................
...........................................................................................................................................
.......................................................................................................................................[2]
(iii) Explain why soil erosion occurred during 2010.
...........................................................................................................................................
...........................................................................................................................................
...........................................................................................................................................
...........................................................................................................................................
...........................................................................................................................................
...........................................................................................................................................
...........................................................................................................................................
.......................................................................................................................................[4]
12
5014/12/M/J/16© UCLES 2016
(iv) The fruit and vegetable farmers use large quantities of fertilisers. Describe the problems that these may cause for the environment.
...........................................................................................................................................
...........................................................................................................................................
...........................................................................................................................................
...........................................................................................................................................
...........................................................................................................................................
...........................................................................................................................................
...........................................................................................................................................
.......................................................................................................................................[4]
(v) Suggest how farming in this area could be made more sustainable.
...........................................................................................................................................
...........................................................................................................................................
...........................................................................................................................................
...........................................................................................................................................
...........................................................................................................................................
.......................................................................................................................................[3]
13
5014/12/M/J/16© UCLES 2016 [Turn over
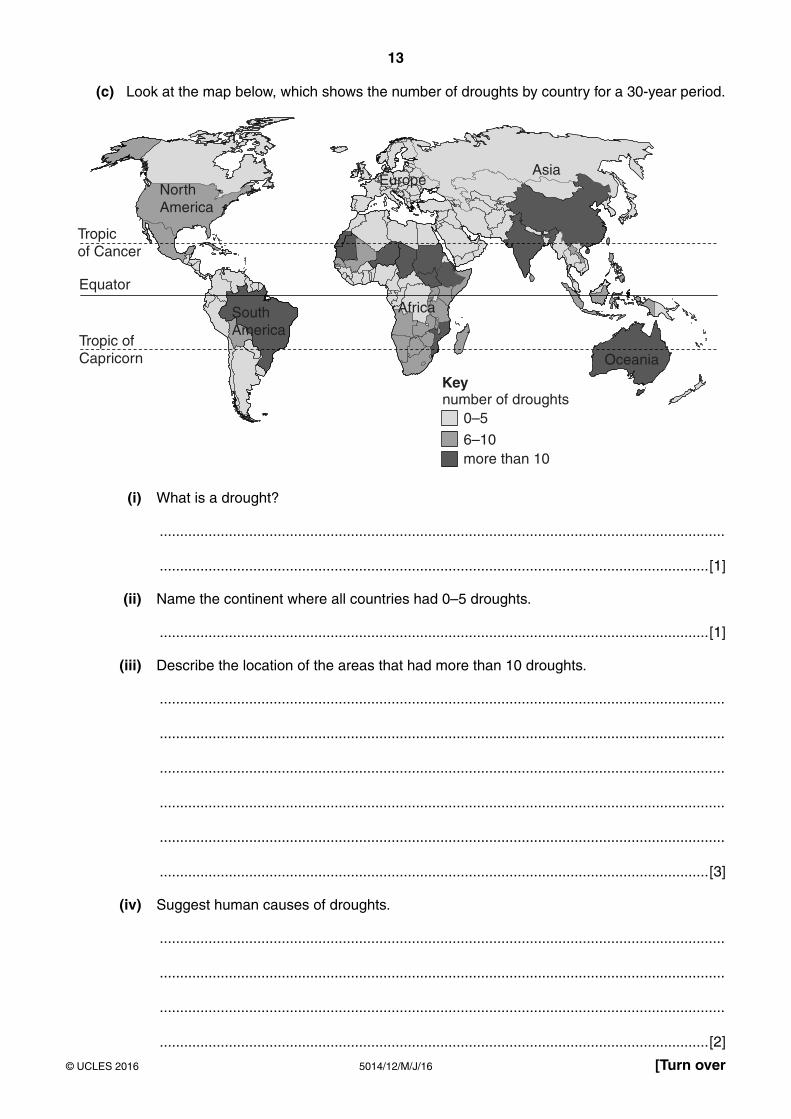
(c) Look at the map below, which shows the number of droughts by country for a 30-year period.
Equator
Tropic ofCapricorn
Tropicof Cancer
Asia
Africa
Oceania
EuropeNorthAmerica
SouthAmerica
more than 10
Keynumber of droughts
6–10
0–5
(i) What is a drought?
...........................................................................................................................................
.......................................................................................................................................[1]
(ii) Name the continent where all countries had 0–5 droughts.
.......................................................................................................................................[1]
(iii) Describe the location of the areas that had more than 10 droughts.
...........................................................................................................................................
...........................................................................................................................................
...........................................................................................................................................
...........................................................................................................................................
...........................................................................................................................................
.......................................................................................................................................[3]
(iv) Suggest human causes of droughts.
...........................................................................................................................................
...........................................................................................................................................
...........................................................................................................................................
.......................................................................................................................................[2]
14
5014/12/M/J/16© UCLES 2016
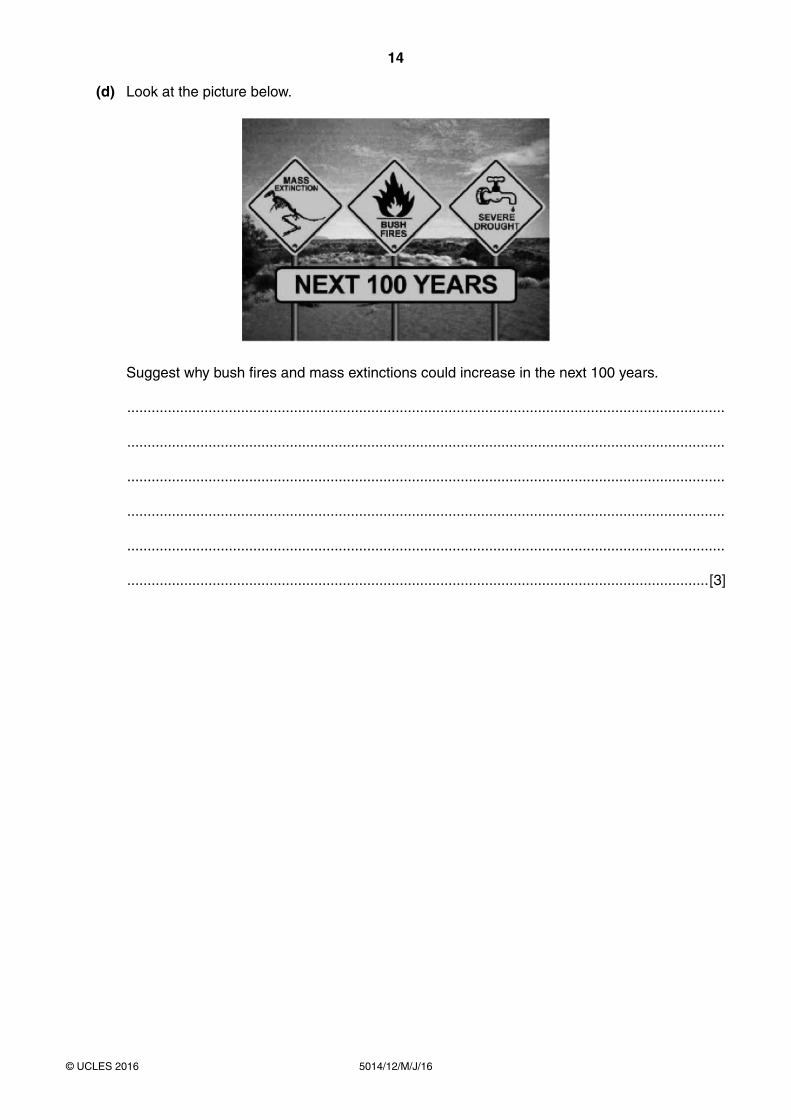
(d) Look at the picture below.
Suggest why bush fires and mass extinctions could increase in the next 100 years.
...................................................................................................................................................
...................................................................................................................................................
...................................................................................................................................................
...................................................................................................................................................
...................................................................................................................................................
...............................................................................................................................................[3]
15
5014/12/M/J/16© UCLES 2016 [Turn over
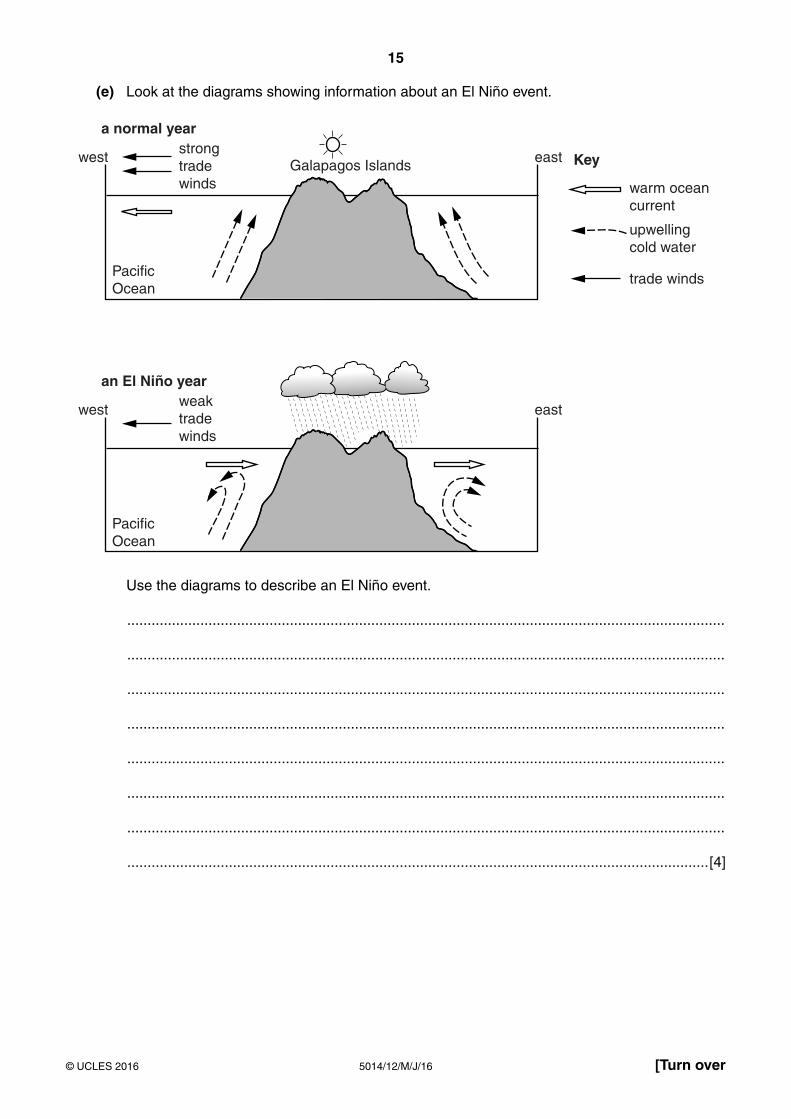
(e) Look at the diagrams showing information about an El Niño event.
a normal year
west eaststrongtradewinds warm ocean
current
upwellingcold water
trade winds
Galapagos Islands Key
PacificOcean
an El Niño year
west eastweaktradewinds
PacificOcean
Use the diagrams to describe an El Niño event.
...................................................................................................................................................
...................................................................................................................................................
...................................................................................................................................................
...................................................................................................................................................
...................................................................................................................................................
...................................................................................................................................................
...................................................................................................................................................
...............................................................................................................................................[4]
16
5014/12/M/J/16© UCLES 2016
(f) ‘Cyclones are the most damaging climatic hazards.’ How far do you agree with this statement? Give reasons for your answer.
...................................................................................................................................................
...................................................................................................................................................
...................................................................................................................................................
...................................................................................................................................................
...................................................................................................................................................
...................................................................................................................................................
...................................................................................................................................................
...................................................................................................................................................
...................................................................................................................................................
...................................................................................................................................................
...................................................................................................................................................
...............................................................................................................................................[6]
17
5014/12/M/J/16© UCLES 2016 [Turn over
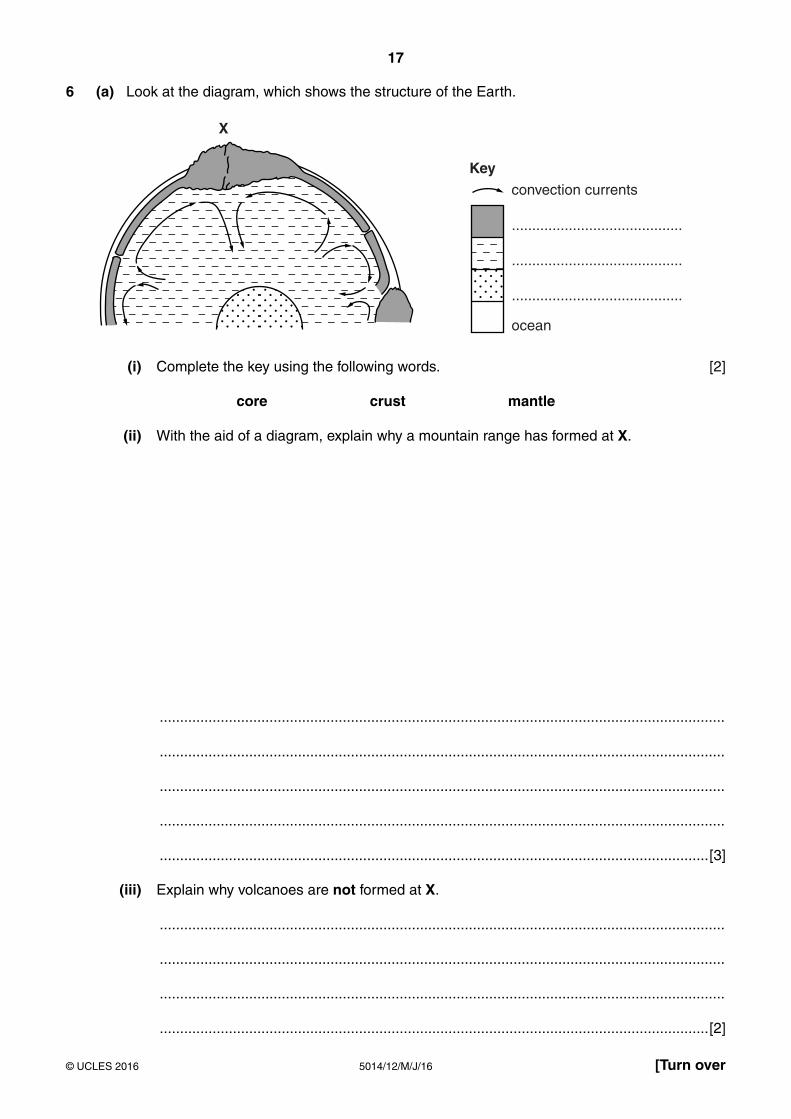
6 (a) Look at the diagram, which shows the structure of the Earth.
X
Key
..........................................
..........................................
..........................................
ocean
convection currents
(i) Complete the key using the following words. [2]
core crust mantle
(ii) With the aid of a diagram, explain why a mountain range has formed at X.
...........................................................................................................................................
...........................................................................................................................................
...........................................................................................................................................
...........................................................................................................................................
.......................................................................................................................................[3]
(iii) Explain why volcanoes are not formed at X.
...........................................................................................................................................
...........................................................................................................................................
...........................................................................................................................................
.......................................................................................................................................[2]
18
5014/12/M/J/16© UCLES 2016
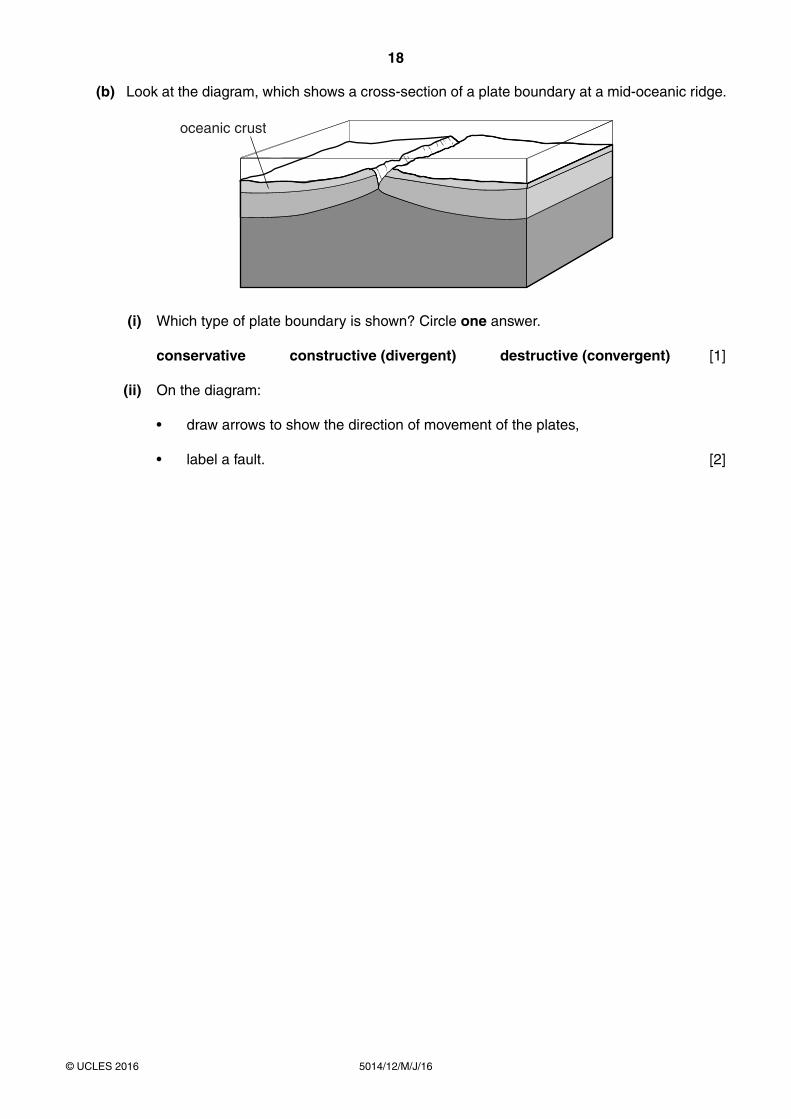
(b) Look at the diagram, which shows a cross-section of a plate boundary at a mid-oceanic ridge.
oceanic crust
(i) Which type of plate boundary is shown? Circle one answer.
conservative constructive (divergent) destructive (convergent) [1]
(ii) On the diagram:
• draw arrows to show the direction of movement of the plates,
• label a fault. [2]
19
5014/12/M/J/16© UCLES 2016 [Turn over
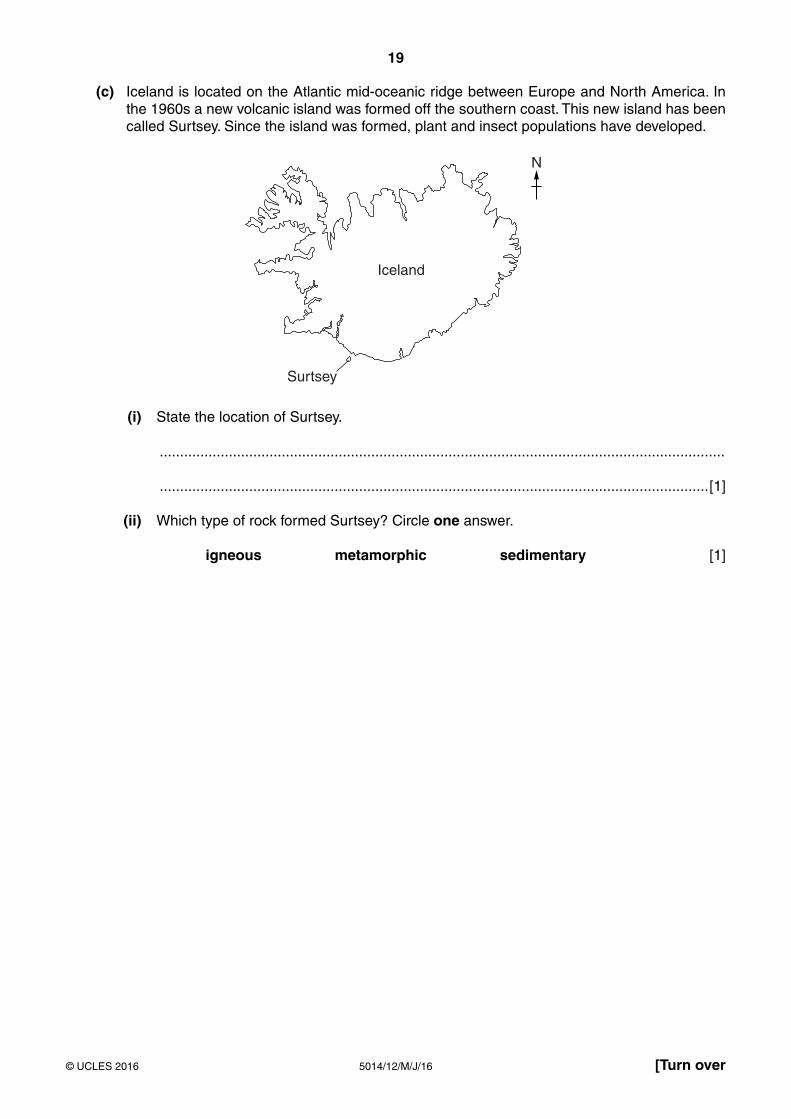
(c) Iceland is located on the Atlantic mid-oceanic ridge between Europe and North America. In the 1960s a new volcanic island was formed off the southern coast. This new island has been called Surtsey. Since the island was formed, plant and insect populations have developed.
N
Surtsey
Iceland
(i) State the location of Surtsey.
...........................................................................................................................................
.......................................................................................................................................[1]
(ii) Which type of rock formed Surtsey? Circle one answer.
igneous metamorphic sedimentary [1]
20
5014/12/M/J/16© UCLES 2016
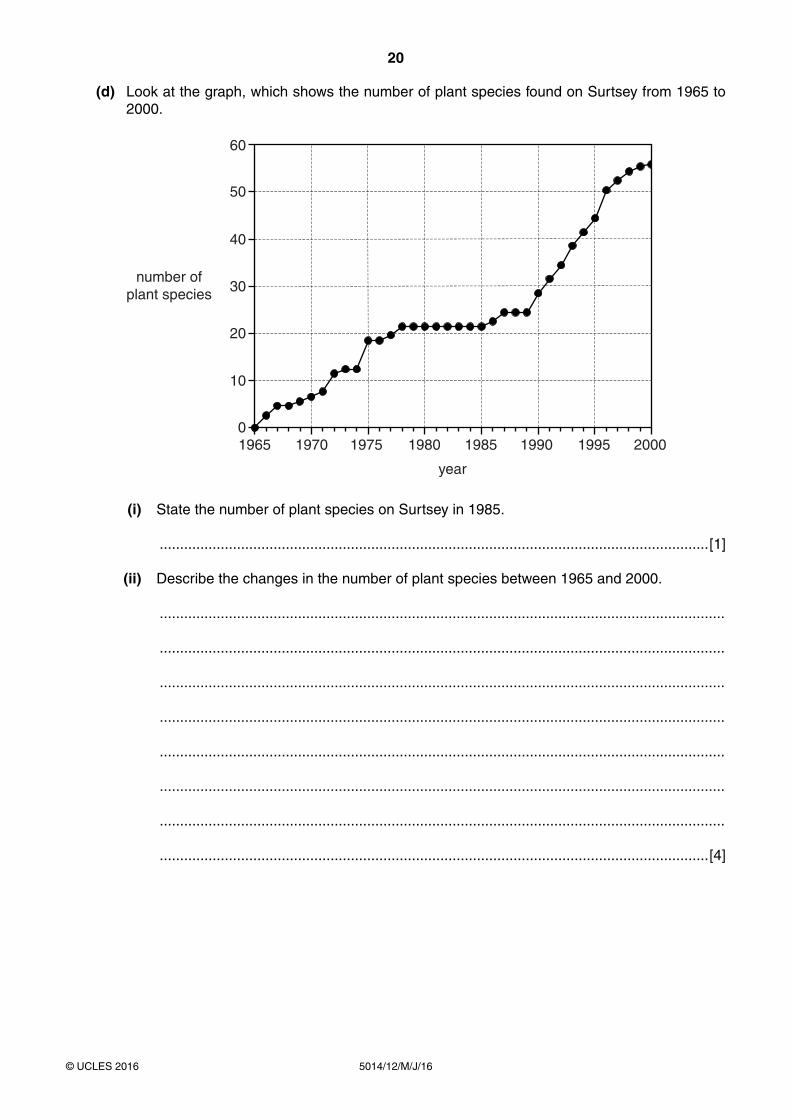
(d) Look at the graph, which shows the number of plant species found on Surtsey from 1965 to 2000.
number ofplant species
0
10
20
30
40
50
60
1965 1970 1975 1980 1985 1990 1995 2000
year
(i) State the number of plant species on Surtsey in 1985.
.......................................................................................................................................[1]
(ii) Describe the changes in the number of plant species between 1965 and 2000.
...........................................................................................................................................
...........................................................................................................................................
...........................................................................................................................................
...........................................................................................................................................
...........................................................................................................................................
...........................................................................................................................................
...........................................................................................................................................
.......................................................................................................................................[4]
21
5014/12/M/J/16© UCLES 2016 [Turn over
(iii) A colony of seabirds started nesting on the island in 1989. Suggest ways the seabirds affected the number of plant species found on Surtsey.
...........................................................................................................................................
...........................................................................................................................................
...........................................................................................................................................
...........................................................................................................................................
...........................................................................................................................................
.......................................................................................................................................[3]
(iv) Explain the meaning of the term vegetational succession.
...........................................................................................................................................
...........................................................................................................................................
...........................................................................................................................................
.......................................................................................................................................[2]
22
5014/12/M/J/16© UCLES 2016
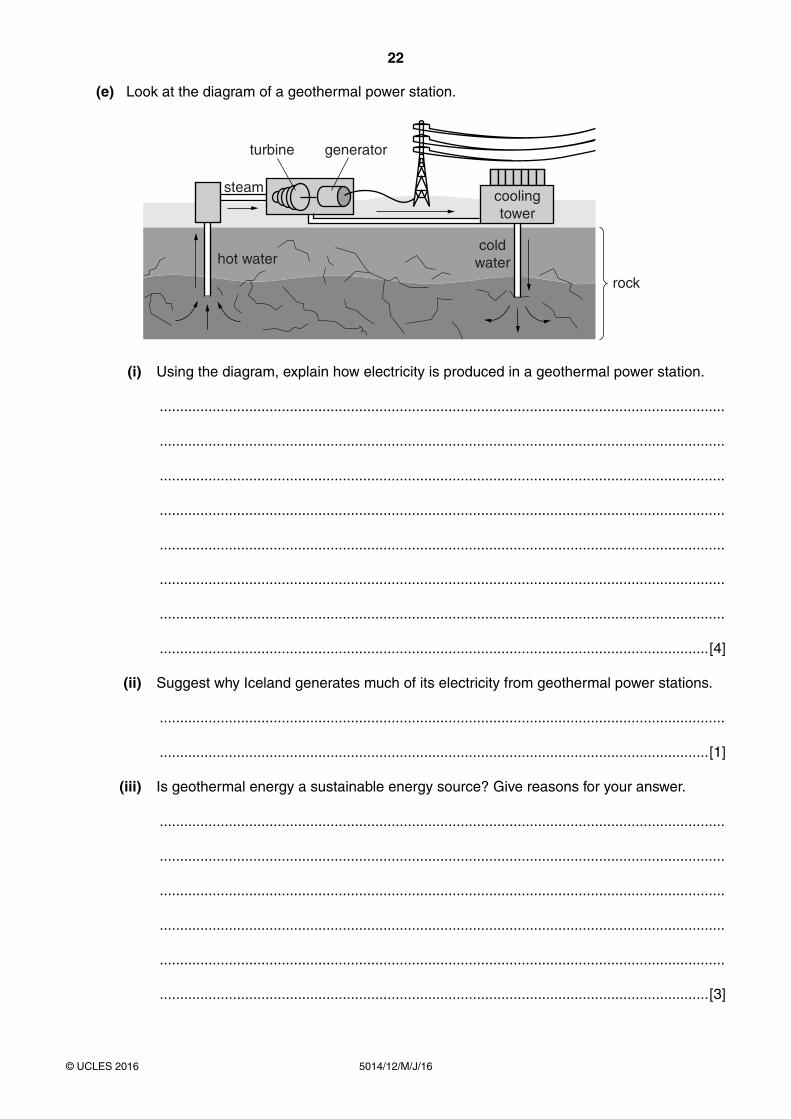
(e) Look at the diagram of a geothermal power station.
hot watercold
water
steam
turbine generator
coolingtower
rock
(i) Using the diagram, explain how electricity is produced in a geothermal power station.
...........................................................................................................................................
...........................................................................................................................................
...........................................................................................................................................
...........................................................................................................................................
...........................................................................................................................................
...........................................................................................................................................
...........................................................................................................................................
.......................................................................................................................................[4]
(ii) Suggest why Iceland generates much of its electricity from geothermal power stations.
...........................................................................................................................................
.......................................................................................................................................[1]
(iii) Is geothermal energy a sustainable energy source? Give reasons for your answer.
...........................................................................................................................................
...........................................................................................................................................
...........................................................................................................................................
...........................................................................................................................................
...........................................................................................................................................
.......................................................................................................................................[3]
23
5014/12/M/J/16© UCLES 2016
(iv) Much of the world’s electricity is generated using fossil fuels. Explain why environmental groups want to reduce the use of fossil fuels.
...........................................................................................................................................
...........................................................................................................................................
...........................................................................................................................................
...........................................................................................................................................
...........................................................................................................................................
...........................................................................................................................................
...........................................................................................................................................
.......................................................................................................................................[4]
(f) Are the advantages of living in an area of active volcanoes greater than the disadvantages? Give reasons for your answer.
...................................................................................................................................................
...................................................................................................................................................
...................................................................................................................................................
...................................................................................................................................................
...................................................................................................................................................
...................................................................................................................................................
...................................................................................................................................................
...................................................................................................................................................
...................................................................................................................................................
...................................................................................................................................................
...................................................................................................................................................
...............................................................................................................................................[6]
24
5014/12/M/J/16© UCLES 2016
Permission to reproduce items where third-party owned material protected by copyright is included has been sought and cleared where possible. Every reasonable effort has been made by the publisher (UCLES) to trace copyright holders, but if any items requiring clearance have unwittingly been included, the publisher will be pleased to make amends at the earliest possible opportunity.
To avoid the issue of disclosure of answer-related information to candidates, all copyright acknowledgements are reproduced online in the Cambridge International Examinations Copyright Acknowledgements Booklet. This is produced for each series of examinations and is freely available to download at www.cie.org.uk after the live examination series.
Cambridge International Examinations is part of the Cambridge Assessment Group. Cambridge Assessment is the brand name of University of Cambridge Local Examinations Syndicate (UCLES), which is itself a department of the University of Cambridge.
BLANK PAGE