Embed Size (px)
Citation preview
Funding was made available through the Agriculture and Food Council, which is responsible for delivering Agriculture and Agri‐Food Canada's Advancing Canadian Agriculture and Agri‐Food (ACAAF) Program in Alberta, the Alberta Beef Producers, Ontario Cattlemen’s Association, and Canfax Research Services. We gratefully acknowledge Brenna Grant and Andrea Brocklebank for assistance in this project as well as feedlots that provided transaction data necessary to complete this study.
Canadian‐US Basis for Cash Fed Cattle & Impacts from Government Regulations 1
Executive summary
Background
Historically, U.S. packing plants have been an important market outlet for Canadian fed cattle because Canadian producers finished more cattle than their domestic slaughter capacity and excess slaughter capacity has persisted for a long time in the U.S. As a result, nearly 1 million head of cattle were exported from Canada to the U.S. annually in what were highly integrated markets. Because of the importance of the U.S. market for Canadian cattle, feeders regularly compare Canadian and U.S. cattle prices. Cash fed cattle basis between Canadian and U.S. markets has been the primary barometer Canadian cattle feeders monitor when assessing when and where to sell their cattle. The cash basis, such as Alberta fed cattle price minus the Nebraska fed cattle price adjusted for exchange rate, has shown extreme volatility in recent years. The variation in cash fed cattle basis has been driven by policy changes in both Canada and the U.S. affecting cattle and beef trade as well as changing market fundamentals in the two countries. Increased cash basis variability has elevated the importance of understanding the nature of the variation. The purpose of this study was to quantify Canadian cash fed cattle to Nebraska cash fed cattle basis determinants.
Objectives
The overarching goal of this project was to estimate determinants of Canadian to U.S. cash market fed cattle basis. Particular focus included quantifying how changing local market fundamentals in Canada and the U.S. affect cash market fed cattle basis. In addition, the study determines how a variety of policies enacted both in Canada and the U.S., affecting cattle and beef trade, has affected relative fed cattle prices across the two countries.
Procedure
To accomplish the objectives of this study, we collected detailed data on weekly aggregate Alberta and Ontario fed cattle prices and compared these to Nebraska direct fed steer prices over the 1998 ‐ June 2009 period. A separate data collection effort was undertaken to collect data on 4,067 individual fed cattle transactions from selected feedlots in the Alberta region and compare the transaction prices to the Nebraska direct fed steer prices over the 2006 – April 2009 period. Econometric models were constructed and estimated to determine how market fundamentals and selected policies affected cash basis calculated using each of the weekly aggregate and the individual transactions price series.
Canadian‐US Basis for Cash Fed Cattle & Impacts from Government Regulations 2
Findings
Weekly aggregate Alberta and Ontario fed cattle basis has experienced substantial variation over time reflecting both changing market fundamentals and policy changes. Especially notable basis decay occurred when the U.S. market was closed to Canadian fed cattle and beef following the 2003 BSE discovery in Canada when basis went from around ‐$7/cwt to ‐$80/cwt for a short time and remained below ‐$30/cwt for nearly two years.
Since recovery from the BSE and subsequent market reopening, Alberta and Ontario basis relative to Nebraska has returned to more stable levels, but at what appear to be weaker than before the market closure, with fed cattle basis ranging on average around ‐$8/cwt to ‐10/cwt. In addition, basis since the border closure recovery period is considerably more variable than prior to the border closing. This wider and more variable basis in recent years relative to prior to border closing is likely associated with generally more volatile markets and increased inspection and customs fees and transportation costs associated with exporting live animals to the U.S.
Econometric models of weekly aggregate basis illustrate sensitivity to the time period included in the analysis. Part of the sensitivity is because substantial structural change in Canadian fed cattle markets has taken place over the past decade. Part of the sensitivity is also because different policy environments that significantly affected Canadian fed cattle cash market basis and basis determinants lasted over relatively short time periods. Having short time periods with stable market structure makes statistical estimation using weekly aggregate data not particularly robust.
Weekly aggregate basis declined on average by about $14/cwt to $23/cwt as result of the border closure; rebounded by about $11/cwt following re‐establishment of boneless beef exports to the U.S.; increased by about $5/cwt in Alberta following enactment of Rule 2 which opened the border to beef and live cattle trade; and weakened again by roughly $1.40/cwt to $3.60/cwt following enactment of mandatory country of origin labeling in the U.S.
Econometric models of feedlot transaction basis were statistically more robust than the aggregate weekly basis analysis because substantially larger numbers of observations were available in the transaction data. As a result, the transaction data provide us with greater statistical confidence in particular coefficient estimates.
Numerous characteristics of individual lots of fed cattle affect transaction basis. For example, the number of head in a lot, the dressed weight of cattle, the distance from the feedlot to the packing plant, the feedlot selling cattle, and the packer buying cattle all were statistically significant and economically important basis determinants for
Canadian‐US Basis for Cash Fed Cattle & Impacts from Government Regulations 3
individual sales. Transaction basis declined by $0.79/cwt following enactment of the July 2007 enhanced feed ban in Canada. Basis strengthened by $3.83/cwt following the November 2007 approval of Rule 2 further opening the U.S. border to Canadian beef and live cattle. Finally, transaction basis weakened by $2.15/cwt following enactment of mandatory country of origin labeling in the U.S.
Implications
Fed cattle basis in Canada has become more volatile in recent times as a result of more dynamic market fundamentals across the two countries affecting fed cattle prices. Much as markets in general have become more volatile, so have spatial fed cattle market price relationships. This means that monitoring opportunities to sell cattle to U.S. plants, relative to added costs to export animals, has increased in importance. Furthermore, the opportunities for cattle exports might best be monitored on a transaction level in addition to watching weekly aggregate cash basis quotes.
Increased basis variability suggests basis forecasting is going to be more difficult under current market conditions than it used to be. This is a reality of new market fundamentals and trade policy. This means greater basis risk is present for Canadian cattle feeders than they have been accustomed to in the past. Basis level and variability are related to each other as higher basis variability contributes to basis widening because basis level in part reflects risk.
Policies affecting cattle and beef trade flows with the U.S., domestic regulations affecting beef processing in Canada, and mandatory country of origin labeling in the U.S. have economically important effects on Canadian fed cattle cash market basis. Maintaining unrestricted beef and cattle trade with the U.S. and not burdening Canadian beef packers with costly regulations relative to U.S. packers will help support basis. At any rate, these impacts must be understood as policies are debated and as mitigation strategies are designed.
On‐going basis analysis and modeling is recommended. We especially see value in regularly updating feedlot transaction data basis analysis to better monitor basis movement and to determine impacts of changes occurring in the Canadian relative to U.S. fed cattle markets. Maintaining such a data bank can greatly facilitate analysis of on‐going developments and provide a foundation for improved basis forecasting.
Canadian‐US Basis for Cash Fed Cattle & Impacts from Government Regulations 4
Introduction and Objectives
Exports of fed cattle and beef to the U.S. are important to Canada and Canadian beef producers (Klein, McGivern, and Grier 2006). In May 2003, Canadian‐U.S. trade and trade relations changed immensely when the first case of BSE (bovine spongiform encephalopathy) was found in Canada and the U.S. government closed the Canadian‐U.S. border to all cattle and beef movement. The reduction of exports from Canada to the United States had an adverse affect on Canadian slaughter prices. The loss of export markets for cattle resulted in decreased demand for Canadian fed cattle and led to an excess supply of fed cattle on the domestic market. “As a result Canadian fed cattle prices declined 65 percent from $108/cwt in April 2003 to $38/cwt in July 2003” (CanFax 2009).
Prior to the BSE case, the two countries’ cattle feeding and meat packing industries were highly integrated. Annually nearly one million head of Canadian cattle were exported to the U.S. prior to the border closure (LMIC 2009). Following the border closing, market integration eroded sharply (Miljkovic 2007; Rude, Carlberg, and Pellow 2007; Church and Gordon 2007). Still, marketing and pricing practices in the two countries by cattle feeders and meat packers both before and after the border closing are similar (Ward, Carlberg, and Brocklebank 2007). Similar, too, are perceptions of cattle feeders toward marketing and pricing practices and proposed solutions to marketing and pricing issues.
A key factor affecting trade in fed cattle is the cash market basis, or difference, between cash fed cattle prices in Canada and the U.S. (Schroeder and Ward 2006). Cattle feeders monitor basis closely in evaluating competing bids from Canadian and U.S. packers. However, explaining basis, especially if the goal is forecasting basis ex ante, is difficult (Tomek 1997).
The objectives of this report are two‐fold. The first objective is to determine factors affecting the Canadian‐U.S. fed cattle cash market price difference (referred to as basis). To accomplish this objective, we employ two approaches. The first approach determines factors affecting historical weekly aggregate market‐level basis and the second approach quantifies factors affecting basis for recent individual transaction prices between feedlots in Canada and packers. The second objective is to determine the effect from governmental policy changes since the 2003 Canadian border closing on the Canadian‐U.S. fed cattle basis. The impacts of policy changes are estimated for both weekly aggregate and transaction data analyses.
Canadian‐US Basis for Cash Fed Cattle & Impacts from Government Regulations 5
Two different data sets are used to determine the amount of basis variation present in the weekly aggregate market compared to individual transactions. Feedlots are interested in basis variation for individual transactions as they negotiate sale prices. Whereas, understanding aggregate market‐level basis determinants are useful for monitoring overall market pricing patterns. Because the two data sets analyzed are closely related, for overlapping time periods, we expect similar impacts of factors affecting overall market conditions on basis estimates using both data sets. In contrast, how characteristics of individual sale lots, feedlots, and packers affect basis can only be discerned from analysis of transaction data. So, the two different basis analyses (weekly aggregate and transaction data) provide an opportunity to both assess robustness of selected findings as well as identify variation in basis determinants using different levels of data aggregation. Understanding basis determinants will provide increased information Canadian cattle producers can use to assess packer bids, make more informed cattle marketing decisions, manage risk, and provide market surveillance and assessment of Canadian fed cattle market conditions. Furthermore, more informed policy changes can be made in light of understanding impacts of enacted policies on basis.
Background
Basis between U.S. and Canadian cash fed cattle prices is used as a barometer of fed cattle prices in Canada because cattle feeders in Canada sell sizeable amounts of fed cattle to packing plants located in the U.S. (Schroeder and Ward 2006). As described later in the data sections, our weekly aggregate basis analysis examines both the Alberta‐Nebraska and Ontario‐Nebraska fed cattle basis for the years 1998‐ June 2009. Our transaction data analysis focuses on Alberta‐Nebraska fed cattle transaction basis for the January 2006‐April 2009 period.
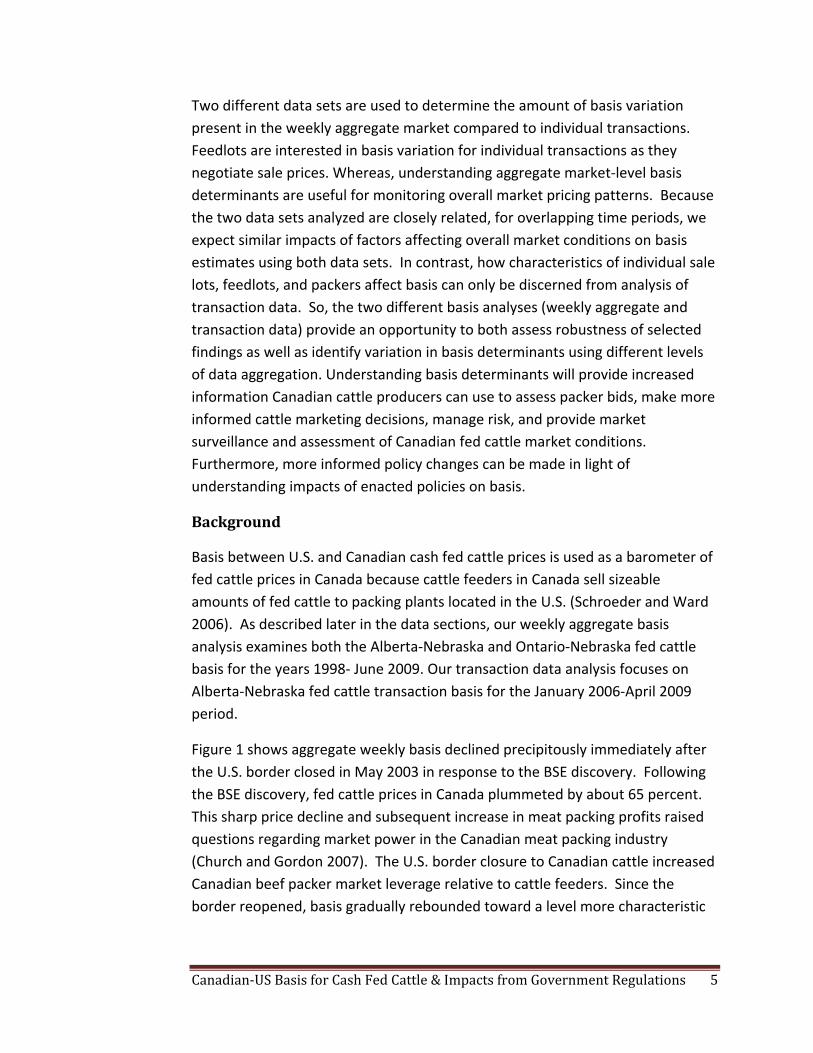
Figure 1 shows aggregate weekly basis declined precipitously immediately after the U.S. border closed in May 2003 in response to the BSE discovery. Following the BSE discovery, fed cattle prices in Canada plummeted by about 65 percent. This sharp price decline and subsequent increase in meat packing profits raised questions regarding market power in the Canadian meat packing industry (Church and Gordon 2007). The U.S. border closure to Canadian cattle increased Canadian beef packer market leverage relative to cattle feeders. Since the border reopened, basis gradually rebounded toward a level more characteristic
Canadian‐US Basis for Cash Fed Cattle & Impacts from Government Regulations 6
of prior to the border closing. However, cash fed cattle basis has exhibited considerable and unprecedented variability over the study period.
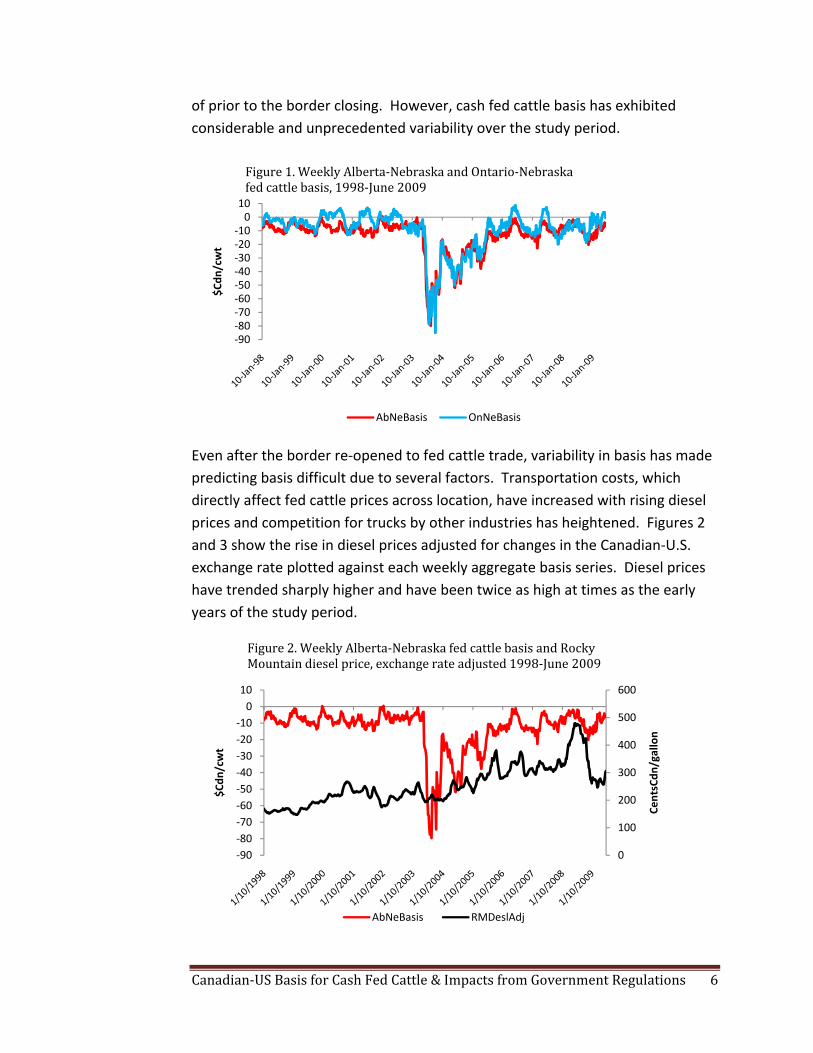
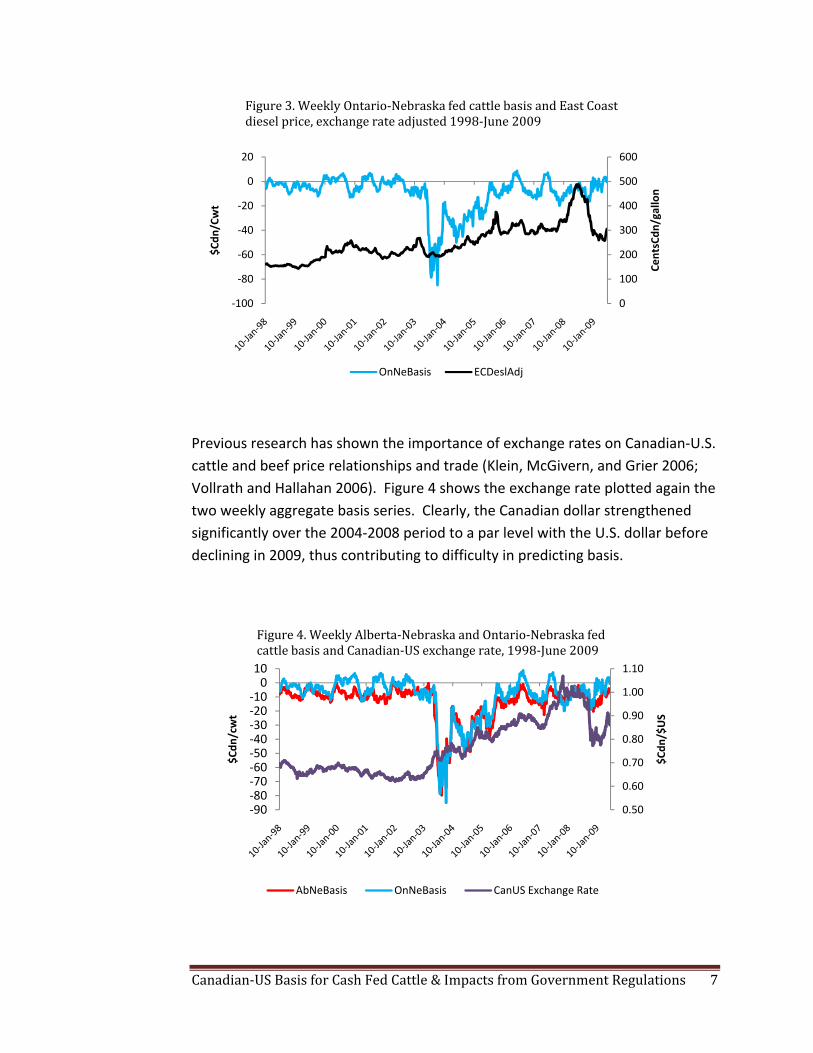
Even after the border re‐opened to fed cattle trade, variability in basis has made predicting basis difficult due to several factors. Transportation costs, which directly affect fed cattle prices across location, have increased with rising diesel prices and competition for trucks by other industries has heightened. Figures 2 and 3 show the rise in diesel prices adjusted for changes in the Canadian‐U.S. exchange rate plotted against each weekly aggregate basis series. Diesel prices have trended sharply higher and have been twice as high at times as the early years of the study period.
‐90‐80‐70‐60‐50‐40‐30‐20‐10010
$Cdn
/cwt
Figure 1. Weekly Alberta‐Nebraska and Ontario‐Nebraska fed cattle basis, 1998‐June 2009
AbNeBasis OnNeBasis
0
100
200
300
400
500
600
‐90‐80‐70‐60‐50‐40‐30‐20‐10010
CentsCdn
/gallon
$Cdn
/cwt
Figure 2. Weekly Alberta‐Nebraska fed cattle basis and Rocky Mountain diesel price, exchange rate adjusted 1998‐June 2009
AbNeBasis RMDeslAdj
Canadian‐US Basis for Cash Fed Cattle & Impacts from Government Regulations 7
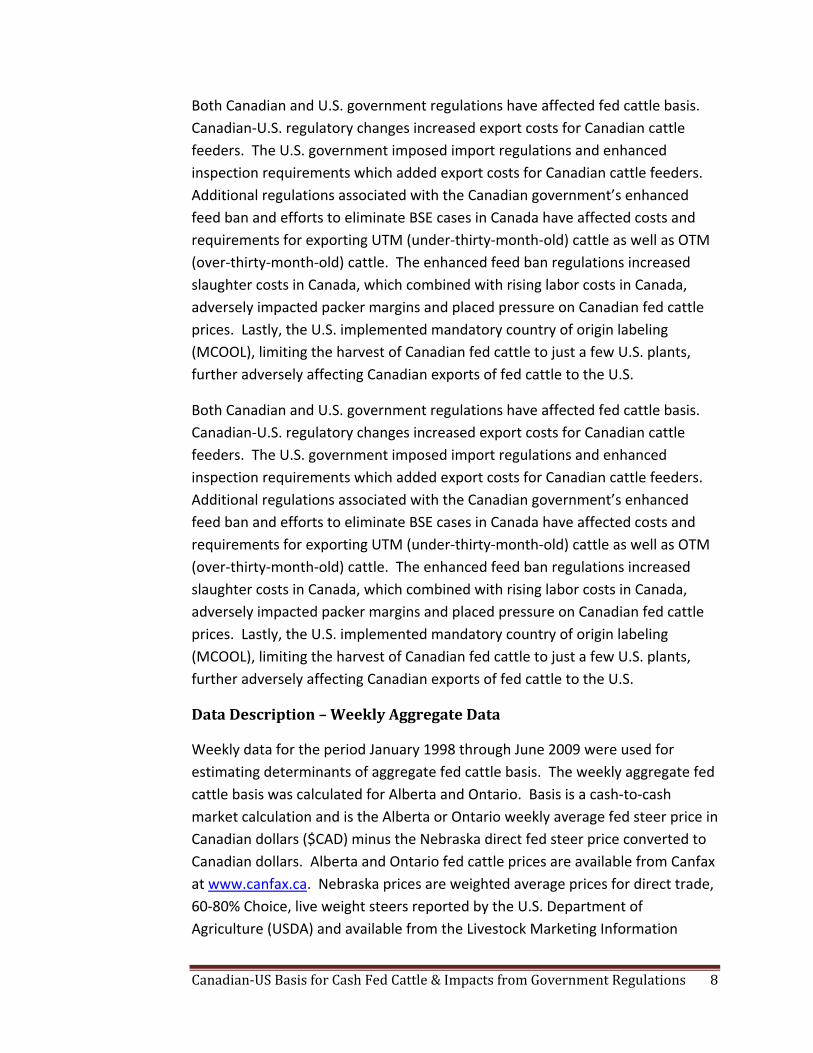
Previous research has shown the importance of exchange rates on Canadian‐U.S. cattle and beef price relationships and trade (Klein, McGivern, and Grier 2006; Vollrath and Hallahan 2006). Figure 4 shows the exchange rate plotted again the two weekly aggregate basis series. Clearly, the Canadian dollar strengthened significantly over the 2004‐2008 period to a par level with the U.S. dollar before declining in 2009, thus contributing to difficulty in predicting basis.
0
100
200
300
400
500
600
‐100
‐80
‐60
‐40
‐20
0
20
CentsCdn
/gallon
$Cdn
/Cwt
Figure 3. Weekly Ontario‐Nebraska fed cattle basis and East Coast diesel price, exchange rate adjusted 1998‐June 2009
OnNeBasis ECDeslAdj
0.50
0.60
0.70
0.80
0.90
1.00
1.10
‐90‐80‐70‐60‐50‐40‐30‐20‐10010
$Cdn
/$US
$Cdn
/cwt
Figure 4. Weekly Alberta‐Nebraska and Ontario‐Nebraska fed cattle basis and Canadian‐US exchange rate, 1998‐June 2009
AbNeBasis OnNeBasis CanUS Exchange Rate
Canadian‐US Basis for Cash Fed Cattle & Impacts from Government Regulations 8
Both Canadian and U.S. government regulations have affected fed cattle basis. Canadian‐U.S. regulatory changes increased export costs for Canadian cattle feeders. The U.S. government imposed import regulations and enhanced inspection requirements which added export costs for Canadian cattle feeders. Additional regulations associated with the Canadian government’s enhanced feed ban and efforts to eliminate BSE cases in Canada have affected costs and requirements for exporting UTM (under‐thirty‐month‐old) cattle as well as OTM (over‐thirty‐month‐old) cattle. The enhanced feed ban regulations increased slaughter costs in Canada, which combined with rising labor costs in Canada, adversely impacted packer margins and placed pressure on Canadian fed cattle prices. Lastly, the U.S. implemented mandatory country of origin labeling (MCOOL), limiting the harvest of Canadian fed cattle to just a few U.S. plants, further adversely affecting Canadian exports of fed cattle to the U.S.
Both Canadian and U.S. government regulations have affected fed cattle basis. Canadian‐U.S. regulatory changes increased export costs for Canadian cattle feeders. The U.S. government imposed import regulations and enhanced inspection requirements which added export costs for Canadian cattle feeders. Additional regulations associated with the Canadian government’s enhanced feed ban and efforts to eliminate BSE cases in Canada have affected costs and requirements for exporting UTM (under‐thirty‐month‐old) cattle as well as OTM (over‐thirty‐month‐old) cattle. The enhanced feed ban regulations increased slaughter costs in Canada, which combined with rising labor costs in Canada, adversely impacted packer margins and placed pressure on Canadian fed cattle prices. Lastly, the U.S. implemented mandatory country of origin labeling (MCOOL), limiting the harvest of Canadian fed cattle to just a few U.S. plants, further adversely affecting Canadian exports of fed cattle to the U.S.
Data Description – Weekly Aggregate Data
Weekly data for the period January 1998 through June 2009 were used for estimating determinants of aggregate fed cattle basis. The weekly aggregate fed cattle basis was calculated for Alberta and Ontario. Basis is a cash‐to‐cash market calculation and is the Alberta or Ontario weekly average fed steer price in Canadian dollars ($CAD) minus the Nebraska direct fed steer price converted to Canadian dollars. Alberta and Ontario fed cattle prices are available from Canfax at www.canfax.ca. Nebraska prices are weighted average prices for direct trade, 60‐80% Choice, live weight steers reported by the U.S. Department of Agriculture (USDA) and available from the Livestock Marketing Information
Canadian‐US Basis for Cash Fed Cattle & Impacts from Government Regulations 9
Center (LMIC) www.lmic.info. Canadian‐U.S. dollar exchange rates are available at the Canfax website.
Additional data in our models include: nearby live cattle futures market prices available from the LMIC website; Rocky Mountain and East Coast diesel prices available from the Energy Information Center at http://tonto.eia.doe.gov/oog/info/wohdp/diesel.asp; regional Federally inspected (FI) steer and heifer slaughter in the U.S. (FI regions 7 and 8 for the northern plains and mountain states and regions 3 and 5 for eastern states) reported by USDA and available from LMIC; regional steer and heifer slaughter in Canada from Canfax; and regional slaughter capacity in Canada from Canfax.
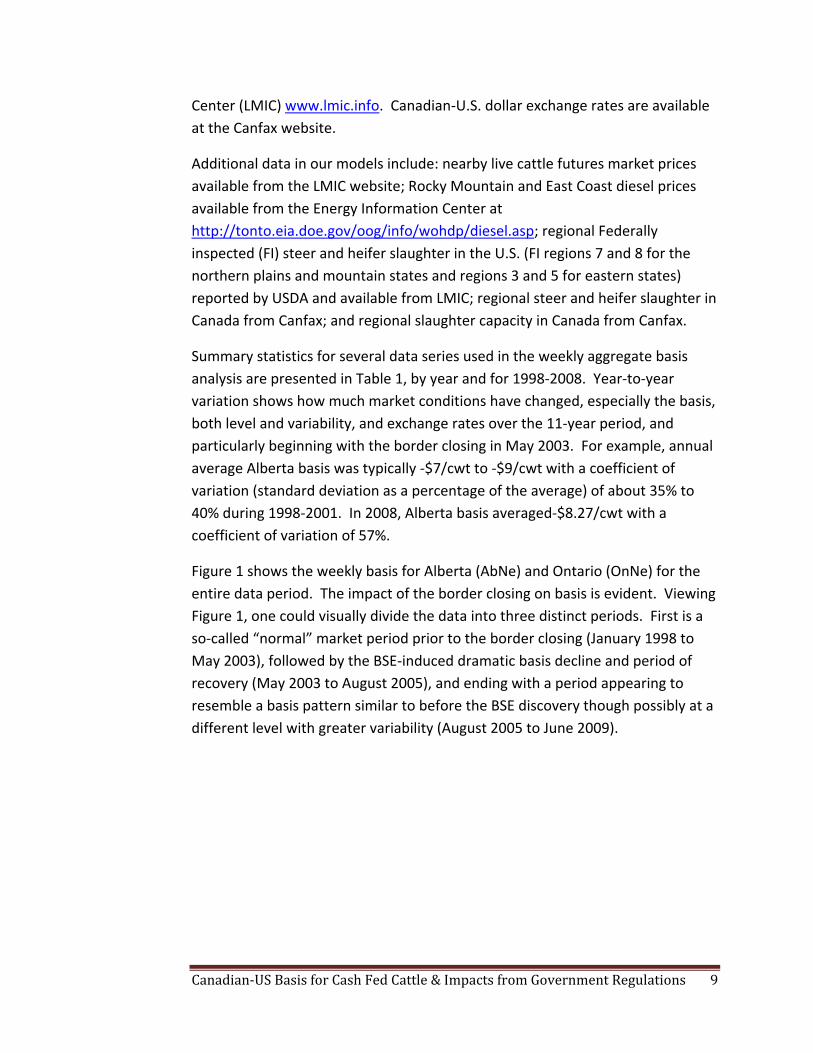
Summary statistics for several data series used in the weekly aggregate basis analysis are presented in Table 1, by year and for 1998‐2008. Year‐to‐year variation shows how much market conditions have changed, especially the basis, both level and variability, and exchange rates over the 11‐year period, and particularly beginning with the border closing in May 2003. For example, annual average Alberta basis was typically ‐$7/cwt to ‐$9/cwt with a coefficient of variation (standard deviation as a percentage of the average) of about 35% to 40% during 1998‐2001. In 2008, Alberta basis averaged‐$8.27/cwt with a coefficient of variation of 57%.
Figure 1 shows the weekly basis for Alberta (AbNe) and Ontario (OnNe) for the entire data period. The impact of the border closing on basis is evident. Viewing Figure 1, one could visually divide the data into three distinct periods. First is a so‐called “normal” market period prior to the border closing (January 1998 to May 2003), followed by the BSE‐induced dramatic basis decline and period of recovery (May 2003 to August 2005), and ending with a period appearing to resemble a basis pattern similar to before the BSE discovery though possibly at a different level with greater variability (August 2005 to June 2009).
Canadian‐US Basis for Cash Fed Cattle & Impacts from Government Regulations 10
Table 1. Mean and Standard Deviation for Selected Variables, Weekly Aggregate Basis Data, by Year and Total, 19982008ab
Year
Variable 1998 1999 2000 2001 2002 2003 2004 2005 2006 2007 2008 1998‐2008
Alberta minus Nebraska fed cattle basisc ‐7.75 ‐7.59 ‐7.89 ‐9.25 ‐6.50 ‐33.66 ‐31.31 ‐20.06 ‐10.16 ‐10.49 ‐8.27 ‐13.92 (2.72) (3.45) (2.67) (3.48) (2.11) (26.6) (9.96) (7.82) (4.10) (4.21) (4.69) (13.28) Ontario minus Nebraska fed cattle basisb ‐3.20 ‐4.60 ‐0.42 ‐1.40 ‐2.22 ‐33.27 ‐33.02 ‐14.82 ‐3.71 ‐7.16 ‐8.08 ‐10.20 (3.26) (3.31) (5.78) (4.86) (4.46) (26.15) (7.02) (8.38) (6.01) (7.47) (4.26) (14.92) Alberta fed cattle price 83.64 89.76 95.34 103.06 98.82 84.34 78.73 85.58 86.76 88.46 90.01 89.49 (3.35) (4.16) (5.31) (8.12) (6.91) (26.7) (6.35) (5.04) (2.99) (7.72) (5.20) (11.8) Ontario fed cattle price 88.19 92.75 102.82 110.91 103.10 84.72 77.02 90.82 93.21 91.79 90.20 93.21 (2.12) (3.84) (4.22) (8.35) (6.01) (24.53) (4.75) (4.83) (3.87) (11.52) (7.14) (12.98) Nebraska fed cattle price 61.61 65.56 69.48 72.61 67.09 84.50 84.63 87.24 85.45 92.06 92.35 78.46 (2.48) (2.80) (3.46) (5.63) (3.70) (10.36) (3.72) (4.66) (4.15) (3.77) (4.66) (11.82) Live cattle futures market price 63.38 66.39 70.23 73.03 68.56 82.07 83.80 87.32 86.20 93.89 93.72 79.00 (2.65) (2.65) (2.99) (5.09) (4.30) (8.78) (3.98) (4.53) (5.28) (2.82) (5.39) (11.52) Canadian to U.S. dollar exchange rate 0.67 0.67 0.67 0.65 0.64 0.72 0.77 0.83 0.88 0.93 0.94 0.76
(0.02) (0.01) (0.01) (0.01) (0.01) (0.04) (0.03) (0.02) (0.01) (0.06) (0.07) (0.12)a Numbers in parentheses are standard deviationb Complete data years, i.e., 52 weeks c Basis is exchange‐rate adjusted
Canadian‐US Basis for Cash Fed Cattle & Impacts from Government Regulations 11
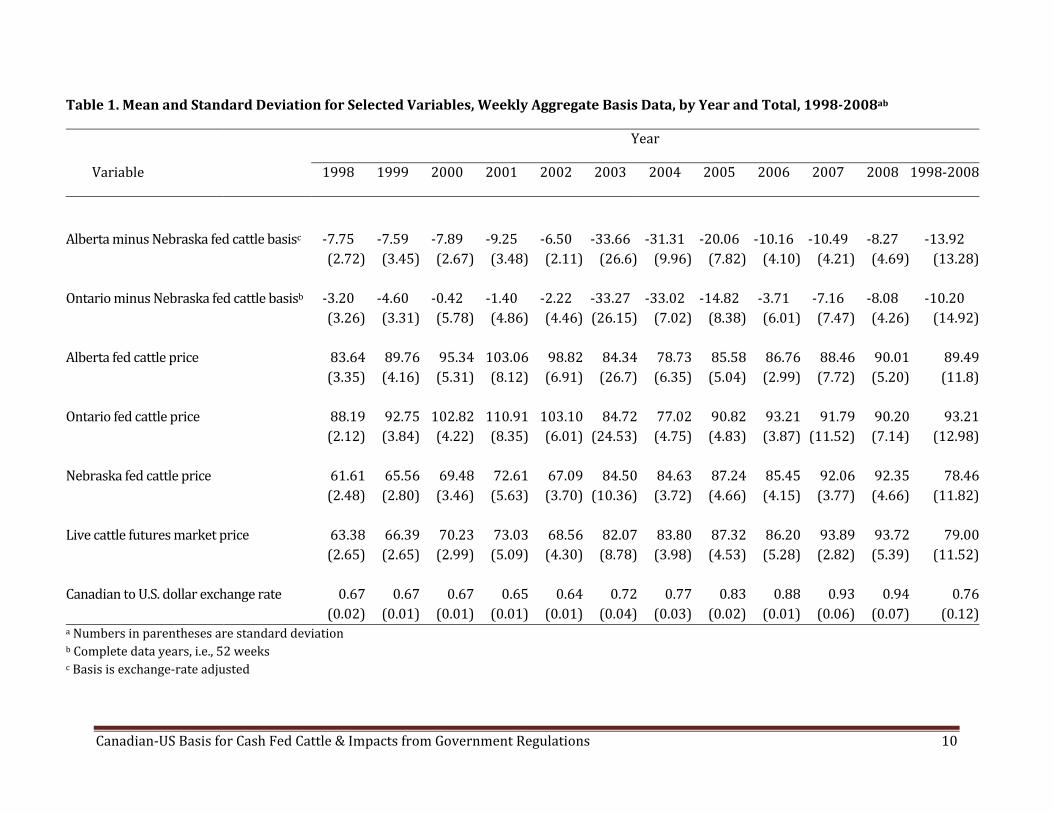
Figure 5 provides a closer look at the basis for the period since the border closing in May 2003. At the top of the figure are markers for times when governmental policies changed conditions hypothesized to affect the fed cattle cash basis between Canada and the U.S. The six markers correspond to the following policy changes or events.
1. May 20, 2003 – BSE discovery in Canada and immediate Canadian‐U.S. border closing to Canadian live cattle and beef trade
2. September 10, 2003 – First shipment to the U.S. of boneless beef exports from Canada processed from cattle UTM of age following the May 20 border closing
3. July 18, 2005 – First shipment of UTM live cattle exports from Canada to the U.S. after the border closure
4. July 12, 2007 – Announcement of the enhanced feed ban and SRM (specific risk materials) regulations in Canada
5. November 20, 2007 – Approval of Rule 2 in the U.S., which allowed resumption of all live cattle and beef exports to the U.S. from Canada
6. September 30, 2008 – Implementation of MCOOL in the U.S. which limited processing of Canadian fed cattle in some U.S. plants.
‐90‐80‐70‐60‐50‐40‐30‐20‐10010
$Cdn
/cwt
Figure 5. Weekly Alberta‐Nebraska and Ontario‐Nebraska fed cattle basis, May 2003‐June 2009
AbNeBasis OnNeBasis PolChng
Canadian‐US Basis for Cash Fed Cattle & Impacts from Government Regulations 12
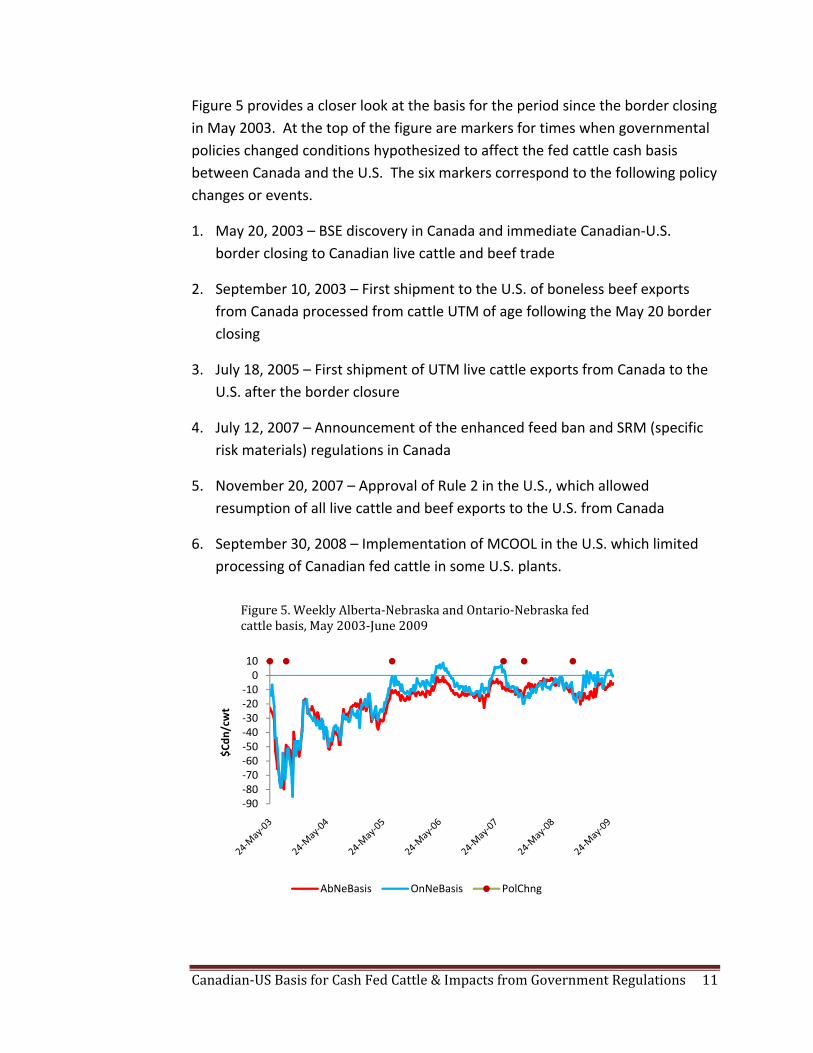
Given the precipitous decline in basis when the border closed and the subsequent recovery to a more normal basis pattern, identifying a model that can account for abnormal market conditions is difficult. Normal fed cattle price relationships changed significantly when the border closed (Miljkovic 2007; Rude, Carlberg, and Pellow 2007). Those changes can be seen in Figure 6. Prior to the border closing, the Nebraska fed cattle price adjusted for exchange rates and the Alberta and Ontario fed cattle prices moved closely together. However, when the border closed, Alberta and Ontario fed cattle prices declined sharply while Nebraska fed cattle prices increased sharply. Then, gradually, fed cattle prices recovered in Canada while Nebraska fed cattle prices declined toward a more normal relationship with Canadian prices.
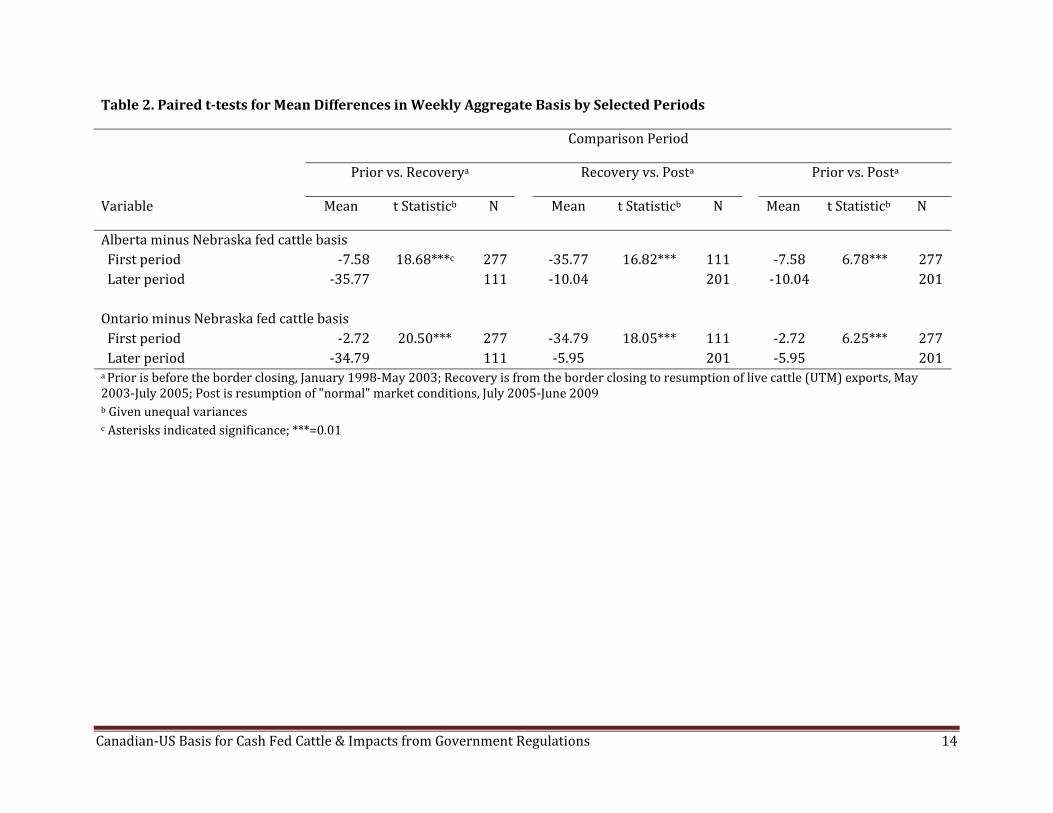
Therefore, based on the graph of weekly basis over, we hypothesized three distinct time periods. To determine whether basis levels changed across market environments, paired t‐tests were conducted on basis means, both for Alberta and Ontario, for the three time periods (pre border closing, recovery, and post recovery). The paired t‐tests reveal changes in basis across different time periods we selected and do not reveal causes of basis change.
Table 2 provides the t‐test results which confirm different basis means for each pair of time periods at the 0.01 significance level. For example, Alberta‐Nebraska fed cattle basis prior to the May 2003 BSE discovery averaged ‐$7.58/cwt compared to an average basis of ‐$10.04/cwt during the post‐recovery (most recent) period. A similar basis weakening is observed for the
30
50
70
90
110
130
150
$Cdn
/cwt
Figure 6. Weekly Alberta, Ontario, and Nebraska fed cattle price, exchange‐rate adjusted, 1998‐June 2009
AbFedP NeFed$C OnFedP
Canadian‐US Basis for Cash Fed Cattle & Impacts from Government Regulations 13
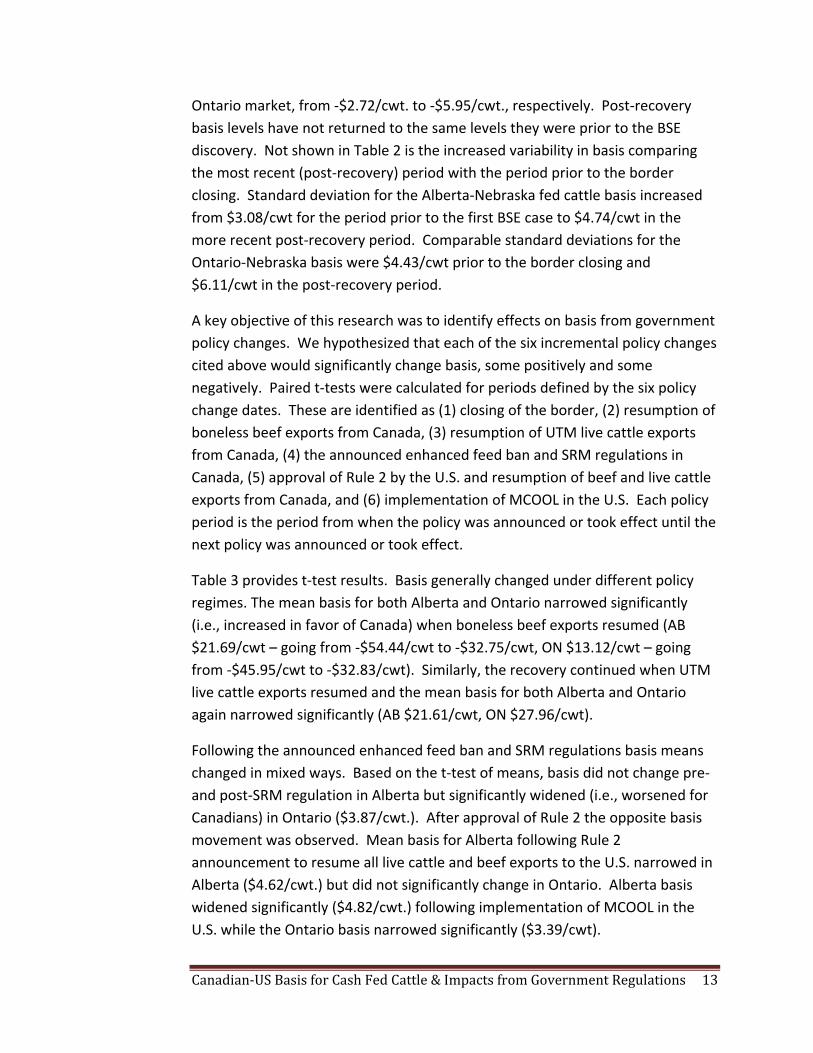
Ontario market, from ‐$2.72/cwt. to ‐$5.95/cwt., respectively. Post‐recovery basis levels have not returned to the same levels they were prior to the BSE discovery. Not shown in Table 2 is the increased variability in basis comparing the most recent (post‐recovery) period with the period prior to the border closing. Standard deviation for the Alberta‐Nebraska fed cattle basis increased from $3.08/cwt for the period prior to the first BSE case to $4.74/cwt in the more recent post‐recovery period. Comparable standard deviations for the Ontario‐Nebraska basis were $4.43/cwt prior to the border closing and $6.11/cwt in the post‐recovery period.
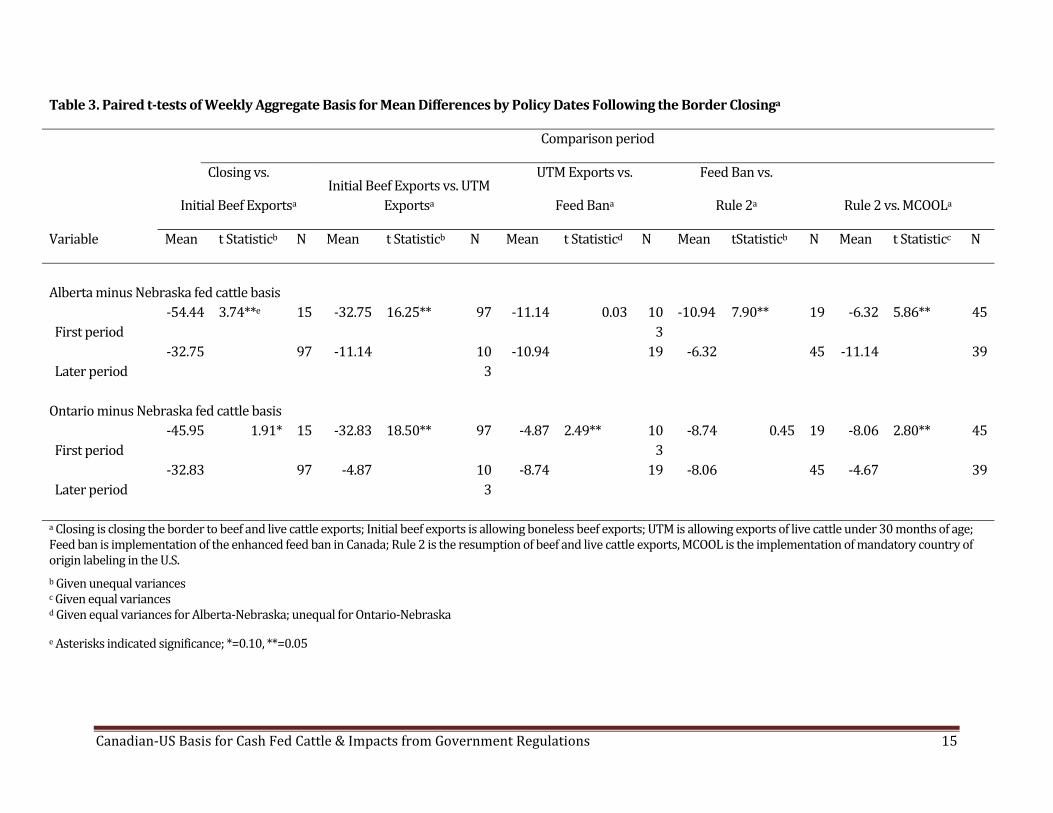
A key objective of this research was to identify effects on basis from government policy changes. We hypothesized that each of the six incremental policy changes cited above would significantly change basis, some positively and some negatively. Paired t‐tests were calculated for periods defined by the six policy change dates. These are identified as (1) closing of the border, (2) resumption of boneless beef exports from Canada, (3) resumption of UTM live cattle exports from Canada, (4) the announced enhanced feed ban and SRM regulations in Canada, (5) approval of Rule 2 by the U.S. and resumption of beef and live cattle exports from Canada, and (6) implementation of MCOOL in the U.S. Each policy period is the period from when the policy was announced or took effect until the next policy was announced or took effect.
Table 3 provides t‐test results. Basis generally changed under different policy regimes. The mean basis for both Alberta and Ontario narrowed significantly (i.e., increased in favor of Canada) when boneless beef exports resumed (AB $21.69/cwt – going from ‐$54.44/cwt to ‐$32.75/cwt, ON $13.12/cwt – going from ‐$45.95/cwt to ‐$32.83/cwt). Similarly, the recovery continued when UTM live cattle exports resumed and the mean basis for both Alberta and Ontario again narrowed significantly (AB $21.61/cwt, ON $27.96/cwt).
Following the announced enhanced feed ban and SRM regulations basis means changed in mixed ways. Based on the t‐test of means, basis did not change pre‐ and post‐SRM regulation in Alberta but significantly widened (i.e., worsened for Canadians) in Ontario ($3.87/cwt.). After approval of Rule 2 the opposite basis movement was observed. Mean basis for Alberta following Rule 2 announcement to resume all live cattle and beef exports to the U.S. narrowed in Alberta ($4.62/cwt.) but did not significantly change in Ontario. Alberta basis widened significantly ($4.82/cwt.) following implementation of MCOOL in the U.S. while the Ontario basis narrowed significantly ($3.39/cwt).
Canadian‐US Basis for Cash Fed Cattle & Impacts from Government Regulations 14
Table 2. Paired ttests for Mean Differences in Weekly Aggregate Basis by Selected Periods
Comparison Period
Prior vs. Recoverya Recovery vs. Posta Prior vs. Posta
Variable Mean t Statisticb N Mean t Statisticb N Mean t Statisticb N
Alberta minus Nebraska fed cattle basis First period ‐7.58 18.68***c 277 ‐35.77 16.82*** 111 ‐7.58 6.78*** 277 Later period ‐35.77 111 ‐10.04 201 ‐10.04 201
Ontario minus Nebraska fed cattle basis First period ‐2.72 20.50*** 277 ‐34.79 18.05*** 111 ‐2.72 6.25*** 277 Later period ‐34.79 111 ‐5.95 201 ‐5.95 201 a Prior is before the border closing, January 1998‐May 2003; Recovery is from the border closing to resumption of live cattle (UTM) exports, May2003‐July 2005; Post is resumption of "normal" market conditions, July 2005‐June 2009 b Given unequal variances c Asterisks indicated significance; ***=0.01
Canadian‐US Basis for Cash Fed Cattle & Impacts from Government Regulations 15
Table 3. Paired ttests of Weekly Aggregate Basis for Mean Differences by Policy Dates Following the Border Closinga
Comparison period
Closing vs.
Initial Beef Exportsa Initial Beef Exports vs. UTM
Exportsa
UTM Exports vs.
Feed Bana
Feed Ban vs.
Rule 2a Rule 2 vs. MCOOLa
Variable Mean t Statisticb N Mean t Statisticb N Mean t Statisticd N Mean tStatisticb N Mean t Statisticc N
Alberta minus Nebraska fed cattle basis
First period ‐54.44 3.74**e 15 ‐32.75 16.25** 97 ‐11.14 0.03 10
3‐10.94 7.90** 19 ‐6.32 5.86** 45
Later period ‐32.75 97 ‐11.14 10
3‐10.94 19 ‐6.32 45 ‐11.14 39
Ontario minus Nebraska fed cattle basis
First period ‐45.95 1.91* 15 ‐32.83 18.50** 97 ‐4.87 2.49** 10
3‐8.74 0.45 19 ‐8.06 2.80** 45
Later period ‐32.83 97 ‐4.87 10
3‐8.74 19 ‐8.06 45 ‐4.67 39
a Closing is closing the border to beef and live cattle exports; Initial beef exports is allowing boneless beef exports; UTM is allowing exports of live cattle under 30 months of age; Feed ban is implementation of the enhanced feed ban in Canada; Rule 2 is the resumption of beef and live cattle exports, MCOOL is the implementation of mandatory country of origin labeling in the U.S. b Given unequal variances c Given equal variances d Given equal variances for Alberta‐Nebraska; unequal for Ontario‐Nebraska
e Asterisks indicated significance; *=0.10, **=0.05
Canadian‐US Basis for Cash Fed Cattle & Impacts from Government Regulations 16
Importantly, t‐tests are ceteris paribus in that t‐tests fail to determine which of several market factors could explain the basis behavior, thus do not provide explanations of why basis changed. Therefore, a more definitive approach that accounts for other changing market conditions is required to determine how any single event affected basis after adjusting for other factors.
Model Development – Weekly Aggregate Data
Few previous livestock studies have modeled weekly price determinants and thus provide little guidance in how to model joint market dynamics, i.e., the fed cattle market both in Canada and the U.S. Modeling weekly market dynamics is difficult also because preferred weekly data series are often not available, making model estimation even more challenging. However, given the nature of policy changes occurring on specific dates and otherwise limited degrees of freedom, weekly data, as opposed to monthly or other aggregation, are best suited for our study.
Our approach was to specify and estimate a structural model. Serial correlation was assumed and confirmed in the weekly time series data so the model was estimated as a first‐order autoregressive model by ordinary least squares in SAS (SAS Institute 2002‐2003). Given t‐test results discussed earlier for periods (Table 2), each model was estimated for the entire data period and for three subperiods (prior to the border closing, recovery, and post recovery). Independent variables were those hypothesized to affect the weekly basis as well as zero‐one dummy variables included to measure effects from incremental governmental policy changes. The autoregressive model can be written as
(1) ∑=
++=n
ititi Vxy
1t βα
where the regression is augmented with an autoregressive model for the random error term. Dependent variables yt are, respectively, the Alberta minus Nebraska fed cattle price or the Ontario minus Nebraska fed cattle price, all in $CAD. All prices are adjusted for exchange rate changes to recognize the importance of exchange rates (Klein, McGivern, and Grier 2006) and the changes in Canadian‐U.S. exchange rates over the data period.
Independent variables xit are discussed here. Canadian cattle feeders use the Nebraska fed cattle price, adjusted for exchange rate, as a market barometer of U.S. fed cattle prices, thus was included. As can be hypothesized from Figure 6,
Canadian‐US Basis for Cash Fed Cattle & Impacts from Government Regulations 17
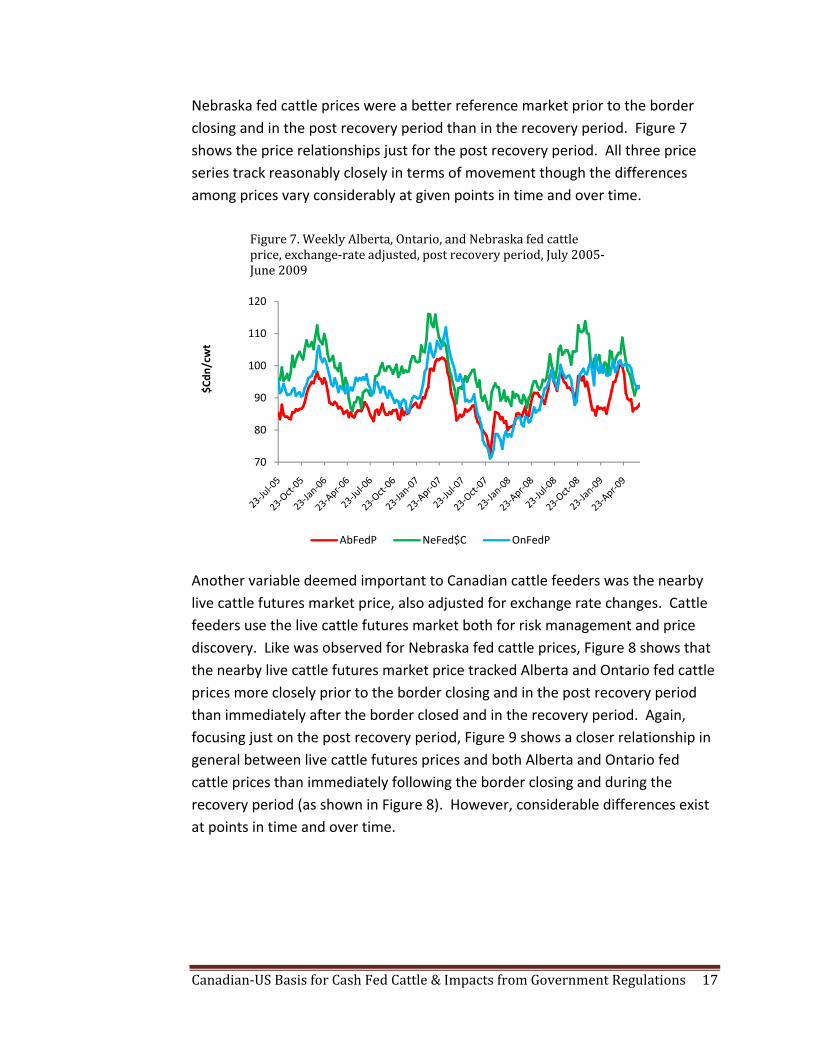
Nebraska fed cattle prices were a better reference market prior to the border closing and in the post recovery period than in the recovery period. Figure 7 shows the price relationships just for the post recovery period. All three price series track reasonably closely in terms of movement though the differences among prices vary considerably at given points in time and over time.
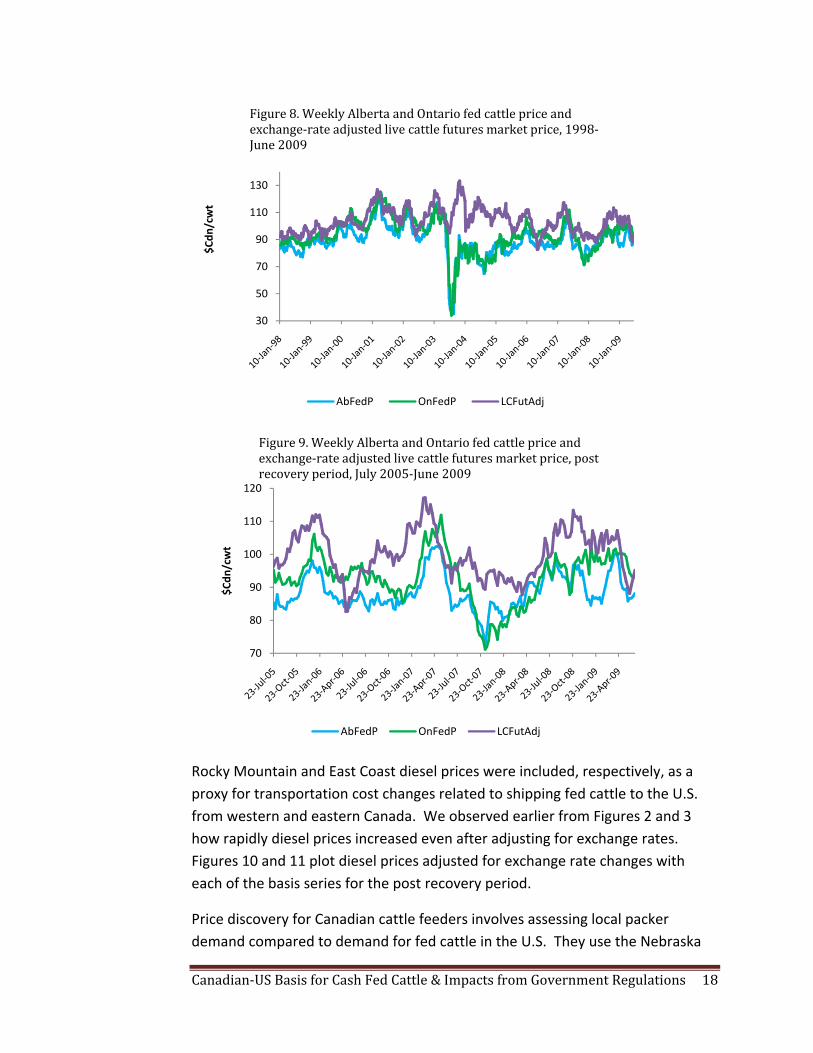
Another variable deemed important to Canadian cattle feeders was the nearby live cattle futures market price, also adjusted for exchange rate changes. Cattle feeders use the live cattle futures market both for risk management and price discovery. Like was observed for Nebraska fed cattle prices, Figure 8 shows that the nearby live cattle futures market price tracked Alberta and Ontario fed cattle prices more closely prior to the border closing and in the post recovery period than immediately after the border closed and in the recovery period. Again, focusing just on the post recovery period, Figure 9 shows a closer relationship in general between live cattle futures prices and both Alberta and Ontario fed cattle prices than immediately following the border closing and during the recovery period (as shown in Figure 8). However, considerable differences exist at points in time and over time.
70
80
90
100
110
120
$Cdn
/cwt
Figure 7. Weekly Alberta, Ontario, and Nebraska fed cattle price, exchange‐rate adjusted, post recovery period, July 2005‐June 2009
AbFedP NeFed$C OnFedP
Canadian‐US Basis for Cash Fed Cattle & Impacts from Government Regulations 18
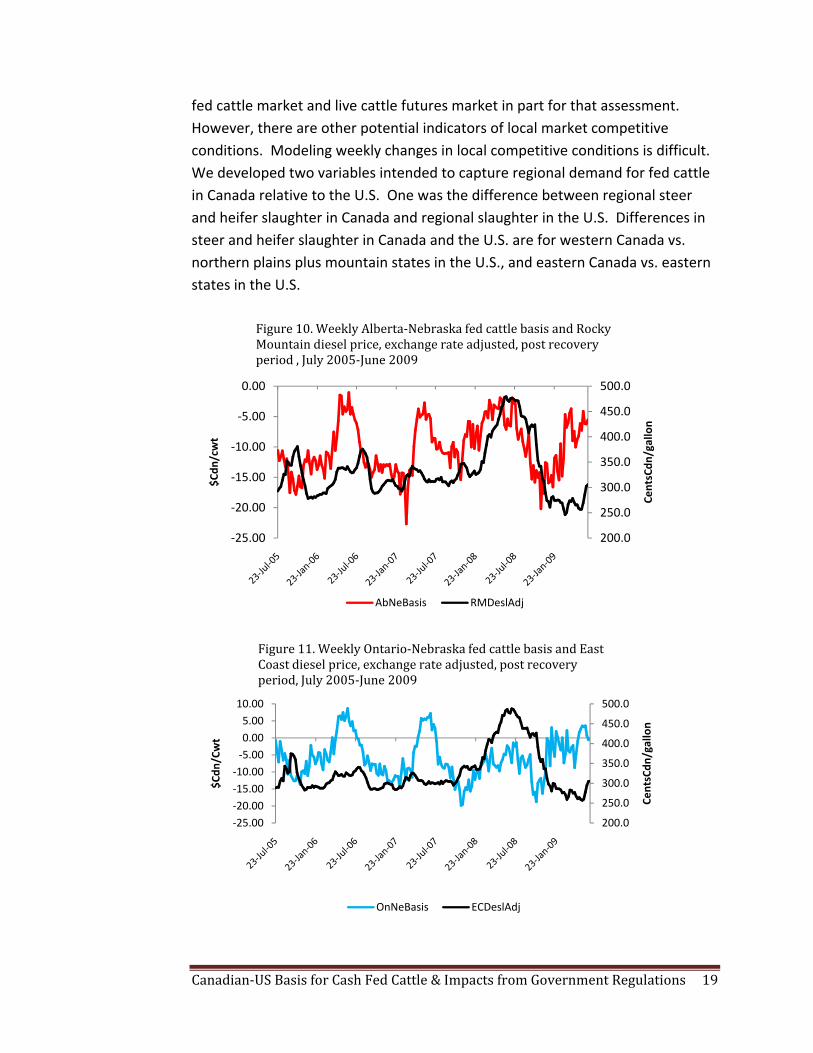
Rocky Mountain and East Coast diesel prices were included, respectively, as a proxy for transportation cost changes related to shipping fed cattle to the U.S. from western and eastern Canada. We observed earlier from Figures 2 and 3 how rapidly diesel prices increased even after adjusting for exchange rates. Figures 10 and 11 plot diesel prices adjusted for exchange rate changes with each of the basis series for the post recovery period.
Price discovery for Canadian cattle feeders involves assessing local packer demand compared to demand for fed cattle in the U.S. They use the Nebraska
30
50
70
90
110
130
$Cdn
/cwt
Figure 8. Weekly Alberta and Ontario fed cattle price and exchange‐rate adjusted live cattle futures market price, 1998‐June 2009
AbFedP OnFedP LCFutAdj
70
80
90
100
110
120
$Cdn
/cwt
Figure 9. Weekly Alberta and Ontario fed cattle price and exchange‐rate adjusted live cattle futures market price, post recovery period, July 2005‐June 2009
AbFedP OnFedP LCFutAdj
Canadian‐US Basis for Cash Fed Cattle & Impacts from Government Regulations 19
fed cattle market and live cattle futures market in part for that assessment. However, there are other potential indicators of local market competitive conditions. Modeling weekly changes in local competitive conditions is difficult. We developed two variables intended to capture regional demand for fed cattle in Canada relative to the U.S. One was the difference between regional steer and heifer slaughter in Canada and regional slaughter in the U.S. Differences in steer and heifer slaughter in Canada and the U.S. are for western Canada vs. northern plains plus mountain states in the U.S., and eastern Canada vs. eastern states in the U.S.
200.0
250.0
300.0
350.0
400.0
450.0
500.0
‐25.00
‐20.00
‐15.00
‐10.00
‐5.00
0.00
CentsCdn
/gallon
$Cdn
/cwt
Figure 10. Weekly Alberta‐Nebraska fed cattle basis and Rocky Mountain diesel price, exchange rate adjusted, post recovery period , July 2005‐June 2009
AbNeBasis RMDeslAdj
200.0
250.0
300.0
350.0
400.0
450.0
500.0
‐25.00‐20.00‐15.00‐10.00‐5.000.005.0010.00
CentsCdn
/gallon
$Cdn
/Cwt
Figure 11. Weekly Ontario‐Nebraska fed cattle basis and East Coast diesel price, exchange rate adjusted, post recovery period, July 2005‐June 2009
OnNeBasis ECDeslAdj
Canadian‐US Basis for Cash Fed Cattle & Impacts from Government Regulations 20
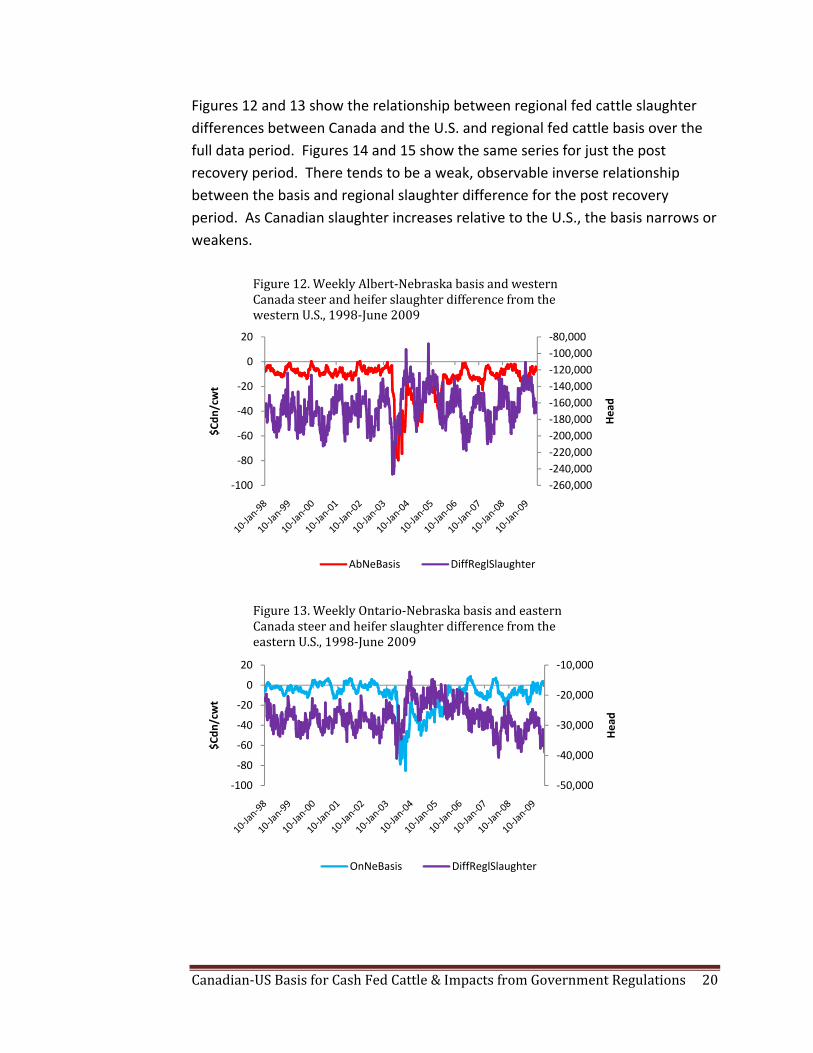
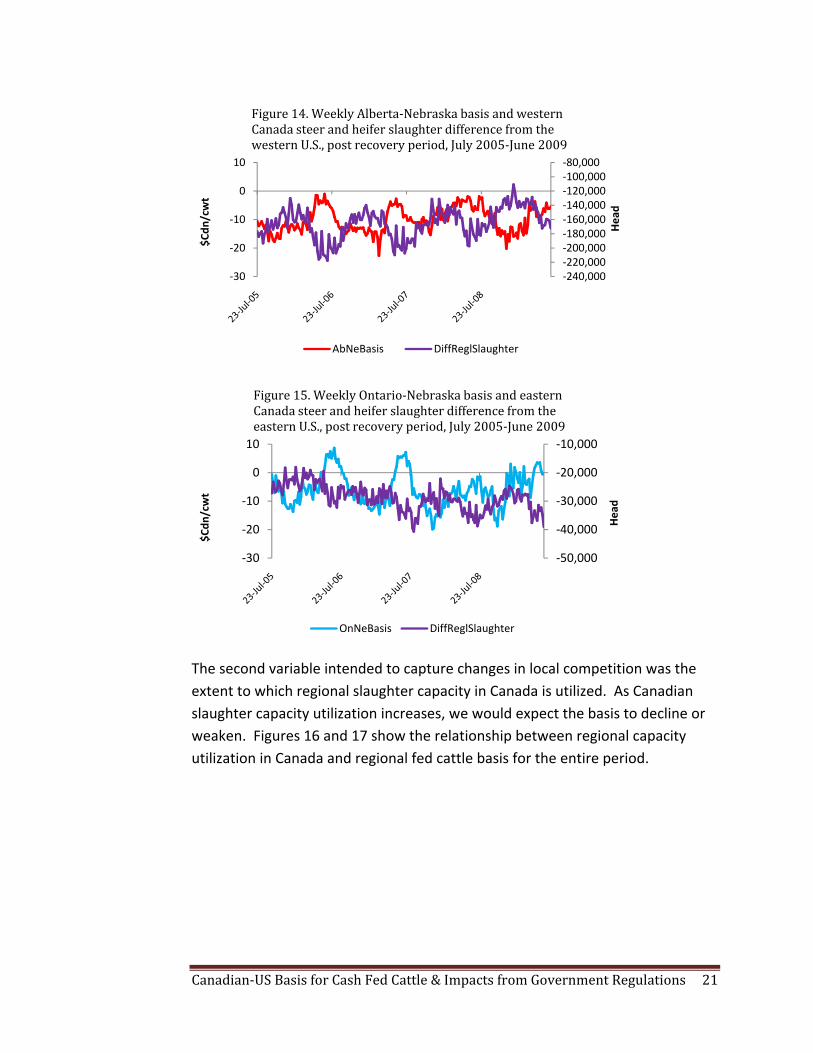
Figures 12 and 13 show the relationship between regional fed cattle slaughter differences between Canada and the U.S. and regional fed cattle basis over the full data period. Figures 14 and 15 show the same series for just the post recovery period. There tends to be a weak, observable inverse relationship between the basis and regional slaughter difference for the post recovery period. As Canadian slaughter increases relative to the U.S., the basis narrows or weakens.
‐260,000‐240,000‐220,000‐200,000‐180,000‐160,000‐140,000‐120,000‐100,000‐80,000
‐100
‐80
‐60
‐40
‐20
0
20
Head
$Cdn
/cwt
Figure 12. Weekly Albert‐Nebraska basis and western Canada steer and heifer slaughter difference from the western U.S., 1998‐June 2009
AbNeBasis DiffReglSlaughter
‐50,000
‐40,000
‐30,000
‐20,000
‐10,000
‐100
‐80
‐60
‐40
‐20
0
20
Head
$Cdn
/cwt
Figure 13. Weekly Ontario‐Nebraska basis and eastern Canada steer and heifer slaughter difference from the eastern U.S., 1998‐June 2009
OnNeBasis DiffReglSlaughter
Canadian‐US Basis for Cash Fed Cattle & Impacts from Government Regulations 21
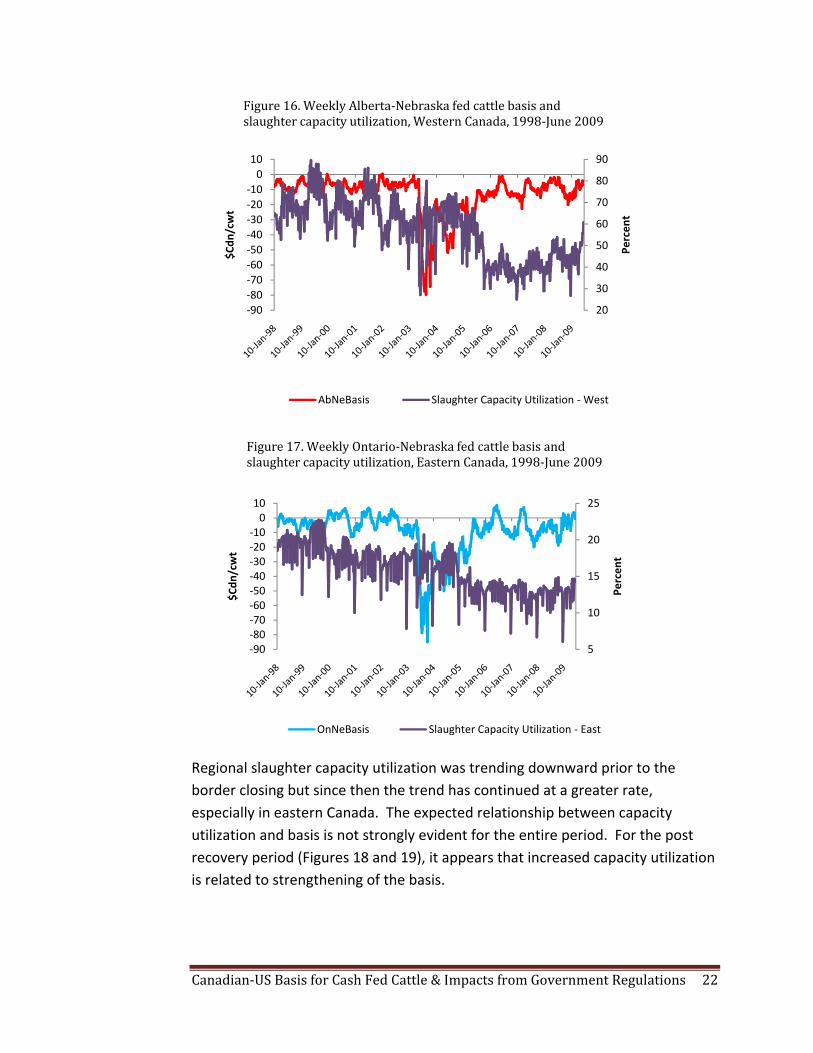
The second variable intended to capture changes in local competition was the extent to which regional slaughter capacity in Canada is utilized. As Canadian slaughter capacity utilization increases, we would expect the basis to decline or weaken. Figures 16 and 17 show the relationship between regional capacity utilization in Canada and regional fed cattle basis for the entire period.
‐240,000‐220,000‐200,000‐180,000‐160,000‐140,000‐120,000‐100,000‐80,000
‐30
‐20
‐10
0
10
Head
$Cdn
/cwt
Figure 14. Weekly Alberta‐Nebraska basis and western Canada steer and heifer slaughter difference from the western U.S., post recovery period, July 2005‐June 2009
AbNeBasis DiffReglSlaughter
‐50,000
‐40,000
‐30,000
‐20,000
‐10,000
‐30
‐20
‐10
0
10
Head
$Cdn
/cwt
Figure 15. Weekly Ontario‐Nebraska basis and eastern Canada steer and heifer slaughter difference from the eastern U.S., post recovery period, July 2005‐June 2009
OnNeBasis DiffReglSlaughter
Canadian‐US Basis for Cash Fed Cattle & Impacts from Government Regulations 22
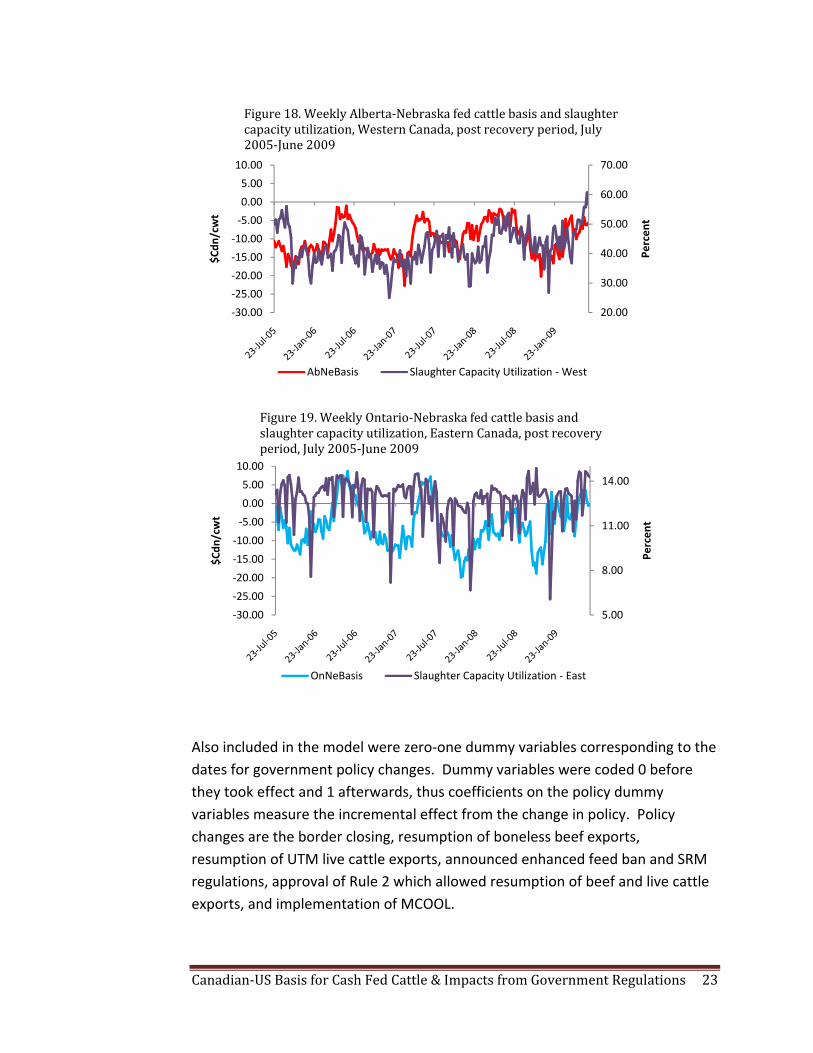
Regional slaughter capacity utilization was trending downward prior to the border closing but since then the trend has continued at a greater rate, especially in eastern Canada. The expected relationship between capacity utilization and basis is not strongly evident for the entire period. For the post recovery period (Figures 18 and 19), it appears that increased capacity utilization is related to strengthening of the basis.
20
30
40
50
60
70
80
90
‐90‐80‐70‐60‐50‐40‐30‐20‐10010
Percen
t
$Cdn
/cwt
Figure 16. Weekly Alberta‐Nebraska fed cattle basis and slaughter capacity utilization, Western Canada, 1998‐June 2009
AbNeBasis Slaughter Capacity Utilization ‐West
5
10
15
20
25
‐90‐80‐70‐60‐50‐40‐30‐20‐10010
Percen
t
$Cdn
/cwt
Figure 17. Weekly Ontario‐Nebraska fed cattle basis and slaughter capacity utilization, Eastern Canada, 1998‐June 2009
OnNeBasis Slaughter Capacity Utilization ‐ East
Canadian‐US Basis for Cash Fed Cattle & Impacts from Government Regulations 23
Also included in the model were zero‐one dummy variables corresponding to the dates for government policy changes. Dummy variables were coded 0 before they took effect and 1 afterwards, thus coefficients on the policy dummy variables measure the incremental effect from the change in policy. Policy changes are the border closing, resumption of boneless beef exports, resumption of UTM live cattle exports, announced enhanced feed ban and SRM regulations, approval of Rule 2 which allowed resumption of beef and live cattle exports, and implementation of MCOOL.
20.00
30.00
40.00
50.00
60.00
70.00
‐30.00
‐25.00
‐20.00
‐15.00
‐10.00
‐5.00
0.00
5.00
10.00
Percen
t
$Cdn
/cwt
Figure 18. Weekly Alberta‐Nebraska fed cattle basis and slaughter capacity utilization, Western Canada, post recovery period, July 2005‐June 2009
AbNeBasis Slaughter Capacity Utilization ‐West
5.00
8.00
11.00
14.00
‐30.00
‐25.00
‐20.00
‐15.00
‐10.00
‐5.00
0.00
5.00
10.00
Percen
t
$Cdn
/cwt
Figure 19. Weekly Ontario‐Nebraska fed cattle basis and slaughter capacity utilization, Eastern Canada, post recovery period, July 2005‐June 2009
OnNeBasis Slaughter Capacity Utilization ‐ East
Canadian‐US Basis for Cash Fed Cattle & Impacts from Government Regulations 24
Estimation Results – Weekly Aggregate Data
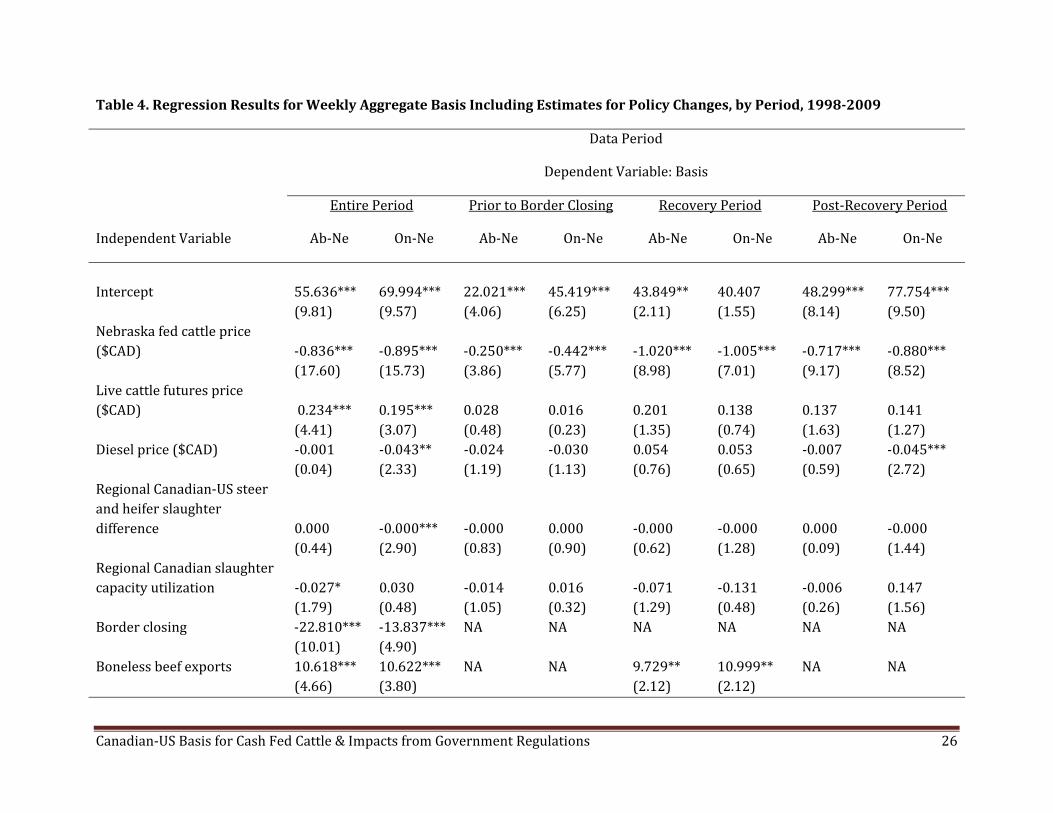
Results from the autoregressive model estimation are shown in Table 4. The regression R2 is a measure of fit for the structural part of the model after transforming for autocorrelation. The structural part of the model explained a higher percentage of weekly fed cattle variation in the post recovery period than for the other three estimation periods. The total R2 is a measure of how well the next value can be predicted from the structural part of the model and past values of residuals. Predictive power was best for the model estimated over the entire data period than for the three subperiods. All coefficient impacts are discussed in terms of Canadian dollars.
Nebraska fed cattle prices were negative and statistically significant across the four time periods (entire data period, prior to the border closing, recovery, and post recovery) but coefficient magnitude varied.
Nebraska fed cattle prices were hypothesized to be highly significant as Canadian cattle feeders watch Nebraska prices closely as an indicator of the U.S. fed cattle market when making fed cattle marketing decisions. Coefficients varied across the three subperiods, suggesting different market conditions existed in the subperiods than for the entire data period.
Canadian cattle feeders watch the live cattle futures market as an indicator of near‐term market condition changes in the U.S. and use the futures market for hedging fed cattle prices. Live cattle futures market prices were positive and statistically significant for the entire period, but were not significant in the three subperiod estimations. Perhaps changing fundamental market conditions in the U.S. over time are being captured in our models largely by including the Nebraska fed cattle price. This point will be addressed again later.
Diesel prices were included in the model to proxy changes in transportation costs over time when exporting Canadian fed cattle to the U.S. Diesel prices were more important for the Ontario‐Nebraska basis than the Alberta‐Nebraska basis. Increasing diesel prices adversely affected the Ontario‐Nebraska basis in the overall period and for the post‐recovery subperiod, though impacts were small. A $1/gallon increase in diesel price reduced the Ontario‐Nebraska basis by $0.04 to $0.05/cwt. Clearly, changes in diesel prices affect transportation costs and are important. However, week‐to‐week changes may not be reflected immediately in transportation rates, thus not being as useful in a model of weekly basis as in more aggregated analyses.
Canadian‐US Basis for Cash Fed Cattle & Impacts from Government Regulations 25
Differences in regional steer and heifer slaughter and regional slaughter capacity utilization were intended to capture near‐term supply‐demand condition differences in Canada and the U.S. Increased slaughter in the eastern U.S. relative to eastern Canada adversely affected the Ontario‐Nebraska basis, while increased slaughter capacity utilization in western Canada adversely affected the Alberta‐Nebraska basis, but only for the full data period in both cases, and impacts were small. Therefore, these variables may not be good indicators of relative, local competitive conditions in the two countries. As was noted, modeling local competitive conditions with weekly data is challenging.
Dummy variables for policy change increments were mixed positive and negative and mixed significant and not significant. However, results were quite consistent between the entire period and subperiods.
As expected and consistent with Figure 1, basis declined sharply with the closing of the Canadian‐U.S. border to live cattle and beef exports. During the initial border closing period, prior to any allowed resumption in cattle and beef movement across the border to the U.S., the Alberta‐Nebraska basis dropped (widened) $22.81/cwt. and the Ontario‐Nebraska basis dropped $13.84/cwt. The larger decline in western Canada may reflect the larger fed cattle industry in Alberta.
The resumption of boneless beef exports from Canada to the U.S. processed from UTM cattle enhanced basis recovery in Canada as is evidenced in results for the entire period and the recovery period. Average basis increased $10.62/cwt. both in Alberta and Ontario in the full‐period model when beef exports resumed. In the recovery period model, the increases were $9.73/cwt. and $11.00/cwt., respectively, for Alberta and Ontario. Resuming exports of live cattle UTM did not significantly increase the Canadian‐U.S. basis.
Announcement and implementation of the Canadian feed ban was expected to adversely affect the Canadian‐U.S. fed cattle basis. Specifically, regulations requiring removal of specific risk materials (SRM) from carcasses in processing were expected to increase slaughter costs, making the Canadian processing industry less competitive relative to the U.S. That, in turn, was expected to translate into lower fed cattle bids from Canadian packers relative to U.S. packers. However, neither in the full period model nor the post‐recovery model did the feed ban significantly affect the basis in our model.
Canadian‐US Basis for Cash Fed Cattle & Impacts from Government Regulations 26
Table 4. Regression Results for Weekly Aggregate Basis Including Estimates for Policy Changes, by Period, 19982009
Data Period
Dependent Variable: Basis
Entire Period Prior to Border Closing Recovery Period Post‐Recovery Period
Independent Variable Ab‐Ne On‐Ne Ab‐Ne On‐Ne Ab‐Ne On‐Ne Ab‐Ne On‐Ne
Intercept 55.636*** 69.994*** 22.021*** 45.419*** 43.849** 40.407 48.299*** 77.754*** (9.81) (9.57) (4.06) (6.25) (2.11) (1.55) (8.14) (9.50) Nebraska fed cattle price ($CAD) ‐0.836*** ‐0.895*** ‐0.250*** ‐0.442*** ‐1.020*** ‐1.005*** ‐0.717*** ‐0.880*** (17.60) (15.73) (3.86) (5.77) (8.98) (7.01) (9.17) (8.52) Live cattle futures price ($CAD) 0.234*** 0.195*** 0.028 0.016 0.201 0.138 0.137 0.141 (4.41) (3.07) (0.48) (0.23) (1.35) (0.74) (1.63) (1.27) Diesel price ($CAD) ‐0.001 ‐0.043** ‐0.024 ‐0.030 0.054 0.053 ‐0.007 ‐0.045*** (0.04) (2.33) (1.19) (1.13) (0.76) (0.65) (0.59) (2.72) Regional Canadian‐US steer and heifer slaughter difference 0.000 ‐0.000*** ‐0.000 0.000 ‐0.000 ‐0.000 0.000 ‐0.000 (0.44) (2.90) (0.83) (0.90) (0.62) (1.28) (0.09) (1.44) Regional Canadian slaughter capacity utilization ‐0.027* 0.030 ‐0.014 0.016 ‐0.071 ‐0.131 ‐0.006 0.147 (1.79) (0.48) (1.05) (0.32) (1.29) (0.48) (0.26) (1.56) Border closing ‐22.810*** ‐13.837*** NA NA NA NA NA NA (10.01) (4.90) Boneless beef exports 10.618*** 10.622*** NA NA 9.729** 10.999** NA NA (4.66) (3.80) (2.12) (2.12)
Canadian‐US Basis for Cash Fed Cattle & Impacts from Government Regulations 27
Table 4. Regression Results for Weekly Aggregate Basis Including Estimates for Policy Changes, by Period, 19982009
Data Period
Dependent Variable: Basis
Entire Period Prior to Border Closing Recovery Period Post‐Recovery Period
Independent Variable Ab‐Ne On‐Ne Ab‐Ne On‐Ne Ab‐Ne On‐Ne Ab‐Ne On‐Ne
Under 30 months live cattle exports 0.880 2.573 NA NA NA NA NA NA (0.39) (0.92) Canadian feed ban 1.563 1.514 NA NA NA NA 0.234 0.950 (0.67) (0.53) (0.16) (0.47) Beef and live cattle exports (Rule 2) 4.835** 2.272 NA NA NA NA 4.046*** 1.768 (2.08) (0.79) (2.76) (0.88) Mandatory COOL ‐1.375 ‐3.505 NA NA NA NA ‐1.904 ‐3.582* (0.58) (1.21) (1.26) (1.73) n 596 596 277 277 111 111 201 201 Regression R2 0.484 0.431 0.124 0.226 0.549 0.450 0.538 0.556 Total R2 0.966 0.961 0.766 0.862 0.928 0.892 0.882 0.891 a Asterisks indicate significance, where *=0.10, **=0.05, ***=0.01. Numbers in parentheses are absolute values of calculated t statistics.
Canadian‐US Basis for Cash Fed Cattle & Impacts from Government Regulations 28
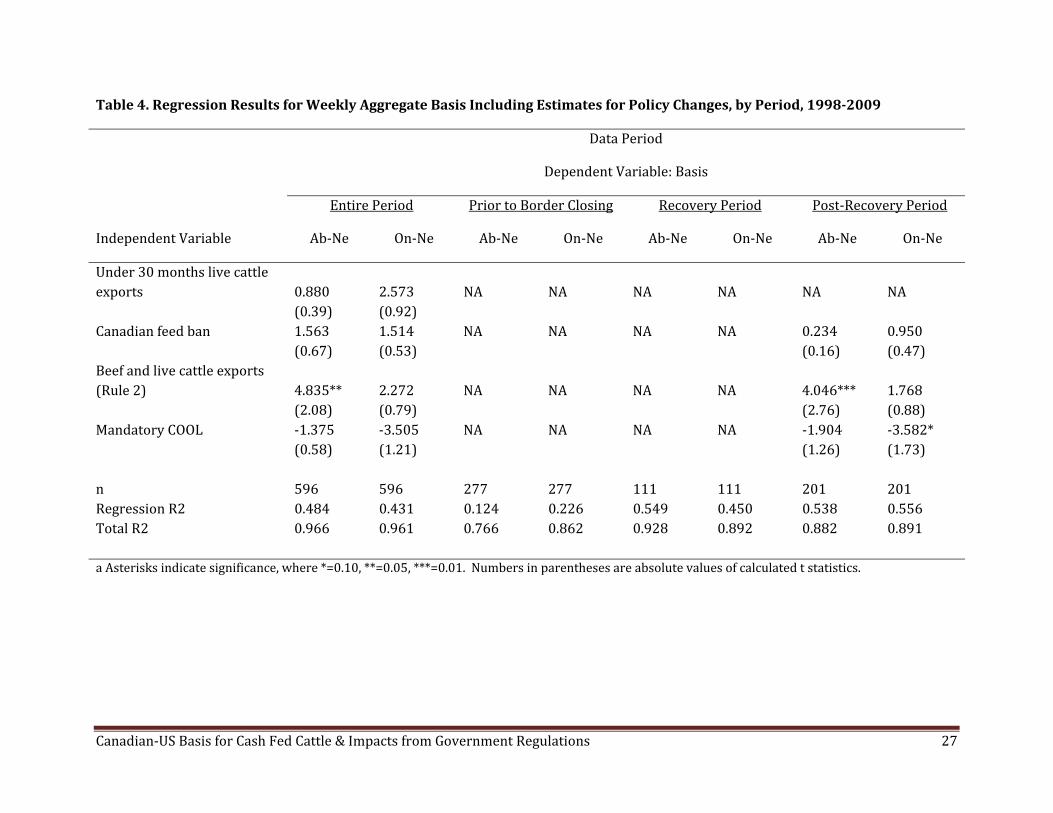
Full resumption of cattle and beef movement across the Canadian‐U.S. border (Rule 2) positively and statistically significantly affected the Alberta basis but not the Ontario basis, both for the full data period and the post recovery period. Respectively, the increase was $4.83/cwt. and $4.05/cwt. Perhaps the market in eastern Canada already adjusted to the resumption of boneless beef exports and UTM fed cattle exports and full resumption of exports had little additional effect.
Implementation of MCOOL, reportedly adversely affected the Canadian‐U.S. fed cattle basis (Kay 2008). Earlier t‐test results seem to confirm the negative effect on the Alberta‐Nebraska basis but indicated a positive effect on the Ontario‐Nebraska basis. No statistically significant effect was found either for Alberta or Ontario in the model for the entire data period. However, for the post‐recovery period, MCOOL was associated with a $3.58/cwt. decline in basis for Ontario and $1.91/cwt. for Alberta. The decline in Alberta was significant at a 0.10 significance level for a one‐tailed test, which is appropriate given our hypothesis of a negative impact on basis.
Implications – Weekly Aggregate Basis
Determining factors affecting the Canadian‐U.S. fed cattle basis is important in predicting basis, which in turn affects Canadian cattle feeders’ decision to market fed cattle domestically or export them to the U.S. However, predicting aggregate weekly basis and basis changes are difficult. The weekly aggregate model estimated for the entire period and subperiods did not as clearly identify determinants of the Alberta‐Nebraska and Ontario‐Nebraska basis as we would like. Part of the difficulty in indentifying robust statistical determinants of basis is that as we break the data into sub‐periods, the number of observations becomes quite small. For example, the recovery period is only 111 weeks and the post‐recovery only 201 weeks, hardly sufficient numbers of observations for sorting out complex economic relationships in the data. In addition, basis variability was greater in the post‐recovery period. However, the tradeoff is that combining periods, as in the full model, combines data under structurally different market relationships which is also not ideal. For this reason, using transaction data, as in the next section, may be preferable for sorting out more of the complex basis determinants.
The aggregate weekly models reveal the importance of the Nebraska fed cattle price as a barometer for estimating fed cattle basis in Alberta and Ontario. All else equal, as the Nebraska fed cattle price rises, basis widens. Other structural
Canadian‐US Basis for Cash Fed Cattle & Impacts from Government Regulations 29
variables were of lesser importance and less consistent in explaining variation in basis across periods.
The model was estimated with the Nebraska fed cattle price as the only structural variable along with the dummy variables for policy changes. Overall changes in model fit and predictability were relatively small. Regression R2 declined from 0.538 and 0.556 for the Alberta and Ontario models reported above with all variables to 0.530 for each model with the condensed version. Total R2 declined from 0.893 and 0.891, respectively, with the full model to 0.880 and 0.884, respectively, for the condensed Alberta and Ontario models. Thus, the Nebraska fed cattle price in the model swamped the explanatory contribution from other structural variables.
In terms of predicting basis one week ahead, a simple estimate of next week’s basis is this week’s basis. This week’s basis alone as a predictor of next week’s basis explains about 75% of the variability over time. However, that means about 25% of basis variability over time is caused by market factors. And of course, as one goes forward additional weeks, predictability using the most recent basis worsens.
In the full model, several policy changes significantly affected the basis. The border closing to beef and live cattle exports from Canada to the U.S. had a large negative effect on the weekly aggregate basis in both Alberta and Ontario. Reopening the border to boneless beef exports from Canada to the U.S. significantly improved the fed cattle basis and moved the basis toward a more “pre‐BSE” level. Clearly, Canadian fed cattle prices relative to U.S. prices depend heavily upon unrestricted cattle and beef trade with the U.S. Any binding border constraint that prevents or reduces Canadian cattle or beef form export access to the U.S. causes Canadian fed cattle prices to decline relative to the U.S. The importance of access to the U.S. market to Canadian cattle feeders is apparent.
Implementing the feed ban and placing restrictions on carcass SRMs in Canada did not affect aggregate weekly basis adversely as was anticipated. Apparently, these regulations either did not have lasting substantial impacts on costs of production or beef processing or the transmission of these impacts was absorbed at various places in the value chain and were not systematically revealed in weekly fed cattle basis. Or perhaps our weekly aggregate models were not able to adequately capture the impacts of SRM policy on basis.
Canadian‐US Basis for Cash Fed Cattle & Impacts from Government Regulations 30
Complete reopening of the border to all cattle and beef trade (Rule 2) further improved the basis for Alberta, but not Ontario. Alberta has depended more on cattle exports to the U.S. than Ontario in the post recovery period. Exports from western Canada were 30.8% of Canadian steer and heifer slaughter, compared to 23.8% for eastern Canada. In addition, more U.S. steer and heifer beef packing plants would be considered part of the contestable market for cattle fed in Alberta than in Ontario. As a result, the complete border reopening was expected to have more impact on Alberta than Ontario fed cattle prices.
U.S. implementation of MCOOL had a negative effect on weekly fed cattle basis as expected, with a greater impact in Ontario than Alberta. The larger impact in Ontario is a bit surprising considering the larger percentage of fed cattle exports to the U.S. from Alberta. The negative impact for Alberta, which was significant with a one‐tailed test was not statistically significant for a two‐tailed test, as was the case for Ontario.
Policy change impacts were quite robust. Re‐estimating the model with only the Nebraska fed cattle price and the policy change dummy variables resulted in relatively minor changes in the policy change coefficients and significance. There was no substantive change in the coefficients for either the Alberta or Ontario model for the Canadian feed ban. Coefficients for the Rule 2 dummy variables declined slightly, from $4.04 and $1.77 in the full model to $3.976 and $1.58 in the condensed model, respectively for Alberta and Ontario, with no substantive change in significance. Coefficients increased slightly for MCOOL, from ‐$1.91 and ‐$3.58 in the full model, respectively, to ‐$2.17 and ‐$4.25, respectively, for Alberta and Ontario in the condensed model, but with little change in statistical significance.
Overall, results from weekly aggregate basis analysis leave some lingering questions relative to model reliability based upon structural changes occurring over time, limited numbers of observations precluding much more dissection by time periods, and difficulty in modeling certain market conditions as well as we might like. To further test the robustness of findings in our weekly aggregate analysis, we turn next to analysis of transaction data.
Data Description – Transaction Data
To complete analysis of transaction data basis determinants CanFax Research Services assisted in identifying cooperator feedlots to supply fed cattle transaction data. Data on transactions from all fed cattle sales from seven
Canadian‐US Basis for Cash Fed Cattle & Impacts from Government Regulations 31
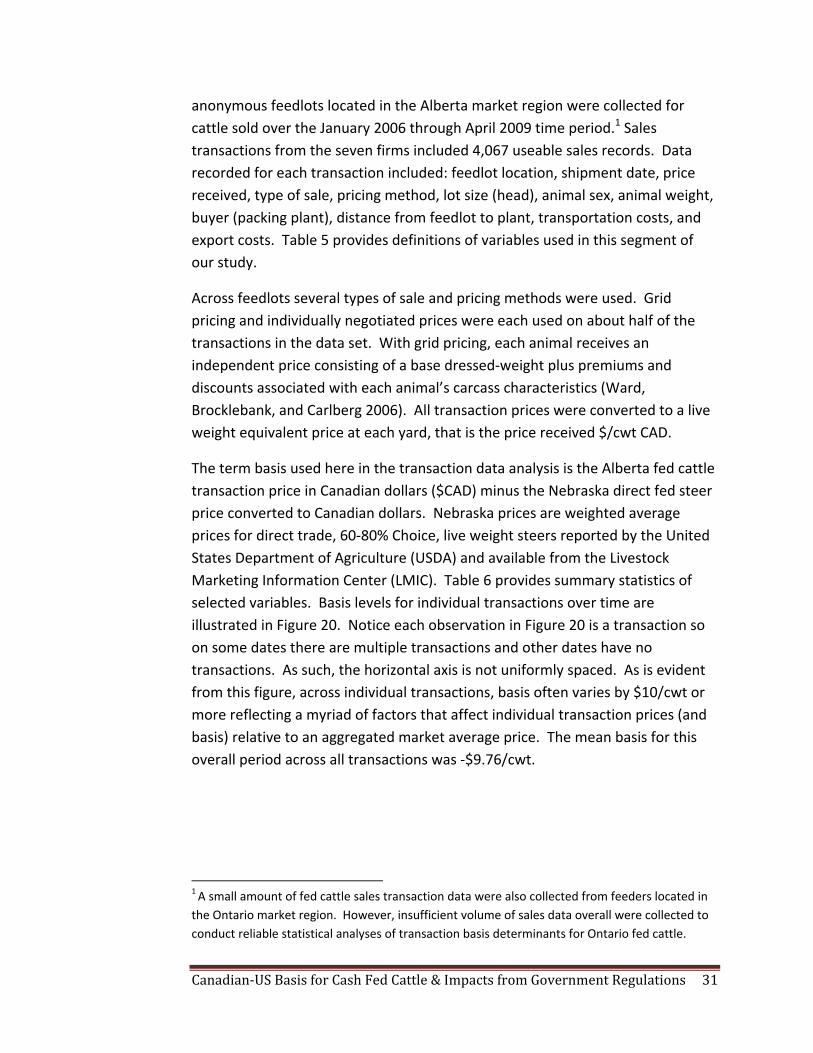
anonymous feedlots located in the Alberta market region were collected for cattle sold over the January 2006 through April 2009 time period.1 Sales transactions from the seven firms included 4,067 useable sales records. Data recorded for each transaction included: feedlot location, shipment date, price received, type of sale, pricing method, lot size (head), animal sex, animal weight, buyer (packing plant), distance from feedlot to plant, transportation costs, and export costs. Table 5 provides definitions of variables used in this segment of our study.
Across feedlots several types of sale and pricing methods were used. Grid pricing and individually negotiated prices were each used on about half of the transactions in the data set. With grid pricing, each animal receives an independent price consisting of a base dressed‐weight plus premiums and discounts associated with each animal’s carcass characteristics (Ward, Brocklebank, and Carlberg 2006). All transaction prices were converted to a live weight equivalent price at each yard, that is the price received $/cwt CAD.
The term basis used here in the transaction data analysis is the Alberta fed cattle transaction price in Canadian dollars ($CAD) minus the Nebraska direct fed steer price converted to Canadian dollars. Nebraska prices are weighted average prices for direct trade, 60‐80% Choice, live weight steers reported by the United States Department of Agriculture (USDA) and available from the Livestock Marketing Information Center (LMIC). Table 6 provides summary statistics of selected variables. Basis levels for individual transactions over time are illustrated in Figure 20. Notice each observation in Figure 20 is a transaction so on some dates there are multiple transactions and other dates have no transactions. As such, the horizontal axis is not uniformly spaced. As is evident from this figure, across individual transactions, basis often varies by $10/cwt or more reflecting a myriad of factors that affect individual transaction prices (and basis) relative to an aggregated market average price. The mean basis for this overall period across all transactions was ‐$9.76/cwt.
1 A small amount of fed cattle sales transaction data were also collected from feeders located in the Ontario market region. However, insufficient volume of sales data overall were collected to conduct reliable statistical analyses of transaction basis determinants for Ontario fed cattle.
Canadian‐US Basis for Cash Fed Cattle & Impacts from Government Regulations 32
Table 5. Definitions of Variables used in Transaction Basis Modela
Variable Definition BASISjt Feedlot specific Canadian fed cattle transaction live price minus weekly weighted average (65‐80%
choice) Nebraska fed cattle live cash price ($/cwt live weight) CTRPj,t Feedlot specific Canadian fed cattle transaction live price ($/cwt live weight) NEPRCjt Weekly weighted average (65‐80% choice) Nebraska fed cattle live cash market price, adjusted for
Canadian exchange rate ($/cwt live weight) DDOWd,t Zero‐one dummy variable for the day of the week cash market cattle were purchased (Monday,
Tuesday,…, Sunday) DMONmt Zero‐one dummy variable for month of the year cash market cattle were purchased (January, February,…,
December) NOHDj Number of head in the sale lot ADRESSWtj Average dressed weight in the sale lot (pounds/carcass) DISTPj Distance to packer (kilometers) WCDPt West coast diesel price, adjusted for Canadian exchange rate. ($/gallon) CAPt Canadian packing plant utilization rate during the data period (%) SHWCNUSt Ratio of western Canada steer & heifer slaughter head to western U.S. steer & heifer slaughter head (%) DTYPj Zero‐one dummy variable for the type of cattle purchased (steers, heifers, mixed/unidentified sex) SALEj Zero‐one dummy variable for type of sale (grid or cash) DFLTj Zero‐one dummy variable for the feedlot that sold cash market cattle (feedlot 1, feedlot 2,…, feedlot 7) DPPTj Zero‐one dummy variable for the packing plant that purchased cash market cattle (plant 1, plant 2,…,
plant 8) FSRMjt Zero‐one dummy variable for the enactment of the enhanced feedban and specified risk materials
regulation (July 12, 2007) RULE2jt Zero‐one dummy variable or the approval of Rule 2 which allowed for exporting of beef (of all ages) and
live cattle born after March 1, 1999 for slaughter and breeding purposes (November 20, 2007) MCOOLjt Zero‐one dummy variable for the enactment of Mandatory COOL in the U.S. (September 30, 2008)
aAll prices are in Canadian dollars unless otherwise noted.
Canadian‐US Basis for Cash Fed Cattle & Impacts from Government Regulations 33
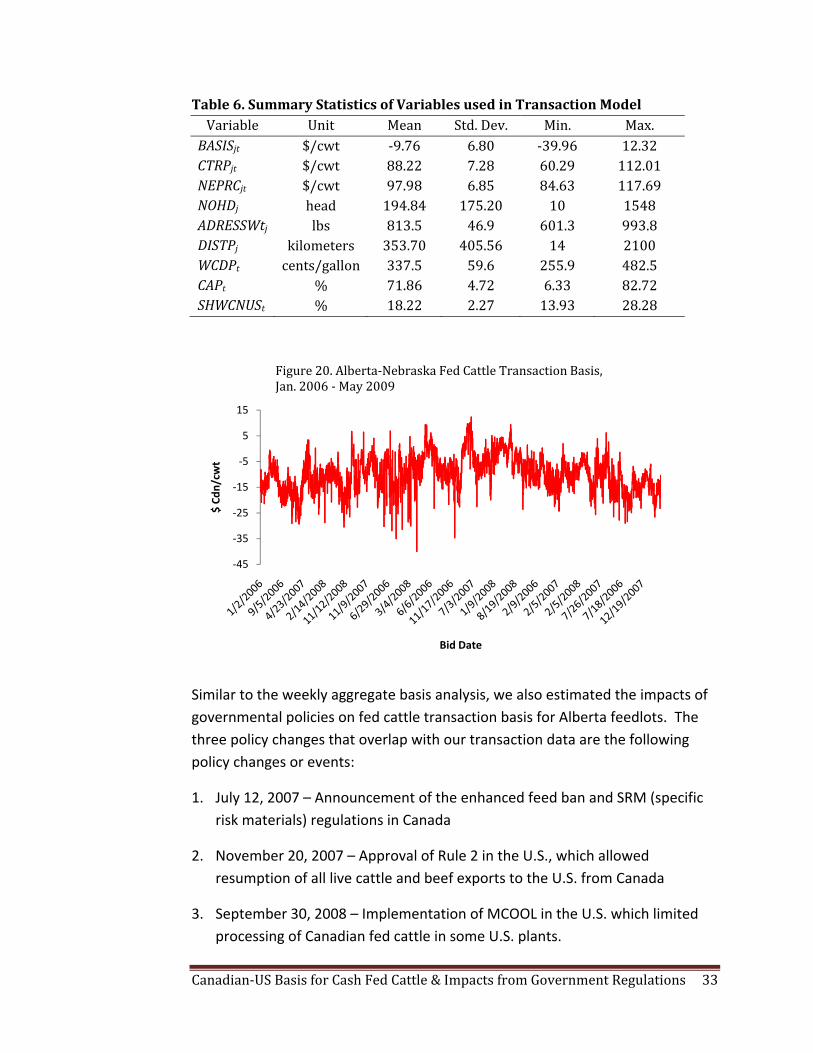
Table 6. Summary Statistics of Variables used in Transaction Model Variable Unit Mean Std. Dev. Min. Max. BASISjt $/cwt ‐9.76 6.80 ‐39.96 12.32 CTRPjt $/cwt 88.22 7.28 60.29 112.01 NEPRCjt $/cwt 97.98 6.85 84.63 117.69 NOHDj head 194.84 175.20 10 1548 ADRESSWtj lbs 813.5 46.9 601.3 993.8 DISTPj kilometers 353.70 405.56 14 2100 WCDPt cents/gallon 337.5 59.6 255.9 482.5 CAPt % 71.86 4.72 6.33 82.72 SHWCNUSt % 18.22 2.27 13.93 28.28
Similar to the weekly aggregate basis analysis, we also estimated the impacts of governmental policies on fed cattle transaction basis for Alberta feedlots. The three policy changes that overlap with our transaction data are the following policy changes or events:
1. July 12, 2007 – Announcement of the enhanced feed ban and SRM (specific risk materials) regulations in Canada
2. November 20, 2007 – Approval of Rule 2 in the U.S., which allowed resumption of all live cattle and beef exports to the U.S. from Canada
3. September 30, 2008 – Implementation of MCOOL in the U.S. which limited processing of Canadian fed cattle in some U.S. plants.
‐45
‐35
‐25
‐15
‐5
5
15
$ Cd
n/cw
t
Bid Date
Figure 20. Alberta‐Nebraska Fed Cattle Transaction Basis, Jan. 2006 ‐ May 2009
Canadian‐US Basis for Cash Fed Cattle & Impacts from Government Regulations 34
The three policy changes noted here are a subset of the policy changes analyzed in the aggregate weekly data. Because our transaction data only spans from January 2006 through April 2009, as opposed to going back to 1998 as does our weekly aggregate data, we can only include the three most recent of the six policy changes analyzed in the transaction basis analysis. The overlapping time periods of the transaction and weekly aggregate data provide for a direct comparison of basis change estimates across the two data sets for these three policy changes.
Model Development – Transaction Data
The transaction data have the characterization of a panel (i.e., the data have both time series and cross sectional components), more specifically a long panel consisting of many time periods (i.e., sales across time) but few entities (i.e., feedlots). The panel is unbalanced, meaning there are different numbers of sale lots across days, due to the transaction nature of the data. Along with the panel being unbalanced another issue arises as there is more than one observation per time period per cross section. This is typical in transaction data because any particular feedlot often sells none and may sell multiple lots of cattle on a single day. As a result, there is not a consistently‐sequenced time variable for such data which affects empirical modeling issues.2 These issues are discussed later. Panel data have traditionally been analyzed using unobserved effects models which are characterized by the following equation:
where is 1 and can contain observable variables that change across t but not i, variables that change across i but not t, and variables that change across i and t, is the individual effect, and are the idiosyncratic error which change across t as well as across i. The discussion becomes whether should be treated as a fixed effect or a random effect. That is whether is a parameter to be estimated or a random variable. There are two preconditions for using random effects modeling in unbalanced panel data estimation; if either is violated, fixed effects should be used. One precondition is that the observations can be described as being drawn randomly from a given population. In most cases this is not a reasonable assumption. The key consideration when testing between fixed effects and random effects is whether and are correlated
2 Statistical computing packages consider panel data as based on a set of individuals observed at a set of times. For each individual at each time, there is at most one observation.
Canadian‐US Basis for Cash Fed Cattle & Impacts from Government Regulations 35
(Wooldridge 2003). Within the fixed effects model an individual specific effect is time invariant and considered part of the intercept, is allowed to be correlated to other regressors; whereas, by contrast, in the random effects model is part of the errors and thus should not be correlated with any regressor; otherwise a core OLS assumption is violated (Park 2009). According to Greene (2003, p. 301) “The fixed effects approach has one considerable virtue; there is little justification for treating the individual effects as uncorrelated with other regressors, as it is assumed in the random effects model. The random effects treatment, therefore, may suffer from the inconsistency due to this correlation between the included variables and the random effects.” Hausman (1978) proposed a test on the difference between the random effects and fixed effects estimates. Under the null hypothesis of no correlation, both OLS in the LSDV model and GLS in the random effects model are consistent, but OLS is inefficient; while under the alternative hypothesis of correlation, OLS is consistent, but GLS is not (Greene, 2003).
To control for components of u that are fixed for one subject we estimate the regression:
Because we have a small number of feedlots (seven) we are able to generate a dummy variable for each feedlot, and add them to the regression for the component. The model is a least squares dummy variable (LSDV) regression, a fixed effects model, in which the model has constant slopes but intercepts that differ according to the cross‐sectional unit, in this case the feedlot (Yaffee 2003). Following Greene (2003) an F‐test can be used to test the hypothesis that the ′ are all equal. Under the null hypothesis of equality, the efficient estimator is
pooled least squares.
The test statistics is:
1,/ 1
1 / ∑
where LSDV indicates the dummy variable model and Pooled indicates the pooled or restricted model with only a single constant term.
The of each model is relatively high; if all but one intercept is eliminated, the
coefficient of determination, , is 0.70 in the pooled model and 0.72 in the
Canadian‐US Basis for Cash Fed Cattle & Impacts from Government Regulations 36
LSDV model. The values of the F random variables for the pooled and LSDV models are F(40, 4026) = 233.27 (p‐value < 0.0000) and F(46, 4020) = 228.01 (p‐value < 0.0000). This shows that the feedlot‐specific constants differ and a pooled model with one intercept is not appropriate. Overall, we conclude that the alternative OLS model omits important time‐invariant feedlot effects, and hence we use a feedlot fixed effects model.
When performing the Hausman test, the variance covariance matrix for the Hausman test was not able to be inverted. This happens in the presence of time invariant variables in the model. These are the feedlot dummy variables. Alternatively, there is another approach developed by Wu (1973). The Durbin‐Wu‐Hausman (DWH) test is numerically equivalent to the standard Hausman test (Christopher, Schaffer, and Stillman 2007). The test was performed by obtaining the group means of the time invariant variables and adding them to the estimated random effects model. Then testing the joint hypothesis that the coefficients on the group means are all zero is equivalent to the Hausman test, but avoids the problem of singular covariance matrix. The hypothesis that the individual effects are uncorrelated with the other regressors was rejected (i.e. there is correlation between an effect and the explanatory variables). This suggests that these effects are correlated with other variables in the model, thus the fixed effects model is appropriate.
Given the nature of the data, the variance of basis may potentially increase or decrease with increases in the level of the basis and/or increase or decrease with changes in the independent variables. The Breusch‐Pagan Godfrey test was employed to test the null hypothesis of homoskedasticity in the model. The chi‐squared test statistic of 0.67 (p‐value = 0.41) lead us to fail to reject the null hypothesis at a one percent significance level which provides evidence of no cross‐sectional correlation.
Autocorrelation is a potential problem as it is reasonable to expect error terms from different observations to be correlated with one another. Two potential forms to consider are that autocorrelation is common to all panels or that autocorrelation is specific to each panel. If either form of autocorrelation is hypothesized, a time variable must also be specified. However, for this data there was not a consistent time variable because we often have zero or more than one observation per time period per cross section. This makes it impossible to conduct a consistent test for autocorrelation of either form. As such, our
Canadian‐US Basis for Cash Fed Cattle & Impacts from Government Regulations 37
model is specified as having independent errors across observations. This could result in bias in our estimated standard errors.
To predict how changing government regulations in Canada and the United States have affected transaction prices for fed cattle in Alberta, an econometric model was developed to account for major variables that might influence transaction prices in Alberta relative to the Nebraska price. The framework for which variables impact feed cattle transaction basis to include in the model was drawn from previous research. Several nonlinear variables are included in the model to allow for nonlinear effects. For example, both linear and nonlinear terms for weight, lot size, and distance were included. To account for changes in the general price level of fed cattle during the data collection period, we included the weekly weighted average Nebraska fed cattle live cash market price, adjusted for Canadian exchange rate. The hedonic methodology proved useful as a tool for analyzing price variation for fed cattle and as a mechanism for examining packer preferences and the affect of government regulations and market conditions. The cash market basis for each lot of cattle was modeled as (see table 5 for variable definitions):
, , , , , ,
, , , , , ,
, , , , , 2 ,
where j refers to an individual transaction and all other variables are defined in table 5.
Basis determinants used in our econometric model include factors such as general fed cattle price levels as basis has been shown to vary with fed cattle price level, diesel prices to account for changing transportation costs over time, measures of regional packing plant capacity utilization and steer and heifer slaughter differences to account for variation in local competition or changing feedlot vs. packer market leverage over time, and government policy changes during the time that were considered potentially important basis determinants.
The reason to include the basis determinants discussed here in addition to the policy variables of interest is to be able to isolate the impact of the policy changes, after adjusting for other market determinants that change over time.
Canadian‐US Basis for Cash Fed Cattle & Impacts from Government Regulations 38
Using such a multivariate modeling approach is the most appropriate way to isolate the impact of individual policy impacts.
Estimation Results – Transaction Data
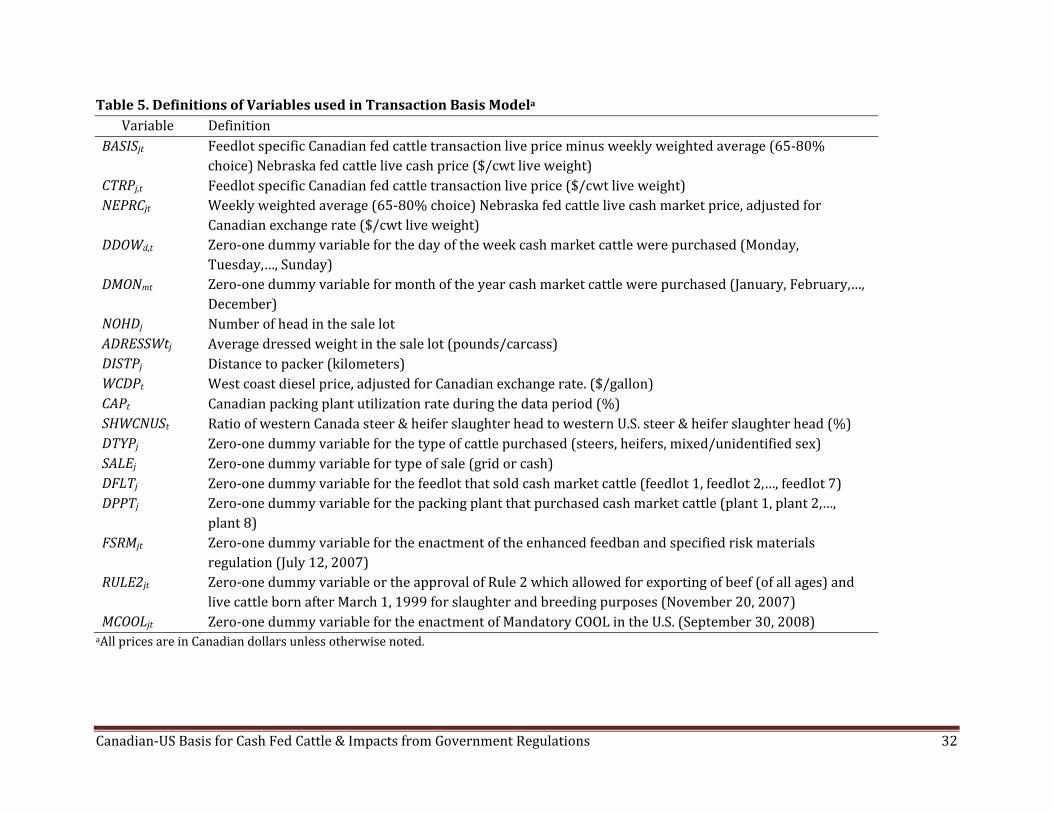
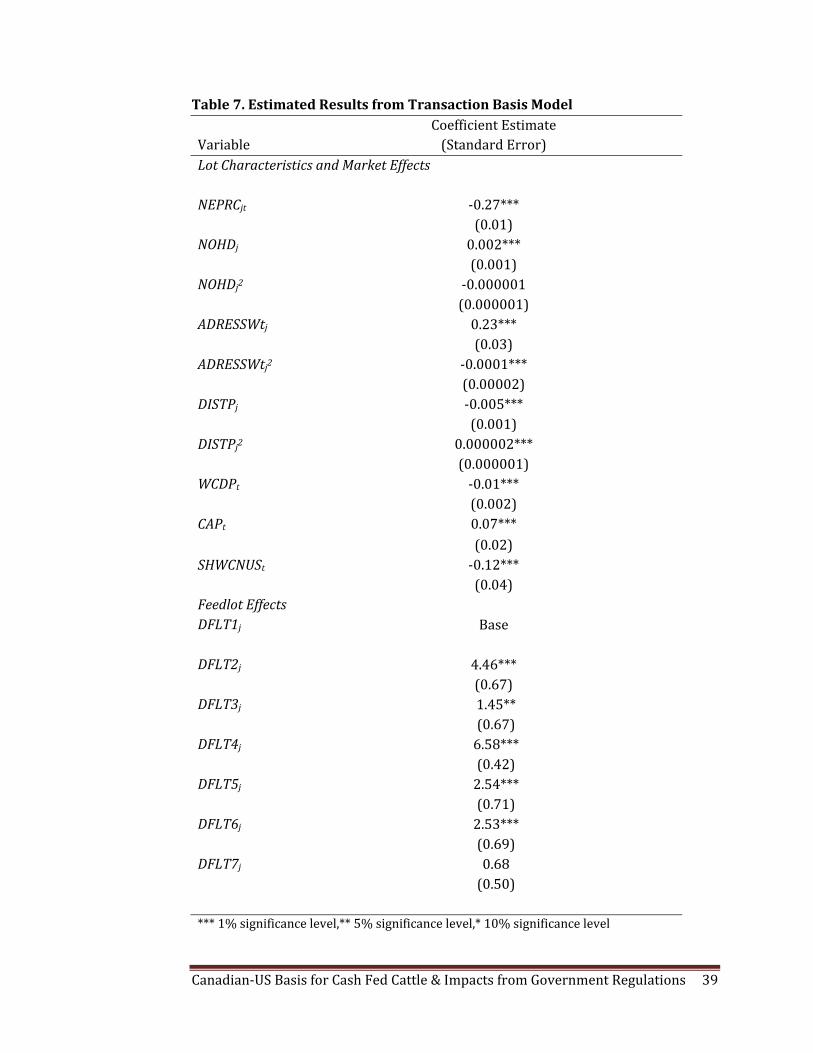
Empirical results for the basis model are presented in table 7. Coefficient estimates refer to a change in basis in $/cwt (hundredweight) from a one unit change in the independent variable, ceteris paribus. Positive coefficients represent a strengthening/narrowing basis meaning the Alberta fed cattle transaction price is nearer the Nebraska fed cattle price. Negative coefficients indicate a weakening/widening of the basis.
The coefficient on Nebraska fed cattle price was negative and statistically significant. Nebraska fed cattle price was hypothesized to be significant as Canadian cattle feeders watch Nebraska prices closely as an indicator of the U.S. fed cattle market when making fed cattle marketing decisions. The estimated coefficient was ‐$0.27/cwt. Thus, a $1/cwt increase in the Nebraska fed cattle price weakens Alberta fed cattle transaction basis by $0.27/cwt. This suggests that when fed cattle prices in general are high, Alberta basis widens.
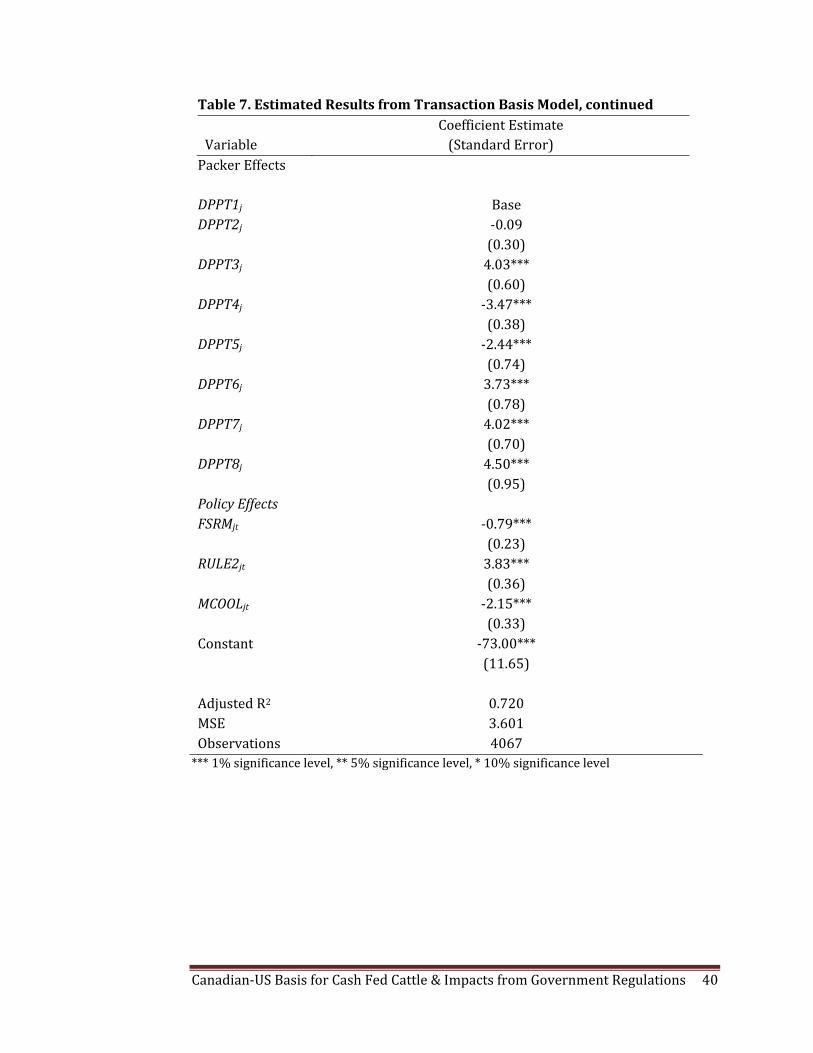
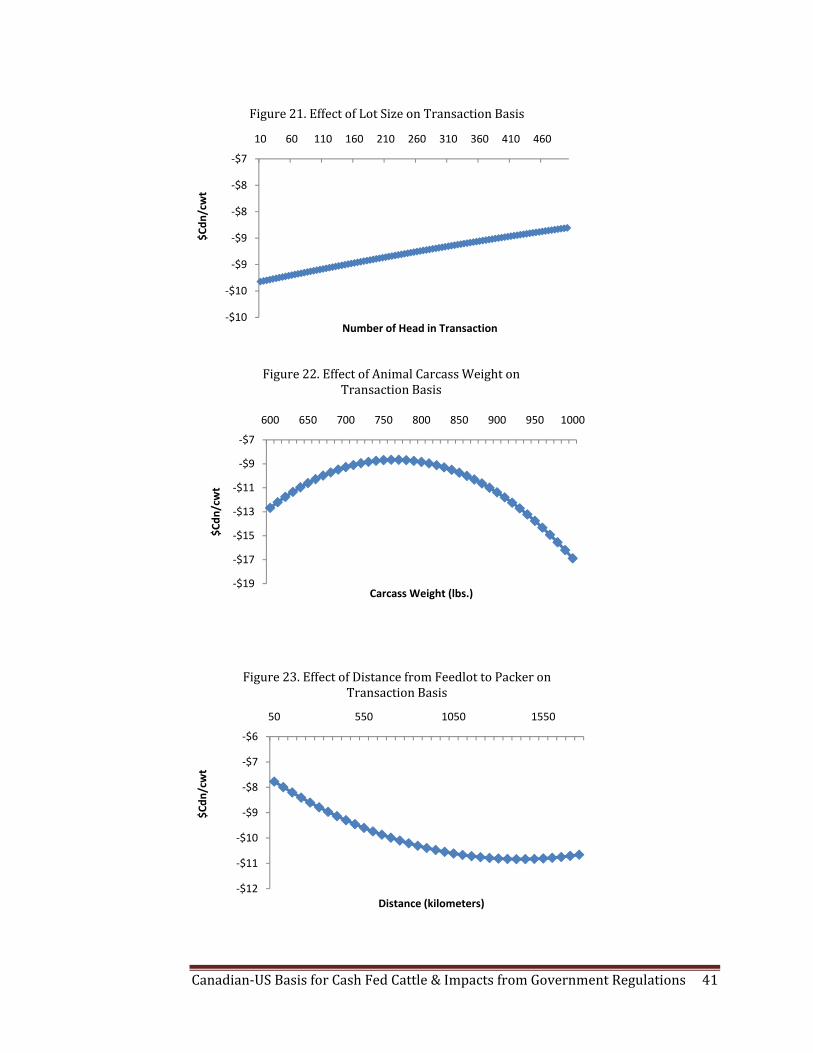
Several transaction specific factors were statistically significant in explaining basis variation. Lot size, dressed weight, and distance from the feedlot to the packing plant all had nonlinear influences. Basis narrowed as lot size increased at a declining rate. As shown in Figure 21, transaction basis for a transaction with 15 head is about $1.00/cwt weaker than for a transaction involving 500 head. Packers prefer larger lot sizes to reduce buying search costs.
The effect on basis of an additional pound of carcass weight was quadratic. Basis strengthened as dressed carcass weight increased from 600 lbs to 760 lbs by about $4.00/cwt (Figure 22). Higher prices are typically realized for cattle that meet packer’s preferred weight specifications because light‐weight carcasses reduce slaughter and processing efficiency and heavy‐weight carcasses produce excessively large wholesale products relative to customer preferences. Basis decreased at a declining rate with the distance from the feedlot to the packer (Figure 23). To ship cattle 300 km relative to 100 km, basis declines about $1.00/cwt. Whereas, to ship from 700 km relative to 500 km basis weakens about $0.50/cwt. This is consistent with lower prices being paid as transportation costs increase with distance. These findings are similar to previous studies involving fed cattle transaction prices (Schroeder et al. 1993).
Canadian‐US Basis for Cash Fed Cattle & Impacts from Government Regulations 39
Table 7. Estimated Results from Transaction Basis Model
Variable Coefficient Estimate (Standard Error)
Lot Characteristics and Market Effects
NEPRCjt ‐0.27*** (0.01) NOHDj 0.002*** (0.001) NOHDj2 ‐0.000001 (0.000001) ADRESSWtj 0.23*** (0.03) ADRESSWtj2 ‐0.0001*** (0.00002) DISTPj ‐0.005*** (0.001) DISTPj2 0.000002*** (0.000001) WCDPt ‐0.01*** (0.002) CAPt 0.07*** (0.02) SHWCNUSt ‐0.12*** (0.04) Feedlot Effects DFLT1j Base DFLT2j 4.46*** (0.67) DFLT3j 1.45** (0.67) DFLT4j 6.58*** (0.42) DFLT5j 2.54*** (0.71) DFLT6j 2.53*** (0.69) DFLT7j 0.68 (0.50) *** 1% significance level,** 5% significance level,* 10% significance level
Canadian‐US Basis for Cash Fed Cattle & Impacts from Government Regulations 40
Table 7. Estimated Results from Transaction Basis Model, continued
Variable Coefficient Estimate (Standard Error)
Packer Effects
DPPT1j Base DPPT2j ‐0.09 (0.30) DPPT3j 4.03*** (0.60) DPPT4j ‐3.47*** (0.38) DPPT5j ‐2.44*** (0.74) DPPT6j 3.73*** (0.78) DPPT7j 4.02*** (0.70) DPPT8j 4.50*** (0.95) Policy Effects FSRMjt ‐0.79*** (0.23) RULE2jt 3.83*** (0.36) MCOOLjt ‐2.15*** (0.33) Constant ‐73.00*** (11.65) Adjusted R2 0.720 MSE 3.601 Observations 4067 *** 1% significance level, ** 5% significance level, * 10% significance level
Canadian‐US Basis for Cash Fed Cattle & Impacts from Government Regulations 41
‐$10
‐$10
‐$9
‐$9
‐$8
‐$8
‐$7
10 60 110 160 210 260 310 360 410 460
$Cdn
/cwt
Number of Head in Transaction
Figure 21. Effect of Lot Size on Transaction Basis
‐$19
‐$17
‐$15
‐$13
‐$11
‐$9
‐$7
600 650 700 750 800 850 900 950 1000
$Cdn
/cwt
Carcass Weight (lbs.)
Figure 22. Effect of Animal Carcass Weight on Transaction Basis
‐$12
‐$11
‐$10
‐$9
‐$8
‐$7
‐$6
50 550 1050 1550
$Cdn
/cwt
Distance (kilometers)
Figure 23. Effect of Distance from Feedlot to Packer on Transaction Basis
Canadian‐US Basis for Cash Fed Cattle & Impacts from Government Regulations 42
Statistically and economically significant feedlot and packer effects were found. Results show that basis varies across feedlots by as much as $6.58/cwt. Differences exist due to relationships with certain packers and/or market access in the domestic or export market. Also, which packer bought the cattle in a transaction resulted in significantly different basis levels ranging from ‐$3.47/cwt to $4.03/cwt relative to the base packer.
Diesel prices were included in the model to proxy changes in transportation costs over time when exporting Canadian fed cattle to the U.S. Increasing diesel prices adversely affected the Alberta‐Nebraska basis, as 1 cent/gallon increase in diesel price reduced the Alberta‐Nebraska basis by $0.01/cwt. Differences in regional steer and heifer slaughter and regional slaughter capacity utilization were intended to capture near‐term supply‐demand differences in Canada and the U.S. An increase in the ratio of western Canadian steer and heifer slaughter to western U.S. steer and heifer slaughter adversely affected the Alberta‐Nebraska basis by $0.12/cwt, while an increase in slaughter capacity utilization rate in western Canada positively affected the Alberta‐Nebraska basis by $0.07/cwt. These results indicate that regional market conditions in Canada relative to the United States influence Alberta cattle basis.
Dummy variables for policy and regulatory changes had expected directions of impact on Alberta fed cattle transaction prices relative to Nebraska price. Announcement and implementation of the Canadian feed ban was expected to adversely affect the Canadian‐U.S. basis. Specifically, regulations requiring removal of specific risk materials (SRM) from carcasses in processing were expected to increase slaughter costs, making the Canadian processing industry incur more costs relative to the United States, thus translating into lower fed cattle bids from Canadian packers relative to U.S. packers. The decrease in basis associated with SRM removal regulations was $0.79/cwt. Full resumption of cattle and beef movement across the Canadian‐U.S. border (Rule 2) positively and statistically significantly affected the Alberta basis. Rule 2 enactment increased basis $3.83/cwt. Implementation of MCOOL, reportedly adversely affected the Canadian‐U.S. fed cattle basis (Kay 2008). MCOOL was associated with a $2.15/cwt decline in basis for Alberta fed cattle transactions.
Canadian‐US Basis for Cash Fed Cattle & Impacts from Government Regulations 43
Conclusions – Transaction Data
The results and associated inferences regarding the Alberta‐U.S. fed cattle cash basis provide an improved understanding of how traditional and more recent basis determinants affect fed cattle trade between Canada and the United States. The three policy variables included in this study explicitly measure Canadian fed cattle market access to the United States market.
The Canadian government’s regulation against feeding any animal products containing SRM to livestock may have increased market access because the regulation was targeted at decreasing risk of disease transmission. However, enactment of this regulation resulted in a net reduction in Alberta fed cattle price relative to Nebraska of $0.79/cwt. The new feeding regulation apparently increased slaughter costs for the Canadian processing industry relative to the U.S. by more than it expanded market access for Canadian cattle.
Regulations that increased market access, Rule 2, had a strong positive effect on basis, strengthening basis by $3.83/cwt. This demonstrates how important having additional access to the U.S. market can have on Canadian cattle feeders. The full border closure to both cattle and beef trade, which occurred prior to our data period, certainly had a much greater impact on Alberta basis than our estimate of Rule 2. However, the important aspect is that Rule 2 was an incremental border opening to just fed cattle as beef trade was already open prior to enactment of Rule 2. Thus, the Rule 2 impact represents the effect on basis of just live cattle trade.
Enactment of COOL in the United States adversely affected Alberta fed cattle basis. CanFax (2009, p.4) claim that “while COOL is not a direct barrier to market access it has resulted in decreased demand for Canadian cattle by U.S. packers and therefore has influenced Canadian fed cattle prices” is supported by our research. COOL enactment reduced Alberta fed cattle transaction basis by $2.15/cwt. Uncertainty remains regarding the implementation of COOL, which has been evident in the fluctuations in the fed cattle basis and fluctuations in prices. Since COOL is in the early stages, limited information is available to measure its long‐term impact.
Canadian‐US Basis for Cash Fed Cattle & Impacts from Government Regulations 44
References
Bailey, D., B.W. Brorsen, and C. Fawson. “Buyer Concentration at Feeder Cattle Auctions.” Review of Agricultural Economics. 15(1, 1993):103‐119.
Canadian Food Inspection Agency (CFIA). “Canada’s New Animal Feed Regulations Come into
Force.” 2007a. www.inspection.gc.ca. Canadian Food Inspection Agency (CFIA). “Exporting Cattle, Bison and their Products under the
USDA Final Rule on BSE Risk.” 2007b. www.inspection.gc.ca. CanFax Research Services. “The Importance of Market Access to the Canadian Beef and Cattle
Industry.” Report prepared for the Canadian Cattleman’s Association Trade Committee. 2009.
Christopher F.B., M.E. Schaffer, and S. Stillman. “IVENDOG: Stata module to calculate Durbin‐
Wu‐Hausman endogeneity test after ivreg.” Report prepared for Open Archives Initiative. 2007. Available at http://www.scientificcommons.org/1036116. Accessed 10/16/09.
Church, J. and D. Gordon. “Market Power in the Alberta Red Meat Packing Industry.” University
of Calgary, Institute for Advanced Policy Research, Technical Paper 07004, May 2007. Feuz, D.M., C Harris, D. Bailey, and G. Halverson. “Transportation and Quality Adjusted Basis.”
Paper presented at the Western Agricultural Economics Association Annual Meetings, Big Sky, Montana, June 25‐27, 2008.
Greene, W.H. Econometric Analysis, 5th edition. Upper Saddle Rive, New Jersey: Prentice‐Hall,
Inc. 2003. Jones, R., T. Schroeder, J. Mintert, and F. Brazle. “The Impacts of Quality on Cash Fed Cattle
Prices.” Southern Journal of Agricultural Economics. 24(December, 1992):149‐162. Kay, S. “MCOOL Has Cost Canadian Producers C$92M.” Cattle Buyers Weekly. December 8,
2008. Klein, K., D. McGivern, and K. Grier. “Exchange Rate Impacts on the Canadian Beef Industry.”
Report for the National Beef Industry Development Fund, March 2006. http://www.canfax.ca/beef_supply/projects.htm
Livestock Marketing Information Center (LMIC). 2009. Englewood, CO.
Canadian‐US Basis for Cash Fed Cattle & Impacts from Government Regulations 45
Miljkovic, D. “US and Canadian Livestock Prices: Market Integration and Trade Dependence.” Applied Economics (2007):1‐11.
Muth, M.K., Y. Liu, S.R. Koontz, and J.D. Lawrence. “Differences in Prices and Price Risk Across
Alternative Marketing Arrangements Used in the Fed Cattle Industry.” Journal of Agricultural and Resource Economics. 33(1, 2008):118‐135.
Parcell, J.L., T.C. Schroeder, and K.C. Dhuyvetter. “Factors Affecting Live Cattle Basis.” Journal of
Agricultural and Applied Economics 32, 3(December 2000):531‐541. Park, H.M. 2009. Linear Regression Models for Panel Data Using SAS, Stata, LIMDEP, and SPSS.
Working paper. The University Information Technology Services (UITS) Center for Statistical and Mathematical Computing, Indiana University. Available at http://www.indiana.edu/~statmath/stat/all/panel. Last accessed 11/9/09.
Rude, J. and J. Carlberg. “Kill or Shill: Processing Capacity and Cattle Prices with a Closed
Border.” Current Agriculture, Food, & Resource Issues 7(2006):85‐93. Rude, J., J. Carlberg, and S. Pellow. “Integration to Fragmentation: Post BSE Canadian Cattle
Markets, Processing Capacity, and Cattle Prices.” Canadian Journal of Agricultural Economics 55(2007):197‐216.
SAS Institute. SASTM System under Microsoft Windows. Release 9.1. SAS Institute Inc., Cary, NC,
2002‐2003. Schroeder, T.C. “Fed Cattle Spatial Transactions Price Relationships.” Journal of Agricultural
and Applied Economics. 29(2, 1997):347‐362. Schroeder, T.C., R. Jones, J. Mintert, and A.P. Barkley. “The Impact of Forward Contracting on
Fed Cattle Transaction Prices.” Review of Agricultural Economics. 15(2, 1993):325‐338. Schroeder, T.C. and C.E. Ward. Price Discovery and Captive Supply Implications for Alberta Beef
Producers and Feeders. Kansas State University, North American Institute for Beef Economic Research, Information Bulletin 12‐2006‐01, December 2006. www.naiber.org
Tomek, W.G. “Futures Prices as Forecasts.” Review of Agricultural Economics 19, 1(Spring‐
Summer 1997):23‐44. Tomek, W.G. and K.L. Robinson. Agricultural Product Prices. 3rd ed. Cornell University Press:
Ithaca, NY. 1990.
Canadian‐US Basis for Cash Fed Cattle & Impacts from Government Regulations 46
Tonsor, G.T., K.C. Dhuyvetter, and J.R. Mintert. “Improving Cattle Basis Forecasting.” Journal of Agricultural and Resource Economics 29, 2(August 2004):228‐241.
Vollrath, T. and C. Hallahan. “Testing the Integration of U.S.‐Canadian Meat and Livestock
Markets.” Canadian Journal of Agricultural Economics 54(1, 2006):55‐79. United States Department of Agriculture Agricultural Marketing Service (USDA‐AMS).
“Mandatory Country of Origin Labeling of Beef, Pork, Lamb, Chicken, Goat Meat, Wild and Farm‐Raised Fish and Shellfish, Perishable Agricultural Commodities, Peanuts, Pecans, Ginseng, and Macadamia Nuts; Final Rule.” Federal Register. vol. 74, no. 10. 2009.
Ward, C.E., A. Brocklebank, and J.G. Carlberg. “Canadian vs. U.S. Fed Cattle Pricing and
Marketing Practices and Viewpoints.” Report prepared for CanFax Research Services. 2006.
Ward, C.E., J.G. Carlberg, and A. Brocklebank. “Comparing Canadian and U.S. Cattle Feeding
Pricing Practices and Perceptions of Pricing Issues.” Current Agriculture, Food, & Resource Issues 8(2007):28‐39. www.CAFRI.org
Ward, C.E., S.R. Koontz, and T.C. Schroeder. “Impacts from Captive Supplies on Fed Cattle
Transaction Prices.” Journal of Agricultural and Resource Economics. 23(2, 1998):494‐514.
Wooldridge, J.M. Econometric Analysis of Cross Section and Panel Data. MIT Press, Cambridge.
2002. Wu, D.M. “Alternative Tests of Independence between Stochastic Regressors and
Distrurbances,” Econometrica, 41(4, 1973):733–750. Young, L.M. “U.S. – Canadian Agricultural Trade Conflicts: Time for a New Paradigm.” Estey
Centre Journal of International Law and Trade Policy, 1(1, 2000).