Embed Size (px)
Citation preview
R l f h 6 h d d 30 J 2012Results for the 6 months ended 30 June 2012
Capita plc
Wednesday 25 July 2012 y y
Agenda
1. Summary – Paul Pindar, Chief Executive
2. Financial results – Gordon Hurst, Group Finance Director
3. Creating long term value:
- Organic growth – Maggi Bell, Business Development Director
- Acquisitions – Paul Pindar
4. Summary & outlook – Paul Pindar
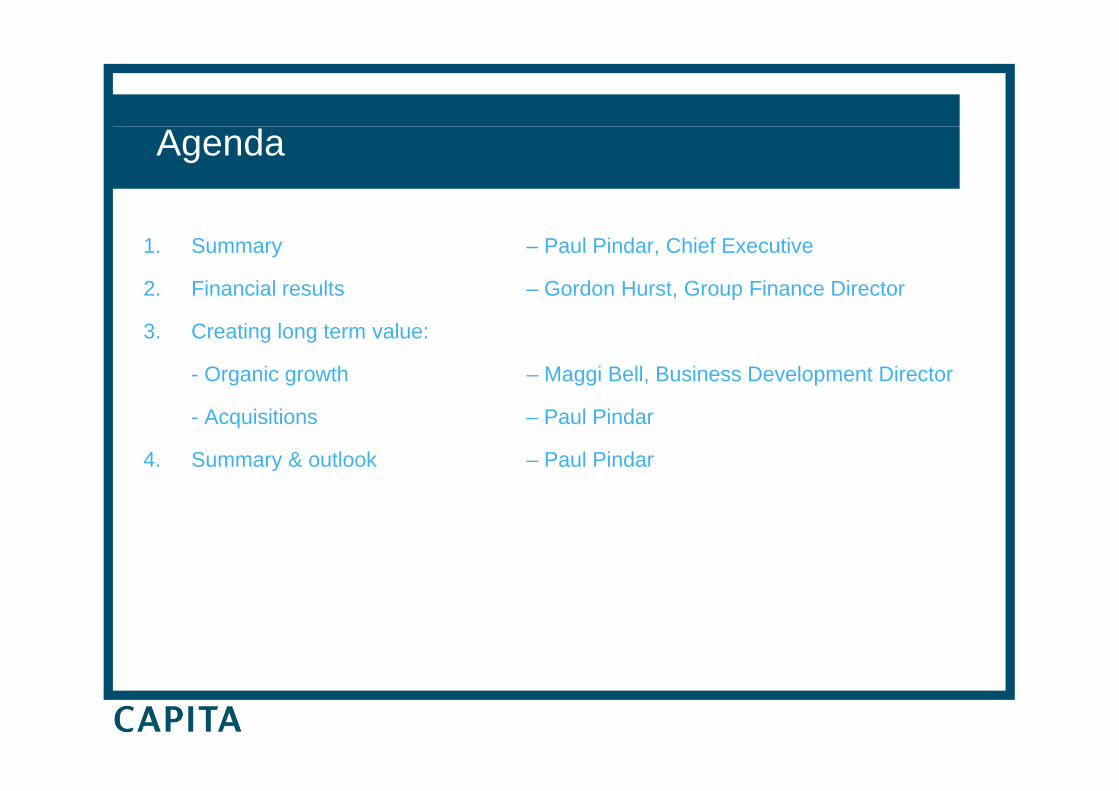
H1 2012 – The 3 key essentials
Hit numbers Profits, earnings & dividends all up 10%
Return to Reverse -7% decline in 2011organic growth On track for +3% in 2012
Improve 2011 full year: 85%cash conversion 2012 half year: 93%
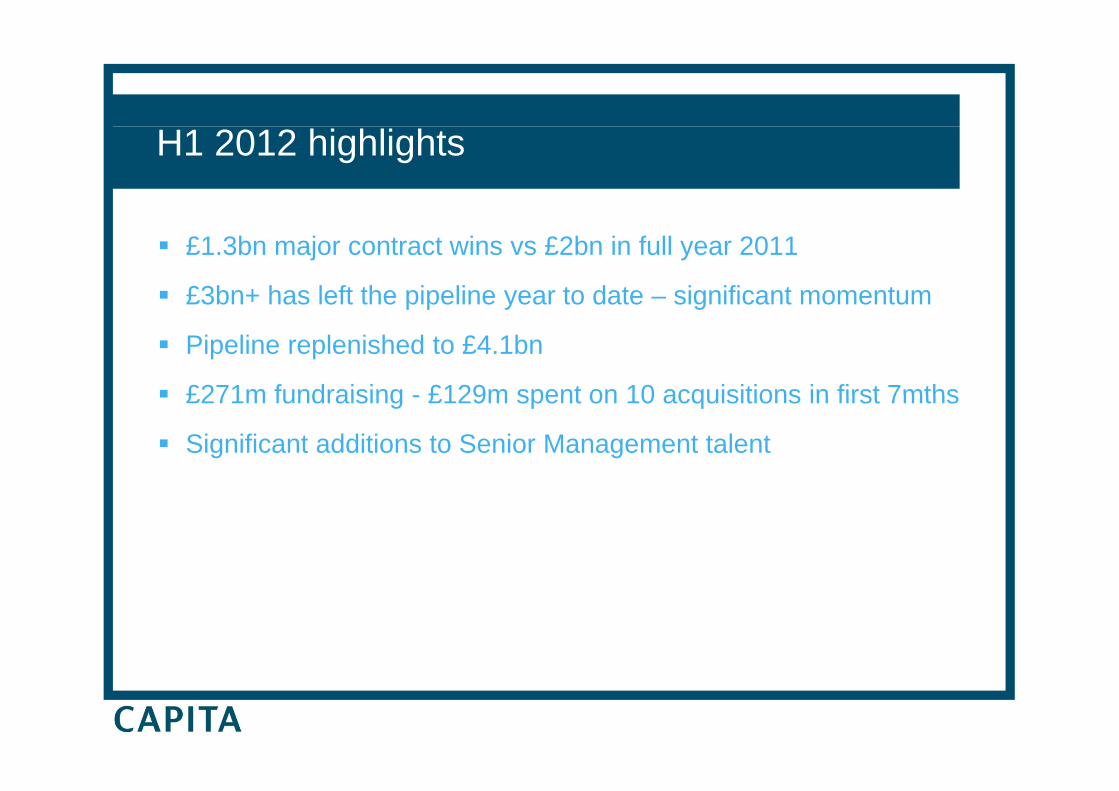
H1 2012 highlights
£1.3bn major contract wins vs £2bn in full year 2011
£3bn+ has left the pipeline year to date – significant momentump p y g
Pipeline replenished to £4.1bn
£271m fundraising - £129m spent on 10 acquisitions in first 7mths£271m fundraising - £129m spent on 10 acquisitions in first 7mths
Significant additions to Senior Management talent
Financial results
Gordon Hurst
Group Finance Director
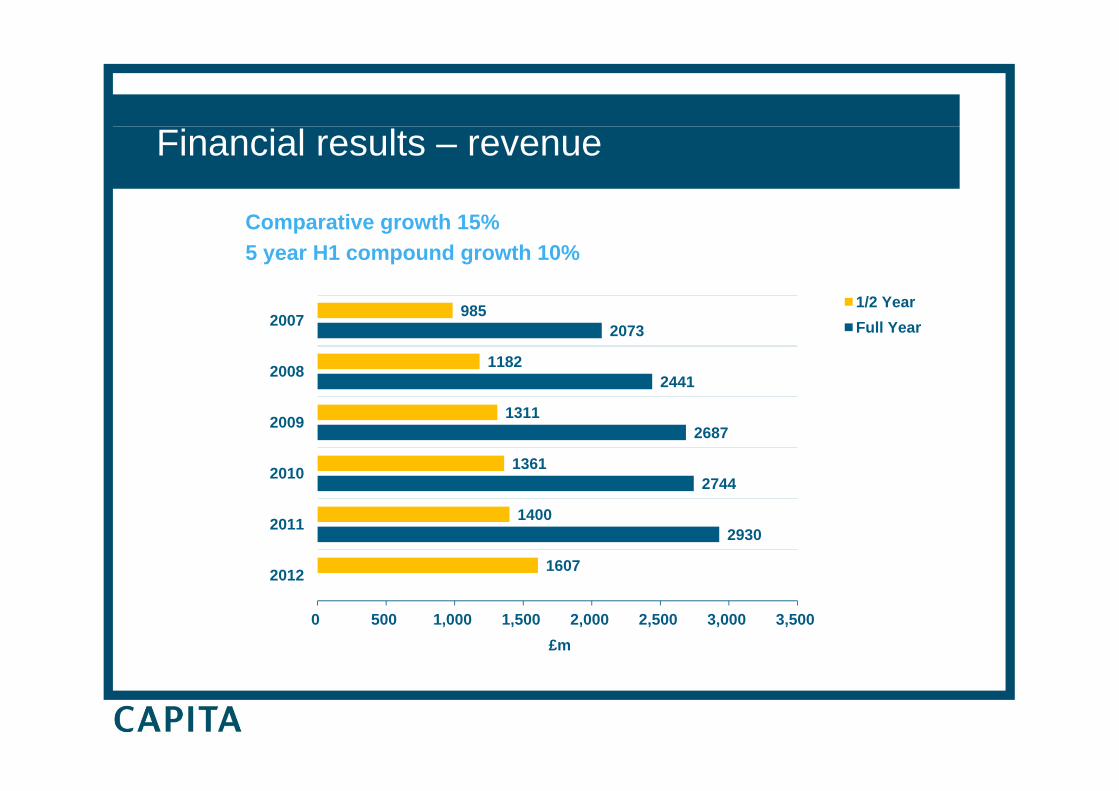
Financial results – revenue
C ti th 15%Comparative growth 15%5 year H1 compound growth 10%
985 1/2 Year
2441
2073
1182
985
2008
20071/2 YearFull Year
2744
2687
1361
1311
2010
2009
2930
2744
1607
1400
2012
2011
0 500 1,000 1,500 2,000 2,500 3,000 3,500
2012
£m
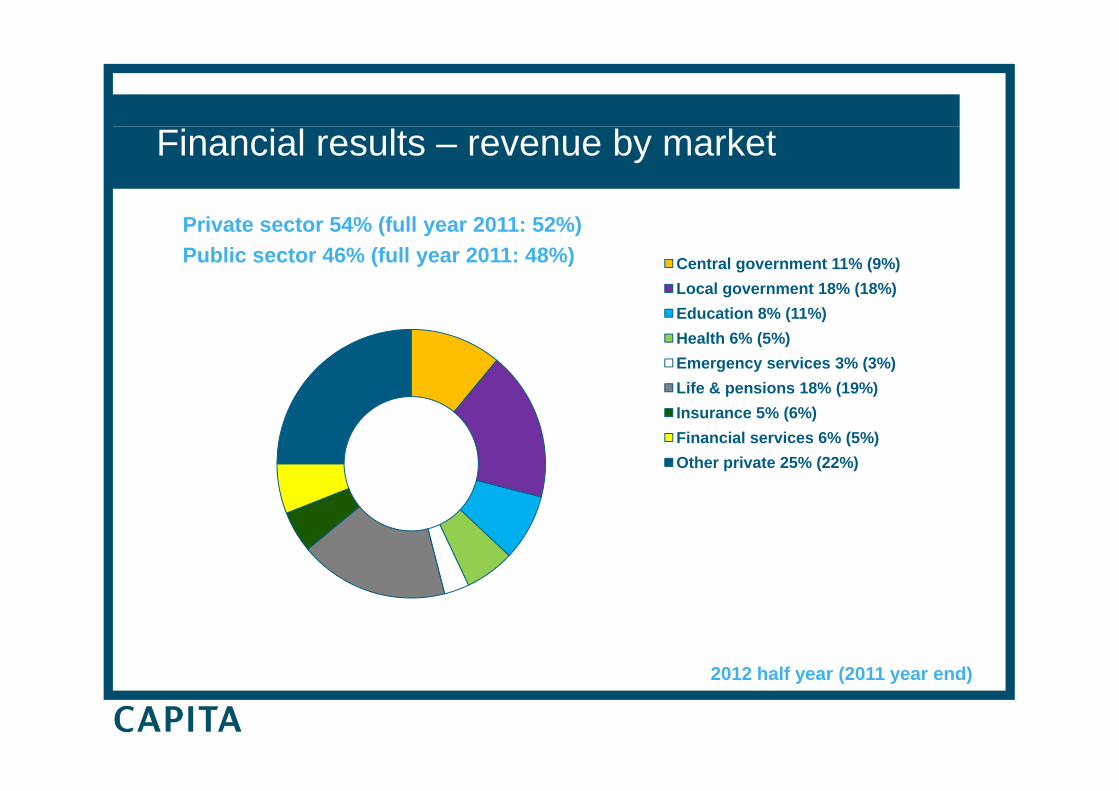
Financial results – revenue by market
Private sector 54% (full year 2011: 52%)Public sector 46% (full year 2011: 48%) Central government 11% (9%)
Local government 18% (18%)Education 8% (11%)Health 6% (5%)Emergency services 3% (3%)Life & pensions 18% (19%)p ( )Insurance 5% (6%)Financial services 6% (5%)Other private 25% (22%)
2012 half year (2011 year end)
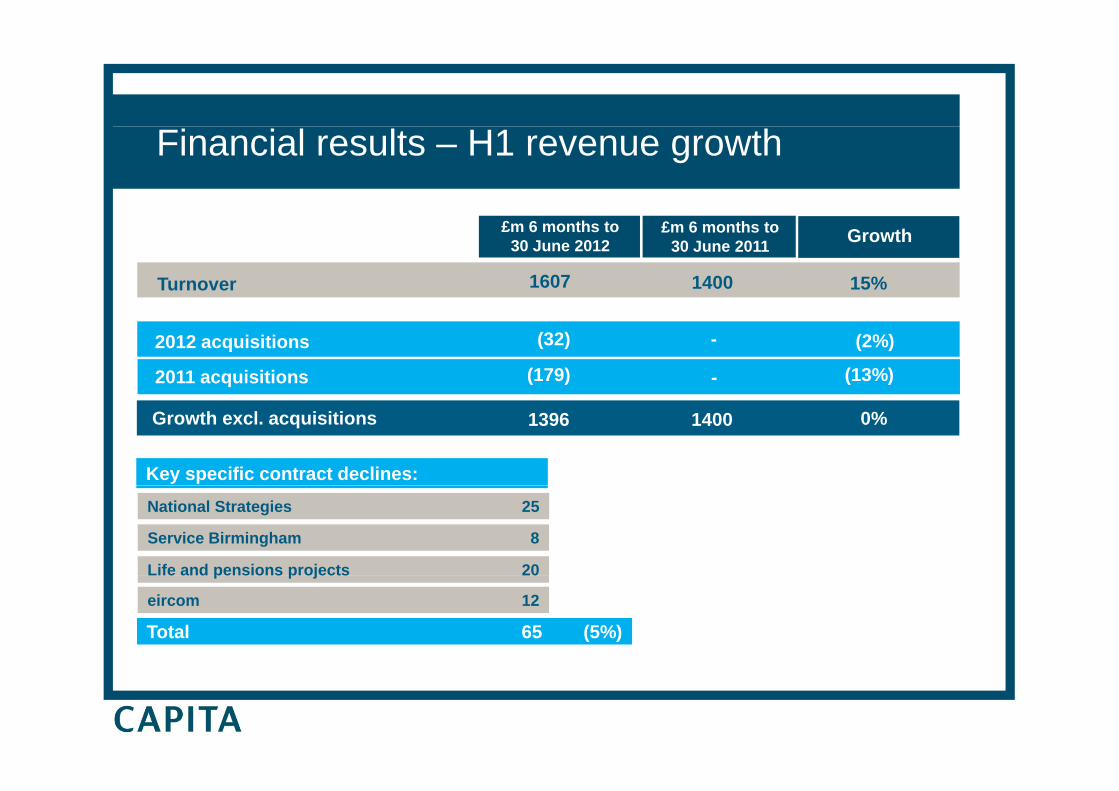
Financial results – H1 revenue growth
£m 2008
1400
£m 2007 Growth
Turnover 15%1607
£m 6 months to 30 June 2011
£m 6 months to 30 June 2012 £m 2008Growth
2001 2003 20042011 acquisitions
2012 acquisitions (2%)
(13%)(179)
(32)
-
-
[ ]Disposals [ ]%[ ] 1400Growth excl. acquisitions 0%1396
Key specific contract declines:
Service Birmingham 8
National Strategies 25
Life and pensions projects 20
eircom 12
Life and pensions projects 20
Total 65 (5%)
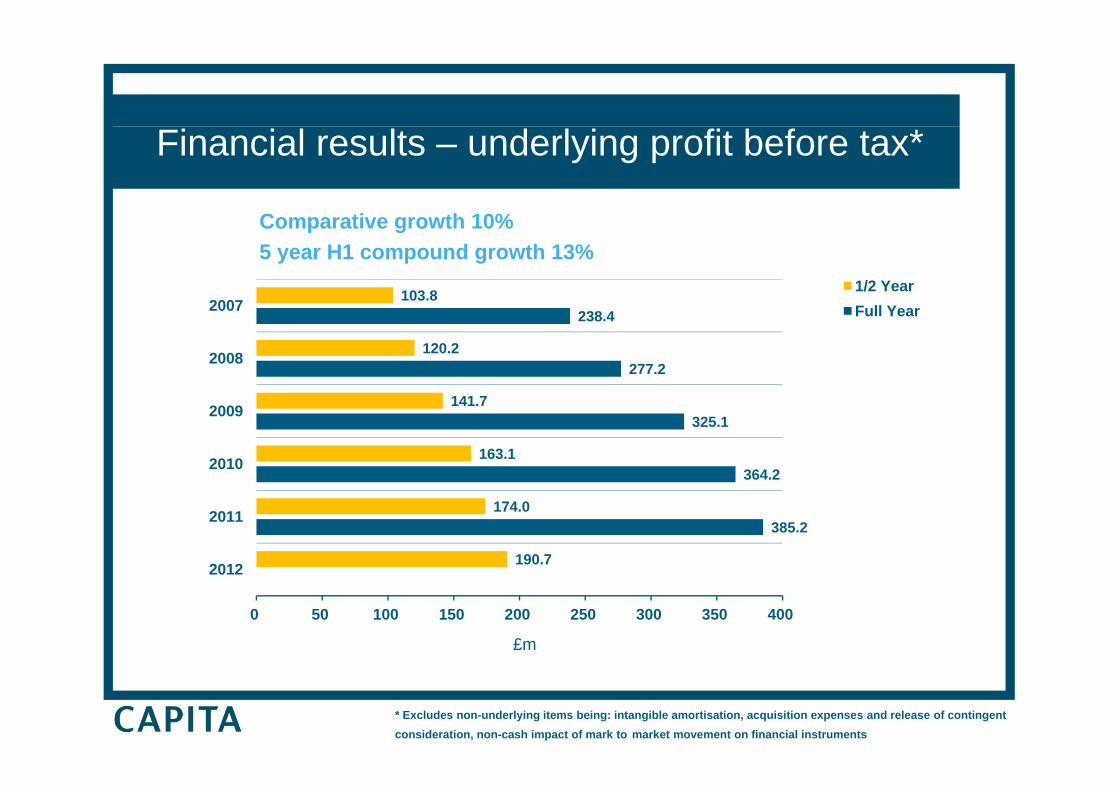
Financial results – underlying profit before tax*
C ti th 10%
103.820071/2 YearF ll Y
Comparative growth 10%5 year H1 compound growth 13%
277.2
238.4
141
120.22008
2007 Full Year
364.2
325.1
163.1
141.7
2010
2009
385.2
190.7
174.0
2012
2011
0 50 100 150 200 250 300 350 400
£m
* Excludes non-underlying items being: intangible amortisation, acquisition expenses and release of contingent consideration, non-cash impact of mark to market movement on financial instruments
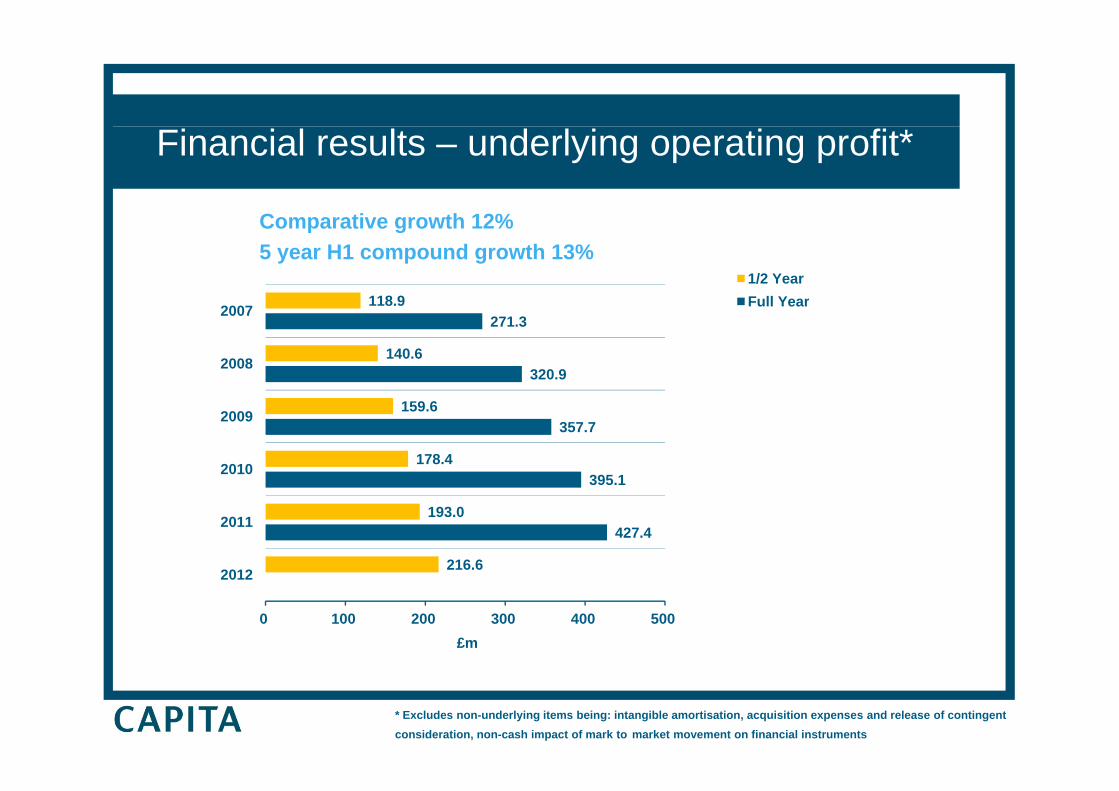
Financial results – underlying operating profit*
C ti th 12%
118.92007
1/2 YearFull Year
Comparative growth 12%5 year H1 compound growth 13%
320.9
271.3
140.6
8 9
2008
2007 Full Year
395.1
357.7
178.4
159.6
2010
2009
427.4
216.6
193.0
2012
2011
0 100 200 300 400 500
2012
£m
* Excludes non-underlying items being: intangible amortisation, acquisition expenses and release of contingent consideration, non-cash impact of mark to market movement on financial instruments
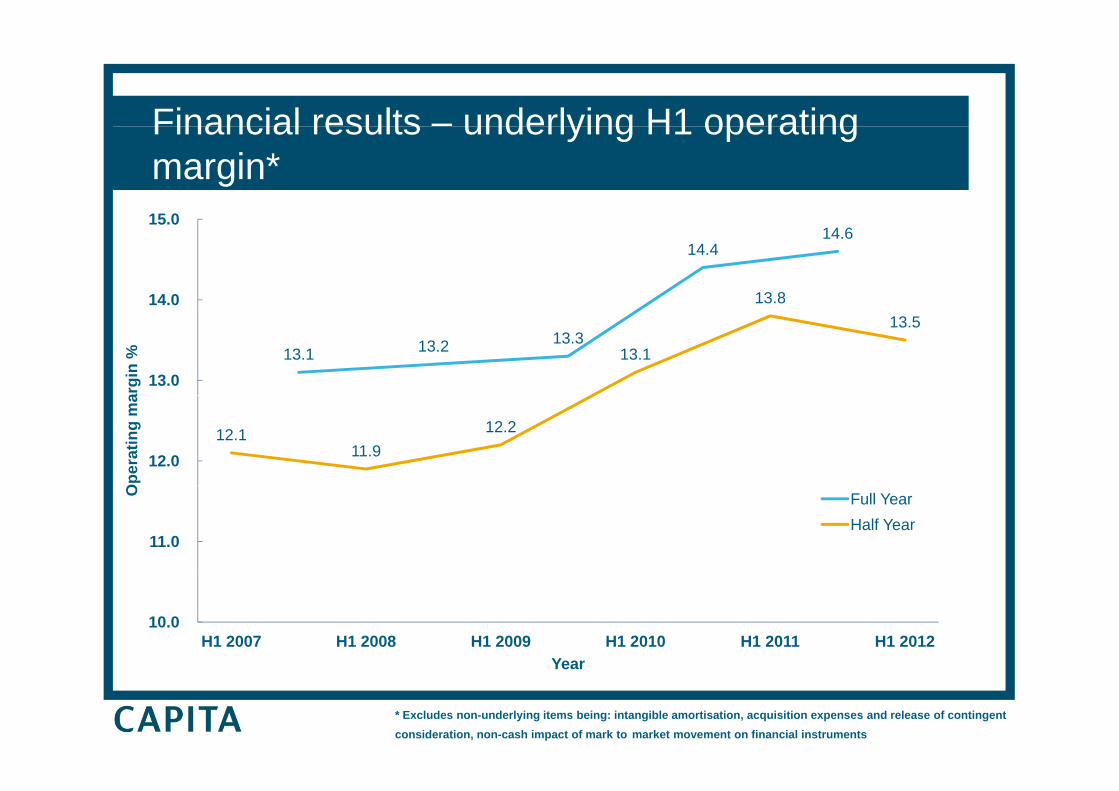
Financial results – underlying H1 operatingFinancial results underlying H1 operating margin*15 0
14.414.6
13.814.0
15.0
13.1 13.2 13.313.1
13.5
13.0
argi
n %
12.111.9
12.2
12.0
Ope
ratin
g m
a
11.0
O Full YearHalf Year
10.0 H1 2007 H1 2008 H1 2009 H1 2010 H1 2011 H1 2012
YearYear
* Excludes non-underlying items being: intangible amortisation, acquisition expenses and release of contingent consideration, non-cash impact of mark to market movement on financial instruments
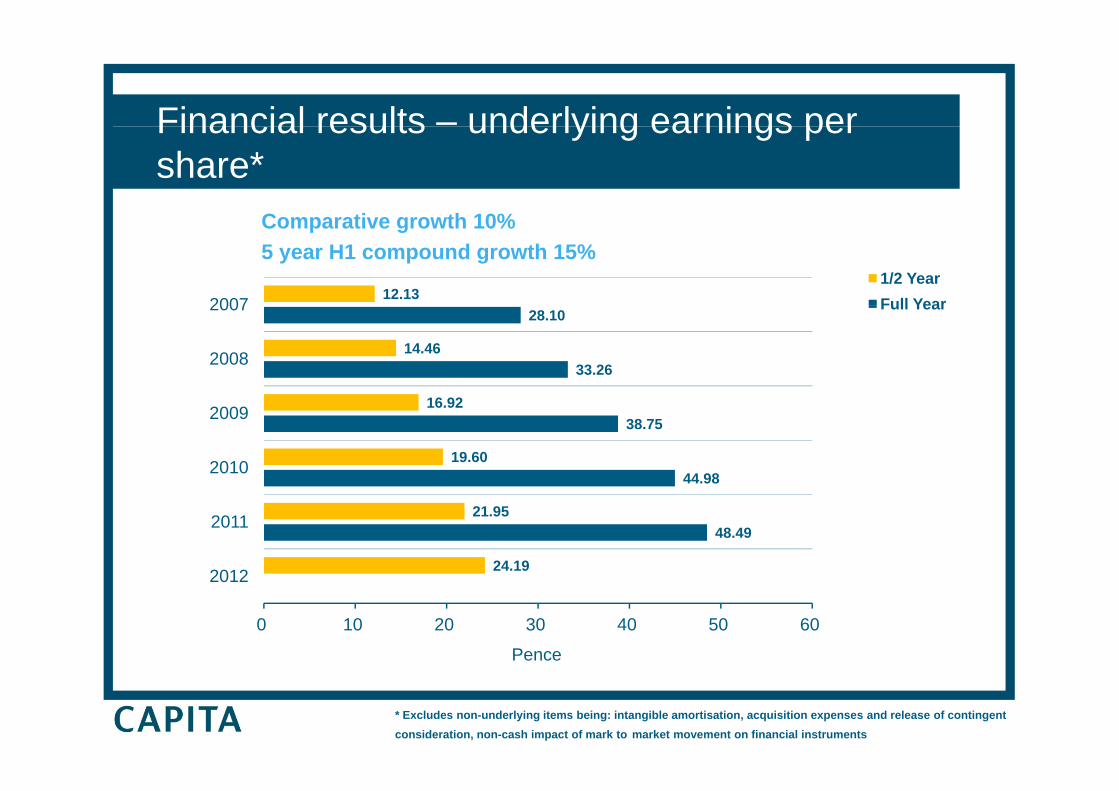
Financial results – underlying earnings perFinancial results underlying earnings per share*
C ti th 10%
12.1320071/2 YearFull Year
Comparative growth 10%5 year H1 compound growth 15%
33.26
28.10
14.462008
2007 Full Year
44.98
38.75
19.60
16.92
2010
2009
48.49
24.19
21.95
2012
2011
0 10 20 30 40 50 60
2012
Pence
* Excludes non-underlying items being: intangible amortisation, acquisition expenses and release of contingent consideration, non-cash impact of mark to market movement on financial instruments
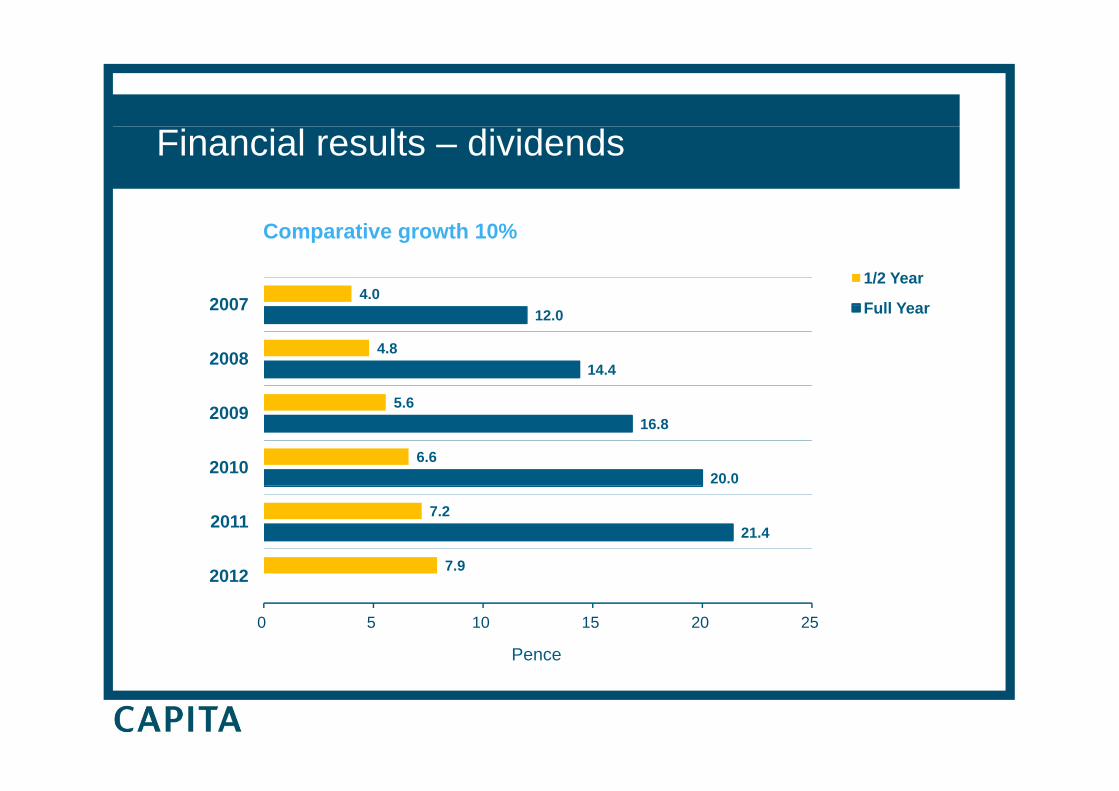
Financial results – dividends
4.020071/2 Year
Full Year
Comparative growth 10%
14.4
12.0
4.82008
2007 Full Year
20.0
16.8
6.6
5.6
2010
2009
21.4
7.9
7.2
2012
2011
0 5 10 15 20 25
2012
Pence
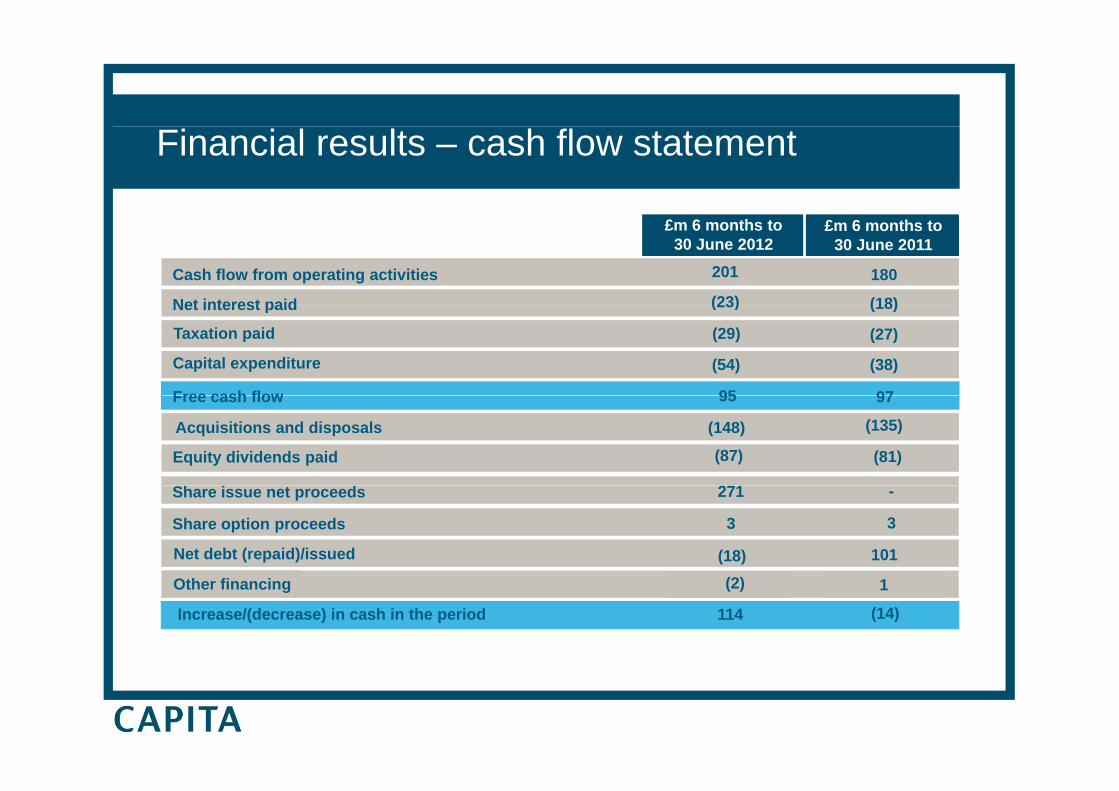
Financial results – cash flow statement
Cash flow from operating activities
Net interest paid
£m 6 months to 30 June 2011
180
(18)
£m 6 months to 30 June 2012
201
(23)Net interest paid
Taxation paid
Capital expenditure
Free cash flow
(18)
(27)
(38)
9795
(54)
(29)
(23)
Free cash flow 97
Acquisitions and disposals (148)
Equity dividends paid
(135)
(81)
95
(87)
Share issue net proceeds -
Net debt (repaid)/issued (18) 101
271
Share option proceeds 33
Increase/(decrease) in cash in the period
Other financing 1
(14)
(2)
114
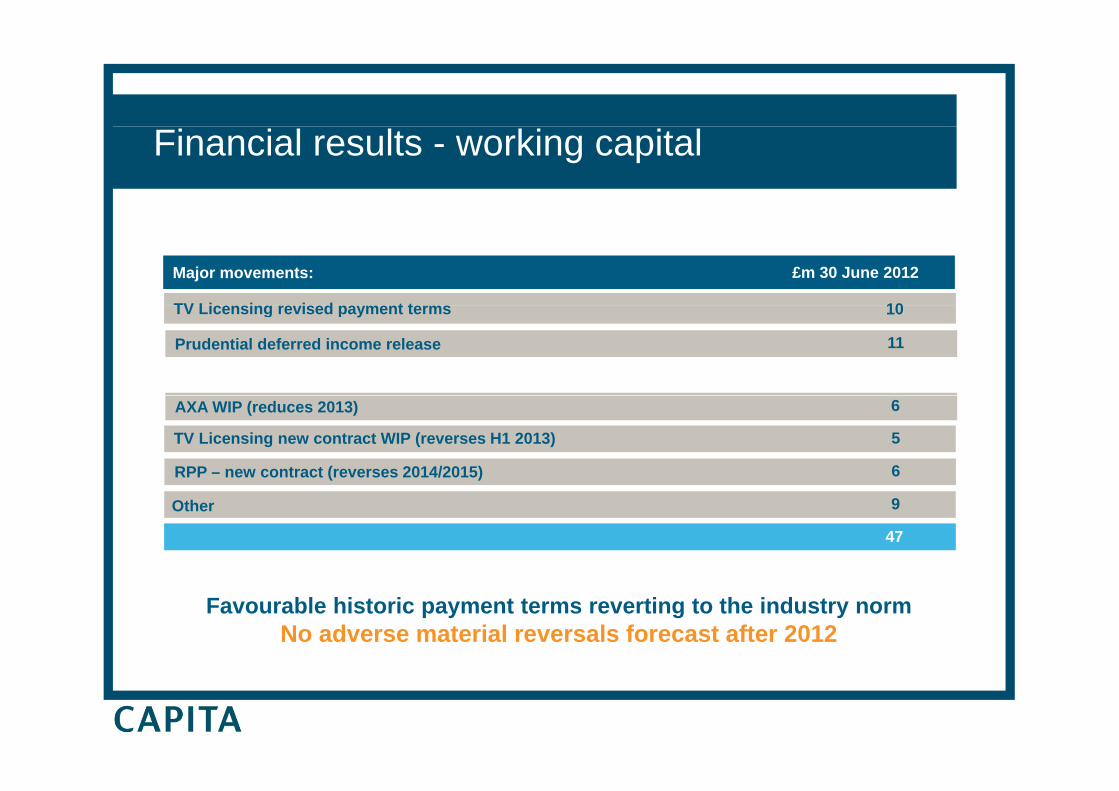
Financial results - working capital
Major movements:
TV Licensing re ised pa ment terms 10
£m 30 June 2012
Prudential deferred income release 11
TV Licensing revised payment terms 10
AXA WIP (reduces 2013)
TV Licensing new contract WIP (reverses H1 2013) 5
6
RPP – new contract (reverses 2014/2015) 6
Other 9
47
Favourable historic payment terms reverting to the industry normNo adverse material reversals forecast after 2012
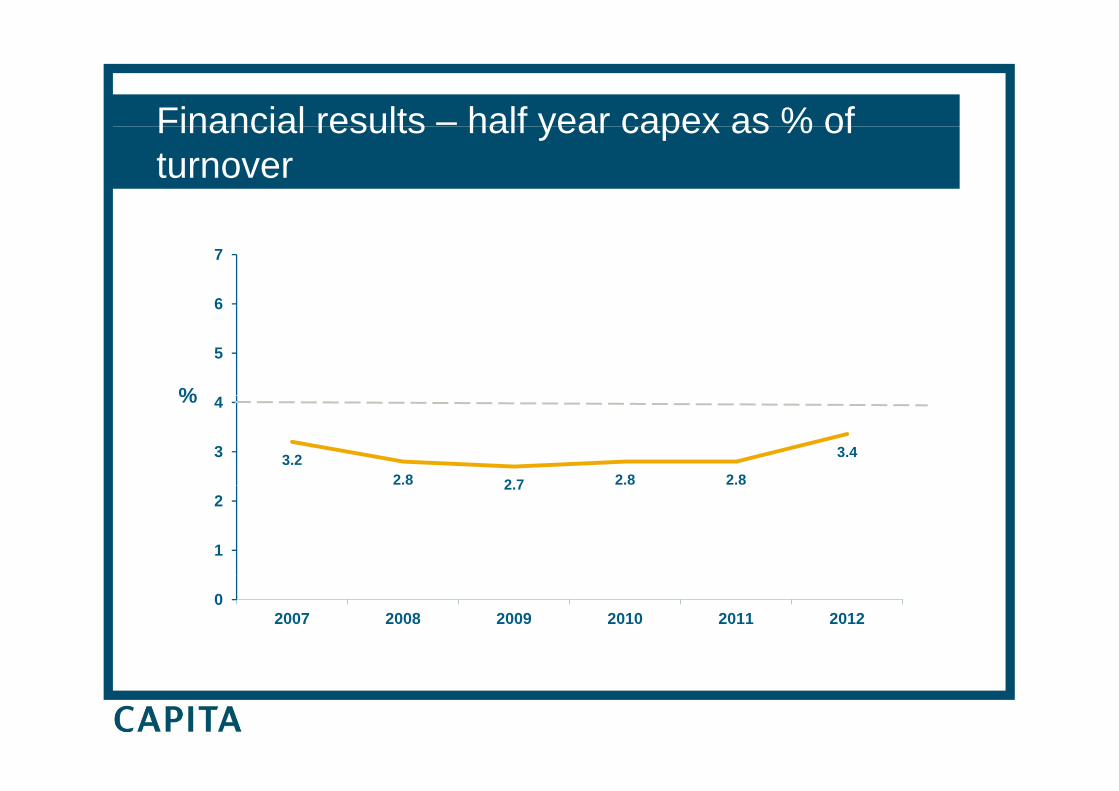
Financial results – half year capex as % ofFinancial results half year capex as % of turnover
6
7
%
5
6
%
3.22.8 2 7 2.8 2.8
3.43
4
2.7
1
2
02007 2008 2009 2010 2011 2012

Financial results – % post tax return on capital (debtFinancial results – % post tax return on capital (debt plus equity) – 12 months to 30 June 2012
18.620.0 20.2 20.2
18.816.3
16
20
24
n
ActualWACC
8.1 8.2 7.9 7.8 7.8 7.28
12
16
% re
turn
42007 2008 2009 2010 2011 2012
2007 2008 2009 2010 2011 2012
PBIT (normalised)
Avg capital (£m)
2007 2008 2009 2010
245 293 340 377
954 1067 1230 1377
2011
410
1671
2012
451
2187Avg capital (£m)
Tax (%)
954 1067 1230 1377
27.7 27.0 26.8 26.0
1671
23.5
2187
21.0
Annual acquisition spend 114 147 301178 341 129*Annual acquisition spend 114 147 301178 341 129
* 2012 to date
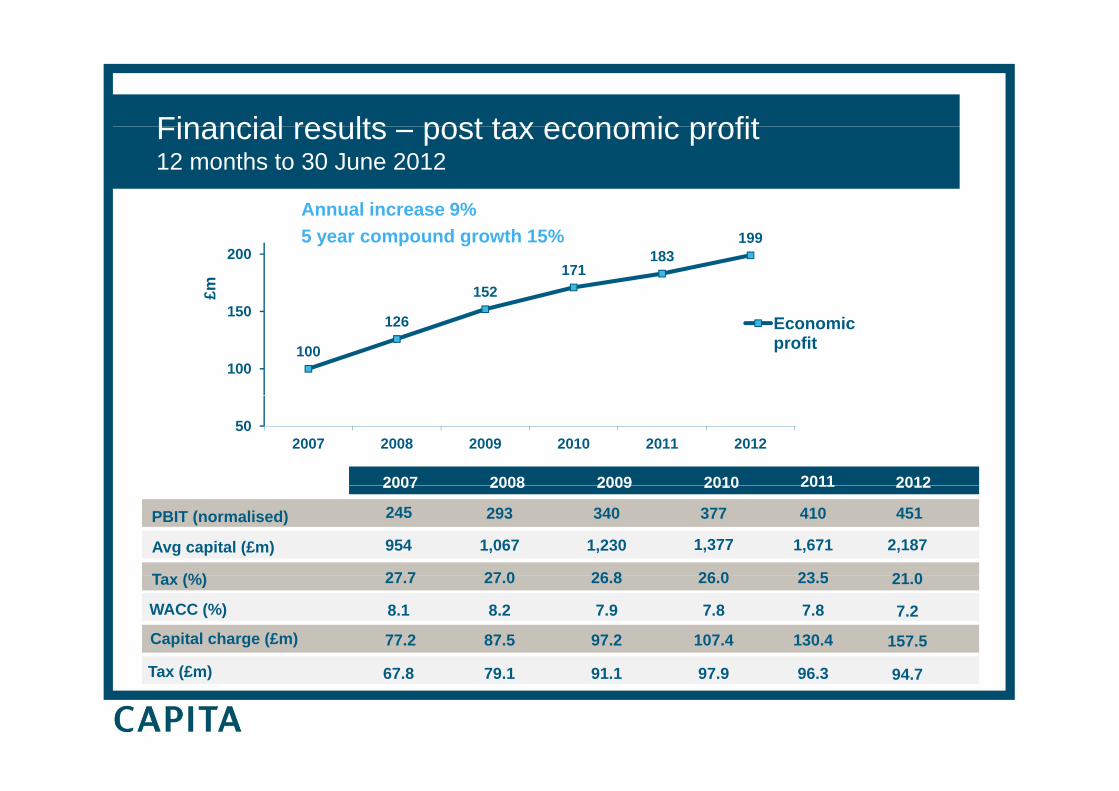
Financial results post tax economic profitFinancial results – post tax economic profit 12 months to 30 June 2012
Annual increase 9%
152171
183199
1 0
200
£m%
5 year compound growth 15%
100
126
100
150Economic profit
502007 2008 2009 2010 2011 2012
2007 2008 2009 2010 2011 2012
PBIT (normalised)
Avg capital (£m)
T (%)
2007 2008 2009 2010
245 293 340 377
954 1,067 1,230 1,377
27 7 27 0 26 8 26 0
2011
410
1,671
23 5
2012
451
2,187
21 0Tax (%) 27.7 27.0 26.8 26.0 23.5 21.0
WACC (%)
Capital charge (£m)
8.1 8.2 7.9 7.8
77.2 87.5 97.2 107.4
7.8
130.4
7.2
157.5
Tax (£m) 67.8 79.1 91.1 97.9 96.3 94.7
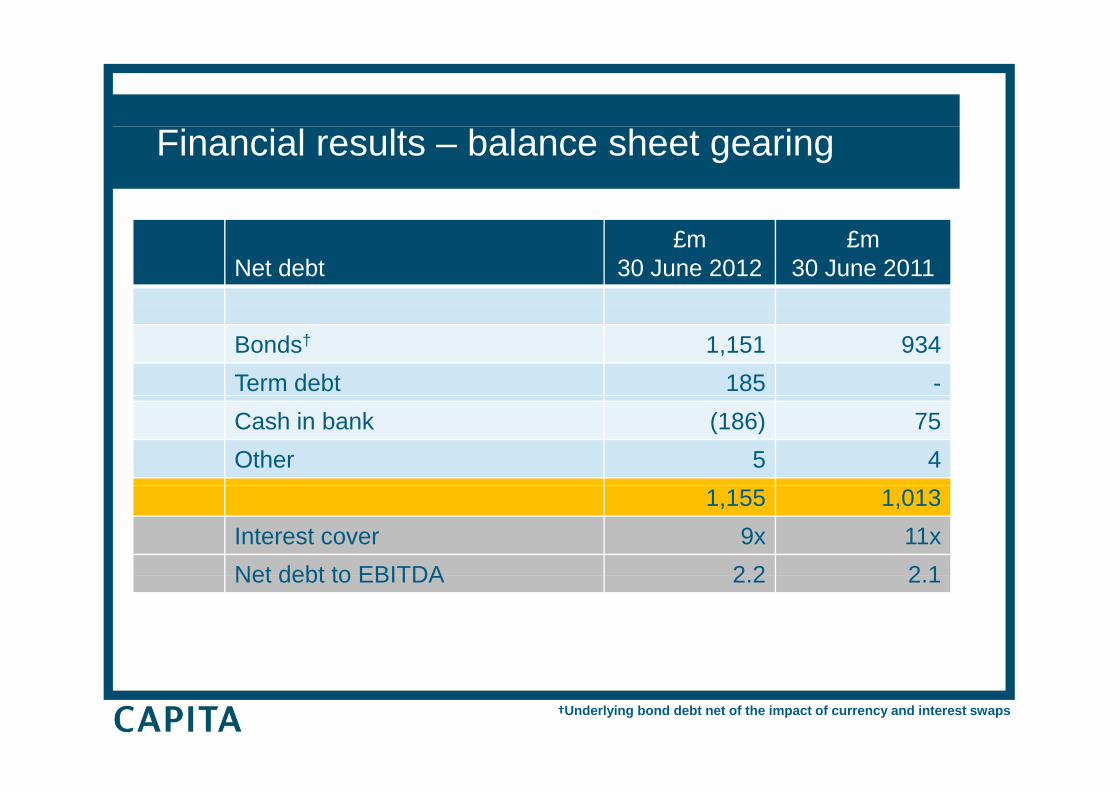
Financial results – balance sheet gearing
30 June 2007 (£m)£m 2008 £m 2007£m
30 June 2012Net debt£m
30 June 2012£m
30 June 2011
Bonds† 1,151 934Term debt 185 -Cash in bank (186) 75Other 5 4
1,155 1,013Interest cover 9x 11xNet debt to EBITDA 2 2 2 1Net debt to EBITDA 2.2 2.1
†Underlying bond debt net of the impact of currency and interest swaps
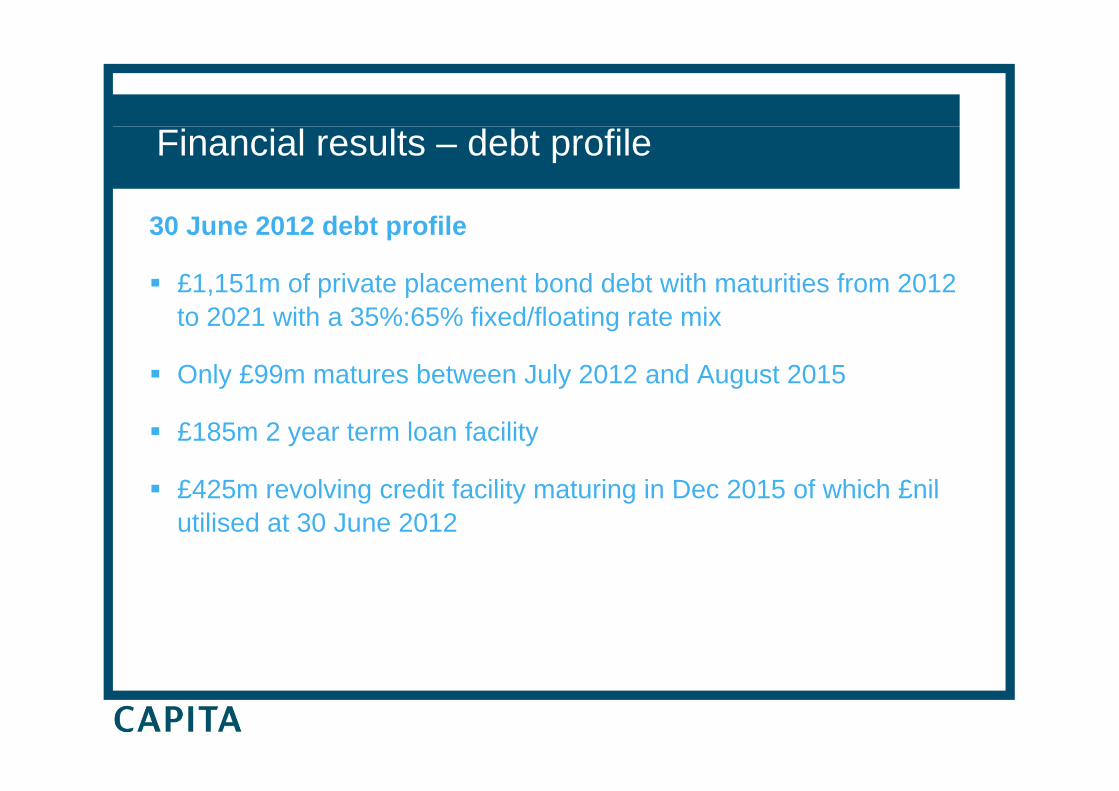
Financial results – debt profile
30 J 2012 d b fil30 June 2012 debt profile
£1,151m of private placement bond debt with maturities from 2012 to 2021 with a 35%:65% fixed/floating rate mix
Only £99m matures between July 2012 and August 2015
£185m 2 year term loan facility
£425m revolving credit facility maturing in Dec 2015 of which £nil£425m revolving credit facility maturing in Dec 2015 of which £nil utilised at 30 June 2012
Creating long term value
Maggi Bell, Business Development Director
Paul Pindar, Chief Executive
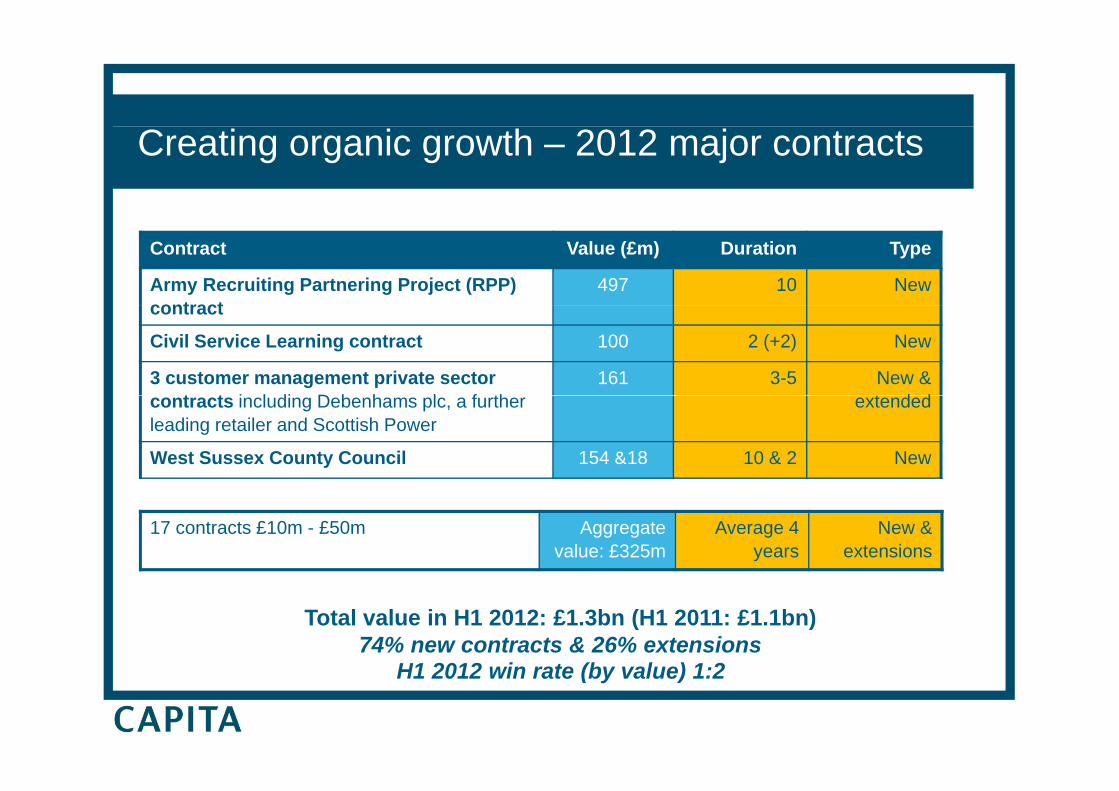
Creating organic growth – 2012 major contracts
Contract Value (£m) Duration Type
Army Recruiting Partnering Project (RPP) contract
497 10 New contract
Civil Service Learning contract 100 2 (+2) New
3 customer management private sector t t i l di D b h l f th
161 3-5 New & t d dcontracts including Debenhams plc, a further
leading retailer and Scottish Power extended
West Sussex County Council 154 &18 10 & 2 New
17 contracts £10m - £50m Aggregate value: £325m
Average 4 years
New & extensions
Total value in H1 2012: £1.3bn (H1 2011: £1.1bn)74% new contracts & 26% extensions
H1 2012 i t (b l ) 1 2H1 2012 win rate (by value) 1:2

Recruiting Partnering Project (RPP)
£497m over 10 years£497m over 10 years Selected by the MOD to jointly deliver entire recruitment process for the Army and enabling ICT for the Royal Navy & Royal Air Force Represents our first significant BPO contract in the defence sectorClients’ evaluation criteria focused on:
C fid i l ti– Confidence in solution – Value for money – Strength of our BPO experienceg p– Established presence in the resourcing market – built up via organic growth
& acquisition i.e. Recruitment & Assessment Services in 1996
Implementation underway on track for service commencement in H1 2013Implementation underway, on track for service commencement in H1 2013Significant prospects emerging on training outplacement/other HR services
Securing large scale complex contracts in new market segmentsSecuring large scale, complex contracts in new market segments

Civil Service Learning agreement
Efficient procurement & implementation:£100m over 2 years (+ 2 years) Selected by the Cabinet Office as sole supplier to manage provision of training
Efficient procurement & implementation:Procurement completed in 22 weeks from OJEU publication to contract award
across the Civil Service Delivery of 49% of training directly through our learning & development
Since contract commencement in April 2012:
Installed end-to-end booking system to prevent leakagebusiness and the balance through a
network of SME providers (all revenue flows through Capita)D t t bilit d t k
system to prevent leakageLaunched 73 new eLearning productsStreamlined 30 different ways of i i i d t 4Demonstrates our capability and track
record in training developed over 16yrs organically and through acquisition
invoicing down to 4 Developing tailored specialist programmes commissioned by individual departments
Francis Maude, Minister for the Cabinet Office: “The company is showing real leadership by pioneering this new approach and committing to working with its supply chain to find
the best value and innovation the learning and development market has to offer.”the best value and innovation the learning and development market has to offer.
UK Border Agency (“UKBA”) – contactUK Border Agency ( UKBA ) contact management
Up to £30m over 4 years Selected as preferred bidder for contact management services to support UKBA in the management of the “overstayer” backlogUKBA in the management of the overstayer backlogHarnessing capacity within our Dearne Valley contact centre to provide flexible multi-media contact solutions for UKBA, whilst also deploying staff
ithi th UKBA it l b i Sh ffi ldwithin the UKBA site close by in SheffieldReflects strength of our capability within the contact centre sector and our ability to deploy resources swiftly to provide cost effective solutions to meet clients’ needs and provide Government with value for money A further lot for casework services is due to be awarded shortly
Securing new opportunities to develop solutions in new market segments
West Sussex County Council
£154m over 10 yearsA new contract for a range of back office services; HR & payroll, finance, office services procurement pensions admin in addition to our existing IToffice services, procurement, pensions admin in addition to our existing IT contracts
In addition, secured extension to existing IT contract - valued at a further £18 2 t 2022£18m over 2 years to 2022
Demonstrates the strength of Capita’s proposition and the appetite for outsourcing in local government g g
Contract includes provision to deliver services to other public sector partners i.e. local/regional health trusts and local authorities up to the OJEU limit of £750mOJEU limit of £750m
Securing major contracts in established markets

Private sectorSecured 3 new clients including a full customer management service for Debenhams plcSecured 3 new clients including a full customer management service for Debenhams plc and a further 8 customer management contractsDemonstrating increasing penetration in retail and utilities alongside our positions in telecoms and financial servicesEstablished end-to-end outsourced offering following Ventura & Vertex Private Sector acquisitionsCustomer management contracts typically fall into 3 broad categories:g yp y g
– first line customer service for high value brands– collections and debt management– complex case management including complaint handling and remediation activitycomplex case management including complaint handling and remediation activity
Services extend to omni/multi-channel including voice, email, white mail, webchat and social media listening and engagementIncreasing demand for multilingual solutions & detailed insight into customer behaviourIncreasing demand for multilingual solutions & detailed insight into customer behaviour Tools and techniques to reduce costs, increase sales and reduce debt
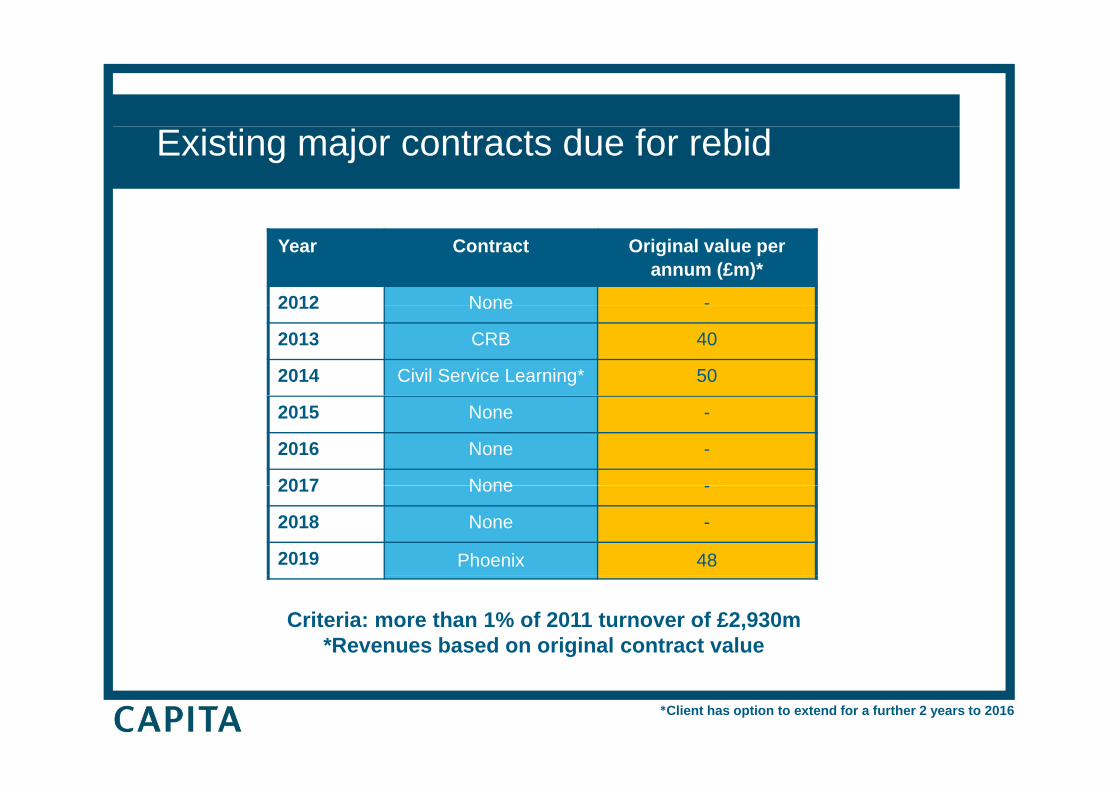
Existing major contracts due for rebid
Year Contract Original value per annum (£m)*
2012 None -2012 None
2013 CRB 40
2014 Civil Service Learning* 50
2015 None -
2016 None -
2017 None2017 None -
2018 None -
2019 Phoenix 48
Criteria: more than 1% of 2011 turnover of £2,930m*Revenues based on original contract value
*Client has option to extend for a further 2 years to 2016
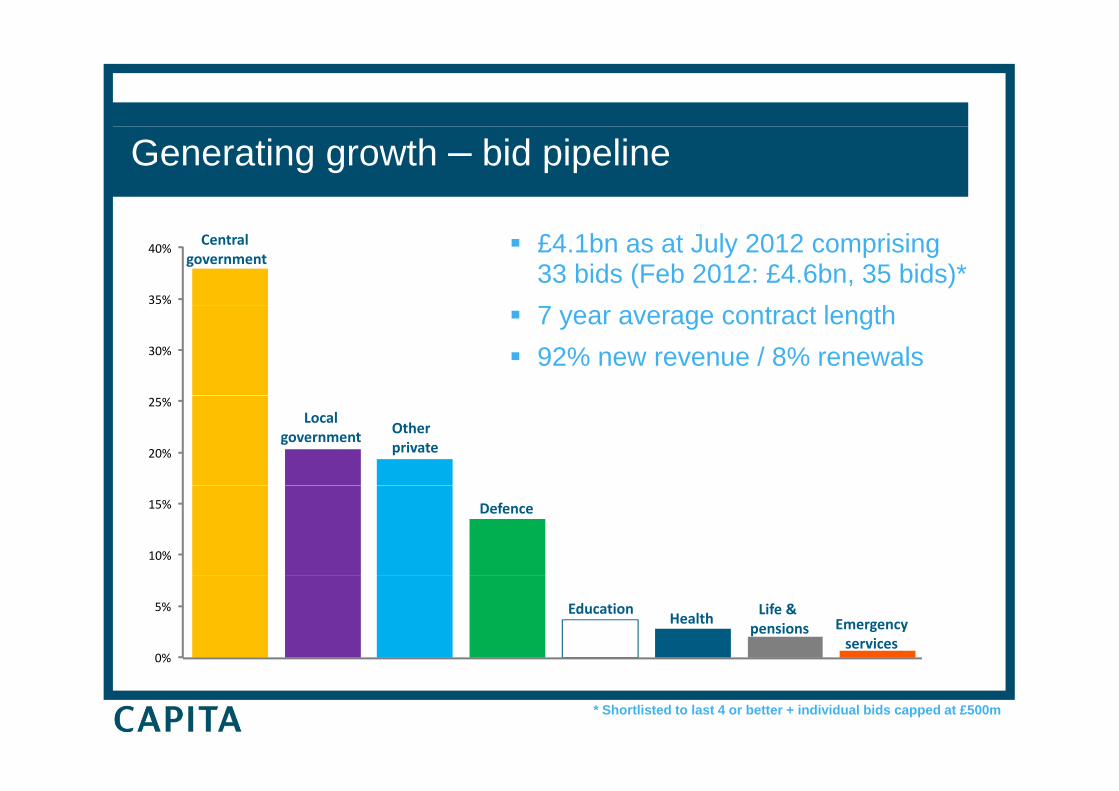
Generating growth – bid pipeline
Central government
35%
40% £4.1bn as at July 2012 comprising 33 bids (Feb 2012: £4.6bn, 35 bids)*7 t t l th
30%
7 year average contract length92% new revenue / 8% renewals
Local government Other
private20%
25%
Defence
10%
15%
EducationHealth
Life & pensions Emergency
services 0%
5%
* Shortlisted to last 4 or better + individual bids capped at £500m
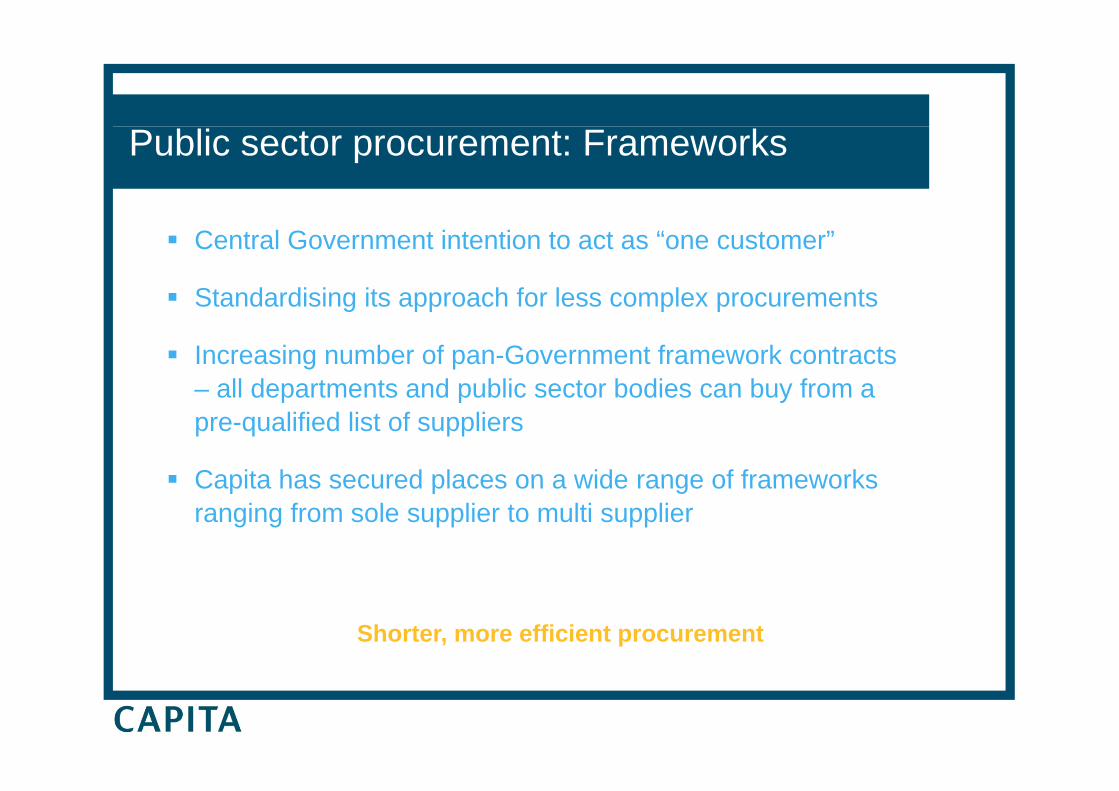
Public sector procurement: Frameworks
Central Government intention to act as “one customer”
Standardising its approach for less complex procurementsStandardising its approach for less complex procurements
Increasing number of pan-Government framework contracts – all departments and public sector bodies can buy from aall departments and public sector bodies can buy from a pre-qualified list of suppliers
Capita has secured places on a wide range of frameworksCapita has secured places on a wide range of frameworks ranging from sole supplier to multi supplier
Shorter, more efficient procurement
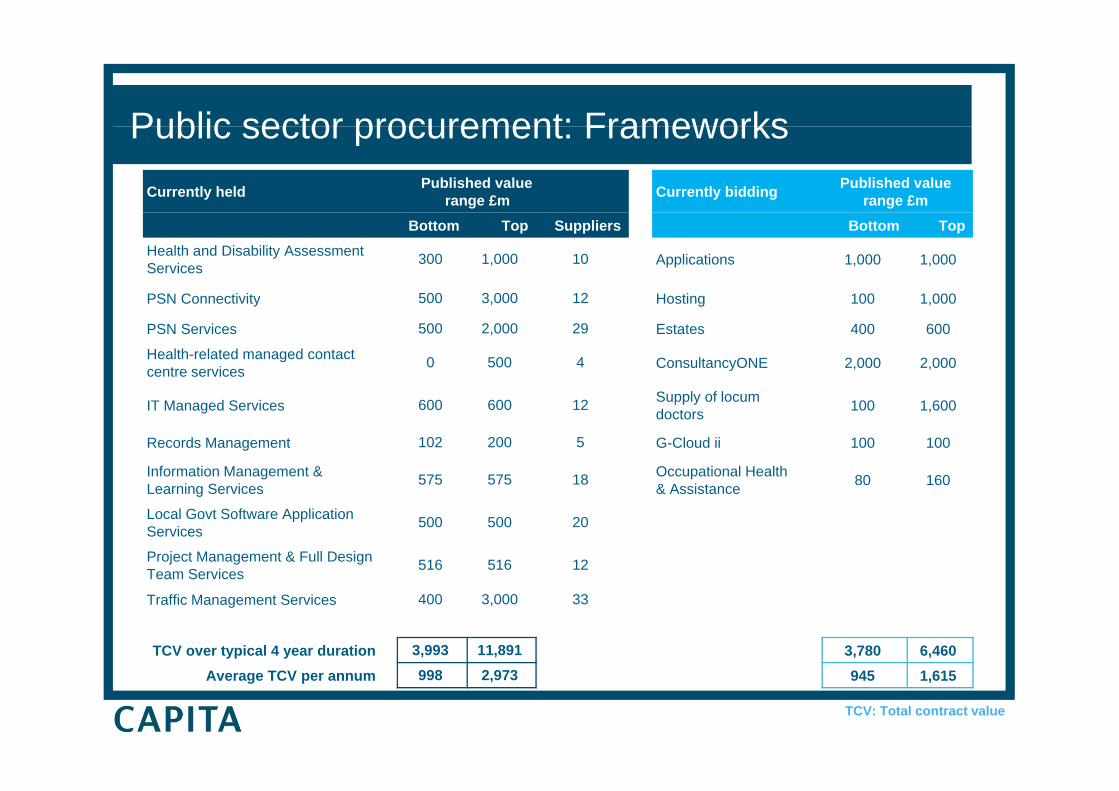
Public sector procurement: FrameworksCurrently held Published value
range £m Currently bidding Published value range £m
Public sector procurement: Frameworks
Bottom Top Suppliers Bottom TopHealth and Disability Assessment Services 300 1,000 10 Applications 1,000 1,000
PSN Connectivity 500 3,000 12 Hosting 100 1,000 y g
PSN Services 500 2,000 29 Estates 400 600
Health-related managed contact centre services 0 500 4 ConsultancyONE 2,000 2,000
Supply of locumIT Managed Services 600 600 12 Supply of locum doctors 100 1,600
Records Management 102 200 5 G-Cloud ii 100 100
Information Management & L i S i 575 575 18 Occupational Health
& A i t 80 160Learning Services & Assistance
Local Govt Software Application Services 500 500 20
Project Management & Full Design Team Services 516 516 12Team Services
Traffic Management Services 400 3,000 33
TCV over typical 4 year duration 3,993 11,891 3,780 6,460Average TCV per annum 998 2,973 945 1,615
TCV: Total contract value
Delivering value through acquisitions
Paul Pindar
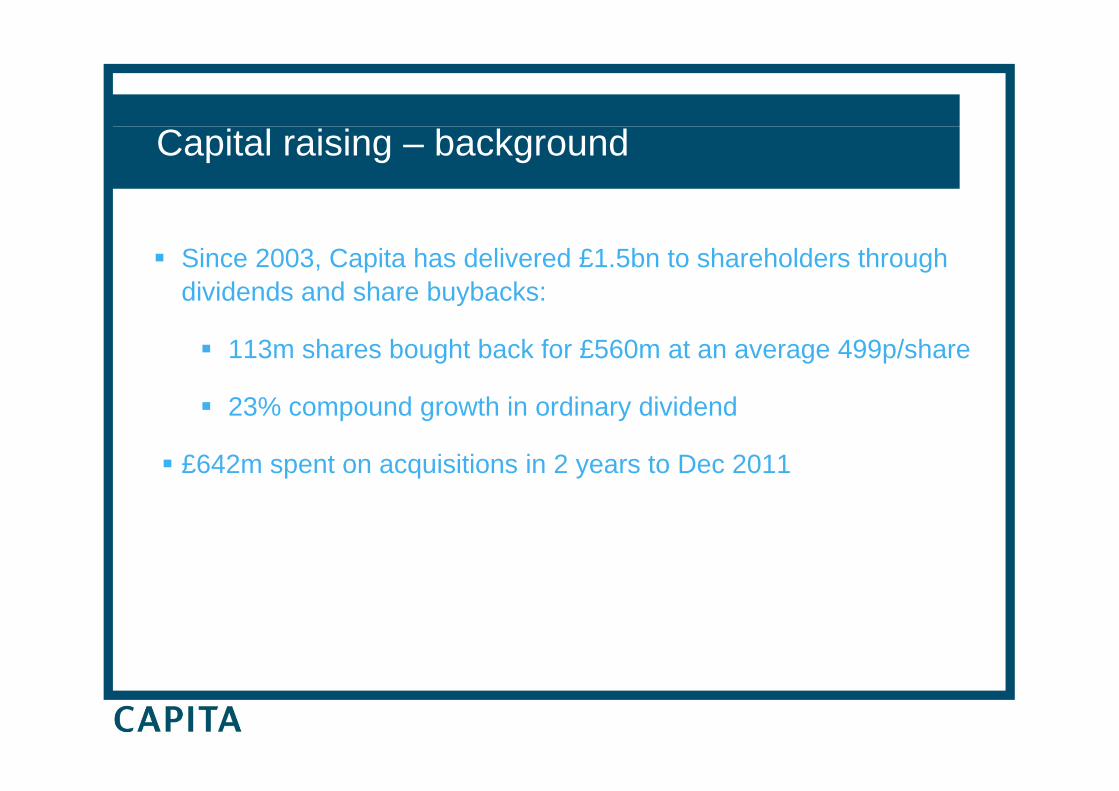
Capital raising – background
Since 2003, Capita has delivered £1.5bn to shareholders through dividends and share buybacks:y
113m shares bought back for £560m at an average 499p/share
23% compound growth in ordinary dividend
£642m spent on acquisitions in 2 years to Dec 2011
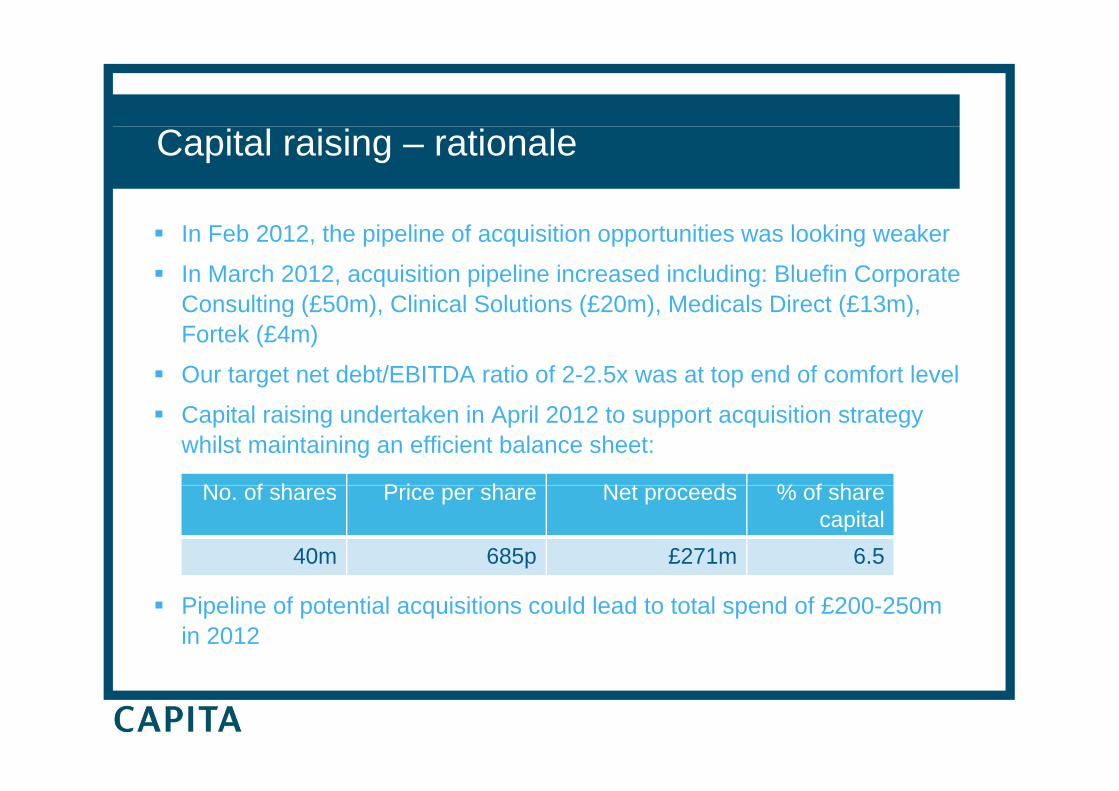
Capital raising – rationale
In Feb 2012, the pipeline of acquisition opportunities was looking weaker
In March 2012, acquisition pipeline increased including: Bluefin Corporate Consulting (£50m) Clinical Solutions (£20m) Medicals Direct (£13m)Consulting (£50m), Clinical Solutions (£20m), Medicals Direct (£13m), Fortek (£4m)
Our target net debt/EBITDA ratio of 2-2.5x was at top end of comfort level
Capital raising undertaken in April 2012 to support acquisition strategy whilst maintaining an efficient balance sheet:
N f h P i h N t d % f hNo. of shares Price per share Net proceeds % of share capital
40m 685p £271m 6.5
Pipeline of potential acquisitions could lead to total spend of £200-250m in 2012
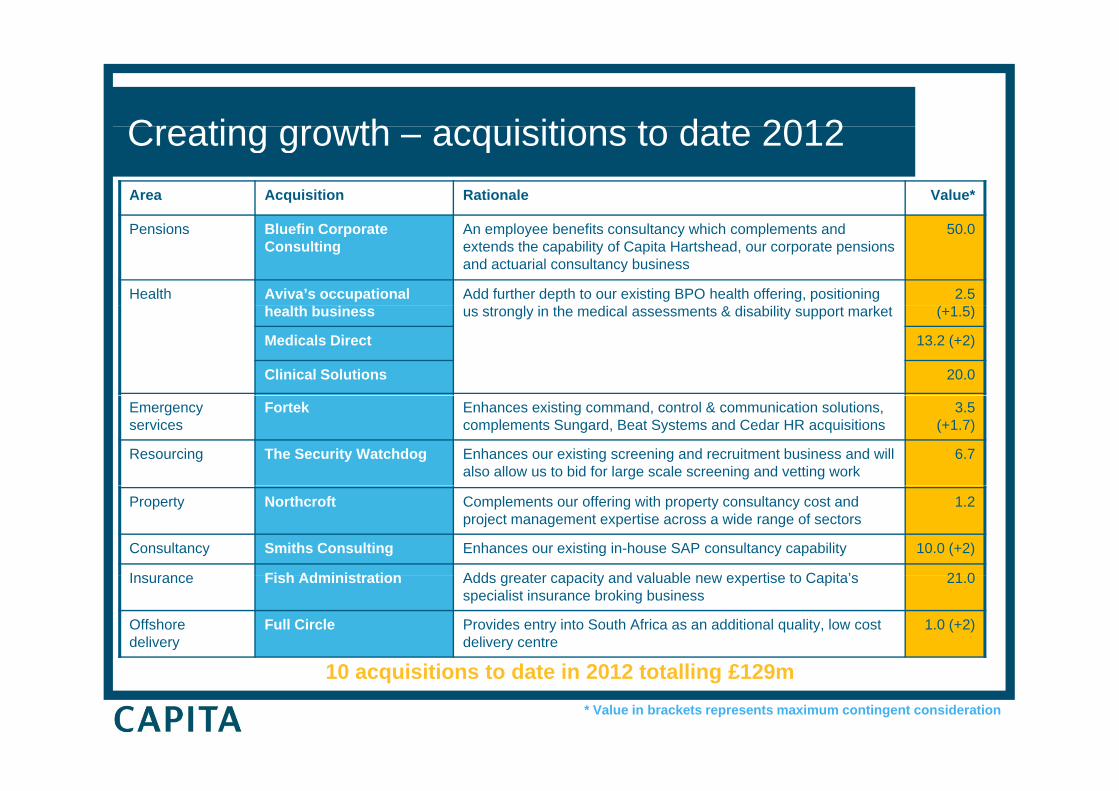
Creating growth acquisitions to date 2012Creating growth – acquisitions to date 2012 Area Acquisition Rationale Value*
Pensions Bluefin Corporate Consulting
An employee benefits consultancy which complements and extends the capability of Capita Hartshead, our corporate pensions and actuarial consultancy business
50.0
Health Aviva’s occupational Add further depth to our existing BPO health offering, positioning &
2.5 ( 1 )health business us strongly in the medical assessments & disability support market (+1.5)
Medicals Direct 13.2 (+2)
Clinical Solutions 20.0
Emergency services
Fortek Enhances existing command, control & communication solutions, complements Sungard, Beat Systems and Cedar HR acquisitions
3.5 (+1.7)
Resourcing The Security Watchdog Enhances our existing screening and recruitment business and will also allow us to bid for large scale screening and vetting work
6.7
Property Northcroft Complements our offering with property consultancy cost and project management expertise across a wide range of sectors
1.2
Consultancy Smiths Consulting Enhances our existing in-house SAP consultancy capability 10.0 (+2)
Ins rance Fish Administration Adds greater capacit and al able ne e pertise to Capita’s 21 0
10 i iti t d t i 2012 t t lli £129
Insurance Fish Administration Adds greater capacity and valuable new expertise to Capita’s specialist insurance broking business
21.0
Offshore delivery
Full Circle Provides entry into South Africa as an additional quality, low cost delivery centre
1.0 (+2)
10 acquisitions to date in 2012 totalling £129m* Value in brackets represents maximum contingent consideration
Creating value – delivering returns
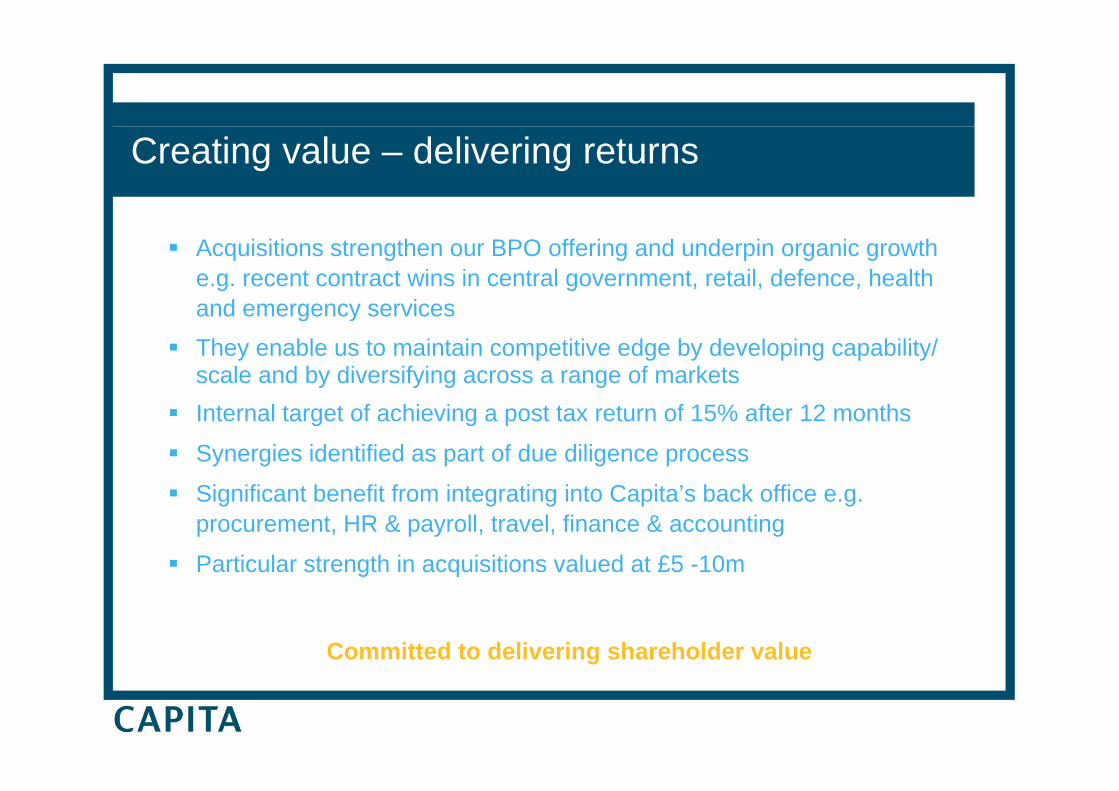
Acquisitions strengthen our BPO offering and underpin organic growth e.g. recent contract wins in central government, retail, defence, health and emergency servicesand emergency servicesThey enable us to maintain competitive edge by developing capability/ scale and by diversifying across a range of markets Internal target of achieving a post tax return of 15% after 12 months
Synergies identified as part of due diligence process
Si ifi t b fit f i t ti i t C it ’ b k ffiSignificant benefit from integrating into Capita’s back office e.g. procurement, HR & payroll, travel, finance & accounting
Particular strength in acquisitions valued at £5 -10m g q
Committed to delivering shareholder value
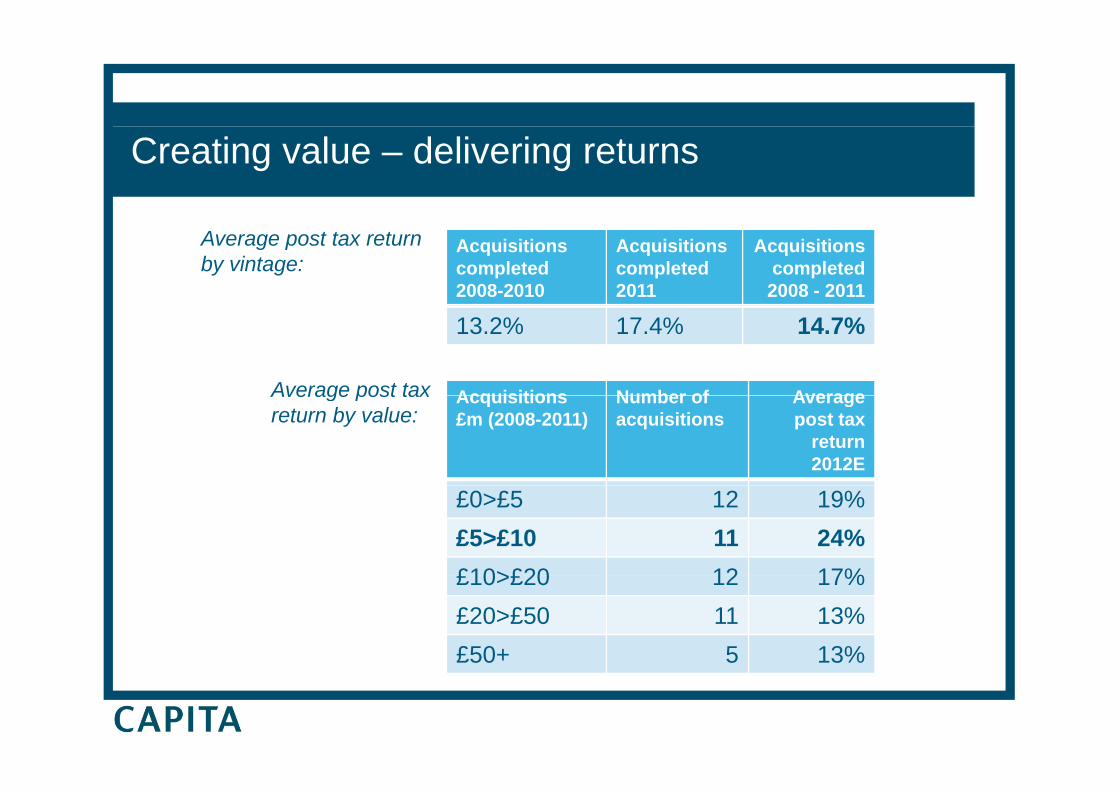
Creating value – delivering returns
Acquisitions completed 2008-2010
Acquisitionscompleted2011
Acquisitions completed 2008 - 2011
Average post tax return by vintage:
13.2% 17.4% 14.7%
Acquisitions Number of AverageAverage post tax Acquisitions £m (2008-2011)
Number of acquisitions
Average post tax
return 2012E
Average post tax return by value:
£0>£5 12 19%£5>£10 11 24%£10>£20 12 17%£10>£20 12 17%£20>£50 11 13%£50+ 5 13%
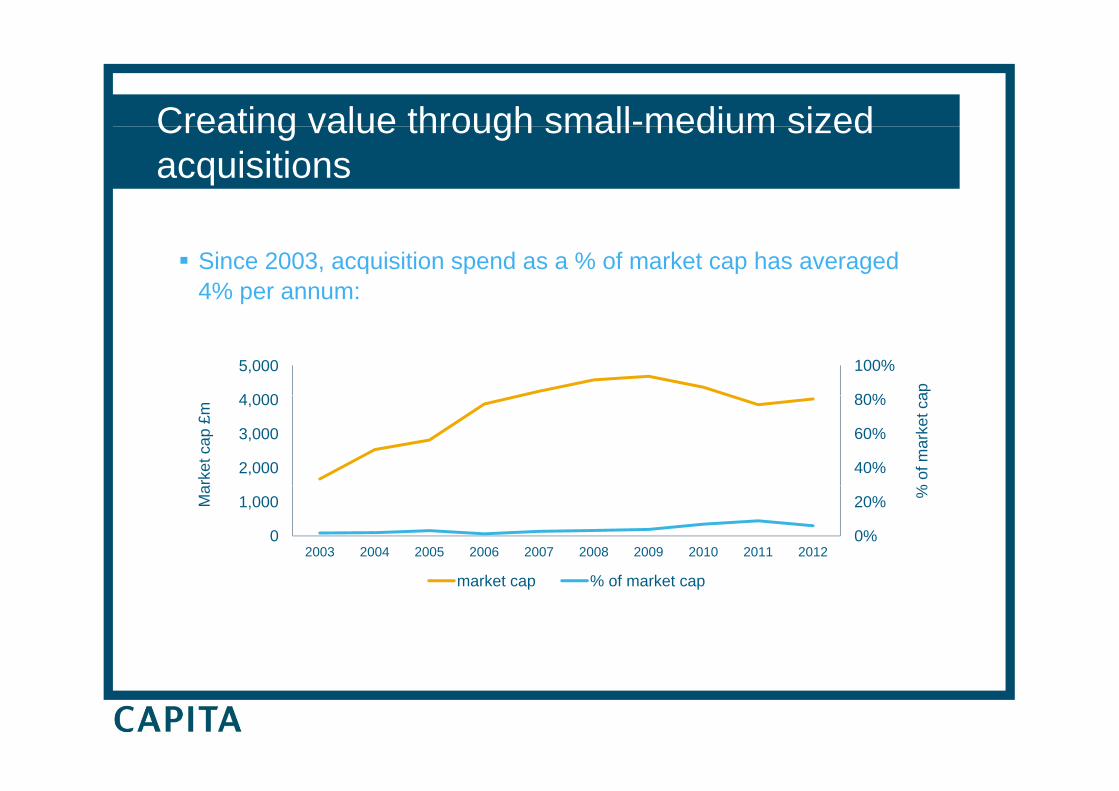
Creating value through small-medium sizedCreating value through small medium sized acquisitions
Since 2003, acquisition spend as a % of market cap has averaged 4% per annum:
80%
100%
4 000
5,000
ap
40%
60%
80%
2,000
3,000
4,000
rket
cap
£m
% o
f mar
ket c
a
0%
20%
0
1,000
2003 2004 2005 2006 2007 2008 2009 2010 2011 2012
k t % f k t
Ma %
market cap % of market cap
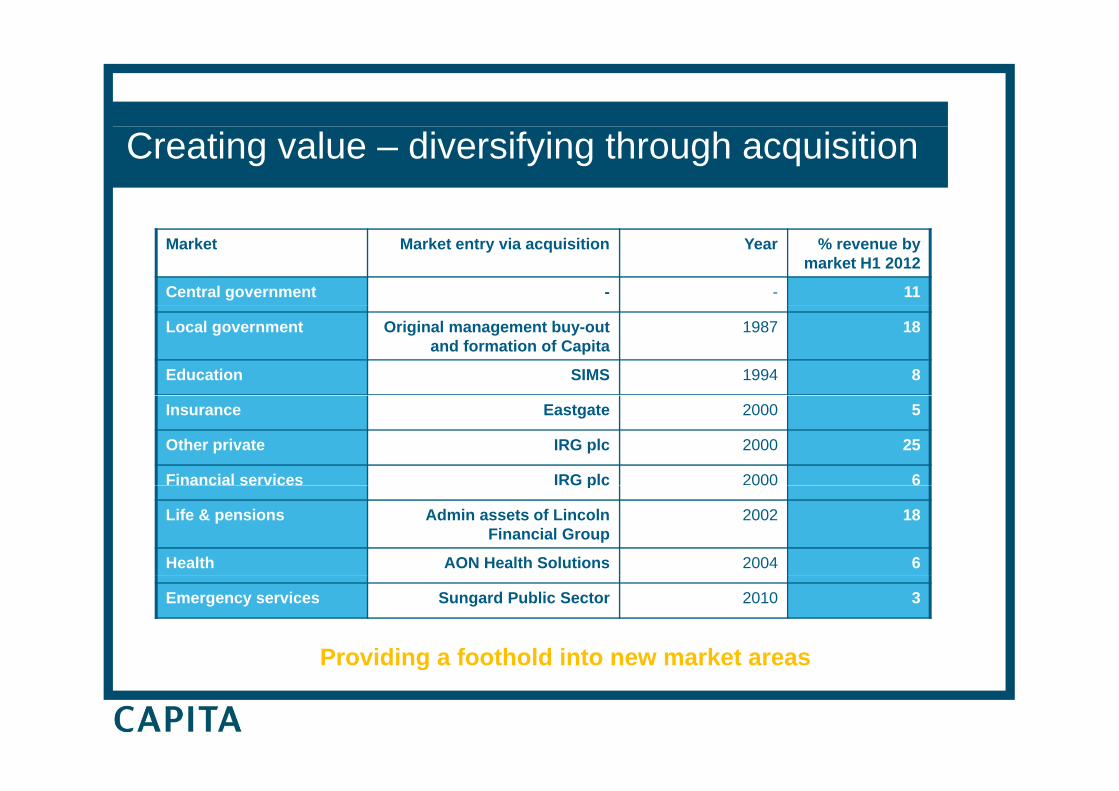
Creating value – diversifying through acquisition
Market Market entry via acquisition Year % revenue by market H1 2012
Central government - - 11
Local government Original management buy-out and formation of Capita
1987 18
Education SIMS 1994 8
Insurance Eastgate 2000 5
Other private IRG plc 2000 25
Financial services IRG plc 2000 6a c a se ces G p c 000 6
Life & pensions Admin assets of Lincoln Financial Group
2002 18
Health AON Health Solutions 2004 6
Emergency services Sungard Public Sector 2010 3
Providing a foothold into new market areasProviding a foothold into new market areas
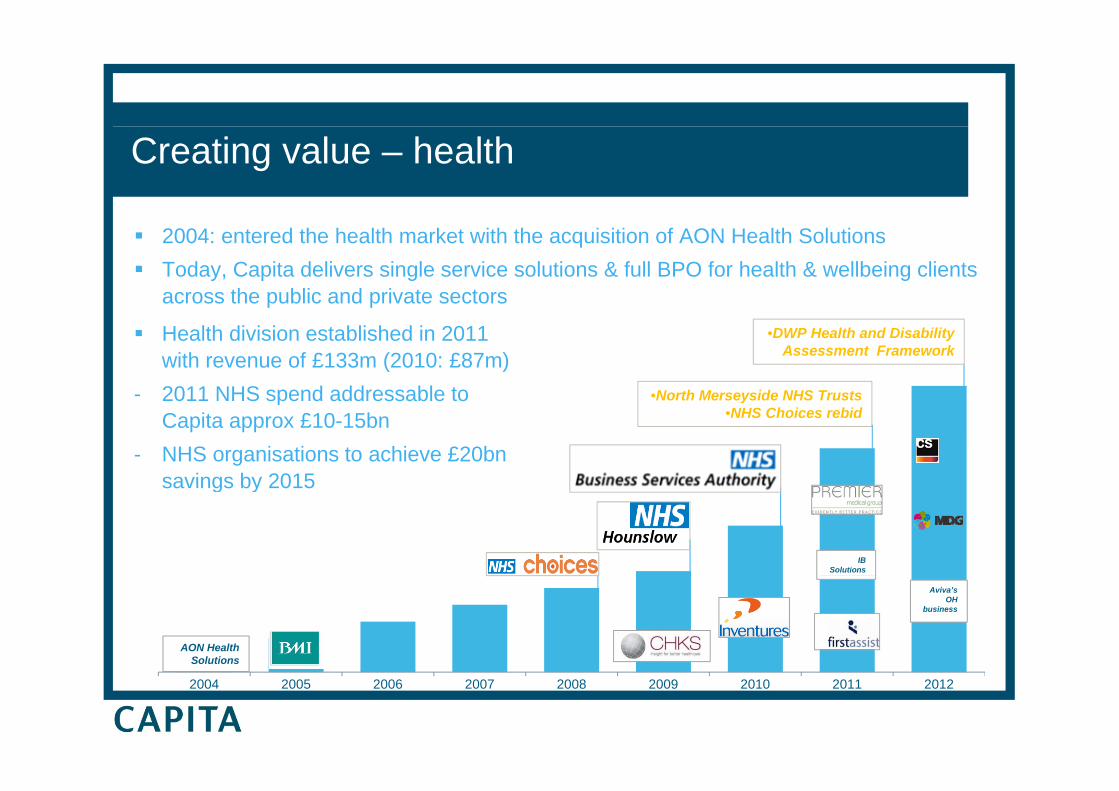
Creating value – health
2004: entered the health market with the acquisition of AON Health Solutions Today, Capita delivers single service solutions & full BPO for health & wellbeing clients across the public and private sectorsp p
•North Merseyside NHS Trusts
•DWP Health and Disability Assessment Framework
Health division established in 2011 with revenue of £133m (2010: £87m)
- 2011 NHS spend addressable to •North Merseyside NHS Trusts•NHS Choices rebid
- 2011 NHS spend addressable to Capita approx £10-15bn
- NHS organisations to achieve £20bn savings by 2015savings by 2015
IB Solutions
Aviva’s OH
business
AON Health Solutions
2004 2005 2006 2007 2008 2009 2010 2011 2012
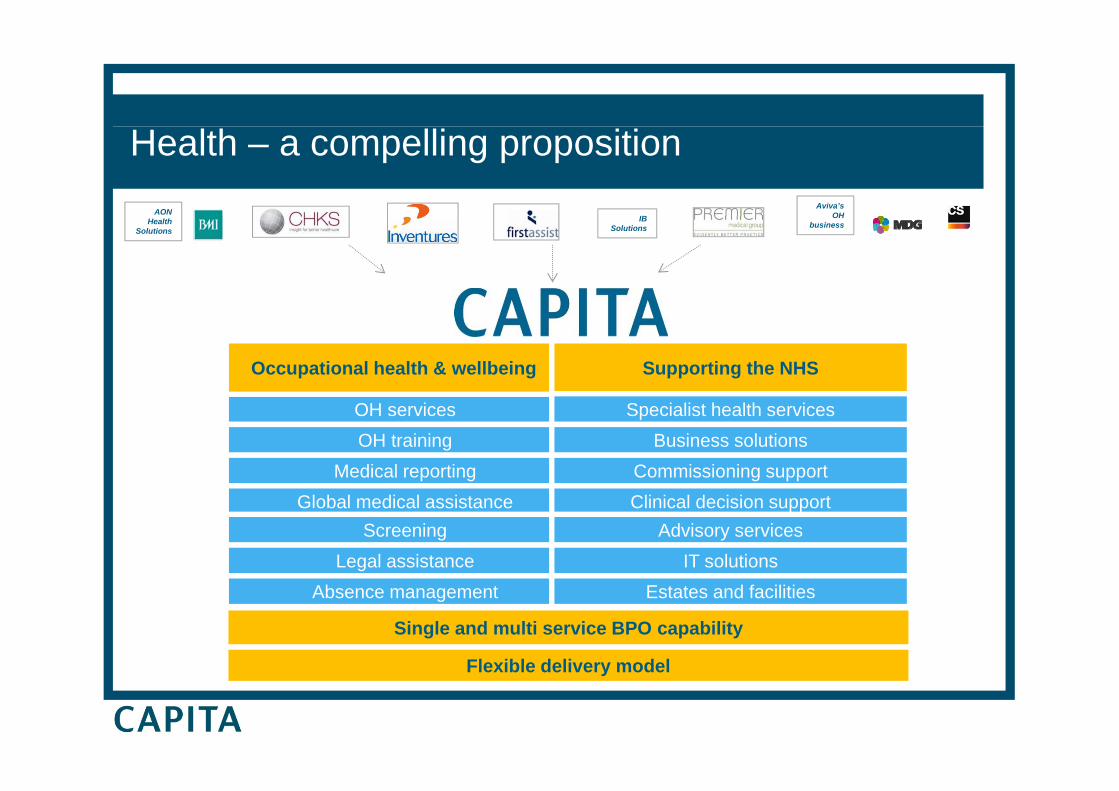
Health – a compelling proposition Aviva’s
OHAON IB OH
businessHealth Solutions
IB Solutions
Occupational health & wellbeing Supporting the NHS
OH servicesOH training
Medical reporting
Specialist health servicesBusiness solutions
Commissioning supportGlobal medical assistance
Screening Legal assistance
Clinical decision supportAdvisory services
IT solutions Absence management
Single and multi service BPO capability
Flexible delivery model
Estates and facilities
Flexible delivery model
Creating value – customer management
Enhanced existing offering with acquisition of specialist customer management expertise, Ventura, Vertex Private Sector and CCTand CCT Added scale, capability and extended our market reach bringingclients from across the utilities, telecoms and retail sectors Enable us to secure new business that was previously not possible as separate entities Strong bid pipeline across the private and public sectorsStrong growth expected for the full year 2012
Expanding our capability and scale
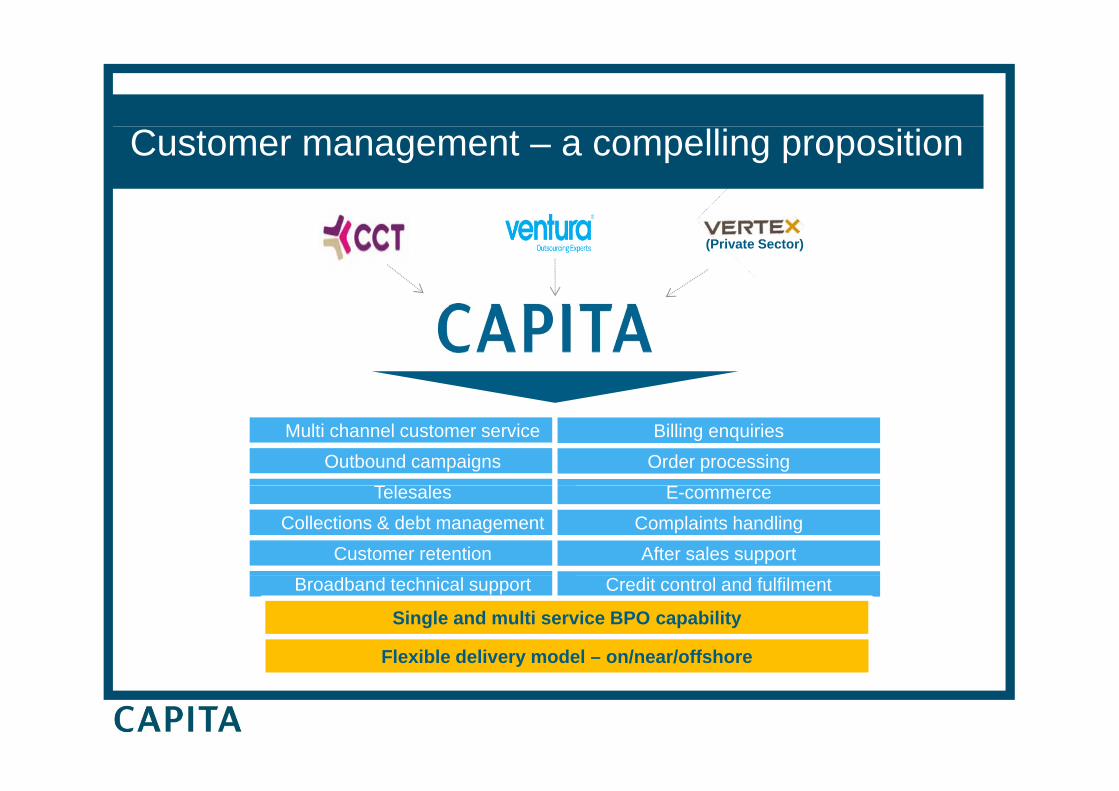
Customer management – a compelling proposition
(Private Sector)
Multi channel customer serviceOutbound campaigns
T l l
Billing enquiriesOrder processing
ETelesales Collections & debt management
Customer retention
E-commerceComplaints handlingAfter sales support
Broadband technical support Credit control and fulfilment
Single and multi service BPO capability
Flexible delivery model – on/near/offshorey
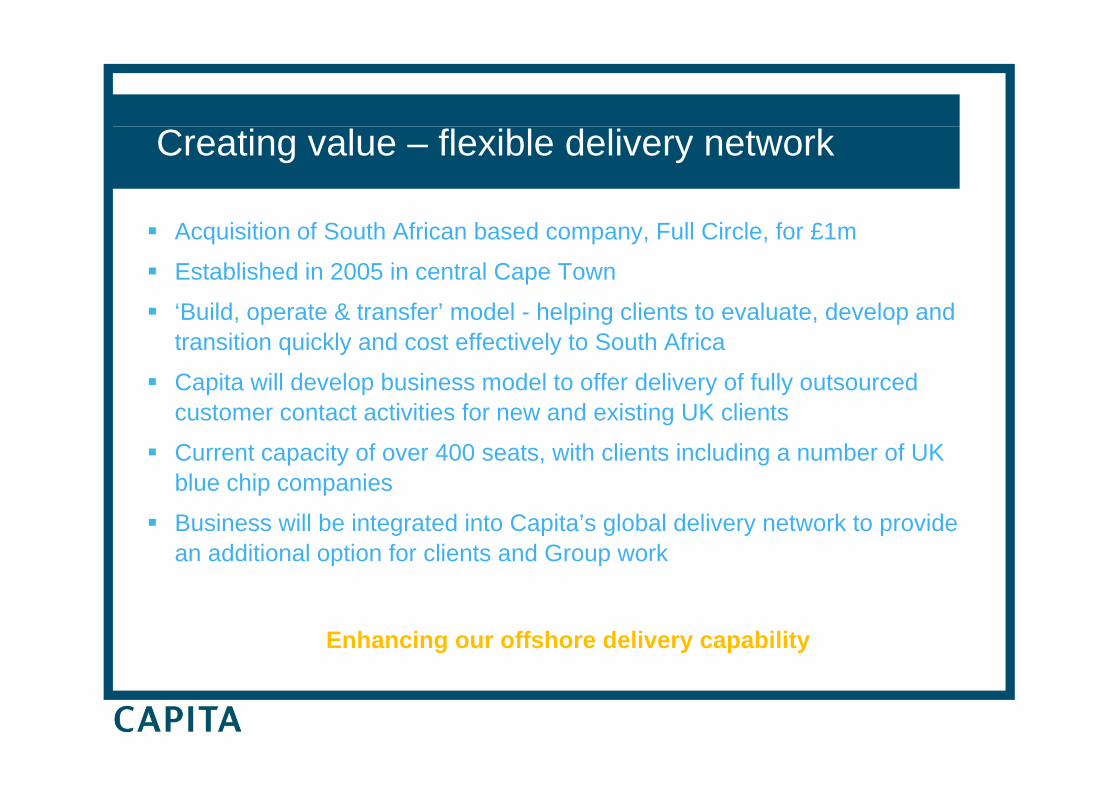
Creating value – flexible delivery network
Acquisition of South African based company, Full Circle, for £1m
Established in 2005 in central Cape Town
‘B ild t & t f ’ d l h l i li t t l t d l d‘Build, operate & transfer’ model - helping clients to evaluate, develop and transition quickly and cost effectively to South Africa
Capita will develop business model to offer delivery of fully outsourced customer contact activities for new and existing UK clients
Current capacity of over 400 seats, with clients including a number of UK blue chip companiesblue chip companies
Business will be integrated into Capita’s global delivery network to provide an additional option for clients and Group work
Enhancing our offshore delivery capability

International delivery capability
1 site150 FTEs
UK
Poland
India
7 sites4000+ FTEs
India
South Africa1 site
4000+ FTEs200 FTEs
Estimated FTEs at year end 2012
Summary & outlook
Met our 3 key objectives
Excellent level of contract wins year to date
A strong pipeline with momentum
Solid trading across the Group
Healthy pipeline of small to medium sized acquisitions in our key target markets
Capital Markets event planned for October 2012 in LondonCapital Markets event planned for October 2012 in London
Well positioned for growth in the full year 2012

Capita plc