Embed Size (px)
Citation preview

Copyright © 2012 Pearson Prentice Hall.
All rights reserved.
Chapter 10
Capital
Budgeting
Techniques
© 2012 Pearson Prentice Hall. All rights reserved. 10-2
Overview of Capital Budgeting
• Capital budgeting is the process of evaluating and
selecting long-term investments that are consistent with
the firm’s goal of maximizing owner wealth.
• A capital expenditure is an outlay of funds by the firm
that is expected to produce benefits over a period of time
greater than 1 year.
• An operating expenditure is an outlay of funds by the
firm resulting in benefits received within 1 year.
© 2012 Pearson Prentice Hall. All rights reserved. 10-3
Overview of Capital Budgeting:
Steps in the Process
The capital budgeting process consists of five steps:
1. Proposal generation. Proposals for new investment projects are made at all levels within a business organization and are reviewed by finance personnel.
2. Review and analysis. Financial managers perform formal review and analysis to assess the merits of investment proposals
3. Decision making. Firms typically delegate capital expenditure decision making on the basis of dollar limits.
4. Implementation. Following approval, expenditures are made and projects implemented. Expenditures for a large project often occur in phases.
5. Follow-up. Results are monitored and actual costs and benefits are compared with those that were expected. Action may be required if actual outcomes differ from projected ones.
© 2012 Pearson Prentice Hall. All rights reserved. 10-4
Overview of Capital Budgeting:
Basic Terminology
Independent versus Mutually Exclusive Projects
– Independent projects are projects whose cash flows are unrelated to (or
independent of) one another; the acceptance of one does not eliminate the
others from further consideration.
– Mutually exclusive projects are projects that compete with one another, so
that the acceptance of one eliminates from further consideration all other
projects that serve a similar function.
Unlimited Funds versus Capital Rationing
– Unlimited funds is the financial situation in which a firm is able to accept all
independent projects that provide an acceptable return.
– Capital rationing is the financial situation in which a firm has only a fixed
number of dollars available for capital expenditures, and numerous projects
compete for these dollars.
© 2012 Pearson Prentice Hall. All rights reserved. 10-5
Overview of Capital Budgeting:
Basic Terminology (cont.)
Accept-Reject versus Ranking Approaches
– An accept–reject approach is the evaluation of capital
expenditure proposals to determine whether they meet the firm’s
minimum acceptance criterion.
– A ranking approach is the ranking of capital expenditure
projects on the basis of some predetermined measure, such as
the rate of return.
© 2012 Pearson Prentice Hall. All rights reserved. 10-6
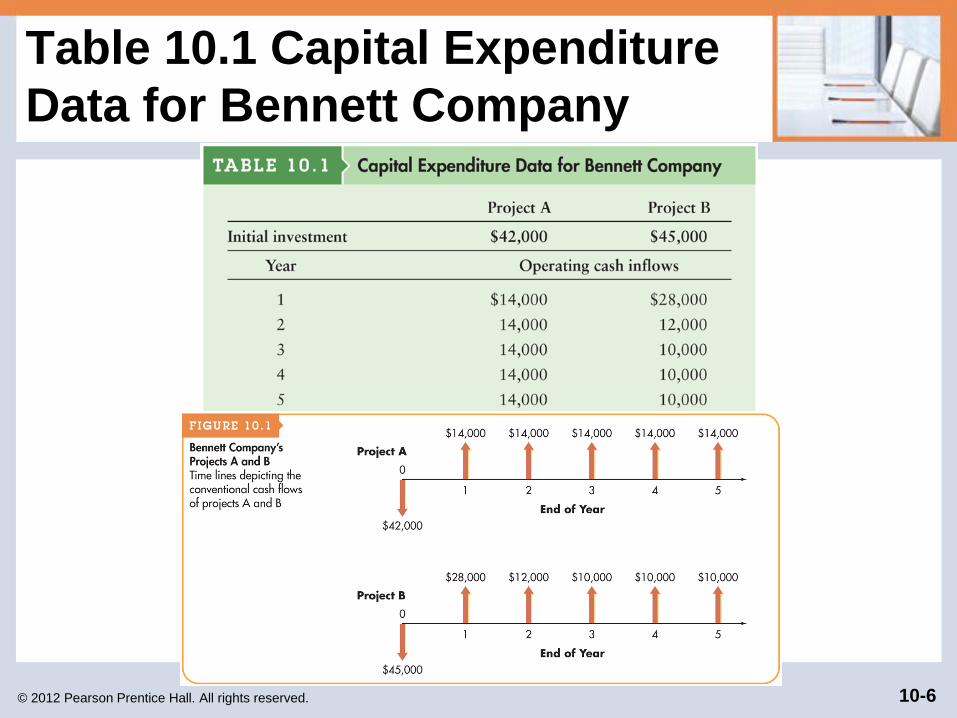
Table 10.1 Capital Expenditure
Data for Bennett Company
© 2012 Pearson Prentice Hall. All rights reserved. 10-7
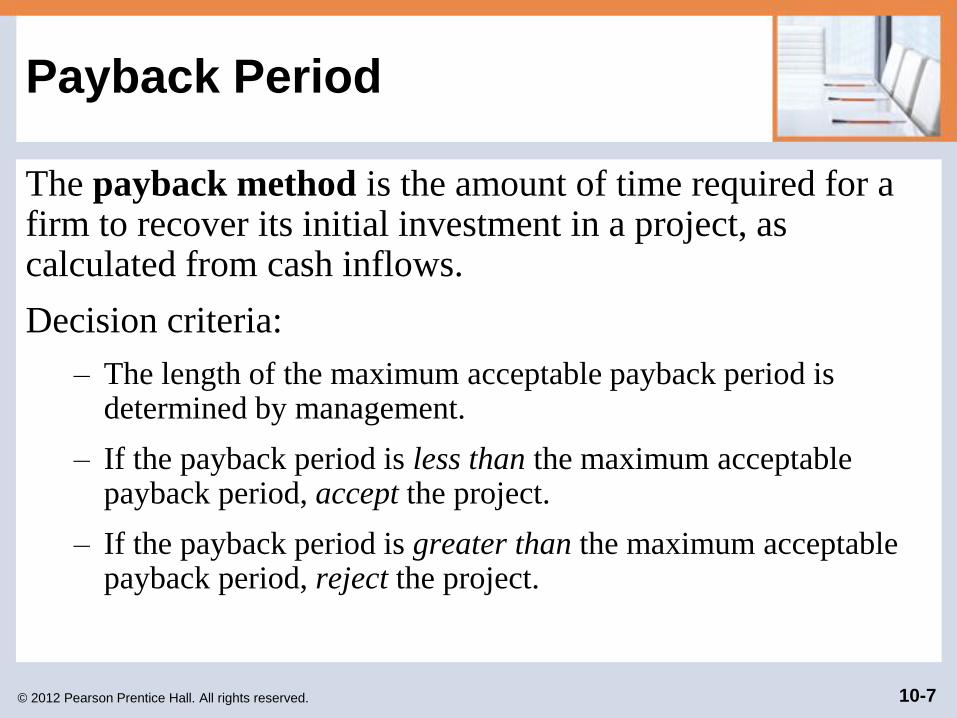
Payback Period
The payback method is the amount of time required for a firm to recover its initial investment in a project, as calculated from cash inflows.
Decision criteria:
– The length of the maximum acceptable payback period is determined by management.
– If the payback period is less than the maximum acceptable payback period, accept the project.
– If the payback period is greater than the maximum acceptable payback period, reject the project.

© 2012 Pearson Prentice Hall. All rights reserved. 10-8
Project A
CB:Techniques
Investment (CF0) -$42,000
CF1 $14,000
CF2 $14,000
CF3 $14,000
CF4 $14,000
CF5 $14,000
CF6
CF7
CF8
Benchmarks Accept or Reject
Payback Period 3.000 3.00
Discounted Payback 3.751 3.50
Net Present Value $11,071.01
IRR 19.858%
Modified IRR 16.653%
Profitability Index 1.264
Investment (CF0) -$45,000
CF1 $28,000
CF2 $12,000
CF3 $10,000
CF4 $10,000
CF5 $10,000
CF6
CF7
CF8
Benchmarks Accept or Reject
Payback Period 2.417 3.00
Discounted Payback 3.310 3.50
Net Present Value $10,924.40
IRR 21.650%
Modified IRR 16.612%
Profitability Index 1.243
Project B
© 2012 Pearson Prentice Hall. All rights reserved. 10-9
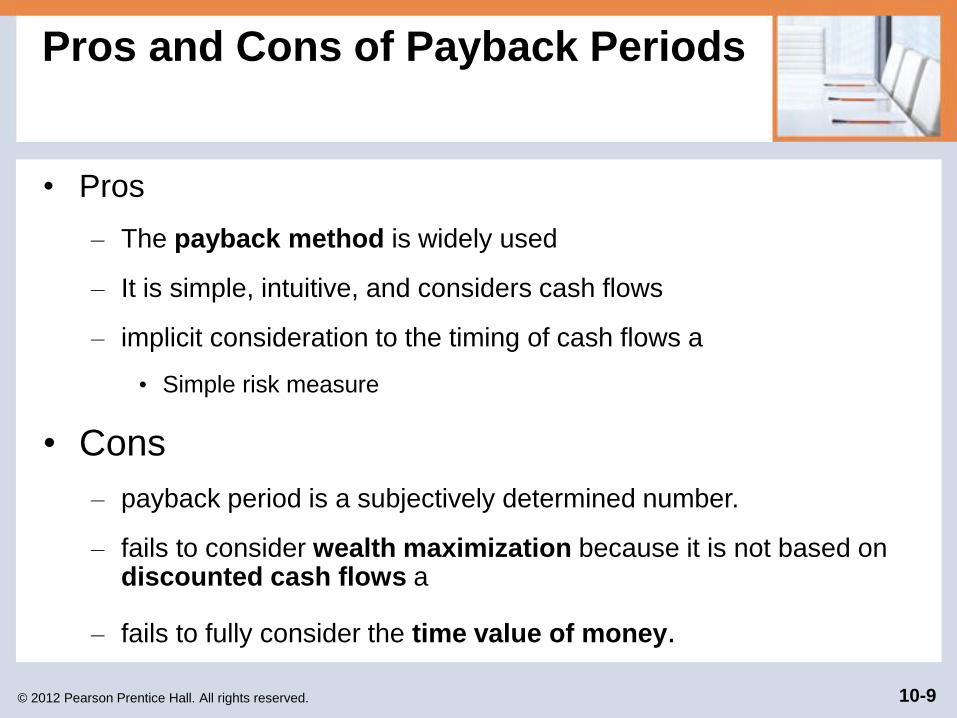
Pros and Cons of Payback Periods
• Pros
– The payback method is widely used
– It is simple, intuitive, and considers cash flows
– implicit consideration to the timing of cash flows a
• Simple risk measure
• Cons
– payback period is a subjectively determined number.
– fails to consider wealth maximization because it is not based on discounted cash flows a
– fails to fully consider the time value of money.
© 2012 Pearson Prentice Hall. All rights reserved. 10-10
Focus on Practice
Limits on Payback Analysis
– While easy to compute and easy to understand, the payback period simplicity brings with it some drawbacks.
– Whatever the weaknesses of the payback period method of evaluating capital projects, the simplicity of the method does allow it to be used in conjunction with other, more sophisticated measures.
– In your view, if the payback period method is used in conjunction with the NPV method, should it be used before or after the NPV evaluation?
© 2012 Pearson Prentice Hall. All rights reserved. 10-11
Net Present Value (NPV)
Net present value (NPV) is a sophisticated capital
budgeting technique; found by subtracting a project’s initial
investment from the present value of its cash inflows
discounted at a rate equal to the firm’s cost of capital.
NPV = Present value of cash inflows – Initial investment
© 2012 Pearson Prentice Hall. All rights reserved. 10-12
Net Present Value (NPV) (cont.)
Decision criteria:
– If the NPV is greater than $0, accept the project.
– If the NPV is less than $0, reject the project.
If the NPV is greater than $0, the firm will earn a return greater than its cost of capital. Such action should increase the market value of the firm, and therefore the wealth of its owners by an amount equal to the NPV.
© 2012 Pearson Prentice Hall. All rights reserved. 10-13
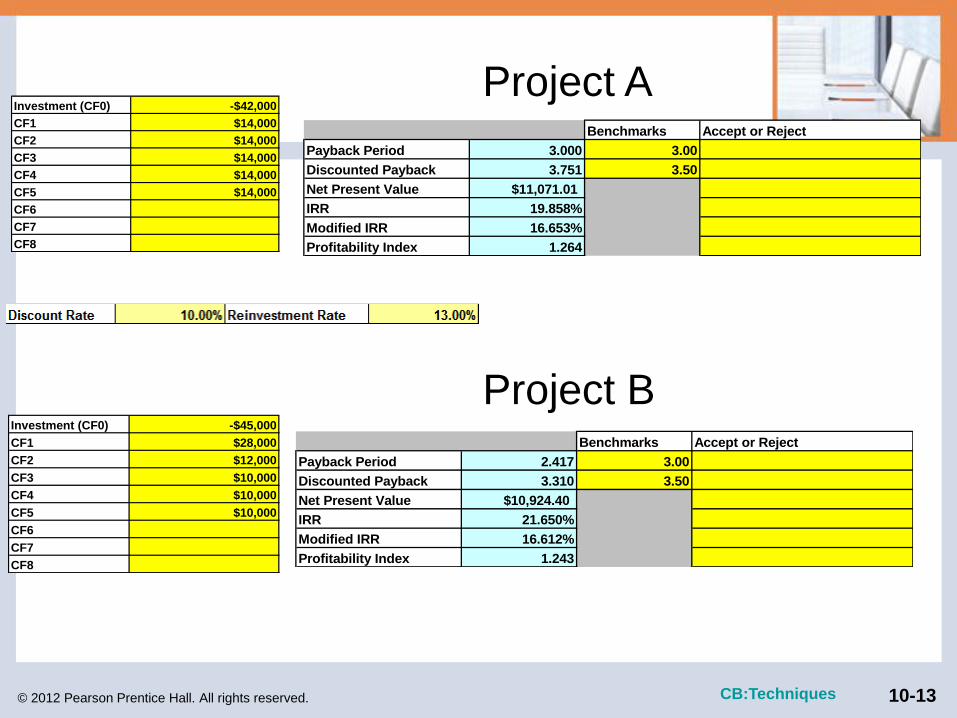
Project A
CB:Techniques
Investment (CF0) -$42,000
CF1 $14,000
CF2 $14,000
CF3 $14,000
CF4 $14,000
CF5 $14,000
CF6
CF7
CF8
Benchmarks Accept or Reject
Payback Period 3.000 3.00
Discounted Payback 3.751 3.50
Net Present Value $11,071.01
IRR 19.858%
Modified IRR 16.653%
Profitability Index 1.264
Investment (CF0) -$45,000
CF1 $28,000
CF2 $12,000
CF3 $10,000
CF4 $10,000
CF5 $10,000
CF6
CF7
CF8
Benchmarks Accept or Reject
Payback Period 2.417 3.00
Discounted Payback 3.310 3.50
Net Present Value $10,924.40
IRR 21.650%
Modified IRR 16.612%
Profitability Index 1.243
Project B

© 2012 Pearson Prentice Hall. All rights reserved. 10-14
Net Present Value (NPV):
NPV and the Profitability Index
• Can be used to break ties or very close decisions
• NOT a wealth maximization technique
• If PI >=1.0, accept the project
investment net
investment netNPV
investment net
CF futureof PV
PI
+==
26.1
42000
4200011071
PIA
=+
= 24.1
000,45
000,45924,10
PIB
=+
=

© 2012 Pearson Prentice Hall. All rights reserved. 10-15
Project A
CB:Techniques
Investment (CF0) -$42,000
CF1 $14,000
CF2 $14,000
CF3 $14,000
CF4 $14,000
CF5 $14,000
CF6
CF7
CF8
Benchmarks Accept or Reject
Payback Period 3.000 3.00
Discounted Payback 3.751 3.50
Net Present Value $11,071.01
IRR 19.858%
Modified IRR 16.653%
Profitability Index 1.264
Investment (CF0) -$45,000
CF1 $28,000
CF2 $12,000
CF3 $10,000
CF4 $10,000
CF5 $10,000
CF6
CF7
CF8
Benchmarks Accept or Reject
Payback Period 2.417 3.00
Discounted Payback 3.310 3.50
Net Present Value $10,924.40
IRR 21.650%
Modified IRR 16.612%
Profitability Index 1.243
Project B
© 2012 Pearson Prentice Hall. All rights reserved. 10-16
Net Present Value (NPV): NPV
and Economic Value Added
• Economic Value Added (or EVA), a registered trademark of the consulting firm, Stern Stewart & Co., is another close cousin of the NPV method.
• The EVA method begins the same way that NPV does—by calculating a project’s net cash flows.
• However, the EVA approach subtracts from those cash flows a charge that is designed to capture the return that the firm’s investors demand on the project.
• EVA determines whether a project earns a pure economic profit–a profit above and beyond the normal competitive rate of return in a line of business.
© 2012 Pearson Prentice Hall. All rights reserved. 10-17
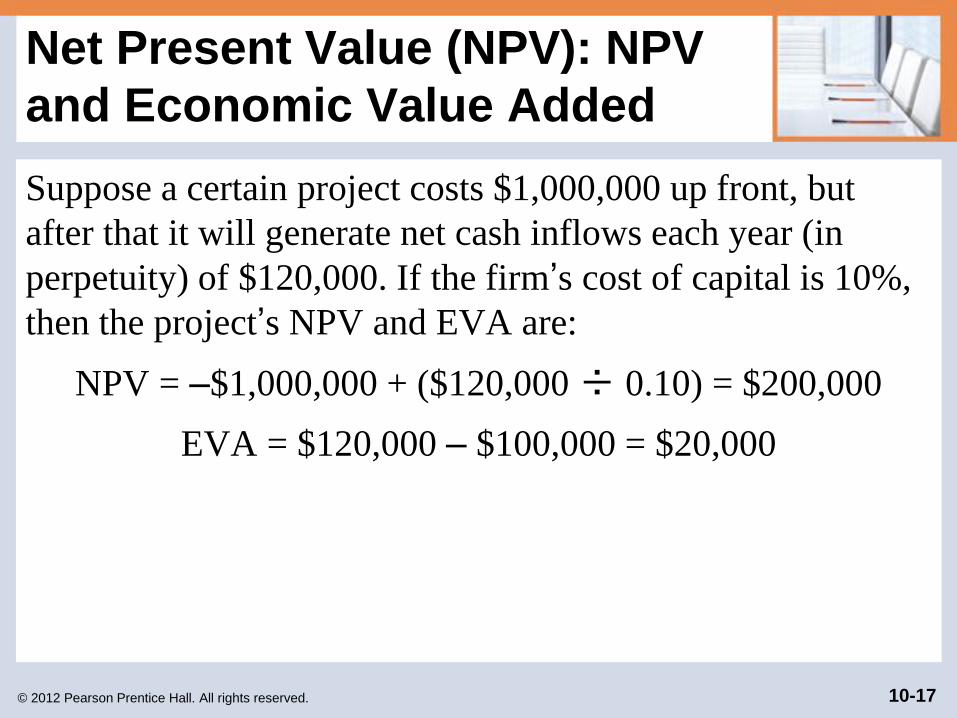
Net Present Value (NPV): NPV
and Economic Value Added
Suppose a certain project costs $1,000,000 up front, but
after that it will generate net cash inflows each year (in
perpetuity) of $120,000. If the firm’s cost of capital is 10%,
then the project’s NPV and EVA are:
NPV = –$1,000,000 + ($120,000 ÷ 0.10) = $200,000
EVA = $120,000 – $100,000 = $20,000
© 2012 Pearson Prentice Hall. All rights reserved. 10-18
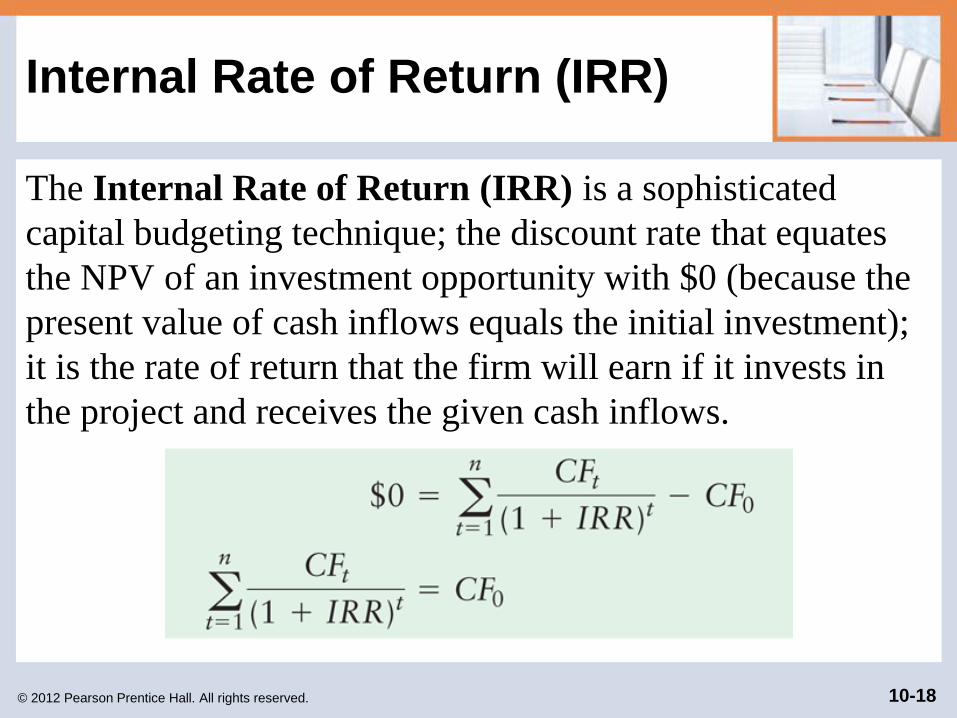
Internal Rate of Return (IRR)
The Internal Rate of Return (IRR) is a sophisticated
capital budgeting technique; the discount rate that equates
the NPV of an investment opportunity with $0 (because the
present value of cash inflows equals the initial investment);
it is the rate of return that the firm will earn if it invests in
the project and receives the given cash inflows.
© 2012 Pearson Prentice Hall. All rights reserved. 10-19
Internal Rate of Return (IRR)
Decision criteria:
– If the IRR is greater than the cost of capital, accept the project.
– If the IRR is less than the cost of capital, reject the project.
These criteria guarantee that the firm will earn at least its
required return. Such an outcome should increase the market
value of the firm and, therefore, the wealth of its owners.
© 2012 Pearson Prentice Hall. All rights reserved. 10-20
Project A
CB:Techniques
Investment (CF0) -$42,000
CF1 $14,000
CF2 $14,000
CF3 $14,000
CF4 $14,000
CF5 $14,000
CF6
CF7
CF8
Benchmarks Accept or Reject
Payback Period 3.000 3.00
Discounted Payback 3.751 3.50
Net Present Value $11,071.01
IRR 19.858%
Modified IRR 16.653%
Profitability Index 1.264
Investment (CF0) -$45,000
CF1 $28,000
CF2 $12,000
CF3 $10,000
CF4 $10,000
CF5 $10,000
CF6
CF7
CF8
Benchmarks Accept or Reject
Payback Period 2.417 3.00
Discounted Payback 3.310 3.50
Net Present Value $10,924.40
IRR 21.650%
Modified IRR 16.612%
Profitability Index 1.243
Project B
© 2012 Pearson Prentice Hall. All rights reserved. 10-21
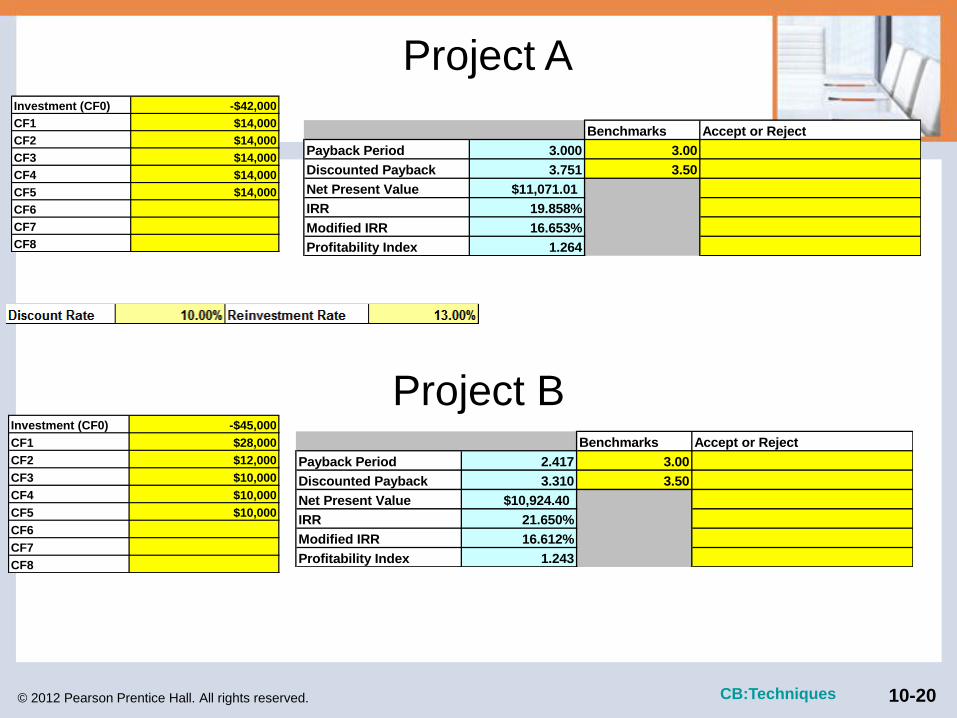
Internal Rate of Return (IRR):
Calculating the IRR (cont.)
• It is interesting to note in the preceding example that the IRR suggests that project B, which has an IRR of 21.7%, is preferable to project A, which has an IRR of 19.9%.
• This conflicts with the NPV rankings obtained in an earlier example.
• Such conflicts are not unusual.
• There is no guarantee that NPV and IRR will rank projects in the same order. However, both methods should reach the same conclusion about the acceptability or nonacceptability of projects.
© 2012 Pearson Prentice Hall. All rights reserved. 10-22
Comparing NPV and IRR Techniques:
Net Present Value Profiles
Net present value profiles are graphs that depict a project’s
NPVs for various discount rates.
To prepare NPV profiles for Bennett Company’s projects A
and B, the first step is to develop a number of discount rate-
NPV coordinates and then graph them as shown in the
following table and figure.
© 2012 Pearson Prentice Hall. All rights reserved. 10-23
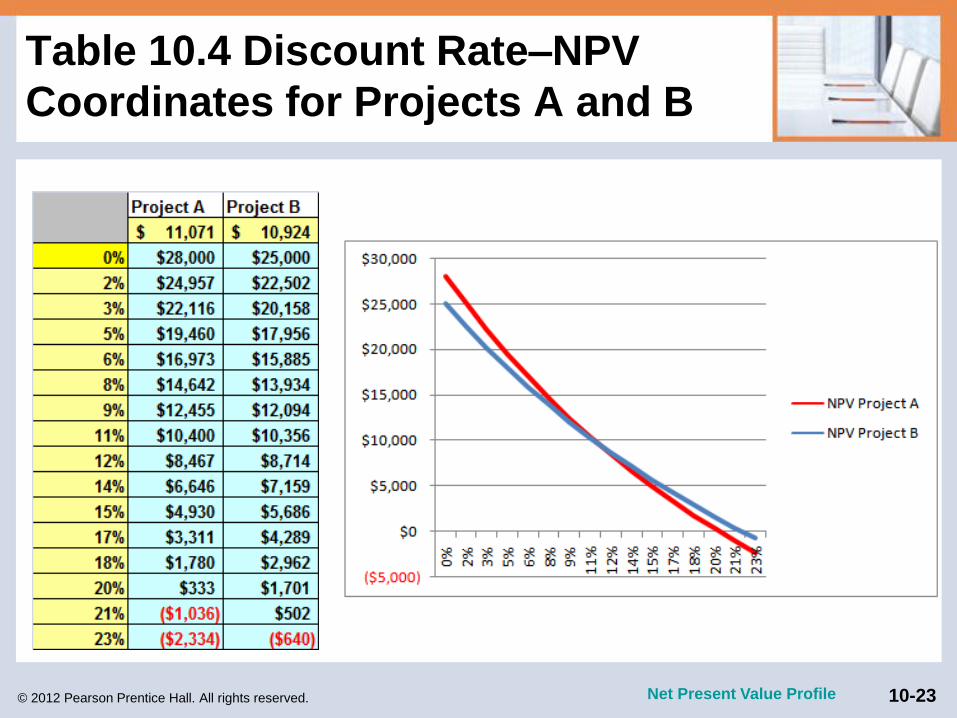
Table 10.4 Discount Rate–NPV
Coordinates for Projects A and B
Net Present Value Profile
© 2012 Pearson Prentice Hall. All rights reserved. 10-24
Comparing NPV and IRR
Techniques: Conflicting Rankings
• Conflicting rankings are conflicts in the ranking given a project by NPV and IRR, resulting from differences in the magnitude and timing of cash flows.
• One underlying cause of conflicting rankings is the implicit assumption concerning the reinvestment of intermediate cash inflows—cash inflows received prior to the termination of the project.
• NPV assumes intermediate cash flows are reinvested at the cost of capital, while IRR assumes that they are reinvested at the IRR.
© 2012 Pearson Prentice Hall. All rights reserved. 10-25
Comparing NPV and IRR Techniques:
Timing of the Cash Flow
Another reason why the IRR and NPV methods may provide different rankings for investment options has to do with differences in the timing of cash flows.
– When much of a project’s cash flows arrive early in its life, the project’s NPV will not be particularly sensitive to the discount rate.
– On the other hand, the NPV of projects with cash flows that arrive later will fluctuate more as the discount rate changes.
– The differences in the timing of cash flows between the two projects does not affect the ranking provided by the IRR method.
© 2012 Pearson Prentice Hall. All rights reserved. 10-26
Comparing NPV and IRR Techniques:
Magnitude of the Initial Investment
The scale problem occurs when two projects are very
different in terms of how much money is required to invest
in each project.
– In these cases, the IRR and NPV methods may rank projects
differently.
– The IRR approach (and the PI method) may favor small projects
with high returns (like the $2 loan that turns into $3).
– The NPV approach favors the investment that makes the
investor the most money (like the $1,000 investment that yields
$1,100 in one day).

© 2012 Pearson Prentice Hall. All rights reserved. 10-27
Comparing NPV and IRR Techniques:
Which Approach is Better?
On a purely theoretical basis, NPV is the better approach because:
– NPV measures how much wealth a project creates (or destroys if the NPV is negative) for shareholders.
– Certain mathematical properties may cause a project to have multiple IRRs—more than one IRR resulting from a capital budgeting project with a nonconventional cash flow pattern; the maximum number of IRRs for a project is equal to the number of sign changes in its cash flows.
Despite its theoretical superiority, however, financial managers prefer to use the IRR approach just as often as the NPV method because of the preference for rates of return.
© 2012 Pearson Prentice Hall. All rights reserved. 10-28
Matter of Fact
Which Methods Do Companies Actually Use?
– A recent survey asked Chief Financial Officers (CFOs) what
methods they used to evaluate capital investment projects.
– The most popular approaches by far were IRR and NPV, used
by 76% and 75% (respectively) of the CFOs responding to the
survey.
– These techniques enjoy wider use in larger firms, with the
payback approach being more common in smaller firms.