Embed Size (px)
Citation preview

Capital Markets 2018 Deep Dive – Mid-Year UpdateJune 12, 2018
REUTERS / Firstname Lastname
REUTERS / David Mdzinarishvili
Capital Markets 2018 Deep Dive
Capital Markets 2018 Deep Dive
Matthew Toole is the Director of Deals Intelligence within Thomson Reuters Investing and Advisory Division and is
responsible for communicating broad M&A, capital markets, private equity and venture capital industry trends through
quarterly research reports and the financial media. Matthew’s research has been featured in various global financial
publications including The New York Times and the Financial Times and he has appeared on CNBC’s Worldwide
Exchange and Squawk Box and The Nightly Business Report.
Stephen Lacey is US Editor for International Financing Review, responsible for coordinating coverage of Americas
capital markets teams (fixed income, securitization, derivatives, equities) across real-time and print publications. Since
joining IFR in 2001, Mr. Lacey has specialized in coverage across the life-cycle of equity capital markets, from venture
capital/private equity to IPO, and onto public equity (primary/secondary stock sales, convertible bonds and M&A). He
previously headed up IPO coverage at Red Herring, a bi-weekly publication focused on the venture capital industry.
Anthony Hughes is Assistant Editor for International Financing Review with primary responsibility for overseeing
equity capital markets coverage, including publication of the IFR US ECM Briefing. In this capacity, Mr. Hughes
specializes in coverage of TMT, Industrials and Financials. He has had a long career in business journalism, starting in
Australia as Investment Editor of the Sydney Morning Herald as well author of a daily stock market column for the
Australian Financial Review. Prior to joining IFR in 2011, Mr. Hughes worked as AFR’s New York correspondent. He
has also co-authored two books on stock market investing in Australia. Anthony is a CFA charterholder.

Capital Markets 2018 Deep Dive
Capital Markets Deep Dive
28%
30%
21%
21%
Investment BankingRevenue by Product2018
Mergers & Acquisitions Debt Capital Markets
Equity Capital Markets Syndicated Loans
$0
$5
$10
$15
$20
$25
$30
2013 2014 2015 2016 2017 2018
Regional IB Revenues
Americas Europe Asia Pacific
$0
$5
$10
$15
$20
$25
$30
2013 2014 2015 2016 2017 2018
BONDS EQUITY LOANS MA

Capital Markets 2018 Deep Dive
Global Equity Capital Markets activity falls 4% compared to 2017 levels
$0
$50
$100
$150
$200
$250
$300
$350
$400
$450
$500
1999 2000 2001 2002 2003 2004 2005 2006 2007 2008 2009 2010 2011 2012 2013 2014 2015 2016 2017 2018
Global IPO ($bil) Global Follow-Ons ($bil) Global Convertibles ($bil)
*year-to-date for all time periods

US Listed Initial Public Offerings hits four-year high, raising $25.8 billion, up
37% from a year ago; Number of offerings up 30%
0
50
100
150
200
250
$0
$10
$20
$30
$40
$50
$60
1999 2000 2001 2002 2003 2004 2005 2006 2007 2008 2009 2010 2011 2012 2013 2014 2015 2016 2017 2018
US Listed IPO Proceeds ($bil) Number of Offerings
Capital Markets 2018 Deep Dive

Top US Listed Initial Public Offerings: First Half 2018
Capital Markets 2018 Deep Dive
$3
$3
$3
$3
$3
$5
$8
$8
$9
$17
$0 $5 $10 $15 $20
Bolsa Mexicana de Valores
Ho Chi Minh City STC
London
Mumbai
National Stock Exchange
Hong Kong
Shanghai
Frankfurt
Nasdaq
New York
2018YTD IPO Proceeds ($bil)

Capital Markets 2018 Deep Dive
Could Spotify’s direct listing on the NYSE disrupt the traditional IPO process?

Capital Markets 2018 Deep Dive
Spotify’s performance since listing on the NYSE

Capital Markets 2018 Deep Dive
Tech listings lead 2018 offerings with 24% of total proceeds; Industrials lead by
number of offerings so far this year
10
20
30
40
50
60
70
80
90
$0
$2
$4
$6
$8
$10
$12
$14
$16
$18
$20
HighTechnology
Financials Healthcare Industrials Real Estate ConsumerProducts
Energy andPower
Retail Materials ConsumerStaples
Media andEntertainment
Telecom
IPO Proceeds ($bil) Number of Offerings

Global Block Trades account for 30% of follow-on activity so far this year, on par
with year-ago levels; Overall follow-ons down from 14% during year-to-date 2018
0%
5%
10%
15%
20%
25%
30%
35%
40%
45%
$0
$50
$100
$150
$200
$250
$300
$350
$400
$450
1999 2000 2001 2002 2003 2004 2005 2006 2007 2008 2009 2010 2011 2012 2013 2014 2015 2016 2017 2018
Global Block Trades ($bil) Non-Block Trade Follow Ons ($bil) Block Trades a % of Total
Capital Markets 2018 Deep Dive
*year-to-date for all time periods
Capital Markets 2018 Deep Dive
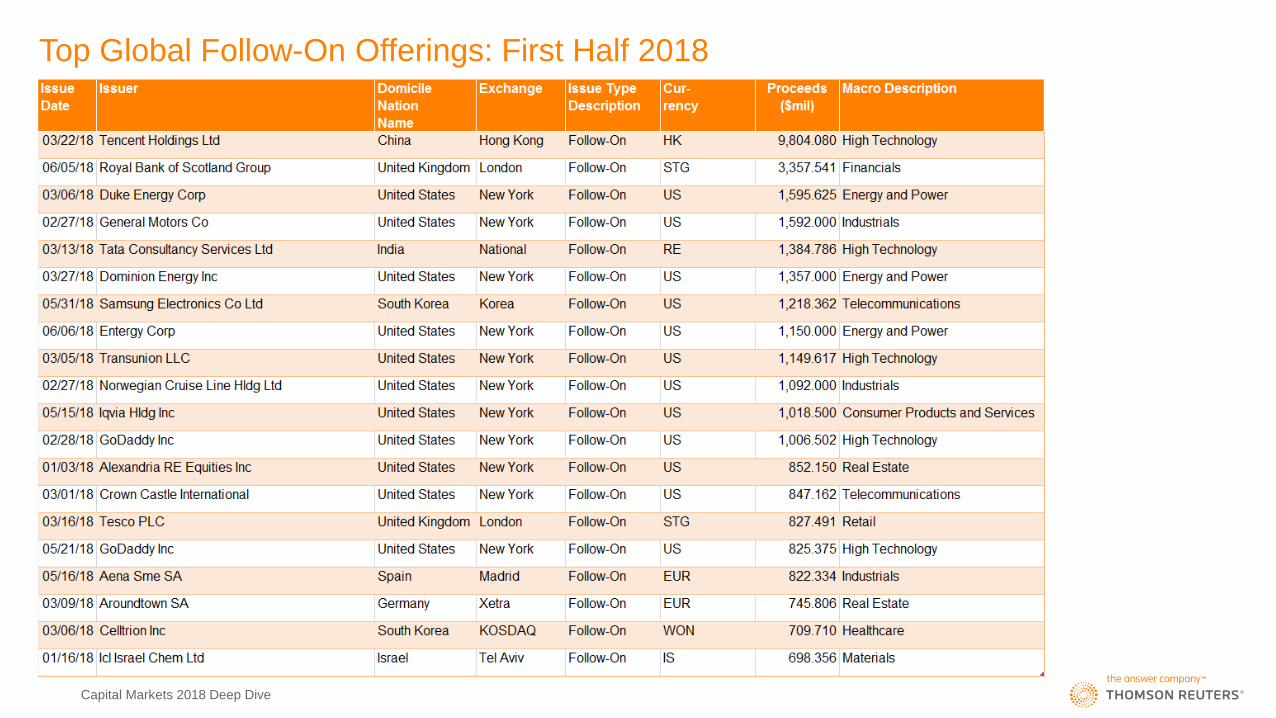
Top Global Follow-On Offerings: First Half 2018

Capital Markets 2018 Deep Dive
Special Purpose Acquisition Company (SPAC) offerings on pace for record year
5
10
15
20
25
30
35
40
45
$0
$1
$2
$3
$4
$5
2003 2004 2005 2006 2007 2008 2009 2010 2011 2012 2013 2014 2015 2016 2017 2018
SPAC IPO Proceeds ($bil) Number of Offerings*year-to-date for all time periods

Technology convertible bond offerings account for 21% of total issuance this year
as Twitter, Western Digital, Square tap the markets
0%
10%
20%
30%
40%
50%
60%
70%
80%
90%
100%
$0
$10
$20
$30
$40
$50
$60
$70
$80
$90
$100
1999 2000 2001 2002 2003 2004 2005 2006 2007 2008 2009 2010 2011 2012 2013 2014 2015 2016 2017 2018
Technology Convertibles ($bil) Non-Technology Convertibles ($bil) Technology as % of Total
Capital Markets 2018 Deep Dive
*year-to-date for all time periods

Global High Yield offerings decline 21% by proceeds and 18% by number of
new offerings
0
50
100
150
200
250
300
350
400
450
500
$0
$50
$100
$150
$200
$250
1999 2000 2001 2002 2003 2004 2005 2006 2007 2008 2009 2010 2011 2012 2013 2014 2015 2016 2017 2018
Global High Yield Corporate Debt ($bil) Number of Offerings
Capital Markets 2018 Deep Dive
*year-to-date for all time periods

Top Global High Yield Bonds: First Half 2018
Capital Markets 2018 Deep Dive
$1
$3
$8
$9
$9
$11
$13
$14
$0 $5 $10 $15
CCC
CCC+
B-
BB+
BB
BB-
B
B+
S&P Ratings ($bil)

Global Investment Grade bond offerings fall 8% compared to year-to-date
2017; US marketplace offerings decline 15% compared to a year ago
0
1,000
2,000
3,000
4,000
5,000
6,000
7,000
$0
$200
$400
$600
$800
$1,000
$1,200
$1,400
$1,600
$1,800
$2,000
1999 2000 2001 2002 2003 2004 2005 2006 2007 2008 2009 2010 2011 2012 2013 2014 2015 2016 2017 2018
Global Investment Grade Corporate Debt ($bil) Number of Offerings
Capital Markets 2018 Deep Dive
*year-to-date for all time periods

Top Global Investment Grade Bonds: First Half 2018
Capital Markets 2018 Deep Dive
121
128129
136
147
126
106
117
109106104
89
9691
0
20
40
60
80
100
120
140
160
2015 2016 2017 2018
Avg. US Investment Grade Spreads (BPS)

Questions and Second Half 2018 Outlook
REUTERS / Firstname Lastname
REUTERS / David Mdzinarishvili
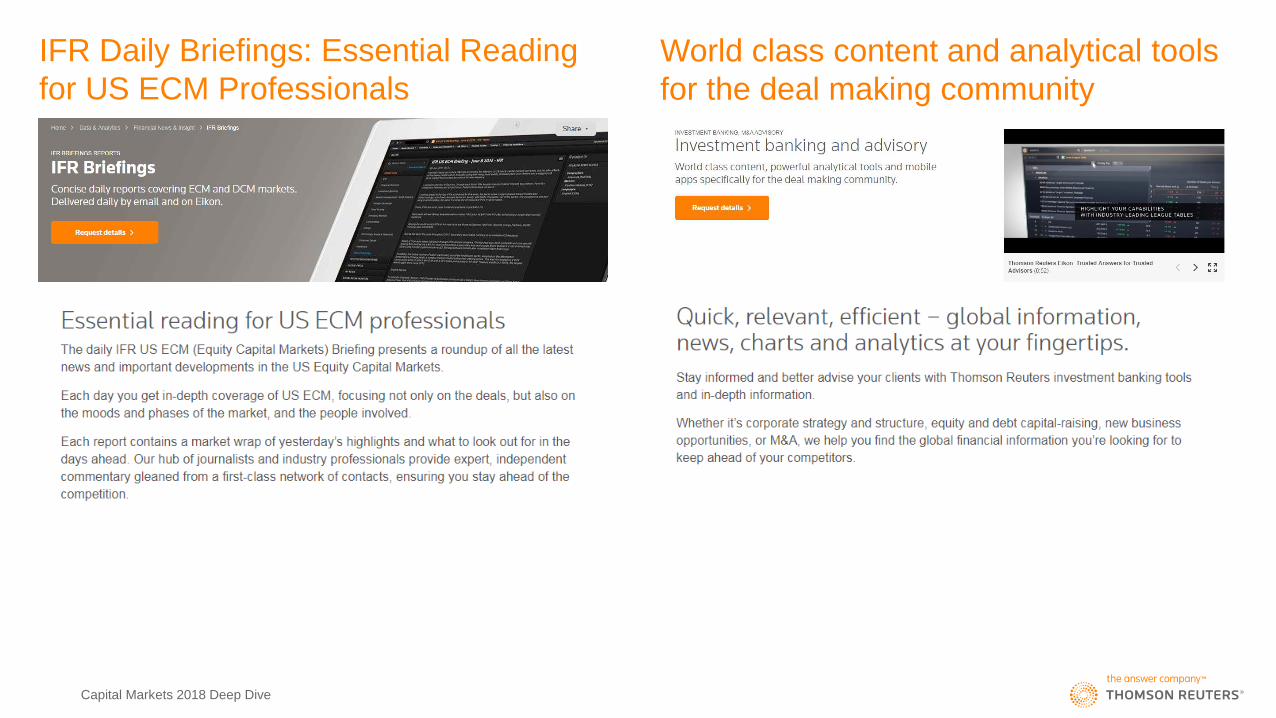
IFR Daily Briefings: Essential Reading
for US ECM Professionals
Capital Markets 2018 Deep Dive
World class content and analytical tools
for the deal making community