Embed Size (px)
Citation preview
Car-sharing in Switzerland - comparison of usergroups
Henrik Becker
Francesco Ciari
IVT, ETH Zurich April 2015
STRC
15th Swiss Transport Research Conference
Monte Verità / Ascona, April 15 – 17, 2015
Car-sharing in Switzerland - comparison of user groups April 2015
IVT, ETH Zurich
Car-sharing in Switzerland - comparison of user groups
Henrik Becker, Francesco CiariInstitute for Transport Planning and SystemsETH ZurichStefano-Franscini-Platz 58093 ZurichSwitzerlandphone: +41-44-633 65 29fax: +41-44-633 10 [email protected]
April 2015
Abstract
A survey was conducted to study customer groups and usage patterns for a station-based anda free-floating car-sharing service in Basel. It was found, that the two car-sharing servicesserve different groups and are used in different ways. In particular, the free-floating car-sharingservice attracts a broad variety of customers. Contrarily, the station-based car-sharing service isespecially appealing to highly-educated and high-income people from non-car households. Also,station-based car-sharing is mainly used for purposes actually requiring a car, whereas most free-floating car-sharing rides could in principle also have been done using public transit. Therefore,station-based carsharing direcly enables and serves carless households, whilst free-floatingcar-sharing does so indirectly by providing efficient transportation on a trip-basis.
Keywordsfree-floating car-sharing, Catch a Car
i
Car-sharing in Switzerland - comparison of user groups April 2015
1 Introduction
Ubiquitous mobile devices such as smartphones allow real-time exchange of information. Thisenables new forms of social interactions and supports the idea of a shared economy. One ofthe best-known and most widespread applications in a shared economy is car-sharing of whichfree-floating car-sharing benefits the most from the new communication technologies.
Since free floating car-sharing is a new service, knowledge about its impacts is still very limited.In contrast to traditional, round-trip car-sharing, it allows for one-way-trips offering much moreflexibility to its customers. Moreover, vehicles usually cannot be reserved beforehand. As thisimposes major conceptual changes, insights from traditional car-sharing do not necessarily holdfor the case of its free-floating form.
Whilst traditional car-sharing services seem to have reached their limits of growth (especially inEurope), free-floating car-sharing seems to attract a larger group of customers and still enjoyshigh levels of growth.
Empirical studies on free-floating car-sharing in the few cities with the service have identifiedmajor user groups and their motivations. In addition, they analyzed the dominant usage patternsas well as environmental implications (Kopp et al., 2013, Schmöller et al., 2014). Yet, thesefacets have been treated separately leaving possibly important links undetected. Offering aconvenient and fast new form of urban mobility free-floating car-sharing may attract both(former) car owners and public transit users. Hence, it is still unclear how its growing diffusionaffects overall travel behavior (Seattle Department of Transportation, 2014).
The introduction of the free-floating car-sharing service Catch a Car in Basel for the first timeallows an investigation of the usage and impacts of free-floating car-sharing in the Swiss context.For this purpose, empirical data has been collected allowing a comparison of the travel patternsand socio-demographic backgrounds of the members of the new free-floating car-sharing servicewith the ones of station-based car-sharing members and the general population. Furthermore,the results may help to draw detailed user profiles and may contribute to the understanding of theparticularities of car-sharing usage, i.e. if and how the specific forms of car-sharing complementor substitute each other and how their user groups are different.
The remainder of this paper is structured as follows: Section 2 provides a short overview ofthe relevant scientific literature, Section 3 describes the methodology of this study includingdetails about the survey design. The results of this study are then presented in Section 4 and arebeing discussed in Section 5. Section 6 concludes with an outlook onto the next steps of thisresearch.
1
Car-sharing in Switzerland - comparison of user groups April 2015
2 Background
2.1 Free-Floating Carsharing
The roots of today’s more and more successful car-sharing systems can be traced back to the late1940s, when the first systems were ideated to share a useful, yet expensive asset - the car. As thefirst implementation of a car-sharing service, the Sefage program in Zurich was established in1948 (Harms and Truffer, 1998). Systems in other European cities followed. However, in anera of fast and ever-cheaper private motorization, car-sharing lacked attractiveness. Only in theearly 1990s rising fuel prices and a congested road network built the path for a successful revivalof the idea of car-sharing. Technology has been key to unlock this new potential by providinguser-friendly systems, efficient allocation strategies and has even led to the development of newforms such as free-floating car-sharing or peer-to-peer car-sharing.
The scientific literature about car-sharing has grown in scope and number in recent years as hasthe diffusion of the service itself. There already exists a large corpus of literature that deals withmany of its different aspects.
The overwhelming majority of scientific literature on car-sharing has been written in the last20 years (Millard-Ball et al., 2005) and mainly covered traditional station-based car-sharingservices. The research has produced agreement on several issues. For instance station-basedcar-sharing is widely accepted that the most suitable markets are dense urban areas with agood public transport supply (Stillwater et al., 2008, Grasset and Morency, 2010) or that theprototype user is relatively young and affluent and well educated. One-way car-sharing is not asdiffused but the optimal redistribution of vehicles has been investigated several times (Uesugiet al., 2007, Awasthi et al., 2008, Correia and Antunes, 2012). The impact of car-sharing on thetransportation system has also inspired several researchers. The works focusing on car-sharingwere able to confirm several positive impacts like less vehicle travel and lower emissions (Martinand Shaheen, 2011b) as well as reducing the need for parking (Shaheen et al., 2010, Millard-Ballet al., 2005).
Predictions concerning car-sharing demand and diffusion levels, however, proved hardly reliable:For example an early study in Austria estimating a market potential of 9% (Steininger et al.,
1996) as well as a Swiss study predicting a potential of 6000́00 customers for the service ofMobility Switzerland (Muheim and Reinhardt, 1999) were both off by more than a factor five.
For a better understanding of the travel behavior of car-sharing users, the distinction betweenstrategic and tactic decisions (Le Vine, 2011) is very helpful as the short-term (tactic) decisions
2
Car-sharing in Switzerland - comparison of user groups April 2015
are usually determined by the traveler’s (strategic) mobility equipment. Car-Sharing in generalhas effects on both the tactic and strategic level most often represented by the variables modechoice and car-ownership.
Recently, the research has extended its scope to the newest forms of car-sharing such asfree-floating car-sharing. In contrast to station-based car-sharing services, the research onfree-floating car-sharing services focused on its usage patterns and environmental impact.
Whilst early studies expected a significant reduction in car ownership and CO2 emissions(Firnkorn and Müller, 2011) due to free-floating car-sharing, the actual impact seems to bemore complex as non-car-owners reduce bike, walk and public transit trips, but start to use acar instead (Firnkorn, 2012). First reports from municipalities having introduced free-floatingalso state this ambivalence. For example, a first study after one year of operation of car2go, afree-floating car-sharing service, in Seattle found inconclusive results: Whilst 39% of car2gomembers had at least considered giving up a car and a third of the members were traveling fewermiles with their private car, nearly half reported to ride transit less frequently and two thirdshave not changed the amount vehicle miles travelled with their private car despite despite their(additional) car2go use (Seattle Department of Transportation, 2014). Also another first impactanalysis of car2go in Amsterdam, reported only slight contributions towards a relaxation of theprevailing parking situation or towards a reduction of congestion or greenhouse gas emissions(Suiker and van den Elshout, 2013).
Yet, a similar pattern has also been observed in the case of traditional car-sharing services,where slight increases of vehicle miles travelled (VMT) by the majority of customers were morethan balanced by substantial decreases in VMT by the remainder of the customers (Martin andShaheen, 2011a) making for the traditional system’s significantly positive overall impact. Henceit is yet too early to determine the actual impact of free-floating systems.
Furthermore, studies on car-sharing services after only one year of operation have only limitedvalidity as the composition and travel behavior of early adopters may differ greatly from latercustomer groups. In the case of car2go in San Francisco, early adopters were mostly non-car-owners who therefore increased their vehicle mileage (Cervero, 2003), whilst members whohad joined the service later, actually reduced their private car-ownership and vehicle mileage(Cervero and Tsai, 2004).
Confirming the evidence from studies cited above a recent British study directly comparingfree-floating car-sharing to round-trip car-sharing, found that round-trip car-sharing has a farmore positive impact on the transport system and is used to complement public transit, whereaspoint-to-point (or free-floating) car-sharing is used in parallel to public transit and has only
3
Car-sharing in Switzerland - comparison of user groups April 2015
slim impact on the transportation system (Le Vine et al., 2014b) indicating a small effect on thestrategic level. Nonetheless, point-to-point car-sharing - due to its flexibility - has a far highermarket potential.
On the tactic level, one-way car-sharing is found to cause changes to its members’ travel behavior.For example, it lets non-car-owning members shop for groceries less frequently, visit fewerdistinct food shops and spend less total time traveling for grocery shopping purposes (Le Vineet al., 2014a). The impact of free-floating (one-way) car-sharing, however, is not stable, buthighly dependent on weather conditions (Schmöller et al., 2014) or pricing structures (Ciariet al., 2014). Moreover, customers of free-floating car-sharing services only show low levels ofloyalty towards a single service (Wappelhorst et al., 2013).
2.2 Catch a Car
In August 2014, Mobility Switzerland has launched its free-floating car-sharing pilot programin Basel, Switzerland (Mobility International Inc., 2014). 100 cars of the type VW Up aredistributed around the city and are available spontaneously. They can be located via a smartphone-app and reserved for up to 15 minutes. Customers have to pay a small registration fee up frontand then only pay on a per-use basis. The fare structure distinguishes between parking anddriving time; customers are charged per minute. At the end of the journey, the vehicle can beparked on any residential parking bay within the service area. It will then become available forother members.
4
Car-sharing in Switzerland - comparison of user groups April 2015
3 Methodology
This study is based on a survey conducted in Basel, Switzerland, in late fall 2014.
Since August 2014, there are two different car-sharing services operating in Basel: the traditional,round-trip based service ”Mobility”) and the new free-floating car-sharing pilot program ”Catcha Car”. Both services are offered by the company Mobility Switzerland.
In order to capture the full impact of the new free-floating car-sharing service on the trans-portation system, three different groups were considered for the survey: Members of the newfree-floating car-sharing service Catch a Car, members of the traditional car-sharing serviceMobility and people holding a driver’s license, who are a random sample of the local population.The survey was conducted in German language.
3.1 Recruitment and data acquisition
In total, 527 Catch a Car members, 2 224 Mobility customers and 6 000 members of the randomsample were invited to take part in the study (as of December 15th, 2014). Whilst address listsof car-sharing members were made available by Mobility Switzerland, surface-mail addressesfor the random sample of the population were provided by the Cantonal Statistical Office ofBasel-Stadt. The random sample was drawn from the local population above legal age.
The study consisted of two separate parts. The first was a survey about socio-demographicattributes as well as the participants’ general mobility behavior, whereas the second part was aone-week travel diary using a smartphone-based GPS-tracker. Participants were asked to fill inthe survey by the end of the week of reception and to keep the diary the week after. Details andinstructions concerning the mobility diary were given at the end of the survey.
Each of the three participant groups was provided with dedicated questionnaires. Whilst thecar-sharing members were recruited via e-mail and were able to access the online-survey usingpersonalized links, members of the control group received the survey in pencil-and-paper-formatvia surface mail including a reply-paid envelope.
Except for a few addresses used for pre-tests in early October 2014, participants were invitedto take part in the study in weekly waves in calendar weeks 43 to 50 as detailed in Table 1. Inparticular, participant feedback from the early waves war used to improve the technical setupand to therefore reduce the burden for the following participants. In the last week, reminders
5
Car-sharing in Switzerland - comparison of user groups April 2015
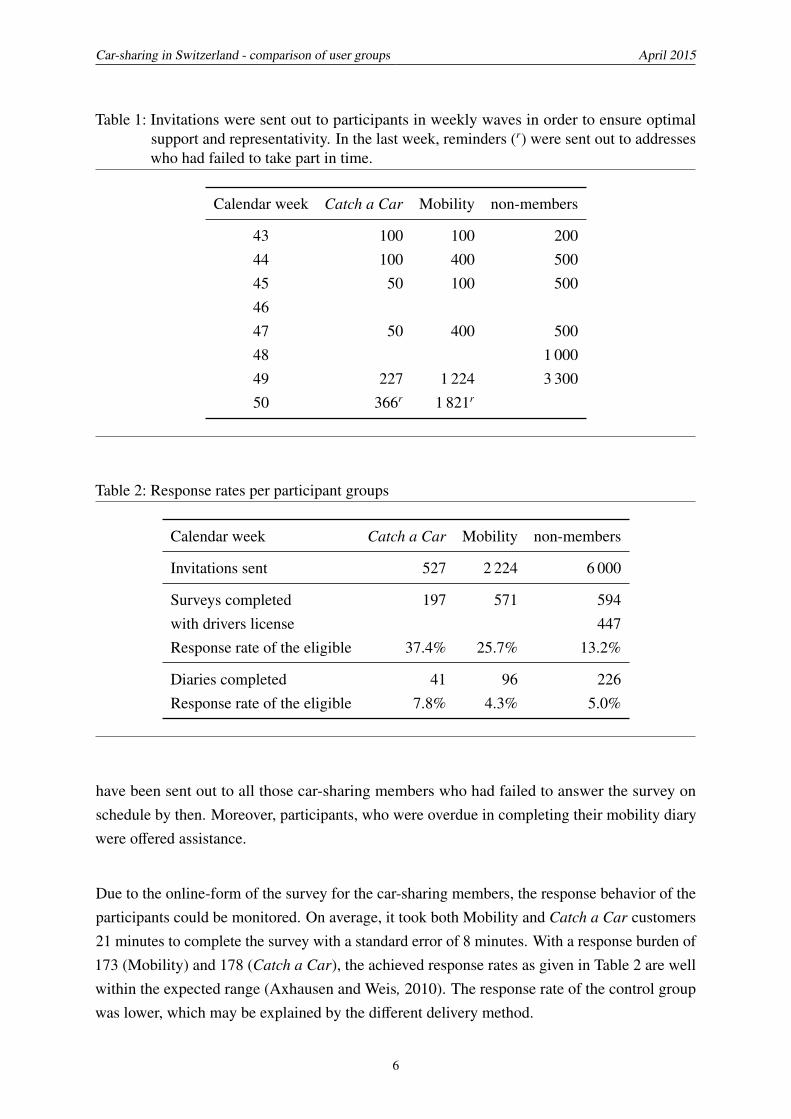
Table 1: Invitations were sent out to participants in weekly waves in order to ensure optimalsupport and representativity. In the last week, reminders (r) were sent out to addresseswho had failed to take part in time.
Calendar week Catch a Car Mobility non-members
43 100 100 20044 100 400 50045 50 100 5004647 50 400 50048 1 00049 227 1 224 3 30050 366r 1 821r
Table 2: Response rates per participant groups
Calendar week Catch a Car Mobility non-members
Invitations sent 527 2 224 6 000
Surveys completed 197 571 594with drivers license 447Response rate of the eligible 37.4% 25.7% 13.2%
Diaries completed 41 96 226Response rate of the eligible 7.8% 4.3% 5.0%
have been sent out to all those car-sharing members who had failed to answer the survey onschedule by then. Moreover, participants, who were overdue in completing their mobility diarywere offered assistance.
Due to the online-form of the survey for the car-sharing members, the response behavior of theparticipants could be monitored. On average, it took both Mobility and Catch a Car customers21 minutes to complete the survey with a standard error of 8 minutes. With a response burden of173 (Mobility) and 178 (Catch a Car), the achieved response rates as given in Table 2 are wellwithin the expected range (Axhausen and Weis, 2010). The response rate of the control groupwas lower, which may be explained by the different delivery method.
6
Car-sharing in Switzerland - comparison of user groups April 2015
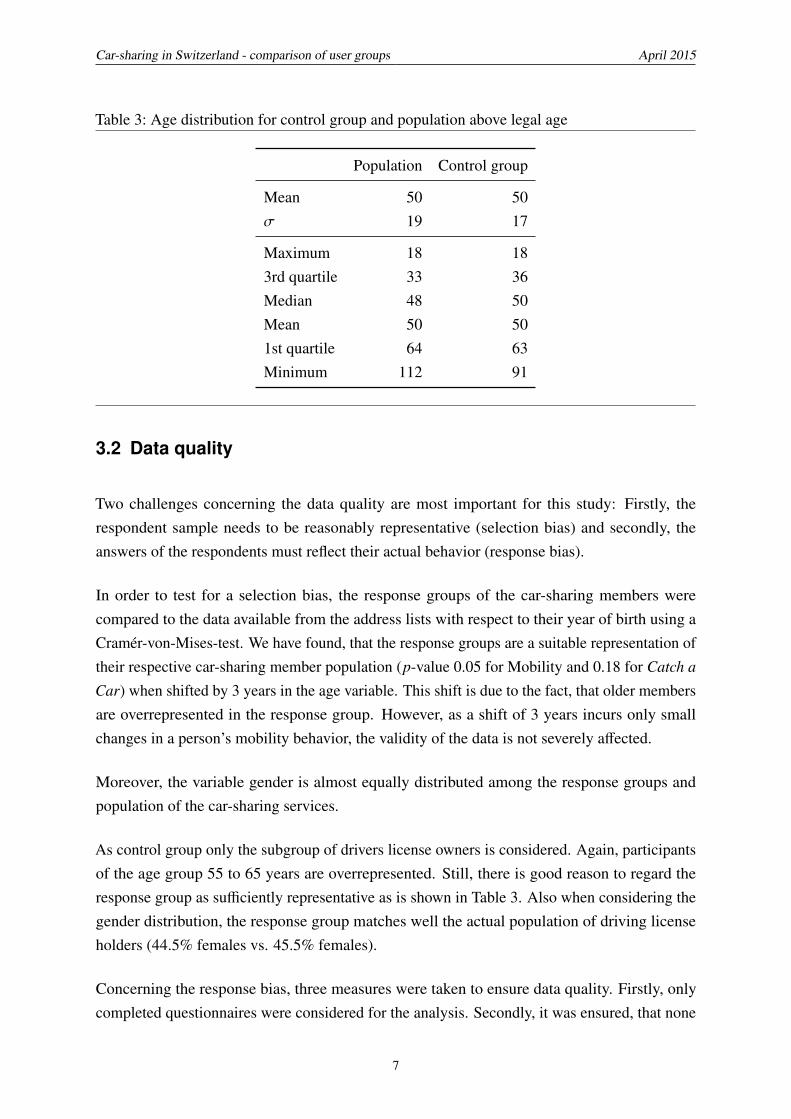
Table 3: Age distribution for control group and population above legal age
Population Control group
Mean 50 50σ 19 17
Maximum 18 183rd quartile 33 36Median 48 50Mean 50 501st quartile 64 63Minimum 112 91
3.2 Data quality
Two challenges concerning the data quality are most important for this study: Firstly, therespondent sample needs to be reasonably representative (selection bias) and secondly, theanswers of the respondents must reflect their actual behavior (response bias).
In order to test for a selection bias, the response groups of the car-sharing members werecompared to the data available from the address lists with respect to their year of birth using aCramér-von-Mises-test. We have found, that the response groups are a suitable representation oftheir respective car-sharing member population (p-value 0.05 for Mobility and 0.18 for Catch a
Car) when shifted by 3 years in the age variable. This shift is due to the fact, that older membersare overrepresented in the response group. However, as a shift of 3 years incurs only smallchanges in a person’s mobility behavior, the validity of the data is not severely affected.
Moreover, the variable gender is almost equally distributed among the response groups andpopulation of the car-sharing services.
As control group only the subgroup of drivers license owners is considered. Again, participantsof the age group 55 to 65 years are overrepresented. Still, there is good reason to regard theresponse group as sufficiently representative as is shown in Table 3. Also when considering thegender distribution, the response group matches well the actual population of driving licenseholders (44.5% females vs. 45.5% females).
Concerning the response bias, three measures were taken to ensure data quality. Firstly, onlycompleted questionnaires were considered for the analysis. Secondly, it was ensured, that none
7

Car-sharing in Switzerland - comparison of user groups April 2015
of the car-sharing members took less than seven minutes (a third of the average time) to completethe questionnaire. Thirdly, unreasonable answers were omitted on a per-question basis.
8
Car-sharing in Switzerland - comparison of user groups April 2015
4 Survey Results
As the analysis of the mobility diaries is still ongoing, in this section the results of the survey forthe three participant groups are presented. It is assumed, that the response groups are sufficientlyrepresentative for the sample population. Although having been available for validation of thesurvey results, information directly provided by Mobility Carsharing does not appear in thisreport due to reasons of data protection.
4.1 Socio-Demographics
With a reported average age of 42 years (σ = 13y), Catch a Car respondents are five yearsyounger than Mobility customers (mean = 47y, σ = 13y). Both car-sharing groups are youngerthan the control group with an average age of 50 years (σ = 17y). Differences also occur whenregarding the gender distribution of the three groups. Whilst women only account for 21% ofthe Catch a Car respondents, they are more abundant among Mobility customers (35%) and thecontrol group (45%). Item non-response for above questions was 0 except for one member ofthe control group who did not provide a year of birth.
Considering hosehold size, differences between the groups become less substantial. 20% of theCatchaCar respondents live in single-households, but 23% of the control group and 26% of theMobility respondents. With average household sizes of 2.55 (Catch a Car), 2.32 (Mobility) and2.33 (control group) all respondent groups reportet higher numbers than the average householdsize of the local population with 1.92 members per household as of 2011. One Catch a Car
member and four members of the control group skipped this question.
Significant differences were found when comparing the groups with respect to education andoccupation. As shown in Table 4, 80% of the Mobility respondents and 70% of the Catch a Car
respondents hold a tertiary degree compared to 60% among members of the control group. Theyounger average age (compared to the control group) also translates to high occupation ratesamong car-sharing members. 83% of the Mobility and Catch a Car respondents report to beemployed or self-employed versus 64% of the members of the control group. Retirees makefor a 25% of the members of the control group, but only for 9% of the Mobility and 6% of theCatch a Car customers. Hence, Mobility seems to attract more retirees, whereas Catch a Car
seems to appeal more to students. Four Mobility customers and two Catch a Car respondentschose not to provide their occupation.
Furthermore, respondents were asked to specify their net household income range in intervals
9
Car-sharing in Switzerland - comparison of user groups April 2015
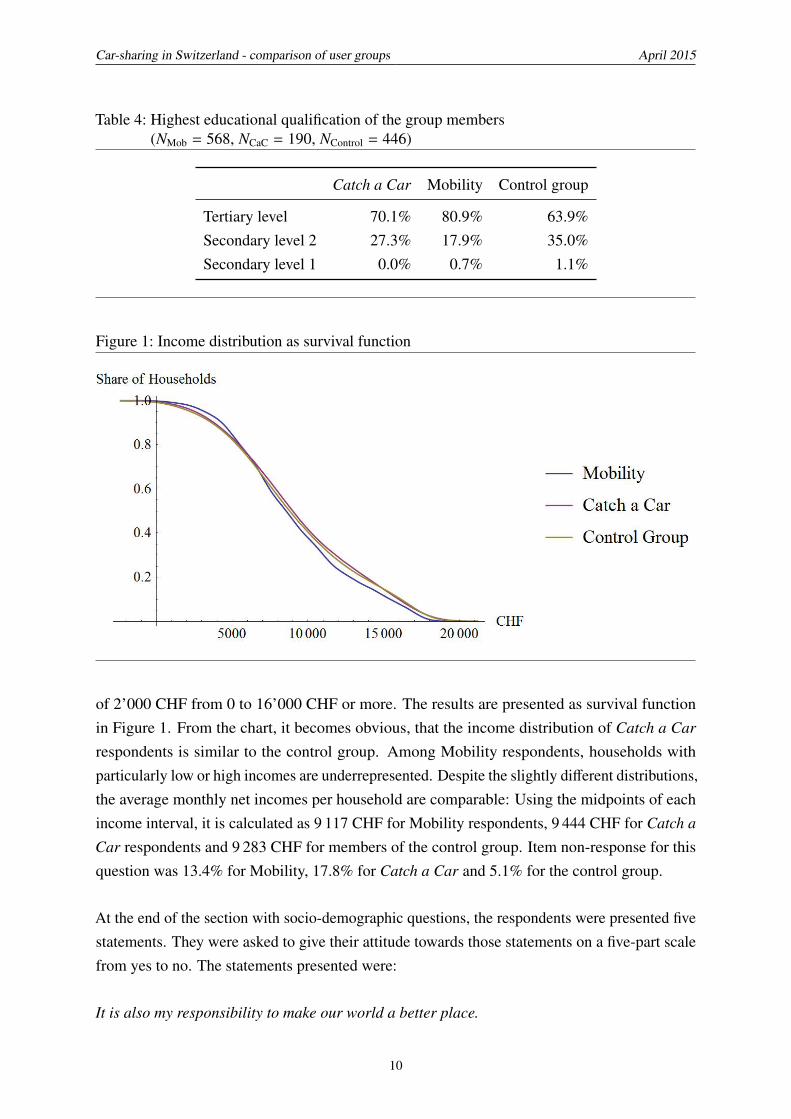
Table 4: Highest educational qualification of the group members(NMob = 568, NCaC = 190, NControl = 446)
Catch a Car Mobility Control group
Tertiary level 70.1% 80.9% 63.9%Secondary level 2 27.3% 17.9% 35.0%Secondary level 1 0.0% 0.7% 1.1%
Figure 1: Income distribution as survival function
of 2’000 CHF from 0 to 16’000 CHF or more. The results are presented as survival functionin Figure 1. From the chart, it becomes obvious, that the income distribution of Catch a Car
respondents is similar to the control group. Among Mobility respondents, households withparticularly low or high incomes are underrepresented. Despite the slightly different distributions,the average monthly net incomes per household are comparable: Using the midpoints of eachincome interval, it is calculated as 9 117 CHF for Mobility respondents, 9 444 CHF for Catch a
Car respondents and 9 283 CHF for members of the control group. Item non-response for thisquestion was 13.4% for Mobility, 17.8% for Catch a Car and 5.1% for the control group.
At the end of the section with socio-demographic questions, the respondents were presented fivestatements. They were asked to give their attitude towards those statements on a five-part scalefrom yes to no. The statements presented were:
It is also my responsibility to make our world a better place.
10
Car-sharing in Switzerland - comparison of user groups April 2015
This statement has the approval of more than 90% of all respondents. Interestingly, members ofthe control group were most likely to tick ”strongly agree” (74.7%) with 70.2% of the Mobilityand 66.0% of the Catch a Car respondents strongly agreeing to this statement.
I care about environmental protection and climate change.
Also this statement receives support by the vast majority of respondents.94.4% of the Mobilityrespondents, 93.6% of the Catch a Car respondents and 92.0% of the members of the controlgroup agree or strongly agree. Mobility members show the largest share of respondents stronglyagreeing with this statement (73.1%).
I like to try out new things.
Catch a Car members give by far the strongest support to this statement. 93.1% agree to thisstatement and 67.0% do so strongly. Approval rates among Mobility customers (48.0% stronglyagree, 37.8% agree) and members of the control group (42.6% strongly agree, 27.7% agree) aresignificantly lower.
Saving money is important for me.
This statement evoked mixed responses throughout the different groups. 11.9% from the controlgroup, 9.7% of the Mobility customers and 11.4% of the Catch a Car members disagreed withthis statement. On the other hand, 25.1% of the control group members, 18.5% of the Mobilitycustomers and 27.1% of the Catch a Car respondents strongly agreed to this statement.
For me, a car also is a status symbol.
Only 13.5% of the control group respondents, 5.4% of the Mobility customers and 11.3% ofthe Catch a Car members agree to this statement. 73.0% of the Mobility customers stronglydisagree, significantly exceeding the respective shares of 59.1% and 60.1% for the control groupand Catch a Car members.
For the attitude questions above, item non-response rates were around 1%.
4.2 General Mobility Behavior
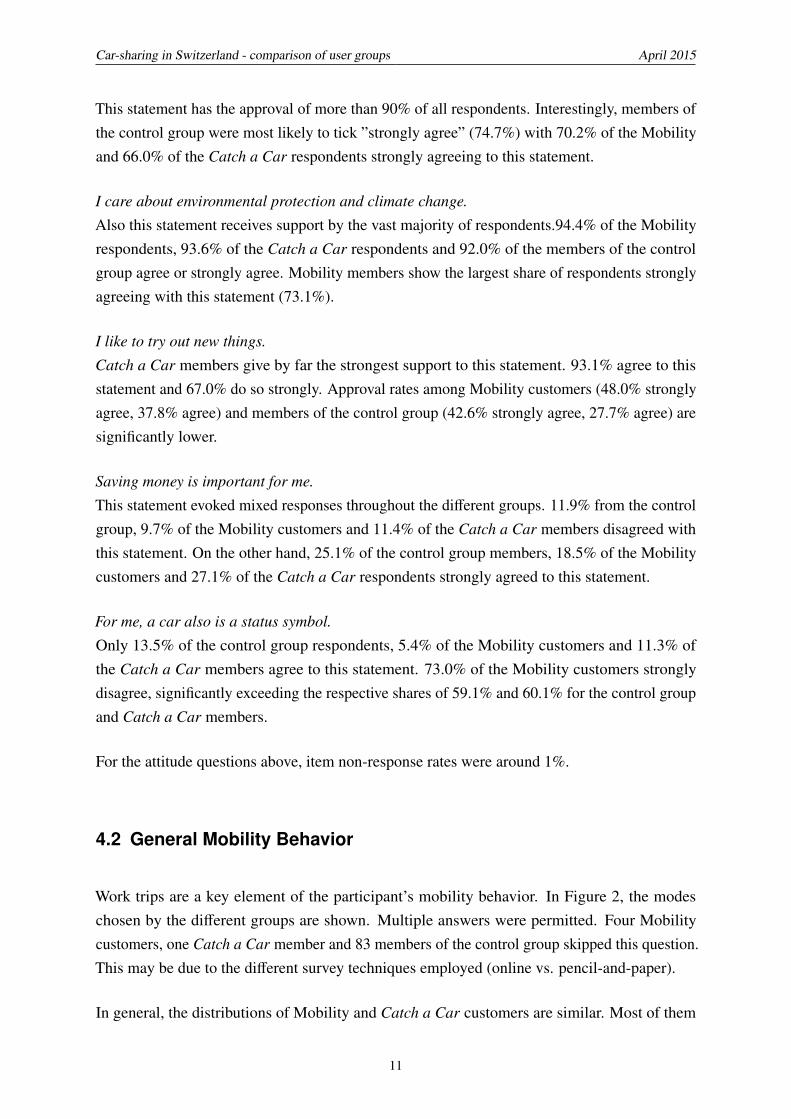
Work trips are a key element of the participant’s mobility behavior. In Figure 2, the modeschosen by the different groups are shown. Multiple answers were permitted. Four Mobilitycustomers, one Catch a Car member and 83 members of the control group skipped this question.This may be due to the different survey techniques employed (online vs. pencil-and-paper).
In general, the distributions of Mobility and Catch a Car customers are similar. Most of them
11
Car-sharing in Switzerland - comparison of user groups April 2015
Figure 2: Modes used for work trips (multiple answers permitted)
use public transit and bikes and almost 40% walk at least parts of their journey. Differencesoccur when regarding the use of cars: Catch a Car members are much more likely to use carsthan Mobility customers. Of the control group members 28% use a car for their work trips - amuch higher share than among car-sharing customers. On the other hand, car-sharing membersrely more on public transit and bicycles. Only few respondents from the control group takepublic transit or walk. A particularly interesting observation is, that 9% of the car-sharingmembers state, that they use car-sharing (among others) for their work trips.
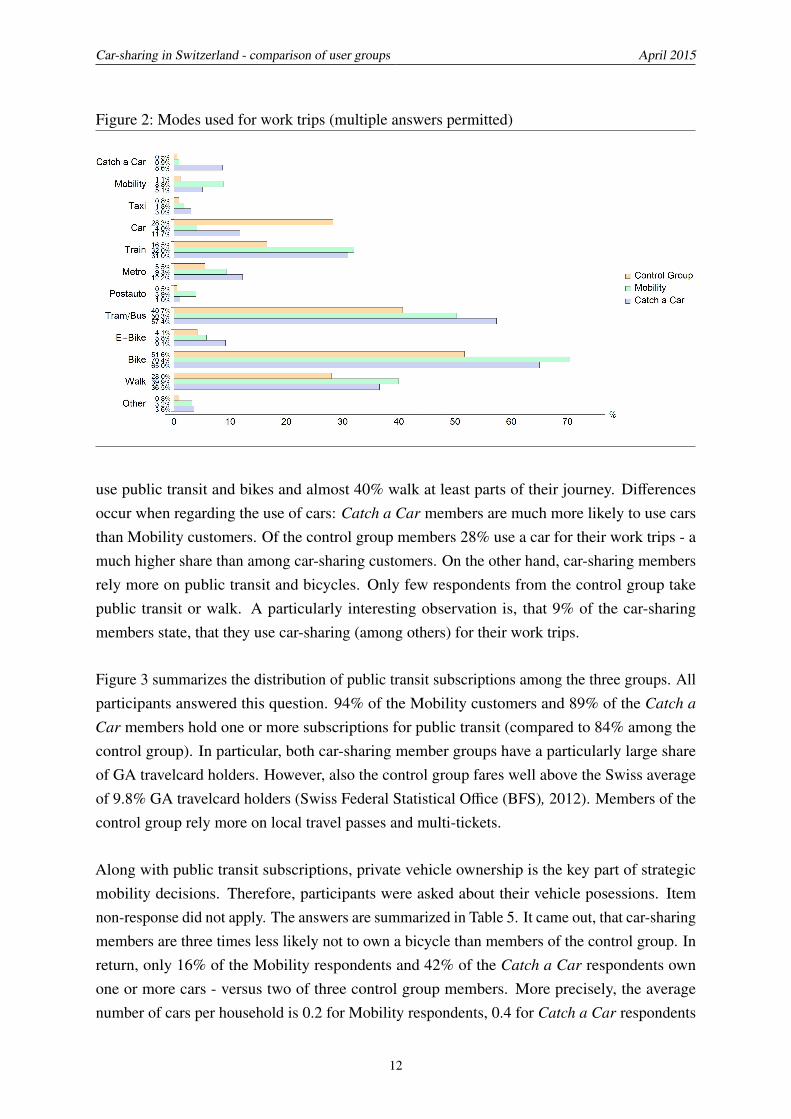
Figure 3 summarizes the distribution of public transit subscriptions among the three groups. Allparticipants answered this question. 94% of the Mobility customers and 89% of the Catch a
Car members hold one or more subscriptions for public transit (compared to 84% among thecontrol group). In particular, both car-sharing member groups have a particularly large shareof GA travelcard holders. However, also the control group fares well above the Swiss averageof 9.8% GA travelcard holders (Swiss Federal Statistical Office (BFS), 2012). Members of thecontrol group rely more on local travel passes and multi-tickets.
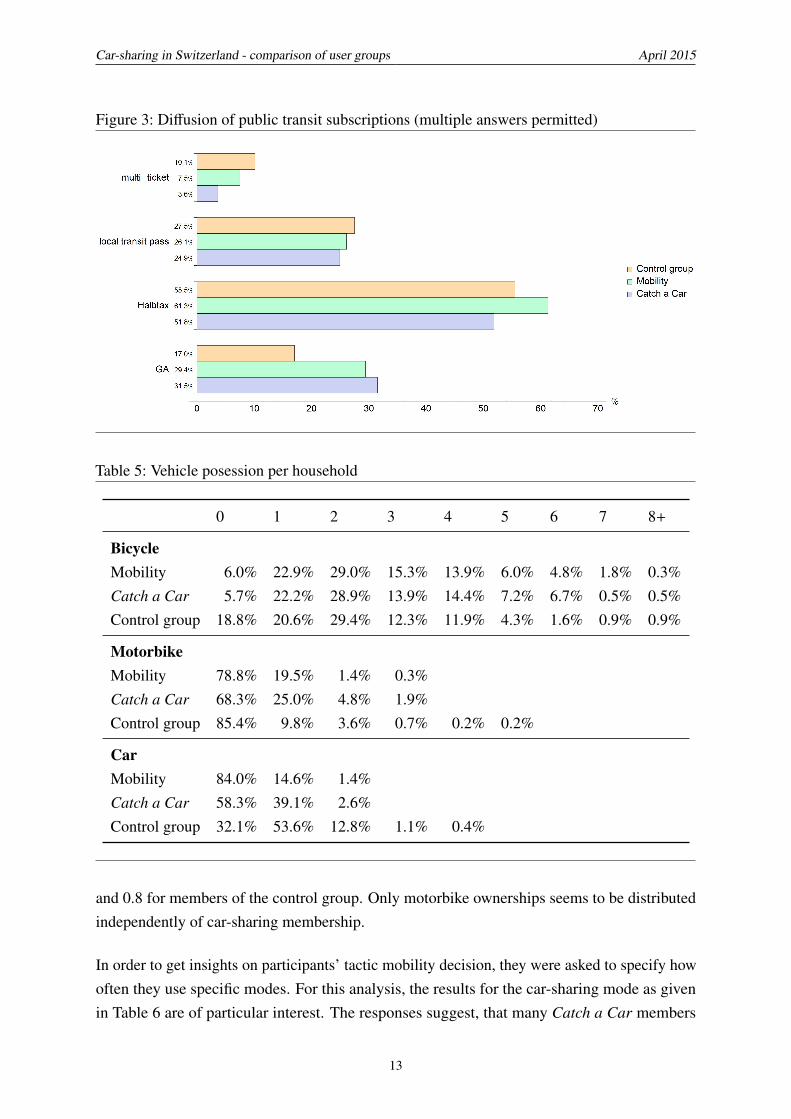
Along with public transit subscriptions, private vehicle ownership is the key part of strategicmobility decisions. Therefore, participants were asked about their vehicle posessions. Itemnon-response did not apply. The answers are summarized in Table 5. It came out, that car-sharingmembers are three times less likely not to own a bicycle than members of the control group. Inreturn, only 16% of the Mobility respondents and 42% of the Catch a Car respondents ownone or more cars - versus two of three control group members. More precisely, the averagenumber of cars per household is 0.2 for Mobility respondents, 0.4 for Catch a Car respondents
12
Car-sharing in Switzerland - comparison of user groups April 2015
Figure 3: Diffusion of public transit subscriptions (multiple answers permitted)
Table 5: Vehicle posession per household
0 1 2 3 4 5 6 7 8+
BicycleMobility 6.0% 22.9% 29.0% 15.3% 13.9% 6.0% 4.8% 1.8% 0.3%Catch a Car 5.7% 22.2% 28.9% 13.9% 14.4% 7.2% 6.7% 0.5% 0.5%Control group 18.8% 20.6% 29.4% 12.3% 11.9% 4.3% 1.6% 0.9% 0.9%
MotorbikeMobility 78.8% 19.5% 1.4% 0.3%Catch a Car 68.3% 25.0% 4.8% 1.9%Control group 85.4% 9.8% 3.6% 0.7% 0.2% 0.2%
CarMobility 84.0% 14.6% 1.4%Catch a Car 58.3% 39.1% 2.6%Control group 32.1% 53.6% 12.8% 1.1% 0.4%
and 0.8 for members of the control group. Only motorbike ownerships seems to be distributedindependently of car-sharing membership.
In order to get insights on participants’ tactic mobility decision, they were asked to specify howoften they use specific modes. For this analysis, the results for the car-sharing mode as givenin Table 6 are of particular interest. The responses suggest, that many Catch a Car members
13
Car-sharing in Switzerland - comparison of user groups April 2015
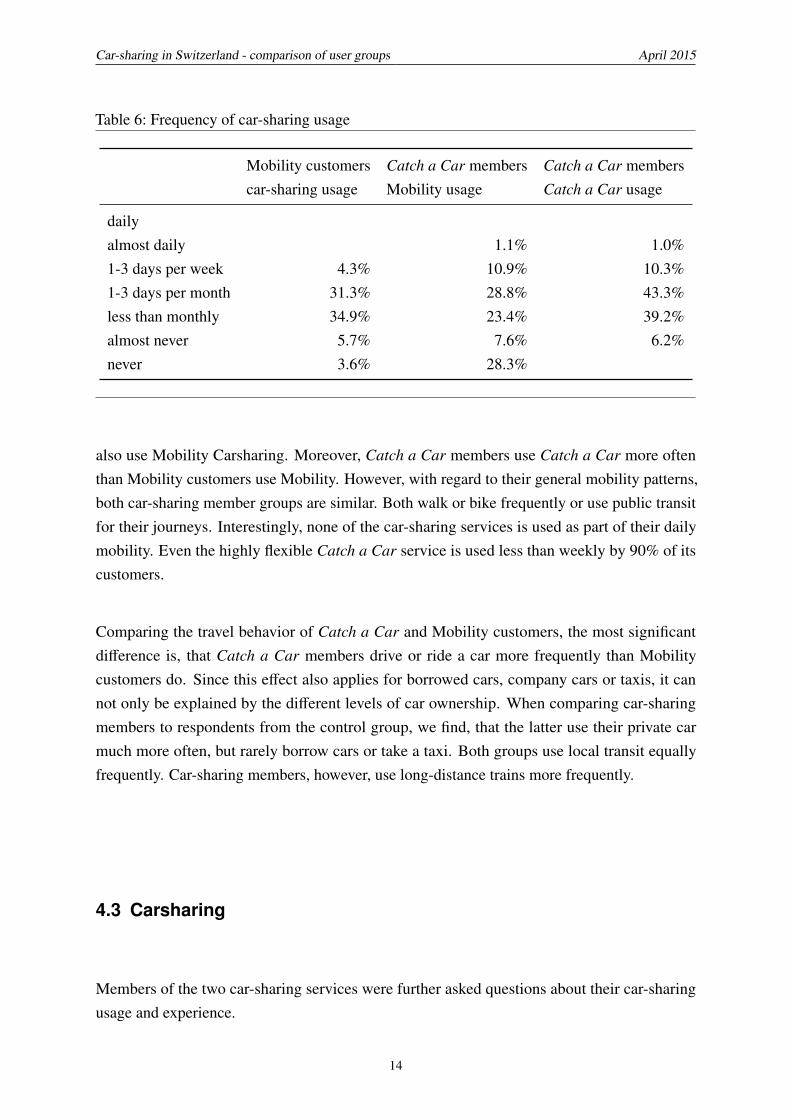
Table 6: Frequency of car-sharing usage
Mobility customers Catch a Car members Catch a Car memberscar-sharing usage Mobility usage Catch a Car usage
dailyalmost daily 1.1% 1.0%1-3 days per week 4.3% 10.9% 10.3%1-3 days per month 31.3% 28.8% 43.3%less than monthly 34.9% 23.4% 39.2%almost never 5.7% 7.6% 6.2%never 3.6% 28.3%
also use Mobility Carsharing. Moreover, Catch a Car members use Catch a Car more oftenthan Mobility customers use Mobility. However, with regard to their general mobility patterns,both car-sharing member groups are similar. Both walk or bike frequently or use public transitfor their journeys. Interestingly, none of the car-sharing services is used as part of their dailymobility. Even the highly flexible Catch a Car service is used less than weekly by 90% of itscustomers.
Comparing the travel behavior of Catch a Car and Mobility customers, the most significantdifference is, that Catch a Car members drive or ride a car more frequently than Mobilitycustomers do. Since this effect also applies for borrowed cars, company cars or taxis, it cannot only be explained by the different levels of car ownership. When comparing car-sharingmembers to respondents from the control group, we find, that the latter use their private carmuch more often, but rarely borrow cars or take a taxi. Both groups use local transit equallyfrequently. Car-sharing members, however, use long-distance trains more frequently.
4.3 Carsharing
Members of the two car-sharing services were further asked questions about their car-sharingusage and experience.
14
Car-sharing in Switzerland - comparison of user groups April 2015
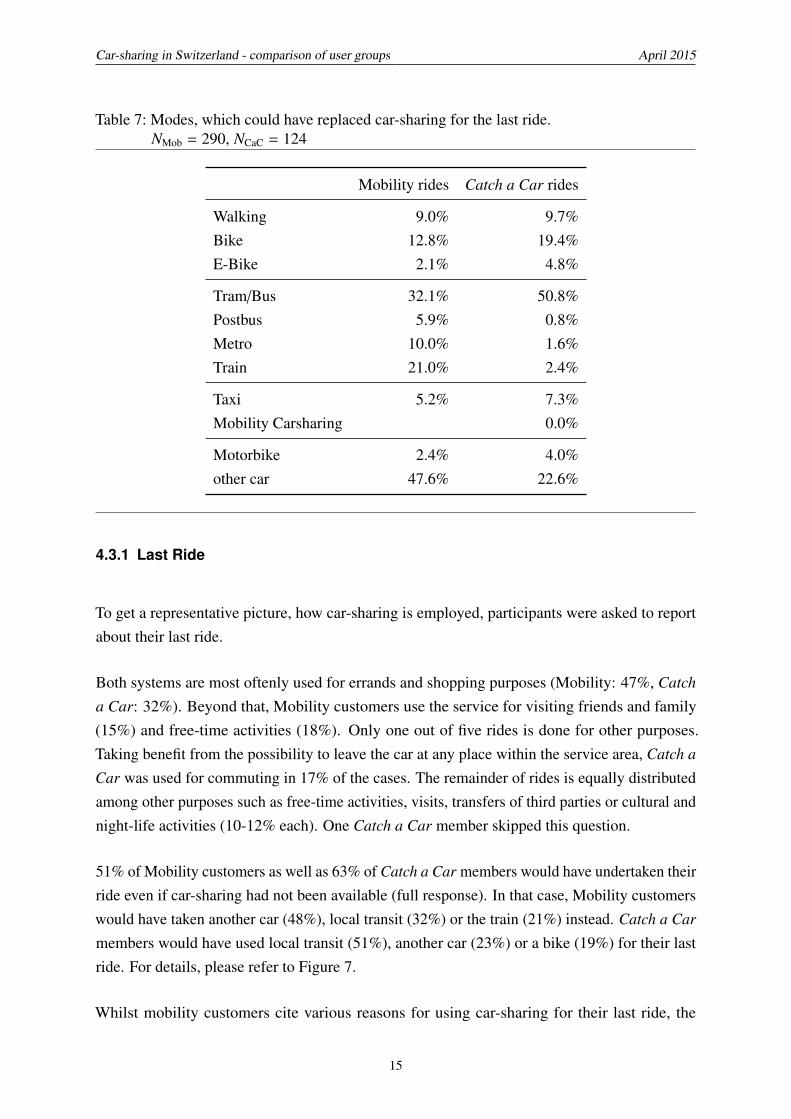
Table 7: Modes, which could have replaced car-sharing for the last ride.NMob = 290, NCaC = 124
Mobility rides Catch a Car rides
Walking 9.0% 9.7%Bike 12.8% 19.4%E-Bike 2.1% 4.8%
Tram/Bus 32.1% 50.8%Postbus 5.9% 0.8%Metro 10.0% 1.6%Train 21.0% 2.4%
Taxi 5.2% 7.3%Mobility Carsharing 0.0%
Motorbike 2.4% 4.0%other car 47.6% 22.6%
4.3.1 Last Ride
To get a representative picture, how car-sharing is employed, participants were asked to reportabout their last ride.
Both systems are most oftenly used for errands and shopping purposes (Mobility: 47%, Catch
a Car: 32%). Beyond that, Mobility customers use the service for visiting friends and family(15%) and free-time activities (18%). Only one out of five rides is done for other purposes.Taking benefit from the possibility to leave the car at any place within the service area, Catch a
Car was used for commuting in 17% of the cases. The remainder of rides is equally distributedamong other purposes such as free-time activities, visits, transfers of third parties or cultural andnight-life activities (10-12% each). One Catch a Car member skipped this question.
51% of Mobility customers as well as 63% of Catch a Car members would have undertaken theirride even if car-sharing had not been available (full response). In that case, Mobility customerswould have taken another car (48%), local transit (32%) or the train (21%) instead. Catch a Car
members would have used local transit (51%), another car (23%) or a bike (19%) for their lastride. For details, please refer to Figure 7.
Whilst mobility customers cite various reasons for using car-sharing for their last ride, the
15
Car-sharing in Switzerland - comparison of user groups April 2015
majority of Catch a Car members (56%) used it, because it was faster than other alternatives(Mobility: 33.6%). Instead, transporting goods was the reason to use car-sharing in 44.8% of theMobility rides, but only for 23.9% of the Catch a Car journeys. 36.0% of the Mobility customersand 27.9% of the Catch a Car members stated, that no good public transit connection wasavailable for their ride; 31.6% and 19.8% said, there was no other car at hand. All respondentsanswered this question as was the case for the following questions of this subsection.
60% of Mobility customers and 37% of Catch a Car carried goods on their last ride (no itemnon-response). In 38% and 35% of the cases, those goods were groceries. In 41% of the rides,Mobility customers carried furniture. Other transported items range from household refuse androllators to pieces of art.
On average, a Mobility car carries the driver and 0.9 passengers. Only one third of the ridesare conducted without passengers. In contrast, 58% of Catch a Car rides took place withoutpassengers. On average, a Catch a Car is occupied by 1.5 persons.
Whilst Catch a Car rides are started spontaneously (60%), this is only the case for 5% of theMobility rides. Instead, a third of the Mobility customers had deciced to use Mobility Carsharingup to one day in advance, 15% had done so more than a week before.
Catch a Car vehicles are accessed and left by walking (85%). In contrast, Mobility customerswalked to the vehicle in 46% of the rides, took the bike in 35% and used public transit in 15% ofthe cases.
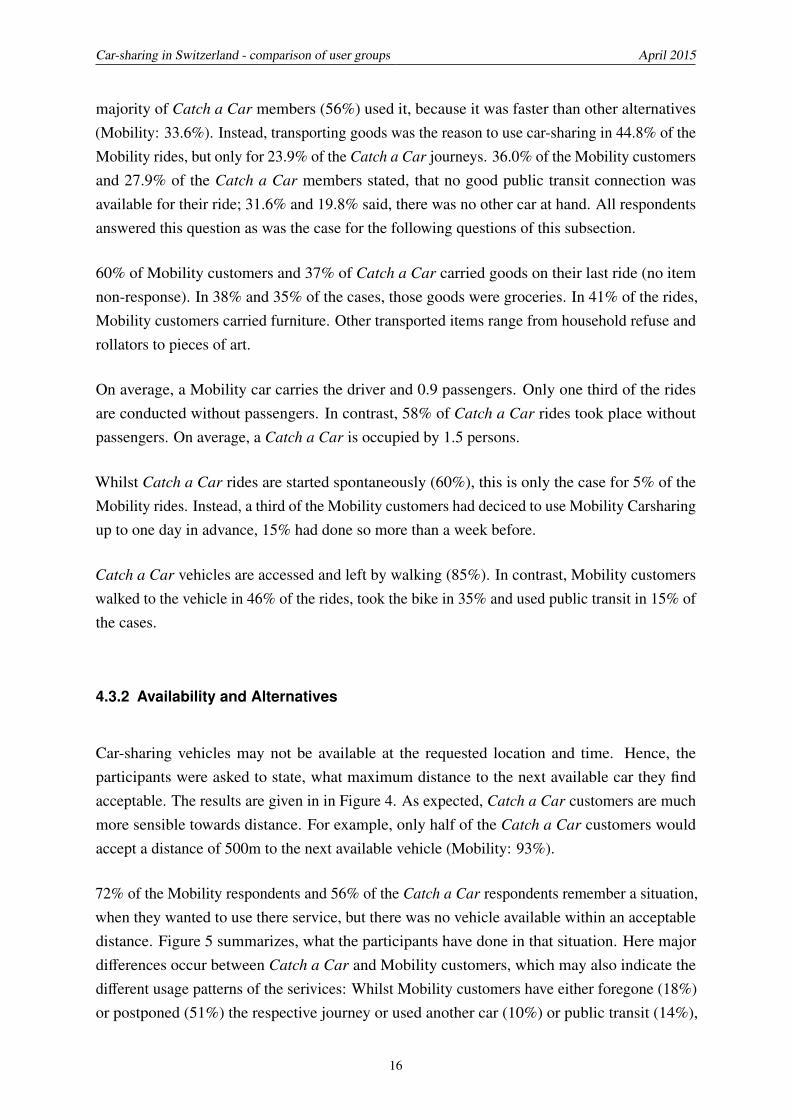
4.3.2 Availability and Alternatives
Car-sharing vehicles may not be available at the requested location and time. Hence, theparticipants were asked to state, what maximum distance to the next available car they findacceptable. The results are given in in Figure 4. As expected, Catch a Car customers are muchmore sensible towards distance. For example, only half of the Catch a Car customers wouldaccept a distance of 500m to the next available vehicle (Mobility: 93%).
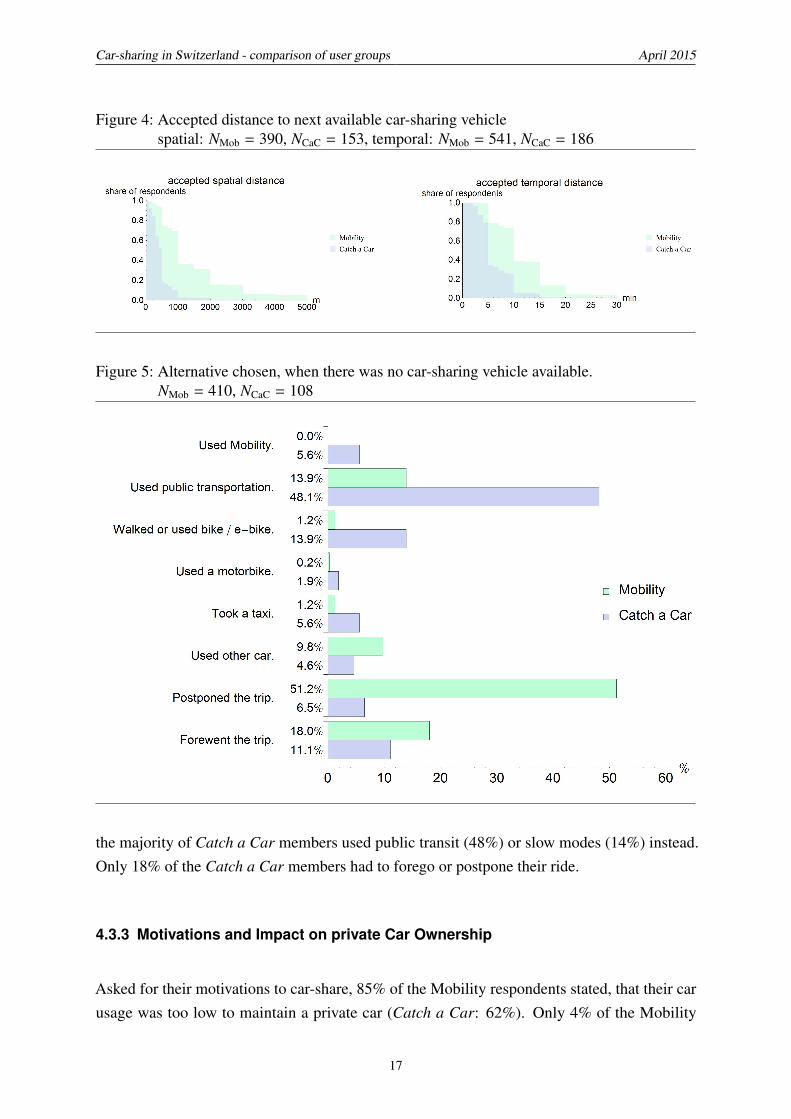
72% of the Mobility respondents and 56% of the Catch a Car respondents remember a situation,when they wanted to use there service, but there was no vehicle available within an acceptabledistance. Figure 5 summarizes, what the participants have done in that situation. Here majordifferences occur between Catch a Car and Mobility customers, which may also indicate thedifferent usage patterns of the serivices: Whilst Mobility customers have either foregone (18%)or postponed (51%) the respective journey or used another car (10%) or public transit (14%),
16
Car-sharing in Switzerland - comparison of user groups April 2015
Figure 4: Accepted distance to next available car-sharing vehiclespatial: NMob = 390, NCaC = 153, temporal: NMob = 541, NCaC = 186
Figure 5: Alternative chosen, when there was no car-sharing vehicle available.NMob = 410, NCaC = 108
the majority of Catch a Car members used public transit (48%) or slow modes (14%) instead.Only 18% of the Catch a Car members had to forego or postpone their ride.
4.3.3 Motivations and Impact on private Car Ownership
Asked for their motivations to car-share, 85% of the Mobility respondents stated, that their carusage was too low to maintain a private car (Catch a Car: 62%). Only 4% of the Mobility
17
Car-sharing in Switzerland - comparison of user groups April 2015
respondents use the service as a second car, but 18% of the Catch a Car members. Ecologicalmotivations are more developed among Mobility customers (55%) than among Catch a Car
members (35%).
A commonly cited argument for car-sharing is its potential to reduce private car ownership. Tostudy this effect, the respondents were asked, how their attitude towards owning a private carhad changed since their membership. 40% of the Mobility respondents and 17% of the Catch
a Car members report, that they were not going purchase a (new) car due to their car-sharingmembership. 8% and 2% even claim to having sold their car as a consequence of their car-sharing membership. Moreover, 12% of the Mobility customers and 6% of the Catch a Car
members said, they would buy a car if there was no car-sharing service available. The majorityof the respondents, however, answered, that they have never wanted to purchase a private car(Mobility: 53%, Catch a Car: 61%). Item non-response for this question was 4.5% for Mobilityand 7.1% for Catch a Car.
18
Car-sharing in Switzerland - comparison of user groups April 2015
5 Discussion
As detailed above, there is good reason to regard the three respondent groups as representativefor their respective population. Hence, the survey results presented above allow to describe thecar-sharing user groups and they way they use the services.
We found, that the two car-sharing services offered in Basel serve different groups and are usedin different ways. Mobility Carsharing appeals to people around their mid-40s with men slightlyoverrepresented. They live in an average-sized household with singles slightly overrepresented.Mobility customers are highly educated, usually they hold a college or university degree.Furthermore, their household income per adult is above average. More than others, Mobilitycustomers care about environmental protection and climate change. Moreover, a vast majoritydoes not regard cars as status symbols. Yet, for them, saving money is not as important as forothers.
Catch a Car particularly attracts men in their late 30s or early 40s. 2.6 people live in an averagemember household, which is therefore larger than usual. A third of the members has childrenliving in their household. Furthermore, Catch a Car members have an above-average educationaldegree and an above-average household income. However, the latter is also due to the largeraverage household size - considering the household income per adult, Catch a Car membersfare slightly below average. Moreover, members are open to try out new things. When regardingtheir attitude towards private cars, saving money and responsibility, their answers are similar tothose of the control group.
Although both car-sharing groups have a comparable, very high share of GA travel-card holdersand bicycle-owners, they differ greatly in their private vehicle ownership. Whilst Mobilitycustomers reported only 0.2 private cars per household, Catch a Car members reported twiceas many. However, this value is still half the average of the control group (0.8). Also when itcomes to the usage frequency of cars, Catch a Car members are somewhere between Mobilitycustomers and members of the control group. Interestingly, Mobility custombers use bikes moreoften whilst Catch a Car rely more on local transit. Moreover, Catch a Car members are activecar-sharers and even use Mobility more often than Mobility customers themselves.
Even more than between the groups, differences occur between the usage patterns of the twocar-sharing services. Whilst the traditional, station-based car-sharing service Mobility is usuallyused for purposes which require a car such as carrying larger items or certain free-time activities,the free-floating car-sharing service Catch a Car is usually used on a spontaneous basis as aparticularly fast or convenient way to get from one place to another. In case of non-availability
19

Car-sharing in Switzerland - comparison of user groups April 2015
of a car-sharing vehicle, Catch a Car is usually replaced by public transit or slow modes. Hence,Mobility is used as key mode for a certain planned tour requiring a car, Catch a Car is used on atrip-basis, whenever it offers the fastest or most convenient connection. In that sense, Mobilityis used in the way a (single) private car ist used, whereas Catch a Car addresses needs servedinefficiently by other modes of transport. Therefore and according to the survey results, bothservices have a potential to replace (second) private cars and to therefore help improving theenergy and land-use impacts of the transportation system.
20
Car-sharing in Switzerland - comparison of user groups April 2015
6 Conclusion
This study allows a first distinction of the customer groups and usage patterns of a free-floatingand station-based car-sharing service. It was both found, that the services have complementaryapplications and may both help to increase the efficiency of the transportation system.
However, this study suffers from a relatively low number of responses in the group of Catch a
Car members. This is due to the limited number of active members after only a few months ofoperation. To address this issue, an additional survey wave for Catch a Car members will beconducted in spring 2015.
The fact, that this study has been conducted right after the start of the introduction of thenew service has two implications. On the one hand, it allows to construct a before-and-aftercomparison with later surveys, on the other hand, the group of the Catch a Car respondentsmainly consists of early adopters whose socio-demographic properties and travel behavior doesnot necessarly match those of the later customer groups (Cervero and Tsai, 2004).
Moreover, the important question of the actual impact of the two car-sharing services on thetransportation system and the environment has not been addressed in this study. A first attemptin this direction will be possible, once the mobility diaries have been analyzed as this allows adeeper insight into the daily travel behavior of the three respondent groups. Only then, validestimations of the actual impacts of the car-sharing systems will be possible.
21

Car-sharing in Switzerland - comparison of user groups April 2015
7 Acknowledgements
This research was only possible thanks to the funding and assistance provided by Mobility Car-sharing. We would like to thank the representatives of Mobility Carsharing for their support.
22
Car-sharing in Switzerland - comparison of user groups April 2015
8 References
Awasthi, A., S. S. Chauhan, X. Hurteau and D. Breuil (2008) An analytical hierarchical process-based decision-making approach for selecting car-sharing stations in medium size agglomera-tions, International Journal of Information and Decision Sciences, 1 (1) 66–97.
Axhausen, K. W. and C. Weis (2010) Predicting response rate: A natural experiment, Survey
Practice, 3 (2).
Cervero, R. (2003) City carshare: First-year travel demand impacts, Transportation Research
Record, 1839, 159–166.
Cervero, R. and Y. Tsai (2004) City carshare in san francisco, california - second-year traveldemand and car ownership impact, Transportation Research Record, 1887, 117–127.
Ciari, F., M. Balac and M. Balmer (2014) Modeling the effect of different pricing schemes onfree-floating carsharing travel demand: a test case study for zurich, switzerland, Working
Paper, 979, IVT, ETH Zurich, Zurich.
Correia, G. H. A. and A. P. Antunes (2012) Optimization approach to depot location and tripselection in one-way carsharing systems, 48 (1) 233–247.
Firnkorn, J. (2012) Triangulation of two methods measuring the impacts of a free-floatingcarsharing system in germany, Transportation Research Part A, 46 (10) 1654–1672.
Firnkorn, J. and M. Müller (2011) What will be the environmental effects of new free-floatingcar-sharing systems? the case of car2go in ulm, Ecological Economics, 70 (8) 1519–1528.
Grasset, V. and C. Morency (2010) Carsharing: Analyzing the interaction between neighborhoodfeatures and market share, paper presented at the 89th Annual Meeting of the Transportation
Research Board, Washington, D.C., January 2010.
Harms, S. and B. Truffer (1998) The emergence of a nationwide carsharing co-operative inswitzerland, Research Report, EAWAG (Eidgenössische Anstalt für Wasserversorgung, Ab-wasserreinigung und Gewässerschutz).
Kopp, J., R. Gerike and K. W. Axhausen (2013) Status quo and perspectives for carsharingsystems: the example of drivenow, in R. Gerike, F. Hülsmann and K. Roller (eds.) Strategies
for Sustainable Mobilities: Opportunities and Challenges, 207–226, Ashgate, Burlington.
Le Vine, S. (2011) Strategies for personal mobility: A study of consumer acceptance of sub-scription drive-it-yourself car services, Ph.D. Thesis, Imperial College London, London.
23
Car-sharing in Switzerland - comparison of user groups April 2015
Le Vine, S., O. Adamou and J. Polak (2014a) Predicting new forms of activity/mobility patternsenabled by shared-mobility services through a needs-based stated-response method: Casestudy of grocery shopping, Transport Policy, 32 (1) 60–68.
Le Vine, S., M. Lee-Gosselin, A. Sivakumar and J. Polak (2014b) A new approach to predictthe market and impacts of round-trip and point-to-point carsharing systems: Case study oflondon, Transportation Research Part D, 32 (1) 218–229.
Martin, E. and S. A. Shaheen (2011a) Greenhouse gas emission impacts of carsharing in northamerica, IEEE Transactions on Intelligent Transportation Systems, 12 (4) 1074–1086.
Martin, E. and S. A. Shaheen (2011b) The impact of carsharing on public transit and non-motorized travel: An exploration of north american carsharing survey data, 4 (11) 2094–2114.
Millard-Ball, A., G. Murray, J. Ter Schure, C. Fox and J. Burkhardt (2005) Car-sharing: Whereand how it succeeds, Technical Report, 108, TCRP (Transit Cooperative Research Program).
Mobility International Inc. (2014) Mobility launches ’catch a car’in basel, http://www.mobility-international.com/de/news/
mobility-launches-catch-a-car-in-basel/.
Muheim, P. and E. Reinhardt (1999) Carsharing - the key to combined mobility, The Journal of
World Transport Policy & Practice, 5 (3) 58–71.
Schmöller, S., S. Weikl, J. Müller and K. Bogenberger (2014) Empirical data analysis of free-floating carsharing systems, paper presented at the 93rd Annual Meeting of the Transportation
Research Board, Washington, D.C., January 2014.
Seattle Department of Transportation (2014) 2013 seattle free-floating car share pilot preogramreport.
Shaheen, S. A., C. Rodier, G. Murray, A. Cohen and E. Martin (2010) Carsharing and publicparking policies: assessing benefits, costs, and best practices in north america, Technical
Report, CA-MTI-10-2612, Mineta Transportation institute, San Jose, California.
Steininger, K., C. Vogl and R. Zettl (1996) Car-sharing organizations - the size of the marketsegment and revealed change in mobility behavior, Transport Policy, 3 (4) 177–185.
Stillwater, T., P. L. Mokhtarian and S. A. Shaheen (2008) Carsharing and the built environment,geographic information system-based study of one u.s. operator, Transportation Research
Record, 2110, 27–34.
Suiker, S. and J. van den Elshout (2013) Wirkungsmessung einführung car2go in amsterdam.
24

Car-sharing in Switzerland - comparison of user groups April 2015
Swiss Federal Statistical Office (BFS) (2012) Mobilität in der Schweiz - Ergebnisse des Mikrozen-
sus Mobilität und Verkehr 2010, Swiss Federal Statistical Office, Neuchatel.
Uesugi, K., N. Mukai and T. Watanabe (2007) Optimization of vehicle assignemnt for carsharing system, Knowledge-Based Intelligent Information and Engineering Systems, 4693 (2)1105–1111.
Wappelhorst, S., A. Graff, J. Steiner and D. Hinkeldein (2013) New car sharing offers andcustomer groups: Implications for a growing and diversifying market, paper presented at theEuropean Transport Conference 2013, Frankfurt, September 2013.
25