Embed Size (px)
Citation preview
Carbon Disclosure Project2018
Carbon Disclosure Project 2018CN
Table of Contents
Introduction .................................................................................................................................................................................... 3
1. Governance .............................................................................................................................................................................. 6
2. Risks and opportunities ........................................................................................................................................................... 9
3. Business strategy .................................................................................................................................................................... 20
4. Targets and performance ...................................................................................................................................................... 24
5. Emissions methodology ......................................................................................................................................................... 29
6. Emissions data ........................................................................................................................................................................ 31
7. Emissions breakdown ............................................................................................................................................................ 37
8. Energy .................................................................................................................................................................................... 41
9. Additional metrics ................................................................................................................................................................. 45
10. Verification ............................................................................................................................................................................ 47
11. Carbon pricing ....................................................................................................................................................................... 50
12. Engagement ........................................................................................................................................................................... 53
14. Sign off ................................................................................................................................................................................... 58

Introduction
Carbon Disclosure Project 2018CN
4
Introduction
CN is a world-class transportation leader engaged in the rail and related transportation business. Our network of approximately 20,000 route miles of track spans Canada and mid-America, uniquely connecting three coasts: the Atlantic, the Pacific and the Gulf of Mexico. We offer fully integrated rail and other transportation services, including intermodal, trucking, freight forwarding, warehousing and distribution.
Our freight revenues are derived from seven commodity groups representing a diversified and balanced portfolio of goods transported between a wide range of origins and destinations, positioning us to handle economic fluctuations and enhance our potential for growth opportunities. On an annual basis, we handle over C$250 billion worth of goods and carry more than 300 million tons of cargo, serving exporters, importers, retailers, farmers and manufacturers. Some of these goods are being transformed into sustainable products, enabling us to play a key role in the transition to a lower carbon economy and the lifeblood of healthier communities.
By providing our customers with one of the most environmentally friendly ways to move their goods, we not only contribute by moving the economy, but also by driving its efficiency. Over the past 25 years, we have improved our fuel efficiency by 40%. Today, we continue to lead the North American rail industry in terms of efficiency, consuming approximately 15% less fuel per gross ton-mile than the industry average. With approximately 88% of our direct GHG emissions generated from rail operations, our focus is to continuously improve our locomotive fuel efficiency and reduce our carbon emissions. Our emission reductions take place on several levels, from our asset lean Precision Railroading initiatives to our Fuel Management Excellence program, which includes the use of new, fuel-efficient locomotives, promoting fuel-efficient train handling behaviours, and investing in new innovative technology applications such as Trip Optimizer and Distributed Power. As a result of these programs, since 2005, we have reduced our rail locomotive GHG emissions intensity (tCO2e/GTM) by 21%.
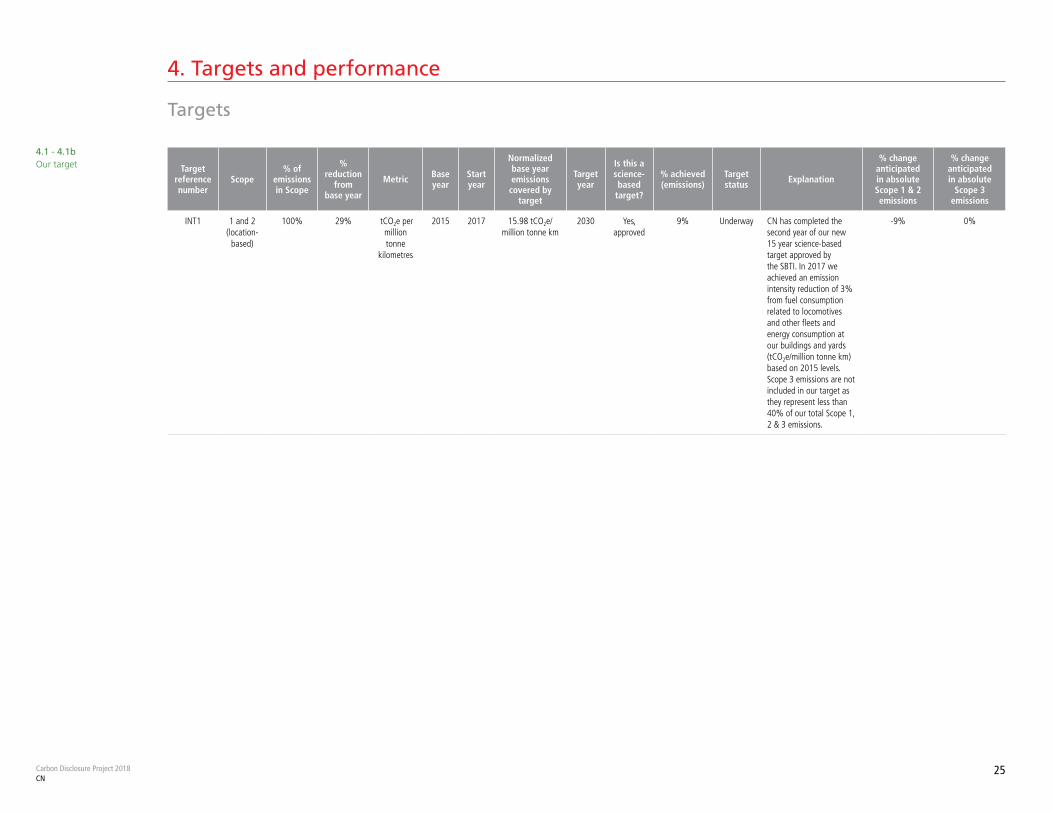
In support of keeping the global temperature increase below 2 degrees Celsius compared to pre-industrial temperatures, we continue to work towards our science-based target to reduce our GHG emission intensity (tCO2e/million tonne kilometres) by 29% by 2030 based on 2015 levels. This target covers emissions from all aspects of our business, including rail locomotives, other fleets, and our buildings and yards. As of 2017, we reduced our GHG emission intensity by approximately 3% since 2015, which is in line with our science-based target pathway.
In addition to providing a fuel-efficient transportation service, we believe that rail can be an integral part of the climate change solution offering both environmental and economic advantages. Compared to other transportation modes, rail is the most fuel efficient method of moving freight over land – on average, trains are approximately four times more fuel efficient than trucks. To leverage these benefits, we offer our customers intermodal freight shipping, which combines the resources of different transportation modes, such as trucking and rail – allowing each mode to be used for the portion of the trip to which it is best suited. As a result, intermodal helps lower transportation costs, reduce emissions, traffic congestion, accidents, and the burden of an overstressed public road transportation infrastructure. Over the past year, we continued to work with many of our customers to help them determine their carbon savings from switching freight from truck to rail, using a carbon calculator based on our industry-leading modal shift quantification protocol. We also continued to invest significantly in building a robust and safe network that is resilient to changing climatic conditions. In 2017, we invested approximately C$1.6 billion in our rail network supporting safety and efficiency. This investment included the maintenance of our tracks and yards, the execution of seasonal readiness plans, natural hazard warning systems, and other weather related emergency preparedness protocols. In support of all of these initiatives, we continue to educate our network of 25,000 employees through our EcoConnexions Employee Engagement program, giving them practical knowledge and tools to reduce our carbon footprint, while adapting to a changing climate.
As we look forward, our 2018 investments will help us leverage our strong pipeline of growth and support our customers in the transition to a low carbon economy. Running a safe and efficient railroad remains our top priority, which will be supported by our unprecedented level of investment to improve the resiliency of our network and ensure we handle our customers’ business efficiently and responsibly, now and for the long haul.
CN - Canadian National Railway Company and its operating railway subsidiaries - spans Canada and mid-America, from the Atlantic and Pacific oceans to the Gulf of Mexico, serving the ports of Vancouver, Prince Rupert, B.C., Montreal, Halifax, New Orleans, and Mobile, Ala., and the key metropolitan areas of Toronto, Buffalo, Chicago, Detroit, Duluth, Minn./Superior, Wis., Green Bay, Wis., Minneapolis/St. Paul, Memphis, and Jackson, Miss., connections to all points in North America. For more information on CN, visit the company’s website at www.cn.ca. Information on delivering responsibly, including climate change is available at: http://www.cn.ca/en/delivering-responsibly
Carbon Disclosure Project 2018CN
5
Boundary
Operational activities
CN’s climate-related impacts are reported using a consolidated approach within an operational control reporting boundary.
The transport modes for which we are providing data are:
• Rail
• Marine
• Heavy Duty Vehicles (HDV)
• Light Duty Vehicles (LDV)
0.5Our reporting boundary
0.7Transport modes
Governance
Carbon Disclosure Project 2018CN
7
1. Governance
Board oversight
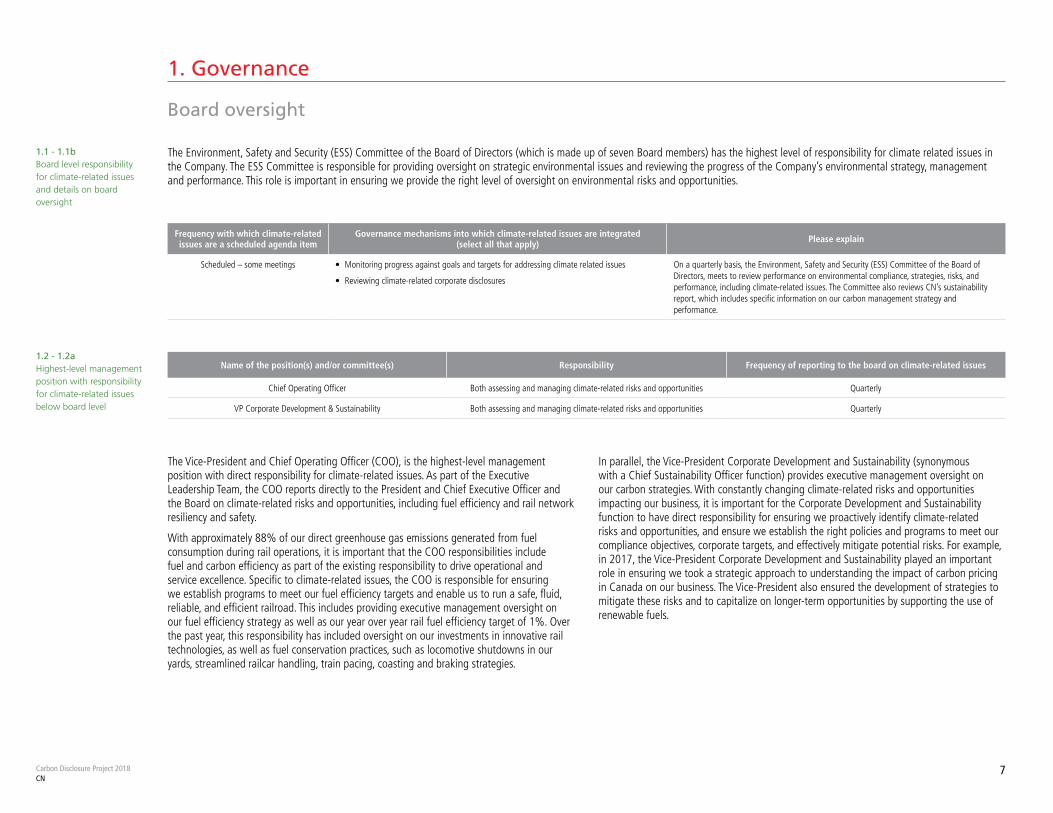
The Environment, Safety and Security (ESS) Committee of the Board of Directors (which is made up of seven Board members) has the highest level of responsibility for climate related issues in the Company. The ESS Committee is responsible for providing oversight on strategic environmental issues and reviewing the progress of the Company’s environmental strategy, management and performance. This role is important in ensuring we provide the right level of oversight on environmental risks and opportunities.
The Vice-President and Chief Operating Officer (COO), is the highest-level management position with direct responsibility for climate-related issues. As part of the Executive Leadership Team, the COO reports directly to the President and Chief Executive Officer and the Board on climate-related risks and opportunities, including fuel efficiency and rail network resiliency and safety.
With approximately 88% of our direct greenhouse gas emissions generated from fuel consumption during rail operations, it is important that the COO responsibilities include fuel and carbon efficiency as part of the existing responsibility to drive operational and service excellence. Specific to climate-related issues, the COO is responsible for ensuring we establish programs to meet our fuel efficiency targets and enable us to run a safe, fluid, reliable, and efficient railroad. This includes providing executive management oversight on our fuel efficiency strategy as well as our year over year rail fuel efficiency target of 1%. Over the past year, this responsibility has included oversight on our investments in innovative rail technologies, as well as fuel conservation practices, such as locomotive shutdowns in our yards, streamlined railcar handling, train pacing, coasting and braking strategies.
In parallel, the Vice-President Corporate Development and Sustainability (synonymous with a Chief Sustainability Officer function) provides executive management oversight on our carbon strategies. With constantly changing climate-related risks and opportunities impacting our business, it is important for the Corporate Development and Sustainability function to have direct responsibility for ensuring we proactively identify climate-related risks and opportunities, and ensure we establish the right policies and programs to meet our compliance objectives, corporate targets, and effectively mitigate potential risks. For example, in 2017, the Vice-President Corporate Development and Sustainability played an important role in ensuring we took a strategic approach to understanding the impact of carbon pricing in Canada on our business. The Vice-President also ensured the development of strategies to mitigate these risks and to capitalize on longer-term opportunities by supporting the use of renewable fuels.
1.1 - 1.1bBoard level responsibility for climate-related issues and details on board oversight
1.2 - 1.2a Highest-level management position with responsibility for climate-related issues below board level
Frequency with which climate-related issues are a scheduled agenda item
Governance mechanisms into which climate-related issues are integrated (select all that apply) Please explain
Scheduled – some meetings • Monitoring progress against goals and targets for addressing climate related issues
• Reviewing climate-related corporate disclosures
On a quarterly basis, the Environment, Safety and Security (ESS) Committee of the Board of Directors, meets to review performance on environmental compliance, strategies, risks, and performance, including climate-related issues. The Committee also reviews CN’s sustainability report, which includes specific information on our carbon management strategy and performance.
Name of the position(s) and/or committee(s) Responsibility Frequency of reporting to the board on climate-related issues
Chief Operating Officer Both assessing and managing climate-related risks and opportunities Quarterly
VP Corporate Development & Sustainability Both assessing and managing climate-related risks and opportunities Quarterly
Carbon Disclosure Project 2018CN
8
1. Governance
Employee incentives
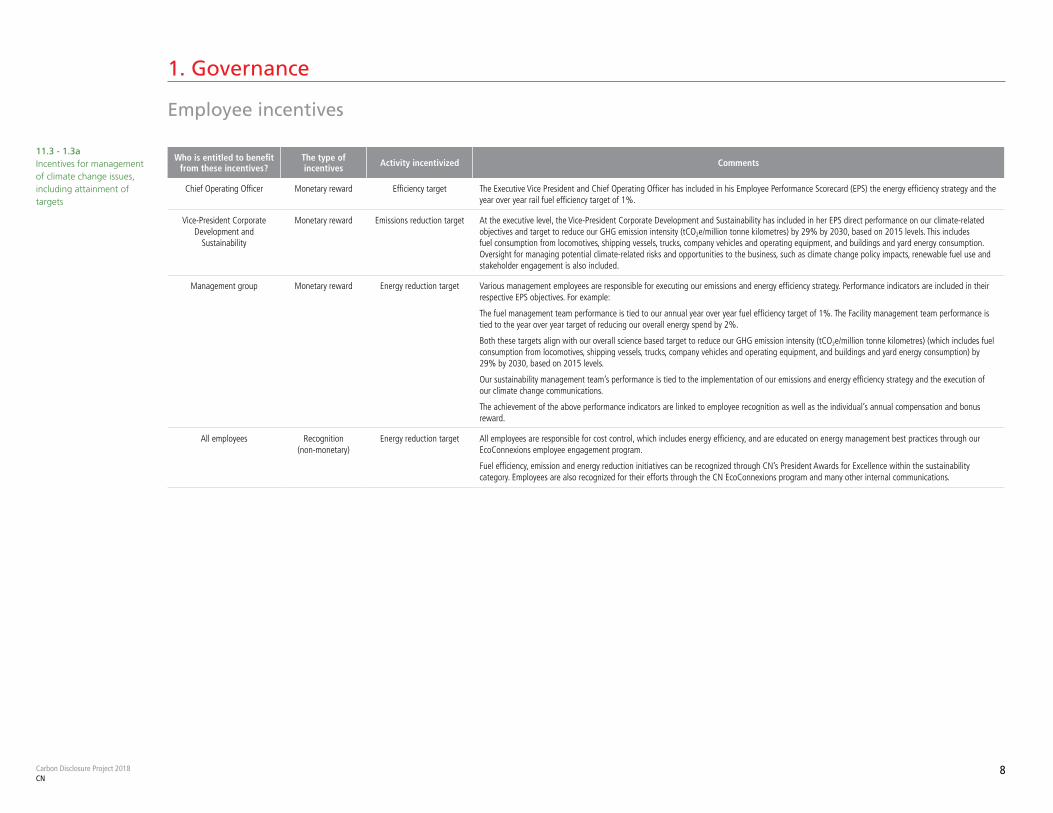
11.3 - 1.3aIncentives for management of climate change issues, including attainment of targets
Who is entitled to benefit from these incentives?
The type of incentives Activity incentivized Comments
Chief Operating Officer Monetary reward Efficiency target The Executive Vice President and Chief Operating Officer has included in his Employee Performance Scorecard (EPS) the energy efficiency strategy and the year over year rail fuel efficiency target of 1%.
Vice-President Corporate Development and
Sustainability
Monetary reward Emissions reduction target At the executive level, the Vice-President Corporate Development and Sustainability has included in her EPS direct performance on our climate-related objectives and target to reduce our GHG emission intensity (tCO2e/million tonne kilometres) by 29% by 2030, based on 2015 levels. This includes fuel consumption from locomotives, shipping vessels, trucks, company vehicles and operating equipment, and buildings and yard energy consumption. Oversight for managing potential climate-related risks and opportunities to the business, such as climate change policy impacts, renewable fuel use and stakeholder engagement is also included.
Management group Monetary reward Energy reduction target Various management employees are responsible for executing our emissions and energy efficiency strategy. Performance indicators are included in their respective EPS objectives. For example:
The fuel management team performance is tied to our annual year over year fuel efficiency target of 1%. The Facility management team performance is tied to the year over year target of reducing our overall energy spend by 2%.
Both these targets align with our overall science based target to reduce our GHG emission intensity (tCO2e/million tonne kilometres) (which includes fuel consumption from locomotives, shipping vessels, trucks, company vehicles and operating equipment, and buildings and yard energy consumption) by 29% by 2030, based on 2015 levels.
Our sustainability management team’s performance is tied to the implementation of our emissions and energy efficiency strategy and the execution of our climate change communications.
The achievement of the above performance indicators are linked to employee recognition as well as the individual’s annual compensation and bonus reward.
All employees Recognition (non-monetary)
Energy reduction target All employees are responsible for cost control, which includes energy efficiency, and are educated on energy management best practices through our EcoConnexions employee engagement program.
Fuel efficiency, emission and energy reduction initiatives can be recognized through CN’s President Awards for Excellence within the sustainability category. Employees are also recognized for their efforts through the CN EcoConnexions program and many other internal communications.

Risks and opportunities
Carbon Disclosure Project 2018CN
10
2. Risks and Opportunities
Time horizons
Management processes
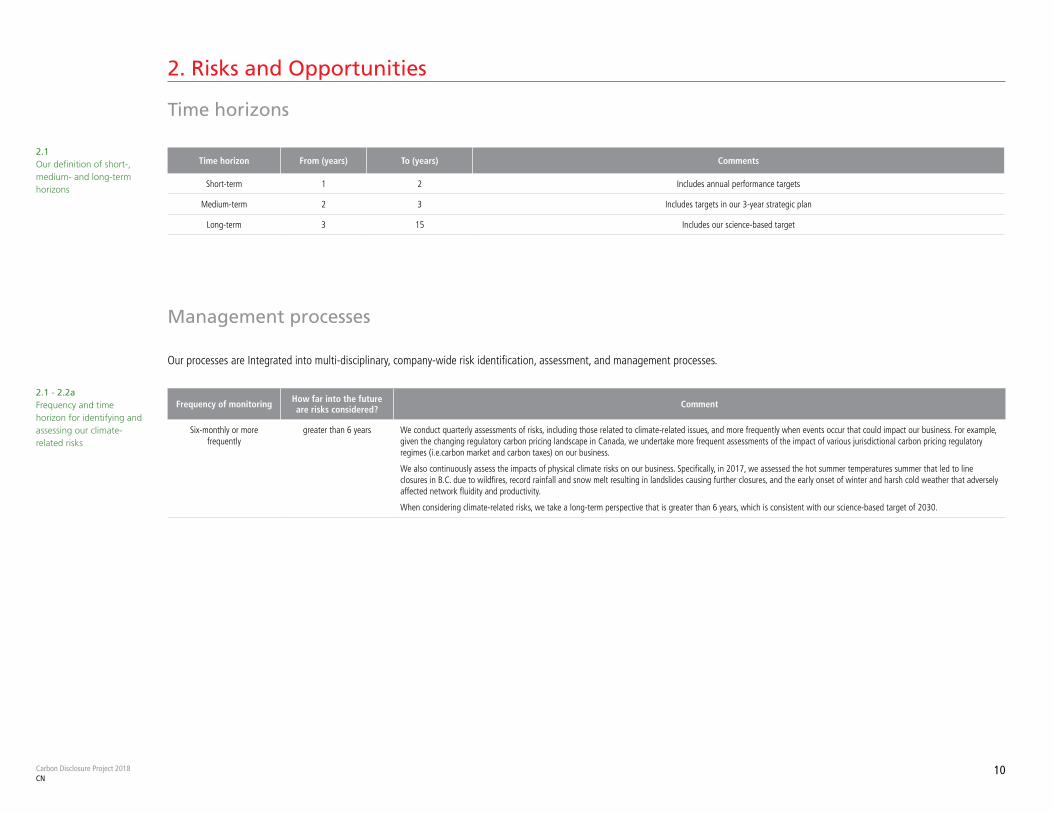
2.1 Our definition of short-, medium- and long-term horizons
2.1 - 2.2a Frequency and time horizon for identifying and assessing our climate-related risks
Our processes are Integrated into multi-disciplinary, company-wide risk identification, assessment, and management processes.
Time horizon From (years) To (years) Comments
Short-term 1 2 Includes annual performance targets
Medium-term 2 3 Includes targets in our 3-year strategic plan
Long-term 3 15 Includes our science-based target
Frequency of monitoring How far into the future are risks considered? Comment
Six-monthly or more frequently
greater than 6 years We conduct quarterly assessments of risks, including those related to climate-related issues, and more frequently when events occur that could impact our business. For example, given the changing regulatory carbon pricing landscape in Canada, we undertake more frequent assessments of the impact of various jurisdictional carbon pricing regulatory regimes (i.e.carbon market and carbon taxes) on our business.
We also continuously assess the impacts of physical climate risks on our business. Specifically, in 2017, we assessed the hot summer temperatures summer that led to line closures in B.C. due to wildfires, record rainfall and snow melt resulting in landslides causing further closures, and the early onset of winter and harsh cold weather that adversely affected network fluidity and productivity.
When considering climate-related risks, we take a long-term perspective that is greater than 6 years, which is consistent with our science-based target of 2030.
Carbon Disclosure Project 2018CN
11
2. Risks and opportunities
Management processes (continued)
2.2b Our processes for identifying and assessing climate-related risks
In order to inform our risk assessment process, climate-related risks and opportunities are identified and assessed at both the company and asset level.
Asset level perspective
At the asset level, departmental assessments of climate risk are assessed on an ongoing basis as the risks occur, and more formally on an annual basis as part of the enterprise risk management process. The departmental assessments are more specific in nature and related to the risks and opportunities that could occur from a functional, business unit and regional perspective.
For example, our Network Transportation and System Engineering function considers the risks of natural disasters and severe weather conditions that could impact specific buildings, yards and operations on CN’s network. The Sales & Marketing function considers climate-related opportunities from positioning CN’s low carbon rail freight transportation solution. The CN Corporate Development and Sustainability Function considers risks relating to the changing carbon pricing schemes in Canada; and the Procurement & Supply Management Function considers the risks of sourcing renewable fuels. The results of these assessments are communicated to the Corporate Development and Sustainability Function, who in turn communicates our climate risks to the internal audit team for inclusion in the enterprise risk management process.
Company level perspective
At the company level, climate change risks and opportunities are assessed annually by the Corporate Development and Sustainability function, taking into consideration the information from our various departmental functions, including a broad range of climate-related physical and transition risks and opportunities that could impact the entire company. Examples of company level risks include reputational impacts from more carbon disclosure investor requests, business continuity and network fluidity from extreme weather events, new cleaner fuel efficient technologies, changing policies and regulations on emission limits, carbon markets / pricing and the uptake of cleaner fuel alternatives. The assessment results are communicated to our internal audit team to be considered for inclusion into the enterprise risk management process.
Process for assessing the size and scope of the risks
To determine the relative size of the risks, we take into consideration the likelihood and severity of the impact on our business. With respect to likelihood we consider the percentage likelihood of occurrence. With respect to assessing climate risks impact, we consider a broad scope of potential impacts, including financial, market capitalization, operational, physical, and reputational and other organizational issues.
Relative significance of the risks
To assess the relative significance of climate risks, we rate each risk based on its likelihood and magnitude of impact using rating of low, moderate and high. The risks are mapped on a heat map to determine their relative significance.
Definition of a substantive financial risk
When identifying or assessing a climate risk, the determination of whether it has a substantive financial impact is aligned with our corporate enterprise risk management framework.
The substantive financial risks are integrated into the enterprise-wide risk management process and re-assessed. Climate change information that could be material is presented in the MD&A section of our annual report. Strategic programs are establish to ensure risks are mitigated, and follow-up action plans are track and monitored through the sustainability committee’s action plan.
Carbon Disclosure Project 2018CN
12
2. Risks and opportunities
Management processes (continued)
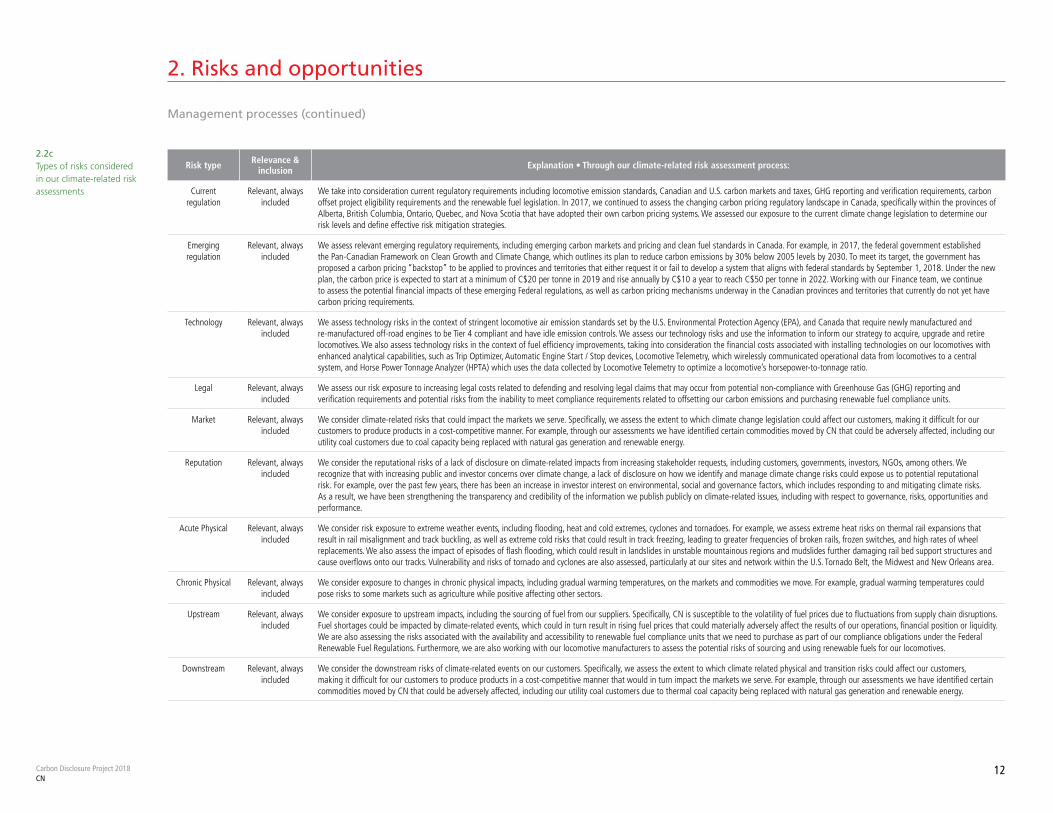
2.2c Types of risks considered in our climate-related risk assessments
Risk type Relevance & inclusion Explanation • Through our climate-related risk assessment process:
Current regulation
Relevant, always included
We take into consideration current regulatory requirements including locomotive emission standards, Canadian and U.S. carbon markets and taxes, GHG reporting and verification requirements, carbon offset project eligibility requirements and the renewable fuel legislation. In 2017, we continued to assess the changing carbon pricing regulatory landscape in Canada, specifically within the provinces of Alberta, British Columbia, Ontario, Quebec, and Nova Scotia that have adopted their own carbon pricing systems. We assessed our exposure to the current climate change legislation to determine our risk levels and define effective risk mitigation strategies.
Emerging regulation
Relevant, always included
We assess relevant emerging regulatory requirements, including emerging carbon markets and pricing and clean fuel standards in Canada. For example, in 2017, the federal government established the Pan-Canadian Framework on Clean Growth and Climate Change, which outlines its plan to reduce carbon emissions by 30% below 2005 levels by 2030. To meet its target, the government has proposed a carbon pricing “backstop” to be applied to provinces and territories that either request it or fail to develop a system that aligns with federal standards by September 1, 2018. Under the new plan, the carbon price is expected to start at a minimum of C$20 per tonne in 2019 and rise annually by C$10 a year to reach C$50 per tonne in 2022. Working with our Finance team, we continue to assess the potential financial impacts of these emerging Federal regulations, as well as carbon pricing mechanisms underway in the Canadian provinces and territories that currently do not yet have carbon pricing requirements.
Technology Relevant, always included
We assess technology risks in the context of stringent locomotive air emission standards set by the U.S. Environmental Protection Agency (EPA), and Canada that require newly manufactured and re-manufactured off-road engines to be Tier 4 compliant and have idle emission controls. We assess our technology risks and use the information to inform our strategy to acquire, upgrade and retire locomotives. We also assess technology risks in the context of fuel efficiency improvements, taking into consideration the financial costs associated with installing technologies on our locomotives with enhanced analytical capabilities, such as Trip Optimizer, Automatic Engine Start / Stop devices, Locomotive Telemetry, which wirelessly communicated operational data from locomotives to a central system, and Horse Power Tonnage Analyzer (HPTA) which uses the data collected by Locomotive Telemetry to optimize a locomotive’s horsepower-to-tonnage ratio.
Legal Relevant, always included
We assess our risk exposure to increasing legal costs related to defending and resolving legal claims that may occur from potential non-compliance with Greenhouse Gas (GHG) reporting and verification requirements and potential risks from the inability to meet compliance requirements related to offsetting our carbon emissions and purchasing renewable fuel compliance units.
Market Relevant, always included
We consider climate-related risks that could impact the markets we serve. Specifically, we assess the extent to which climate change legislation could affect our customers, making it difficult for our customers to produce products in a cost-competitive manner. For example, through our assessments we have identified certain commodities moved by CN that could be adversely affected, including our utility coal customers due to coal capacity being replaced with natural gas generation and renewable energy.
Reputation Relevant, always included
We consider the reputational risks of a lack of disclosure on climate-related impacts from increasing stakeholder requests, including customers, governments, investors, NGOs, among others. We recognize that with increasing public and investor concerns over climate change, a lack of disclosure on how we identify and manage climate change risks could expose us to potential reputational risk. For example, over the past few years, there has been an increase in investor interest on environmental, social and governance factors, which includes responding to and mitigating climate risks. As a result, we have been strengthening the transparency and credibility of the information we publish publicly on climate-related issues, including with respect to governance, risks, opportunities and performance.
Acute Physical Relevant, always included
We consider risk exposure to extreme weather events, including flooding, heat and cold extremes, cyclones and tornadoes. For example, we assess extreme heat risks on thermal rail expansions that result in rail misalignment and track buckling, as well as extreme cold risks that could result in track freezing, leading to greater frequencies of broken rails, frozen switches, and high rates of wheel replacements. We also assess the impact of episodes of flash flooding, which could result in landslides in unstable mountainous regions and mudslides further damaging rail bed support structures and cause overflows onto our tracks. Vulnerability and risks of tornado and cyclones are also assessed, particularly at our sites and network within the U.S. Tornado Belt, the Midwest and New Orleans area.
Chronic Physical Relevant, always included
We consider exposure to changes in chronic physical impacts, including gradual warming temperatures, on the markets and commodities we move. For example, gradual warming temperatures could pose risks to some markets such as agriculture while positive affecting other sectors.
Upstream Relevant, always included
We consider exposure to upstream impacts, including the sourcing of fuel from our suppliers. Specifically, CN is susceptible to the volatility of fuel prices due to fluctuations from supply chain disruptions. Fuel shortages could be impacted by climate-related events, which could in turn result in rising fuel prices that could materially adversely affect the results of our operations, financial position or liquidity. We are also assessing the risks associated with the availability and accessibility to renewable fuel compliance units that we need to purchase as part of our compliance obligations under the Federal Renewable Fuel Regulations. Furthermore, we are also working with our locomotive manufacturers to assess the potential risks of sourcing and using renewable fuels for our locomotives.
Downstream Relevant, always included
We consider the downstream risks of climate-related events on our customers. Specifically, we assess the extent to which climate related physical and transition risks could affect our customers, making it difficult for our customers to produce products in a cost-competitive manner that would in turn impact the markets we serve. For example, through our assessments we have identified certain commodities moved by CN that could be adversely affected, including our utility coal customers due to thermal coal capacity being replaced with natural gas generation and renewable energy.
Carbon Disclosure Project 2018CN
13
2. Risks and opportunities
Management processes (continued)
2.2d How we manage climate-related risks and opportunities
Process for managing climate-related risks
Through our integrated risk management process, we assess both inherent (without controls and mitigation measures) and residual (with existing controls and mitigation measures) risks. Where residual risks are substantive to our business based on an assessment of severity and likelihood, we will assess our risk appetite and determine the relevant controls to effectively manage the risks. When determining the appropriateness of controls, we review the economic, technical and financial feasibility of proposed mitigation measures taking into consideration the results of economic modelling and sensitivity analysis testing, where relevant.
Physical risk example
We assess the risks of severe weather such as extreme temperatures, flooding, hurricanes, and tornados with the potential to disrupt operations and railroad service. Specifically in 2017, we were impacted by the early onset of winter and harsh cold weather conditions adversely affecting network fluidity and productivity. Hot, dry temperatures in the summer led to line closures in B.C. due to wildfires, while record rainfall and snow melt in November led to landslides causing further line closures. To manage these risks, we put in place a number of programs, including enhancing our extreme weather readiness plans and emergency response planning, and increasing the frequency of inspections. We also spend considerable funds towards the maintenance of our infrastructure to protect our assets from wear and tear. In 2017, between C$50-100 million of our operating expenditures was directed towards proactive inspections, maintenance, readiness plans, emergency response and network infrastructure upgrades.
Transition risk example
We regularly assess the impact of climate change legislation on our operating costs and revenue potential from the commodities we move. Last year, we identified regulatory risks related to the Quebec, Ontario and Nova Scotia reporting, verification and cap and trade requirements, as well as the carbon taxes in B.C., Alberta and Manitoba. To manage our carbon price risk, we established a flow-through carbon cost to our customers, based on economic modelling. Specifically, in B.C. our current fee is C$0.040 per mile shipped and C$5.65 per intermodal unit; and, in Alberta, our fee is C$0.044 per mile shipped and C$4.34 per intermodal unit.
Furthermore, to manage our regulatory risks associated with emerging cleaner fuel standards, we are developing a renewable fuel strategy for the medium to long-term (greater than three years), which we expect will enable us to meet our 2030 science based target.
Process for managing climate-related opportunities
We assess the potential opportunities driven by climate related events through our respective business functions as part of our annual planning cycle. We review the impact opportunities may have on our operating costs, revenues and reputation using various economic models, where relevant. Where opportunities are considered substantive for the business, we establish strategies to maximize the benefits supported by operational and capital expenditure allocations.
Transition opportunity example
With growing customer pressures to reduce supply chain carbon impacts, we identified opportunities to grow revenue within our carload and intermodal business segments by promoting strategies to shift freight from truck to rail. Since 2012, our intermodal business segment revenue increased by 42%, and between 2016 and 2017 it increased by 12%, representing C$350 million. Overtime, this number could continue to increase. To maximize the opportunity, we collaboratively engage with customers to position the environmental benefits that rail offers for long haul shipments of freight over other modes of transport. We are also investing significantly in the growth of our intermodal business. In 2017, our investments in the intermodal business included service expansion at our Toronto, Detroit, Memphis, and Joliet intermodal terminals. We launched a new intermodal service in Duluth, establishing the first rail-served intermodal container ramp in the Twin Ports of Duluth, MN and Superior, WI. We also plan to build a C$250 million intermodal and logistics hub in Milton, Ontario to handle growing intermodal traffic.
Physical opportunity example
We recognize that a warmer climate could lengthen growing seasons and increase the availability of agricultural crop production, especially within the prairie regions of Canada. As crop yields increase, the grain and fertilizer supply chains need to adapt to ever-increasing demand for freight capacity to move product to market. To maximize this opportunity, we work closely with our customers to support their investment activities and develop win-win supply chain solutions that drive even greater efficiencies in the grain business segment.
Carbon Disclosure Project 2018CN
14
2. Risks and opportunities
Risk disclosure
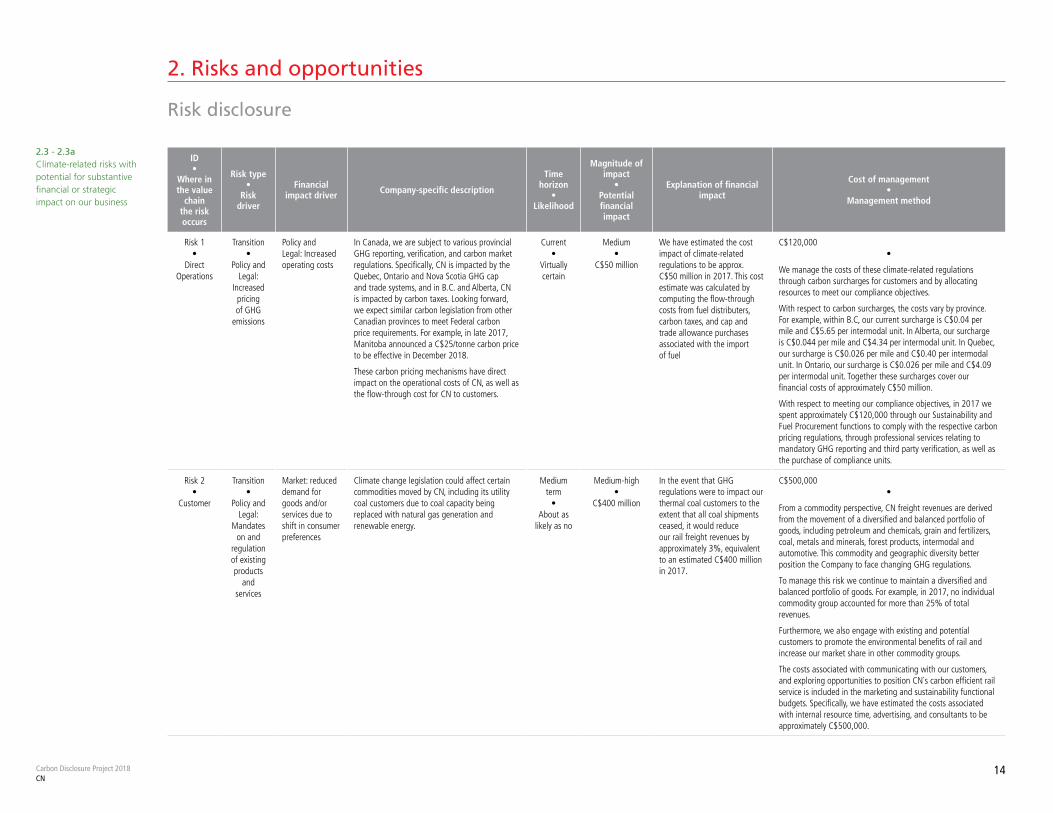
2.3 - 2.3a Climate-related risks with potential for substantive financial or strategic impact on our business
ID •
Where in the value
chain the risk occurs
Risk type •
Risk driver
Financial impact driver Company-specific description
Time horizon
• Likelihood
Magnitude of impact
• Potential financial impact
Explanation of financial impact
Cost of management •
Management method
Risk 1•
Direct Operations
Transition•
Policy and Legal:
Increased pricing of GHG
emissions
Policy and Legal: Increased operating costs
In Canada, we are subject to various provincial GHG reporting, verification, and carbon market regulations. Specifically, CN is impacted by the Quebec, Ontario and Nova Scotia GHG cap and trade systems, and in B.C. and Alberta, CN is impacted by carbon taxes. Looking forward, we expect similar carbon legislation from other Canadian provinces to meet Federal carbon price requirements. For example, in late 2017, Manitoba announced a C$25/tonne carbon price to be effective in December 2018.
These carbon pricing mechanisms have direct impact on the operational costs of CN, as well as the flow-through cost for CN to customers.
Current•
Virtually certain
Medium•
C$50 million
We have estimated the cost impact of climate-related regulations to be approx. C$50 million in 2017. This cost estimate was calculated by computing the flow-through costs from fuel distributers, carbon taxes, and cap and trade allowance purchases associated with the import of fuel
C$120,000•
We manage the costs of these climate-related regulations through carbon surcharges for customers and by allocating resources to meet our compliance objectives.
With respect to carbon surcharges, the costs vary by province. For example, within B.C, our current surcharge is C$0.04 per mile and C$5.65 per intermodal unit. In Alberta, our surcharge is C$0.044 per mile and C$4.34 per intermodal unit. In Quebec, our surcharge is C$0.026 per mile and C$0.40 per intermodal unit. In Ontario, our surcharge is C$0.026 per mile and C$4.09 per intermodal unit. Together these surcharges cover our financial costs of approximately C$50 million.
With respect to meeting our compliance objectives, in 2017 we spent approximately C$120,000 through our Sustainability and Fuel Procurement functions to comply with the respective carbon pricing regulations, through professional services relating to mandatory GHG reporting and third party verification, as well as the purchase of compliance units.
Risk 2•
Customer
Transition•
Policy and Legal:
Mandates on and
regulation of existing products
and services
Market: reduced demand for goods and/or services due to shift in consumer preferences
Climate change legislation could affect certain commodities moved by CN, including its utility coal customers due to coal capacity being replaced with natural gas generation and renewable energy.
Medium term
•About as
likely as no
Medium-high•
C$400 million
In the event that GHG regulations were to impact our thermal coal customers to the extent that all coal shipments ceased, it would reduce our rail freight revenues by approximately 3%, equivalent to an estimated C$400 million in 2017.
C$500,000•
From a commodity perspective, CN freight revenues are derived from the movement of a diversified and balanced portfolio of goods, including petroleum and chemicals, grain and fertilizers, coal, metals and minerals, forest products, intermodal and automotive. This commodity and geographic diversity better position the Company to face changing GHG regulations.
To manage this risk we continue to maintain a diversified and balanced portfolio of goods. For example, in 2017, no individual commodity group accounted for more than 25% of total revenues.
Furthermore, we also engage with existing and potential customers to promote the environmental benefits of rail and increase our market share in other commodity groups.
The costs associated with communicating with our customers, and exploring opportunities to position CN`s carbon efficient rail service is included in the marketing and sustainability functional budgets. Specifically, we have estimated the costs associated with internal resource time, advertising, and consultants to be approximately C$500,000.
Carbon Disclosure Project 2018CN
15
2. Risks and opportunities
Risk disclosure (continued)
ID •
Where in the value
chain the risk occurs
Risk type •
Risk driver
Financial impact driver
Company-specific description
Time horizon
• Likelihood
Magnitude of impact
• Potential financial impact
Explanation of financial impactCost of management
• Management method
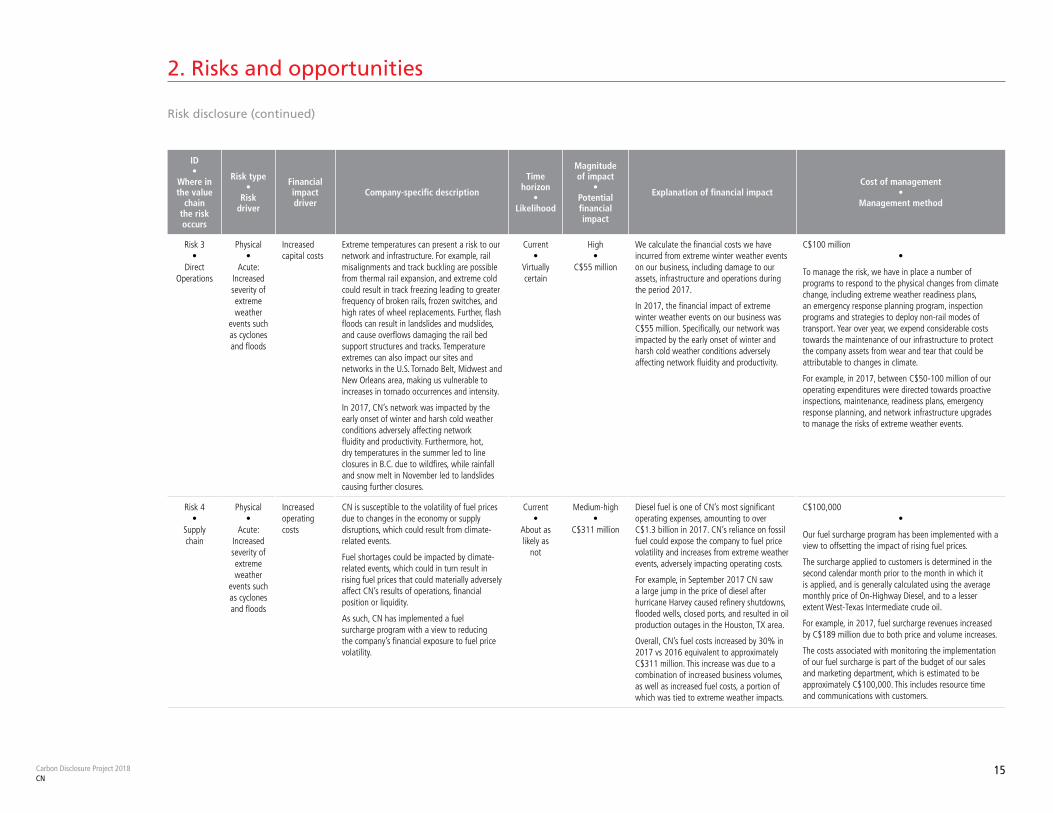
Risk 3•
Direct Operations
Physical•
Acute: Increased severity of extreme weather
events such as cyclones and floods
Increased capital costs
Extreme temperatures can present a risk to our network and infrastructure. For example, rail misalignments and track buckling are possible from thermal rail expansion, and extreme cold could result in track freezing leading to greater frequency of broken rails, frozen switches, and high rates of wheel replacements. Further, flash floods can result in landslides and mudslides, and cause overflows damaging the rail bed support structures and tracks. Temperature extremes can also impact our sites and networks in the U.S. Tornado Belt, Midwest and New Orleans area, making us vulnerable to increases in tornado occurrences and intensity.
In 2017, CN’s network was impacted by the early onset of winter and harsh cold weather conditions adversely affecting network fluidity and productivity. Furthermore, hot, dry temperatures in the summer led to line closures in B.C. due to wildfires, while rainfall and snow melt in November led to landslides causing further closures.
Current•
Virtually certain
High•
C$55 million
We calculate the financial costs we have incurred from extreme winter weather events on our business, including damage to our assets, infrastructure and operations during the period 2017.
In 2017, the financial impact of extreme winter weather events on our business was C$55 million. Specifically, our network was impacted by the early onset of winter and harsh cold weather conditions adversely affecting network fluidity and productivity.
C$100 million •
To manage the risk, we have in place a number of programs to respond to the physical changes from climate change, including extreme weather readiness plans, an emergency response planning program, inspection programs and strategies to deploy non-rail modes of transport. Year over year, we expend considerable costs towards the maintenance of our infrastructure to protect the company assets from wear and tear that could be attributable to changes in climate.
For example, in 2017, between C$50-100 million of our operating expenditures were directed towards proactive inspections, maintenance, readiness plans, emergency response planning, and network infrastructure upgrades to manage the risks of extreme weather events.
Risk 4•
Supply chain
Physical•
Acute: Increased severity of extreme weather
events such as cyclones and floods
Increased operating costs
CN is susceptible to the volatility of fuel prices due to changes in the economy or supply disruptions, which could result from climate-related events.
Fuel shortages could be impacted by climate-related events, which could in turn result in rising fuel prices that could materially adversely affect CN’s results of operations, financial position or liquidity.
As such, CN has implemented a fuel surcharge program with a view to reducing the company’s financial exposure to fuel price volatility.
Current•
About as likely as
not
Medium-high•
C$311 million
Diesel fuel is one of CN’s most significant operating expenses, amounting to over C$1.3 billion in 2017. CN’s reliance on fossil fuel could expose the company to fuel price volatility and increases from extreme weather events, adversely impacting operating costs.
For example, in September 2017 CN saw a large jump in the price of diesel after hurricane Harvey caused refinery shutdowns, flooded wells, closed ports, and resulted in oil production outages in the Houston, TX area.
Overall, CN’s fuel costs increased by 30% in 2017 vs 2016 equivalent to approximately C$311 million. This increase was due to a combination of increased business volumes, as well as increased fuel costs, a portion of which was tied to extreme weather impacts.
C$100,000 •
Our fuel surcharge program has been implemented with a view to offsetting the impact of rising fuel prices.
The surcharge applied to customers is determined in the second calendar month prior to the month in which it is applied, and is generally calculated using the average monthly price of On-Highway Diesel, and to a lesser extent West-Texas Intermediate crude oil.
For example, in 2017, fuel surcharge revenues increased by C$189 million due to both price and volume increases.
The costs associated with monitoring the implementation of our fuel surcharge is part of the budget of our sales and marketing department, which is estimated to be approximately C$100,000. This includes resource time and communications with customers.
Carbon Disclosure Project 2018CN
16
2. Risks and opportunities
Opportunity disclosure
2.4 - 2.4a Climate-related opportunities with potential for substantive financial or strategic impact on our business
ID •
Where in the value chain the
opportunity occurs
Opportunity type •
Opportunity driver
• Type of financial
impact driver
Company-specific description
Time horizon
• Likelihood
Magnitude of impact
• Potential financial impact
Explanation of financial impact Strategy to realize opportunity
Cost to realize opportunity
• Comments
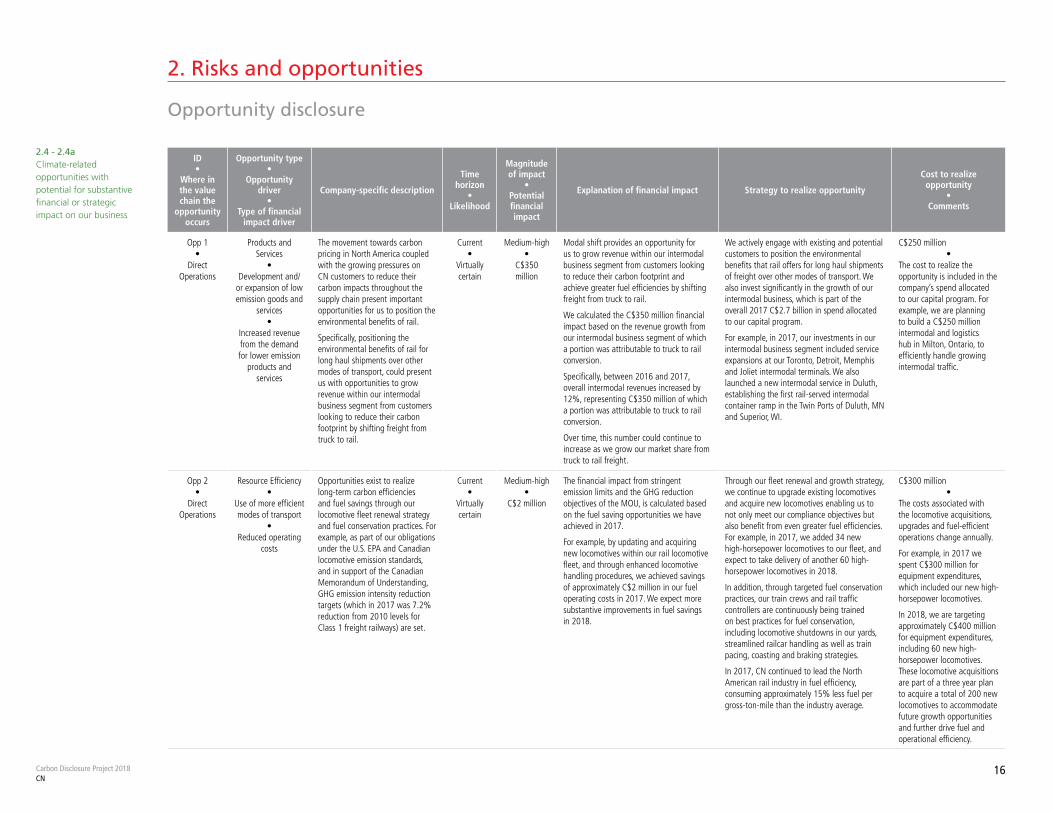
Opp 1•
Direct Operations
Products and Services
•Development and/
or expansion of low emission goods and
services•
Increased revenue from the demand for lower emission
products and services
The movement towards carbon pricing in North America coupled with the growing pressures on CN customers to reduce their carbon impacts throughout the supply chain present important opportunities for us to position the environmental benefits of rail.
Specifically, positioning the environmental benefits of rail for long haul shipments over other modes of transport, could present us with opportunities to grow revenue within our intermodal business segment from customers looking to reduce their carbon footprint by shifting freight from truck to rail.
Current•
Virtually certain
Medium-high•
C$350 million
Modal shift provides an opportunity for us to grow revenue within our intermodal business segment from customers looking to reduce their carbon footprint and achieve greater fuel efficiencies by shifting freight from truck to rail.
We calculated the C$350 million financial impact based on the revenue growth from our intermodal business segment of which a portion was attributable to truck to rail conversion.
Specifically, between 2016 and 2017, overall intermodal revenues increased by 12%, representing C$350 million of which a portion was attributable to truck to rail conversion.
Over time, this number could continue to increase as we grow our market share from truck to rail freight.
We actively engage with existing and potential customers to position the environmental benefits that rail offers for long haul shipments of freight over other modes of transport. We also invest significantly in the growth of our intermodal business, which is part of the overall 2017 C$2.7 billion in spend allocated to our capital program.
For example, in 2017, our investments in our intermodal business segment included service expansions at our Toronto, Detroit, Memphis and Joliet intermodal terminals. We also launched a new intermodal service in Duluth, establishing the first rail-served intermodal container ramp in the Twin Ports of Duluth, MN and Superior, WI.
C$250 million•
The cost to realize the opportunity is included in the company’s spend allocated to our capital program. For example, we are planning to build a C$250 million intermodal and logistics hub in Milton, Ontario, to efficiently handle growing intermodal traffic.
Opp 2•
Direct Operations
Resource Efficiency•
Use of more efficient modes of transport
•Reduced operating
costs
Opportunities exist to realize long-term carbon efficiencies and fuel savings through our locomotive fleet renewal strategy and fuel conservation practices. For example, as part of our obligations under the U.S. EPA and Canadian locomotive emission standards, and in support of the Canadian Memorandum of Understanding, GHG emission intensity reduction targets (which in 2017 was 7.2% reduction from 2010 levels for Class 1 freight railways) are set.
Current•
Virtually certain
Medium-high•
C$2 million
The financial impact from stringent emission limits and the GHG reduction objectives of the MOU, is calculated based on the fuel saving opportunities we have achieved in 2017.
For example, by updating and acquiring new locomotives within our rail locomotive fleet, and through enhanced locomotive handling procedures, we achieved savings of approximately C$2 million in our fuel operating costs in 2017. We expect more substantive improvements in fuel savings in 2018.
Through our fleet renewal and growth strategy, we continue to upgrade existing locomotives and acquire new locomotives enabling us to not only meet our compliance objectives but also benefit from even greater fuel efficiencies. For example, in 2017, we added 34 new high-horsepower locomotives to our fleet, and expect to take delivery of another 60 high-horsepower locomotives in 2018.
In addition, through targeted fuel conservation practices, our train crews and rail traffic controllers are continuously being trained on best practices for fuel conservation, including locomotive shutdowns in our yards, streamlined railcar handling as well as train pacing, coasting and braking strategies.
In 2017, CN continued to lead the North American rail industry in fuel efficiency, consuming approximately 15% less fuel per gross-ton-mile than the industry average.
C$300 million•
The costs associated with the locomotive acquisitions, upgrades and fuel-efficient operations change annually.
For example, in 2017 we spent C$300 million for equipment expenditures, which included our new high-horsepower locomotives.
In 2018, we are targeting approximately C$400 million for equipment expenditures, including 60 new high-horsepower locomotives. These locomotive acquisitions are part of a three year plan to acquire a total of 200 new locomotives to accommodate future growth opportunities and further drive fuel and operational efficiency.
Carbon Disclosure Project 2018CN
17
2. Risks and opportunities
Opportunity disclosure (continued)
ID •
Where in the value chain the
opportunity occurs
Opportunity type
• Opportunity
driver •
Type of financial
impact driver
Company-specific description
Time horizon
• Likelihood
Magnitude of impact
• Potential financial impact
Explanation of financial impact Strategy to realize opportunity
Cost to realize opportunity•
Comments
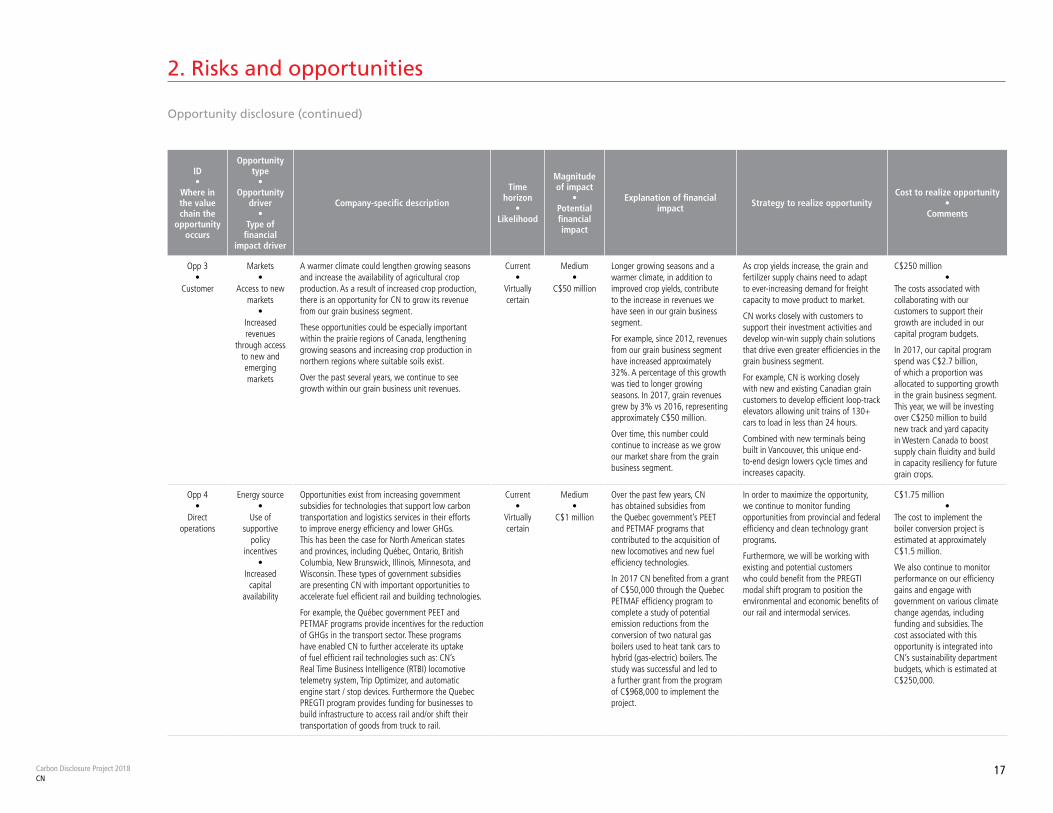
Opp 3•
Customer
Markets•
Access to new markets
•Increased revenues
through access to new and emerging markets
A warmer climate could lengthen growing seasons and increase the availability of agricultural crop production. As a result of increased crop production, there is an opportunity for CN to grow its revenue from our grain business segment.
These opportunities could be especially important within the prairie regions of Canada, lengthening growing seasons and increasing crop production in northern regions where suitable soils exist.
Over the past several years, we continue to see growth within our grain business unit revenues.
Current•
Virtually certain
Medium•
C$50 million
Longer growing seasons and a warmer climate, in addition to improved crop yields, contribute to the increase in revenues we have seen in our grain business segment.
For example, since 2012, revenues from our grain business segment have increased approximately 32%. A percentage of this growth was tied to longer growing seasons. In 2017, grain revenues grew by 3% vs 2016, representing approximately C$50 million.
Over time, this number could continue to increase as we grow our market share from the grain business segment.
As crop yields increase, the grain and fertilizer supply chains need to adapt to ever-increasing demand for freight capacity to move product to market.
CN works closely with customers to support their investment activities and develop win-win supply chain solutions that drive even greater efficiencies in the grain business segment.
For example, CN is working closely with new and existing Canadian grain customers to develop efficient loop-track elevators allowing unit trains of 130+ cars to load in less than 24 hours.
Combined with new terminals being built in Vancouver, this unique end-to-end design lowers cycle times and increases capacity.
C$250 million•
The costs associated with collaborating with our customers to support their growth are included in our capital program budgets.
In 2017, our capital program spend was C$2.7 billion, of which a proportion was allocated to supporting growth in the grain business segment. This year, we will be investing over C$250 million to build new track and yard capacity in Western Canada to boost supply chain fluidity and build in capacity resiliency for future grain crops.
Opp 4•
Direct operations
Energy source•
Use of supportive
policy incentives
•Increased
capital availability
Opportunities exist from increasing government subsidies for technologies that support low carbon transportation and logistics services in their efforts to improve energy efficiency and lower GHGs. This has been the case for North American states and provinces, including Québec, Ontario, British Columbia, New Brunswick, Illinois, Minnesota, and Wisconsin. These types of government subsidies are presenting CN with important opportunities to accelerate fuel efficient rail and building technologies.
For example, the Québec government PEET and PETMAF programs provide incentives for the reduction of GHGs in the transport sector. These programs have enabled CN to further accelerate its uptake of fuel efficient rail technologies such as: CN’s Real Time Business Intelligence (RTBI) locomotive telemetry system, Trip Optimizer, and automatic engine start / stop devices. Furthermore the Quebec PREGTI program provides funding for businesses to build infrastructure to access rail and/or shift their transportation of goods from truck to rail.
Current•
Virtually certain
Medium•
C$1 million
Over the past few years, CN has obtained subsidies from the Quebec government’s PEET and PETMAF programs that contributed to the acquisition of new locomotives and new fuel efficiency technologies.
In 2017 CN benefited from a grant of C$50,000 through the Quebec PETMAF efficiency program to complete a study of potential emission reductions from the conversion of two natural gas boilers used to heat tank cars to hybrid (gas-electric) boilers. The study was successful and led to a further grant from the program of C$968,000 to implement the project.
In order to maximize the opportunity, we continue to monitor funding opportunities from provincial and federal efficiency and clean technology grant programs.
Furthermore, we will be working with existing and potential customers who could benefit from the PREGTI modal shift program to position the environmental and economic benefits of our rail and intermodal services.
C$1.75 million•
The cost to implement the boiler conversion project is estimated at approximately C$1.5 million.
We also continue to monitor performance on our efficiency gains and engage with government on various climate change agendas, including funding and subsidies. The cost associated with this opportunity is integrated into CN’s sustainability department budgets, which is estimated at C$250,000.
Carbon Disclosure Project 2018CN
18
2. Risks and opportunities
Business impact assessment
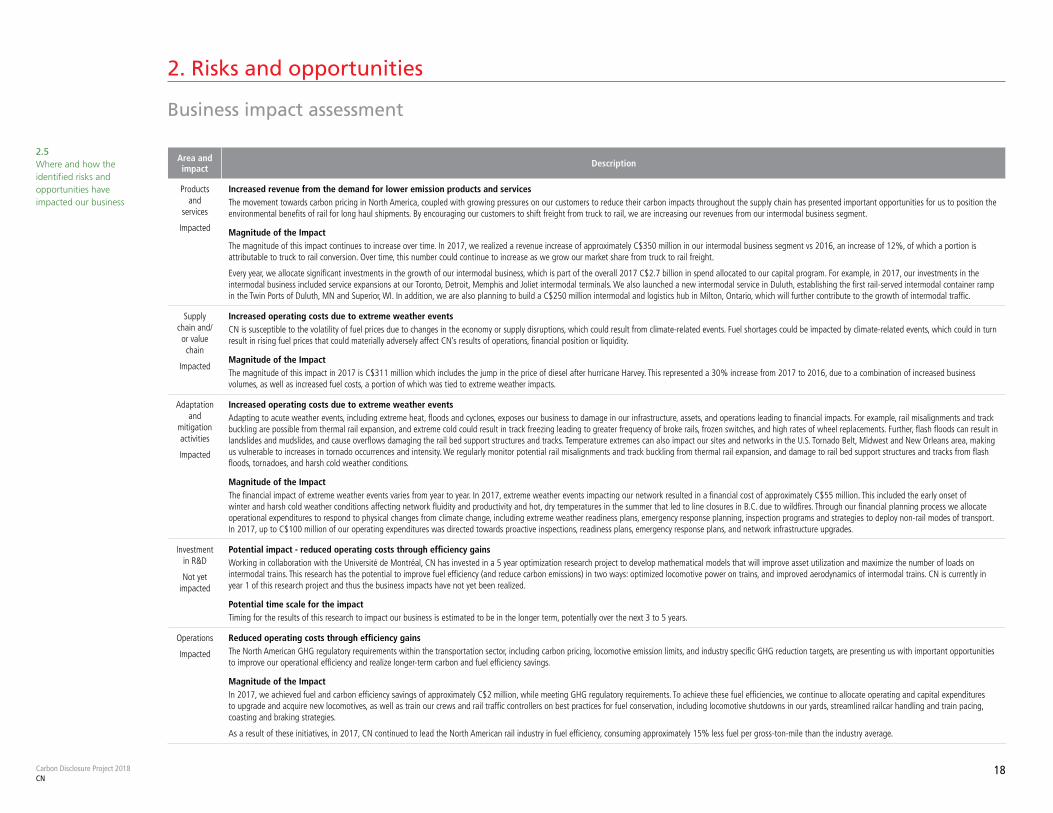
2.5 Where and how the identified risks and opportunities have impacted our business
Area and impact Description
Products and
services
Impacted
Increased revenue from the demand for lower emission products and servicesThe movement towards carbon pricing in North America, coupled with growing pressures on our customers to reduce their carbon impacts throughout the supply chain has presented important opportunities for us to position the environmental benefits of rail for long haul shipments. By encouraging our customers to shift freight from truck to rail, we are increasing our revenues from our intermodal business segment.
Magnitude of the ImpactThe magnitude of this impact continues to increase over time. In 2017, we realized a revenue increase of approximately C$350 million in our intermodal business segment vs 2016, an increase of 12%, of which a portion is attributable to truck to rail conversion. Over time, this number could continue to increase as we grow our market share from truck to rail freight.
Every year, we allocate significant investments in the growth of our intermodal business, which is part of the overall 2017 C$2.7 billion in spend allocated to our capital program. For example, in 2017, our investments in the intermodal business included service expansions at our Toronto, Detroit, Memphis and Joliet intermodal terminals. We also launched a new intermodal service in Duluth, establishing the first rail-served intermodal container ramp in the Twin Ports of Duluth, MN and Superior, WI. In addition, we are also planning to build a C$250 million intermodal and logistics hub in Milton, Ontario, which will further contribute to the growth of intermodal traffic.
Supply chain and/or value chain
Impacted
Increased operating costs due to extreme weather eventsCN is susceptible to the volatility of fuel prices due to changes in the economy or supply disruptions, which could result from climate-related events. Fuel shortages could be impacted by climate-related events, which could in turn result in rising fuel prices that could materially adversely affect CN’s results of operations, financial position or liquidity.
Magnitude of the ImpactThe magnitude of this impact in 2017 is C$311 million which includes the jump in the price of diesel after hurricane Harvey. This represented a 30% increase from 2017 to 2016, due to a combination of increased business volumes, as well as increased fuel costs, a portion of which was tied to extreme weather impacts.
Adaptation and
mitigation activities
Impacted
Increased operating costs due to extreme weather eventsAdapting to acute weather events, including extreme heat, floods and cyclones, exposes our business to damage in our infrastructure, assets, and operations leading to financial impacts. For example, rail misalignments and track buckling are possible from thermal rail expansion, and extreme cold could result in track freezing leading to greater frequency of broke rails, frozen switches, and high rates of wheel replacements. Further, flash floods can result in landslides and mudslides, and cause overflows damaging the rail bed support structures and tracks. Temperature extremes can also impact our sites and networks in the U.S. Tornado Belt, Midwest and New Orleans area, making us vulnerable to increases in tornado occurrences and intensity. We regularly monitor potential rail misalignments and track buckling from thermal rail expansion, and damage to rail bed support structures and tracks from flash floods, tornadoes, and harsh cold weather conditions.
Magnitude of the ImpactThe financial impact of extreme weather events varies from year to year. In 2017, extreme weather events impacting our network resulted in a financial cost of approximately C$55 million. This included the early onset of winter and harsh cold weather conditions affecting network fluidity and productivity and hot, dry temperatures in the summer that led to line closures in B.C. due to wildfires. Through our financial planning process we allocate operational expenditures to respond to physical changes from climate change, including extreme weather readiness plans, emergency response planning, inspection programs and strategies to deploy non-rail modes of transport. In 2017, up to C$100 million of our operating expenditures was directed towards proactive inspections, readiness plans, emergency response plans, and network infrastructure upgrades.
Investment in R&D
Not yet impacted
Potential impact - reduced operating costs through efficiency gainsWorking in collaboration with the Université de Montréal, CN has invested in a 5 year optimization research project to develop mathematical models that will improve asset utilization and maximize the number of loads on intermodal trains. This research has the potential to improve fuel efficiency (and reduce carbon emissions) in two ways: optimized locomotive power on trains, and improved aerodynamics of intermodal trains. CN is currently in year 1 of this research project and thus the business impacts have not yet been realized.
Potential time scale for the impactTiming for the results of this research to impact our business is estimated to be in the longer term, potentially over the next 3 to 5 years.
Operations
Impacted
Reduced operating costs through efficiency gainsThe North American GHG regulatory requirements within the transportation sector, including carbon pricing, locomotive emission limits, and industry specific GHG reduction targets, are presenting us with important opportunities to improve our operational efficiency and realize longer-term carbon and fuel efficiency savings.
Magnitude of the ImpactIn 2017, we achieved fuel and carbon efficiency savings of approximately C$2 million, while meeting GHG regulatory requirements. To achieve these fuel efficiencies, we continue to allocate operating and capital expenditures to upgrade and acquire new locomotives, as well as train our crews and rail traffic controllers on best practices for fuel conservation, including locomotive shutdowns in our yards, streamlined railcar handling and train pacing, coasting and braking strategies.
As a result of these initiatives, in 2017, CN continued to lead the North American rail industry in fuel efficiency, consuming approximately 15% less fuel per gross-ton-mile than the industry average.
Carbon Disclosure Project 2018CN
19
2. Risks and opportunities
Financial planning assessment
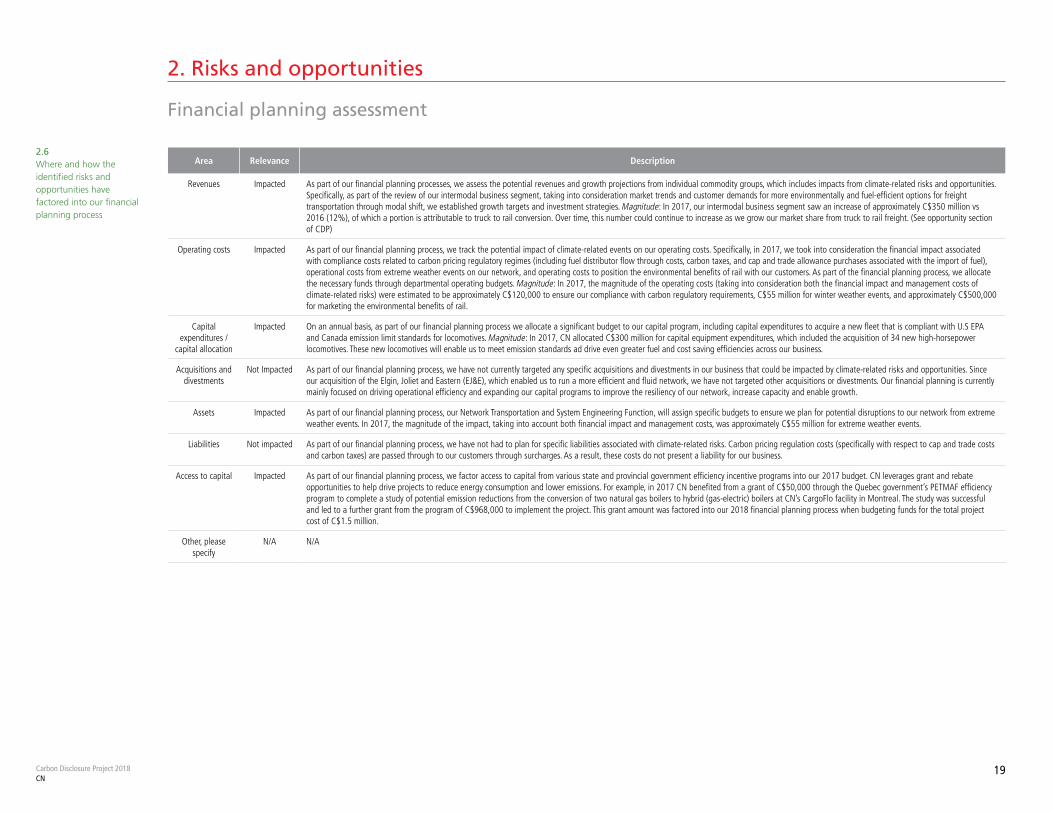
2.6 Where and how the identified risks and opportunities have factored into our financial planning process
Area Relevance Description
Revenues Impacted As part of our financial planning processes, we assess the potential revenues and growth projections from individual commodity groups, which includes impacts from climate-related risks and opportunities. Specifically, as part of the review of our intermodal business segment, taking into consideration market trends and customer demands for more environmentally and fuel-efficient options for freight transportation through modal shift, we established growth targets and investment strategies. Magnitude: In 2017, our intermodal business segment saw an increase of approximately C$350 million vs 2016 (12%), of which a portion is attributable to truck to rail conversion. Over time, this number could continue to increase as we grow our market share from truck to rail freight. (See opportunity section of CDP)
Operating costs Impacted As part of our financial planning process, we track the potential impact of climate-related events on our operating costs. Specifically, in 2017, we took into consideration the financial impact associated with compliance costs related to carbon pricing regulatory regimes (including fuel distributor flow through costs, carbon taxes, and cap and trade allowance purchases associated with the import of fuel), operational costs from extreme weather events on our network, and operating costs to position the environmental benefits of rail with our customers. As part of the financial planning process, we allocate the necessary funds through departmental operating budgets. Magnitude: In 2017, the magnitude of the operating costs (taking into consideration both the financial impact and management costs of climate-related risks) were estimated to be approximately C$120,000 to ensure our compliance with carbon regulatory requirements, C$55 million for winter weather events, and approximately C$500,000 for marketing the environmental benefits of rail.
Capital expenditures /
capital allocation
Impacted On an annual basis, as part of our financial planning process we allocate a significant budget to our capital program, including capital expenditures to acquire a new fleet that is compliant with U.S EPA and Canada emission limit standards for locomotives. Magnitude: In 2017, CN allocated C$300 million for capital equipment expenditures, which included the acquisition of 34 new high-horsepower locomotives. These new locomotives will enable us to meet emission standards ad drive even greater fuel and cost saving efficiencies across our business.
Acquisitions and divestments
Not Impacted As part of our financial planning process, we have not currently targeted any specific acquisitions and divestments in our business that could be impacted by climate-related risks and opportunities. Since our acquisition of the Elgin, Joliet and Eastern (EJ&E), which enabled us to run a more efficient and fluid network, we have not targeted other acquisitions or divestments. Our financial planning is currently mainly focused on driving operational efficiency and expanding our capital programs to improve the resiliency of our network, increase capacity and enable growth.
Assets Impacted As part of our financial planning process, our Network Transportation and System Engineering Function, will assign specific budgets to ensure we plan for potential disruptions to our network from extreme weather events. In 2017, the magnitude of the impact, taking into account both financial impact and management costs, was approximately C$55 million for extreme weather events.
Liabilities Not impacted As part of our financial planning process, we have not had to plan for specific liabilities associated with climate-related risks. Carbon pricing regulation costs (specifically with respect to cap and trade costs and carbon taxes) are passed through to our customers through surcharges. As a result, these costs do not present a liability for our business.
Access to capital Impacted As part of our financial planning process, we factor access to capital from various state and provincial government efficiency incentive programs into our 2017 budget. CN leverages grant and rebate opportunities to help drive projects to reduce energy consumption and lower emissions. For example, in 2017 CN benefited from a grant of C$50,000 through the Quebec government’s PETMAF efficiency program to complete a study of potential emission reductions from the conversion of two natural gas boilers to hybrid (gas-electric) boilers at CN’s CargoFlo facility in Montreal. The study was successful and led to a further grant from the program of C$968,000 to implement the project. This grant amount was factored into our 2018 financial planning process when budgeting funds for the total project cost of C$1.5 million.
Other, please specify
N/A N/A

Business strategy
Carbon Disclosure Project 2018CN
21
3. Business strategy
3.1 - 3.1c Climate -related issues are integrated into our business strategy and qualitative and quantitative scenario analysis informs our business strategy. Additionally, we have developed a low-carbon transition plan to support our long-term business strategy
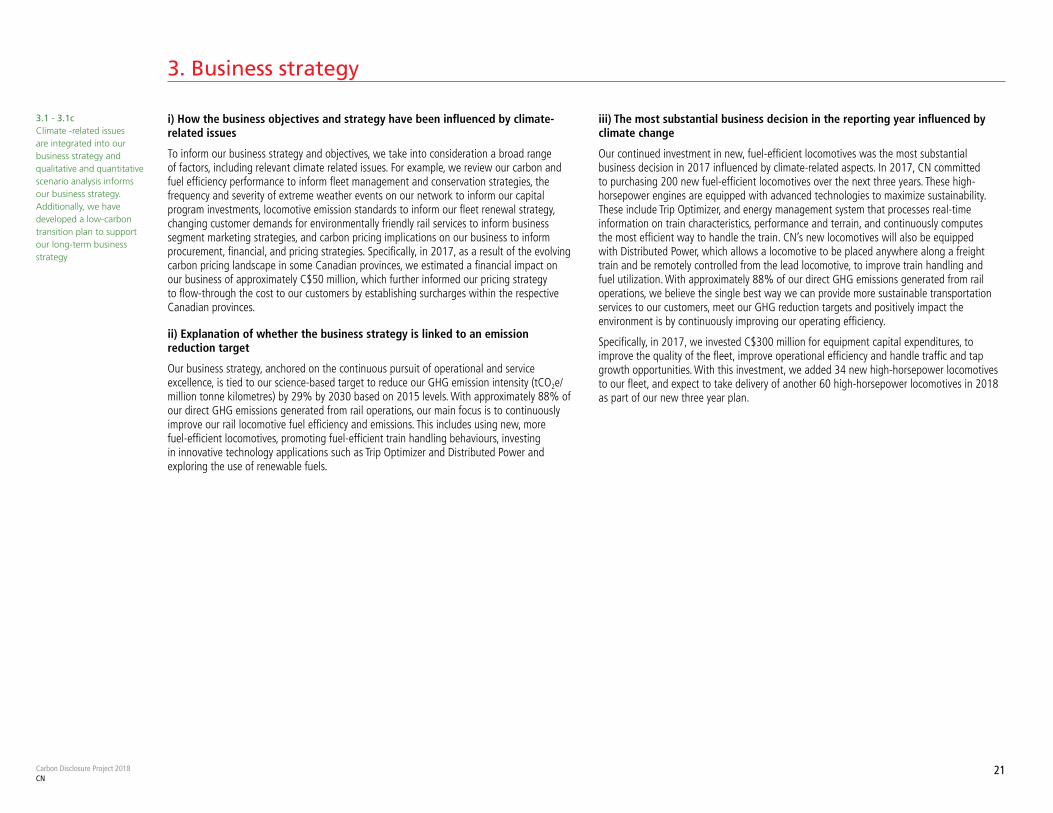
i) How the business objectives and strategy have been influenced by climate-related issues
To inform our business strategy and objectives, we take into consideration a broad range of factors, including relevant climate related issues. For example, we review our carbon and fuel efficiency performance to inform fleet management and conservation strategies, the frequency and severity of extreme weather events on our network to inform our capital program investments, locomotive emission standards to inform our fleet renewal strategy, changing customer demands for environmentally friendly rail services to inform business segment marketing strategies, and carbon pricing implications on our business to inform procurement, financial, and pricing strategies. Specifically, in 2017, as a result of the evolving carbon pricing landscape in some Canadian provinces, we estimated a financial impact on our business of approximately C$50 million, which further informed our pricing strategy to flow-through the cost to our customers by establishing surcharges within the respective Canadian provinces.
ii) Explanation of whether the business strategy is linked to an emission reduction target
Our business strategy, anchored on the continuous pursuit of operational and service excellence, is tied to our science-based target to reduce our GHG emission intensity (tCO2e/million tonne kilometres) by 29% by 2030 based on 2015 levels. With approximately 88% of our direct GHG emissions generated from rail operations, our main focus is to continuously improve our rail locomotive fuel efficiency and emissions. This includes using new, more fuel-efficient locomotives, promoting fuel-efficient train handling behaviours, investing in innovative technology applications such as Trip Optimizer and Distributed Power and exploring the use of renewable fuels.
iii) The most substantial business decision in the reporting year influenced by climate change
Our continued investment in new, fuel-efficient locomotives was the most substantial business decision in 2017 influenced by climate-related aspects. In 2017, CN committed to purchasing 200 new fuel-efficient locomotives over the next three years. These high-horsepower engines are equipped with advanced technologies to maximize sustainability. These include Trip Optimizer, and energy management system that processes real-time information on train characteristics, performance and terrain, and continuously computes the most efficient way to handle the train. CN’s new locomotives will also be equipped with Distributed Power, which allows a locomotive to be placed anywhere along a freight train and be remotely controlled from the lead locomotive, to improve train handling and fuel utilization. With approximately 88% of our direct GHG emissions generated from rail operations, we believe the single best way we can provide more sustainable transportation services to our customers, meet our GHG reduction targets and positively impact the environment is by continuously improving our operating efficiency.
Specifically, in 2017, we invested C$300 million for equipment capital expenditures, to improve the quality of the fleet, improve operational efficiency and handle traffic and tap growth opportunities. With this investment, we added 34 new high-horsepower locomotives to our fleet, and expect to take delivery of another 60 high-horsepower locomotives in 2018 as part of our new three year plan.
Carbon Disclosure Project 2018CN
22
3. Business strategy
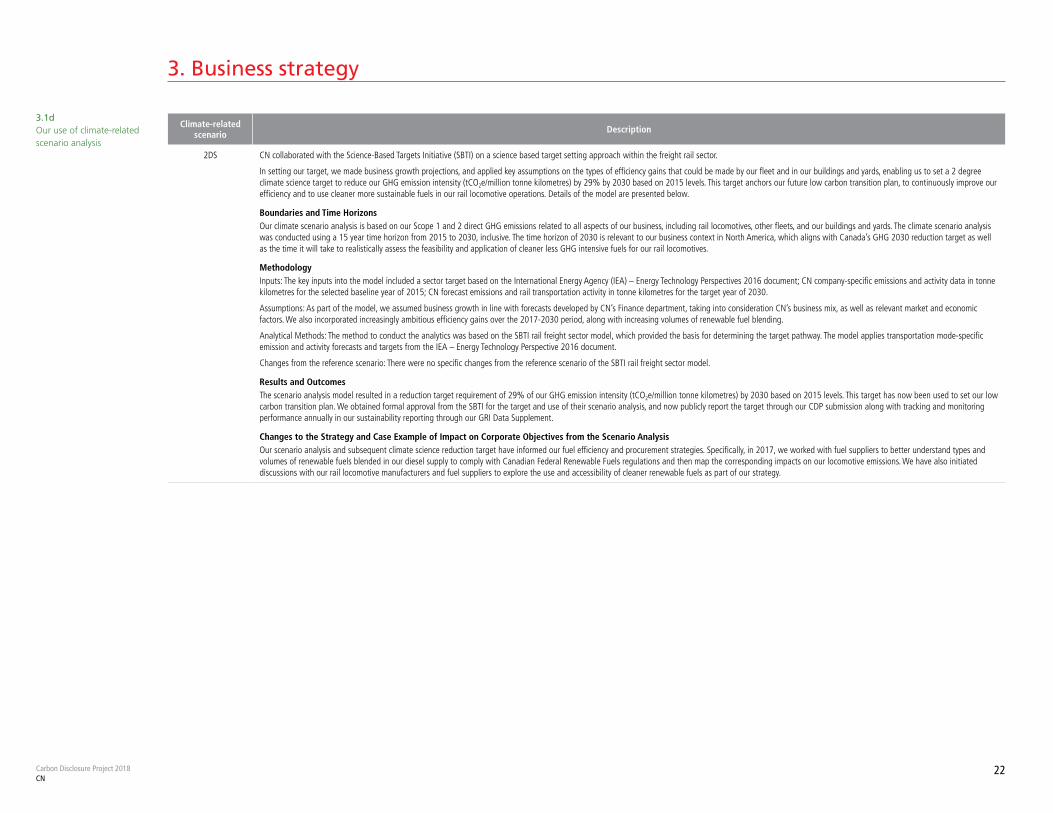
3.1d Our use of climate-related scenario analysis
Climate-related scenario Description
2DS CN collaborated with the Science-Based Targets Initiative (SBTI) on a science based target setting approach within the freight rail sector.
In setting our target, we made business growth projections, and applied key assumptions on the types of efficiency gains that could be made by our fleet and in our buildings and yards, enabling us to set a 2 degree climate science target to reduce our GHG emission intensity (tCO2e/million tonne kilometres) by 29% by 2030 based on 2015 levels. This target anchors our future low carbon transition plan, to continuously improve our efficiency and to use cleaner more sustainable fuels in our rail locomotive operations. Details of the model are presented below.
Boundaries and Time HorizonsOur climate scenario analysis is based on our Scope 1 and 2 direct GHG emissions related to all aspects of our business, including rail locomotives, other fleets, and our buildings and yards. The climate scenario analysis was conducted using a 15 year time horizon from 2015 to 2030, inclusive. The time horizon of 2030 is relevant to our business context in North America, which aligns with Canada’s GHG 2030 reduction target as well as the time it will take to realistically assess the feasibility and application of cleaner less GHG intensive fuels for our rail locomotives.
MethodologyInputs: The key inputs into the model included a sector target based on the International Energy Agency (IEA) – Energy Technology Perspectives 2016 document; CN company-specific emissions and activity data in tonne kilometres for the selected baseline year of 2015; CN forecast emissions and rail transportation activity in tonne kilometres for the target year of 2030.
Assumptions: As part of the model, we assumed business growth in line with forecasts developed by CN’s Finance department, taking into consideration CN’s business mix, as well as relevant market and economic factors. We also incorporated increasingly ambitious efficiency gains over the 2017-2030 period, along with increasing volumes of renewable fuel blending.
Analytical Methods: The method to conduct the analytics was based on the SBTI rail freight sector model, which provided the basis for determining the target pathway. The model applies transportation mode-specific emission and activity forecasts and targets from the IEA – Energy Technology Perspective 2016 document.
Changes from the reference scenario: There were no specific changes from the reference scenario of the SBTI rail freight sector model.
Results and OutcomesThe scenario analysis model resulted in a reduction target requirement of 29% of our GHG emission intensity (tCO2e/million tonne kilometres) by 2030 based on 2015 levels. This target has now been used to set our low carbon transition plan. We obtained formal approval from the SBTI for the target and use of their scenario analysis, and now publicly report the target through our CDP submission along with tracking and monitoring performance annually in our sustainability reporting through our GRI Data Supplement.
Changes to the Strategy and Case Example of Impact on Corporate Objectives from the Scenario AnalysisOur scenario analysis and subsequent climate science reduction target have informed our fuel efficiency and procurement strategies. Specifically, in 2017, we worked with fuel suppliers to better understand types and volumes of renewable fuels blended in our diesel supply to comply with Canadian Federal Renewable Fuels regulations and then map the corresponding impacts on our locomotive emissions. We have also initiated discussions with our rail locomotive manufacturers and fuel suppliers to explore the use and accessibility of cleaner renewable fuels as part of our strategy.
Carbon Disclosure Project 2018CN
23
3. Business strategy
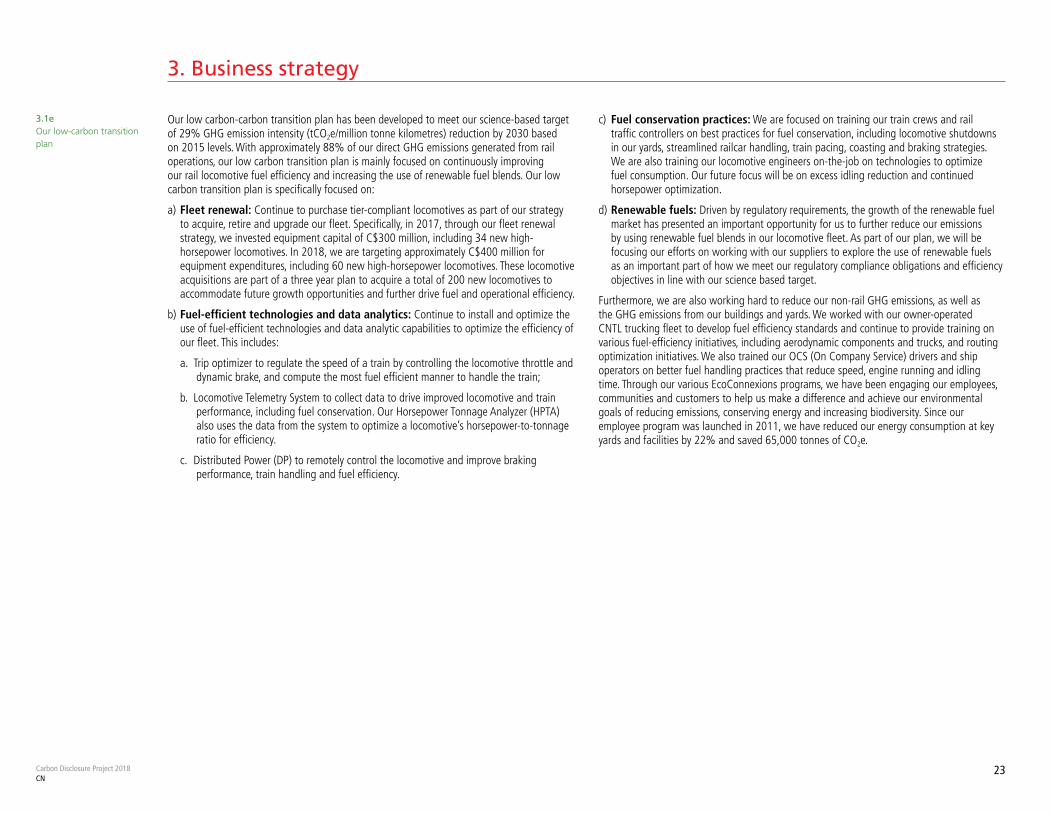
Our low carbon-carbon transition plan has been developed to meet our science-based target of 29% GHG emission intensity (tCO2e/million tonne kilometres) reduction by 2030 based on 2015 levels. With approximately 88% of our direct GHG emissions generated from rail operations, our low carbon transition plan is mainly focused on continuously improving our rail locomotive fuel efficiency and increasing the use of renewable fuel blends. Our low carbon transition plan is specifically focused on:
a) Fleet renewal: Continue to purchase tier-compliant locomotives as part of our strategy to acquire, retire and upgrade our fleet. Specifically, in 2017, through our fleet renewal strategy, we invested equipment capital of C$300 million, including 34 new high-horsepower locomotives. In 2018, we are targeting approximately C$400 million for equipment expenditures, including 60 new high-horsepower locomotives. These locomotive acquisitions are part of a three year plan to acquire a total of 200 new locomotives to accommodate future growth opportunities and further drive fuel and operational efficiency.
b) Fuel-efficient technologies and data analytics: Continue to install and optimize the use of fuel-efficient technologies and data analytic capabilities to optimize the efficiency of our fleet. This includes:
a. Trip optimizer to regulate the speed of a train by controlling the locomotive throttle and dynamic brake, and compute the most fuel efficient manner to handle the train;
b. Locomotive Telemetry System to collect data to drive improved locomotive and train performance, including fuel conservation. Our Horsepower Tonnage Analyzer (HPTA) also uses the data from the system to optimize a locomotive’s horsepower-to-tonnage ratio for efficiency.
c. Distributed Power (DP) to remotely control the locomotive and improve braking performance, train handling and fuel efficiency.
c) Fuel conservation practices: We are focused on training our train crews and rail traffic controllers on best practices for fuel conservation, including locomotive shutdowns in our yards, streamlined railcar handling, train pacing, coasting and braking strategies. We are also training our locomotive engineers on-the-job on technologies to optimize fuel consumption. Our future focus will be on excess idling reduction and continued horsepower optimization.
d) Renewable fuels: Driven by regulatory requirements, the growth of the renewable fuel market has presented an important opportunity for us to further reduce our emissions by using renewable fuel blends in our locomotive fleet. As part of our plan, we will be focusing our efforts on working with our suppliers to explore the use of renewable fuels as an important part of how we meet our regulatory compliance obligations and efficiency objectives in line with our science based target.
Furthermore, we are also working hard to reduce our non-rail GHG emissions, as well as the GHG emissions from our buildings and yards. We worked with our owner-operated CNTL trucking fleet to develop fuel efficiency standards and continue to provide training on various fuel-efficiency initiatives, including aerodynamic components and trucks, and routing optimization initiatives. We also trained our OCS (On Company Service) drivers and ship operators on better fuel handling practices that reduce speed, engine running and idling time. Through our various EcoConnexions programs, we have been engaging our employees, communities and customers to help us make a difference and achieve our environmental goals of reducing emissions, conserving energy and increasing biodiversity. Since our employee program was launched in 2011, we have reduced our energy consumption at key yards and facilities by 22% and saved 65,000 tonnes of CO2e.
3.1e Our low-carbon transition plan

Targets and performance
Carbon Disclosure Project 2018CN
25
4. Targets and performance
Targets
4.1 - 4.1b Our target Target
reference number
Scope% of
emissions in Scope
% reduction
from base year
Metric Base year
Start year
Normalized base year emissions covered by
target
Target year
Is this a science-based
target?
% achieved (emissions)
Target status Explanation
% change anticipated in absolute Scope 1 & 2 emissions
% change anticipated in absolute
Scope 3 emissions
INT1 1 and 2 (location-
based)
100% 29% tCO2e per million tonne
kilometres
2015 2017 15.98 tCO2e/ million tonne km
2030 Yes, approved
9% Underway CN has completed the second year of our new 15 year science-based target approved by the SBTI. In 2017 we achieved an emission intensity reduction of 3% from fuel consumption related to locomotives and other fleets and energy consumption at our buildings and yards (tCO2e/million tonne km) based on 2015 levels. Scope 3 emissions are not included in our target as they represent less than 40% of our total Scope 1, 2 & 3 emissions.
-9% 0%

Carbon Disclosure Project 2018CN
26
4. Targets and performance
Emission reduction initiatives
Activity type Description of activity
Estimated annual CO2e savings
(tCO2e)Scope Voluntary /
Mandatory
Annual monetary savings
(unit currency)
Investment required
(unit currency)
Payback period
Estimated lifetime of the
initiativeComments
Process emission
reductions
New equipment
343,562 Scope 1 Voluntary C$2 million C$300 million 21-25 years
> 30 years The estimated emissions savings relate to Scope 1 emissions covering our rail locomotives. In 2017 we continued to implement projects related to our rail locomotive emissions and energy efficiency strategy, which represent 86% of our Scope 1 & 2 greenhouse gas emissions. This includes new locomotive acquisitions, fuel efficiency training for our locomotive engineers, installation of new locomotive technologies such as Trip Optimizer and CN’s locomotive telemetry system, and installation of anti-idling devices. These projects will help us achiever our science based emissions intensity reduction target of 29% in 2030, based on 2015 levels.
Energy efficiency: building services
Various projects
5,461 Scope 2 (location-
based)
Voluntary C$350,000 C$4 miilion 4-10 years
11-15 years We continue to work to reduce Scope 2 emissions from electricity consumption at our buildings and yards. We invest in energy efficiency projects including HVAC, lighting and air compressor upgrades. This includes a C$5 million dollar EcoFund to support energy and emission reduction projects.
4.3 - 4.3b Emission reduction initiatives active within the reporting year
Stage of development Number of projects Total estimated annual CO2e savings
Under investigation 0 0
To be implemented 0 0
Implementation commenced 0 0
Implemented 5 349,023
Not to be implemented 0 0
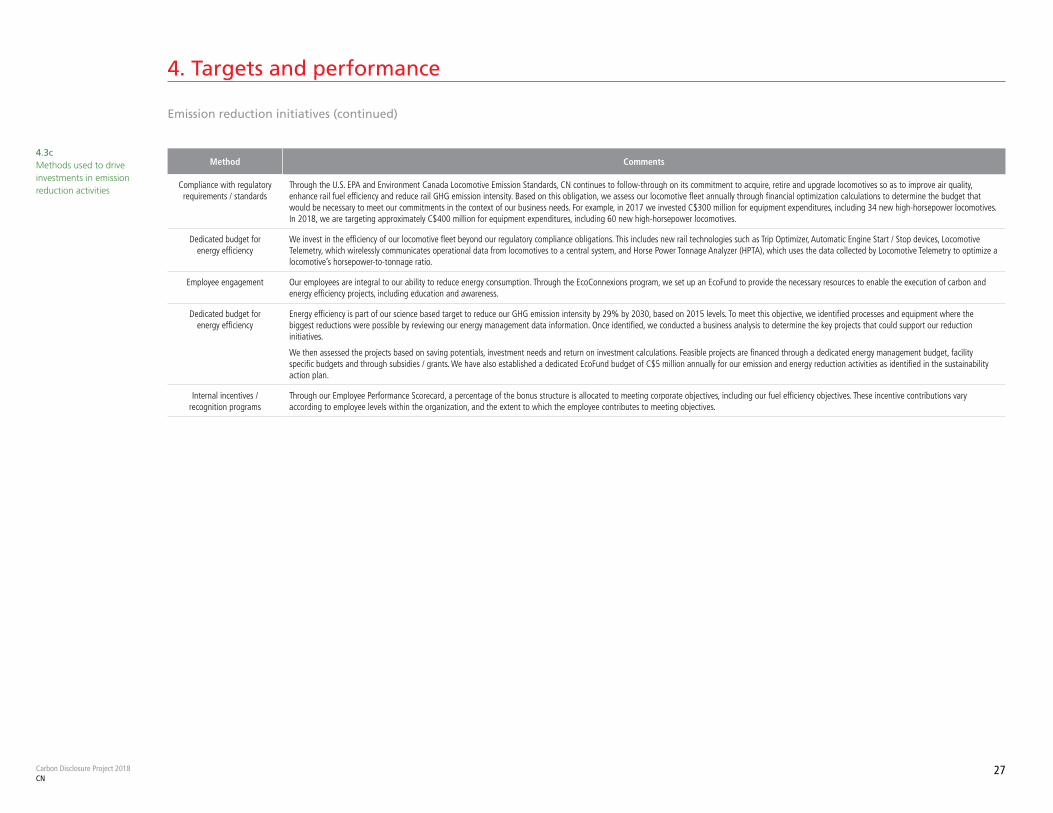
Carbon Disclosure Project 2018CN
27
4. Targets and performance
Emission reduction initiatives (continued)
4.3c Methods used to drive investments in emission reduction activities
Method Comments
Compliance with regulatory requirements / standards
Through the U.S. EPA and Environment Canada Locomotive Emission Standards, CN continues to follow-through on its commitment to acquire, retire and upgrade locomotives so as to improve air quality, enhance rail fuel efficiency and reduce rail GHG emission intensity. Based on this obligation, we assess our locomotive fleet annually through financial optimization calculations to determine the budget that would be necessary to meet our commitments in the context of our business needs. For example, in 2017 we invested C$300 million for equipment expenditures, including 34 new high-horsepower locomotives. In 2018, we are targeting approximately C$400 million for equipment expenditures, including 60 new high-horsepower locomotives.
Dedicated budget for energy efficiency
We invest in the efficiency of our locomotive fleet beyond our regulatory compliance obligations. This includes new rail technologies such as Trip Optimizer, Automatic Engine Start / Stop devices, Locomotive Telemetry, which wirelessly communicates operational data from locomotives to a central system, and Horse Power Tonnage Analyzer (HPTA), which uses the data collected by Locomotive Telemetry to optimize a locomotive’s horsepower-to-tonnage ratio.
Employee engagement Our employees are integral to our ability to reduce energy consumption. Through the EcoConnexions program, we set up an EcoFund to provide the necessary resources to enable the execution of carbon and energy efficiency projects, including education and awareness.
Dedicated budget for energy efficiency
Energy efficiency is part of our science based target to reduce our GHG emission intensity by 29% by 2030, based on 2015 levels. To meet this objective, we identified processes and equipment where the biggest reductions were possible by reviewing our energy management data information. Once identified, we conducted a business analysis to determine the key projects that could support our reduction initiatives.
We then assessed the projects based on saving potentials, investment needs and return on investment calculations. Feasible projects are financed through a dedicated energy management budget, facility specific budgets and through subsidies / grants. We have also established a dedicated EcoFund budget of C$5 million annually for our emission and energy reduction activities as identified in the sustainability action plan.
Internal incentives / recognition programs
Through our Employee Performance Scorecard, a percentage of the bonus structure is allocated to meeting corporate objectives, including our fuel efficiency objectives. These incentive contributions vary according to employee levels within the organization, and the extent to which the employee contributes to meeting objectives.
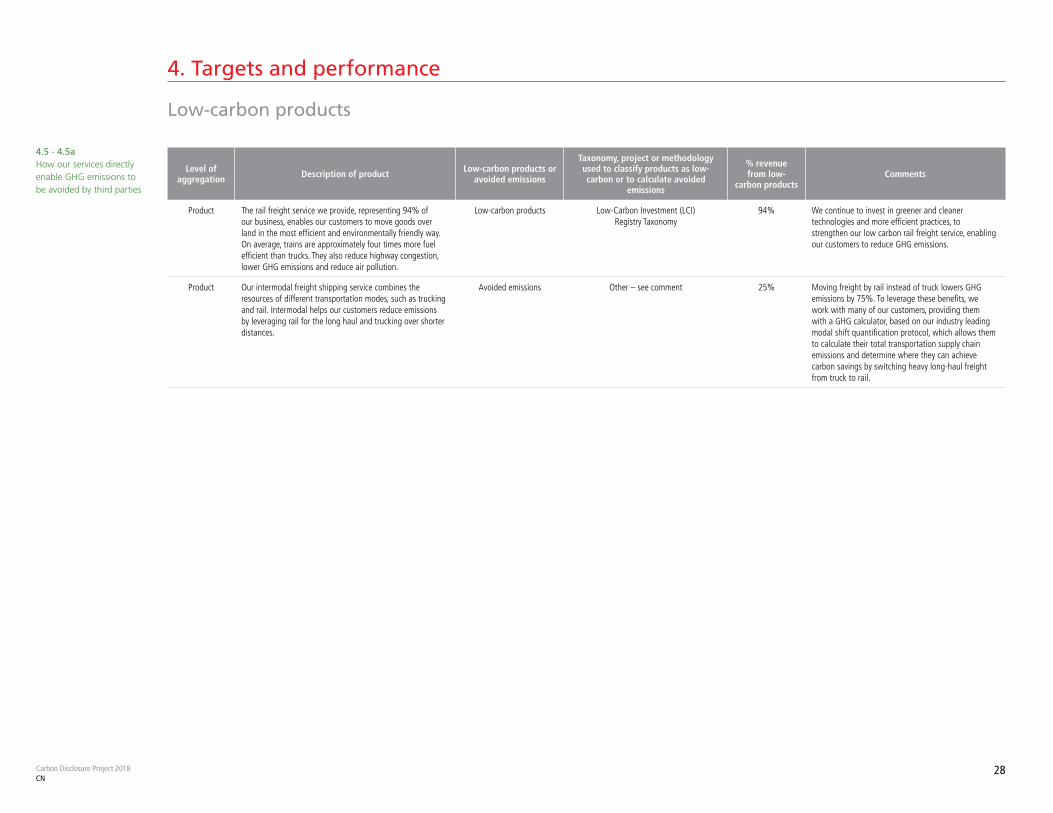
Carbon Disclosure Project 2018CN
28
4. Targets and performance
Low-carbon products
4.5 - 4.5a How our services directly enable GHG emissions to be avoided by third parties
Level of aggregation Description of product Low-carbon products or
avoided emissions
Taxonomy, project or methodology used to classify products as low-carbon or to calculate avoided
emissions
% revenue from low-
carbon productsComments
Product The rail freight service we provide, representing 94% of our business, enables our customers to move goods over land in the most efficient and environmentally friendly way. On average, trains are approximately four times more fuel efficient than trucks. They also reduce highway congestion, lower GHG emissions and reduce air pollution.
Low-carbon products Low-Carbon Investment (LCI) Registry Taxonomy
94% We continue to invest in greener and cleaner technologies and more efficient practices, to strengthen our low carbon rail freight service, enabling our customers to reduce GHG emissions.
Product Our intermodal freight shipping service combines the resources of different transportation modes, such as trucking and rail. Intermodal helps our customers reduce emissions by leveraging rail for the long haul and trucking over shorter distances.
Avoided emissions Other – see comment 25% Moving freight by rail instead of truck lowers GHG emissions by 75%. To leverage these benefits, we work with many of our customers, providing them with a GHG calculator, based on our industry leading modal shift quantification protocol, which allows them to calculate their total transportation supply chain emissions and determine where they can achieve carbon savings by switching heavy long-haul freight from truck to rail.
Emissions methodology
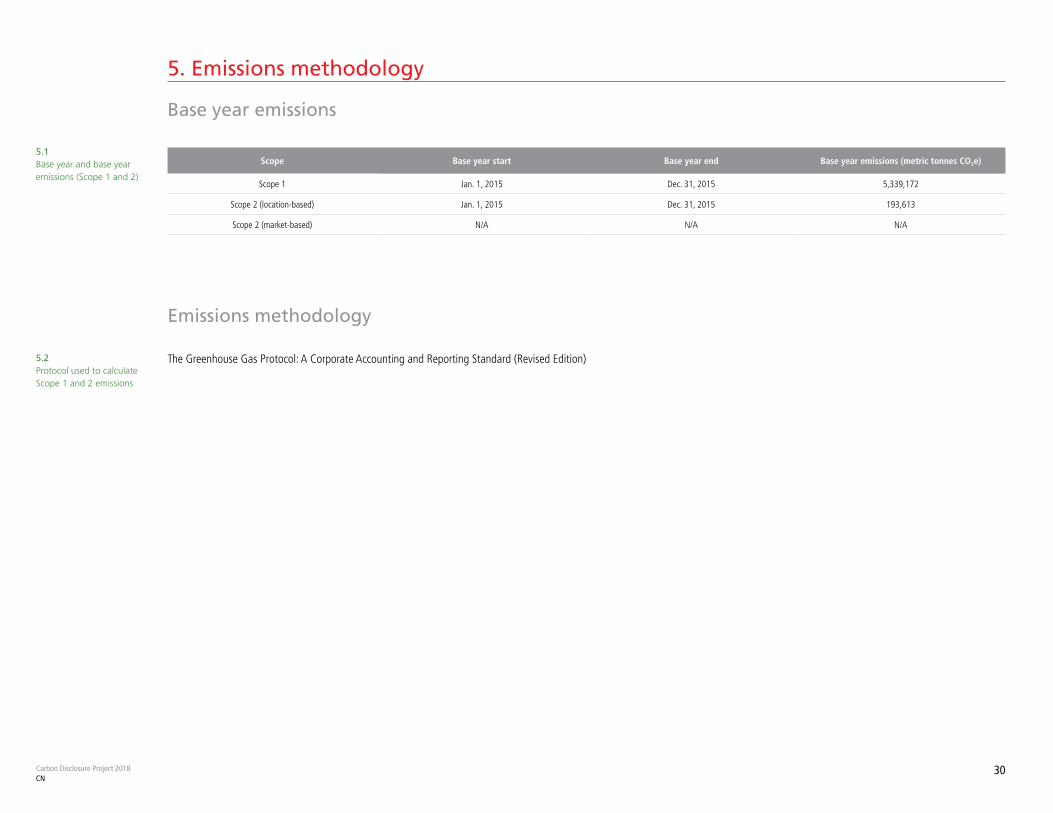
Carbon Disclosure Project 2018CN
30
5. Emissions methodology
Base year emissions
5.1 Base year and base year emissions (Scope 1 and 2)
Scope Base year start Base year end Base year emissions (metric tonnes CO2e)
Scope 1 Jan. 1, 2015 Dec. 31, 2015 5,339,172
Scope 2 (location-based) Jan. 1, 2015 Dec. 31, 2015 193,613
Scope 2 (market-based) N/A N/A N/A
Emissions methodology
5.2 Protocol used to calculate Scope 1 and 2 emissions
The Greenhouse Gas Protocol: A Corporate Accounting and Reporting Standard (Revised Edition)

Emissions data
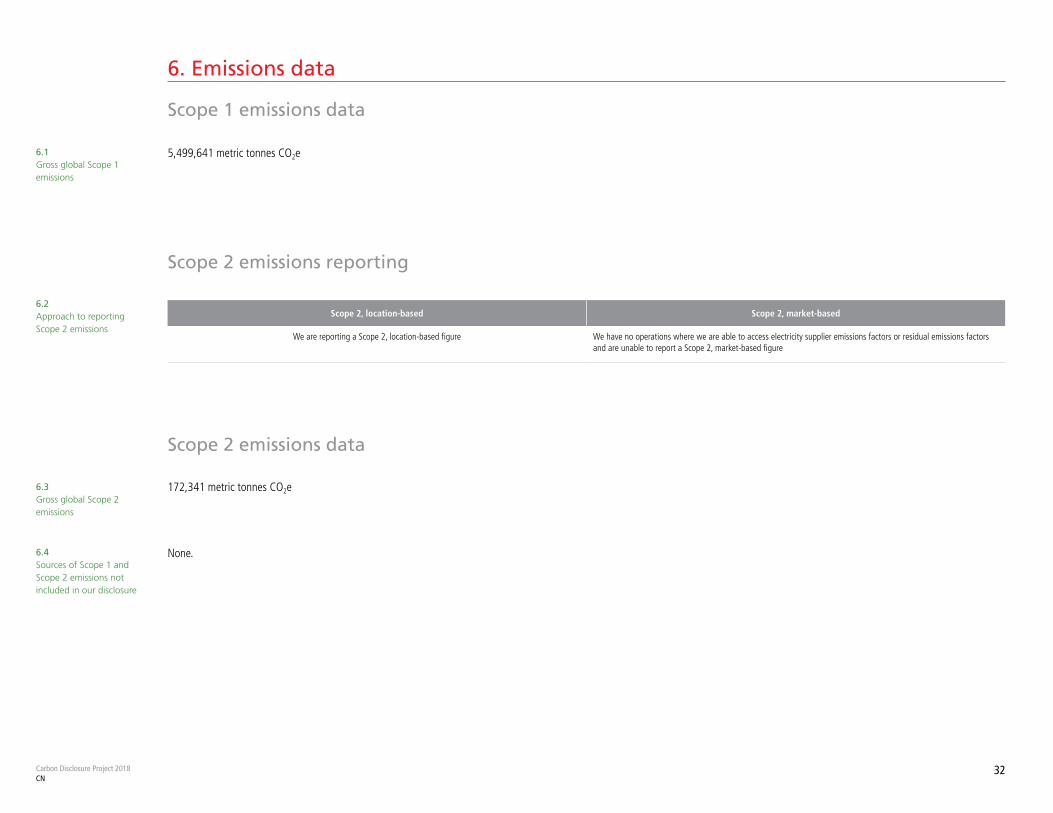
Carbon Disclosure Project 2018CN
32
6. Emissions data
Scope 1 emissions data
Scope 2 emissions reporting
Scope 2 emissions data
6.1 Gross global Scope 1 emissions
5,499,641 metric tonnes CO2e
6.2 Approach to reporting Scope 2 emissions
Scope 2, location-based Scope 2, market-based
We are reporting a Scope 2, location-based figure We have no operations where we are able to access electricity supplier emissions factors or residual emissions factors and are unable to report a Scope 2, market-based figure
172,341 metric tonnes CO2e
None.
6.3 Gross global Scope 2 emissions
6.4 Sources of Scope 1 and Scope 2 emissions not included in our disclosure
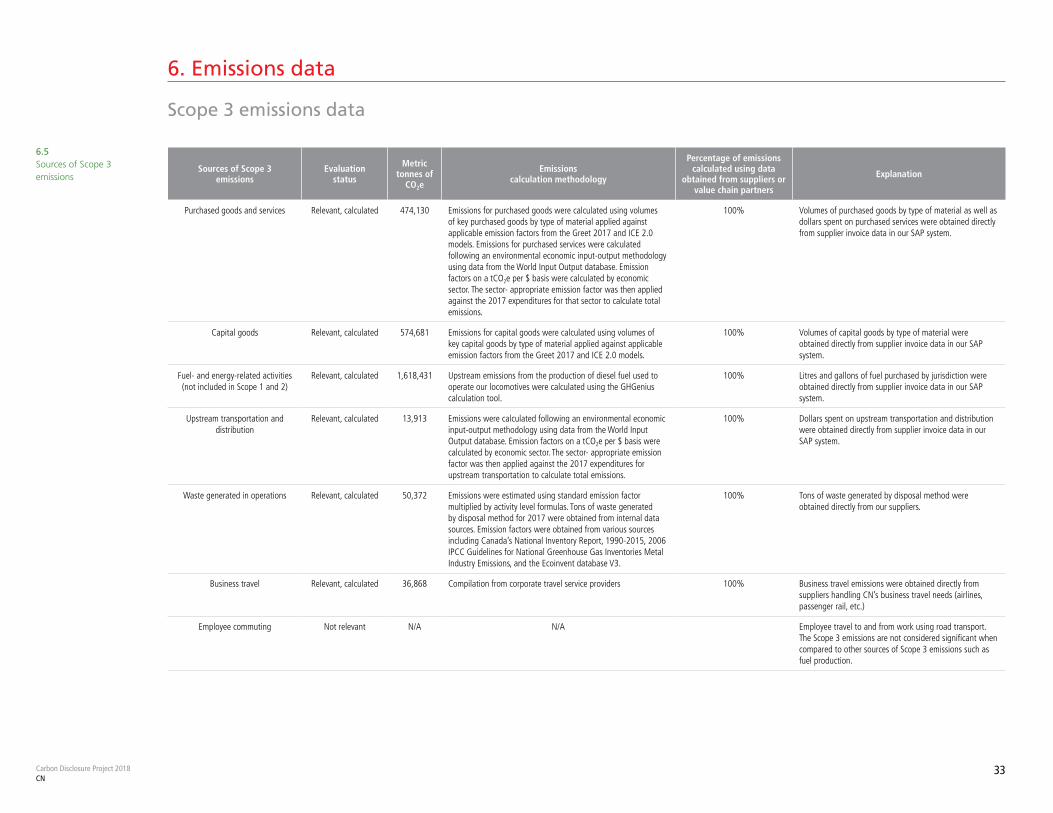
Carbon Disclosure Project 2018CN
33
6. Emissions data
Scope 3 emissions data
6.5 Sources of Scope 3 emissions
Sources of Scope 3 emissions
Evaluation status
Metric tonnes of
CO2e
Emissions calculation methodology
Percentage of emissions calculated using data
obtained from suppliers or value chain partners
Explanation
Purchased goods and services Relevant, calculated 474,130 Emissions for purchased goods were calculated using volumes of key purchased goods by type of material applied against applicable emission factors from the Greet 2017 and ICE 2.0 models. Emissions for purchased services were calculated following an environmental economic input-output methodology using data from the World Input Output database. Emission factors on a tCO2e per $ basis were calculated by economic sector. The sector- appropriate emission factor was then applied against the 2017 expenditures for that sector to calculate total emissions.
100% Volumes of purchased goods by type of material as well as dollars spent on purchased services were obtained directly from supplier invoice data in our SAP system.
Capital goods Relevant, calculated 574,681 Emissions for capital goods were calculated using volumes of key capital goods by type of material applied against applicable emission factors from the Greet 2017 and ICE 2.0 models.
100% Volumes of capital goods by type of material were obtained directly from supplier invoice data in our SAP system.
Fuel- and energy-related activities (not included in Scope 1 and 2)
Relevant, calculated 1,618,431 Upstream emissions from the production of diesel fuel used to operate our locomotives were calculated using the GHGenius calculation tool.
100% Litres and gallons of fuel purchased by jurisdiction were obtained directly from supplier invoice data in our SAP system.
Upstream transportation and distribution
Relevant, calculated 13,913 Emissions were calculated following an environmental economic input-output methodology using data from the World Input Output database. Emission factors on a tCO2e per $ basis were calculated by economic sector. The sector- appropriate emission factor was then applied against the 2017 expenditures for upstream transportation to calculate total emissions.
100% Dollars spent on upstream transportation and distribution were obtained directly from supplier invoice data in our SAP system.
Waste generated in operations Relevant, calculated 50,372 Emissions were estimated using standard emission factor multiplied by activity level formulas. Tons of waste generated by disposal method for 2017 were obtained from internal data sources. Emission factors were obtained from various sources including Canada’s National Inventory Report, 1990-2015, 2006 IPCC Guidelines for National Greenhouse Gas Inventories Metal Industry Emissions, and the Ecoinvent database V3.
100% Tons of waste generated by disposal method were obtained directly from our suppliers.
Business travel Relevant, calculated 36,868 Compilation from corporate travel service providers 100% Business travel emissions were obtained directly from suppliers handling CN’s business travel needs (airlines, passenger rail, etc.)
Employee commuting Not relevant N/A N/A Employee travel to and from work using road transport. The Scope 3 emissions are not considered significant when compared to other sources of Scope 3 emissions such as fuel production.
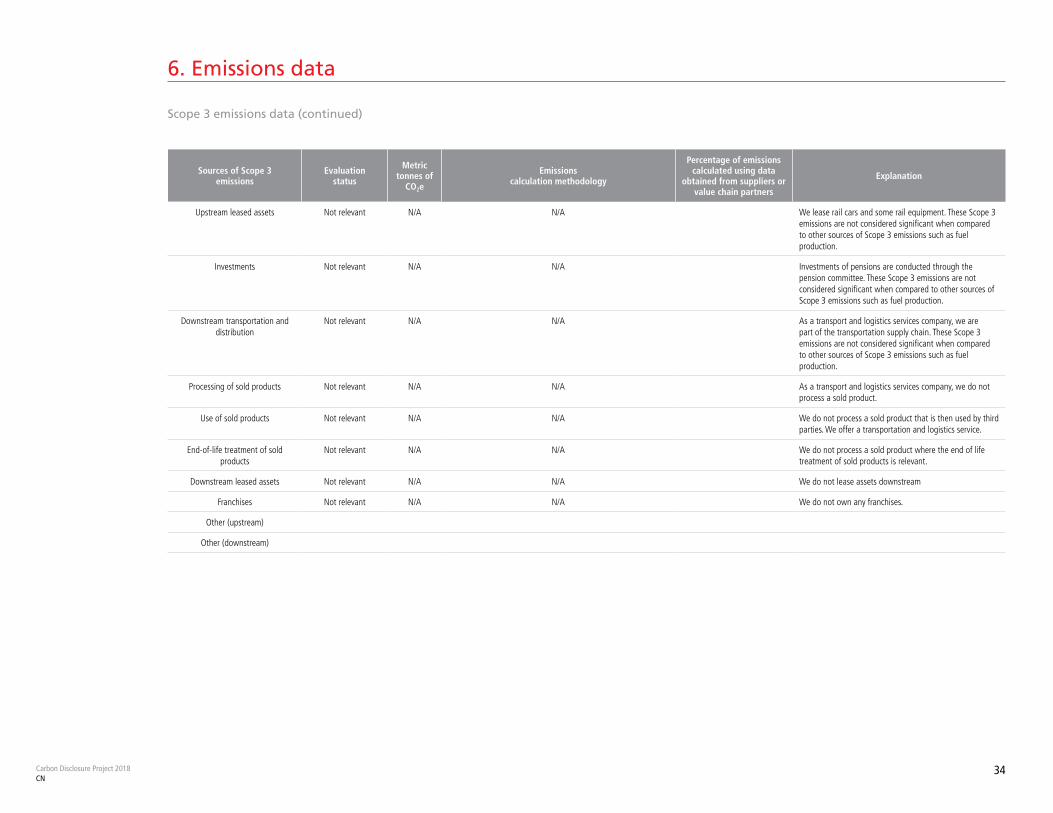
Carbon Disclosure Project 2018CN
34
6. Emissions data
Scope 3 emissions data (continued)
Sources of Scope 3 emissions
Evaluation status
Metric tonnes of
CO2e
Emissions calculation methodology
Percentage of emissions calculated using data
obtained from suppliers or value chain partners
Explanation
Upstream leased assets Not relevant N/A N/A We lease rail cars and some rail equipment. These Scope 3 emissions are not considered significant when compared to other sources of Scope 3 emissions such as fuel production.
Investments Not relevant N/A N/A Investments of pensions are conducted through the pension committee. These Scope 3 emissions are not considered significant when compared to other sources of Scope 3 emissions such as fuel production.
Downstream transportation and distribution
Not relevant N/A N/A As a transport and logistics services company, we are part of the transportation supply chain. These Scope 3 emissions are not considered significant when compared to other sources of Scope 3 emissions such as fuel production.
Processing of sold products Not relevant N/A N/A As a transport and logistics services company, we do not process a sold product.
Use of sold products Not relevant N/A N/A We do not process a sold product that is then used by third parties. We offer a transportation and logistics service.
End-of-life treatment of sold products
Not relevant N/A N/A We do not process a sold product where the end of life treatment of sold products is relevant.
Downstream leased assets Not relevant N/A N/A We do not lease assets downstream
Franchises Not relevant N/A N/A We do not own any franchises.
Other (upstream)
Other (downstream)
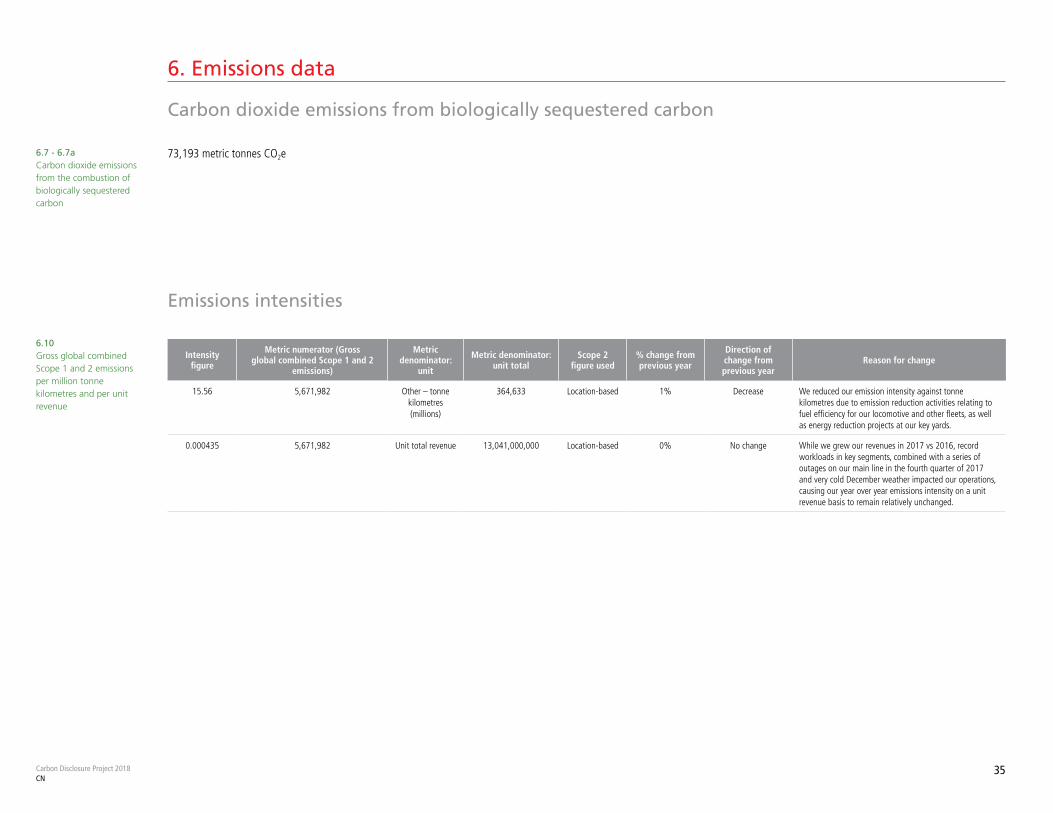
Carbon Disclosure Project 2018CN
35
6. Emissions data
Carbon dioxide emissions from biologically sequestered carbon
6.7 - 6.7a Carbon dioxide emissions from the combustion of biologically sequestered carbon
6.10 Gross global combined Scope 1 and 2 emissions per million tonne kilometres and per unit revenue
Intensity figure
Metric numerator (Gross global combined Scope 1 and 2
emissions)
Metric denominator:
unit
Metric denominator: unit total
Scope 2 figure used
% change from previous year
Direction of change from previous year
Reason for change
15.56 5,671,982 Other – tonne kilometres (millions)
364,633 Location-based 1% Decrease We reduced our emission intensity against tonne kilometres due to emission reduction activities relating to fuel efficiency for our locomotive and other fleets, as well as energy reduction projects at our key yards.
0.000435 5,671,982 Unit total revenue 13,041,000,000 Location-based 0% No change While we grew our revenues in 2017 vs 2016, record workloads in key segments, combined with a series of outages on our main line in the fourth quarter of 2017 and very cold December weather impacted our operations, causing our year over year emissions intensity on a unit revenue basis to remain relatively unchanged.
73,193 metric tonnes CO2e
Emissions intensities
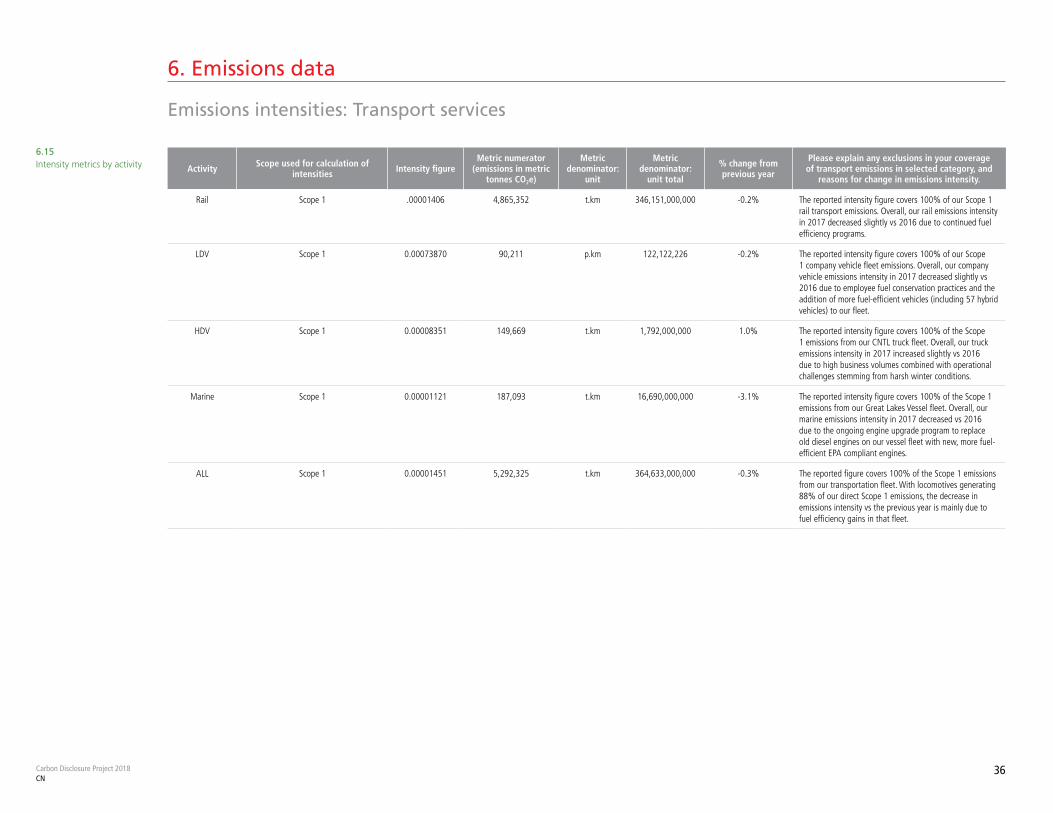
Carbon Disclosure Project 2018CN
36
6. Emissions data
Emissions intensities: Transport services
6.15 Intensity metrics by activity Activity Scope used for calculation of
intensities Intensity figureMetric numerator
(emissions in metric tonnes CO2e)
Metric denominator:
unit
Metric denominator:
unit total
% change from previous year
Please explain any exclusions in your coverage of transport emissions in selected category, and
reasons for change in emissions intensity.
Rail Scope 1 .00001406 4,865,352 t.km 346,151,000,000 -0.2% The reported intensity figure covers 100% of our Scope 1 rail transport emissions. Overall, our rail emissions intensity in 2017 decreased slightly vs 2016 due to continued fuel efficiency programs.
LDV Scope 1 0.00073870 90,211 p.km 122,122,226 -0.2% The reported intensity figure covers 100% of our Scope 1 company vehicle fleet emissions. Overall, our company vehicle emissions intensity in 2017 decreased slightly vs 2016 due to employee fuel conservation practices and the addition of more fuel-efficient vehicles (including 57 hybrid vehicles) to our fleet.
HDV Scope 1 0.00008351 149,669 t.km 1,792,000,000 1.0% The reported intensity figure covers 100% of the Scope 1 emissions from our CNTL truck fleet. Overall, our truck emissions intensity in 2017 increased slightly vs 2016 due to high business volumes combined with operational challenges stemming from harsh winter conditions.
Marine Scope 1 0.00001121 187,093 t.km 16,690,000,000 -3.1% The reported intensity figure covers 100% of the Scope 1 emissions from our Great Lakes Vessel fleet. Overall, our marine emissions intensity in 2017 decreased vs 2016 due to the ongoing engine upgrade program to replace old diesel engines on our vessel fleet with new, more fuel-efficient EPA compliant engines.
ALL Scope 1 0.00001451 5,292,325 t.km 364,633,000,000 -0.3% The reported figure covers 100% of the Scope 1 emissions from our transportation fleet. With locomotives generating 88% of our direct Scope 1 emissions, the decrease in emissions intensity vs the previous year is mainly due to fuel efficiency gains in that fleet.
Emissions breakdown
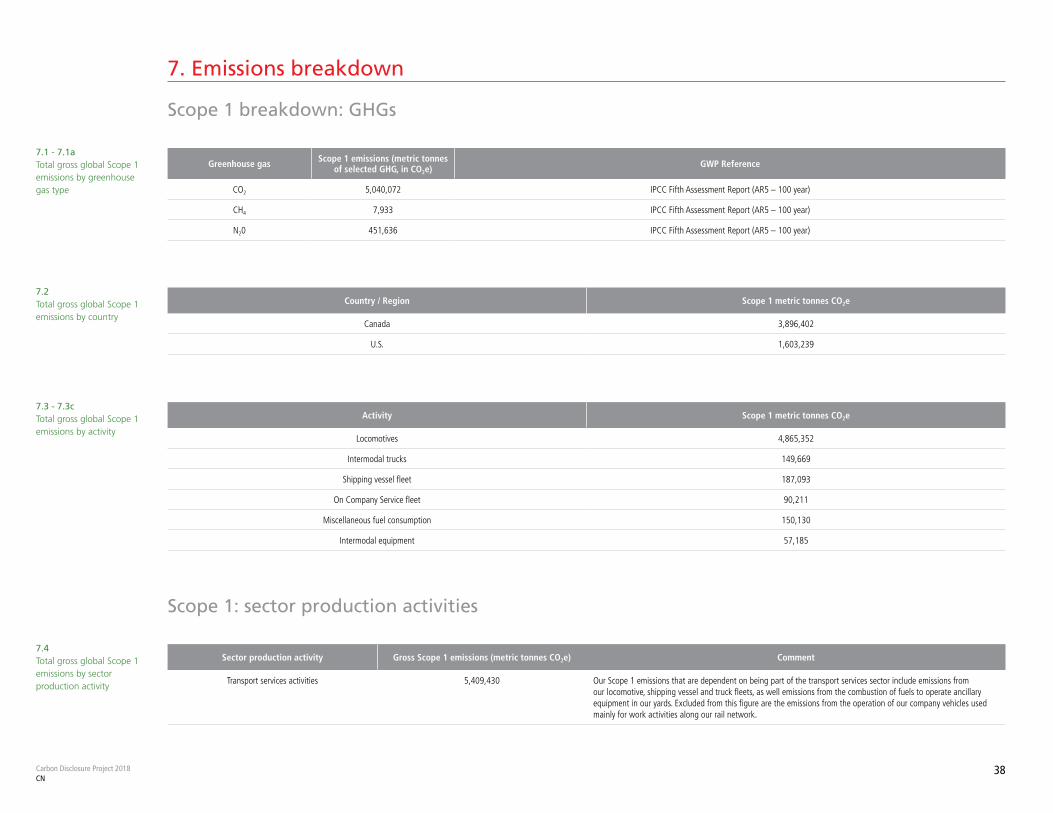
Carbon Disclosure Project 2018CN
38
7. Emissions breakdown
Scope 1 breakdown: GHGs
7.1 - 7.1a Total gross global Scope 1 emissions by greenhouse gas type
Greenhouse gas Scope 1 emissions (metric tonnes of selected GHG, in CO2e) GWP Reference
CO2 5,040,072 IPCC Fifth Assessment Report (AR5 – 100 year)
CH4 7,933 IPCC Fifth Assessment Report (AR5 – 100 year)
N20 451,636 IPCC Fifth Assessment Report (AR5 – 100 year)
7.2 Total gross global Scope 1 emissions by country
Country / Region Scope 1 metric tonnes CO2e
Canada 3,896,402
U.S. 1,603,239
7.3 - 7.3c Total gross global Scope 1 emissions by activity
7.4 Total gross global Scope 1 emissions by sector production activity
Activity Scope 1 metric tonnes CO2e
Locomotives 4,865,352
Intermodal trucks 149,669
Shipping vessel fleet 187,093
On Company Service fleet 90,211
Miscellaneous fuel consumption 150,130
Intermodal equipment 57,185
Sector production activity Gross Scope 1 emissions (metric tonnes CO2e) Comment
Transport services activities 5,409,430 Our Scope 1 emissions that are dependent on being part of the transport services sector include emissions from our locomotive, shipping vessel and truck fleets, as well emissions from the combustion of fuels to operate ancillary equipment in our yards. Excluded from this figure are the emissions from the operation of our company vehicles used mainly for work activities along our rail network.
Scope 1: sector production activities
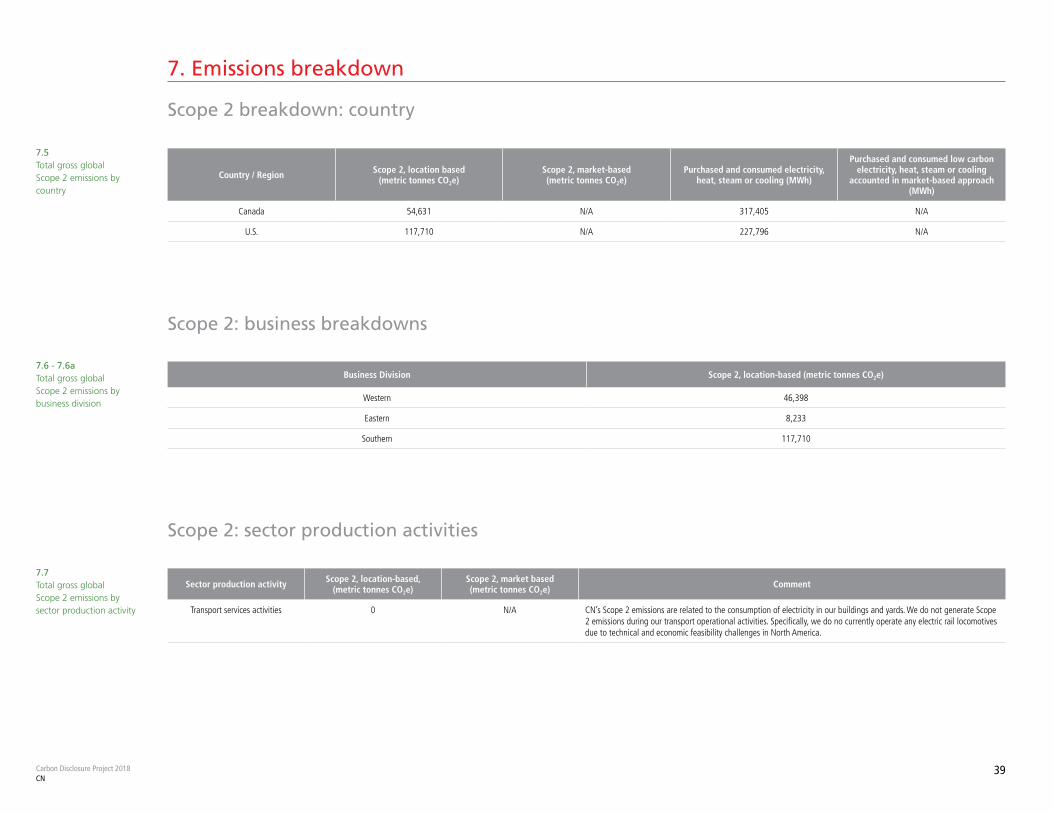
Carbon Disclosure Project 2018CN
39
7. Emissions breakdown
Scope 2 breakdown: country
7.5 Total gross global Scope 2 emissions by country
Country / Region Scope 2, location based (metric tonnes CO2e)
Scope 2, market-based (metric tonnes CO2e)
Purchased and consumed electricity, heat, steam or cooling (MWh)
Purchased and consumed low carbon electricity, heat, steam or cooling
accounted in market-based approach (MWh)
Canada 54,631 N/A 317,405 N/A
U.S. 117,710 N/A 227,796 N/A
7.6 - 7.6a Total gross global Scope 2 emissions by business division
Sector production activity Scope 2, location-based, (metric tonnes CO2e)
Scope 2, market based (metric tonnes CO2e) Comment
Transport services activities 0 N/A CN’s Scope 2 emissions are related to the consumption of electricity in our buildings and yards. We do not generate Scope 2 emissions during our transport operational activities. Specifically, we do no currently operate any electric rail locomotives due to technical and economic feasibility challenges in North America.
Scope 2: sector production activities
Scope 2: business breakdowns
Business Division Scope 2, location-based (metric tonnes CO2e)
Western 46,398
Eastern 8,233
Southern 117,710
7.7 Total gross global Scope 2 emissions by sector production activity
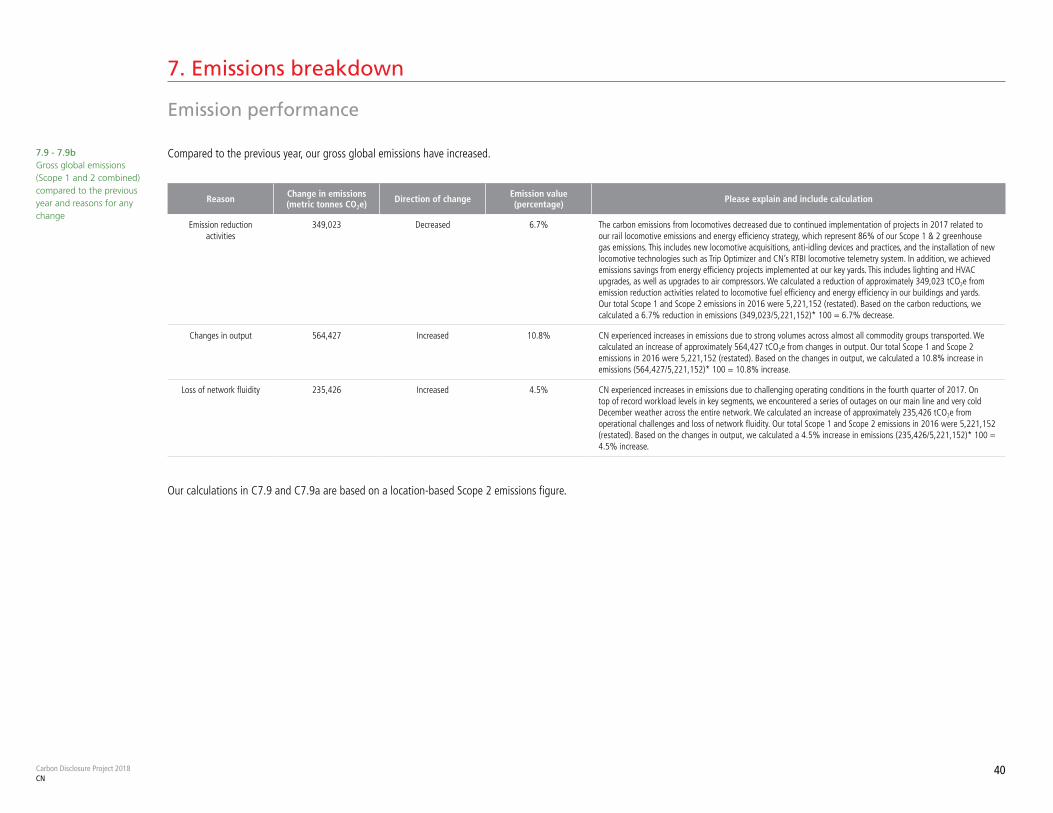
Carbon Disclosure Project 2018CN
40
7.9 - 7.9b Gross global emissions (Scope 1 and 2 combined) compared to the previous year and reasons for any change
Reason Change in emissions (metric tonnes CO2e) Direction of change Emission value
(percentage) Please explain and include calculation
Emission reduction activities
349,023 Decreased 6.7% The carbon emissions from locomotives decreased due to continued implementation of projects in 2017 related to our rail locomotive emissions and energy efficiency strategy, which represent 86% of our Scope 1 & 2 greenhouse gas emissions. This includes new locomotive acquisitions, anti-idling devices and practices, and the installation of new locomotive technologies such as Trip Optimizer and CN’s RTBI locomotive telemetry system. In addition, we achieved emissions savings from energy efficiency projects implemented at our key yards. This includes lighting and HVAC upgrades, as well as upgrades to air compressors. We calculated a reduction of approximately 349,023 tCO2e from emission reduction activities related to locomotive fuel efficiency and energy efficiency in our buildings and yards. Our total Scope 1 and Scope 2 emissions in 2016 were 5,221,152 (restated). Based on the carbon reductions, we calculated a 6.7% reduction in emissions (349,023/5,221,152)* 100 = 6.7% decrease.
Changes in output 564,427 Increased 10.8% CN experienced increases in emissions due to strong volumes across almost all commodity groups transported. We calculated an increase of approximately 564,427 tCO2e from changes in output. Our total Scope 1 and Scope 2 emissions in 2016 were 5,221,152 (restated). Based on the changes in output, we calculated a 10.8% increase in emissions (564,427/5,221,152)* 100 = 10.8% increase.
Loss of network fluidity 235,426 Increased 4.5% CN experienced increases in emissions due to challenging operating conditions in the fourth quarter of 2017. On top of record workload levels in key segments, we encountered a series of outages on our main line and very cold December weather across the entire network. We calculated an increase of approximately 235,426 tCO2e from operational challenges and loss of network fluidity. Our total Scope 1 and Scope 2 emissions in 2016 were 5,221,152 (restated). Based on the changes in output, we calculated a 4.5% increase in emissions (235,426/5,221,152)* 100 = 4.5% increase.
Compared to the previous year, our gross global emissions have increased.
7. Emissions breakdown
Emission performance
Our calculations in C7.9 and C7.9a are based on a location-based Scope 2 emissions figure.

Energy
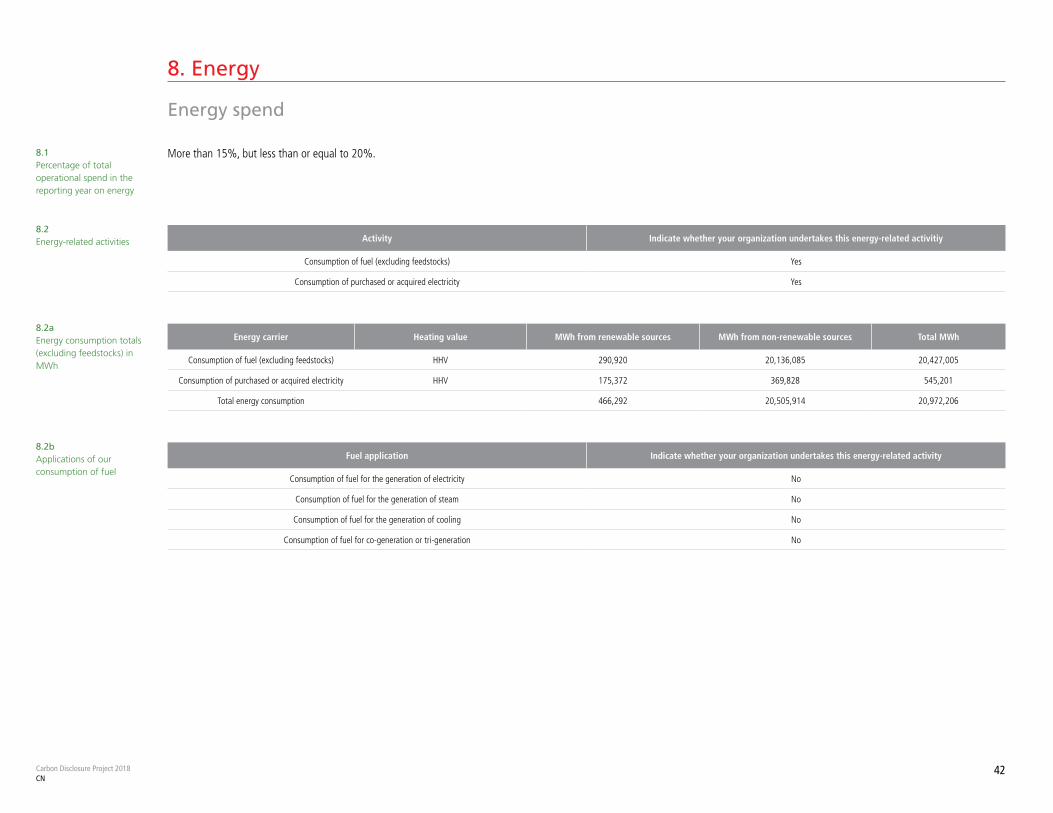
Carbon Disclosure Project 2018CN
42
8. Energy
Energy spend
8.2aEnergy consumption totals (excluding feedstocks) in MWh
8.1Percentage of total operational spend in the reporting year on energy
8.2Energy-related activities
8.2bApplications of our consumption of fuel
Fuel application Indicate whether your organization undertakes this energy-related activity
Consumption of fuel for the generation of electricity No
Consumption of fuel for the generation of steam No
Consumption of fuel for the generation of cooling No
Consumption of fuel for co-generation or tri-generation No
Energy carrier Heating value MWh from renewable sources MWh from non-renewable sources Total MWh
Consumption of fuel (excluding feedstocks) HHV 290,920 20,136,085 20,427,005
Consumption of purchased or acquired electricity HHV 175,372 369,828 545,201
Total energy consumption 466,292 20,505,914 20,972,206
More than 15%, but less than or equal to 20%.
Activity Indicate whether your organization undertakes this energy-related activitiy
Consumption of fuel (excluding feedstocks) Yes
Consumption of purchased or acquired electricity Yes
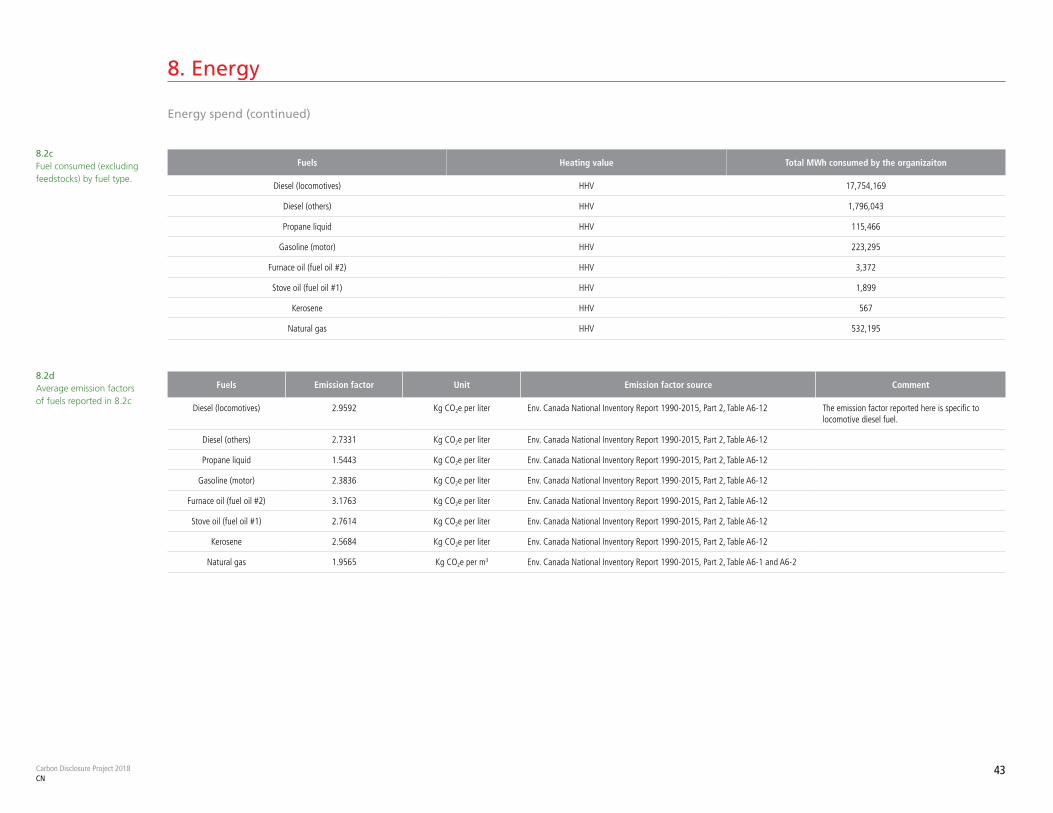
Carbon Disclosure Project 2018CN
43
8. Energy
Energy spend (continued)
Fuels Heating value Total MWh consumed by the organizaiton
Diesel (locomotives) HHV 17,754,169
Diesel (others) HHV 1,796,043
Propane liquid HHV 115,466
Gasoline (motor) HHV 223,295
Furnace oil (fuel oil #2) HHV 3,372
Stove oil (fuel oil #1) HHV 1,899
Kerosene HHV 567
Natural gas HHV 532,195
8.2cFuel consumed (excluding feedstocks) by fuel type.
8.2dAverage emission factors of fuels reported in 8.2c
Fuels Emission factor Unit Emission factor source Comment
Diesel (locomotives) 2.9592 Kg CO2e per liter Env. Canada National Inventory Report 1990-2015, Part 2, Table A6-12 The emission factor reported here is specific to locomotive diesel fuel.
Diesel (others) 2.7331 Kg CO2e per liter Env. Canada National Inventory Report 1990-2015, Part 2, Table A6-12
Propane liquid 1.5443 Kg CO2e per liter Env. Canada National Inventory Report 1990-2015, Part 2, Table A6-12
Gasoline (motor) 2.3836 Kg CO2e per liter Env. Canada National Inventory Report 1990-2015, Part 2, Table A6-12
Furnace oil (fuel oil #2) 3.1763 Kg CO2e per liter Env. Canada National Inventory Report 1990-2015, Part 2, Table A6-12
Stove oil (fuel oil #1) 2.7614 Kg CO2e per liter Env. Canada National Inventory Report 1990-2015, Part 2, Table A6-12
Kerosene 2.5684 Kg CO2e per liter Env. Canada National Inventory Report 1990-2015, Part 2, Table A6-12
Natural gas 1.9565 Kg CO2e per m3 Env. Canada National Inventory Report 1990-2015, Part 2, Table A6-1 and A6-2
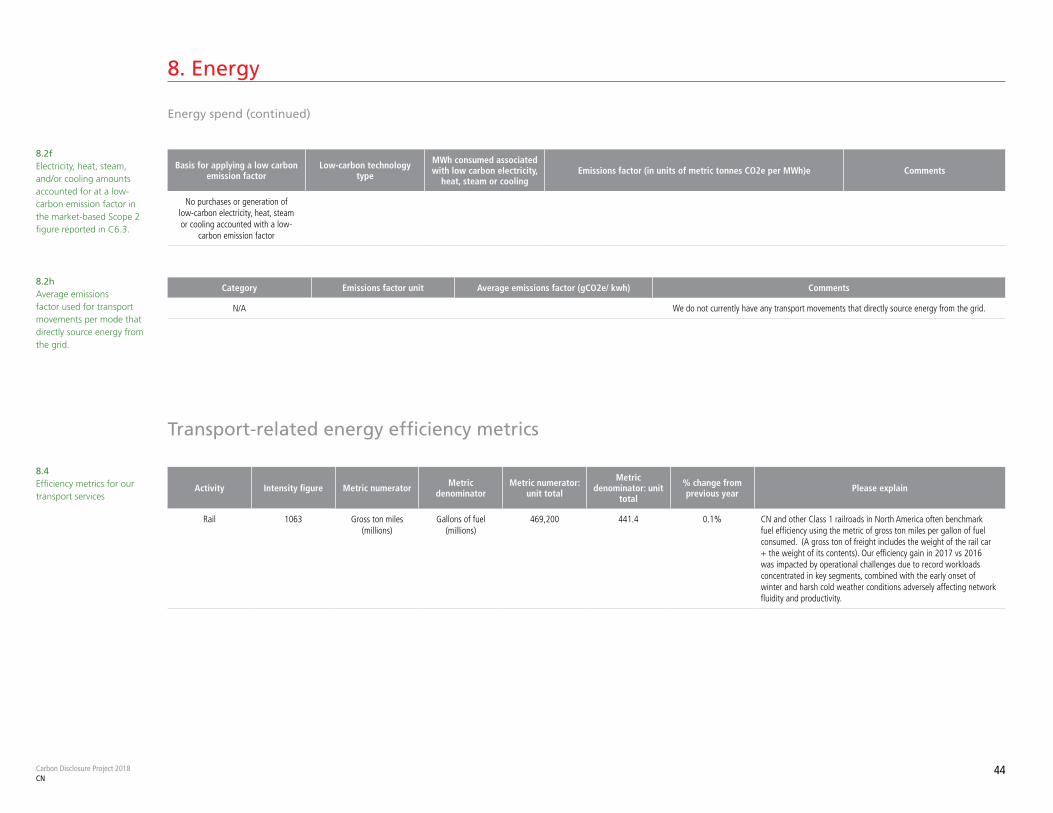
Carbon Disclosure Project 2018CN
44
8. Energy
Energy spend (continued)
Transport-related energy efficiency metrics
8.2fElectricity, heat, steam, and/or cooling amounts accounted for at a low-carbon emission factor in the market-based Scope 2 figure reported in C6.3.
8.2hAverage emissions factor used for transport movements per mode that directly source energy from the grid.
8.4Efficiency metrics for our transport services
Basis for applying a low carbon emission factor
Low-carbon technology type
MWh consumed associated with low carbon electricity,
heat, steam or coolingEmissions factor (in units of metric tonnes CO2e per MWh)e Comments
No purchases or generation of low-carbon electricity, heat, steam or cooling accounted with a low-
carbon emission factor
Activity Intensity figure Metric numerator Metric denominator
Metric numerator: unit total
Metric denominator: unit
total
% change from previous year Please explain
Rail 1063 Gross ton miles (millions)
Gallons of fuel (millions)
469,200 441.4 0.1% CN and other Class 1 railroads in North America often benchmark fuel efficiency using the metric of gross ton miles per gallon of fuel consumed. (A gross ton of freight includes the weight of the rail car + the weight of its contents). Our efficiency gain in 2017 vs 2016 was impacted by operational challenges due to record workloads concentrated in key segments, combined with the early onset of winter and harsh cold weather conditions adversely affecting network fluidity and productivity.
Category Emissions factor unit Average emissions factor (gCO2e/ kwh) Comments
N/A We do not currently have any transport movements that directly source energy from the grid.

Additional metrics
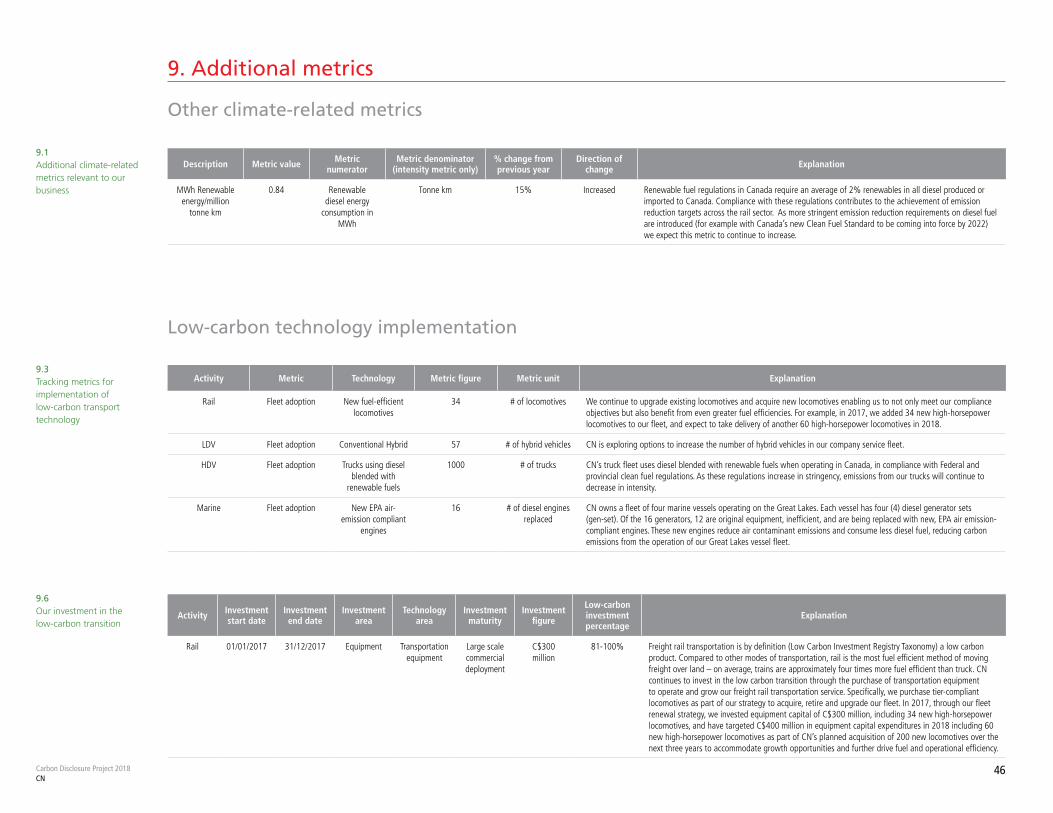
Carbon Disclosure Project 2018CN
46
9. Additional metrics
Other climate-related metrics
9.1Additional climate-related metrics relevant to our business
9.3Tracking metrics for implementation of low-carbon transport technology
9.6Our investment in the low-carbon transition
Description Metric value Metric numerator
Metric denominator (intensity metric only)
% change from previous year
Direction of change Explanation
MWh Renewable energy/million
tonne km
0.84 Renewable diesel energy
consumption in MWh
Tonne km 15% Increased Renewable fuel regulations in Canada require an average of 2% renewables in all diesel produced or imported to Canada. Compliance with these regulations contributes to the achievement of emission reduction targets across the rail sector. As more stringent emission reduction requirements on diesel fuel are introduced (for example with Canada’s new Clean Fuel Standard to be coming into force by 2022) we expect this metric to continue to increase.
Activity Metric Technology Metric figure Metric unit Explanation
Rail Fleet adoption New fuel-efficient locomotives
34 # of locomotives We continue to upgrade existing locomotives and acquire new locomotives enabling us to not only meet our compliance objectives but also benefit from even greater fuel efficiencies. For example, in 2017, we added 34 new high-horsepower locomotives to our fleet, and expect to take delivery of another 60 high-horsepower locomotives in 2018.
LDV Fleet adoption Conventional Hybrid 57 # of hybrid vehicles CN is exploring options to increase the number of hybrid vehicles in our company service fleet.
HDV Fleet adoption Trucks using diesel blended with
renewable fuels
1000 # of trucks CN’s truck fleet uses diesel blended with renewable fuels when operating in Canada, in compliance with Federal and provincial clean fuel regulations. As these regulations increase in stringency, emissions from our trucks will continue to decrease in intensity.
Marine Fleet adoption New EPA air-emission compliant
engines
16 # of diesel engines replaced
CN owns a fleet of four marine vessels operating on the Great Lakes. Each vessel has four (4) diesel generator sets (gen-set). Of the 16 generators, 12 are original equipment, inefficient, and are being replaced with new, EPA air emission-compliant engines. These new engines reduce air contaminant emissions and consume less diesel fuel, reducing carbon emissions from the operation of our Great Lakes vessel fleet.
Activity Investment start date
Investment end date
Investment area
Technology area
Investment maturity
Investment figure
Low-carbon investment percentage
Explanation
Rail 01/01/2017 31/12/2017 Equipment Transportation equipment
Large scale commercial deployment
C$300 million
81-100% Freight rail transportation is by definition (Low Carbon Investment Registry Taxonomy) a low carbon product. Compared to other modes of transportation, rail is the most fuel efficient method of moving freight over land – on average, trains are approximately four times more fuel efficient than truck. CN continues to invest in the low carbon transition through the purchase of transportation equipment to operate and grow our freight rail transportation service. Specifically, we purchase tier-compliant locomotives as part of our strategy to acquire, retire and upgrade our fleet. In 2017, through our fleet renewal strategy, we invested equipment capital of C$300 million, including 34 new high-horsepower locomotives, and have targeted C$400 million in equipment capital expenditures in 2018 including 60 new high-horsepower locomotives as part of CN’s planned acquisition of 200 new locomotives over the next three years to accommodate growth opportunities and further drive fuel and operational efficiency.
Low-carbon technology implementation

Verification
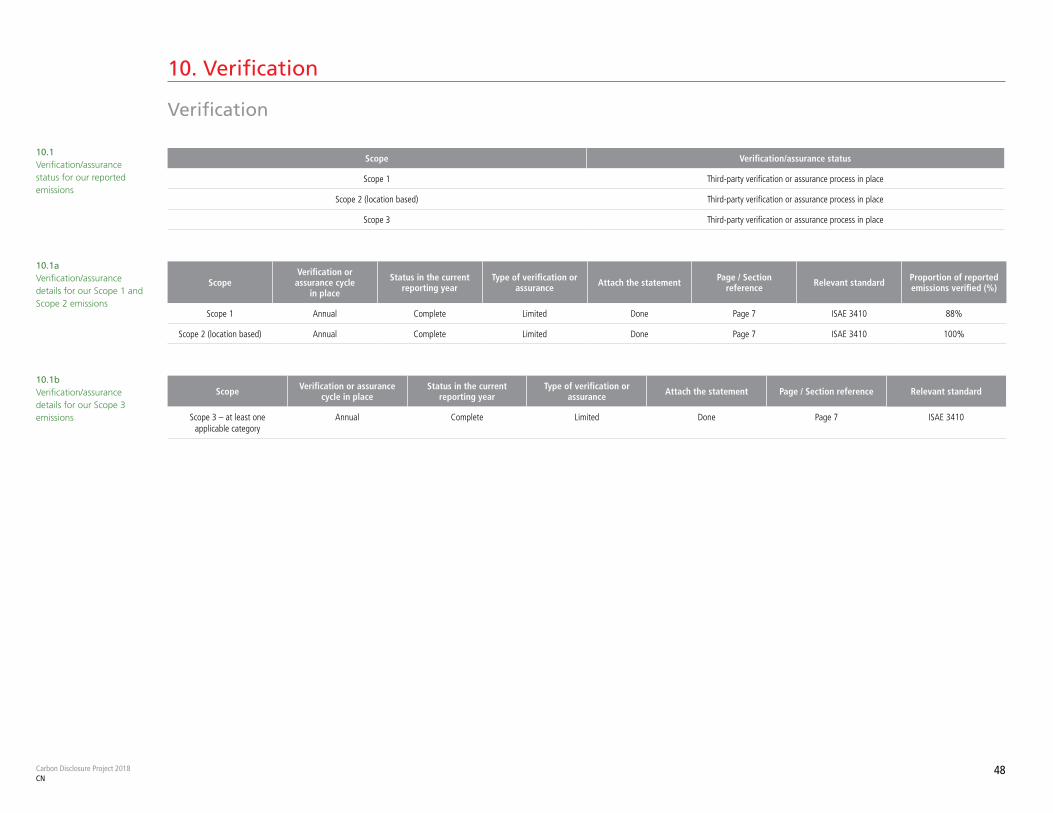
Carbon Disclosure Project 2018CN
48
10. Verification
Verification
10.1aVerification/assurance details for our Scope 1 and Scope 2 emissions
10.1Verification/assurance status for our reported emissions
10.1bVerification/assurance details for our Scope 3 emissions
ScopeVerification or assurance cycle
in place
Status in the current reporting year
Type of verification or assurance Attach the statement Page / Section
reference Relevant standard Proportion of reported emissions verified (%)
Scope 1 Annual Complete Limited Done Page 7 ISAE 3410 88%
Scope 2 (location based) Annual Complete Limited Done Page 7 ISAE 3410 100%
Scope Verification/assurance status
Scope 1 Third-party verification or assurance process in place
Scope 2 (location based) Third-party verification or assurance process in place
Scope 3 Third-party verification or assurance process in place
Scope Verification or assurance cycle in place
Status in the current reporting year
Type of verification or assurance Attach the statement Page / Section reference Relevant standard
Scope 3 – at least one applicable category
Annual Complete Limited Done Page 7 ISAE 3410
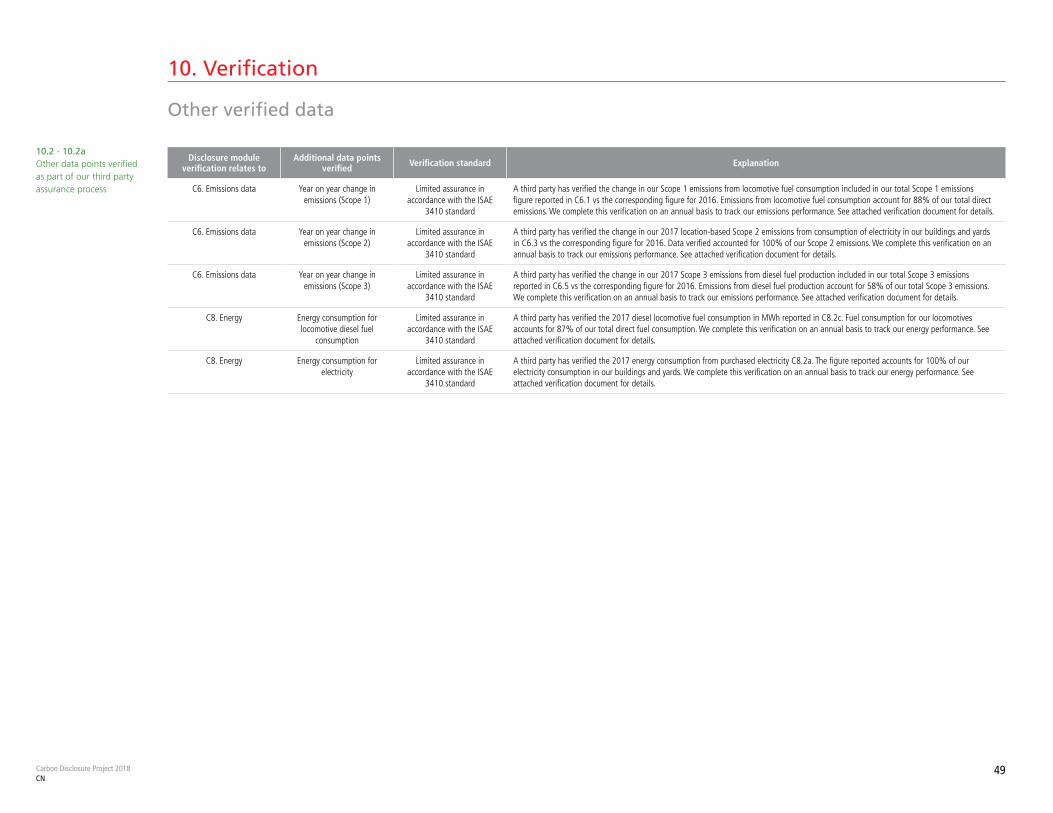
Carbon Disclosure Project 2018CN
49
10.2 - 10.2aOther data points verified as part of our third party assurance process
Disclosure module verification relates to
Additional data points verified Verification standard Explanation
C6. Emissions data Year on year change in emissions (Scope 1)
Limited assurance in accordance with the ISAE
3410 standard
A third party has verified the change in our Scope 1 emissions from locomotive fuel consumption included in our total Scope 1 emissions figure reported in C6.1 vs the corresponding figure for 2016. Emissions from locomotive fuel consumption account for 88% of our total direct emissions. We complete this verification on an annual basis to track our emissions performance. See attached verification document for details.
C6. Emissions data Year on year change in emissions (Scope 2)
Limited assurance in accordance with the ISAE
3410 standard
A third party has verified the change in our 2017 location-based Scope 2 emissions from consumption of electricity in our buildings and yards in C6.3 vs the corresponding figure for 2016. Data verified accounted for 100% of our Scope 2 emissions. We complete this verification on an annual basis to track our emissions performance. See attached verification document for details.
C6. Emissions data Year on year change in emissions (Scope 3)
Limited assurance in accordance with the ISAE
3410 standard
A third party has verified the change in our 2017 Scope 3 emissions from diesel fuel production included in our total Scope 3 emissions reported in C6.5 vs the corresponding figure for 2016. Emissions from diesel fuel production account for 58% of our total Scope 3 emissions. We complete this verification on an annual basis to track our emissions performance. See attached verification document for details.
C8. Energy Energy consumption for locomotive diesel fuel
consumption
Limited assurance in accordance with the ISAE
3410 standard
A third party has verified the 2017 diesel locomotive fuel consumption in MWh reported in C8.2c. Fuel consumption for our locomotives accounts for 87% of our total direct fuel consumption. We complete this verification on an annual basis to track our energy performance. See attached verification document for details.
C8. Energy Energy consumption for electricity
Limited assurance in accordance with the ISAE
3410 standard
A third party has verified the 2017 energy consumption from purchased electricity C8.2a. The figure reported accounts for 100% of our electricity consumption in our buildings and yards. We complete this verification on an annual basis to track our energy performance. See attached verification document for details.
10. Verification
Other verified data
Carbon pricing
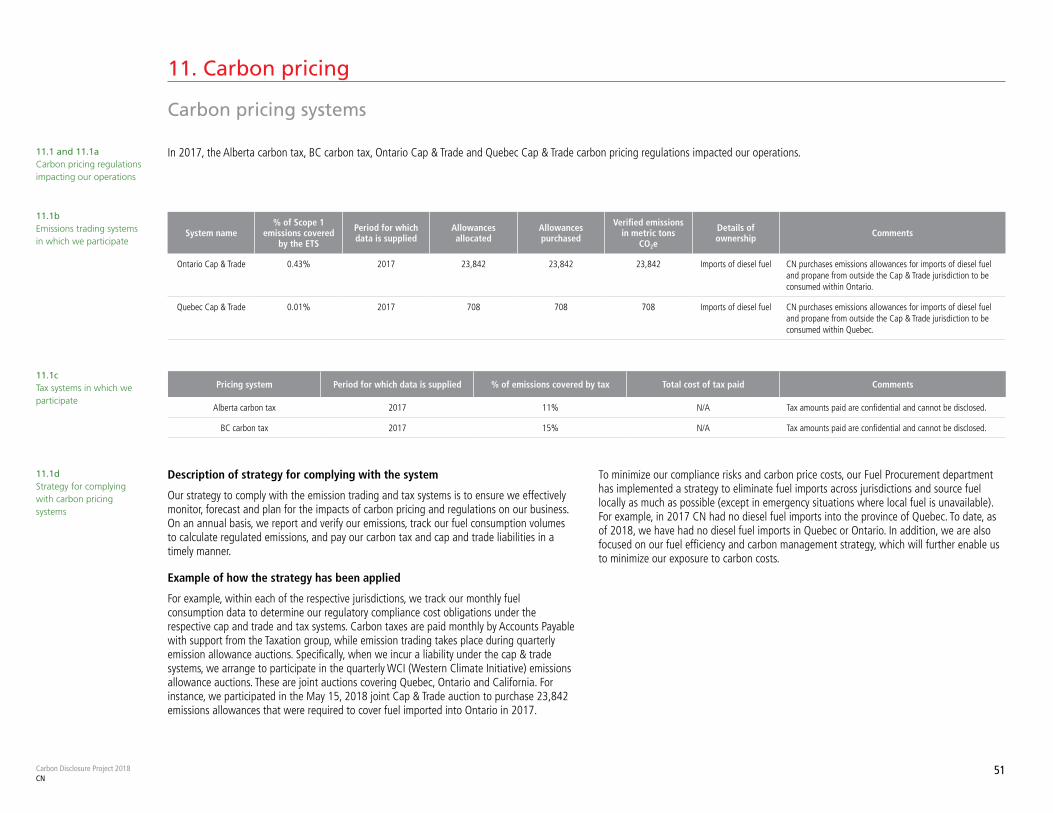
Carbon Disclosure Project 2018CN
51
11. Carbon pricing
Carbon pricing systems
11.1bEmissions trading systems in which we participate
11.1 and 11.1aCarbon pricing regulations impacting our operations
11.1cTax systems in which we participate
11.1dStrategy for complying with carbon pricing systems
System name% of Scope 1
emissions covered by the ETS
Period for which data is supplied
Allowances allocated
Allowances purchased
Verified emissions in metric tons
CO2e
Details of ownership Comments
Ontario Cap & Trade 0.43% 2017 23,842 23,842 23,842 Imports of diesel fuel CN purchases emissions allowances for imports of diesel fuel and propane from outside the Cap & Trade jurisdiction to be consumed within Ontario.
Quebec Cap & Trade 0.01% 2017 708 708 708 Imports of diesel fuel CN purchases emissions allowances for imports of diesel fuel and propane from outside the Cap & Trade jurisdiction to be consumed within Quebec.
Pricing system Period for which data is supplied % of emissions covered by tax Total cost of tax paid Comments
Alberta carbon tax 2017 11% N/A Tax amounts paid are confidential and cannot be disclosed.
BC carbon tax 2017 15% N/A Tax amounts paid are confidential and cannot be disclosed.
Description of strategy for complying with the system
Our strategy to comply with the emission trading and tax systems is to ensure we effectively monitor, forecast and plan for the impacts of carbon pricing and regulations on our business. On an annual basis, we report and verify our emissions, track our fuel consumption volumes to calculate regulated emissions, and pay our carbon tax and cap and trade liabilities in a timely manner.
Example of how the strategy has been applied
For example, within each of the respective jurisdictions, we track our monthly fuel consumption data to determine our regulatory compliance cost obligations under the respective cap and trade and tax systems. Carbon taxes are paid monthly by Accounts Payable with support from the Taxation group, while emission trading takes place during quarterly emission allowance auctions. Specifically, when we incur a liability under the cap & trade systems, we arrange to participate in the quarterly WCI (Western Climate Initiative) emissions allowance auctions. These are joint auctions covering Quebec, Ontario and California. For instance, we participated in the May 15, 2018 joint Cap & Trade auction to purchase 23,842 emissions allowances that were required to cover fuel imported into Ontario in 2017.
To minimize our compliance risks and carbon price costs, our Fuel Procurement department has implemented a strategy to eliminate fuel imports across jurisdictions and source fuel locally as much as possible (except in emergency situations where local fuel is unavailable). For example, in 2017 CN had no diesel fuel imports into the province of Quebec. To date, as of 2018, we have had no diesel fuel imports in Quebec or Ontario. In addition, we are also focused on our fuel efficiency and carbon management strategy, which will further enable us to minimize our exposure to carbon costs.
In 2017, the Alberta carbon tax, BC carbon tax, Ontario Cap & Trade and Quebec Cap & Trade carbon pricing regulations impacted our operations.
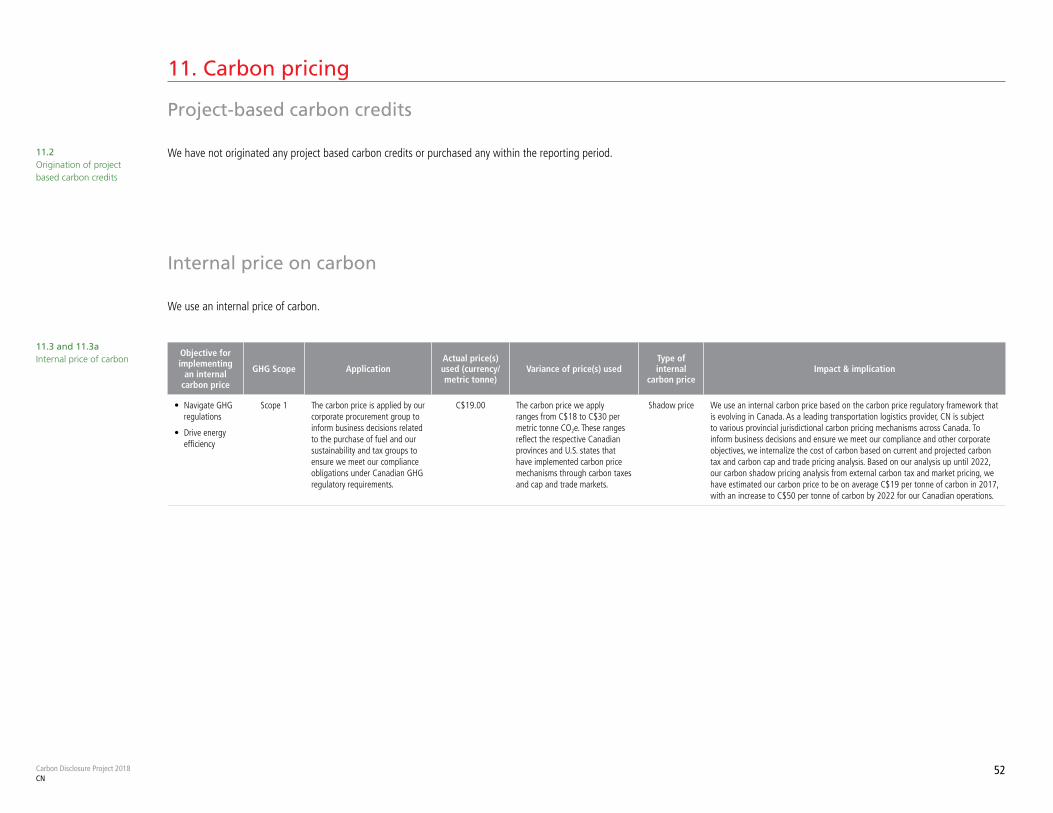
Carbon Disclosure Project 2018CN
52
11. Carbon pricing
Project-based carbon credits
11.2Origination of project based carbon credits
We have not originated any project based carbon credits or purchased any within the reporting period.
Internal price on carbon
We use an internal price of carbon.
11.3 and 11.3aInternal price of carbon
Objective for implementing
an internal carbon price
GHG Scope ApplicationActual price(s) used (currency/ metric tonne)
Variance of price(s) usedType of internal
carbon priceImpact & implication
• Navigate GHG regulations
• Drive energy efficiency
Scope 1 The carbon price is applied by our corporate procurement group to inform business decisions related to the purchase of fuel and our sustainability and tax groups to ensure we meet our compliance obligations under Canadian GHG regulatory requirements.
C$19.00 The carbon price we apply ranges from C$18 to C$30 per metric tonne CO2e. These ranges reflect the respective Canadian provinces and U.S. states that have implemented carbon price mechanisms through carbon taxes and cap and trade markets.
Shadow price We use an internal carbon price based on the carbon price regulatory framework that is evolving in Canada. As a leading transportation logistics provider, CN is subject to various provincial jurisdictional carbon pricing mechanisms across Canada. To inform business decisions and ensure we meet our compliance and other corporate objectives, we internalize the cost of carbon based on current and projected carbon tax and carbon cap and trade pricing analysis. Based on our analysis up until 2022, our carbon shadow pricing analysis from external carbon tax and market pricing, we have estimated our carbon price to be on average C$19 per tonne of carbon in 2017, with an increase to C$50 per tonne of carbon by 2022 for our Canadian operations.

Engagement
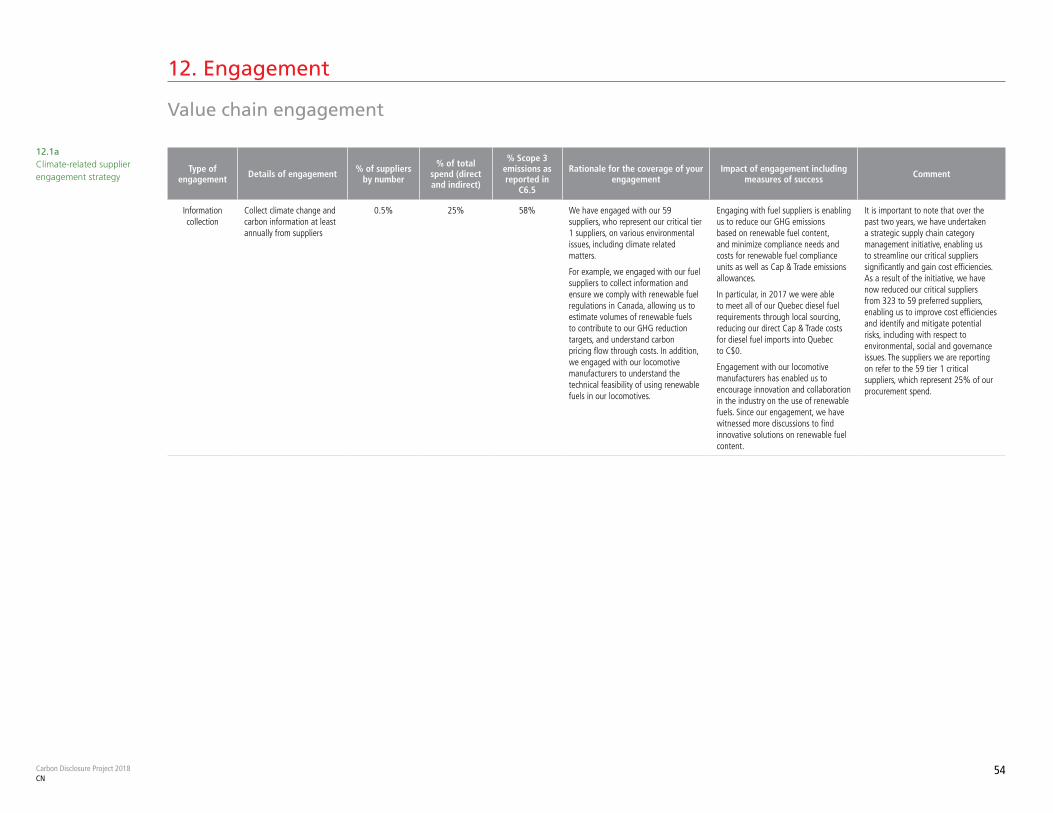
Carbon Disclosure Project 2018CN
54
12.1aClimate-related supplier engagement strategy
Type of engagement Details of engagement % of suppliers
by number
% of total spend (direct and indirect)
% Scope 3 emissions as reported in
C6.5
Rationale for the coverage of your engagement
Impact of engagement including measures of success Comment
Information collection
Collect climate change and carbon information at least annually from suppliers
0.5% 25% 58% We have engaged with our 59 suppliers, who represent our critical tier 1 suppliers, on various environmental issues, including climate related matters.
For example, we engaged with our fuel suppliers to collect information and ensure we comply with renewable fuel regulations in Canada, allowing us to estimate volumes of renewable fuels to contribute to our GHG reduction targets, and understand carbon pricing flow through costs. In addition, we engaged with our locomotive manufacturers to understand the technical feasibility of using renewable fuels in our locomotives.
Engaging with fuel suppliers is enabling us to reduce our GHG emissions based on renewable fuel content, and minimize compliance needs and costs for renewable fuel compliance units as well as Cap & Trade emissions allowances.
In particular, in 2017 we were able to meet all of our Quebec diesel fuel requirements through local sourcing, reducing our direct Cap & Trade costs for diesel fuel imports into Quebec to C$0.
Engagement with our locomotive manufacturers has enabled us to encourage innovation and collaboration in the industry on the use of renewable fuels. Since our engagement, we have witnessed more discussions to find innovative solutions on renewable fuel content.
It is important to note that over the past two years, we have undertaken a strategic supply chain category management initiative, enabling us to streamline our critical suppliers significantly and gain cost efficiencies. As a result of the initiative, we have now reduced our critical suppliers from 323 to 59 preferred suppliers, enabling us to improve cost efficiencies and identify and mitigate potential risks, including with respect to environmental, social and governance issues. The suppliers we are reporting on refer to the 59 tier 1 critical suppliers, which represent 25% of our procurement spend.
12. Engagement
Value chain engagement
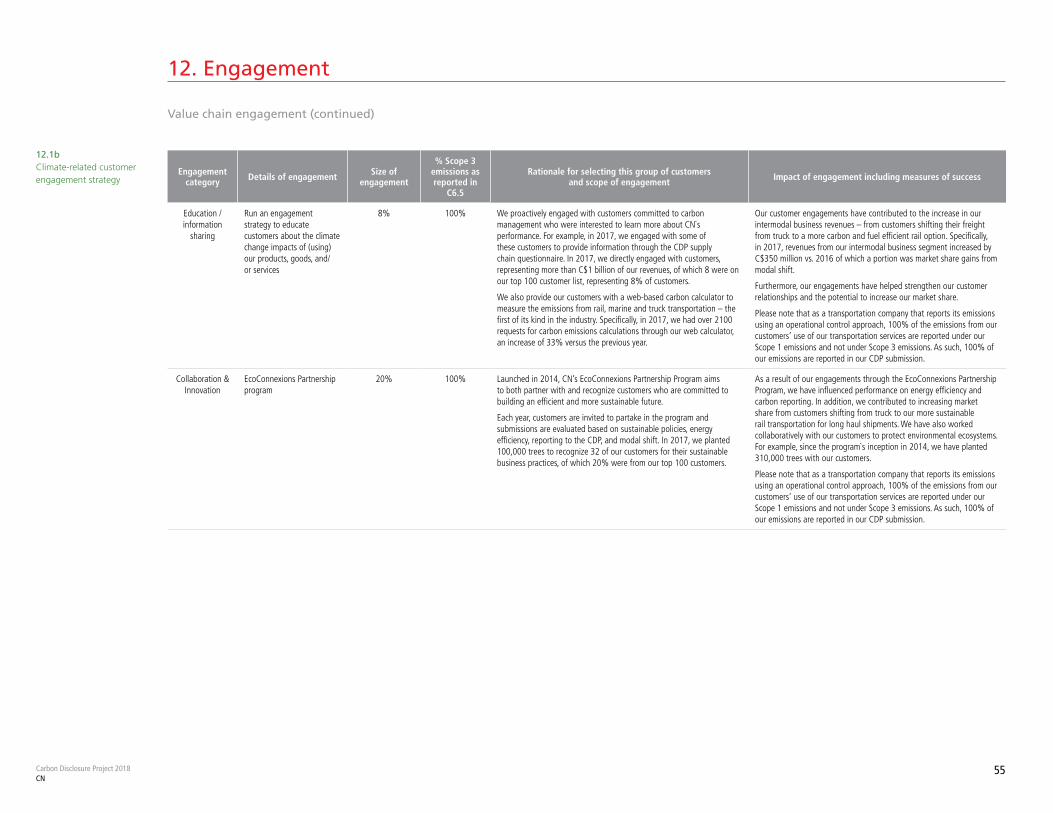
Carbon Disclosure Project 2018CN
55
12.1bClimate-related customer engagement strategy
Engagement category Details of engagement Size of
engagement
% Scope 3 emissions as reported in
C6.5
Rationale for selecting this group of customers and scope of engagement Impact of engagement including measures of success
Education / information
sharing
Run an engagement strategy to educate customers about the climate change impacts of (using) our products, goods, and/or services
8% 100% We proactively engaged with customers committed to carbon management who were interested to learn more about CN`s performance. For example, in 2017, we engaged with some of these customers to provide information through the CDP supply chain questionnaire. In 2017, we directly engaged with customers, representing more than C$1 billion of our revenues, of which 8 were on our top 100 customer list, representing 8% of customers.
We also provide our customers with a web-based carbon calculator to measure the emissions from rail, marine and truck transportation – the first of its kind in the industry. Specifically, in 2017, we had over 2100 requests for carbon emissions calculations through our web calculator, an increase of 33% versus the previous year.
Our customer engagements have contributed to the increase in our intermodal business revenues – from customers shifting their freight from truck to a more carbon and fuel efficient rail option. Specifically, in 2017, revenues from our intermodal business segment increased by C$350 million vs. 2016 of which a portion was market share gains from modal shift.
Furthermore, our engagements have helped strengthen our customer relationships and the potential to increase our market share.
Please note that as a transportation company that reports its emissions using an operational control approach, 100% of the emissions from our customers’ use of our transportation services are reported under our Scope 1 emissions and not under Scope 3 emissions. As such, 100% of our emissions are reported in our CDP submission.
Collaboration & Innovation
EcoConnexions Partnership program
20% 100% Launched in 2014, CN’s EcoConnexions Partnership Program aims to both partner with and recognize customers who are committed to building an efficient and more sustainable future.
Each year, customers are invited to partake in the program and submissions are evaluated based on sustainable policies, energy efficiency, reporting to the CDP, and modal shift. In 2017, we planted 100,000 trees to recognize 32 of our customers for their sustainable business practices, of which 20% were from our top 100 customers.
As a result of our engagements through the EcoConnexions Partnership Program, we have influenced performance on energy efficiency and carbon reporting. In addition, we contributed to increasing market share from customers shifting from truck to our more sustainable rail transportation for long haul shipments. We have also worked collaboratively with our customers to protect environmental ecosystems. For example, since the program`s inception in 2014, we have planted 310,000 trees with our customers.
Please note that as a transportation company that reports its emissions using an operational control approach, 100% of the emissions from our customers’ use of our transportation services are reported under our Scope 1 emissions and not under Scope 3 emissions. As such, 100% of our emissions are reported in our CDP submission.
12. Engagement
Value chain engagement (continued)
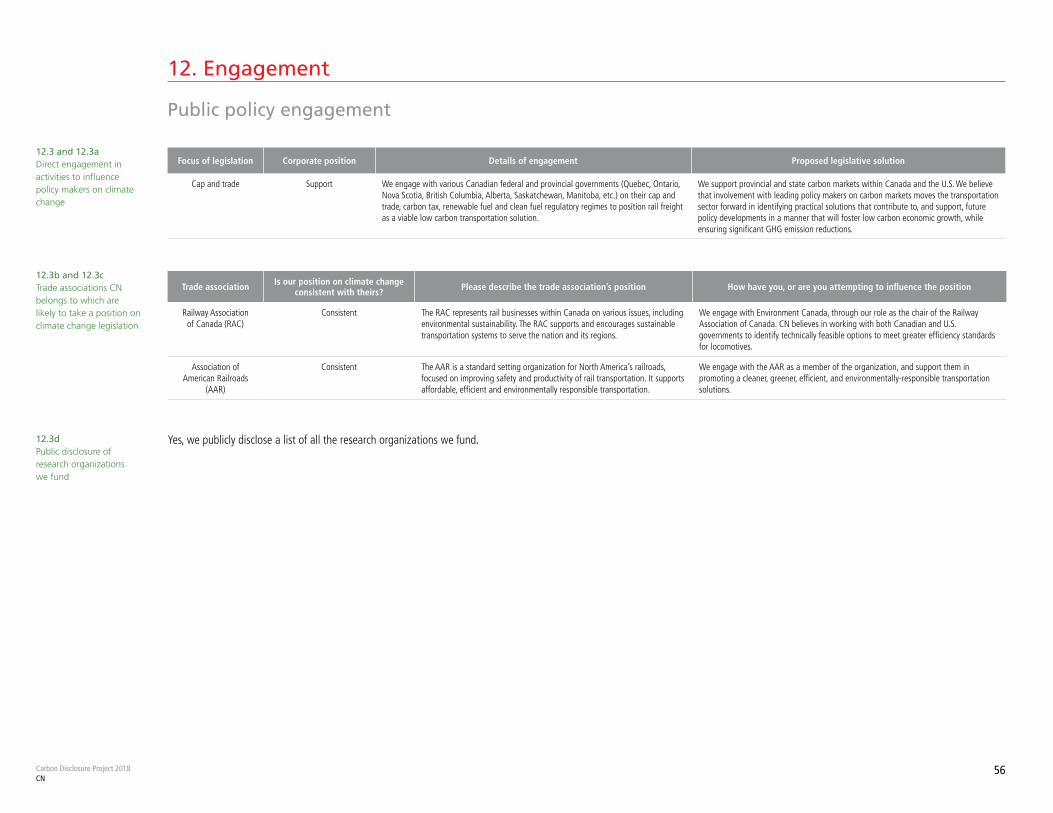
Carbon Disclosure Project 2018CN
56
12. Engagement
Public policy engagement
12.3 and 12.3aDirect engagement in activities to influence policy makers on climate change
Focus of legislation Corporate position Details of engagement Proposed legislative solution
Cap and trade Support We engage with various Canadian federal and provincial governments (Quebec, Ontario, Nova Scotia, British Columbia, Alberta, Saskatchewan, Manitoba, etc.) on their cap and trade, carbon tax, renewable fuel and clean fuel regulatory regimes to position rail freight as a viable low carbon transportation solution.
We support provincial and state carbon markets within Canada and the U.S. We believe that involvement with leading policy makers on carbon markets moves the transportation sector forward in identifying practical solutions that contribute to, and support, future policy developments in a manner that will foster low carbon economic growth, while ensuring significant GHG emission reductions.
12.3b and 12.3cTrade associations CN belongs to which are likely to take a position on climate change legislation
Trade association Is our position on climate change consistent with theirs? Please describe the trade association’s position How have you, or are you attempting to influence the position
Railway Association of Canada (RAC)
Consistent The RAC represents rail businesses within Canada on various issues, including environmental sustainability. The RAC supports and encourages sustainable transportation systems to serve the nation and its regions.
We engage with Environment Canada, through our role as the chair of the Railway Association of Canada. CN believes in working with both Canadian and U.S. governments to identify technically feasible options to meet greater efficiency standards for locomotives.
Association of American Railroads
(AAR)
Consistent The AAR is a standard setting organization for North America’s railroads, focused on improving safety and productivity of rail transportation. It supports affordable, efficient and environmentally responsible transportation.
We engage with the AAR as a member of the organization, and support them in promoting a cleaner, greener, efficient, and environmentally-responsible transportation solutions.
12.3dPublic disclosure of research organizations we fund
Yes, we publicly disclose a list of all the research organizations we fund.
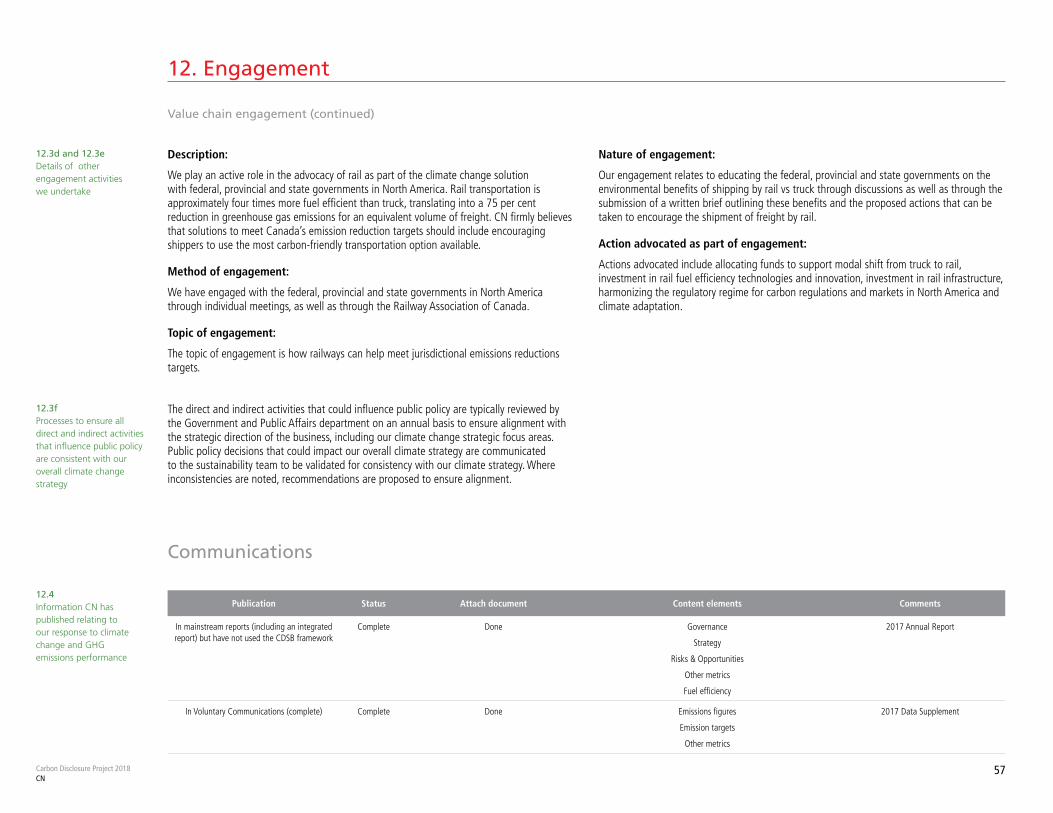
Carbon Disclosure Project 2018CN
57
12. Engagement
Value chain engagement (continued)
12.3d and 12.3eDetails of other engagement activities we undertake
Description:
We play an active role in the advocacy of rail as part of the climate change solution with federal, provincial and state governments in North America. Rail transportation is approximately four times more fuel efficient than truck, translating into a 75 per cent reduction in greenhouse gas emissions for an equivalent volume of freight. CN firmly believes that solutions to meet Canada’s emission reduction targets should include encouraging shippers to use the most carbon-friendly transportation option available.
Method of engagement:
We have engaged with the federal, provincial and state governments in North America through individual meetings, as well as through the Railway Association of Canada.
Topic of engagement:
The topic of engagement is how railways can help meet jurisdictional emissions reductions targets.
Nature of engagement:
Our engagement relates to educating the federal, provincial and state governments on the environmental benefits of shipping by rail vs truck through discussions as well as through the submission of a written brief outlining these benefits and the proposed actions that can be taken to encourage the shipment of freight by rail.
Action advocated as part of engagement:
Actions advocated include allocating funds to support modal shift from truck to rail, investment in rail fuel efficiency technologies and innovation, investment in rail infrastructure, harmonizing the regulatory regime for carbon regulations and markets in North America and climate adaptation.
12.3fProcesses to ensure all direct and indirect activities that influence public policy are consistent with our overall climate change strategy
The direct and indirect activities that could influence public policy are typically reviewed by the Government and Public Affairs department on an annual basis to ensure alignment with the strategic direction of the business, including our climate change strategic focus areas. Public policy decisions that could impact our overall climate strategy are communicated to the sustainability team to be validated for consistency with our climate strategy. Where inconsistencies are noted, recommendations are proposed to ensure alignment.
12.4Information CN has published relating to our response to climate change and GHG emissions performance
Publication Status Attach document Content elements Comments
In mainstream reports (including an integrated report) but have not used the CDSB framework
Complete Done Governance
Strategy
Risks & Opportunities
Other metrics
Fuel efficiency
2017 Annual Report
In Voluntary Communications (complete) Complete Done Emissions figures
Emission targets
Other metrics
2017 Data Supplement
Communications

Sign off
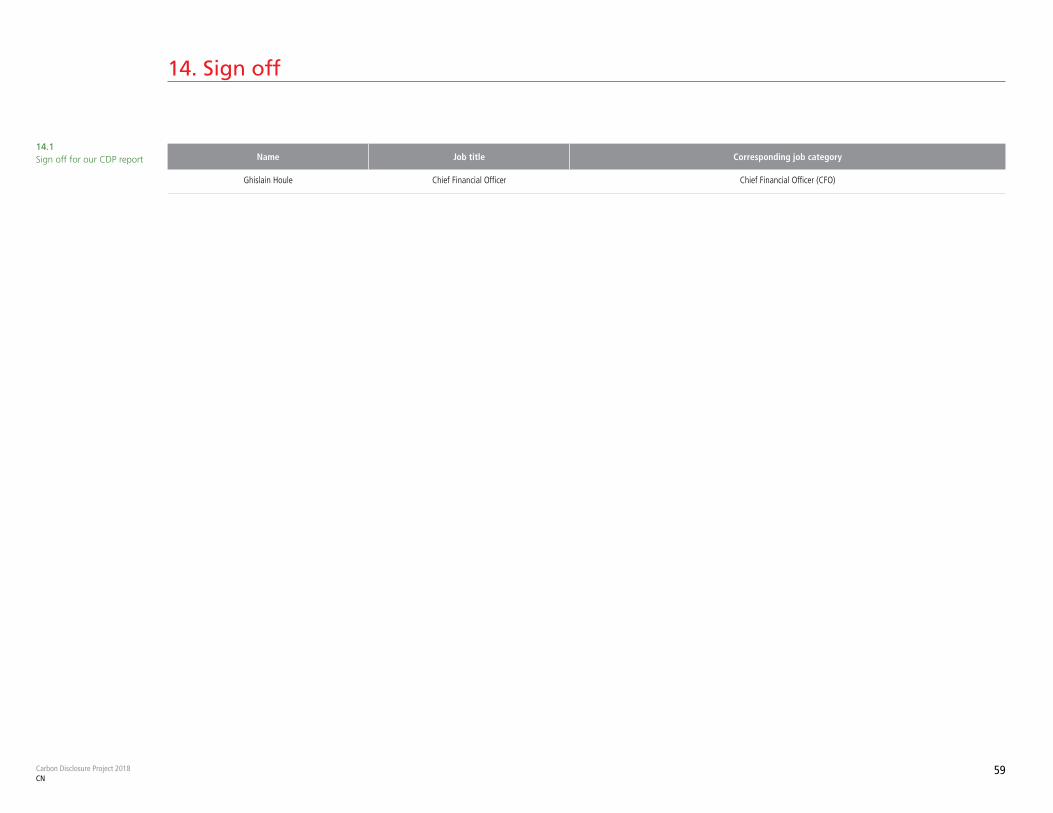
Carbon Disclosure Project 2018CN
59
14. Sign off
14.1Sign off for our CDP report Name Job title Corresponding job category
Ghislain Houle Chief Financial Officer Chief Financial Officer (CFO)