Embed Size (px)
Citation preview
CFI Mapping Tool (V6.01) Help Manual Department of the Environment Page 1
What’s New – 28 July 2015
New data added to the CMT to support the new ERF methodology
“ Estimating sequestration of carbon in soils using default values”
What’s New - 5 August 2014
CMT has been upgraded to support the following new functionality
Simplified access to the Tool - no need to remember login details!
Access additional Forest Cover and Landsat datasets from 1990 to 2013
Ability to compare datasets
Ability to import external data
Ability to select and download Forest Cover Data
A. Definitions:
What is …
The CMT?
A CEA?
A Boundary?
An Exclusion?
Carbon Farming Mapping Tool Help Manual (V6.01)
CFI Mapping Tool (V6.01) Help Manual Department of the Environment Page 2
A Model Point?
A Data Layer?
A Report?
Default Extent?
Full Extent?
B. Using the map:
How do I …
Find soil carbon sequestration values for a given CEA?
Navigate the map?
Search for a specific location on the map?
Measure distances and areas?
Add new data layers?
Remove existing data layers?
Adjust the transparency of a data layer?
Query the CFI rainfall map?
Add a new Forest Cover or Landsat layer?
Compare Datasets?
Import a shapefile?
Extract Forest Cover Data?
CFI Mapping Tool (V6.01) Help Manual Department of the Environment Page 3
C. Managing a single Carbon Estimation Area (CEA):
How do I …
Create a new CEA?
Delete a CEA?
Edit a CEA?
Move a CEA?
Draw a Boundary?
Draw an Exclusion?
Create a Model Point?
Edit a Boundary?
Edit an Exclusion?
Change a Model Point?
Delete a Boundary?
Delete an Exclusion?
Delete a Model Point?
Move a Boundary ?
Move an Exclusion?
Move a Model Point?
CFI Mapping Tool (V6.01) Help Manual Department of the Environment Page 4
D. Managing one or more Carbon Estimation Areass:
How do I …
See more data?
Edit project names?
Create a Report?
Want to save/print my report?
Save my current file?
Open a previous file?
Save only a selected number of records?
Export my data to CSV?
CFI Mapping Tool (V6.01) Help Manual Department of the Environment Page 5
E. General actions:
How do I …
Locate a specific Carbon Estimation Area on the map?
Undo a change?
Add a new Forest Cover or Landsat layer?
Compare Datasets?
Import a shapefile?
Extract Forest Cover Data?
CFI Mapping Tool (V6.01) Help Manual Department of the Environment Page 6
F. Data management:
What is isolated storage?
What happens to my data if I lose my internet connection?
Where is the data kept? (How is the data stored)?
CFI Mapping Tool (V6.01) Help Manual Department of the Environment Page 7
Introduction
The Carbon Farming Initiative is a carbon offsets scheme established by the Australian
Government to provide new economic opportunities for farmers, forest growers and
landholders and help the environment by reducing carbon pollution.
The Carbon Farming Initiative includes:
Legislation to establish a carbon crediting mechanism;
Fast-tracked development of methodologies for offset projects; and
Information and tools to help farmers and landholders benefit from carbon
markets.
Many activities under the Carbon Farming Initiative will involve the specific and
accurate definition of Project Areas, for the purposes of:
meeting compliance obligations,
provision of information to the Administrator and
for the purpose of estimating abatement.
Most of these activities will be sequestration offsets projects.
The geospatial requirements for the CFI will be regulated by:
CFI Bill
CFI Regulations
CFI methodology determinations, and
CFI Geospatial Standards
CMT: The Carbon Farming Initiative (CFI) Mapping Tool is a Silverlight based
application designed to allow a user to meet these requirements.
This User Manual will assist proponents to use the CFI Mapping Tool (CMT) by
providing clear step by step instructions to use of the tool.
CFI Mapping Tool (V6.01) Help Manual Department of the Environment Page 8
Definitions
Project:
A project is the set of activities being undertaken across one or more Project Areas
Project Area:
An area of land on which the set of activities has been, is being, or is to be, carried out
and that may or may not include areas that are adjacent to the activities being undertaken
but not subject to the activities themselves – these areas must be subsequently excluded
from the Carbon Estimation Areas (see Figures on page 11)
Carbon Estimation Areas:
A subset of the Project Area that is defined through stratification or other means and is
used to determine the area for calculations for baseline or project abatement estimations,
A CEA will exclude certain areas from calculations, ie areas registered as part of the
Project Area where activities are not taking place.
A CEA may also be used to refer to other subsets of a Project Area that may be defined
under a methodology determination.
Model Point:
A point that is located within a CEA for the purpose of computer based modelling.
[Where this is not applicable the model point in the CMT may be used to identify certain
features.].
The primary mapping unit used in the CMT is the Carbon Estimation Area.
CFI Mapping Tool (V6.01) Help Manual Department of the Environment Page 9
What is the CFI Mapping Tool (CMT)?
The CFI Mapping Tool (CMT) is a web application enabling proponents to define
geographic areas as required under the methodology for the purpose of estimating
abatement.
The CMT enables users to:
• map Carbon Estimation Area(s) using remotely sensed imagery, including:
– 25m Landsat data for the period from 1990 to 2013;
– 2.5m SpotMap data acquired in the period 2006-2008;
– forest extent data for the period from 1990 to 2013;
– Map Data Sciences Foundation Map
– 2.5m black & white PRISM data from the ALOS Mission
– Additional online mapping services
• define CEA Exclusion areas
• determine the gross and net (of exclusion areas) area of CEAs in hectares
• identify a CFI Model Point (latitude and longitude) for entry into the Reforestation
Modelling Tool
• import geographic information from other sources; and
• produce summary reports of projects
• save Carbon Estimation Area(s) to their local computer and view and edit saved
projects;
A CMT map file may contain multiple CEAs across multiple Project Areas.
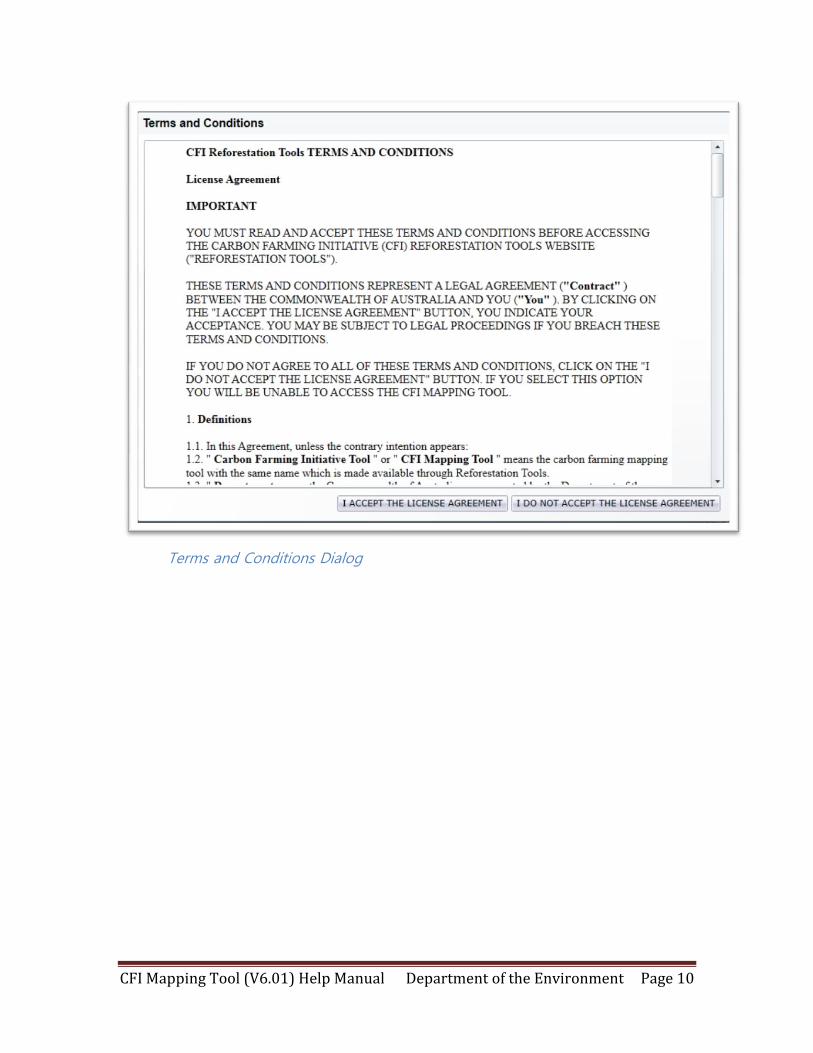
To use the application you will need to read the terms and conditions then agree by
clicking on the “I ACCEPT THE LICENSE AGREEMENT” button. This will close the
dialog and make the application available. If you do not agree to the terms and conditions
click the I DO NOT ACCEPT THE LICENSE AGREEMENT button and the application
will be closed.
CFI Mapping Tool (V6.01) Help Manual Department of the Environment Page 10
Terms and Conditions Dialog
CFI Mapping Tool (V6.01) Help Manual Department of the Environment Page 11
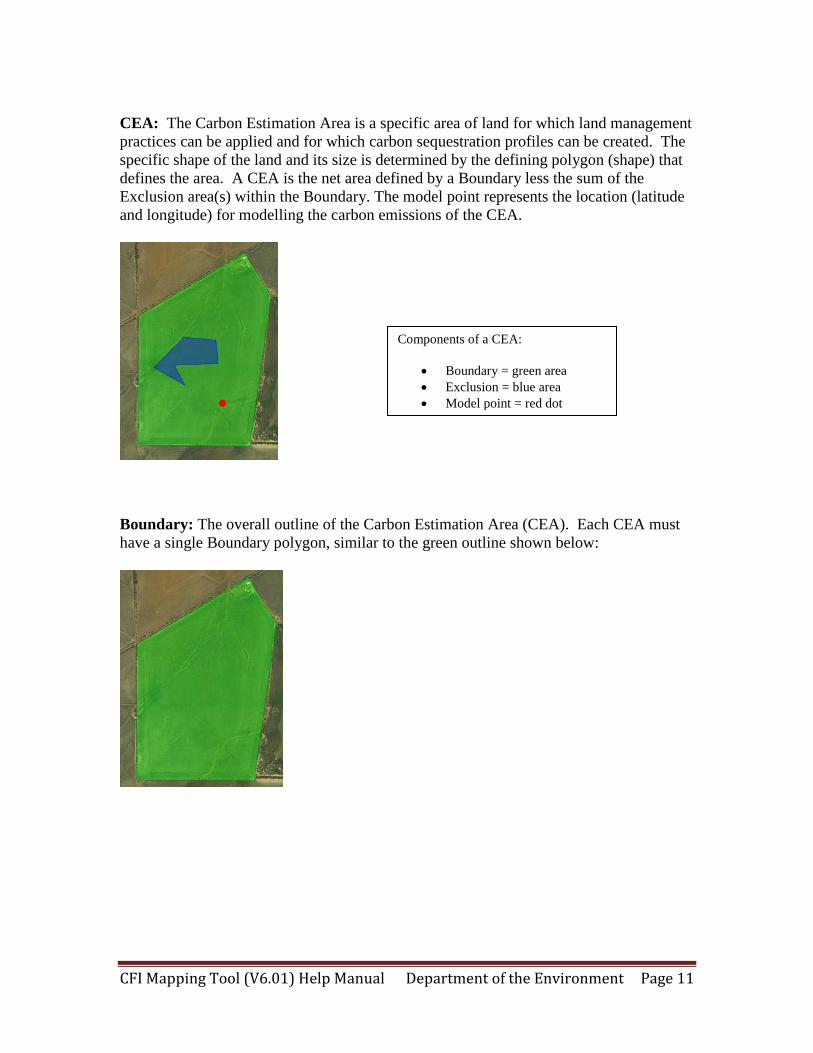
CEA: The Carbon Estimation Area is a specific area of land for which land management
practices can be applied and for which carbon sequestration profiles can be created. The
specific shape of the land and its size is determined by the defining polygon (shape) that
defines the area. A CEA is the net area defined by a Boundary less the sum of the
Exclusion area(s) within the Boundary. The model point represents the location (latitude
and longitude) for modelling the carbon emissions of the CEA.
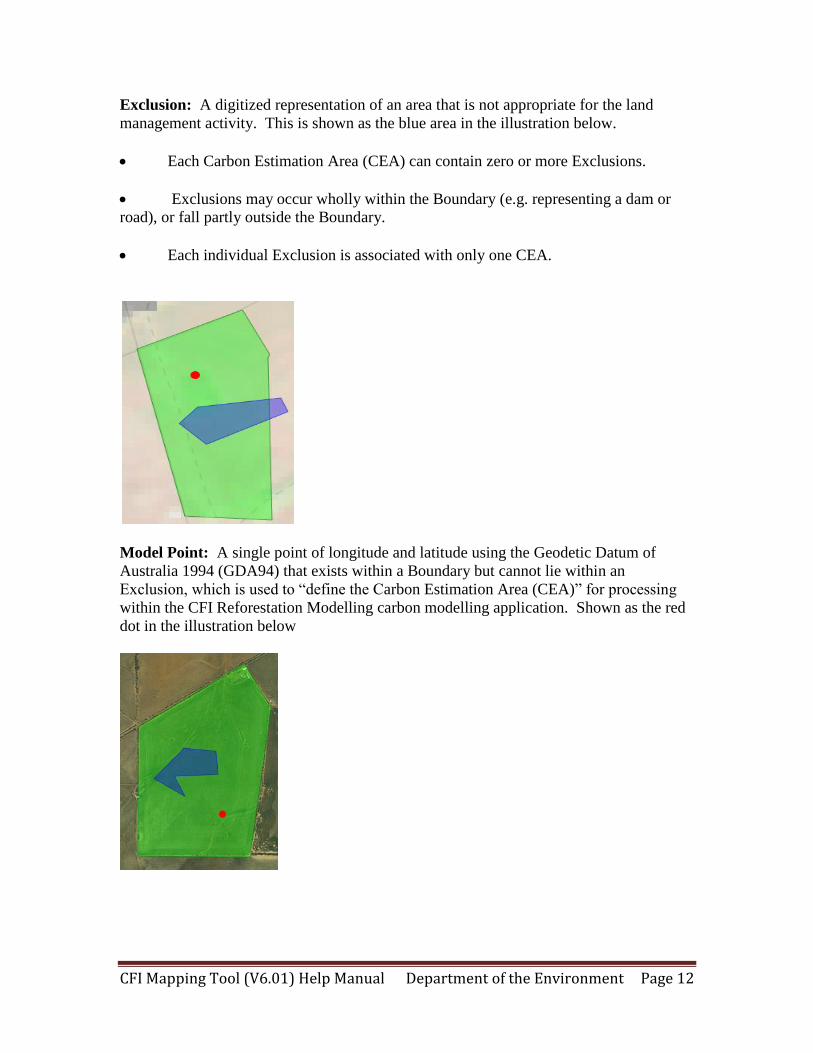
Boundary: The overall outline of the Carbon Estimation Area (CEA). Each CEA must
have a single Boundary polygon, similar to the green outline shown below:
Components of a CEA:
Boundary = green area
Exclusion = blue area
Model point = red dot
CFI Mapping Tool (V6.01) Help Manual Department of the Environment Page 12
Exclusion: A digitized representation of an area that is not appropriate for the land
management activity. This is shown as the blue area in the illustration below.
Each Carbon Estimation Area (CEA) can contain zero or more Exclusions.
Exclusions may occur wholly within the Boundary (e.g. representing a dam or
road), or fall partly outside the Boundary.
Each individual Exclusion is associated with only one CEA.
Model Point: A single point of longitude and latitude using the Geodetic Datum of
Australia 1994 (GDA94) that exists within a Boundary but cannot lie within an
Exclusion, which is used to “define the Carbon Estimation Area (CEA)” for processing
within the CFI Reforestation Modelling carbon modelling application. Shown as the red
dot in the illustration below
CFI Mapping Tool (V6.01) Help Manual Department of the Environment Page 13
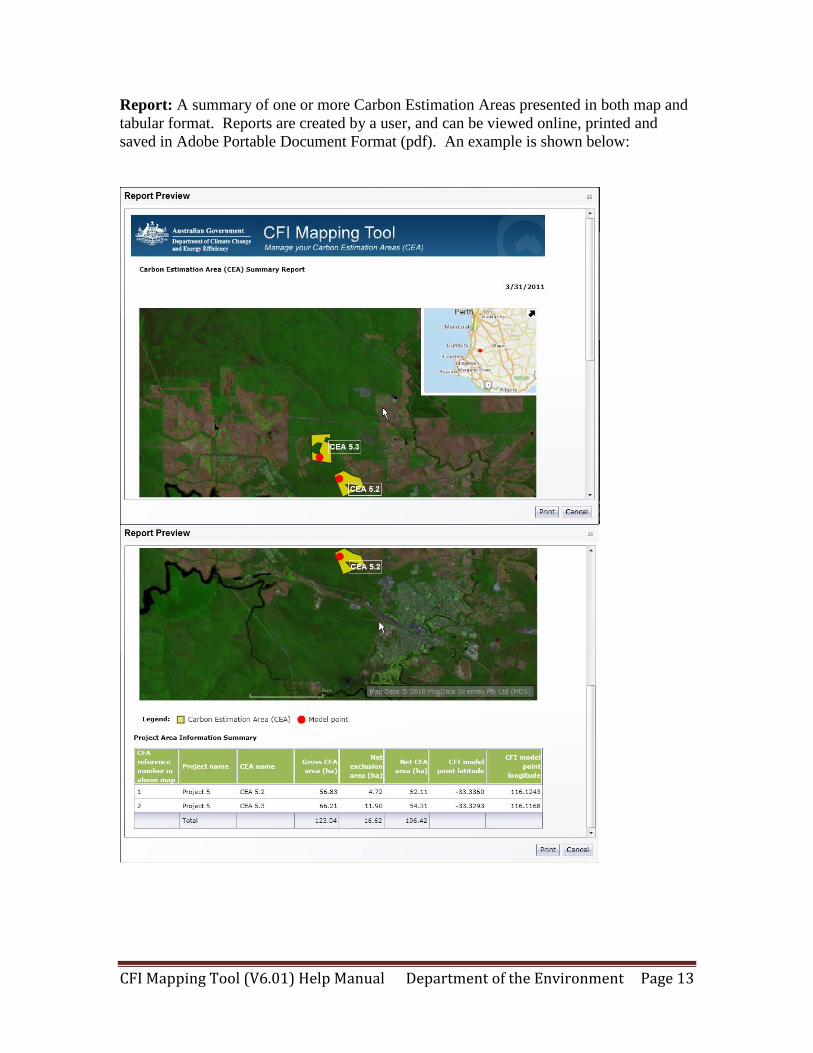
Report: A summary of one or more Carbon Estimation Areas presented in both map and
tabular format. Reports are created by a user, and can be viewed online, printed and
saved in Adobe Portable Document Format (pdf). An example is shown below:
CFI Mapping Tool (V6.01) Help Manual Department of the Environment Page 14
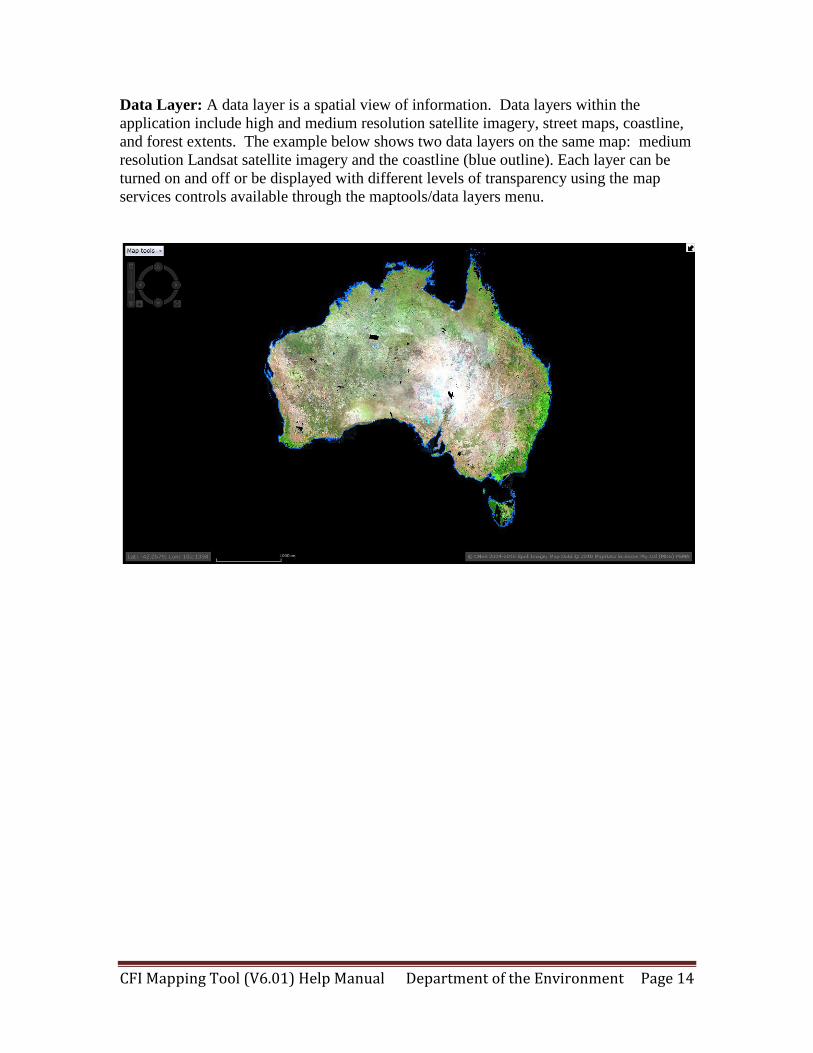
Data Layer: A data layer is a spatial view of information. Data layers within the
application include high and medium resolution satellite imagery, street maps, coastline,
and forest extents. The example below shows two data layers on the same map: medium
resolution Landsat satellite imagery and the coastline (blue outline). Each layer can be
turned on and off or be displayed with different levels of transparency using the map
services controls available through the maptools/data layers menu.
CFI Mapping Tool (V6.01) Help Manual Department of the Environment Page 15
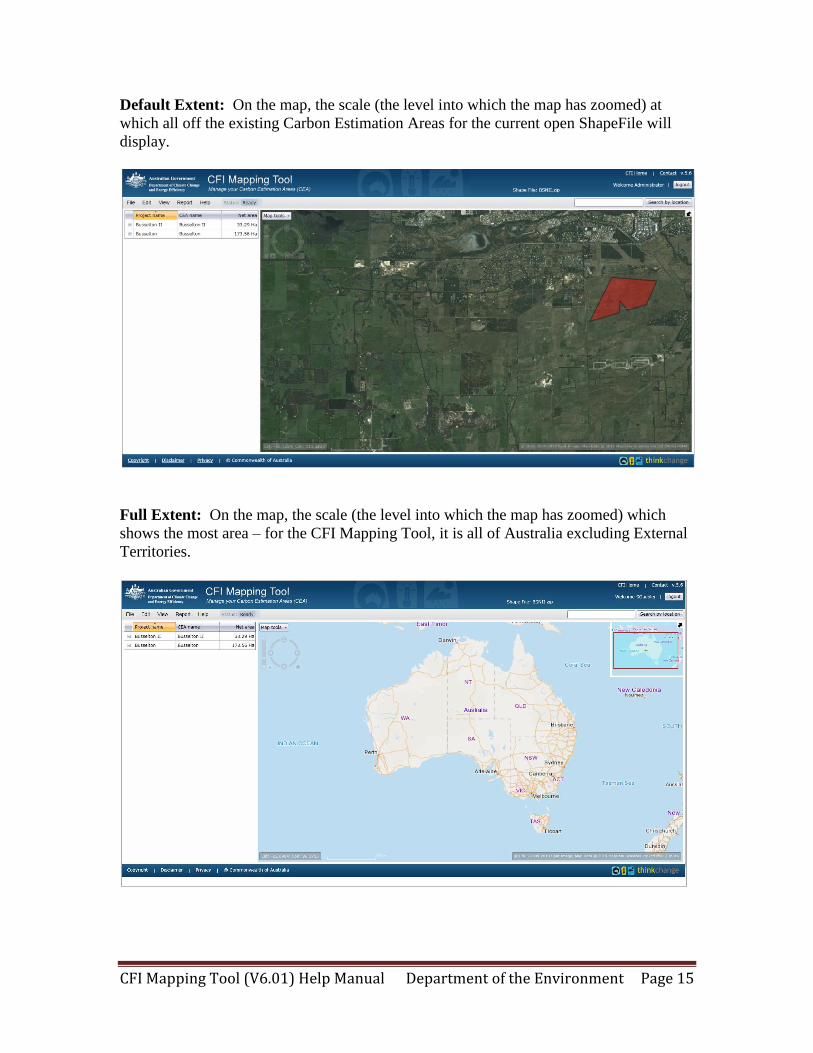
Default Extent: On the map, the scale (the level into which the map has zoomed) at
which all off the existing Carbon Estimation Areas for the current open ShapeFile will
display.
Full Extent: On the map, the scale (the level into which the map has zoomed) which
shows the most area – for the CFI Mapping Tool, it is all of Australia excluding External
Territories.
CFI Mapping Tool (V6.01) Help Manual Department of the Environment Page 16
Using the Map
How do I …
Navigate the map?
Navigating the map involves three basic functions: zooming in, zooming out, and
panning (going sideways). There are two ways to achieve these actions – through the use
of the Map Navigation Wheel and via your mouse.
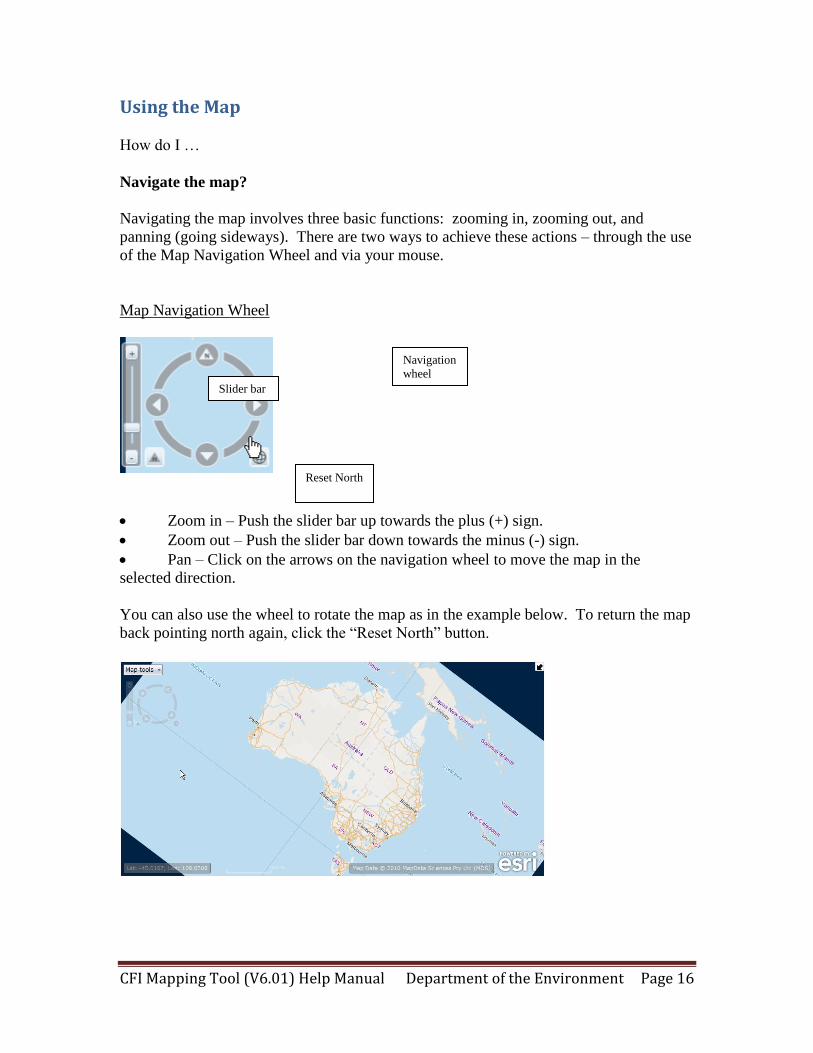
Map Navigation Wheel
Zoom in – Push the slider bar up towards the plus (+) sign.
Zoom out – Push the slider bar down towards the minus (-) sign.
Pan – Click on the arrows on the navigation wheel to move the map in the
selected direction.
You can also use the wheel to rotate the map as in the example below. To return the map
back pointing north again, click the “Reset North” button.
Slider bar
Navigation
wheel
Reset North
CFI Mapping Tool (V6.01) Help Manual Department of the Environment Page 17
Using your mouse
Begin by placing your cursor on the map.
Zoom in – Push the scroll button forward (away from you).
Zoom out – Push the scroll button backwards (towards you).
Pan – Left click on the map and hold the button down. Then you’re your mouse
in the direction you wish to move.
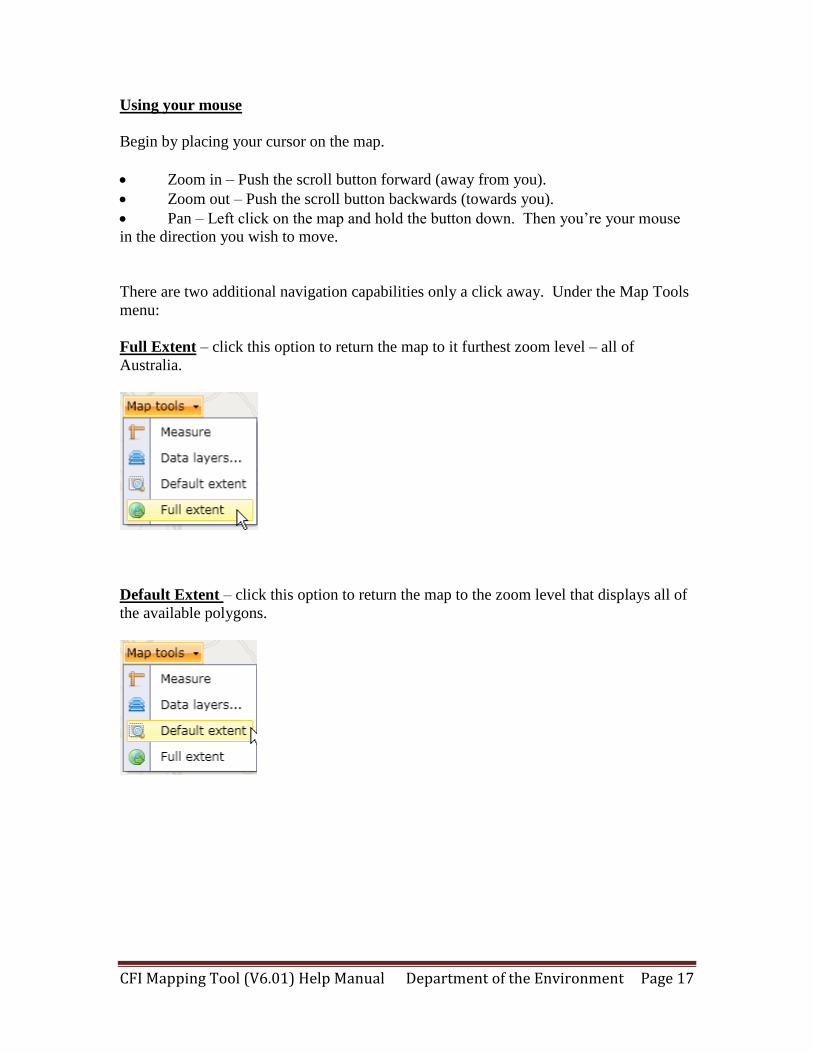
There are two additional navigation capabilities only a click away. Under the Map Tools
menu:
Full Extent – click this option to return the map to it furthest zoom level – all of
Australia.
Default Extent – click this option to return the map to the zoom level that displays all of
the available polygons.
CFI Mapping Tool (V6.01) Help Manual Department of the Environment Page 18
How do I …
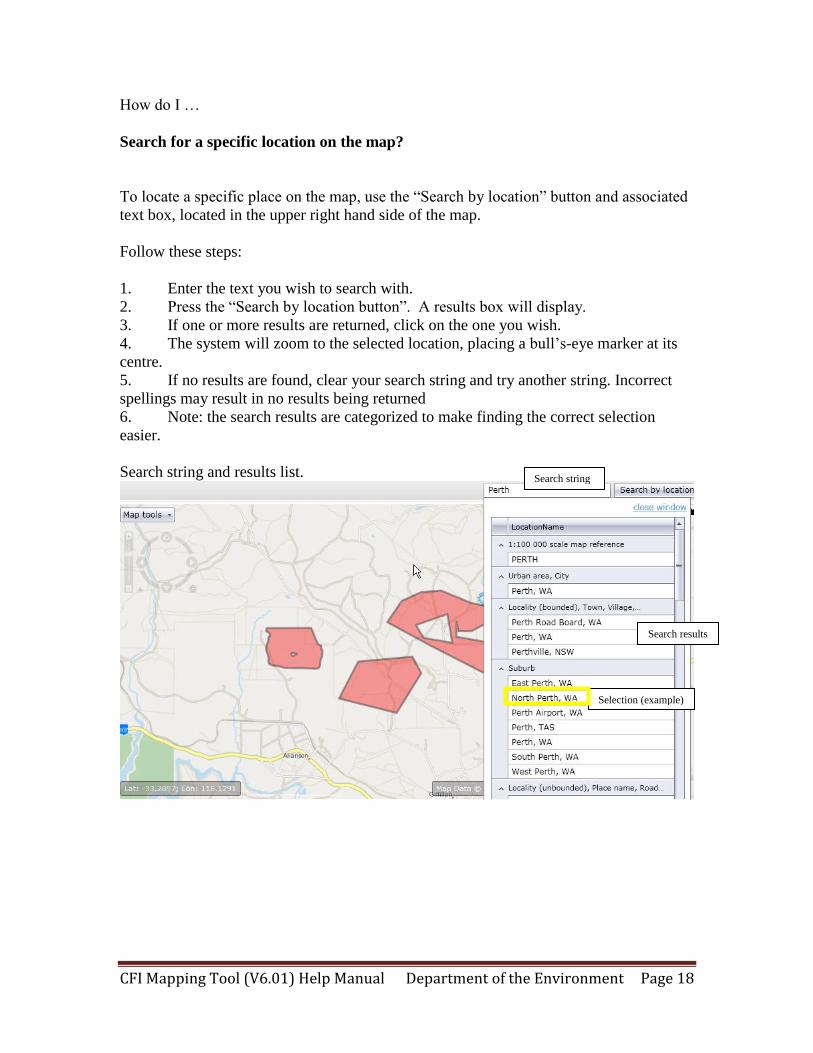
Search for a specific location on the map?
To locate a specific place on the map, use the “Search by location” button and associated
text box, located in the upper right hand side of the map.
Follow these steps:
1. Enter the text you wish to search with.
2. Press the “Search by location button”. A results box will display.
3. If one or more results are returned, click on the one you wish.
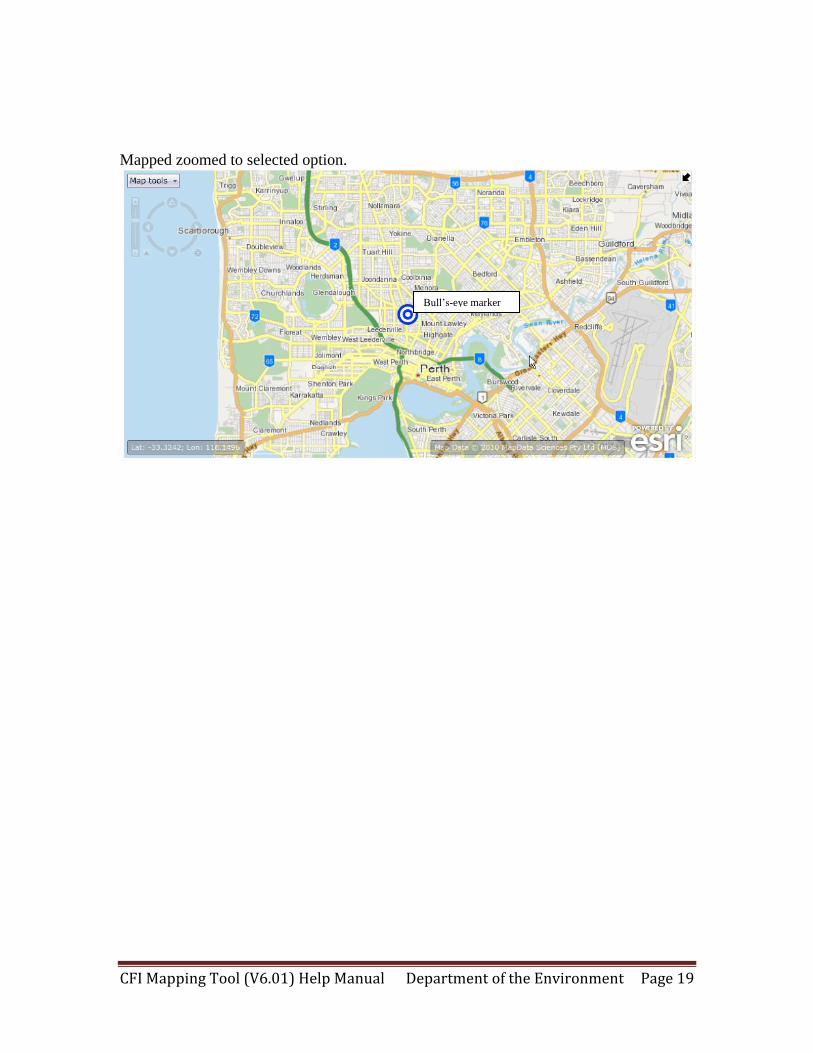
4. The system will zoom to the selected location, placing a bull’s-eye marker at its
centre.
5. If no results are found, clear your search string and try another string. Incorrect
spellings may result in no results being returned
6. Note: the search results are categorized to make finding the correct selection
easier.
Search string and results list.
Search string
Search results
Selection (example)
CFI Mapping Tool (V6.01) Help Manual Department of the Environment Page 19
Mapped zoomed to selected option.
Bull’s-eye marker
CFI Mapping Tool (V6.01) Help Manual Department of the Environment Page 20
How do I …
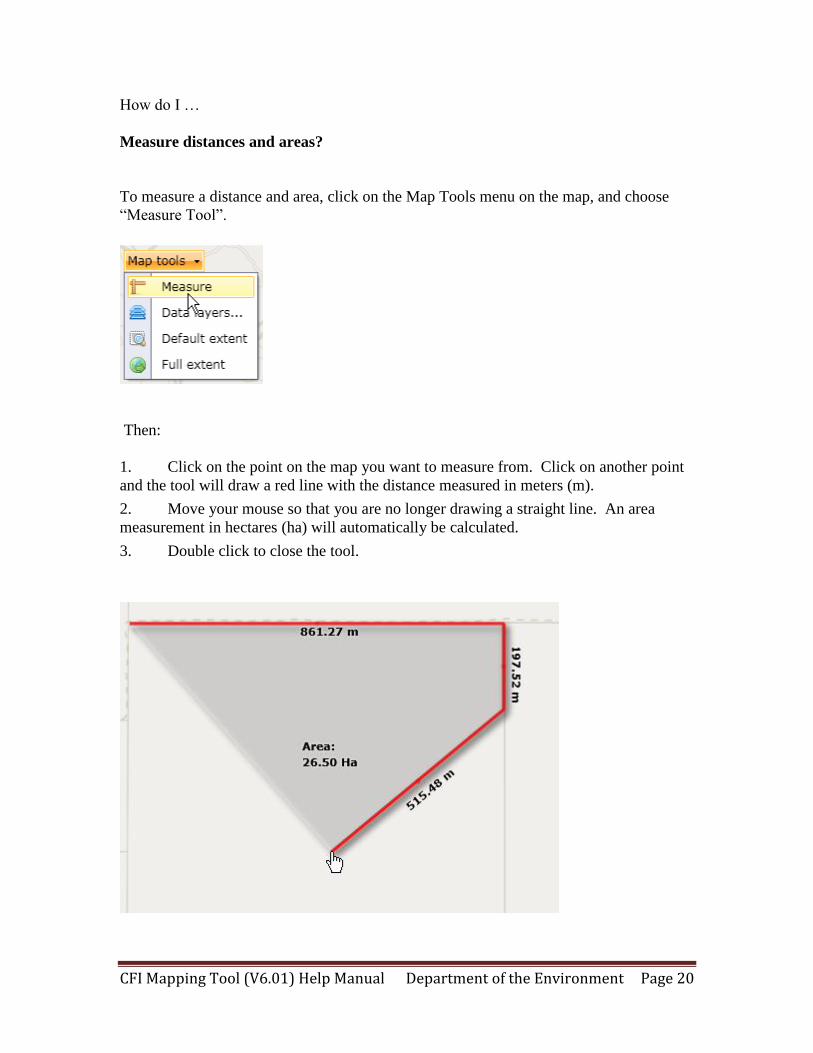
Measure distances and areas?
To measure a distance and area, click on the Map Tools menu on the map, and choose
“Measure Tool”.
Then:
1. Click on the point on the map you want to measure from. Click on another point
and the tool will draw a red line with the distance measured in meters (m).
2. Move your mouse so that you are no longer drawing a straight line. An area
measurement in hectares (ha) will automatically be calculated.
3. Double click to close the tool.
CFI Mapping Tool (V6.01) Help Manual Department of the Environment Page 21
How do I …
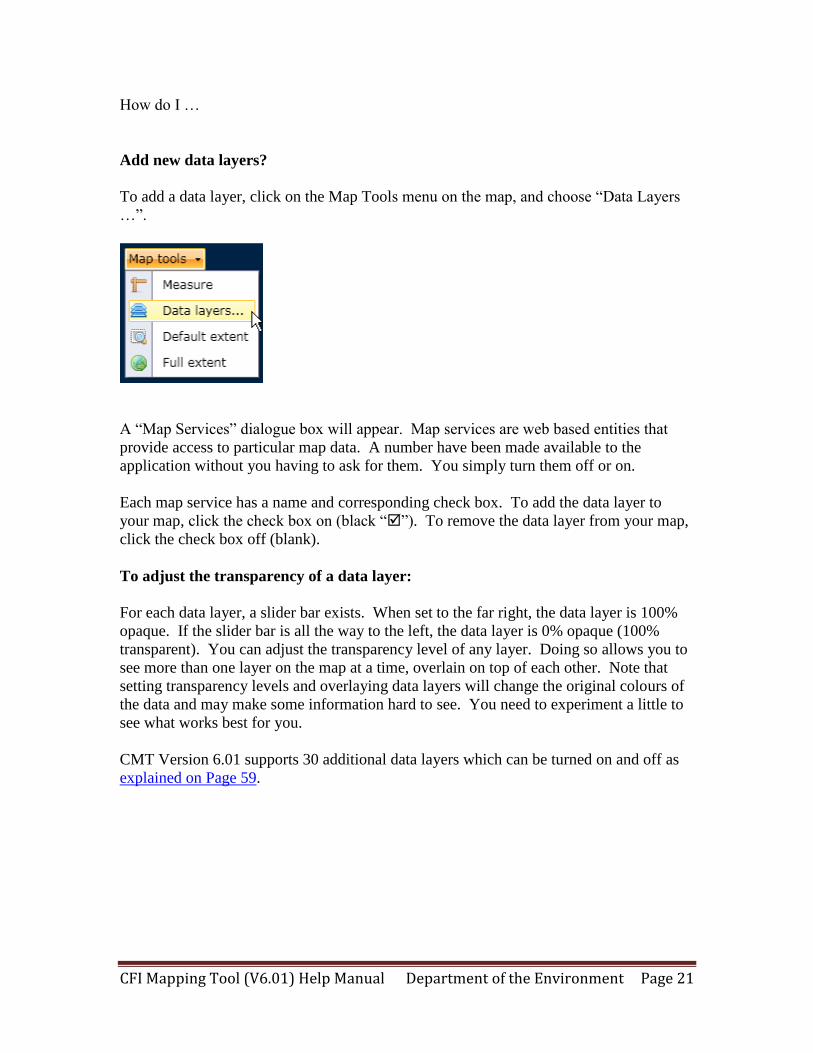
Add new data layers?
To add a data layer, click on the Map Tools menu on the map, and choose “Data Layers
…”.
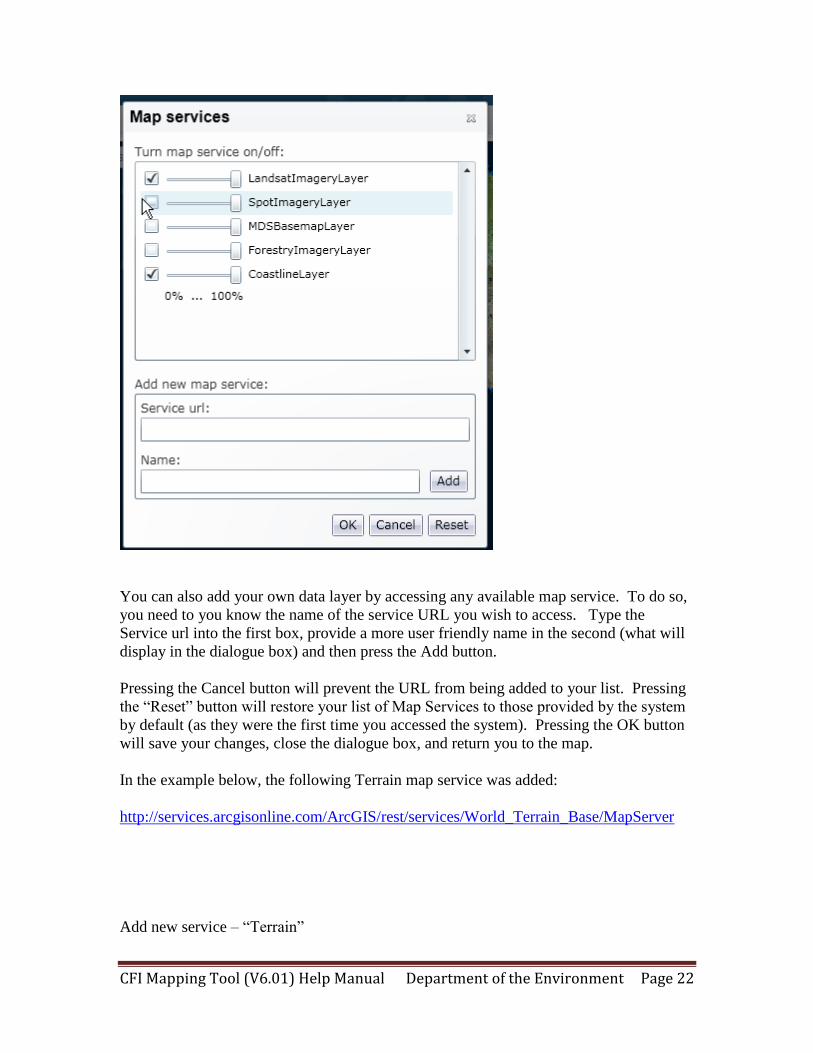
A “Map Services” dialogue box will appear. Map services are web based entities that
provide access to particular map data. A number have been made available to the
application without you having to ask for them. You simply turn them off or on.
Each map service has a name and corresponding check box. To add the data layer to
your map, click the check box on (black “”). To remove the data layer from your map,
click the check box off (blank).
To adjust the transparency of a data layer:
For each data layer, a slider bar exists. When set to the far right, the data layer is 100%
opaque. If the slider bar is all the way to the left, the data layer is 0% opaque (100%
transparent). You can adjust the transparency level of any layer. Doing so allows you to
see more than one layer on the map at a time, overlain on top of each other. Note that
setting transparency levels and overlaying data layers will change the original colours of
the data and may make some information hard to see. You need to experiment a little to
see what works best for you.
CMT Version 6.01 supports 30 additional data layers which can be turned on and off as
explained on Page 59.
CFI Mapping Tool (V6.01) Help Manual Department of the Environment Page 22
You can also add your own data layer by accessing any available map service. To do so,
you need to you know the name of the service URL you wish to access. Type the
Service url into the first box, provide a more user friendly name in the second (what will
display in the dialogue box) and then press the Add button.
Pressing the Cancel button will prevent the URL from being added to your list. Pressing
the “Reset” button will restore your list of Map Services to those provided by the system
by default (as they were the first time you accessed the system). Pressing the OK button
will save your changes, close the dialogue box, and return you to the map.
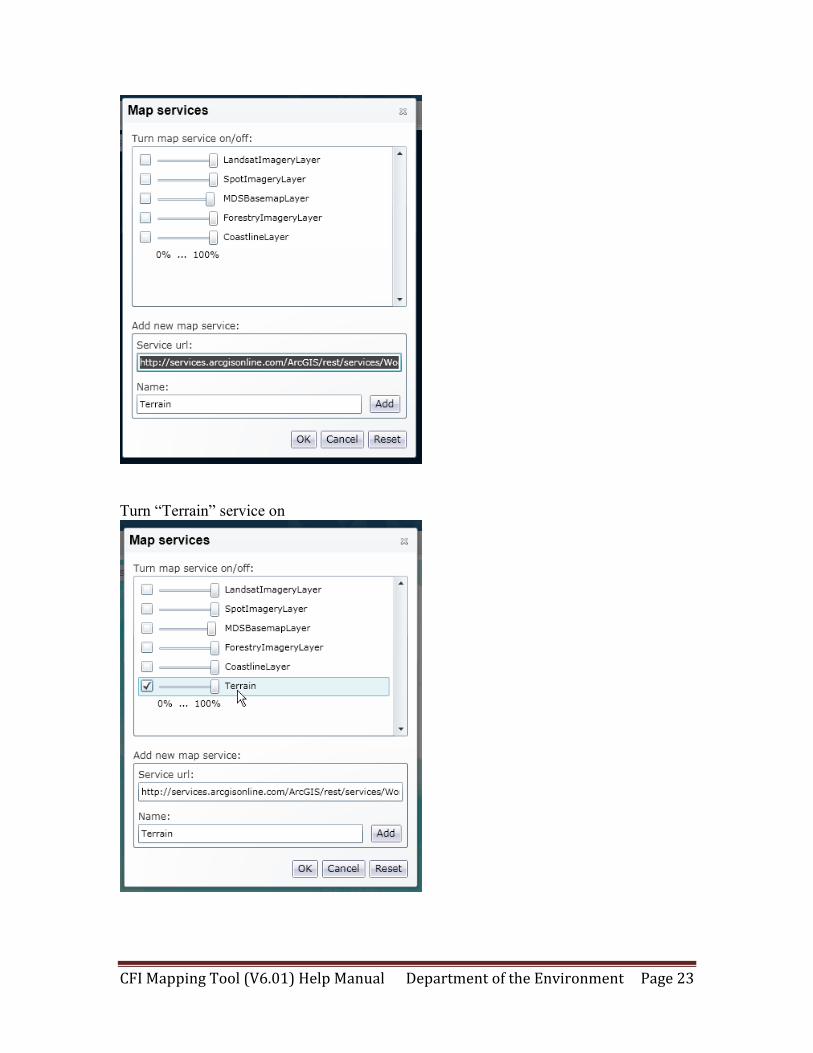
In the example below, the following Terrain map service was added:
http://services.arcgisonline.com/ArcGIS/rest/services/World_Terrain_Base/MapServer
Add new service – “Terrain”
CFI Mapping Tool (V6.01) Help Manual Department of the Environment Page 23
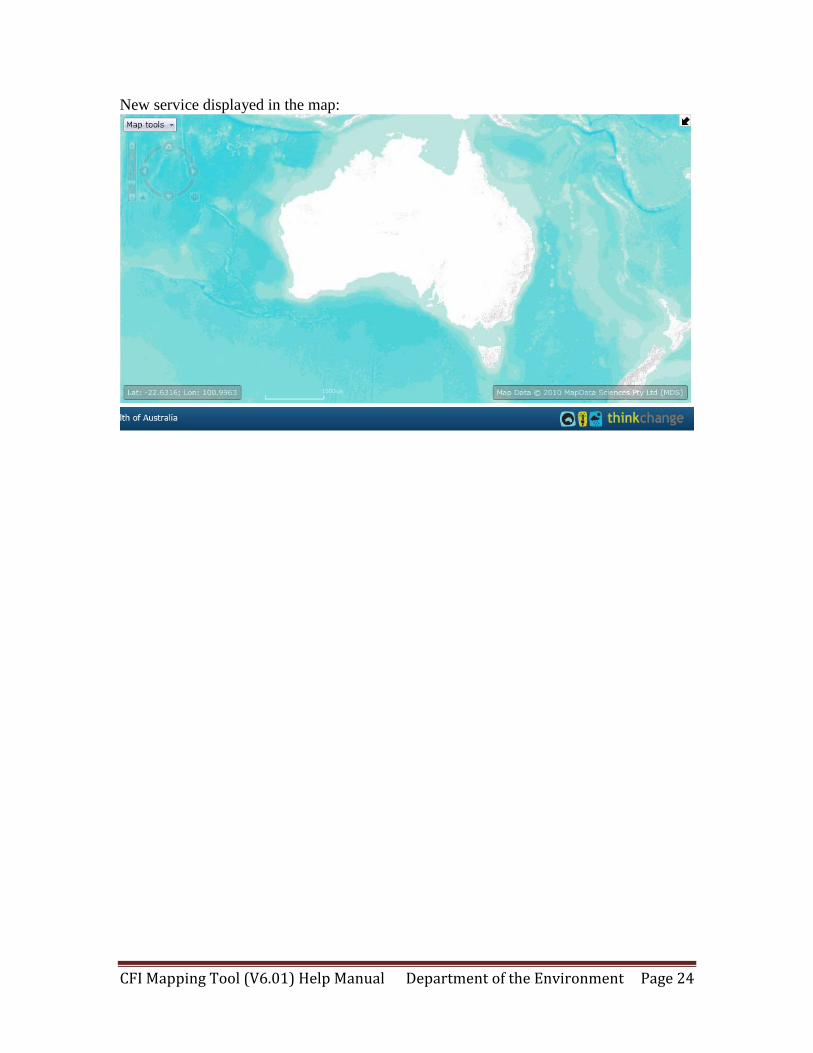
Turn “Terrain” service on
CFI Mapping Tool (V6.01) Help Manual Department of the Environment Page 24
New service displayed in the map:
CFI Mapping Tool (V6.01) Help Manual Department of the Environment Page 25
Managing a single Carbon Estimation Area (CEA):
How do I …
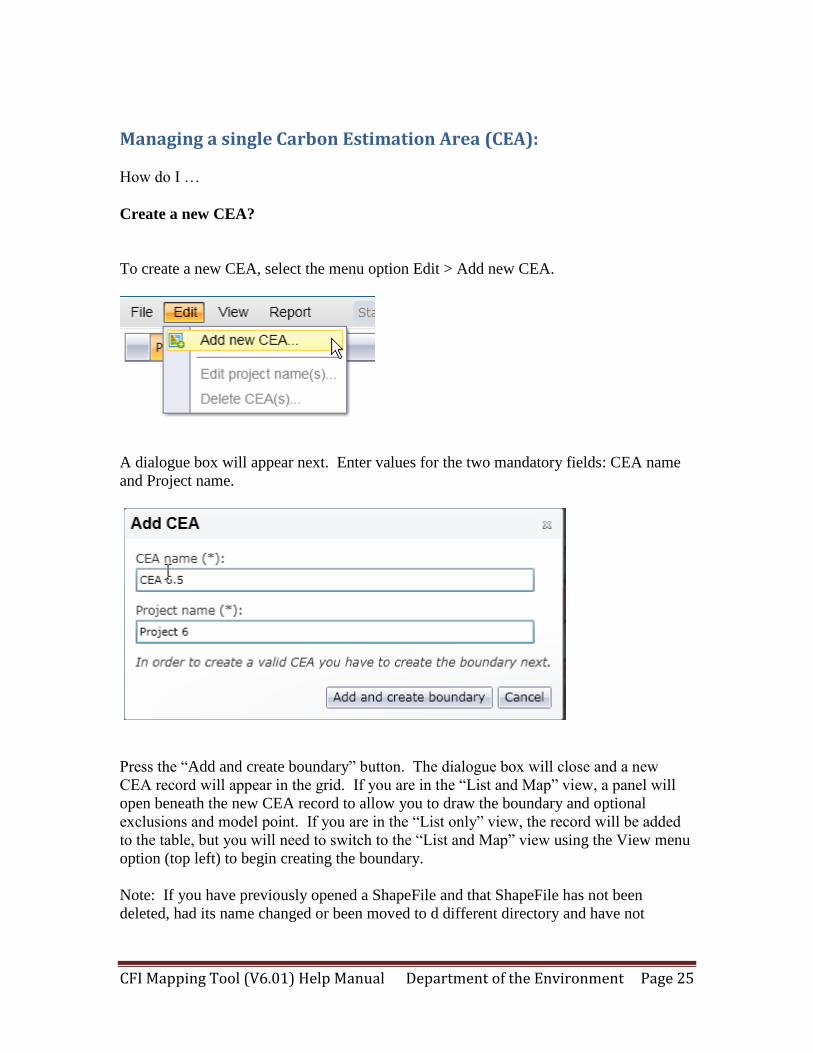
Create a new CEA?
To create a new CEA, select the menu option Edit > Add new CEA.
A dialogue box will appear next. Enter values for the two mandatory fields: CEA name
and Project name.
Press the “Add and create boundary” button. The dialogue box will close and a new
CEA record will appear in the grid. If you are in the “List and Map” view, a panel will
open beneath the new CEA record to allow you to draw the boundary and optional
exclusions and model point. If you are in the “List only” view, the record will be added
to the table, but you will need to switch to the “List and Map” view using the View menu
option (top left) to begin creating the boundary.
Note: If you have previously opened a ShapeFile and that ShapeFile has not been
deleted, had its name changed or been moved to d different directory and have not
CFI Mapping Tool (V6.01) Help Manual Department of the Environment Page 26
cleared your browsing history cache, then the CEA will be populated with the data from
the last ShapeFile opened and that ShapeFile is opened.
CEAs can also be imported using the Import Shapefile functionality.
CFI Mapping Tool (V6.01) Help Manual Department of the Environment Page 27
How do I …
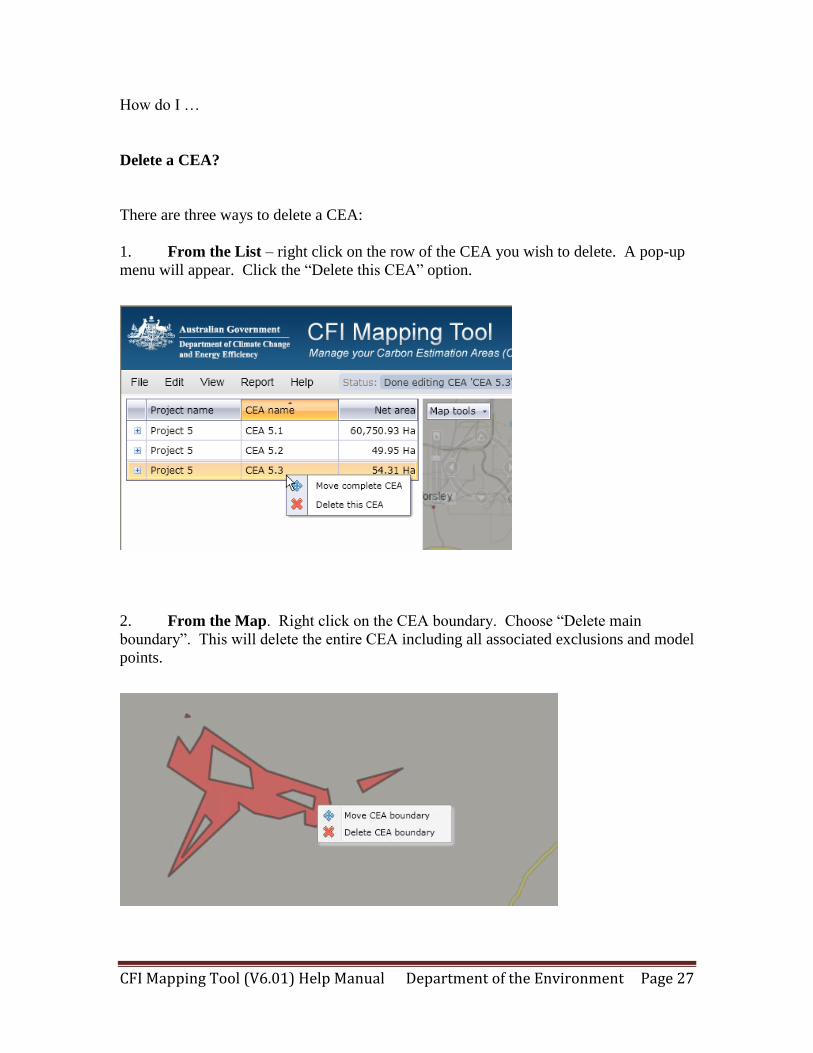
Delete a CEA?
There are three ways to delete a CEA:
1. From the List – right click on the row of the CEA you wish to delete. A pop-up
menu will appear. Click the “Delete this CEA” option.
2. From the Map. Right click on the CEA boundary. Choose “Delete main
boundary”. This will delete the entire CEA including all associated exclusions and model
points.
CFI Mapping Tool (V6.01) Help Manual Department of the Environment Page 28
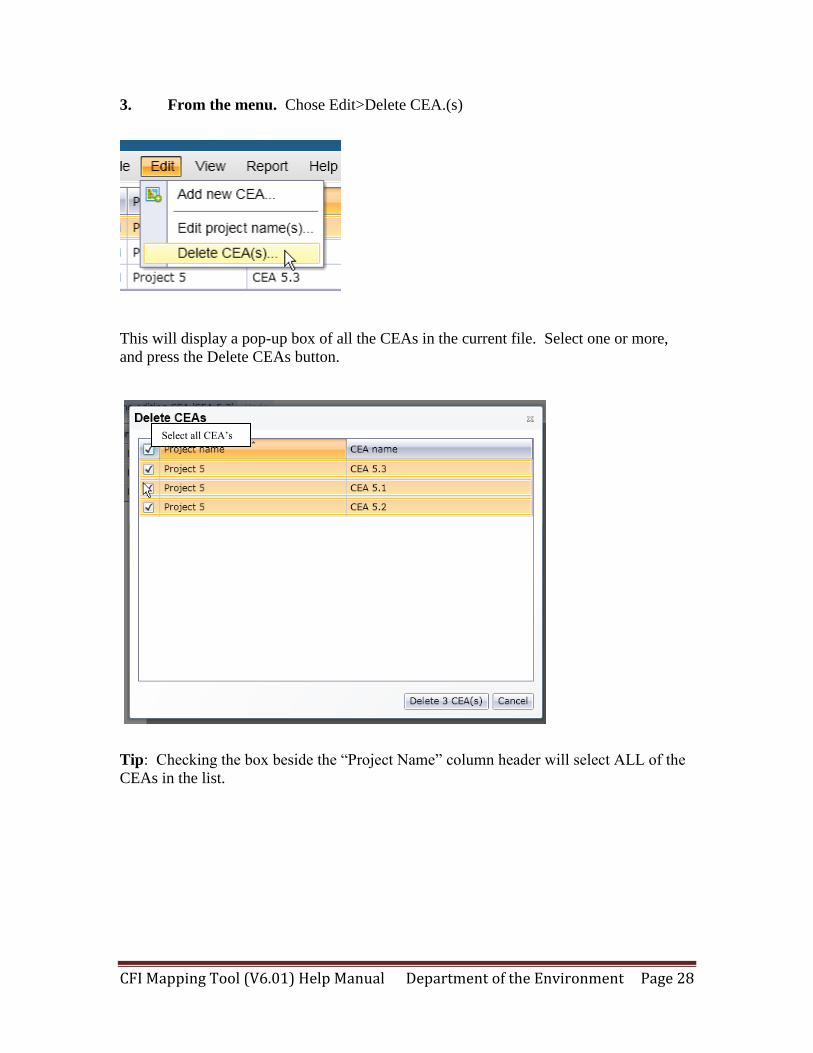
3. From the menu. Chose Edit>Delete CEA.(s)
This will display a pop-up box of all the CEAs in the current file. Select one or more,
and press the Delete CEAs button.
Tip: Checking the box beside the “Project Name” column header will select ALL of the
CEAs in the list.
Select all CEA’s
CFI Mapping Tool (V6.01) Help Manual Department of the Environment Page 29
How do I …
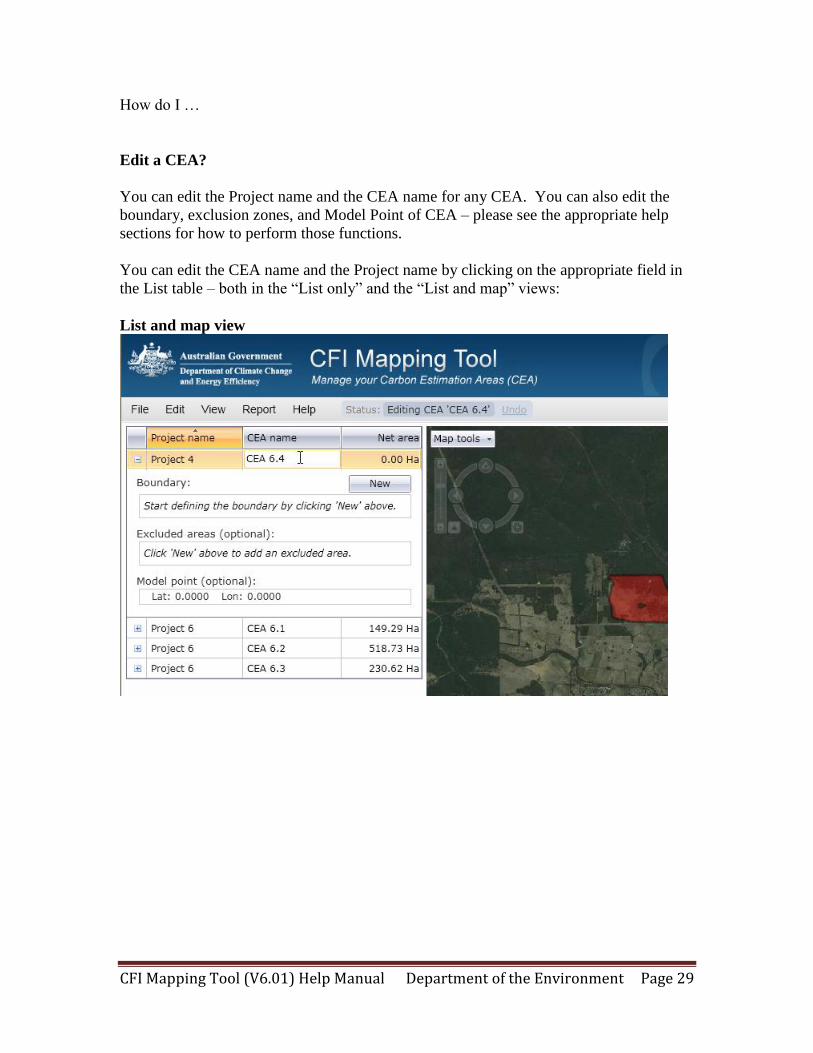
Edit a CEA?
You can edit the Project name and the CEA name for any CEA. You can also edit the
boundary, exclusion zones, and Model Point of CEA – please see the appropriate help
sections for how to perform those functions.
You can edit the CEA name and the Project name by clicking on the appropriate field in
the List table – both in the “List only” and the “List and map” views:
List and map view
CFI Mapping Tool (V6.01) Help Manual Department of the Environment Page 30
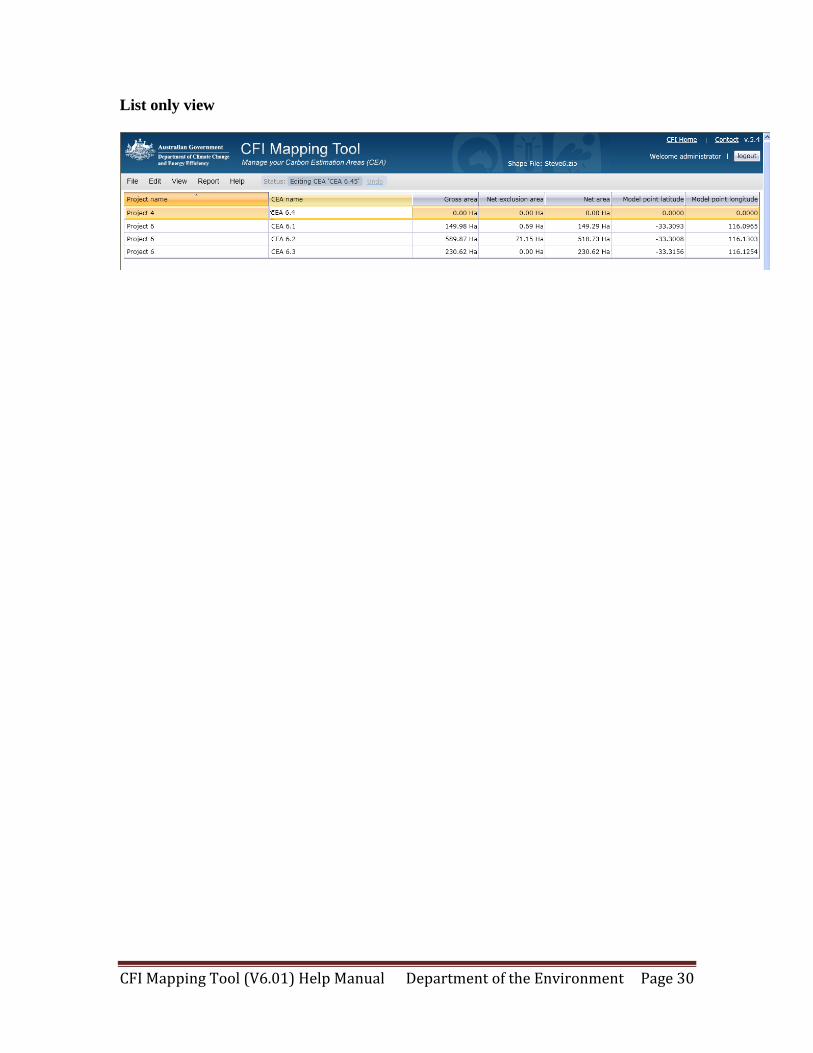
List only view
CFI Mapping Tool (V6.01) Help Manual Department of the Environment Page 31
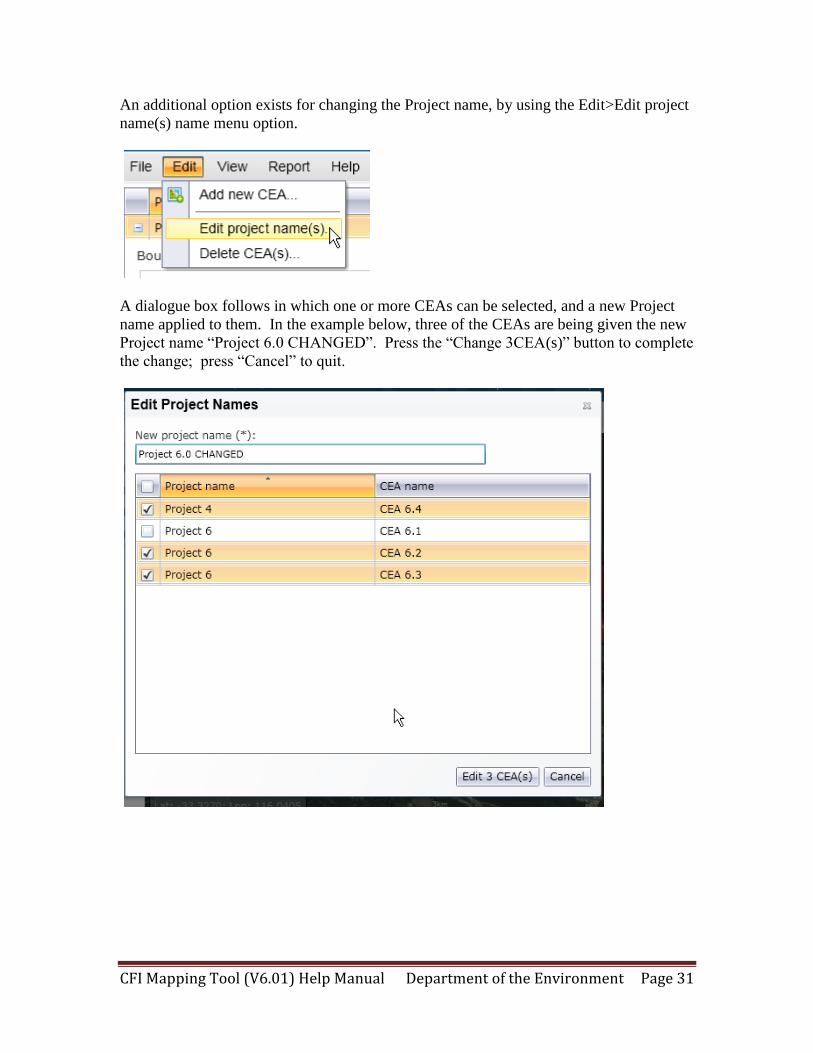
An additional option exists for changing the Project name, by using the Edit>Edit project
name(s) name menu option.
A dialogue box follows in which one or more CEAs can be selected, and a new Project
name applied to them. In the example below, three of the CEAs are being given the new
Project name “Project 6.0 CHANGED”. Press the “Change 3CEA(s)” button to complete
the change; press “Cancel” to quit.
CFI Mapping Tool (V6.01) Help Manual Department of the Environment Page 32
How do I …
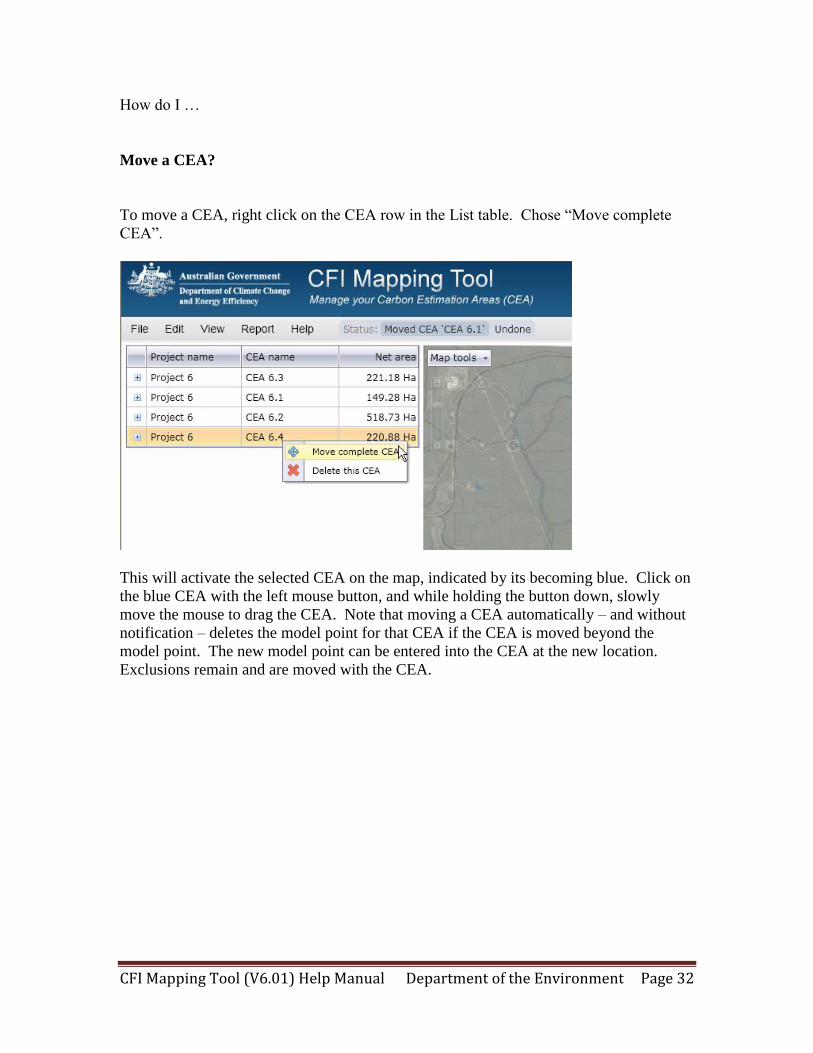
Move a CEA?
To move a CEA, right click on the CEA row in the List table. Chose “Move complete
CEA”.
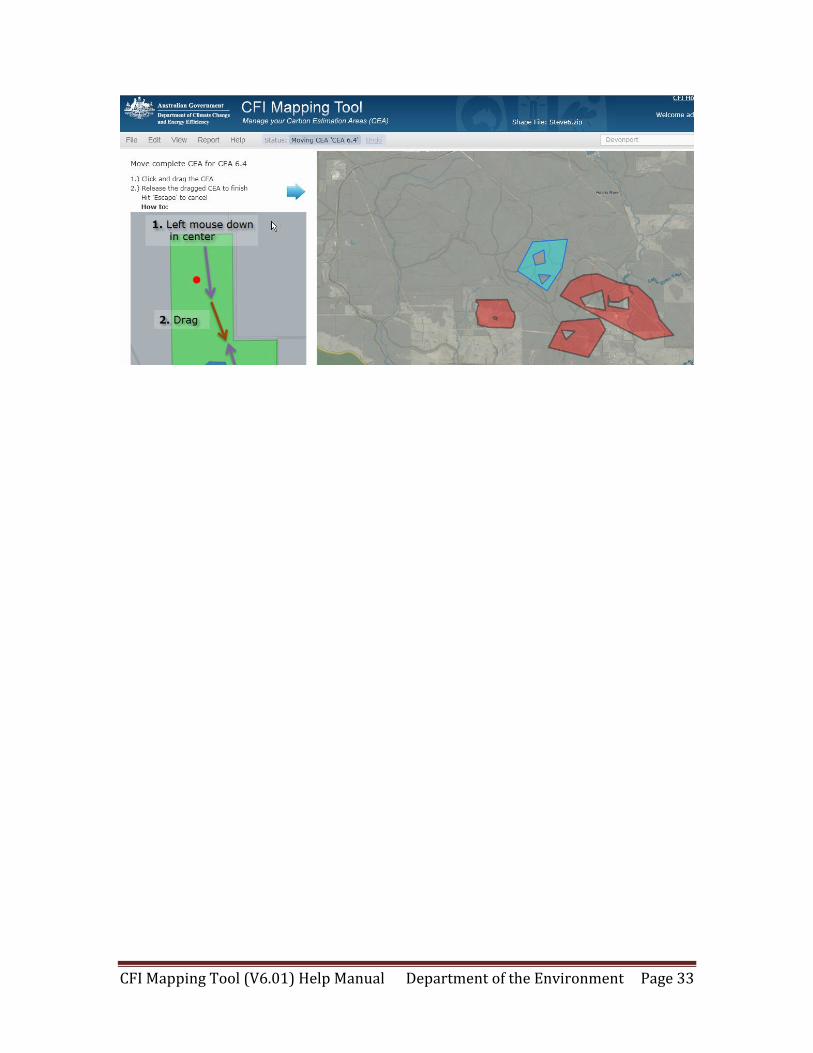
This will activate the selected CEA on the map, indicated by its becoming blue. Click on
the blue CEA with the left mouse button, and while holding the button down, slowly
move the mouse to drag the CEA. Note that moving a CEA automatically – and without
notification – deletes the model point for that CEA if the CEA is moved beyond the
model point. The new model point can be entered into the CEA at the new location.
Exclusions remain and are moved with the CEA.
CFI Mapping Tool (V6.01) Help Manual Department of the Environment Page 33
CFI Mapping Tool (V6.01) Help Manual Department of the Environment Page 34
How do I …
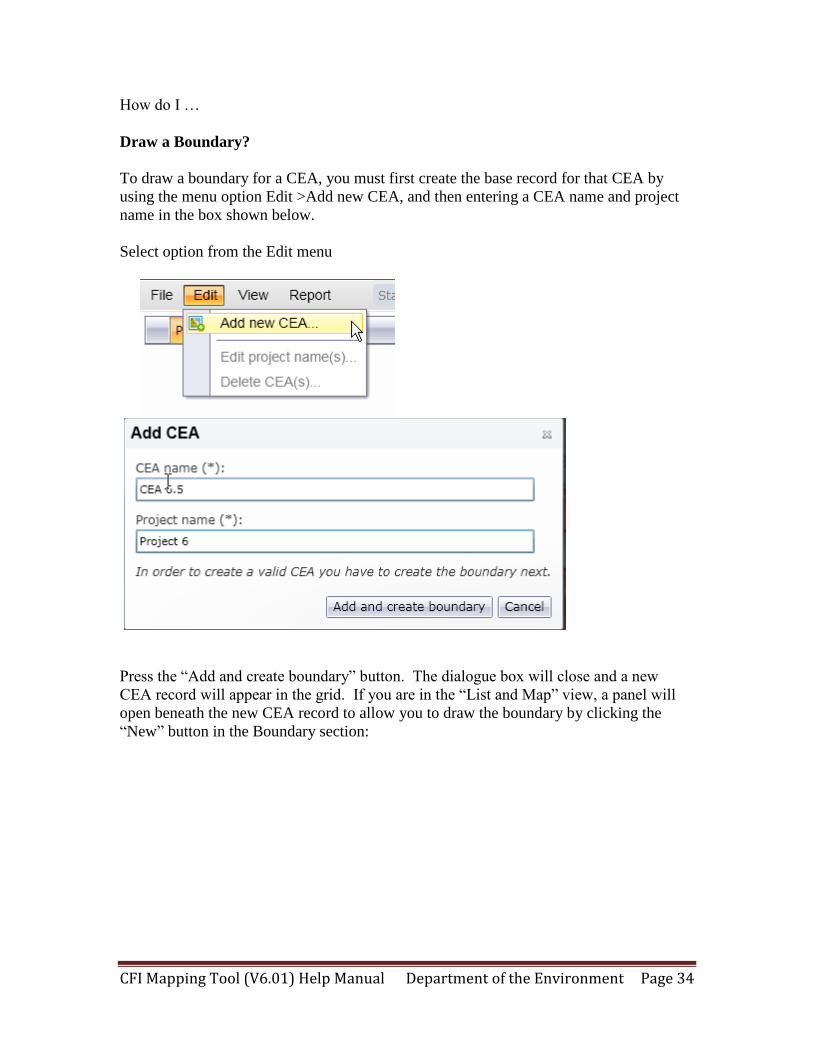
Draw a Boundary?
To draw a boundary for a CEA, you must first create the base record for that CEA by
using the menu option Edit >Add new CEA, and then entering a CEA name and project
name in the box shown below.
Select option from the Edit menu
Press the “Add and create boundary” button. The dialogue box will close and a new
CEA record will appear in the grid. If you are in the “List and Map” view, a panel will
open beneath the new CEA record to allow you to draw the boundary by clicking the
“New” button in the Boundary section:
CFI Mapping Tool (V6.01) Help Manual Department of the Environment Page 35
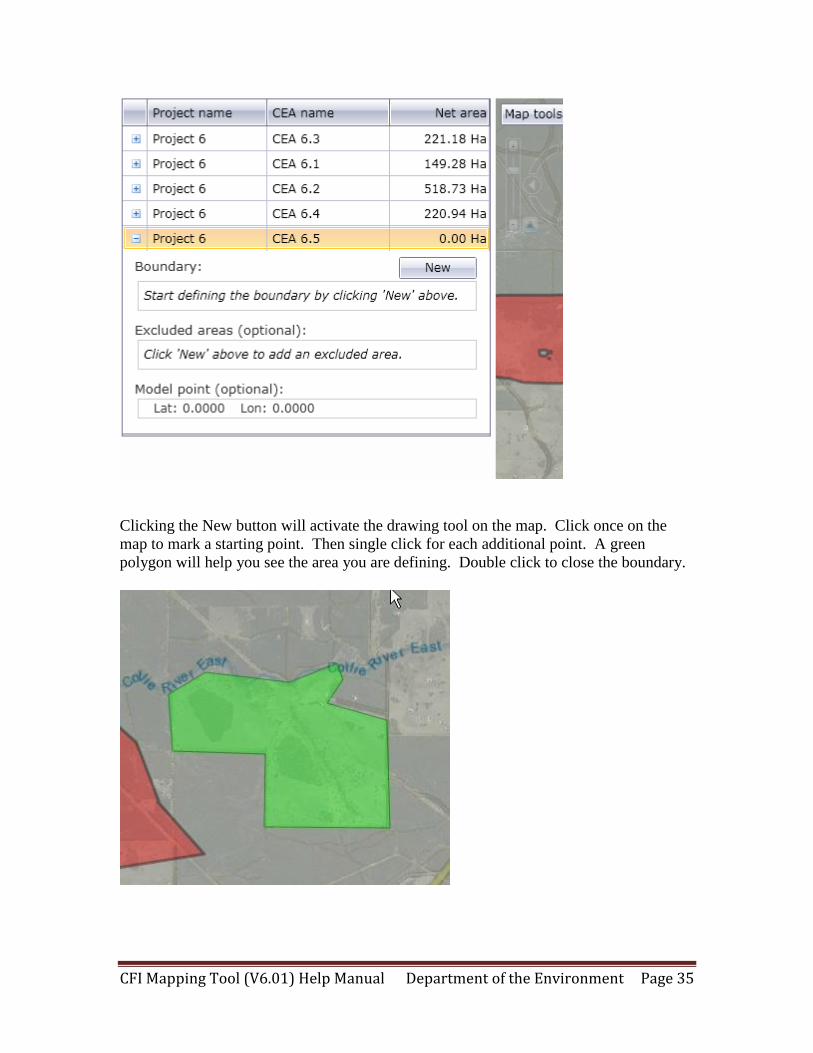
Clicking the New button will activate the drawing tool on the map. Click once on the
map to mark a starting point. Then single click for each additional point. A green
polygon will help you see the area you are defining. Double click to close the boundary.
CFI Mapping Tool (V6.01) Help Manual Department of the Environment Page 36
How do I …
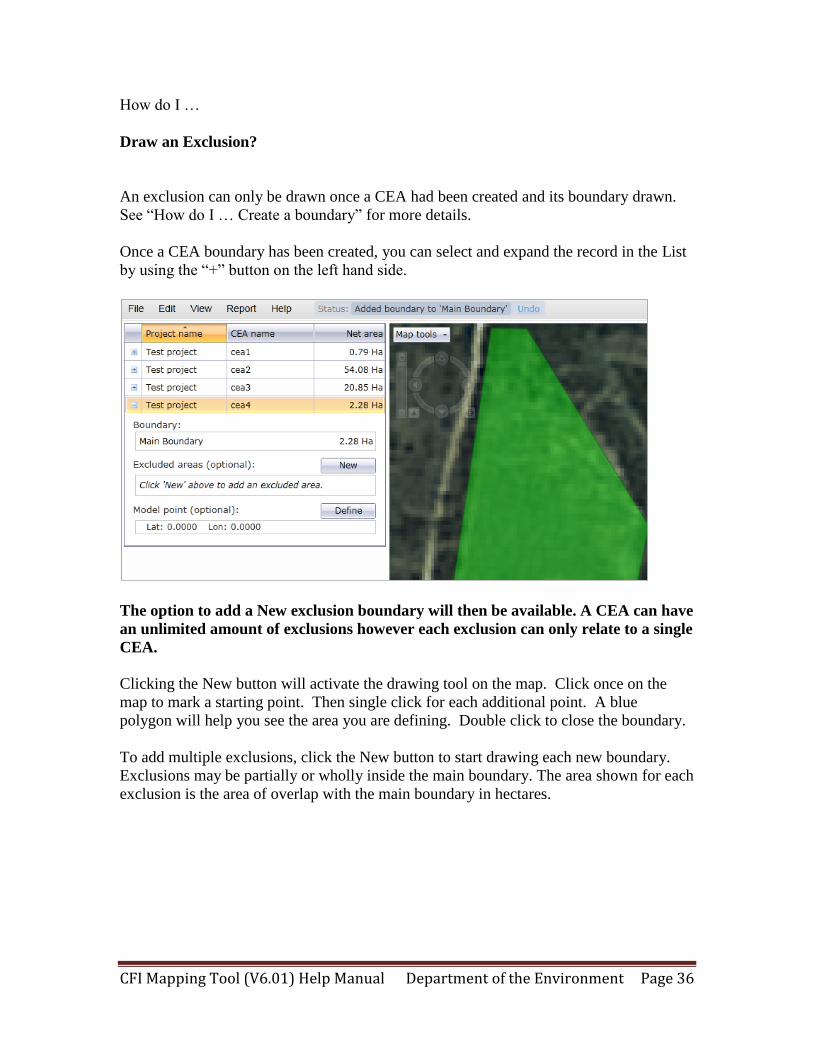
Draw an Exclusion?
An exclusion can only be drawn once a CEA had been created and its boundary drawn.
See “How do I … Create a boundary” for more details.
Once a CEA boundary has been created, you can select and expand the record in the List
by using the “+” button on the left hand side.
The option to add a New exclusion boundary will then be available. A CEA can have
an unlimited amount of exclusions however each exclusion can only relate to a single
CEA.
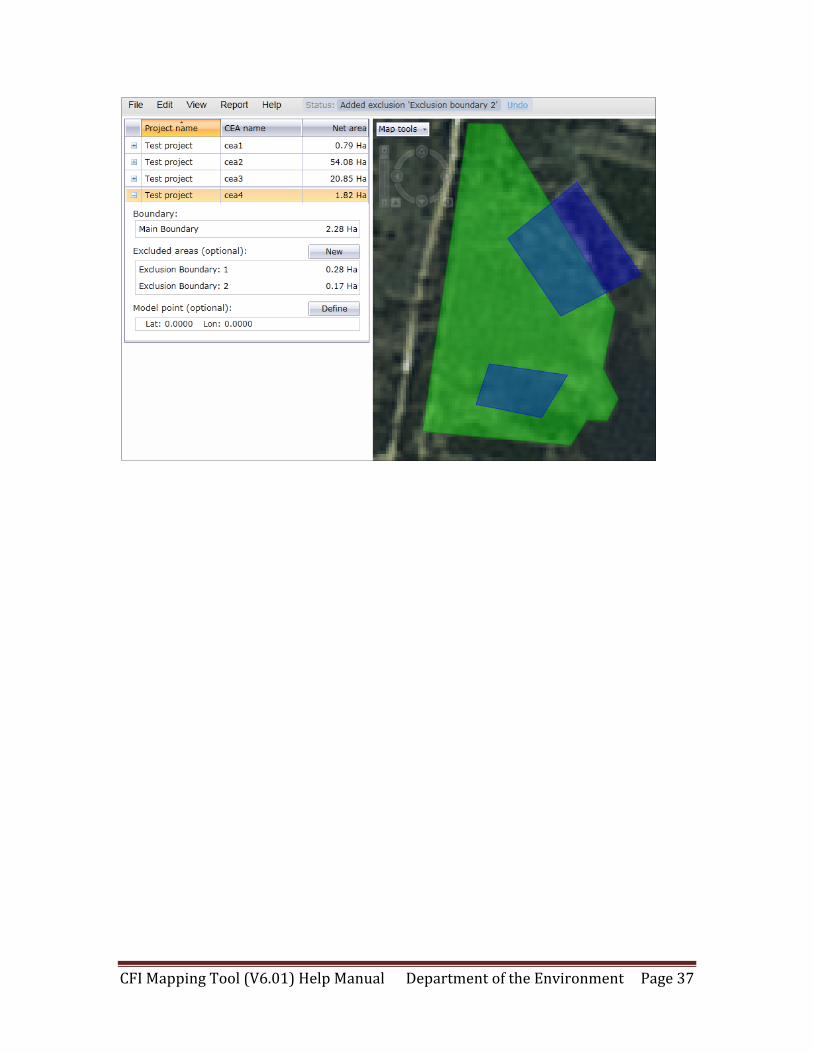
Clicking the New button will activate the drawing tool on the map. Click once on the
map to mark a starting point. Then single click for each additional point. A blue
polygon will help you see the area you are defining. Double click to close the boundary.
To add multiple exclusions, click the New button to start drawing each new boundary.
Exclusions may be partially or wholly inside the main boundary. The area shown for each
exclusion is the area of overlap with the main boundary in hectares.
CFI Mapping Tool (V6.01) Help Manual Department of the Environment Page 37
CFI Mapping Tool (V6.01) Help Manual Department of the Environment Page 38
How do I …
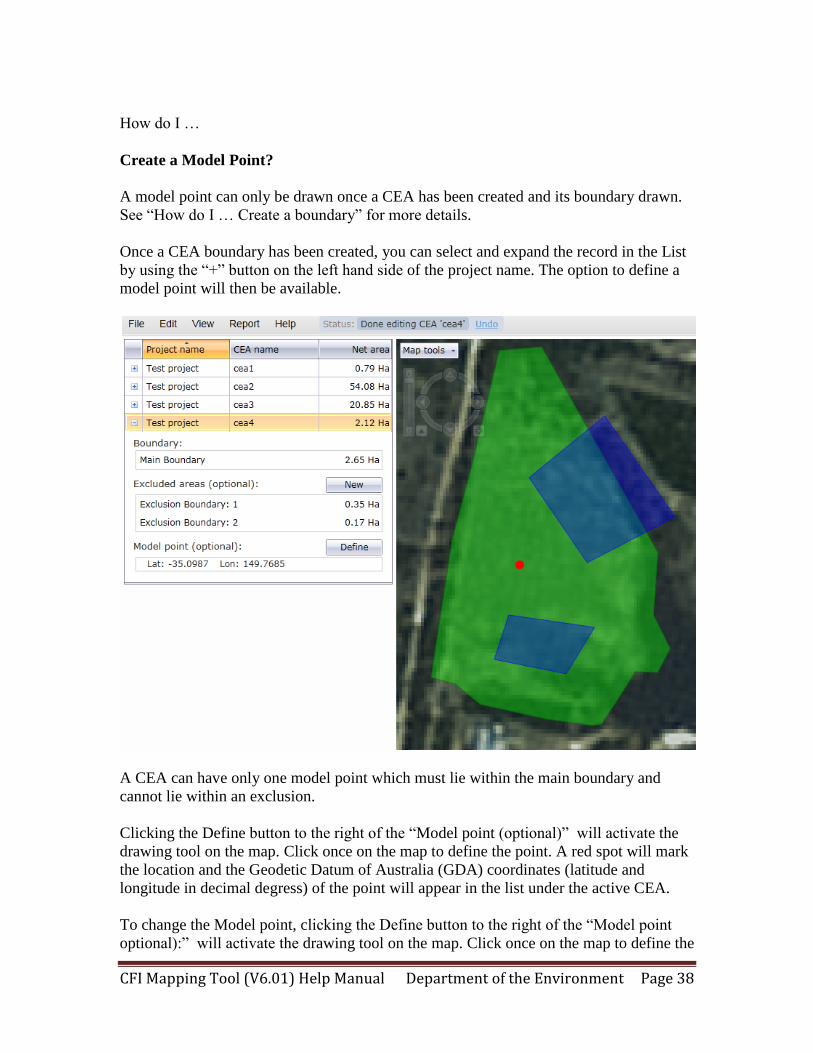
Create a Model Point?
A model point can only be drawn once a CEA has been created and its boundary drawn.
See “How do I … Create a boundary” for more details.
Once a CEA boundary has been created, you can select and expand the record in the List
by using the “+” button on the left hand side of the project name. The option to define a
model point will then be available.
A CEA can have only one model point which must lie within the main boundary and
cannot lie within an exclusion.
Clicking the Define button to the right of the “Model point (optional)” will activate the
drawing tool on the map. Click once on the map to define the point. A red spot will mark
the location and the Geodetic Datum of Australia (GDA) coordinates (latitude and
longitude in decimal degress) of the point will appear in the list under the active CEA.
To change the Model point, clicking the Define button to the right of the “Model point
optional):” will activate the drawing tool on the map. Click once on the map to define the
CFI Mapping Tool (V6.01) Help Manual Department of the Environment Page 39
point. A red spot will mark the location and the Geodetic Datum of Australia (GDA)
coordinates (latitude and longitude in decimal degress) of the point will appear in the list
under the active CEA.
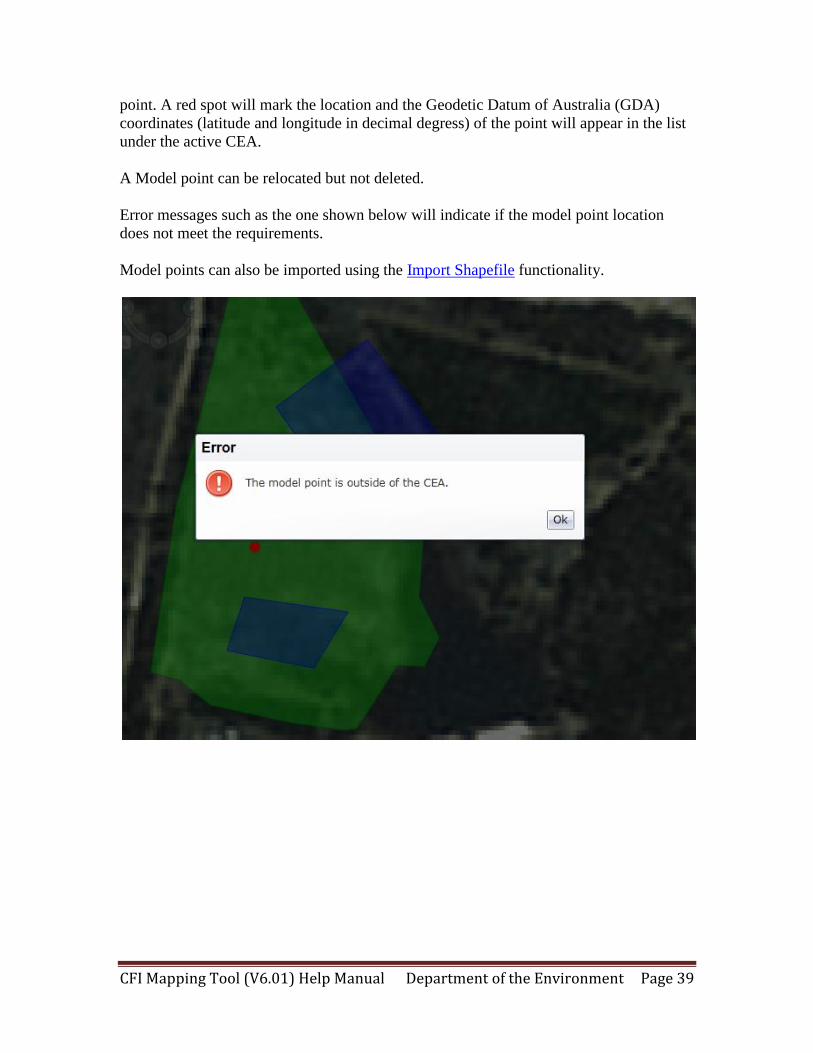
A Model point can be relocated but not deleted.
Error messages such as the one shown below will indicate if the model point location
does not meet the requirements.
Model points can also be imported using the Import Shapefile functionality.
CFI Mapping Tool (V6.01) Help Manual Department of the Environment Page 40
How do I …
Edit a Boundary?
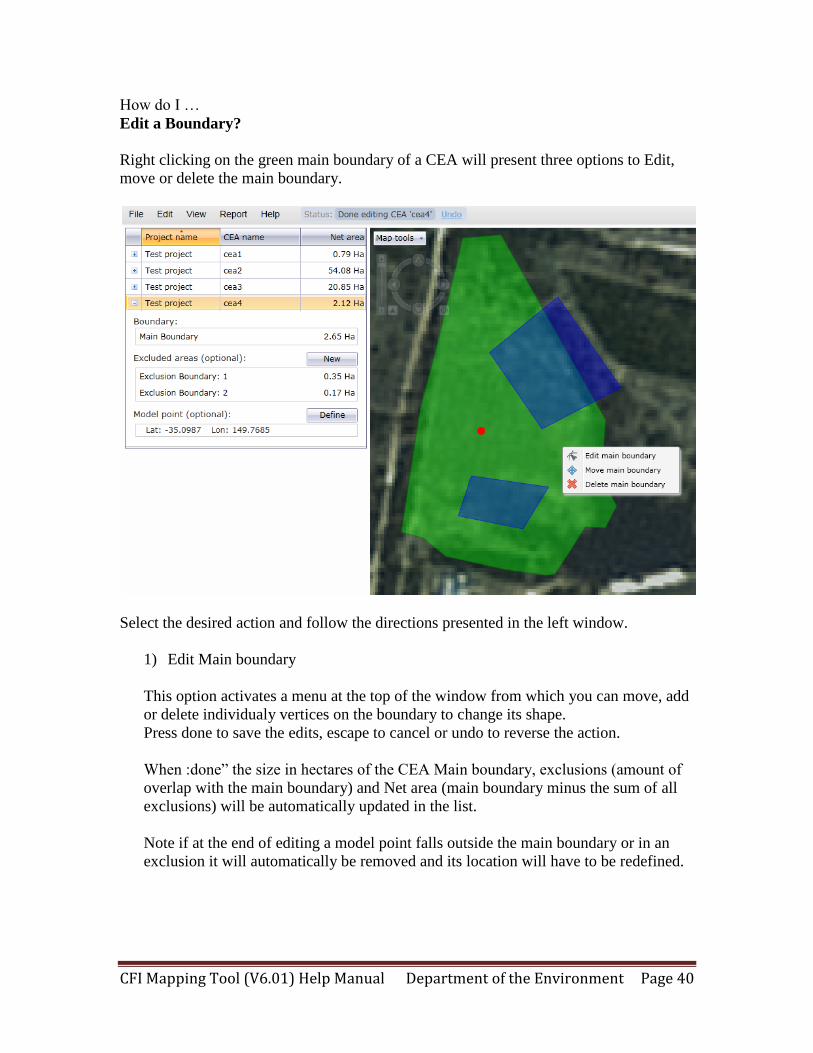
Right clicking on the green main boundary of a CEA will present three options to Edit,
move or delete the main boundary.
Select the desired action and follow the directions presented in the left window.
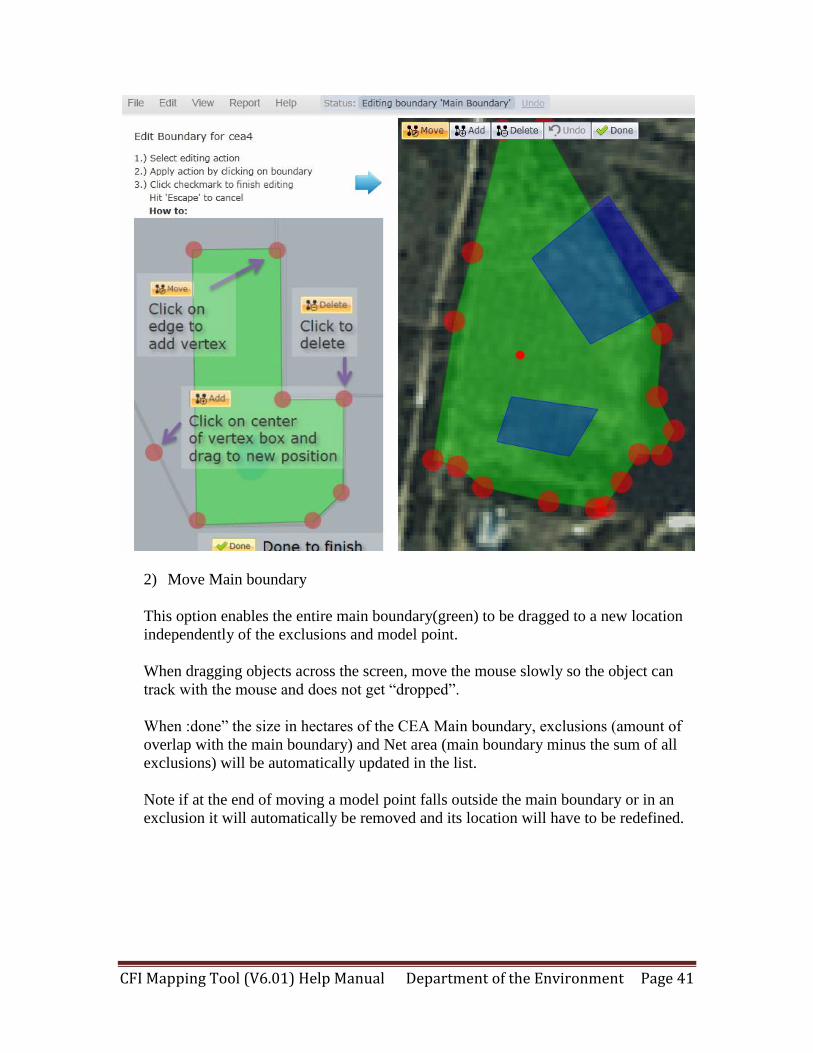
1) Edit Main boundary
This option activates a menu at the top of the window from which you can move, add
or delete individualy vertices on the boundary to change its shape.
Press done to save the edits, escape to cancel or undo to reverse the action.
When :done” the size in hectares of the CEA Main boundary, exclusions (amount of
overlap with the main boundary) and Net area (main boundary minus the sum of all
exclusions) will be automatically updated in the list.
Note if at the end of editing a model point falls outside the main boundary or in an
exclusion it will automatically be removed and its location will have to be redefined.
CFI Mapping Tool (V6.01) Help Manual Department of the Environment Page 41
2) Move Main boundary
This option enables the entire main boundary(green) to be dragged to a new location
independently of the exclusions and model point.
When dragging objects across the screen, move the mouse slowly so the object can
track with the mouse and does not get “dropped”.
When :done” the size in hectares of the CEA Main boundary, exclusions (amount of
overlap with the main boundary) and Net area (main boundary minus the sum of all
exclusions) will be automatically updated in the list.
Note if at the end of moving a model point falls outside the main boundary or in an
exclusion it will automatically be removed and its location will have to be redefined.
CFI Mapping Tool (V6.01) Help Manual Department of the Environment Page 42
3) Delete Main boundary
When this option is chosen, the entire CEA main boundary, associated exclusions
and model point are removed. Click undo from the status bar at the top of the window
to reverse this action.
The CEA will still be present in the list but its net area will be 0 ha and you will be
presented with the New boundary button to created a new main boundary for that
CEA.
If, after deleting the main boundary from the map, you also wish to remove the CEA
from the list entirely, select Edit / Delete CEA(s) from the top menu and check the
box next to the relevant CEA followed by the delete CEAs button at the bottom of the
dialogue box.
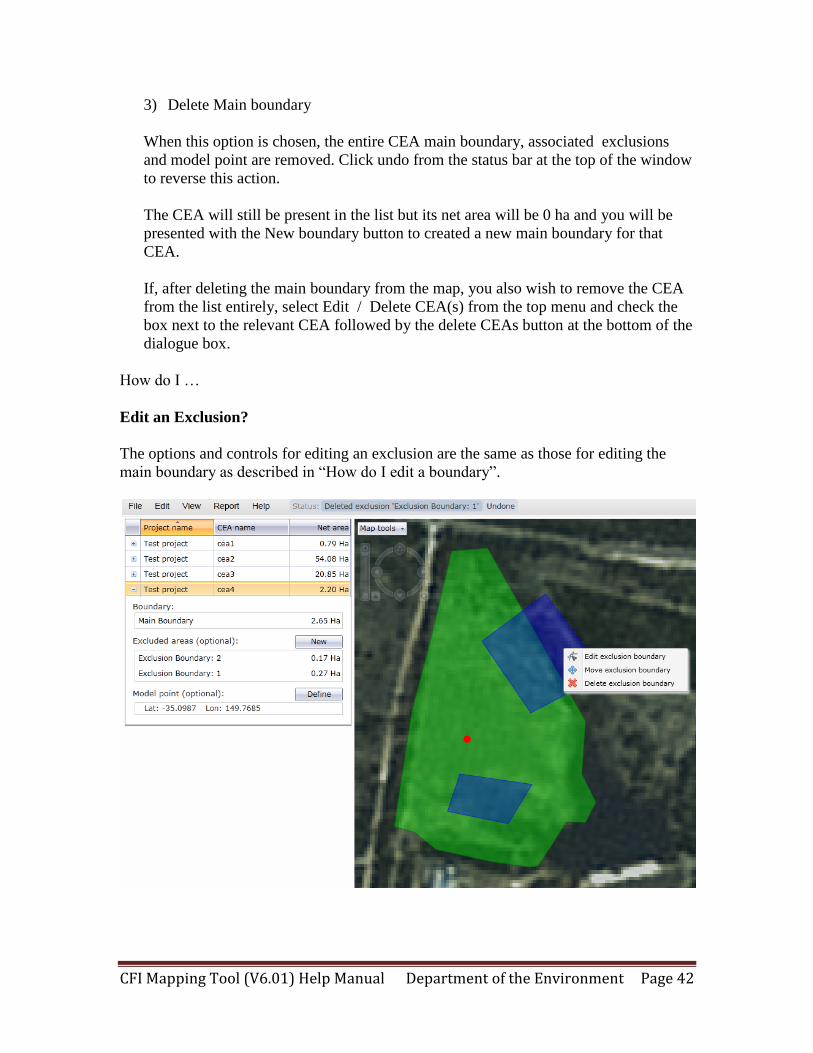
How do I …
Edit an Exclusion?
The options and controls for editing an exclusion are the same as those for editing the
main boundary as described in “How do I edit a boundary”.
CFI Mapping Tool (V6.01) Help Manual Department of the Environment Page 43
Note that if at the end of editing an exclusion, the model point falls outside the main
boundary or inside an exclusion, it will automatically be removed and its location will
have to be redefined.
How do I …
Change a Model Point?
Once a model point has been added, it can be changed by pressing the define button again
and clicking the mouse on the map in the new desired location. The initial point will be
removed and the new point will be shown. The longitude and latitude will also be
updated to reflect the new location of the model point.
The same rules apply as for adding a model point. The new point must lie within a main
boundary and not be within an exclusion.
How do I …
Delete a Boundary?
A boundary can be deleted in two ways:
1) Main menu Edit/ Delete CEA(s)
This will delete the whole CEA from both the list and map including the main
boundary and any exclusions and model point
2) Right click inside the main boundary and choose Delete main boundary.
This will delete the whole CEA from the map including the main boundary and
any exclusions and model point, however the record will remain in the list and a
new boundary for this CEA can then be added.
How do I …
Delete an Exclusion?
Exclusions are deleted by right clicking inside the blue exclusion area on the map and
choosing to delete exclusion boundary.
How do I …
Delete a Model Point?
Once placed, a model point can only be changed see note s under “How do I Change a
Model Point”. To delete the point entirely, the entire CEA must be deleted and redrawn.
CFI Mapping Tool (V6.01) Help Manual Department of the Environment Page 44
How do I …
Move a Model Point?
See notes under “How do I change a Model Point?”
How do I …
Move a Boundary ?
See notes under “How do I Edit a Boundary?”
How do I …
Move an Exclusion?
See notes under “How do I Edit an Exclusion?”
CFI Mapping Tool (V6.01) Help Manual Department of the Environment Page 45
Managing one or more Carbon Estimation Areas:
How do I …
See more data?
How do I …
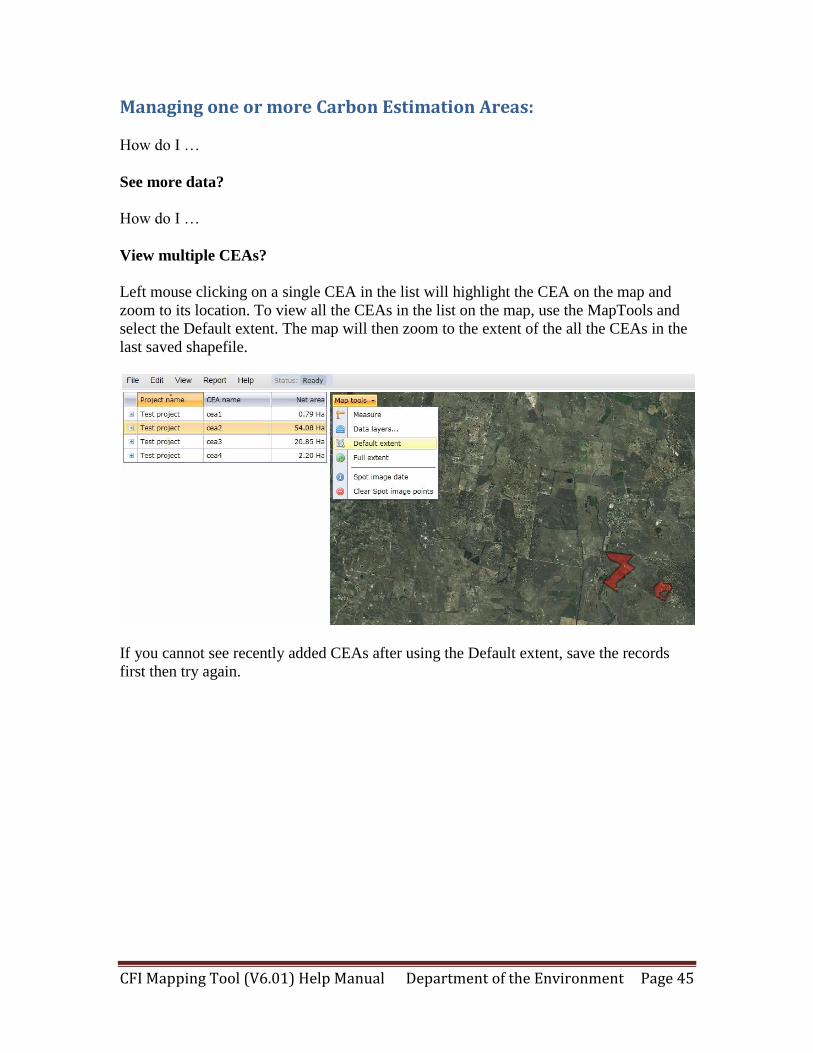
View multiple CEAs?
Left mouse clicking on a single CEA in the list will highlight the CEA on the map and
zoom to its location. To view all the CEAs in the list on the map, use the MapTools and
select the Default extent. The map will then zoom to the extent of the all the CEAs in the
last saved shapefile.
If you cannot see recently added CEAs after using the Default extent, save the records
first then try again.
CFI Mapping Tool (V6.01) Help Manual Department of the Environment Page 46
How do I …
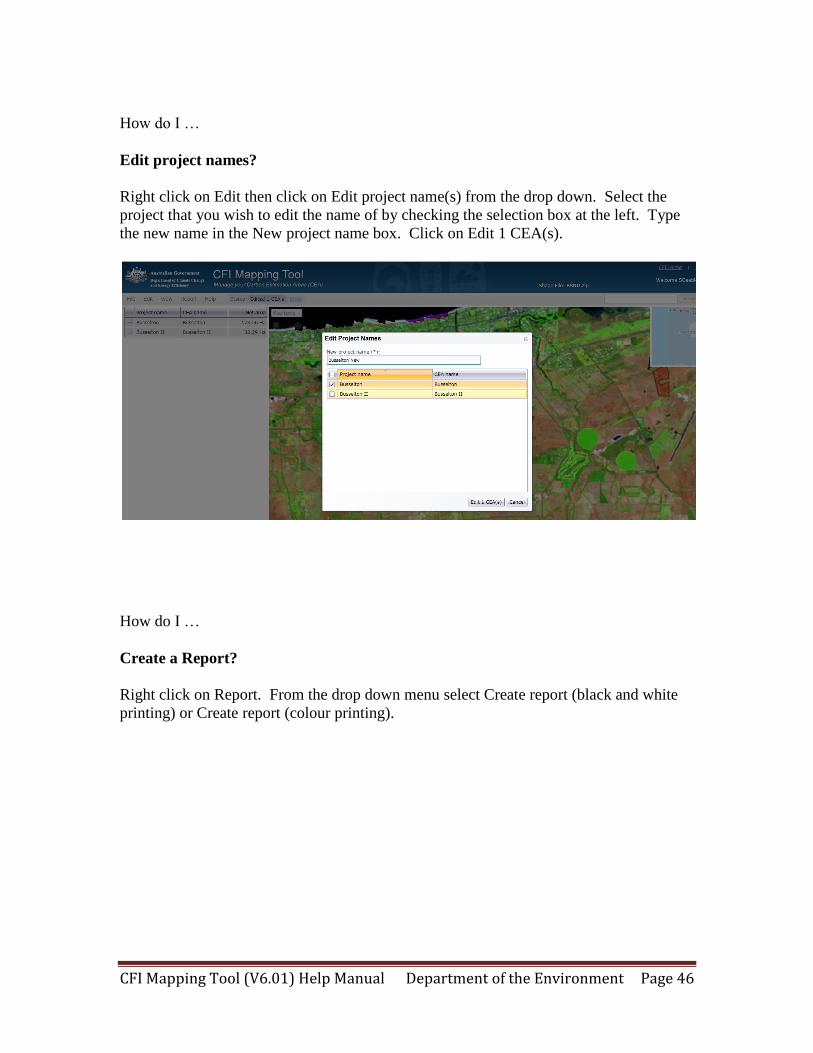
Edit project names?
Right click on Edit then click on Edit project name(s) from the drop down. Select the
project that you wish to edit the name of by checking the selection box at the left. Type
the new name in the New project name box. Click on Edit 1 CEA(s).
How do I …
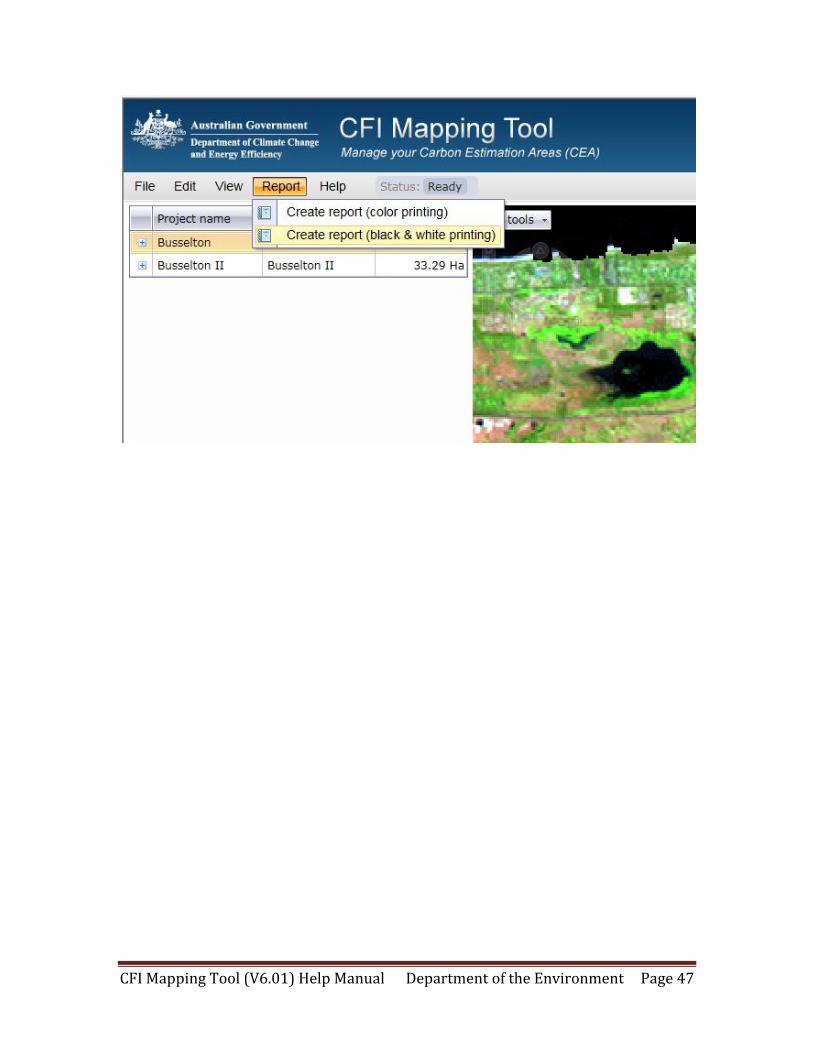
Create a Report?
Right click on Report. From the drop down menu select Create report (black and white
printing) or Create report (colour printing).
CFI Mapping Tool (V6.01) Help Manual Department of the Environment Page 47
CFI Mapping Tool (V6.01) Help Manual Department of the Environment Page 48
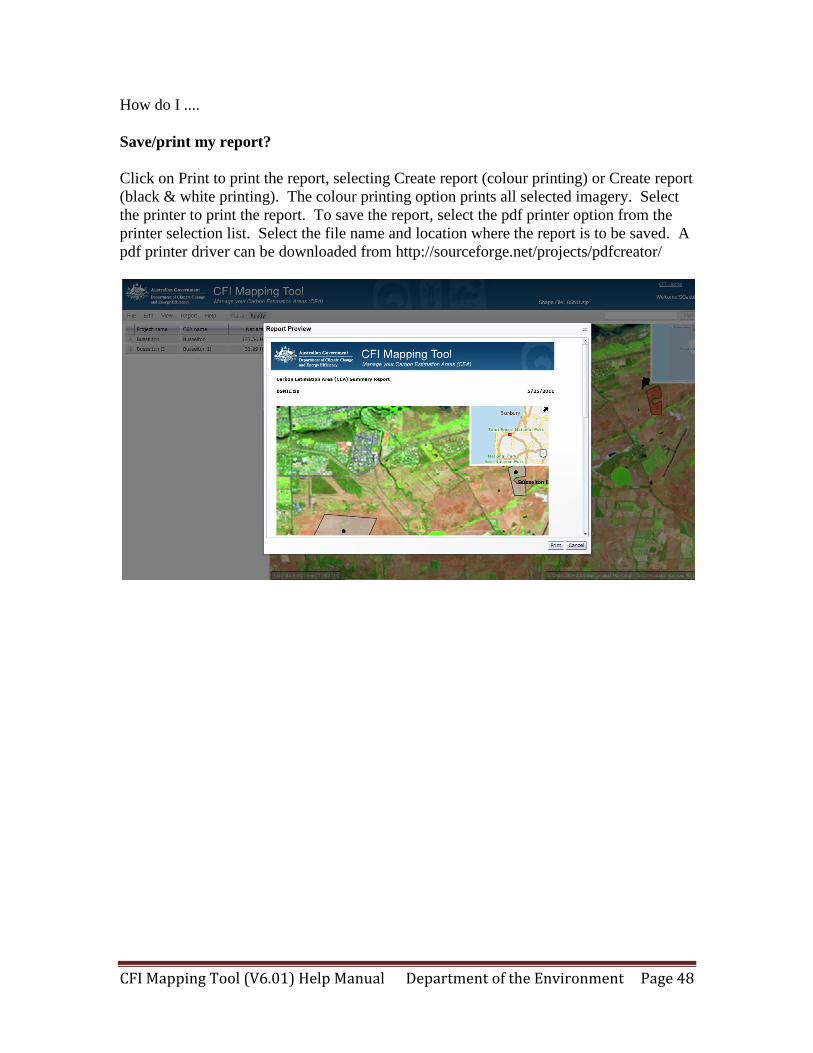
How do I ....
Save/print my report?
Click on Print to print the report, selecting Create report (colour printing) or Create report
(black & white printing). The colour printing option prints all selected imagery. Select
the printer to print the report. To save the report, select the pdf printer option from the
printer selection list. Select the file name and location where the report is to be saved. A
pdf printer driver can be downloaded from http://sourceforge.net/projects/pdfcreator/
CFI Mapping Tool (V6.01) Help Manual Department of the Environment Page 49
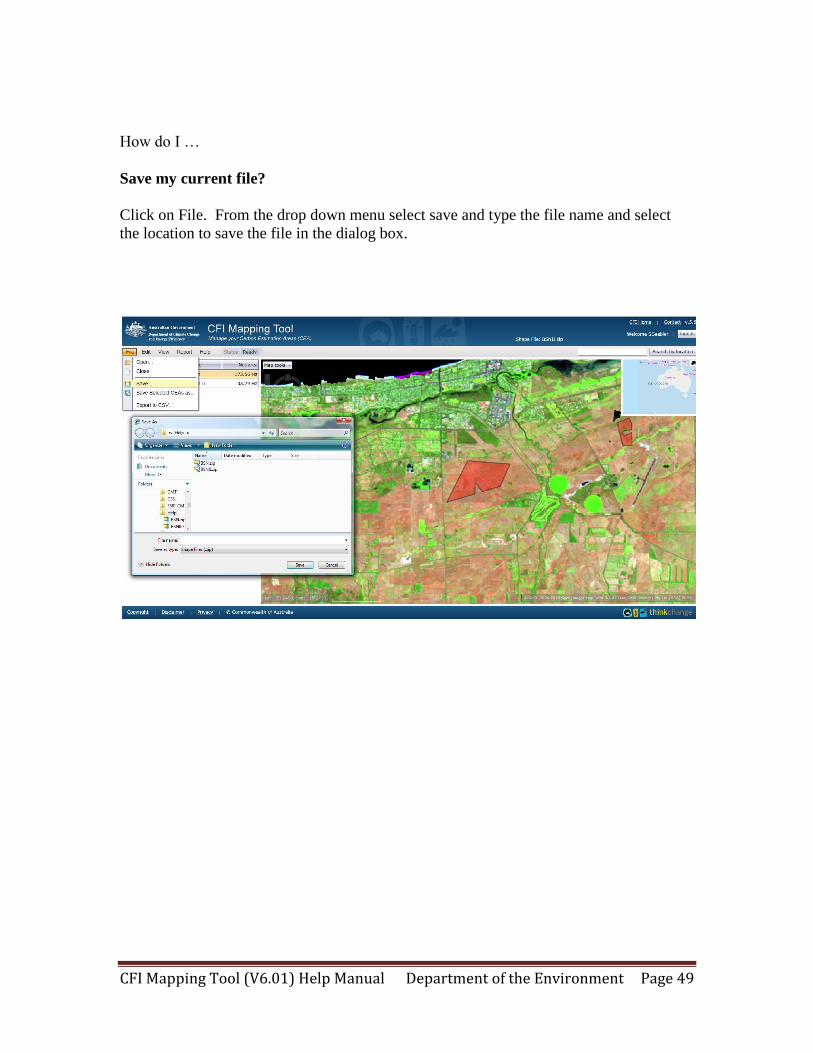
How do I …
Save my current file?
Click on File. From the drop down menu select save and type the file name and select
the location to save the file in the dialog box.
CFI Mapping Tool (V6.01) Help Manual Department of the Environment Page 50
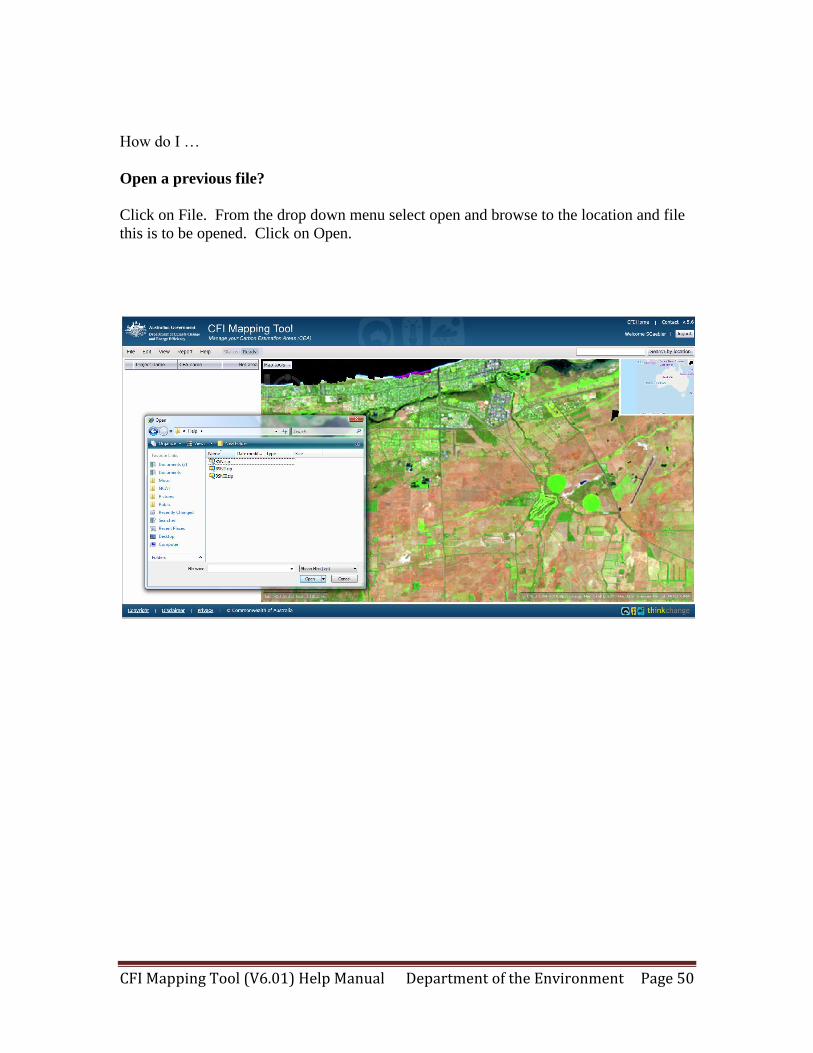
How do I …
Open a previous file?
Click on File. From the drop down menu select open and browse to the location and file
this is to be opened. Click on Open.
CFI Mapping Tool (V6.01) Help Manual Department of the Environment Page 51
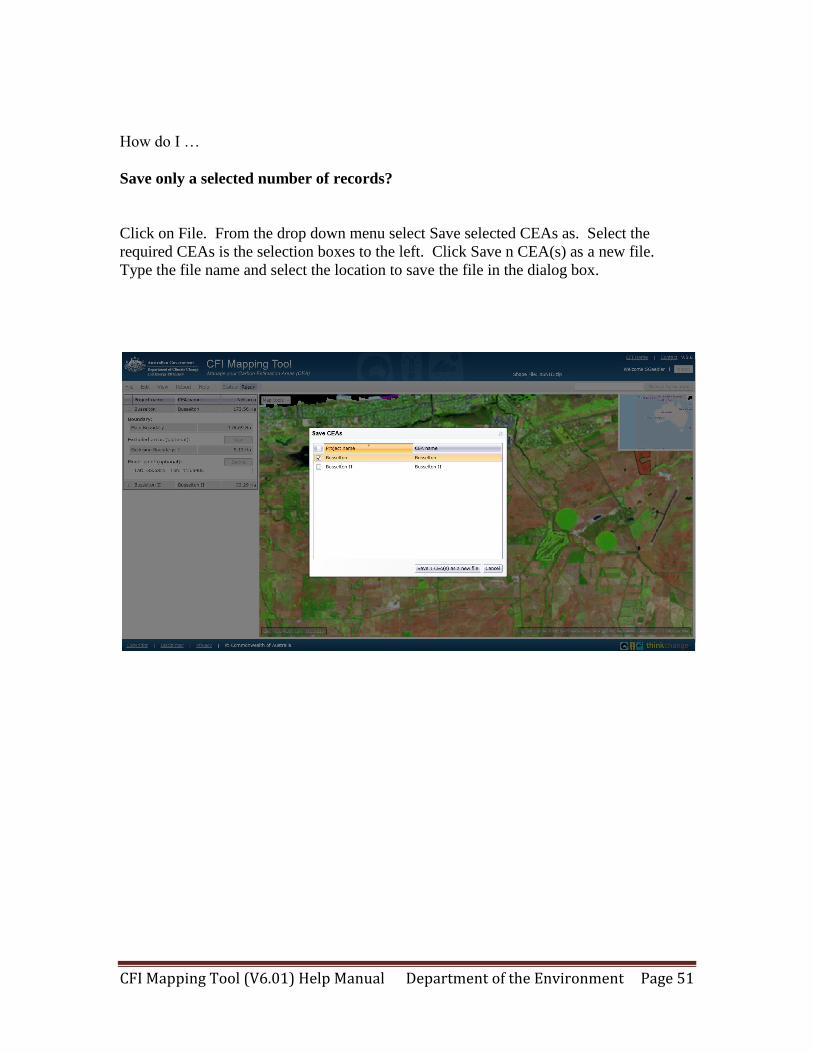
How do I …
Save only a selected number of records?
Click on File. From the drop down menu select Save selected CEAs as. Select the
required CEAs is the selection boxes to the left. Click Save n CEA(s) as a new file.
Type the file name and select the location to save the file in the dialog box.
CFI Mapping Tool (V6.01) Help Manual Department of the Environment Page 52
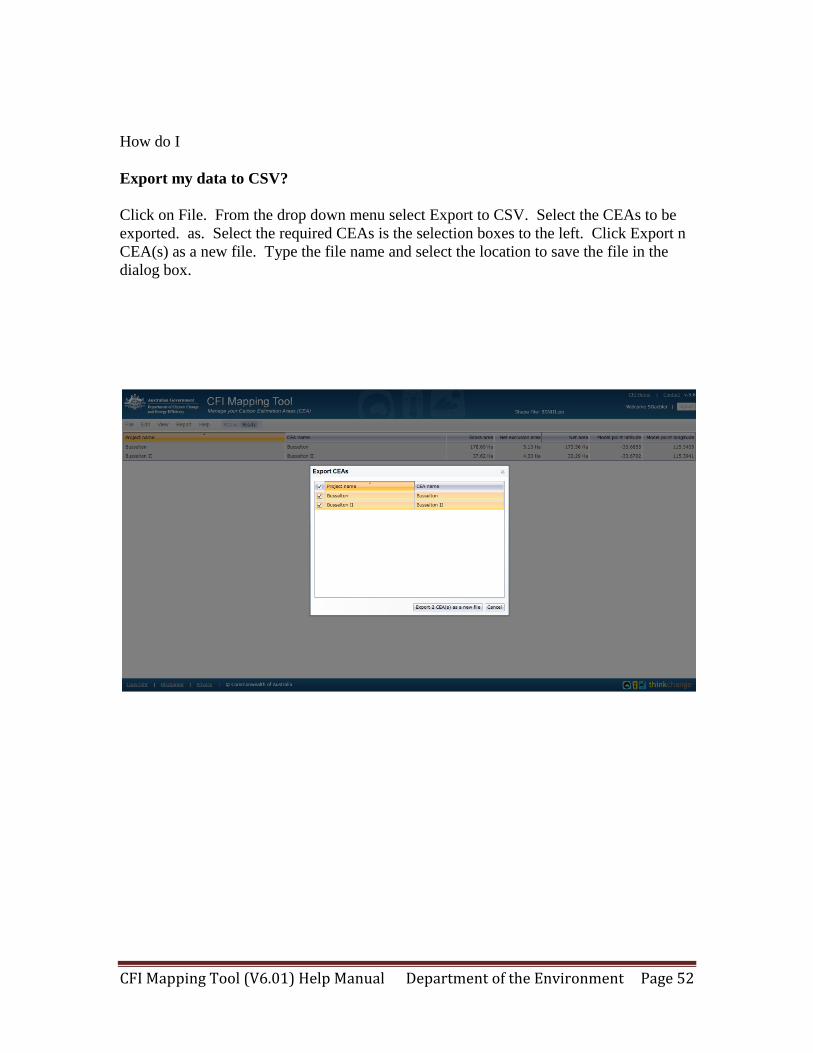
How do I
Export my data to CSV?
Click on File. From the drop down menu select Export to CSV. Select the CEAs to be
exported. as. Select the required CEAs is the selection boxes to the left. Click Export n
CEA(s) as a new file. Type the file name and select the location to save the file in the
dialog box.
CFI Mapping Tool (V6.01) Help Manual Department of the Environment Page 53
General actions:
How do I …
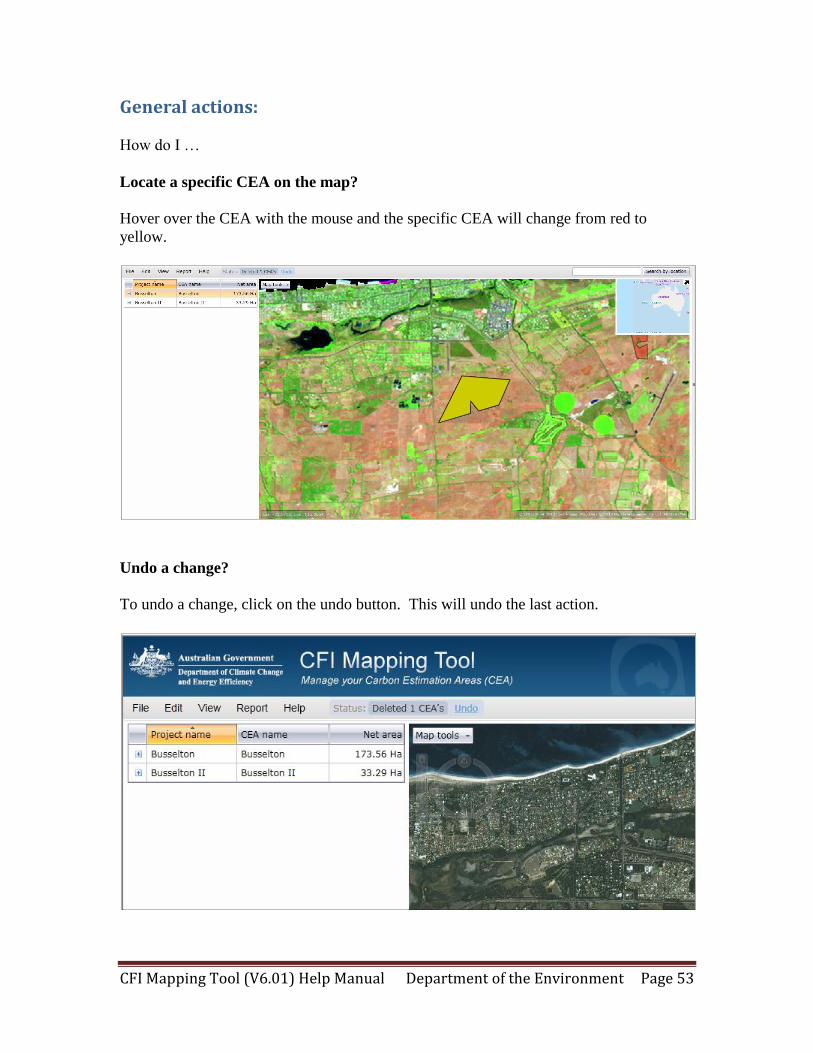
Locate a specific CEA on the map?
Hover over the CEA with the mouse and the specific CEA will change from red to
yellow.
Undo a change?
To undo a change, click on the undo button. This will undo the last action.
CFI Mapping Tool (V6.01) Help Manual Department of the Environment Page 54
Data management:
What is isolated storage?
Isolated Storage is a virtual file system used to store data in a hidden folder on your
machine. It breaks up the data into two separate sections: Section #1 contains
administrative information such as disk quota and section #2 contains the actual data.
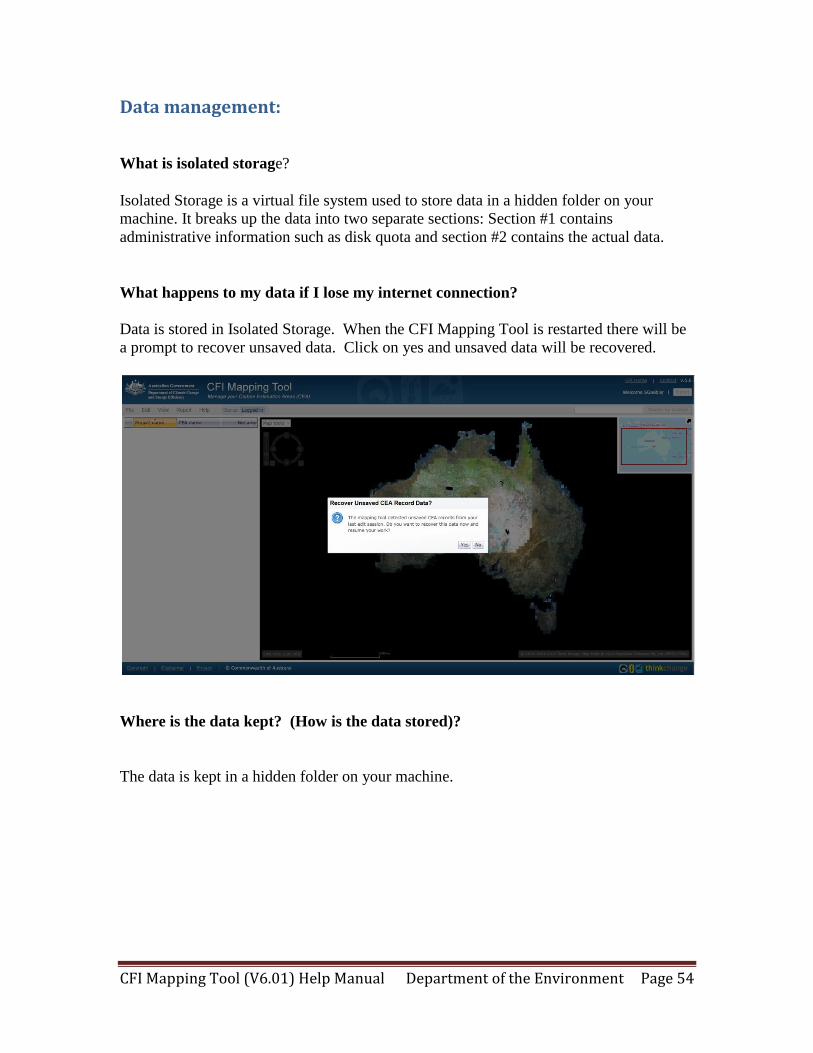
What happens to my data if I lose my internet connection?
Data is stored in Isolated Storage. When the CFI Mapping Tool is restarted there will be
a prompt to recover unsaved data. Click on yes and unsaved data will be recovered.
Where is the data kept? (How is the data stored)?
The data is kept in a hidden folder on your machine.
CFI Mapping Tool (V6.01) Help Manual Department of the Environment Page 55
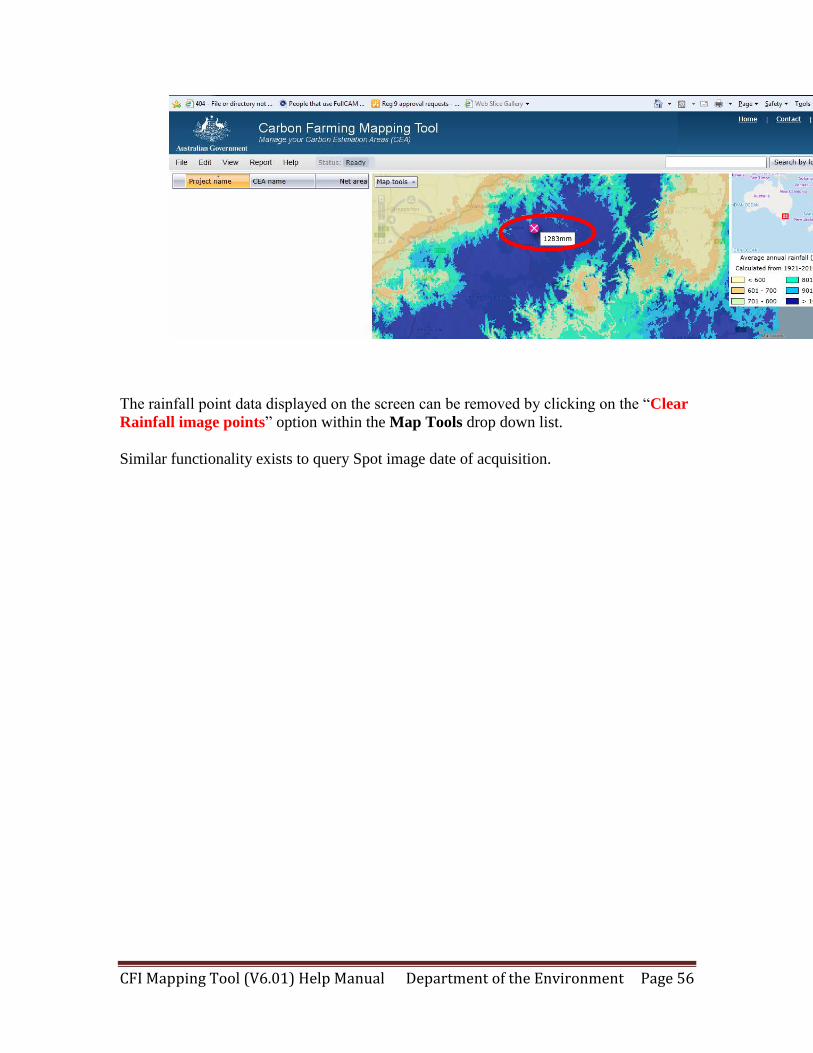
CFI rainfall map
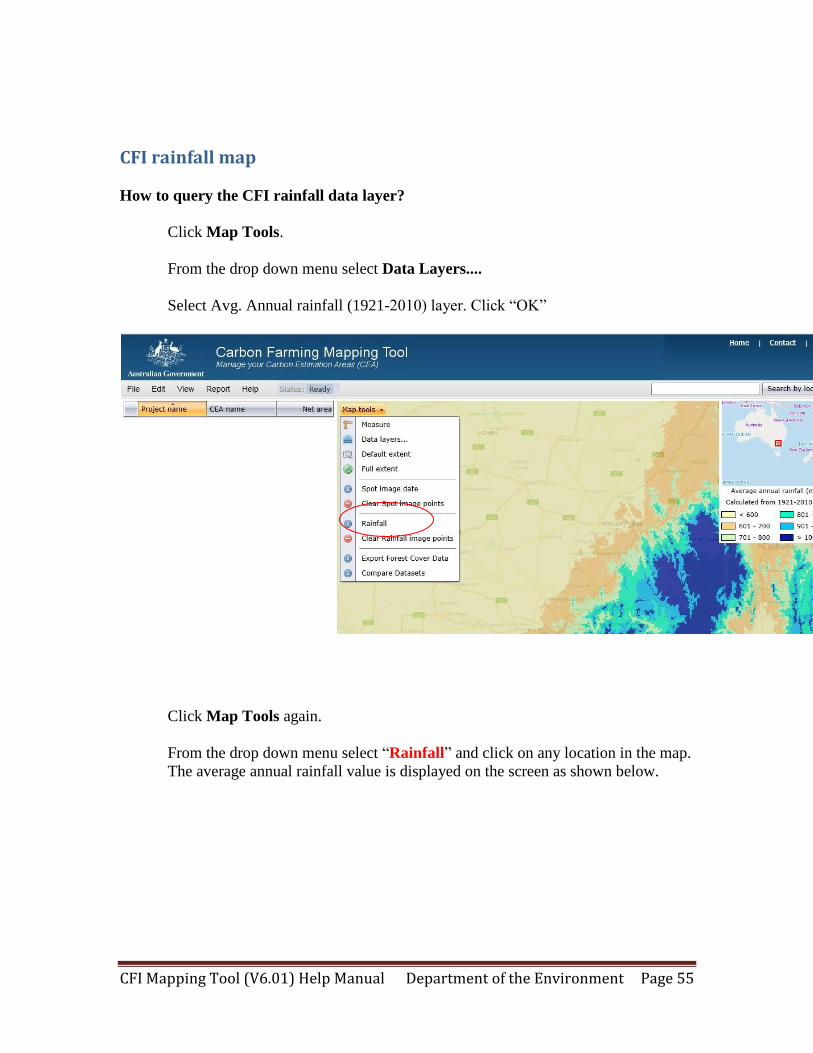
How to query the CFI rainfall data layer?
Click Map Tools.
From the drop down menu select Data Layers....
Select Avg. Annual rainfall (1921-2010) layer. Click “OK”
Click Map Tools again.
From the drop down menu select “Rainfall” and click on any location in the map.
The average annual rainfall value is displayed on the screen as shown below.
CFI Mapping Tool (V6.01) Help Manual Department of the Environment Page 56
The rainfall point data displayed on the screen can be removed by clicking on the “Clear
Rainfall image points” option within the Map Tools drop down list.
Similar functionality exists to query Spot image date of acquisition.
CFI Mapping Tool (V6.01) Help Manual Department of the Environment Page 57
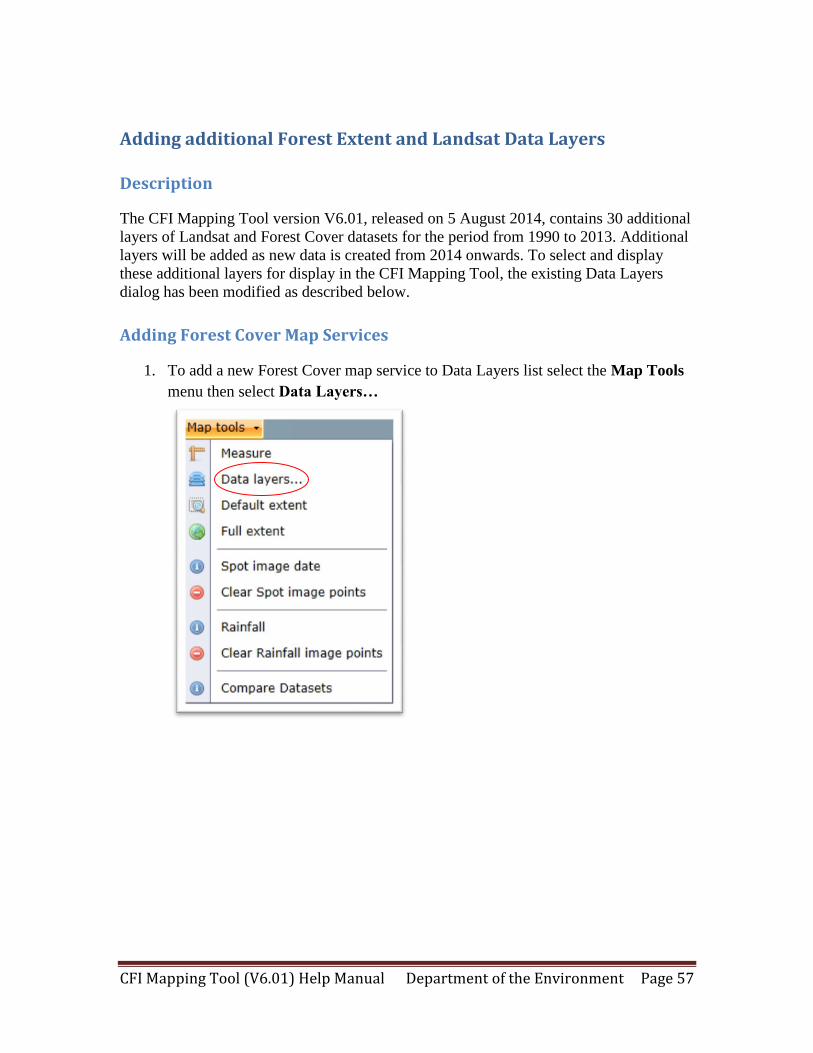
Adding additional Forest Extent and Landsat Data Layers
Description
The CFI Mapping Tool version V6.01, released on 5 August 2014, contains 30 additional
layers of Landsat and Forest Cover datasets for the period from 1990 to 2013. Additional
layers will be added as new data is created from 2014 onwards. To select and display
these additional layers for display in the CFI Mapping Tool, the existing Data Layers
dialog has been modified as described below.
Adding Forest Cover Map Services
1. To add a new Forest Cover map service to Data Layers list select the Map Tools
menu then select Data Layers…
CFI Mapping Tool (V6.01) Help Manual Department of the Environment Page 58
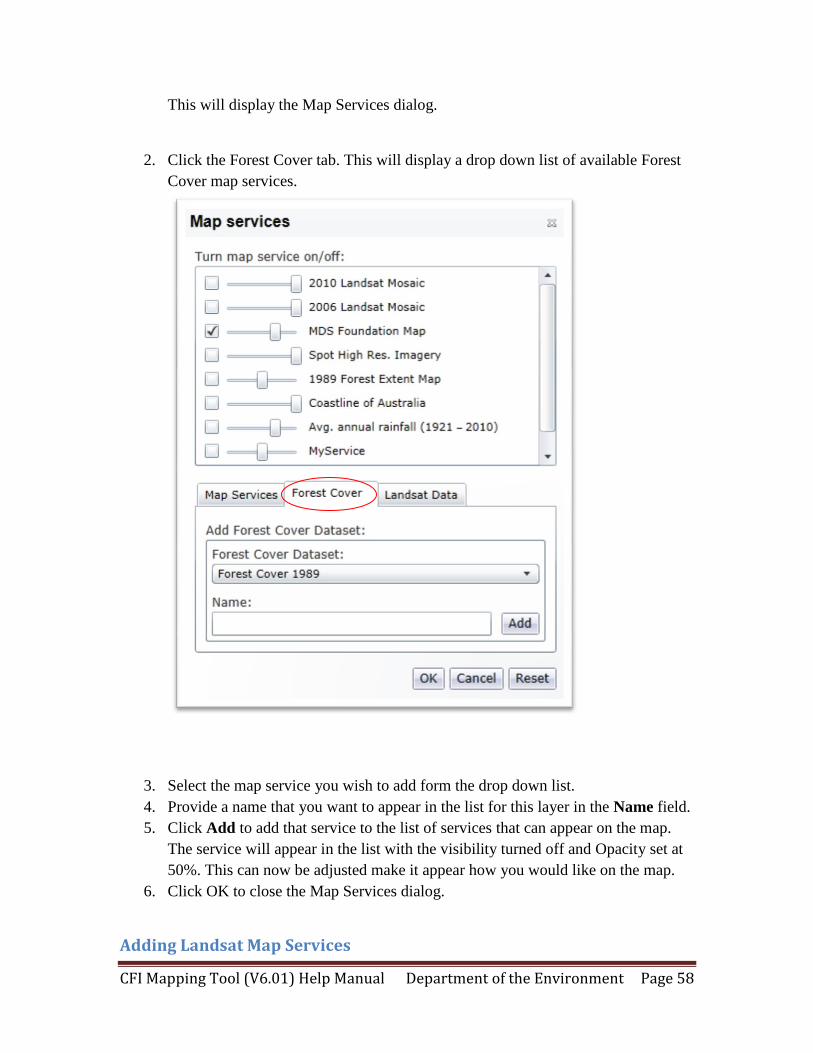
This will display the Map Services dialog.
2. Click the Forest Cover tab. This will display a drop down list of available Forest
Cover map services.
3. Select the map service you wish to add form the drop down list.
4. Provide a name that you want to appear in the list for this layer in the Name field.
5. Click Add to add that service to the list of services that can appear on the map.
The service will appear in the list with the visibility turned off and Opacity set at
50%. This can now be adjusted make it appear how you would like on the map.
6. Click OK to close the Map Services dialog.
Adding Landsat Map Services
CFI Mapping Tool (V6.01) Help Manual Department of the Environment Page 59
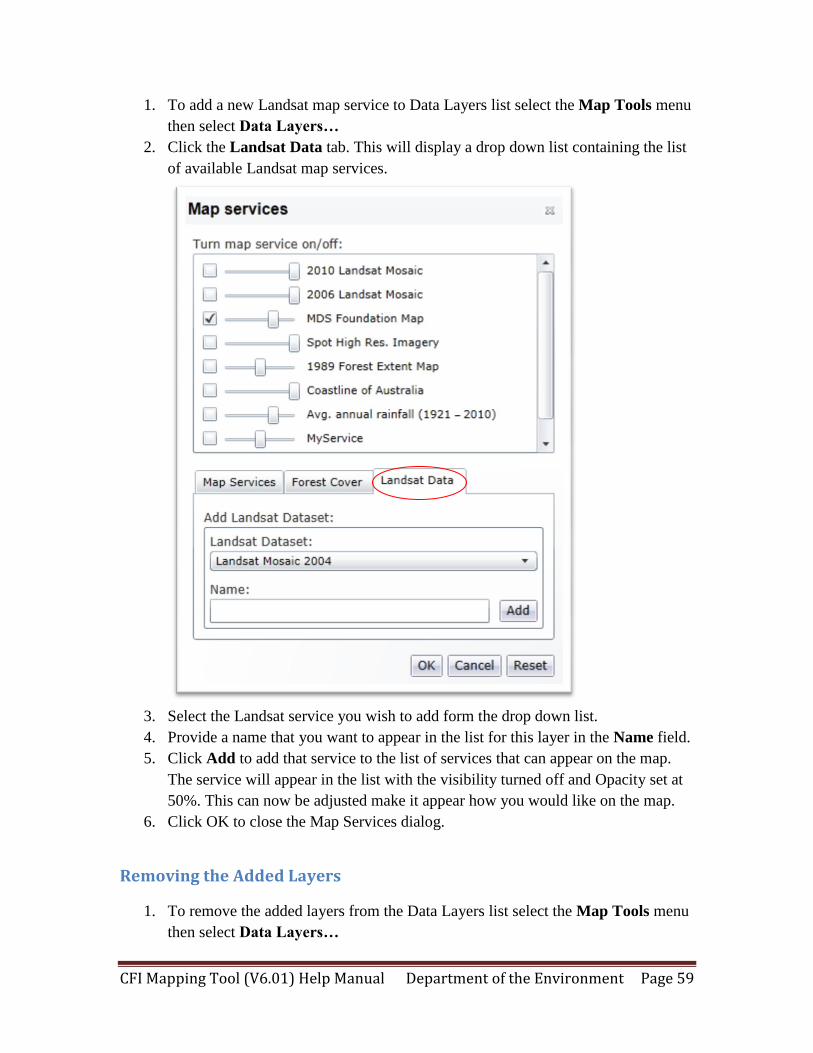
1. To add a new Landsat map service to Data Layers list select the Map Tools menu
then select Data Layers…
2. Click the Landsat Data tab. This will display a drop down list containing the list
of available Landsat map services.
3. Select the Landsat service you wish to add form the drop down list.
4. Provide a name that you want to appear in the list for this layer in the Name field.
5. Click Add to add that service to the list of services that can appear on the map.
The service will appear in the list with the visibility turned off and Opacity set at
50%. This can now be adjusted make it appear how you would like on the map.
6. Click OK to close the Map Services dialog.
Removing the Added Layers
1. To remove the added layers from the Data Layers list select the Map Tools menu
then select Data Layers…
CFI Mapping Tool (V6.01) Help Manual Department of the Environment Page 60
2. Select the Reset button to reset the list to the default layers.
3. Select the OK button to close the dialog
CFI Mapping Tool (V6.01) Help Manual Department of the Environment Page 61
Compare Datasets
Description
The application offers a new swipe tool which allows users to interactively compare two
images from different years and sources. This is achieved by adding a moveable bar to
the map screen that can be dragged back and forth revealing more of one image and
concealing more of the other. The opacity of each image can be adjusted to allow more of
one image to be seen through the other.
Using the Compare Datasets Tool
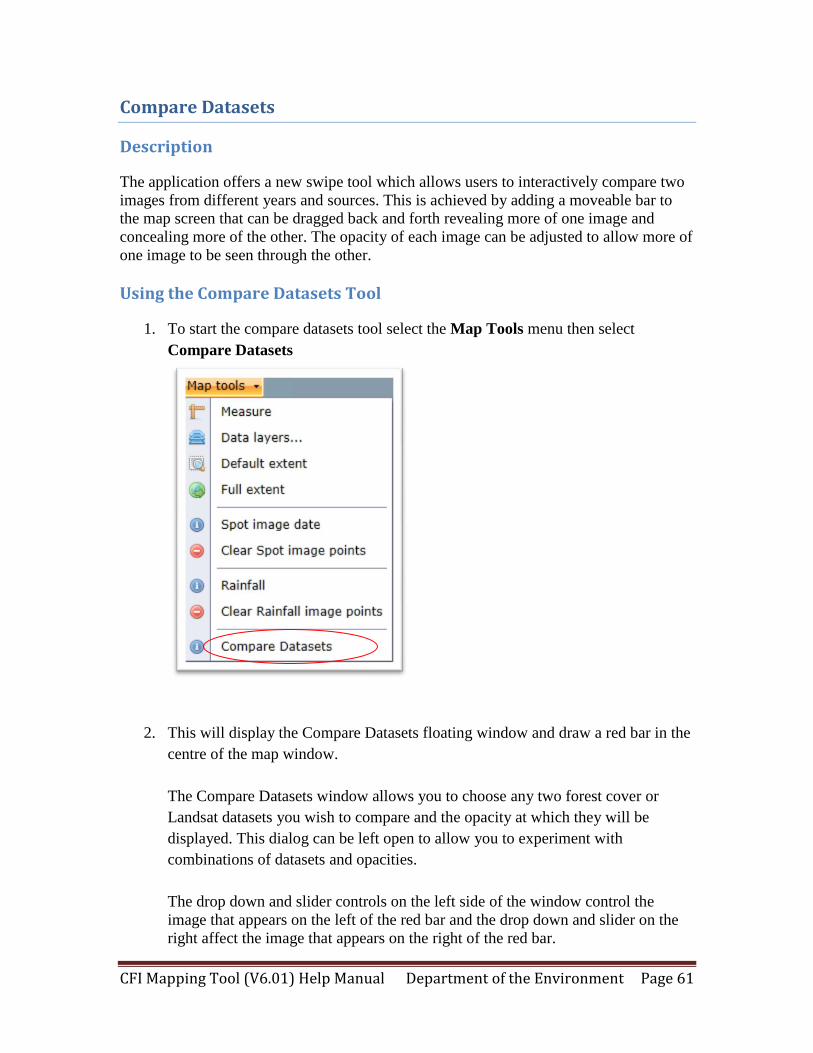
1. To start the compare datasets tool select the Map Tools menu then select
Compare Datasets
2. This will display the Compare Datasets floating window and draw a red bar in the
centre of the map window.
The Compare Datasets window allows you to choose any two forest cover or
Landsat datasets you wish to compare and the opacity at which they will be
displayed. This dialog can be left open to allow you to experiment with
combinations of datasets and opacities.
The drop down and slider controls on the left side of the window control the
image that appears on the left of the red bar and the drop down and slider on the
right affect the image that appears on the right of the red bar.
CFI Mapping Tool (V6.01) Help Manual Department of the Environment Page 62
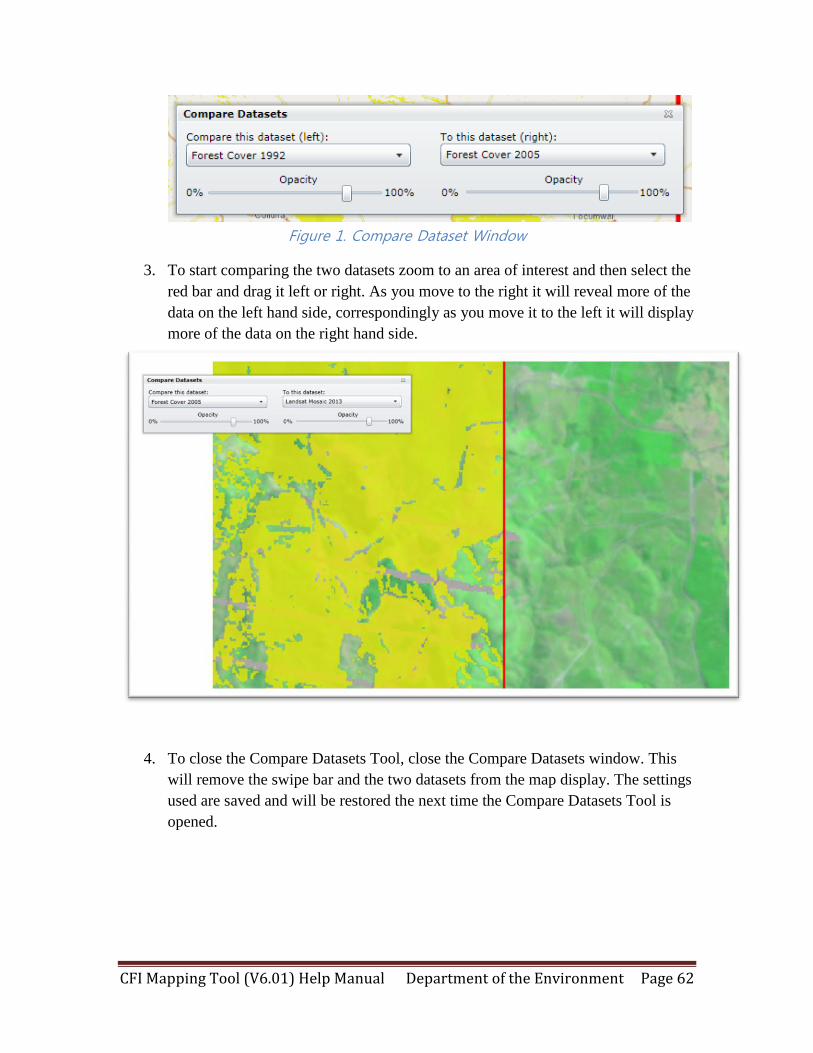
Figure 1. Compare Dataset Window
3. To start comparing the two datasets zoom to an area of interest and then select the
red bar and drag it left or right. As you move to the right it will reveal more of the
data on the left hand side, correspondingly as you move it to the left it will display
more of the data on the right hand side.
4. To close the Compare Datasets Tool, close the Compare Datasets window. This
will remove the swipe bar and the two datasets from the map display. The settings
used are saved and will be restored the next time the Compare Datasets Tool is
opened.
CFI Mapping Tool (V6.01) Help Manual Department of the Environment Page 63
Import a Shapefile
Description
The import CEA functionality allows you to create CEA boundaries from shapefile data
that you have created in external applications e.g. GIS, GPS or CAD.
Data Preparation
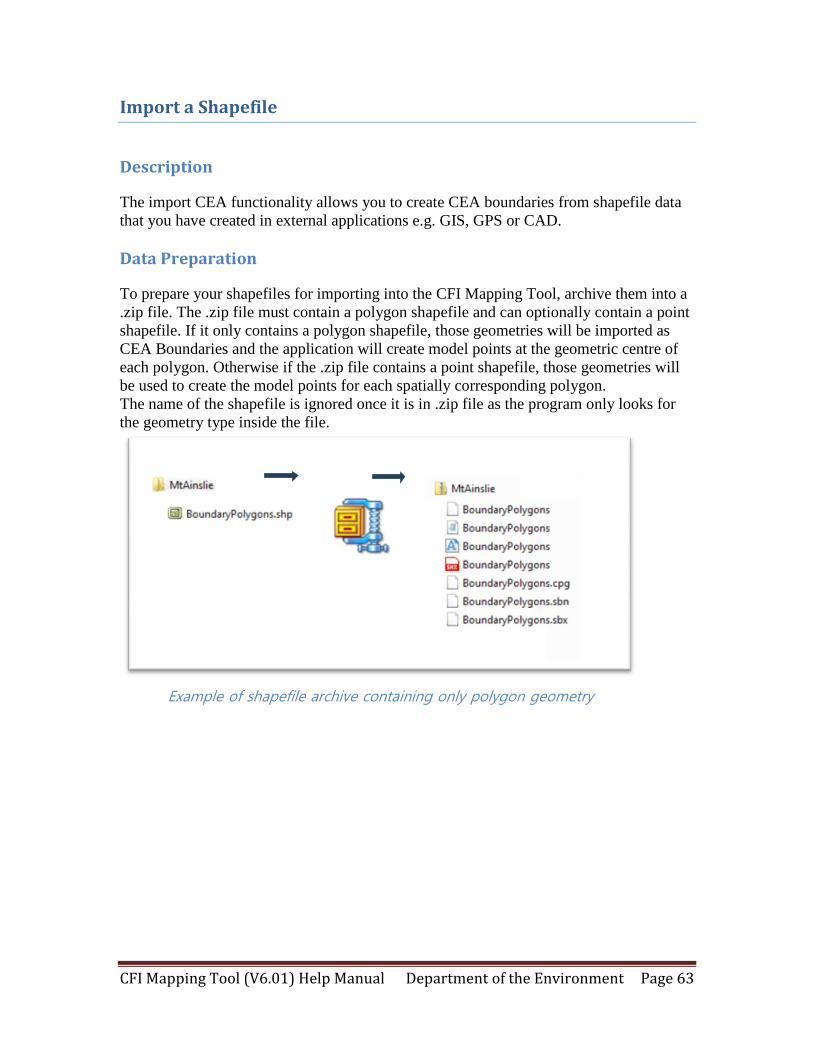
To prepare your shapefiles for importing into the CFI Mapping Tool, archive them into a
.zip file. The .zip file must contain a polygon shapefile and can optionally contain a point
shapefile. If it only contains a polygon shapefile, those geometries will be imported as
CEA Boundaries and the application will create model points at the geometric centre of
each polygon. Otherwise if the .zip file contains a point shapefile, those geometries will
be used to create the model points for each spatially corresponding polygon.
The name of the shapefile is ignored once it is in .zip file as the program only looks for
the geometry type inside the file.
Example of shapefile archive containing only polygon geometry
CFI Mapping Tool (V6.01) Help Manual Department of the Environment Page 64
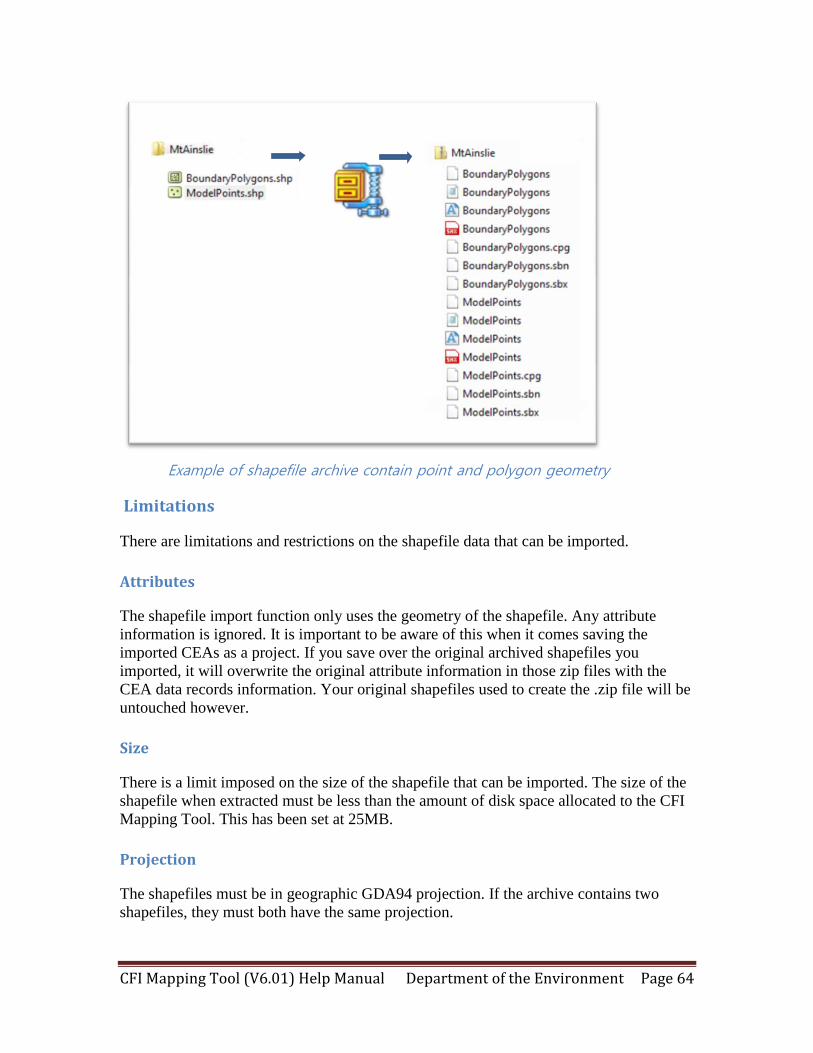
Example of shapefile archive contain point and polygon geometry
Limitations
There are limitations and restrictions on the shapefile data that can be imported.
Attributes
The shapefile import function only uses the geometry of the shapefile. Any attribute
information is ignored. It is important to be aware of this when it comes saving the
imported CEAs as a project. If you save over the original archived shapefiles you
imported, it will overwrite the original attribute information in those zip files with the
CEA data records information. Your original shapefiles used to create the .zip file will be
untouched however.
Size
There is a limit imposed on the size of the shapefile that can be imported. The size of the
shapefile when extracted must be less than the amount of disk space allocated to the CFI
Mapping Tool. This has been set at 25MB.
Projection
The shapefiles must be in geographic GDA94 projection. If the archive contains two
shapefiles, they must both have the same projection.
CFI Mapping Tool (V6.01) Help Manual Department of the Environment Page 65
Geometry
Only point and polygon geometries are supported.
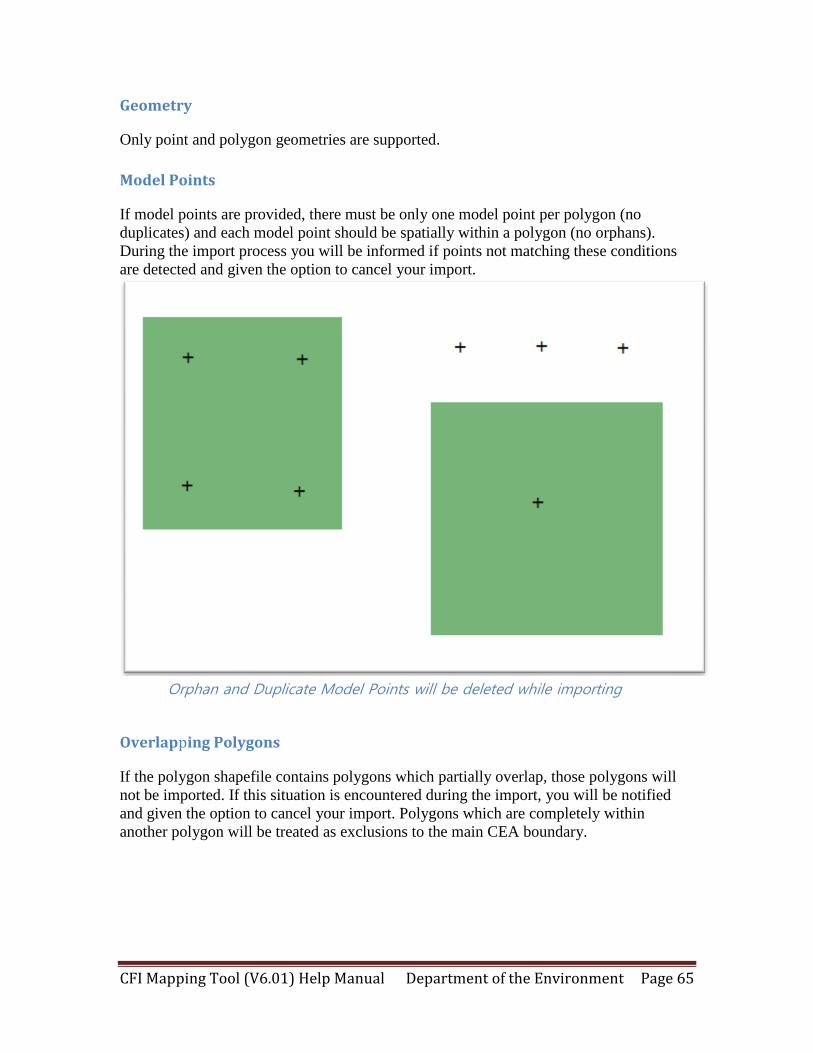
Model Points
If model points are provided, there must be only one model point per polygon (no
duplicates) and each model point should be spatially within a polygon (no orphans).
During the import process you will be informed if points not matching these conditions
are detected and given the option to cancel your import.
Orphan and Duplicate Model Points will be deleted while importing
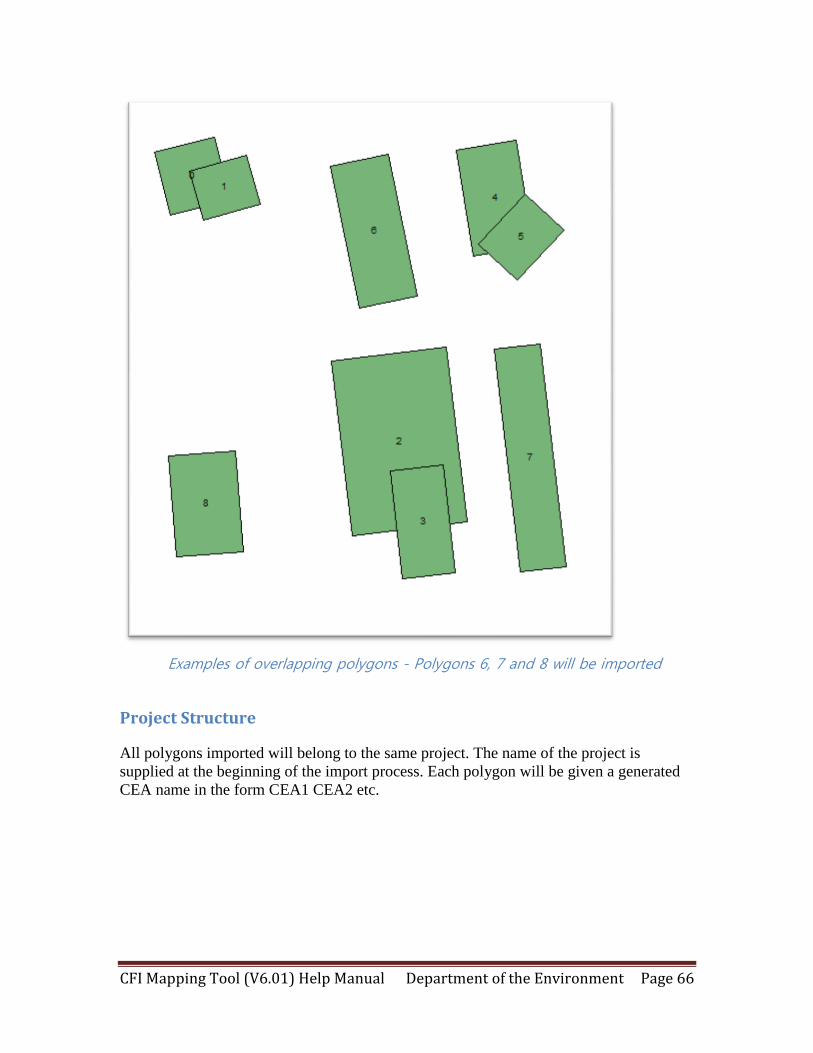
Overlapping Polygons
If the polygon shapefile contains polygons which partially overlap, those polygons will
not be imported. If this situation is encountered during the import, you will be notified
and given the option to cancel your import. Polygons which are completely within
another polygon will be treated as exclusions to the main CEA boundary.
CFI Mapping Tool (V6.01) Help Manual Department of the Environment Page 66
Examples of overlapping polygons - Polygons 6, 7 and 8 will be imported
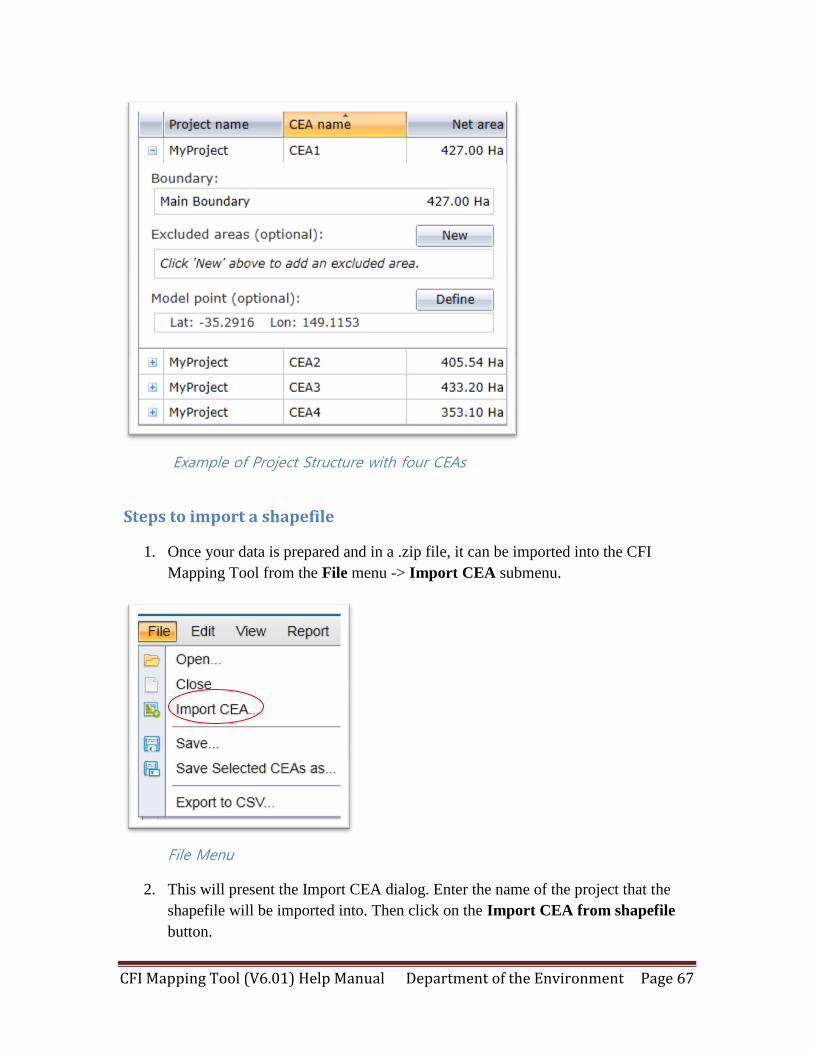
Project Structure
All polygons imported will belong to the same project. The name of the project is
supplied at the beginning of the import process. Each polygon will be given a generated
CEA name in the form CEA1 CEA2 etc.
CFI Mapping Tool (V6.01) Help Manual Department of the Environment Page 67
Example of Project Structure with four CEAs
Steps to import a shapefile
1. Once your data is prepared and in a .zip file, it can be imported into the CFI
Mapping Tool from the File menu -> Import CEA submenu.
File Menu
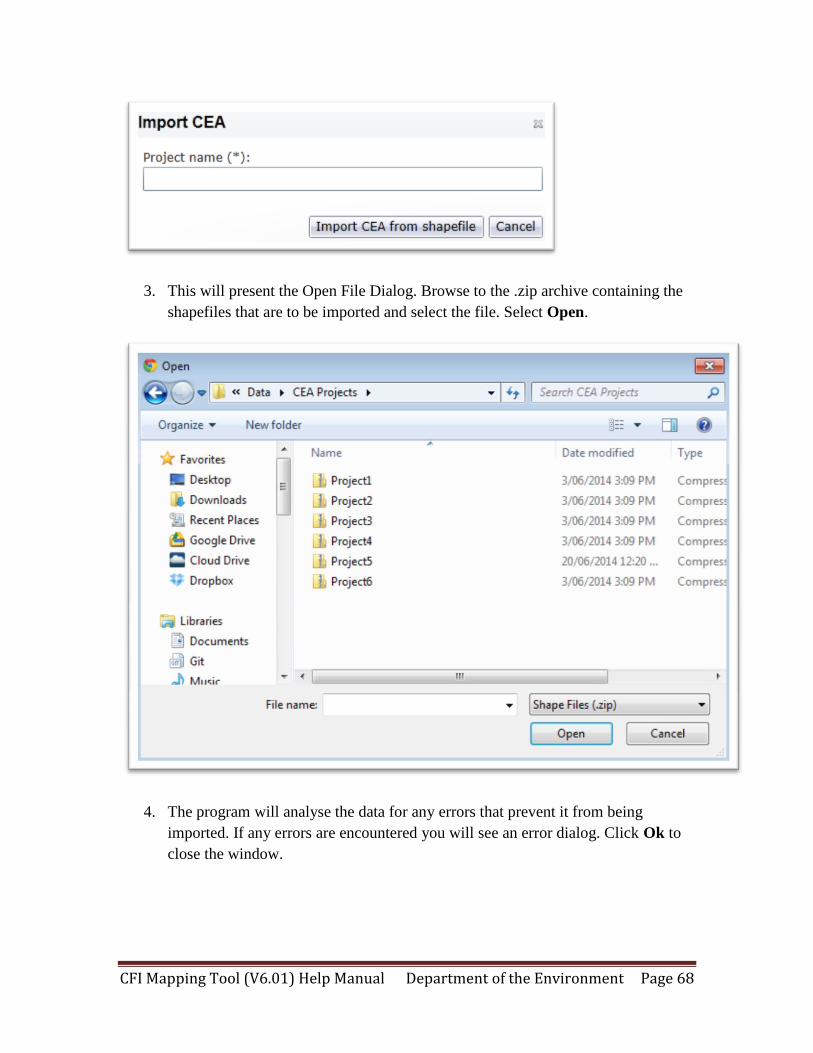
2. This will present the Import CEA dialog. Enter the name of the project that the
shapefile will be imported into. Then click on the Import CEA from shapefile
button.
CFI Mapping Tool (V6.01) Help Manual Department of the Environment Page 68
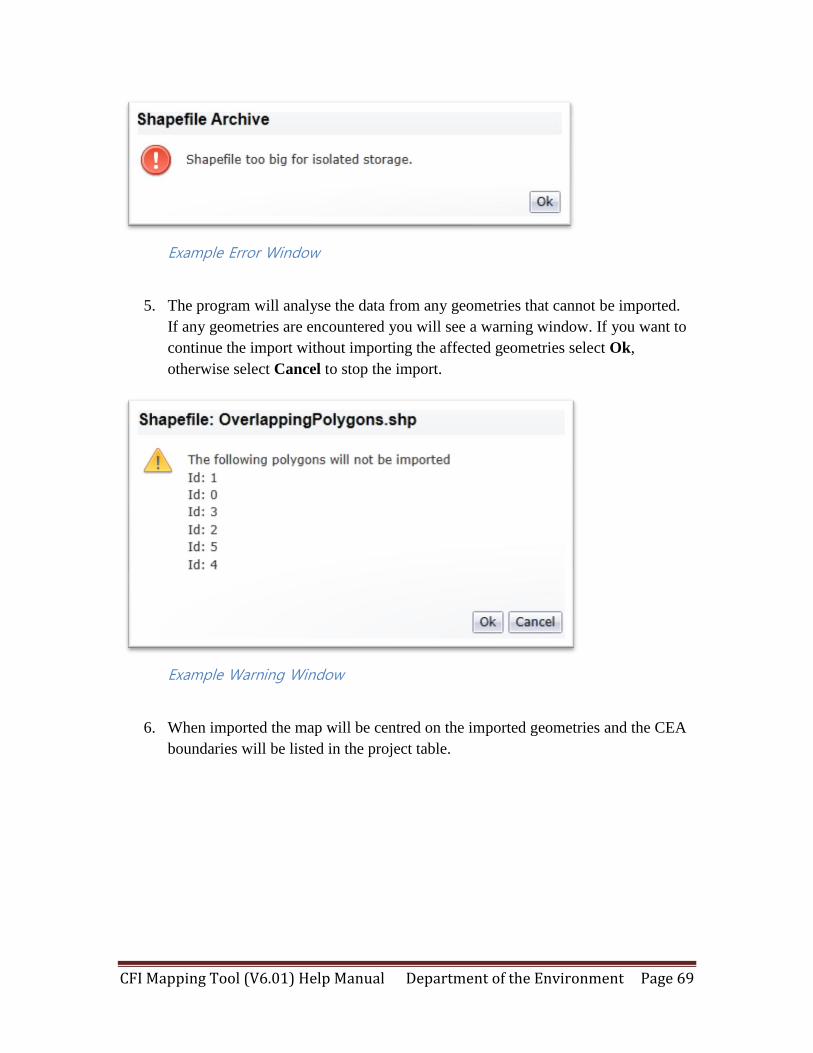
3. This will present the Open File Dialog. Browse to the .zip archive containing the
shapefiles that are to be imported and select the file. Select Open.
4. The program will analyse the data for any errors that prevent it from being
imported. If any errors are encountered you will see an error dialog. Click Ok to
close the window.
CFI Mapping Tool (V6.01) Help Manual Department of the Environment Page 69
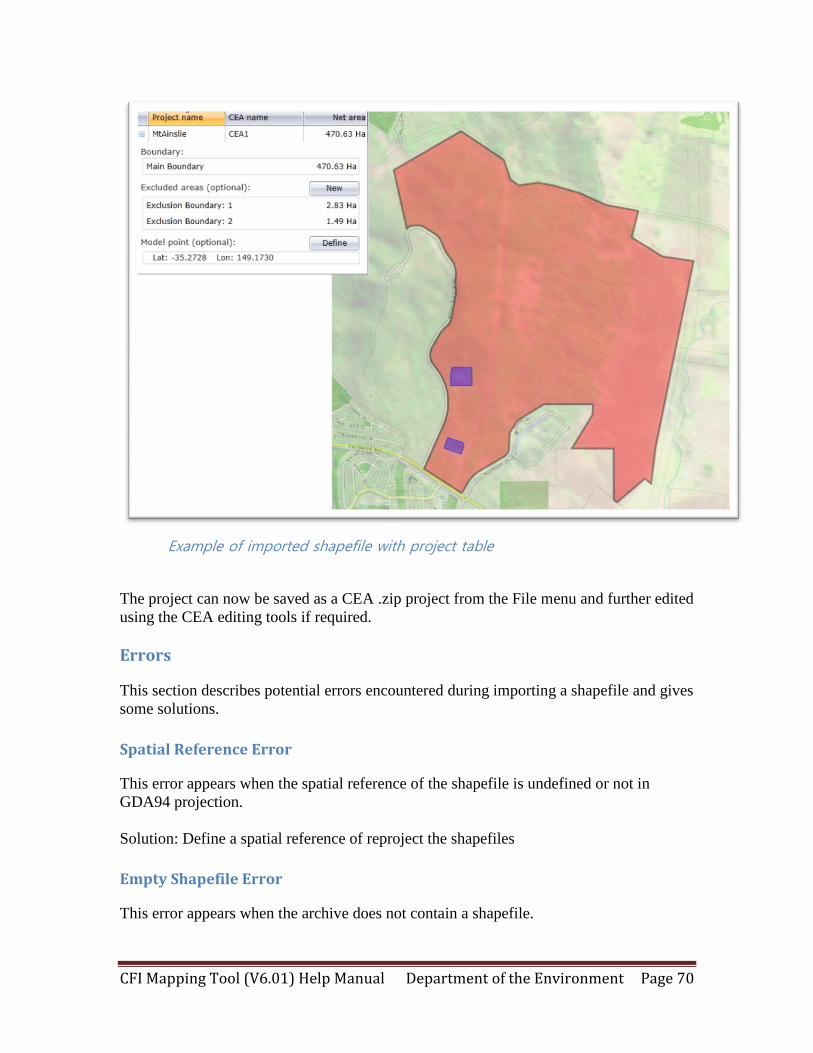
Example Error Window
5. The program will analyse the data from any geometries that cannot be imported.
If any geometries are encountered you will see a warning window. If you want to
continue the import without importing the affected geometries select Ok,
otherwise select Cancel to stop the import.
Example Warning Window
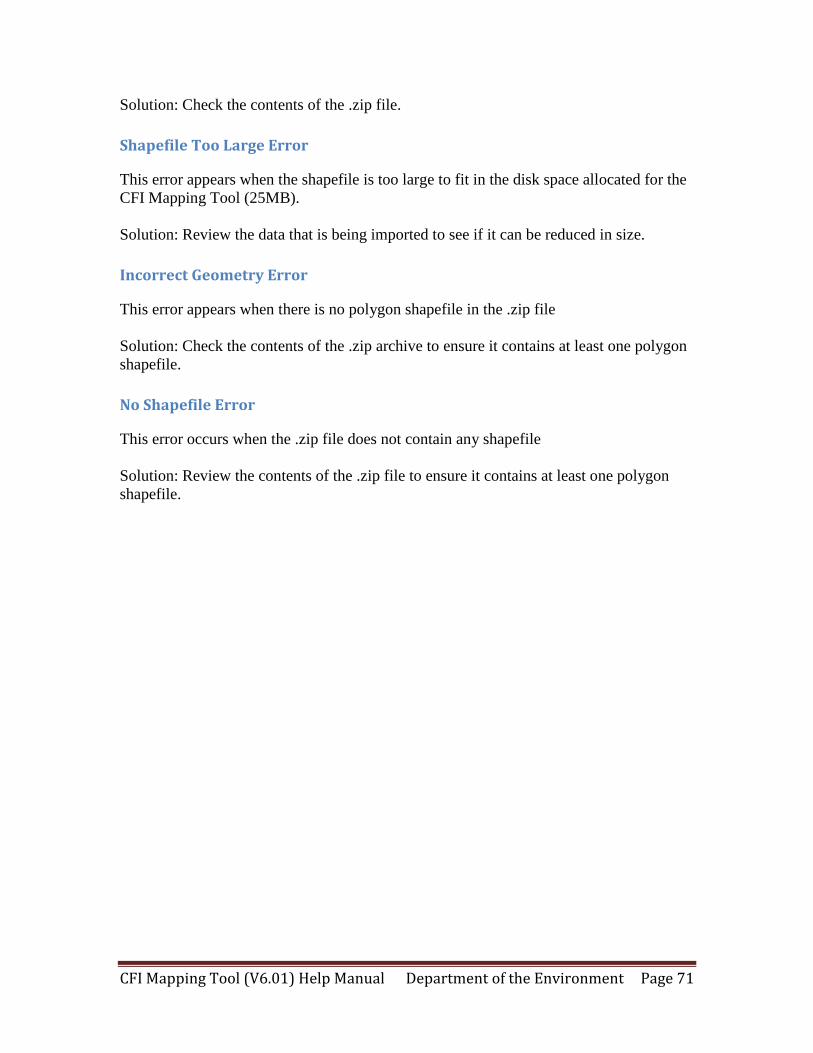
6. When imported the map will be centred on the imported geometries and the CEA
boundaries will be listed in the project table.
CFI Mapping Tool (V6.01) Help Manual Department of the Environment Page 70
Example of imported shapefile with project table
The project can now be saved as a CEA .zip project from the File menu and further edited
using the CEA editing tools if required.
Errors
This section describes potential errors encountered during importing a shapefile and gives
some solutions.
Spatial Reference Error
This error appears when the spatial reference of the shapefile is undefined or not in
GDA94 projection.
Solution: Define a spatial reference of reproject the shapefiles
Empty Shapefile Error
This error appears when the archive does not contain a shapefile.
CFI Mapping Tool (V6.01) Help Manual Department of the Environment Page 71
Solution: Check the contents of the .zip file.
Shapefile Too Large Error
This error appears when the shapefile is too large to fit in the disk space allocated for the
CFI Mapping Tool (25MB).
Solution: Review the data that is being imported to see if it can be reduced in size.
Incorrect Geometry Error
This error appears when there is no polygon shapefile in the .zip file
Solution: Check the contents of the .zip archive to ensure it contains at least one polygon
shapefile.
No Shapefile Error
This error occurs when the .zip file does not contain any shapefile
Solution: Review the contents of the .zip file to ensure it contains at least one polygon
shapefile.
CFI Mapping Tool (V6.01) Help Manual Department of the Environment Page 72
Extract Forest Cover Data Tool
Description
The Extract Forest Cover Data tool provides the ability to select and download a batch of
Forest Cover datasets (organised as tiles) representing a specified area for any number of
available years.
Operating separately to the CFI Mapping tool itself, this tool permits the selection of
Mosaic Tiles to be collated (in GeoTIFF Format with full GIS metadata) and compressed
for download. The resulting download represents the same raw data utilized at the server
to provide the Forest Cover layers utilised within the CMT.
Using the Extract Forest Cover Data Tool
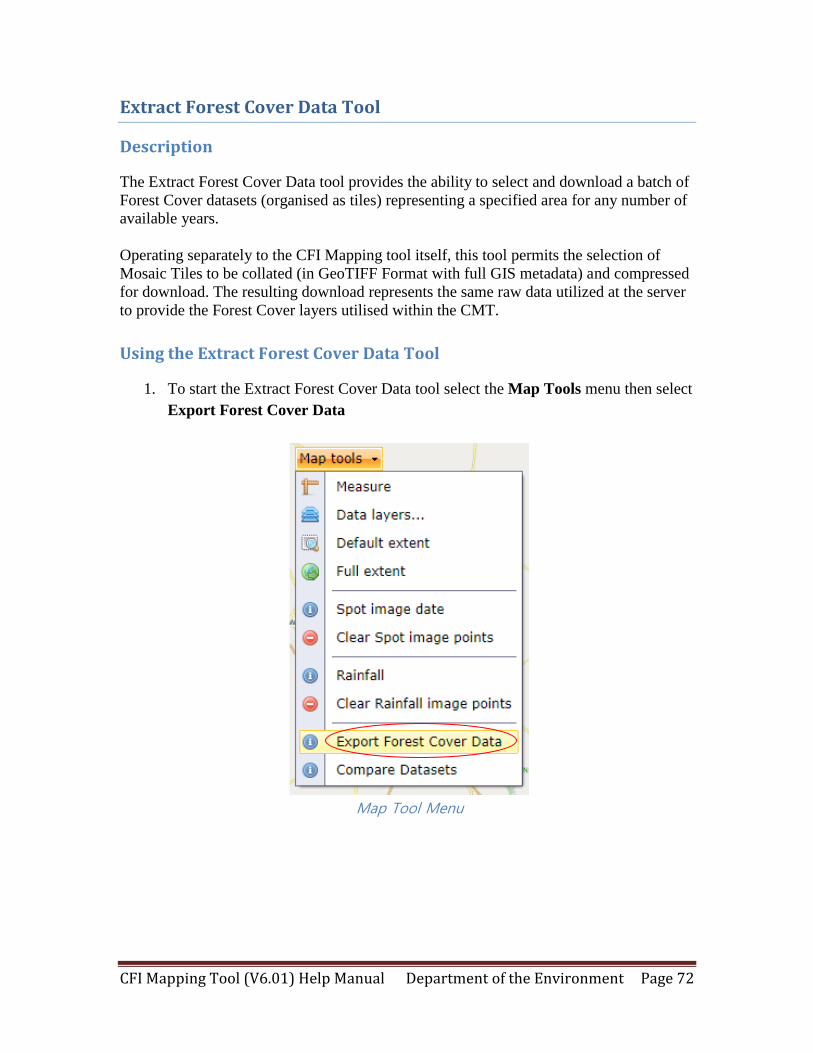
1. To start the Extract Forest Cover Data tool select the Map Tools menu then select
Export Forest Cover Data
Map Tool Menu
CFI Mapping Tool (V6.01) Help Manual Department of the Environment Page 73
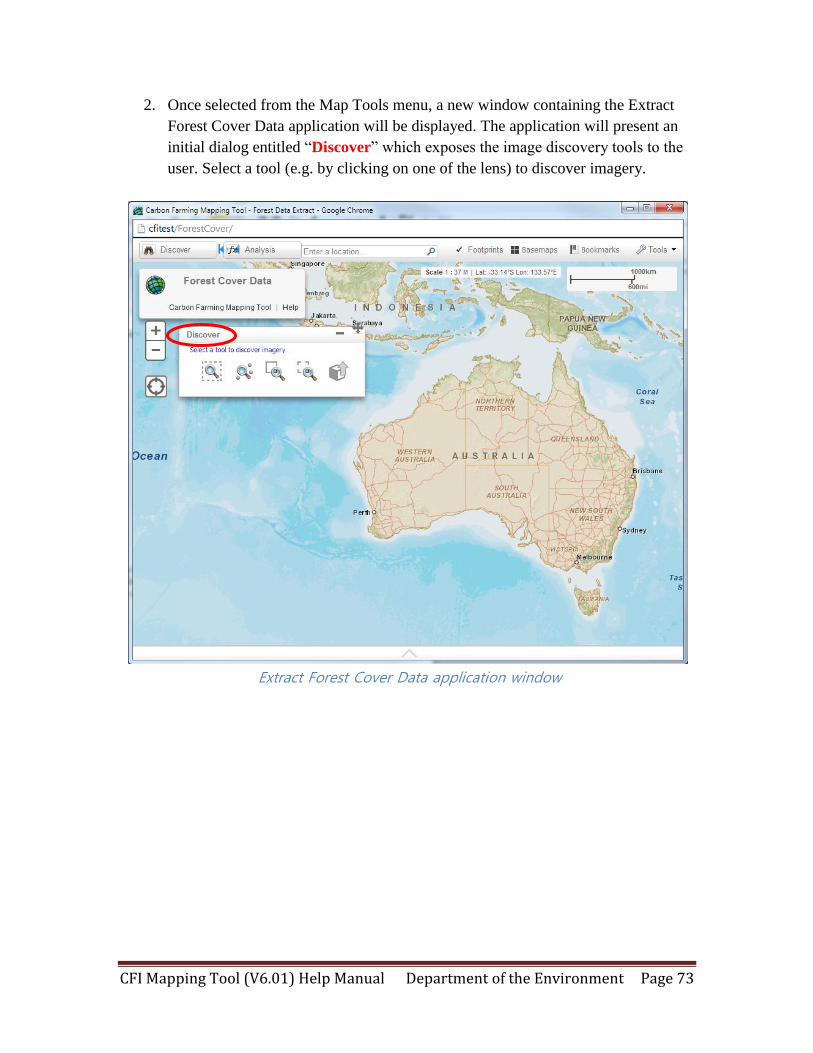
2. Once selected from the Map Tools menu, a new window containing the Extract
Forest Cover Data application will be displayed. The application will present an
initial dialog entitled “Discover” which exposes the image discovery tools to the
user. Select a tool (e.g. by clicking on one of the lens) to discover imagery.
Extract Forest Cover Data application window
CFI Mapping Tool (V6.01) Help Manual Department of the Environment Page 74
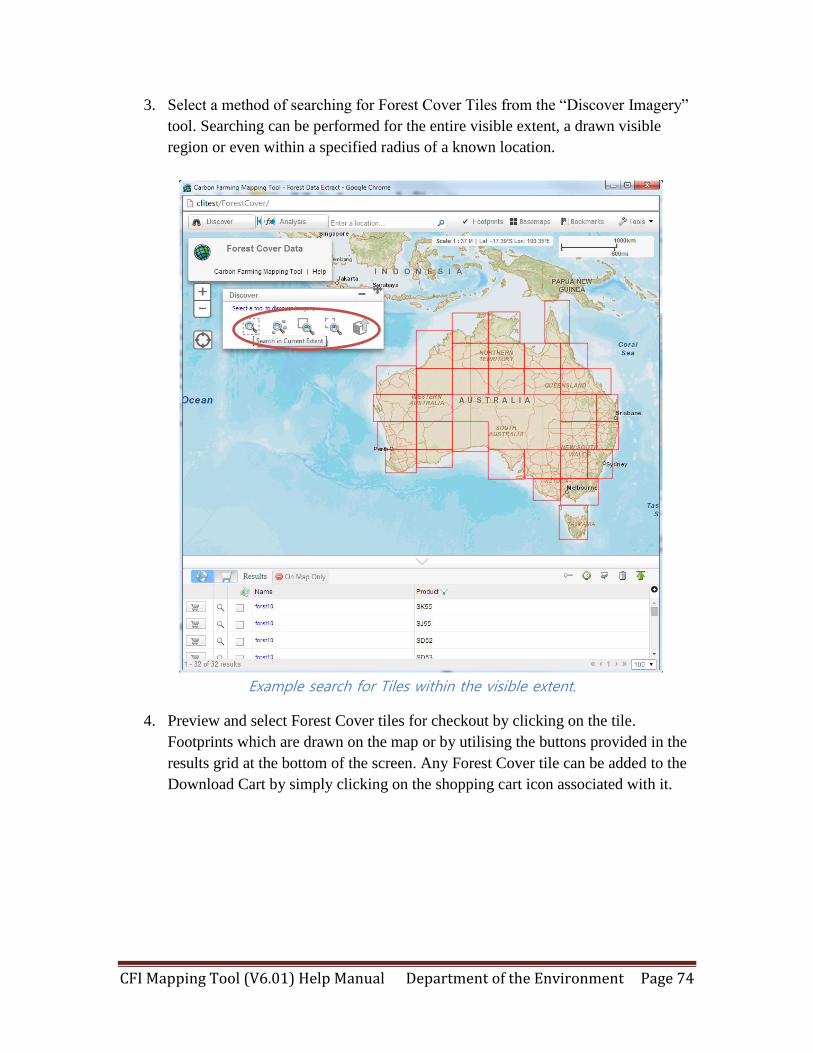
3. Select a method of searching for Forest Cover Tiles from the “Discover Imagery”
tool. Searching can be performed for the entire visible extent, a drawn visible
region or even within a specified radius of a known location.
Example search for Tiles within the visible extent.
4. Preview and select Forest Cover tiles for checkout by clicking on the tile.
Footprints which are drawn on the map or by utilising the buttons provided in the
results grid at the bottom of the screen. Any Forest Cover tile can be added to the
Download Cart by simply clicking on the shopping cart icon associated with it.
CFI Mapping Tool (V6.01) Help Manual Department of the Environment Page 75
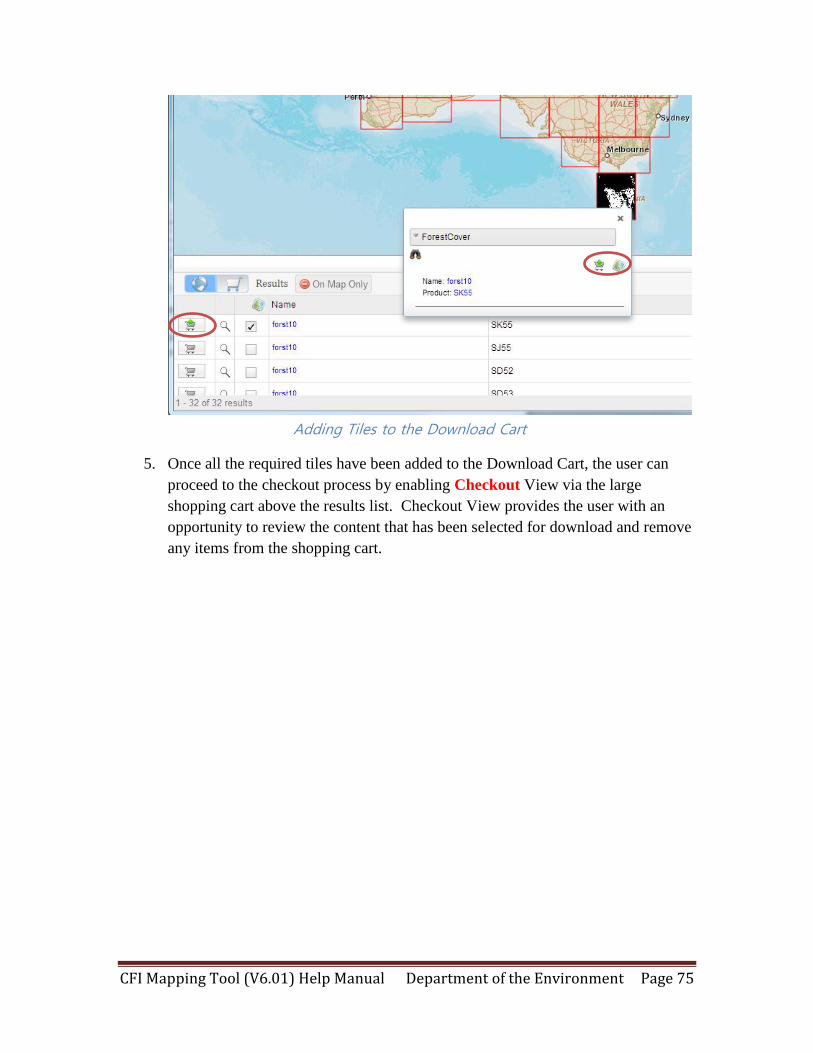
Adding Tiles to the Download Cart
5. Once all the required tiles have been added to the Download Cart, the user can
proceed to the checkout process by enabling Checkout View via the large
shopping cart above the results list. Checkout View provides the user with an
opportunity to review the content that has been selected for download and remove
any items from the shopping cart.
CFI Mapping Tool (V6.01) Help Manual Department of the Environment Page 76
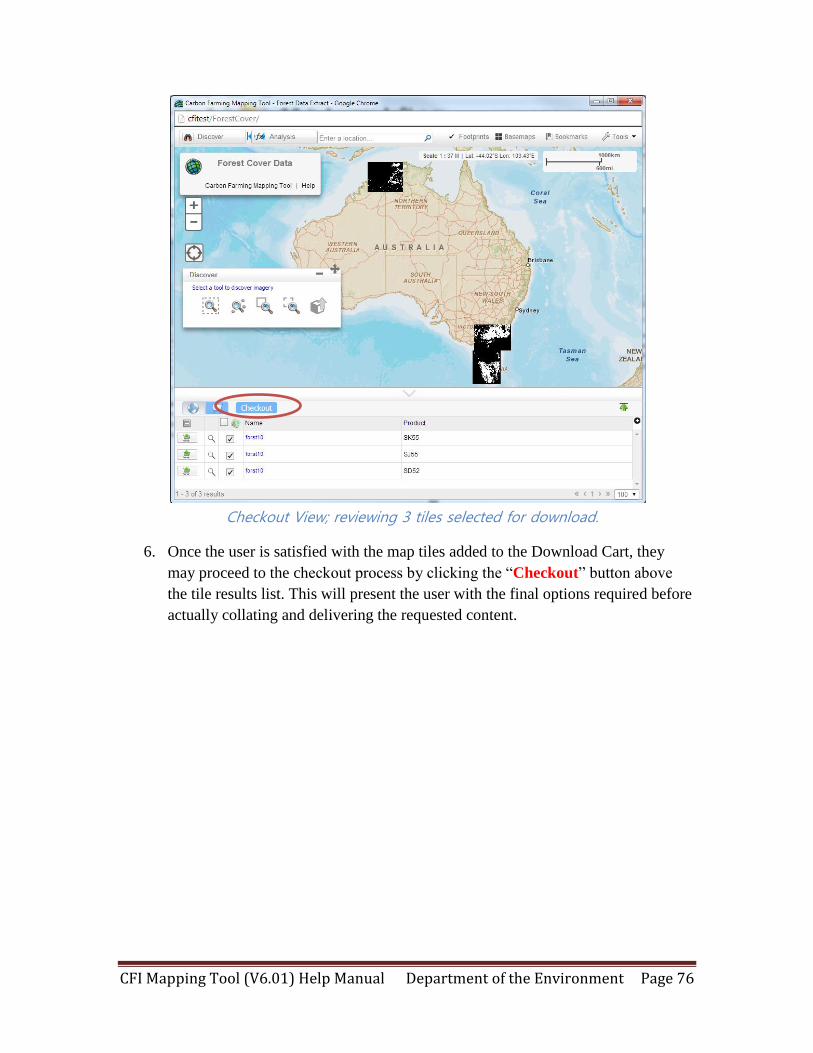
Checkout View; reviewing 3 tiles selected for download.
6. Once the user is satisfied with the map tiles added to the Download Cart, they
may proceed to the checkout process by clicking the “Checkout” button above
the tile results list. This will present the user with the final options required before
actually collating and delivering the requested content.
CFI Mapping Tool (V6.01) Help Manual Department of the Environment Page 77
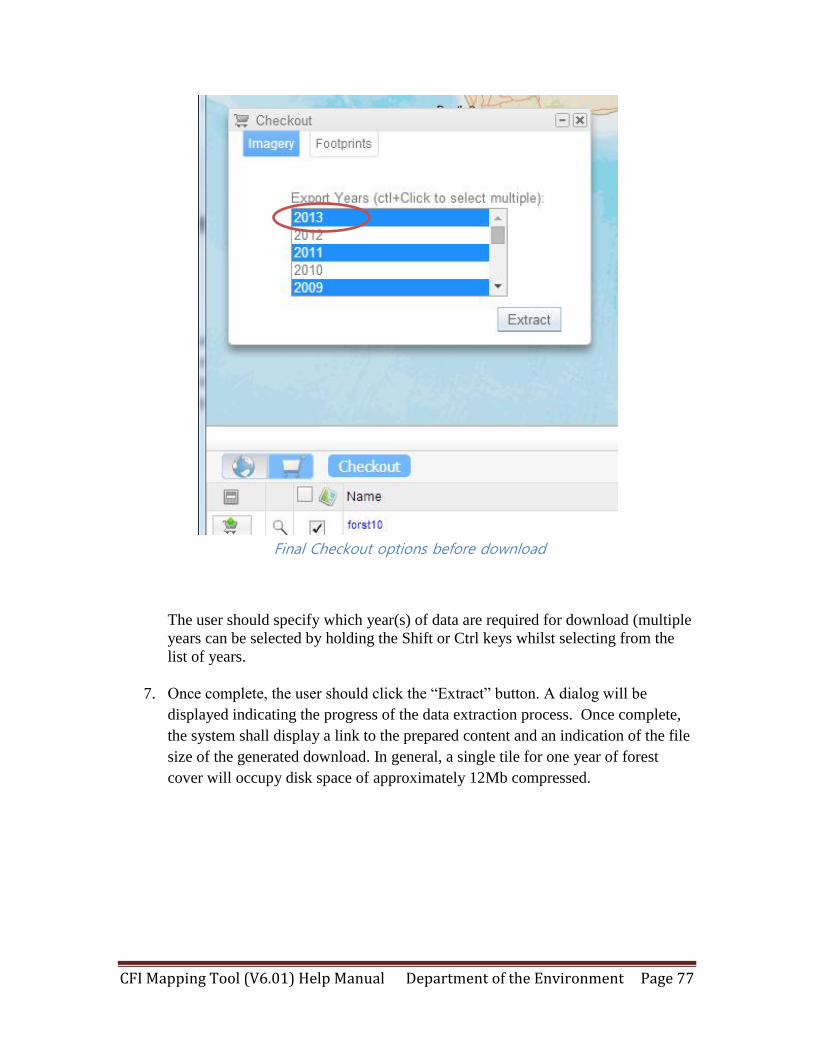
Final Checkout options before download
The user should specify which year(s) of data are required for download (multiple
years can be selected by holding the Shift or Ctrl keys whilst selecting from the
list of years.
7. Once complete, the user should click the “Extract” button. A dialog will be
displayed indicating the progress of the data extraction process. Once complete,
the system shall display a link to the prepared content and an indication of the file
size of the generated download. In general, a single tile for one year of forest
cover will occupy disk space of approximately 12Mb compressed.
CFI Mapping Tool (V6.01) Help Manual Department of the Environment Page 78
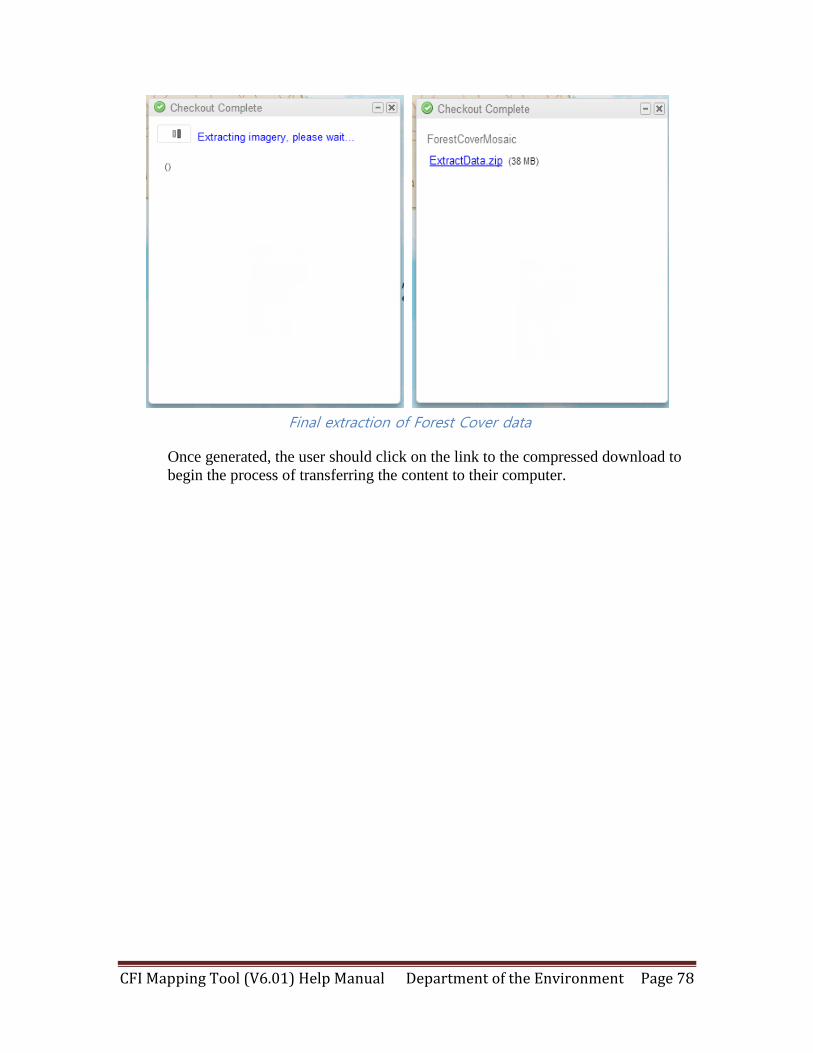
Final extraction of Forest Cover data
Once generated, the user should click on the link to the compressed download to
begin the process of transferring the content to their computer.
CFI Mapping Tool (V6.01) Help Manual Department of the Environment Page 79
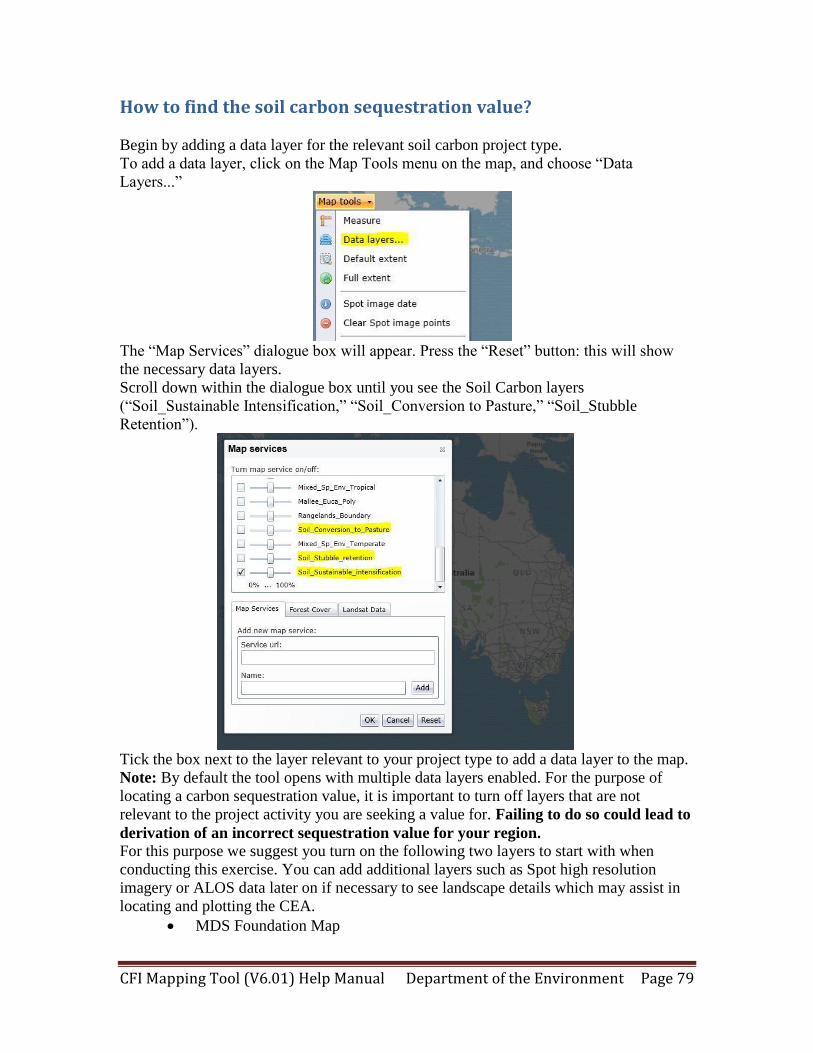
How to find the soil carbon sequestration value?
Begin by adding a data layer for the relevant soil carbon project type.
To add a data layer, click on the Map Tools menu on the map, and choose “Data
Layers...”
The “Map Services” dialogue box will appear. Press the “Reset” button: this will show
the necessary data layers.
Scroll down within the dialogue box until you see the Soil Carbon layers
(“Soil_Sustainable Intensification,” “Soil_Conversion to Pasture,” “Soil_Stubble
Retention”).
Tick the box next to the layer relevant to your project type to add a data layer to the map.
Note: By default the tool opens with multiple data layers enabled. For the purpose of
locating a carbon sequestration value, it is important to turn off layers that are not
relevant to the project activity you are seeking a value for. Failing to do so could lead to
derivation of an incorrect sequestration value for your region.
For this purpose we suggest you turn on the following two layers to start with when
conducting this exercise. You can add additional layers such as Spot high resolution
imagery or ALOS data later on if necessary to see landscape details which may assist in
locating and plotting the CEA.
MDS Foundation Map
CFI Mapping Tool (V6.01) Help Manual Department of the Environment Page 80
One of either “Soil_Sustainable Intensification,” “Soil_Conversion to Pasture”
or “Soil_Stubble Retention,” as determined by the type of project activity you
are looking to undertake.
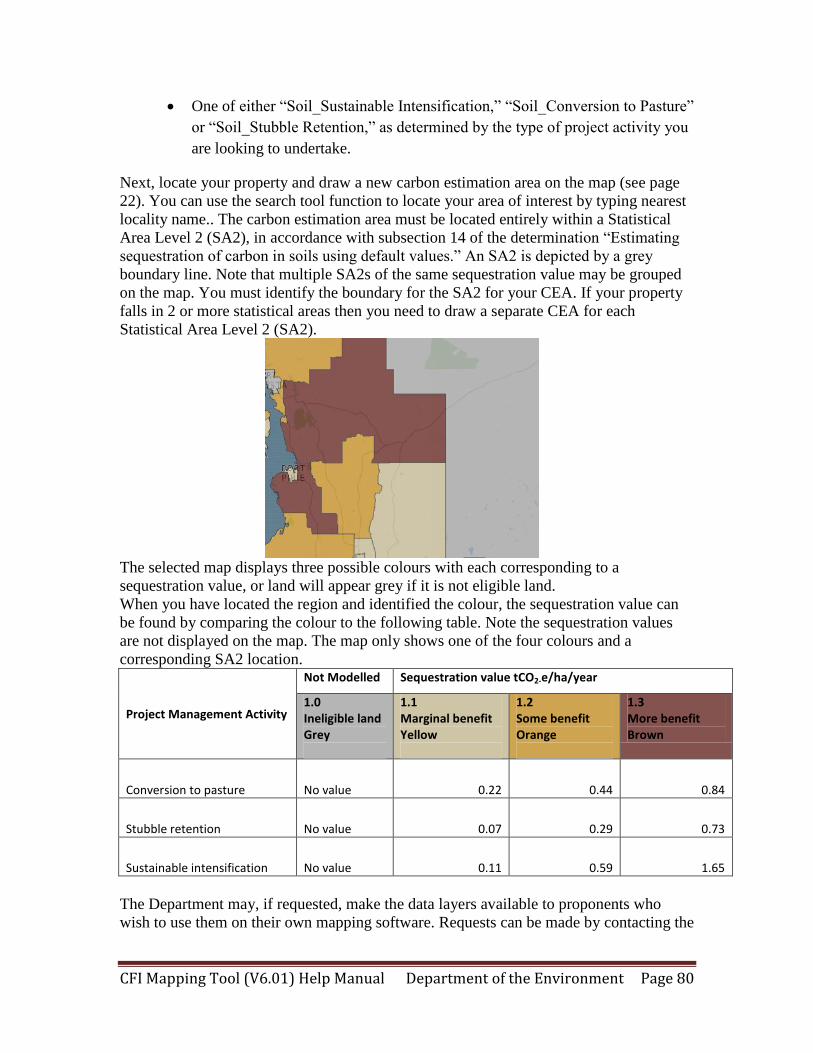
Next, locate your property and draw a new carbon estimation area on the map (see page
22). You can use the search tool function to locate your area of interest by typing nearest
locality name.. The carbon estimation area must be located entirely within a Statistical
Area Level 2 (SA2), in accordance with subsection 14 of the determination “Estimating
sequestration of carbon in soils using default values.” An SA2 is depicted by a grey
boundary line. Note that multiple SA2s of the same sequestration value may be grouped
on the map. You must identify the boundary for the SA2 for your CEA. If your property
falls in 2 or more statistical areas then you need to draw a separate CEA for each
Statistical Area Level 2 (SA2).
The selected map displays three possible colours with each corresponding to a
sequestration value, or land will appear grey if it is not eligible land.
When you have located the region and identified the colour, the sequestration value can
be found by comparing the colour to the following table. Note the sequestration values
are not displayed on the map. The map only shows one of the four colours and a
corresponding SA2 location.
Project Management Activity
Not Modelled Sequestration value tCO2-e/ha/year
1.0 Ineligible land Grey
1.1 Marginal benefit Yellow
1.2 Some benefit Orange
1.3 More benefit Brown
Conversion to pasture No value 0.22 0.44 0.84
Stubble retention No value 0.07 0.29 0.73
Sustainable intensification No value 0.11 0.59 1.65
The Department may, if requested, make the data layers available to proponents who
wish to use them on their own mapping software. Requests can be made by contacting the
CFI Mapping Tool (V6.01) Help Manual Department of the Environment Page 81
ERF on 1800 852 974, or via the following link:
http://www.environment.gov.au/webform/website-feedback
If you have suggestions to improve the quality of this manual, please email:
Thank you!


![cMT-G01 Startup Guide - · PDF file[cMT Series] » [Maintenance] » [cMT-G01 OS Upgrade]. ... cMT Gateway Viewer can read from or write to PLC. ... cMT-G01 Startup Guide](https://img.pdfslide.net/doc/110x75/5ab85bac7f8b9ad13d8c70d9/cmt-g01-startup-guide-cmt-series-maintenance-cmt-g01-os-upgrade-cmt.jpg)