Embed Size (px)
Citation preview
Carbon Footprint Report
Minnesota State University Mankato
SBA Project No. 250808.00
June 13, 2013
Prepared by: Contact: Katie Anthony, LEED AP BD+C & O&M
1450 Energy Park Drive Suite 300
St. Paul, MN 55108 Main: 651-634-0775
Fax: 651-634-7400 email: [email protected]
Table of Contents
Minnesota State University, Mankato Page 1 Carbon Footprint September 30, 2013 Sebesta Blomberg Project No. 250808.00
Minnesota State University, Mankato
Carbon Footprint
Section Page
1.0 Summary .......................................................................................................................................... 2
2.0 Overview .......................................................................................................................................... 2
3.0 Greenhouse Gas Emissions Inventory Methodology ................................................................... 3
4.0 Baseline Emission Inventory Details ............................................................................................. 3
5.0 Stationary Combustion ................................................................................................................... 4
6.0 Minnesota State University, Mankato Vehicle Fleet .................................................................... 5
7.0 Refrigerants, Chemicals, and Agriculture .................................................................................... 5
8.0 Electricity ......................................................................................................................................... 6
9.0 Commuting ...................................................................................................................................... 6
10.0 Air Travel and Business Use of Personal Vehicles ....................................................................... 8
11.0 Solid Waste and Wastewater ......................................................................................................... 9
12.0 Tracking Progress ........................................................................................................................... 9
13.0 Next Steps ...................................................................................................................................... 10
Peer Institution Benchmarking................................................................................................................ 11
Data Requirements ................................................................................................................................... 14
Baseline Report
Minnesota State University, Mankato Page 2 Carbon Footprint September 30, 2013 Sebesta Blomberg Project No. 250808.00
Minnesota State University, Mankato Carbon Footprint
1.0 Summary
In April 2013, Minnesota State University, Mankato conducted a Greenhouse Gas Emissions Inventory in
order to measure the impact of campus operations on the environment. Emissions totaled 45,937.7 metric
tons of carbon dioxide-equivalent (MTCO2e) for fiscal year 2012 (FY12), which spans the period from
July 1, 2011-June 30, 2012. This equates to 0.016 MTCO2e per square foot (2,915,836 total square feet)
and 3.28 MTCO2e per student (based on the FY12 full time equivalent student population of 14,0141).
The baseline for Minnesota State University, Mankato was calculated using the electrical, natural gas, and
fuel consumption totals provided by the Facilities Management departments and verified against the State
of Minnesota B3 database. Other data was provided by University staff .
Emissions from operating buildings contributed the largest percentage of emissions making up a
combined total of 87% of campus wide emissions. Electricity use had the largest impact at 57.4%;
stationary combustion, which is made up of energy use from natural gas and fuel oil, makes up 24% of
emissions; the remainder is due to electricity transmission and distribution losses (T&D Losses).
2.0 Overview
Founded in 1868 as the Mankato Normal School, Minnesota State University, Mankato (Minnesota State
Mankato) today is a comprehensive, 4-year public university located in Mankato, Minnesota. The
majority of students are from Minnesota, but the University attracts students from all over the world.
The University has over 15,000 students with about 80% enrolled on a full-time basis. In addition, MSU,
Mankato has more than 1,500 faculty and staff.
The campus has 2,915,836 square feet with a combination of residential, classroom, laboratory, athletic,
service, and administrative buildings. Most campus buildings are served by a central utility plant, which
provides steam and chilled water. Buildings are predominantly located on the 303 acre central campus
with a satellite location in Edina, MN.
This is the first Greenhouse Gas Emissions Inventory (a.k.a. Carbon Footprint) completed for Minnesota
State Mankato and is considered the baseline inventory. The data covers fiscal year 2012 (FY12) as the
most recent year that comprehensive data is available.
This carbon footprint study is an initiative of University President, Dr. Richard Davenport; the
Environmental Committee; and the Minnesota State Mankato Facilities Management departments.
1 Full time equivalent (FTE) is calculated by adding full-time students and one FTE for every two part-time students.
Baseline Report
Minnesota State University, Mankato Page 3 Carbon Footprint September 30, 2013 Sebesta Blomberg Project No. 250808.00
3.0 Greenhouse Gas Emissions Inventory Methodology
The GHG emissions inventory was conducted using the ACUPCC’s Clean Air-Cool Planet (CA-CP)
calculation tool version 6.85, supplemented by the World Resources Institute’s GHG Protocol. The GHG
Protocol is the most widely accepted international standard for GHG accounting and is the basis of the CA-CP
tool. The inventory of emissions included those arising from electricity consumption, heating and cooling,
vehicle fleet operations, business travel (by air, rental vehicle and personal vehicle), waste management
practices, wastewater treatment, refrigerant use, fertilizer use, and daily commuting of students, staff, and
faculty to and from the campus.
The baseline established for Minnesota State Mankato is FY12 (July 1, 2011 – June 30, 2012).
Minnesota State University, Mankato staff provided the data for all categories with the exception of commuter
data, which was established by a commuter survey of the campus population. Electricity, natural gas, and
building related diesel fuel consumption was obtained from the State of Minnesota B3 Benchmarking database
– the data entered into this database originated from University staff – and was spot checked against utility
bills and University reports.
4.0 Baseline Emission Inventory Details
Greenhouse gas emissions are categorized as Scope 1, Scope 2, and Scope 3 emissions. Scope 1 emissions are
those that are under direct control of the institution. Scope 2 are indirect emissions from the consumption of
purchased electricity, heat, or steam. Scope 3 are also indirect emissions that are not owned or controlled by
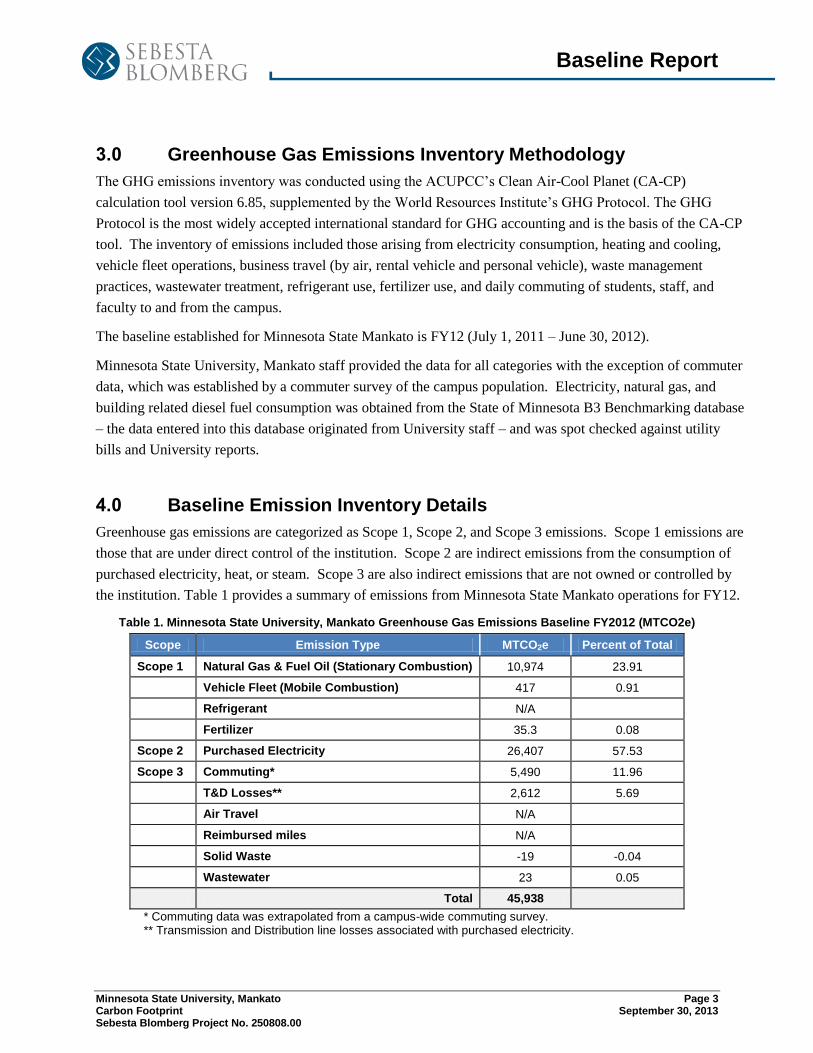
the institution. Table 1 provides a summary of emissions from Minnesota State Mankato operations for FY12.
Table 1. Minnesota State University, Mankato Greenhouse Gas Emissions Baseline FY2012 (MTCO2e)
Scope Emission Type MTCO2e Percent of Total
Scope 1 Natural Gas & Fuel Oil (Stationary Combustion) 10,974 23.91
Vehicle Fleet (Mobile Combustion) 417 0.91
Refrigerant N/A
Fertilizer 35.3 0.08
Scope 2 Purchased Electricity 26,407 57.53
Scope 3 Commuting* 5,490 11.96
T&D Losses** 2,612 5.69
Air Travel N/A
Reimbursed miles N/A
Solid Waste -19 -0.04
Wastewater 23 0.05
Total 45,938
* Commuting data was extrapolated from a campus-wide commuting survey. ** Transmission and Distribution line losses associated with purchased electricity.
Baseline Report
Minnesota State University, Mankato Page 4 Carbon Footprint September 30, 2013 Sebesta Blomberg Project No. 250808.00
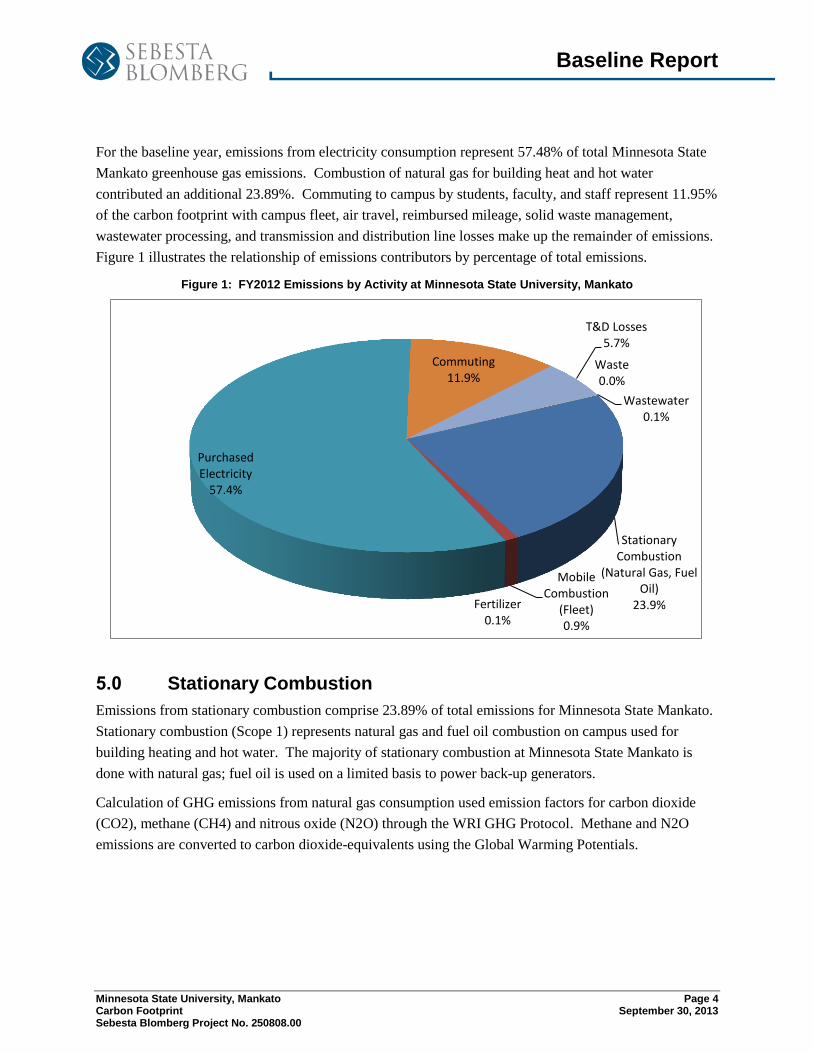
For the baseline year, emissions from electricity consumption represent 57.48% of total Minnesota State
Mankato greenhouse gas emissions. Combustion of natural gas for building heat and hot water
contributed an additional 23.89%. Commuting to campus by students, faculty, and staff represent 11.95%
of the carbon footprint with campus fleet, air travel, reimbursed mileage, solid waste management,
wastewater processing, and transmission and distribution line losses make up the remainder of emissions.
Figure 1 illustrates the relationship of emissions contributors by percentage of total emissions.
Figure 1: FY2012 Emissions by Activity at Minnesota State University, Mankato
5.0 Stationary Combustion
Emissions from stationary combustion comprise 23.89% of total emissions for Minnesota State Mankato.
Stationary combustion (Scope 1) represents natural gas and fuel oil combustion on campus used for
building heating and hot water. The majority of stationary combustion at Minnesota State Mankato is
done with natural gas; fuel oil is used on a limited basis to power back-up generators.
Calculation of GHG emissions from natural gas consumption used emission factors for carbon dioxide
(CO2), methane (CH4) and nitrous oxide (N2O) through the WRI GHG Protocol. Methane and N2O
emissions are converted to carbon dioxide-equivalents using the Global Warming Potentials.
Stationary Combustion
(Natural Gas, Fuel Oil)
23.9%
Mobile Combustion
(Fleet) 0.9%
Fertilizer 0.1%
Purchased Electricity
57.4%
Commuting 11.9%
T&D Losses 5.7%
Waste 0.0%
Wastewater 0.1%
Baseline Report
Minnesota State University, Mankato Page 5 Carbon Footprint September 30, 2013 Sebesta Blomberg Project No. 250808.00
6.0 Minnesota State University, Mankato Vehicle Fleet
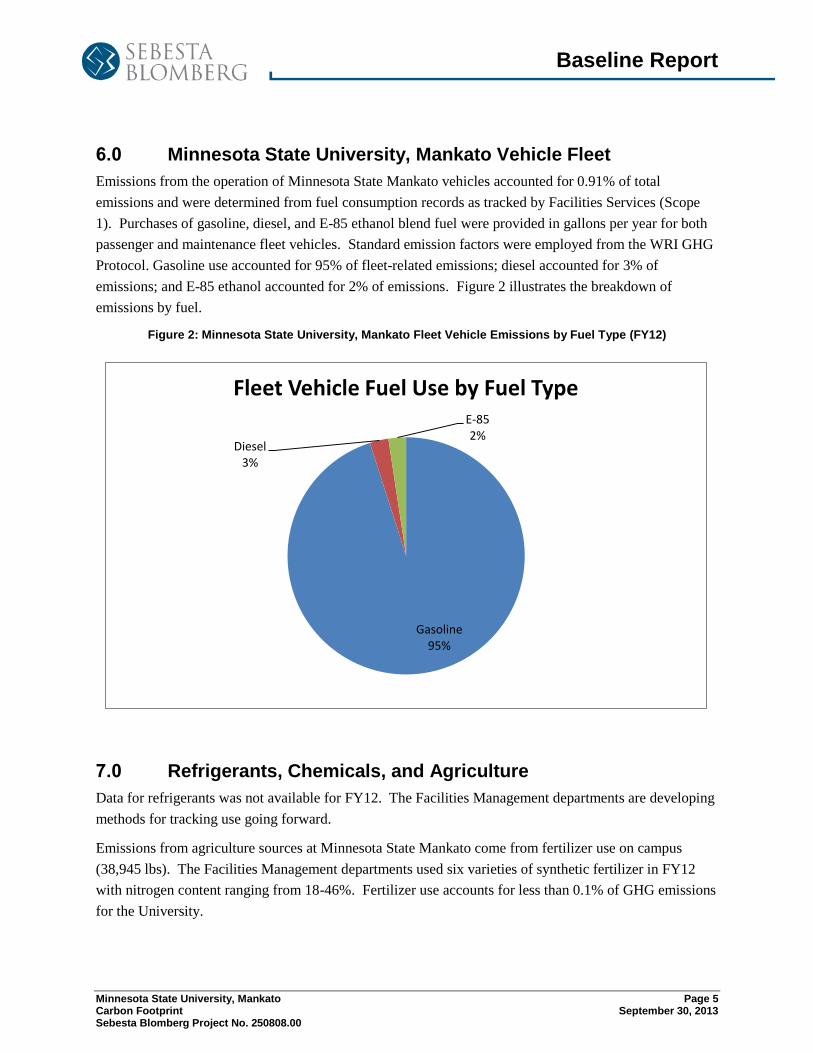
Emissions from the operation of Minnesota State Mankato vehicles accounted for 0.91% of total
emissions and were determined from fuel consumption records as tracked by Facilities Services (Scope
1). Purchases of gasoline, diesel, and E-85 ethanol blend fuel were provided in gallons per year for both
passenger and maintenance fleet vehicles. Standard emission factors were employed from the WRI GHG
Protocol. Gasoline use accounted for 95% of fleet-related emissions; diesel accounted for 3% of
emissions; and E-85 ethanol accounted for 2% of emissions. Figure 2 illustrates the breakdown of
emissions by fuel.
Figure 2: Minnesota State University, Mankato Fleet Vehicle Emissions by Fuel Type (FY12)
7.0 Refrigerants, Chemicals, and Agriculture
Data for refrigerants was not available for FY12. The Facilities Management departments are developing
methods for tracking use going forward.
Emissions from agriculture sources at Minnesota State Mankato come from fertilizer use on campus
(38,945 lbs). The Facilities Management departments used six varieties of synthetic fertilizer in FY12
with nitrogen content ranging from 18-46%. Fertilizer use accounts for less than 0.1% of GHG emissions
for the University.
Gasoline 95%
Diesel 3%
E-85 2%
Fleet Vehicle Fuel Use by Fuel Type
Baseline Report
Minnesota State University, Mankato Page 6 Carbon Footprint September 30, 2013 Sebesta Blomberg Project No. 250808.00
8.0 Electricity
The combined impact of electricity use on greenhouse gas emissions at Minnesota State Mankato is
63.17% of the total carbon footprint. This includes 57.48% of emissions for purchased electricity from
Xcel Energy (Scope 2) plus an additional 5.69% for T&D losses (Scope 3).
Emissions from electric consumption are typically the largest component of a footprint because of the
carbon-intensive inputs to electric generation and the inefficient nature of electricity production and
transportation. Emissions were calculated using emission factors representing the power pool average for
kilowatt hours consumed in the MROW sub-region for FY12. This approach is a standard method used
by both the World Resources Institute (WRI) in their GHG Protocol, and by the U.S. Department of
Energy in the 1605(b) Voluntary Reporting of Greenhouse Gas Emissions Program.
T&D Losses are line losses related to the transmission and distribution of electricity from the power plant
to the University campus. These are calculated separately because T&D loss is inherent in moving
electricity from the power plant to the University.
9.0 Commuting
The fuel burned by students, faculty, and staff as they commute to and from the University contributed
11.95% of the total emissions profile. For a campus that houses approximately 3,000 students on campus
(20-25%), in addition to local bus service, the magnitude of these emissions are not unexpected.
Minnesota State University, Mankato provides a campus shuttle bus and other local bus service to nearby
residential neighborhoods in partnership with the City of Mankato, which is partially funded by a Green
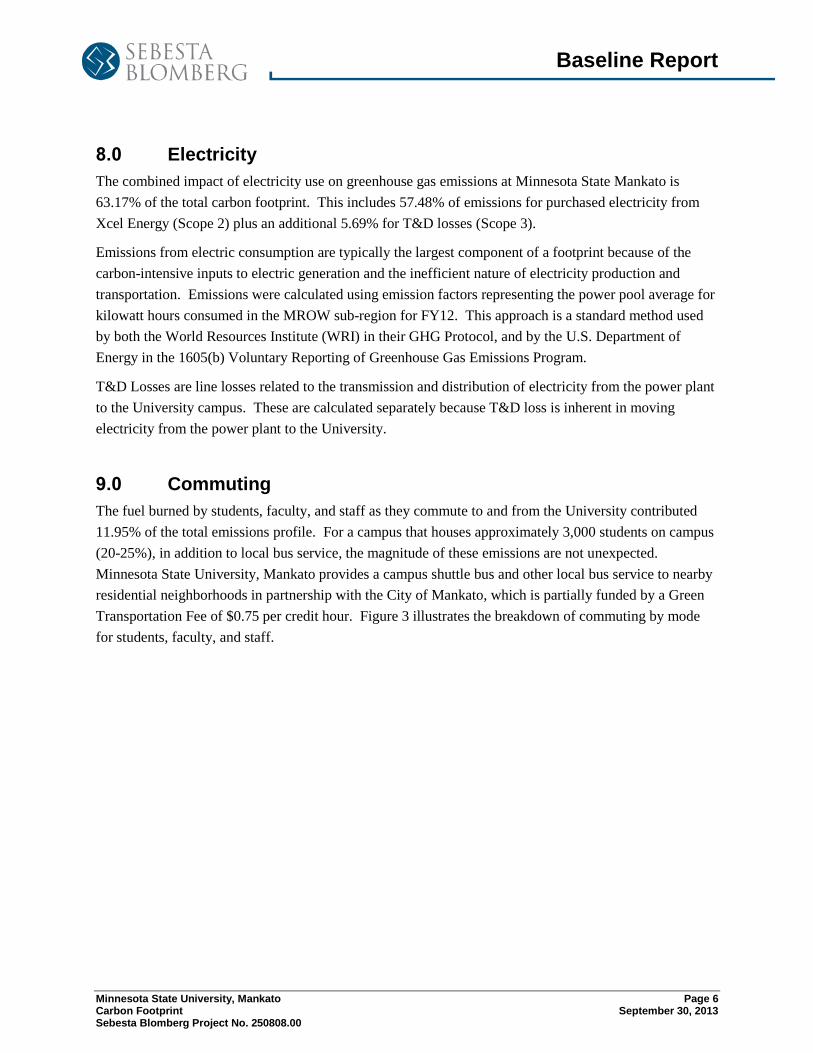
Transportation Fee of $0.75 per credit hour. Figure 3 illustrates the breakdown of commuting by mode
for students, faculty, and staff.
Baseline Report
Minnesota State University, Mankato Page 7 Carbon Footprint September 30, 2013 Sebesta Blomberg Project No. 250808.00
Figure 3: Commuting Trips by Mode at Minnesota State University, Mankato
According to the survey results, the average distance traveled for students is 8.2 miles (one-way) and 11
miles for faculty and staff. Driving and carpooling trips averages range from 11.0-12.9 miles/trip across
the three groups. Bus trips average 2.1 miles (range average of 2.0-5.2 miles across groups). Both bike
and walking trips average 1.9 miles per trip with a range average of 1.9-2.4 miles for bike trips and 1.0-
1.9 for walking trips across groups.
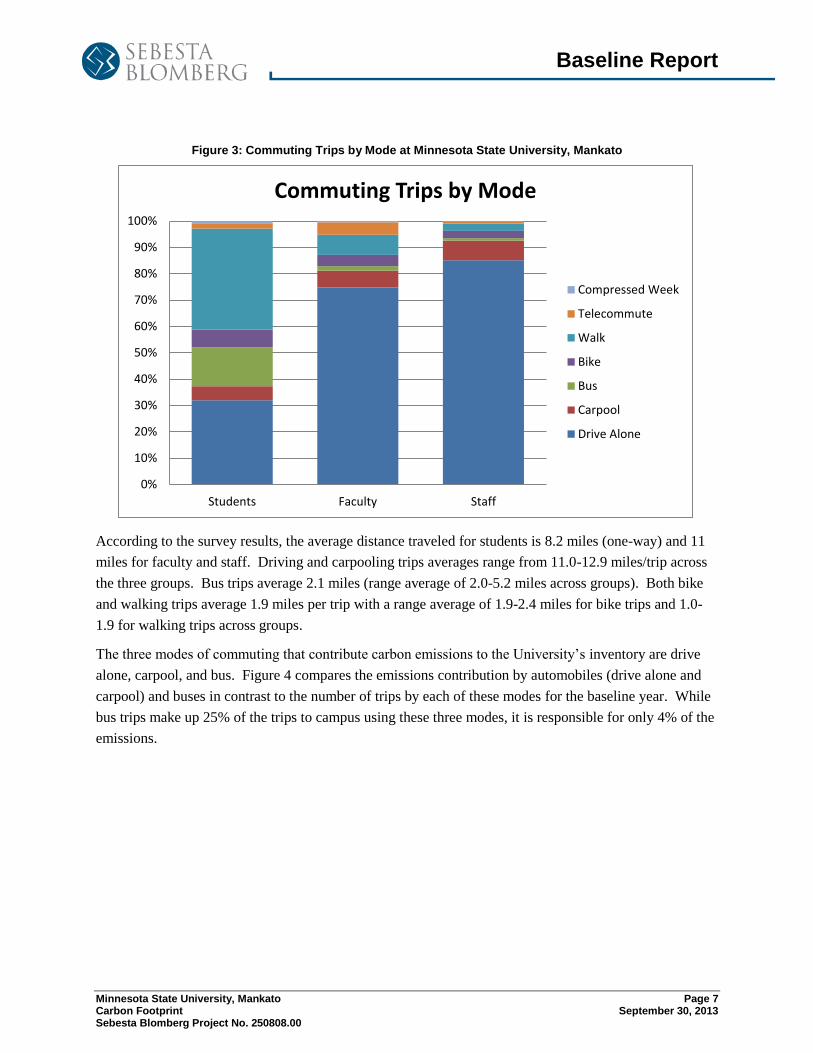
The three modes of commuting that contribute carbon emissions to the University’s inventory are drive
alone, carpool, and bus. Figure 4 compares the emissions contribution by automobiles (drive alone and
carpool) and buses in contrast to the number of trips by each of these modes for the baseline year. While
bus trips make up 25% of the trips to campus using these three modes, it is responsible for only 4% of the
emissions.
0%
10%
20%
30%
40%
50%
60%
70%
80%
90%
100%
Students Faculty Staff
Commuting Trips by Mode
Compressed Week
Telecommute
Walk
Bike
Bus
Carpool
Drive Alone
Baseline Report
Minnesota State University, Mankato Page 8 Carbon Footprint September 30, 2013 Sebesta Blomberg Project No. 250808.00
Figure 4: Percent Emissions by Method of Commuting at Minnesota State University, Mankato
Information on commuting patterns was gathered from a commuter survey, which was distributed
electronically to all students, faculty, and staff. The response rate to the survey was over 25% for faculty
and staff and 4.5% for students. Using this response rate, commuting patterns and mileage were projected
for the balance of the campus community. Commuting data mileage was compiled for trips by car
(including motorcycle), carpool, bus, bike, walk, telecommute, and compressed work week days off.
10.0 Air Travel and Business Use of Personal Vehicles
Data for air travel and business use of personal vehicles was unavailable for FY2012. The Business
Services Finance & Administration Division at Minnesota State Mankato collects travel information and
is discussing a way to pull together the necessary data for the carbon footprinting exercise.
0%
10%
20%
30%
40%
50%
60%
70%
80%
90%
100%
Emissions Trips
Percent Emissions vs. Trips by Commute Mode
Bus
Automobile
Baseline Report
Minnesota State University, Mankato Page 9 Carbon Footprint September 30, 2013 Sebesta Blomberg Project No. 250808.00
11.0 Solid Waste and Wastewater
Minnesota State University, Mankato reported an estimate of 795 short tons2 of solid waste and
recyclables generated in FY12. Approximately 80.7% of solid waste, 642 short tons, were transported to
the Blue Earth Ponderosa processing facility, a waste-to-energy facility, where methane is recovered and
used to produce electricity. Because energy was produced from the processing of the solid waste,
Minnesota State Mankato received a credit of 19 MTCO2e representing the amount of grid electricity
displaced by this form of energy generation (Scope 3). The remaining 19.3% of solid waste, 153 short
tons, were recycled and do not contribute to the carbon footprint.
Minnesota State University, Mankato changed solid waste haulers in 2012 to LJP Enterprises and data
used for the carbon footprint analysis were based on post-FY12 numbers available from the new hauler.
Solid waste disposal practices on campus remain the same and therefore historic waste numbers are
expected to be consistent, however, it is expected that the University will receive more accurate waste
records going forward.
Minnesota State University, Mankato reported an estimate of 44,469,000 gallons of wastewater generated
on campus and processed by an anaerobic digester at the City of Mankato wastewater treatment plant for
FY2012. Sewerage flow data is estimated on a monthly basis by the City of Mankato and is not metered.
This processing resulted in emissions totaling 23 MTCO2e (Scope 3).
12.0 Tracking Progress
With this baseline assessment, Minnesota State Mankato is able to better understand the impact of campus
operations on the environment. It is recommended that the University continues to track these metrics
and update their emissions on an annual basis in order to track progress overtime. Data collection for air
travel, rental car travel, and personal car travel should be improved so emissions can accurately be
counted for the school. Collecting precise data on commuting will remain a challenge, but the survey
strategy can be built on in an effort to increase the response rate.
2 A short ton is equivalent to 2000 pounds.
Baseline Report
Minnesota State University, Mankato Page 10 Carbon Footprint September 30, 2013 Sebesta Blomberg Project No. 250808.00
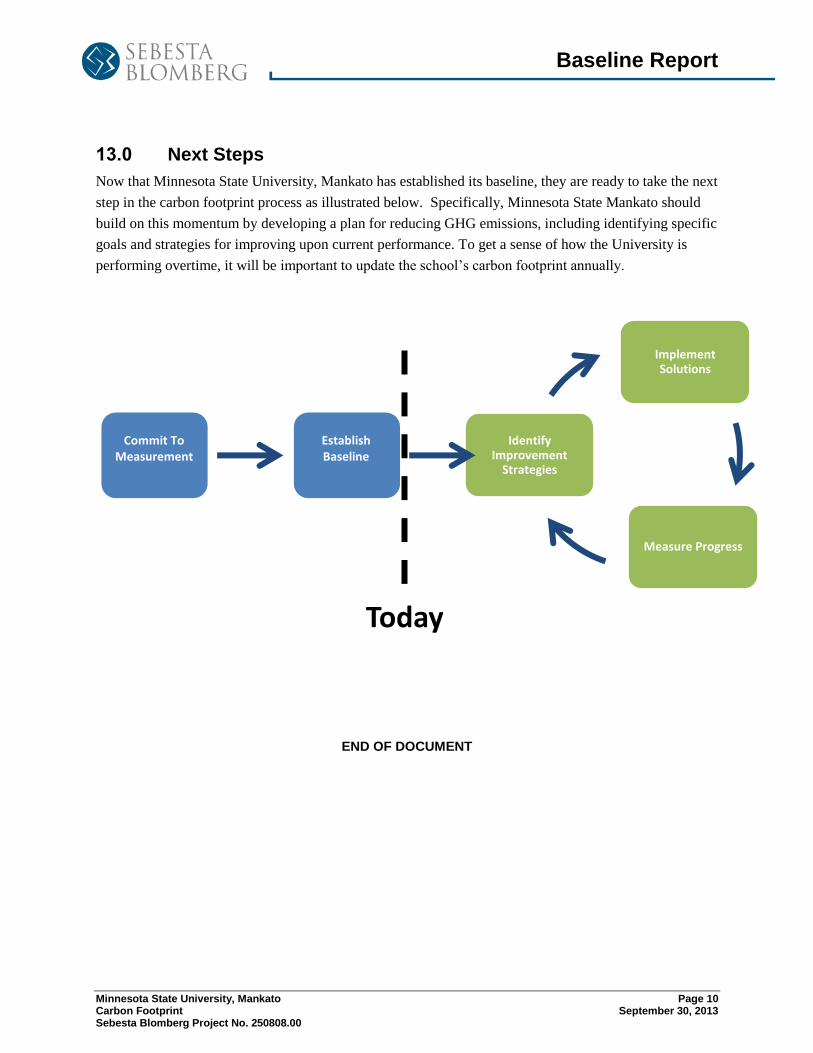
13.0 Next Steps
Now that Minnesota State University, Mankato has established its baseline, they are ready to take the next
step in the carbon footprint process as illustrated below. Specifically, Minnesota State Mankato should
build on this momentum by developing a plan for reducing GHG emissions, including identifying specific
goals and strategies for improving upon current performance. To get a sense of how the University is
performing overtime, it will be important to update the school’s carbon footprint annually.
END OF DOCUMENT
Identify Improvement
Strategies
Implement Solutions
Measure Progress
Commit To
Measurement Establish Baseline
Today
Appendix A
Minnesota State University, Mankato Page 11 Carbon Footprint September 30, 2013 Sebesta Blomberg Project No. 250808.00
Peer Institution Benchmarking
The primary purpose of measuring greenhouse gas emissions is to establish current environmental impact
and track performance over time. In the absence of multiple years of data, this section provides comparable
data for peer Higher Educational institutions to help put Minnesota State Mankato’s emissions inventory in
context. It should be noted that there are variables between institutions that are not controlled in this
analysis, such as building type (laboratory buildings use more energy than office buildings), off-season
programming (summer camps, conferences), and energy supply differences. However, these institutions use
the World Resources Institute’s GHG Protocol as described in Section 3, and therefore should be accounting
for emissions consistently.
Minnesota State University, Mankato is part of the Minnesota State Colleges and University (MnSCU)
system, which is made up of 54 campuses (27 million square feet) of 2-year and 4-year colleges, technical
schools, and universities. The University is one of seven 4-year institutions, almost all of which have a
similar profile to Minnesota State Mankato. Three of these schools currently measure and report their
greenhouse gas emissions through the American College & University Presidents’ Climate Commitment
(ACUPCC), and reported emissions for FY2012. In addition, we pulled data from two peer schools in the
University of Wisconsin system (Eau Claire and Oshkosh) that report their data through the ACUPCC.
Many of these peer institutions have been measuring and reporting GHG emissions for several years in an
effort to track their progress toward emissions reduction goals, and may have reduced their emissions from
their baseline.
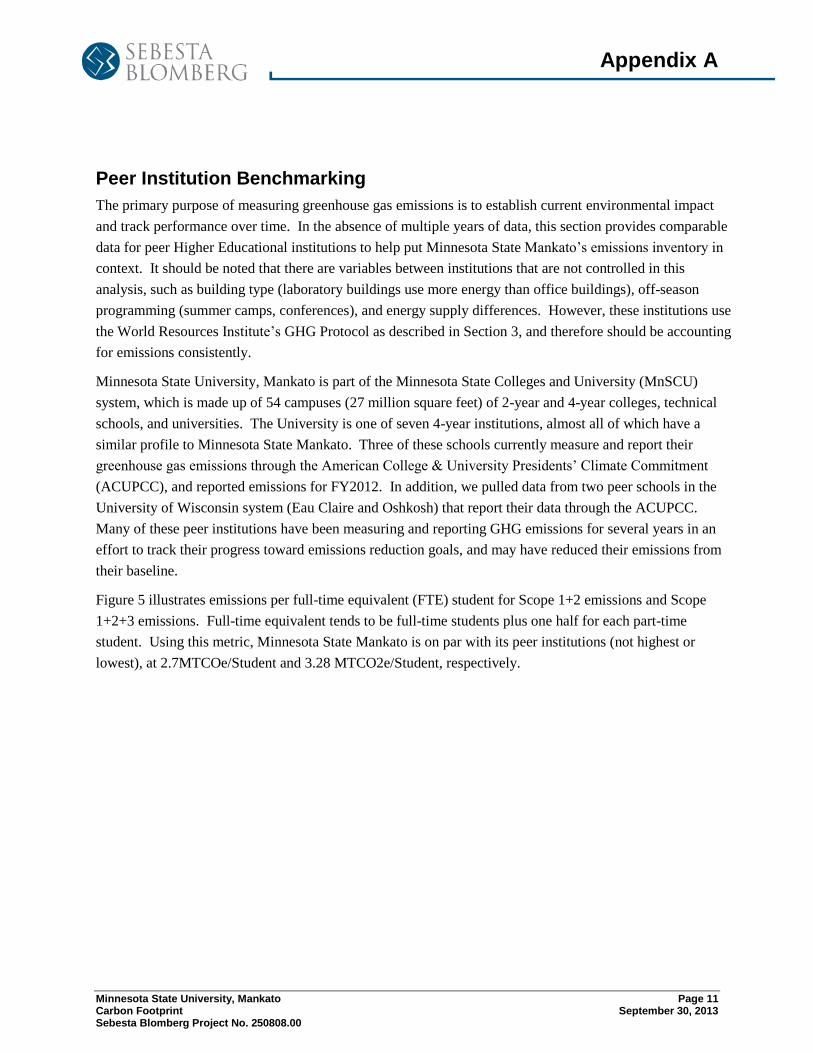
Figure 5 illustrates emissions per full-time equivalent (FTE) student for Scope 1+2 emissions and Scope
1+2+3 emissions. Full-time equivalent tends to be full-time students plus one half for each part-time
student. Using this metric, Minnesota State Mankato is on par with its peer institutions (not highest or
lowest), at 2.7MTCOe/Student and 3.28 MTCO2e/Student, respectively.
Appendix A
Minnesota State University, Mankato Page 12 Carbon Footprint September 30, 2013 Sebesta Blomberg Project No. 250808.00
Figure 5: Carbon Footprint per Student at Peer Institutions (FY12)
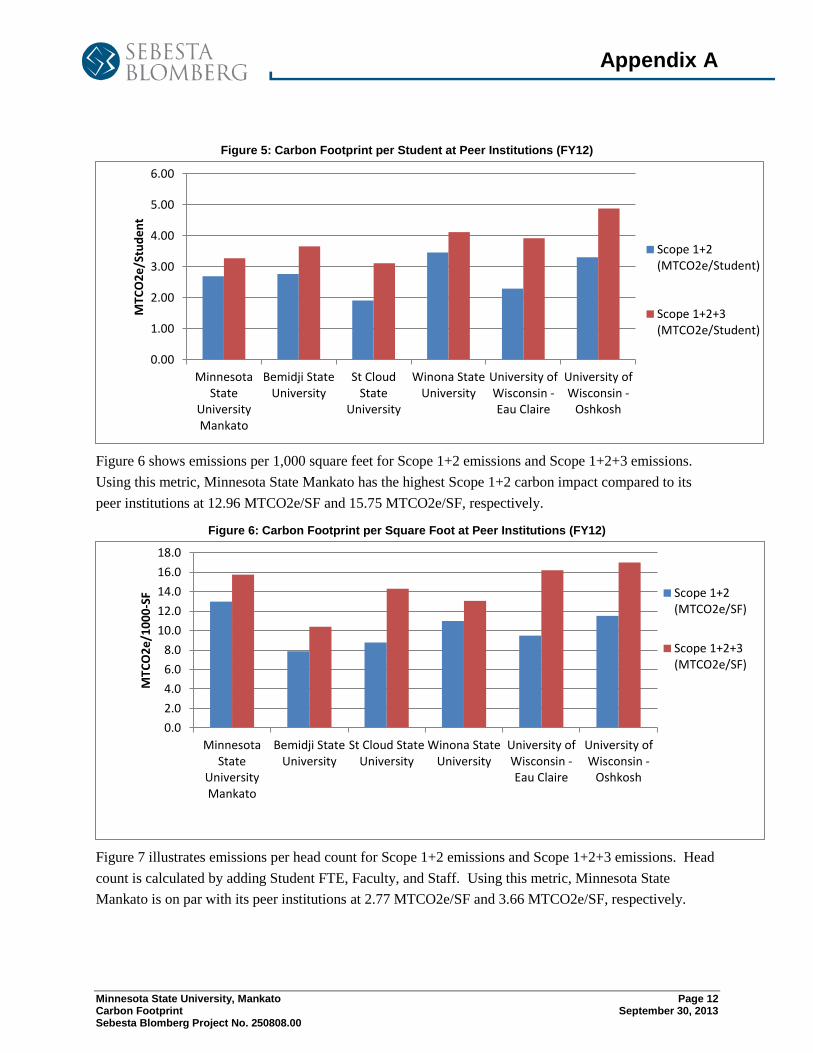
Figure 6 shows emissions per 1,000 square feet for Scope 1+2 emissions and Scope 1+2+3 emissions.
Using this metric, Minnesota State Mankato has the highest Scope 1+2 carbon impact compared to its
peer institutions at 12.96 MTCO2e/SF and 15.75 MTCO2e/SF, respectively.
Figure 6: Carbon Footprint per Square Foot at Peer Institutions (FY12)
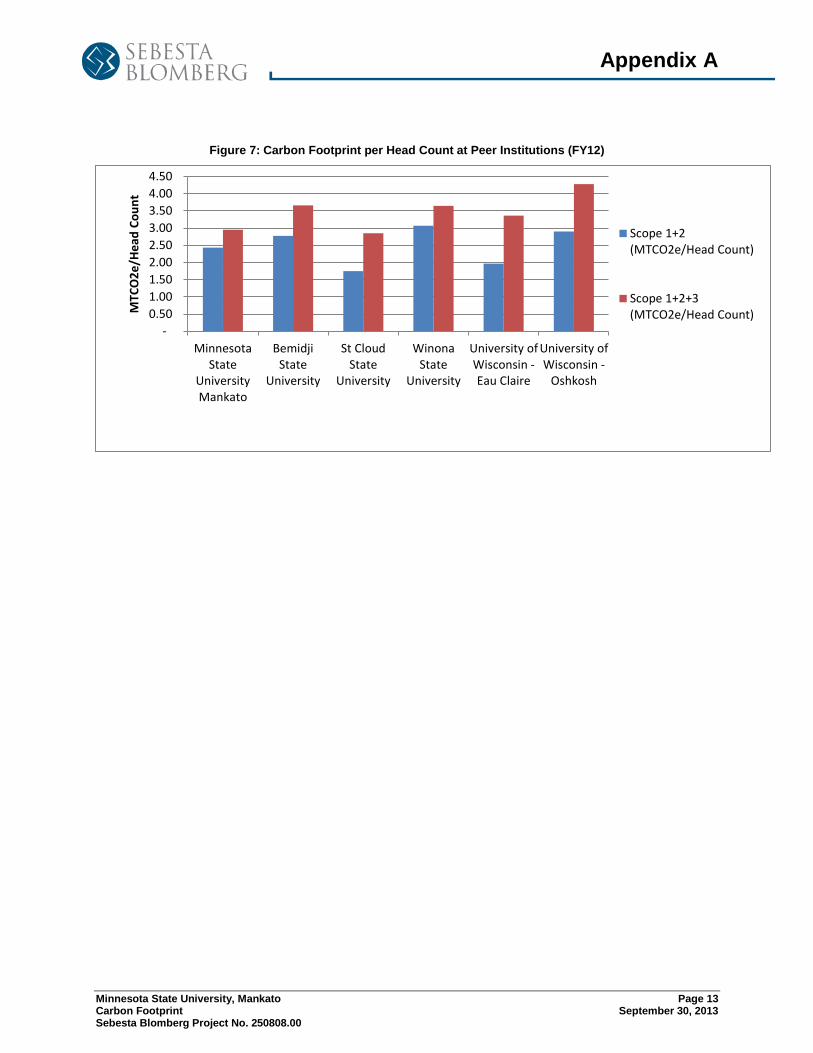
Figure 7 illustrates emissions per head count for Scope 1+2 emissions and Scope 1+2+3 emissions. Head
count is calculated by adding Student FTE, Faculty, and Staff. Using this metric, Minnesota State
Mankato is on par with its peer institutions at 2.77 MTCO2e/SF and 3.66 MTCO2e/SF, respectively.
0.00
1.00
2.00
3.00
4.00
5.00
6.00
MinnesotaState
UniversityMankato
Bemidji StateUniversity
St CloudState
University
Winona StateUniversity
University ofWisconsin -Eau Claire
University ofWisconsin -
Oshkosh
MTC
O2
e/S
tud
en
t
Scope 1+2(MTCO2e/Student)
Scope 1+2+3(MTCO2e/Student)
0.0
2.0
4.0
6.0
8.0
10.0
12.0
14.0
16.0
18.0
MinnesotaState
UniversityMankato
Bemidji StateUniversity
St Cloud StateUniversity
Winona StateUniversity
University ofWisconsin -Eau Claire
University ofWisconsin -
Oshkosh
MTC
O2
e/1
00
0-S
F Scope 1+2(MTCO2e/SF)
Scope 1+2+3(MTCO2e/SF)
Appendix A
Minnesota State University, Mankato Page 13 Carbon Footprint September 30, 2013 Sebesta Blomberg Project No. 250808.00
Figure 7: Carbon Footprint per Head Count at Peer Institutions (FY12)
-
0.50
1.00
1.50
2.00
2.50
3.00
3.50
4.00
4.50
MinnesotaState
UniversityMankato
BemidjiState
University
St CloudState
University
WinonaState
University
University ofWisconsin -Eau Claire
University ofWisconsin -
Oshkosh
MTC
O2
e/H
ead
Co
un
t
Scope 1+2(MTCO2e/Head Count)
Scope 1+2+3(MTCO2e/Head Count)
Appendix B
Minnesota State University, Mankato Page 14 Carbon Footprint September 30, 2013 Sebesta Blomberg Project No. 250808.00
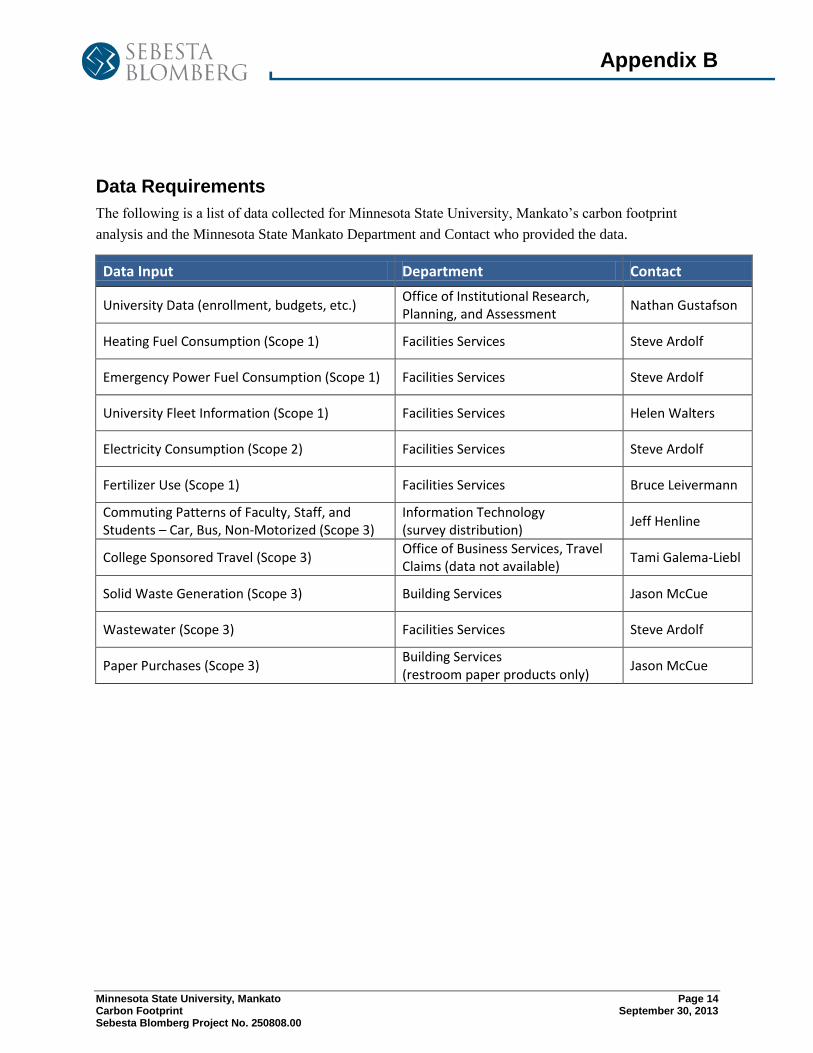
Data Requirements
The following is a list of data collected for Minnesota State University, Mankato’s carbon footprint
analysis and the Minnesota State Mankato Department and Contact who provided the data.
Data Input Department Contact
University Data (enrollment, budgets, etc.) Office of Institutional Research, Planning, and Assessment
Nathan Gustafson
Heating Fuel Consumption (Scope 1) Facilities Services Steve Ardolf
Emergency Power Fuel Consumption (Scope 1) Facilities Services Steve Ardolf
University Fleet Information (Scope 1) Facilities Services Helen Walters
Electricity Consumption (Scope 2) Facilities Services Steve Ardolf
Fertilizer Use (Scope 1) Facilities Services Bruce Leivermann
Commuting Patterns of Faculty, Staff, and Students – Car, Bus, Non-Motorized (Scope 3)
Information Technology (survey distribution)
Jeff Henline
College Sponsored Travel (Scope 3) Office of Business Services, Travel Claims (data not available)
Tami Galema-Liebl
Solid Waste Generation (Scope 3) Building Services Jason McCue
Wastewater (Scope 3) Facilities Services Steve Ardolf
Paper Purchases (Scope 3) Building Services (restroom paper products only)
Jason McCue
Appendix B
Minnesota State University, Mankato Page 15 Carbon Footprint September 30, 2013 Sebesta Blomberg Project No. 250808.00
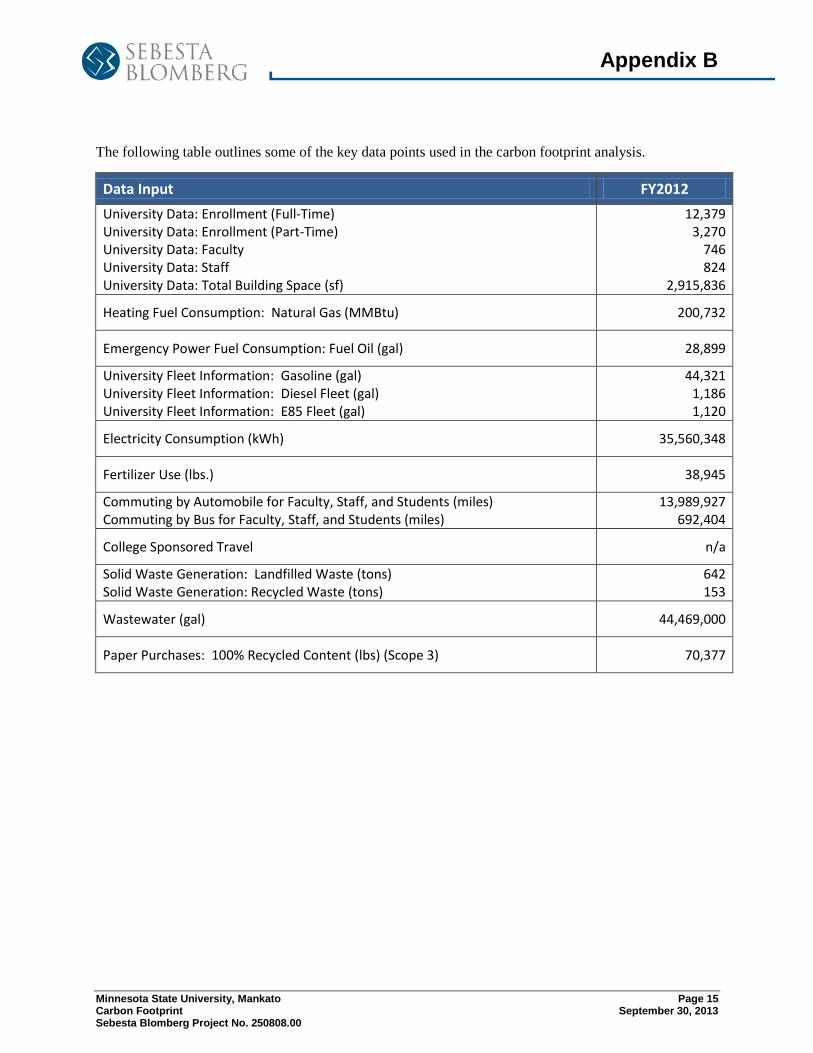
The following table outlines some of the key data points used in the carbon footprint analysis.
Data Input FY2012
University Data: Enrollment (Full-Time) University Data: Enrollment (Part-Time) University Data: Faculty University Data: Staff University Data: Total Building Space (sf)
12,379 3,270
746 824
2,915,836
Heating Fuel Consumption: Natural Gas (MMBtu) 200,732
Emergency Power Fuel Consumption: Fuel Oil (gal) 28,899
University Fleet Information: Gasoline (gal) University Fleet Information: Diesel Fleet (gal) University Fleet Information: E85 Fleet (gal)
44,321 1,186 1,120
Electricity Consumption (kWh) 35,560,348
Fertilizer Use (lbs.) 38,945
Commuting by Automobile for Faculty, Staff, and Students (miles) Commuting by Bus for Faculty, Staff, and Students (miles)
13,989,927 692,404
College Sponsored Travel n/a
Solid Waste Generation: Landfilled Waste (tons) Solid Waste Generation: Recycled Waste (tons)
642 153
Wastewater (gal) 44,469,000
Paper Purchases: 100% Recycled Content (lbs) (Scope 3) 70,377