Embed Size (px)
Citation preview
1 | P a g e
REPORT
CARBON TRADING IN SOUTH AFRICA TRADING OFFSETS AGAINST THE PROPOSED CARBON TAX
MARCH 2014
2 | P a g e
EXECUTIVE SUMMARY
This report presents the findings of a research project on the potential structuring of a carbon offset trading program in South Africa.
The project has been funded by the British High Commission in Pretoria.
Policy documents published by the South African Government mention the potential use of carbon offsets in two applications. The first is to allow companies to mitigate its financial liability in terms of the proposed carbon tax. The second is to be used against a potential carbon budgeting system. This report focusses mainly on the first application.
The report starts off with the question of whether it will be possible to implement a carbon offset trading scheme within the same time horizon as the announced schedule for the implementation of the South African carbon tax. It concludes that this will be possible provided maximum use can be made of existing infrastructure. This infrastructure is required to ensure both the environmental integrity and the economic integrity of the system.
The environmental integrity of the system can be assured through the utilisation of existing offset standards like the CDM, VCS or Gold Standard. Economic integrity can be assured by using the JSE as trading platform and combining it with either a local registry such as Strate or ESC or an international registry such as Markit or APX. Over time elements such as additional standard, new national offset standards or derivative trading could be added to the proposed basic offset trading framework.
The research found that the introduction of credits into a South African system should be done in a process that checks the appropriateness of the project to be traded into the South African system. We propose a set of National Appropriateness Tagging Rules. These rules should specify the eligibility criteria of projects that can be traded within the system. We further propose that the tagging rules be placed under the custodianship of a committee consisting of both government and the private sector.
The project covered a high level analysis of the potential market supply and demand and found that there is sufficient potential volume at a marginal cost of R120 per ton CO2e to create a viable market.
The overall conclusion of the project is that the necessary infrastructure as well as potential supply and demand exists to create a carbon offset trading scheme within the same timeframes as the proposed South African carbon tax.
3 | P a g e
Contents 1 Introduction.......................................................................................................................................................... 5 2 Background to the Proposed Trading Scheme ............................................................................................... 6 3 Framing the Approach ........................................................................................................................................ 8
3.1 Carbon Trade Classification ..................................................................................................................... 8 3.2 Offset Trading in Various Control regimes .......................................................................................... 9 3.3 Offset trading under a Carbon Tax versus a Cap-and-Trade-Scheme ............................................ 10 3.4 Demarcation of the Scope of The Project .......................................................................................... 11
4 Design of the Carbon Offset Trading Scheme ............................................................................................. 15 4.1 Environmental Integrity ......................................................................................................................... 16
4.1.1 Offset Standards .................................................................................................................................. 18 4.2 National Appropriateness ...................................................................................................................... 21
4.2.1 RSA Tagging Rules ............................................................................................................................. 22 4.2.2 Custodianship of RSA Tagging Rules .............................................................................................. 24
4.3 Economic Integrity.................................................................................................................................. 24 4.3.1 Trading System .................................................................................................................................... 24 4.3.2 Registry ................................................................................................................................................. 25
4.4 Longer Term Development ................................................................................................................... 28 4.4.1 South African Standard ...................................................................................................................... 28 4.4.2 Costs ...................................................................................................................................................... 28
5 Functioning of the Market ............................................................................................................................... 29 5.1 Roles of Project Participants .................................................................................................................. 31
6 Supply and Demand .......................................................................................................................................... 32 6.1 Demand for SA Carbon Offset Trading Scheme ............................................................................... 32 6.2 Supply for SA Carbon Offset Trading Scheme .................................................................................. 34
6.2.1 Position of the Project Relative to the Tax Net ............................................................................. 35 6.2.2 Registration date .................................................................................................................................. 35 6.2.3 Additionality ......................................................................................................................................... 36 6.2.4 Positive List .......................................................................................................................................... 37 6.2.5 Implementation and availability levels ............................................................................................. 39
6.3 Supply versus Demand ........................................................................................................................... 39 7 International Alignment ................................................................................................................................... 44
7.1 Developments in the Global GHG Arena .......................................................................................... 44 7.2 South Africa’s Position in the Emerging Global Low carbon Economy ....................................... 45 7.3 Framework for Various Approaches .................................................................................................... 47
8 Conclusion .......................................................................................................................................................... 49
4 | P a g e
Figures Figure 1: Structure of the South African carbon tax proposal ............................................................................. 6 Figure 2: Example of Offsets in the Proposed Carbon Tax ................................................................................. 7 Figure 3: Operation of the EU ETS ...................................................................................................................... 10 Figure 4: Operation of the proposed SA carbon tax system ............................................................................. 11 Figure 5: Scope of this project ................................................................................................................................. 11 Figure 6: Elements of a conventional ETS ............................................................................................................ 12 Figure 7: Proposed process for including carbon offsets in the South African System ................................. 16 Figure 8: Concept of a central environmental standard to be used for both emissions accounting and offset verification ....................................................................................................................................................... 18 Figure 9: Risks associated with the offset schemes ............................................................................................. 19 Figure 10: Envisaged Market Structure .................................................................................................................. 29 Figure 11: Example of CDM registry cancelation letter ..................................................................................... 30 Figure 12: Estimated demand for carbon offsets ................................................................................................. 34 Figure 13: Supply of offsets from outside tax net compared to demand ......................................................... 40 Figure 14: Supply of offsets from projects registered prior 2015 compared to demand ............................... 41 Figure 15: Supply of offsets from outside of the tax net, but additional .......................................................... 41 Figure 16: Supply of offsets from the residential sector (as example of positive list) .................................... 42 Figure 17: Supply of offsets from RE IPP Programme compared to demand ............................................... 42 Figure 18: Cumulative supply compared to the two demand scenarios ........................................................... 43 Figure 20: Emissions from jurisdictions in which carbon pricing is being developed .................................. 44 Figure 21: Growth in domestic and export emissions ........................................................................................ 45 Figure 22: Carbon pricing in South Africa’s trading partners............................................................................ 46 Figure 23: Carbon in international trade ............................................................................................................... 46
Tables Table 1: Sectoral limits for offsets allowed .............................................................................................................. 6 Table 2: Elements associated with traditional Emission Trading Schemes and their relevance to the proposed SA scheme ................................................................................................................................................. 12 Table 3: Asymmetry in environmental integrity between the EU ETS and the CDM ................................. 17 Table 4: Criteria for selection of offset standards ............................................................................................... 19 Table 5: Estimated portion of emissions that fall within the tax net................................................................. 33 Table 5: Potential carbon offset supply at maximum implementation level outside of the carbon tax net 35 Table 7: Potential carbon credit supply at maximum implementation level in the Energy, Industry and Transport Sector ........................................................................................................................................................ 37 Table 8: Offset potential in the Residential Sector ............................................................................................... 38 Table 9: Emission mitigation potential of RE IPP Programme up to a 5% penetration rate ....................... 39 Table 10: Total potential carbon credit supply as per different implementation levels ................................. 39
5 | P a g e
1 INTRODUCTION
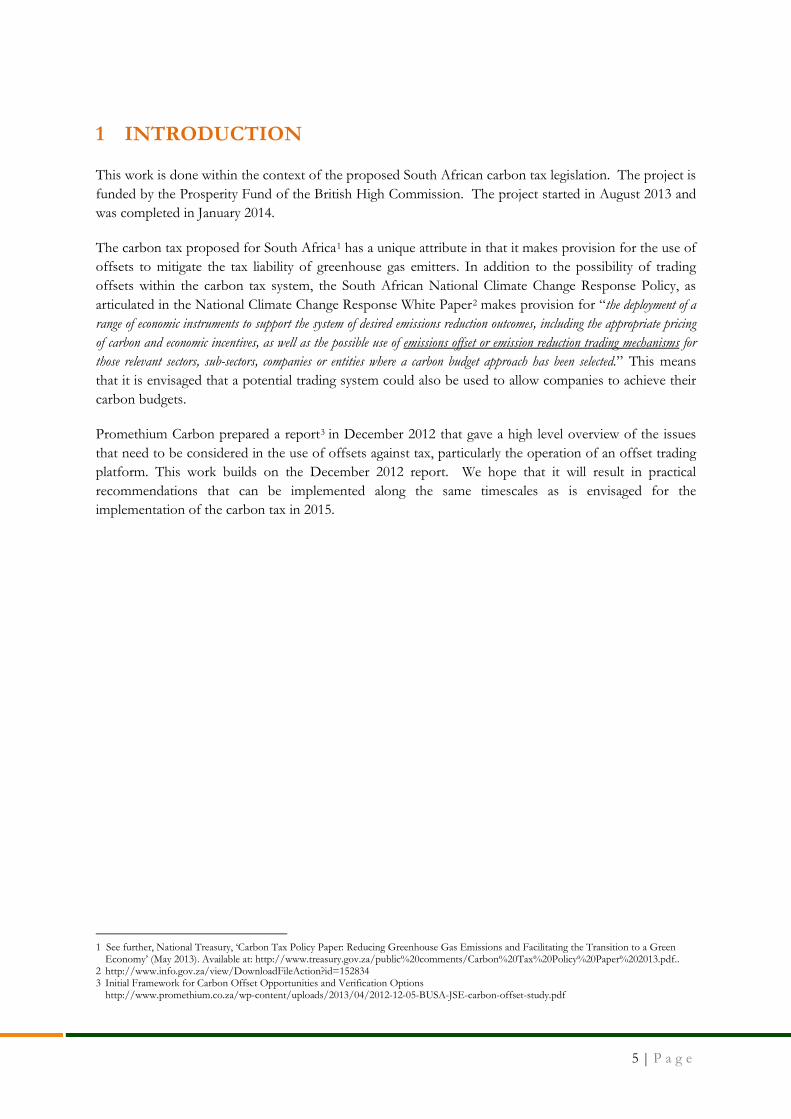
This work is done within the context of the proposed South African carbon tax legislation. The project is funded by the Prosperity Fund of the British High Commission. The project started in August 2013 and was completed in January 2014.
The carbon tax proposed for South Africa1 has a unique attribute in that it makes provision for the use of offsets to mitigate the tax liability of greenhouse gas emitters. In addition to the possibility of trading offsets within the carbon tax system, the South African National Climate Change Response Policy, as articulated in the National Climate Change Response White Paper2 makes provision for “the deployment of a range of economic instruments to support the system of desired emissions reduction outcomes, including the appropriate pricing of carbon and economic incentives, as well as the possible use of emissions offset or emission reduction trading mechanisms for those relevant sectors, sub-sectors, companies or entities where a carbon budget approach has been selected.” This means that it is envisaged that a potential trading system could also be used to allow companies to achieve their carbon budgets.
Promethium Carbon prepared a report3 in December 2012 that gave a high level overview of the issues that need to be considered in the use of offsets against tax, particularly the operation of an offset trading platform. This work builds on the December 2012 report. We hope that it will result in practical recommendations that can be implemented along the same timescales as is envisaged for the implementation of the carbon tax in 2015.
1 See further, National Treasury, ‘Carbon Tax Policy Paper: Reducing Greenhouse Gas Emissions and Facilitating the Transition to a Green
Economy’ (May 2013). Available at: http://www.treasury.gov.za/public%20comments/Carbon%20Tax%20Policy%20Paper%202013.pdf.. 2 http://www.info.gov.za/view/DownloadFileAction?id=152834 3 Initial Framework for Carbon Offset Opportunities and Verification Options
http://www.promethium.co.za/wp-content/uploads/2013/04/2012-12-05-BUSA-JSE-carbon-offset-study.pdf
6 | P a g e
2 BACKGROUND TO THE PROPOSED TRADING SCHEME
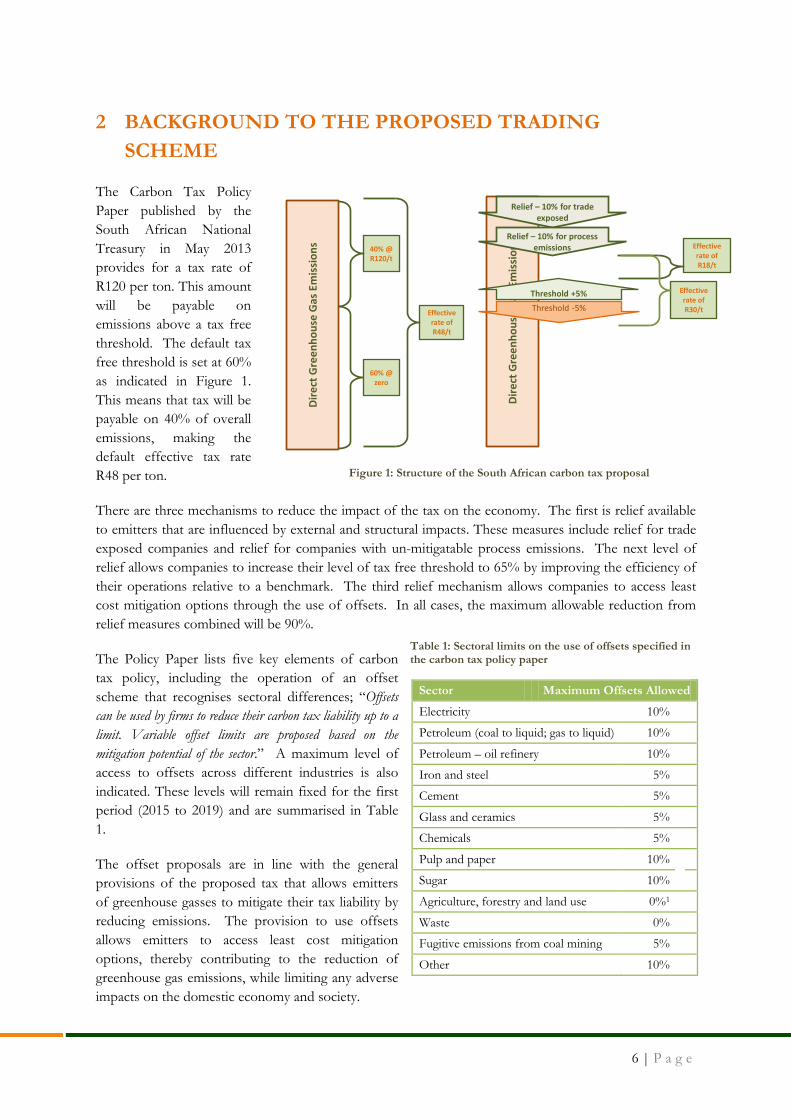
The Carbon Tax Policy Paper published by the South African National Treasury in May 2013 provides for a tax rate of R120 per ton. This amount will be payable on emissions above a tax free threshold. The default tax free threshold is set at 60% as indicated in Figure 1. This means that tax will be payable on 40% of overall emissions, making the default effective tax rate R48 per ton.
There are three mechanisms to reduce the impact of the tax on the economy. The first is relief available to emitters that are influenced by external and structural impacts. These measures include relief for trade exposed companies and relief for companies with un-mitigatable process emissions. The next level of relief allows companies to increase their level of tax free threshold to 65% by improving the efficiency of their operations relative to a benchmark. The third relief mechanism allows companies to access least cost mitigation options through the use of offsets. In all cases, the maximum allowable reduction from relief measures combined will be 90%.
The Policy Paper lists five key elements of carbon tax policy, including the operation of an offset scheme that recognises sectoral differences; “Offsets can be used by firms to reduce their carbon tax liability up to a limit. Variable offset limits are proposed based on the mitigation potential of the sector.” A maximum level of access to offsets across different industries is also indicated. These levels will remain fixed for the first period (2015 to 2019) and are summarised in Table 1.
The offset proposals are in line with the general provisions of the proposed tax that allows emitters of greenhouse gasses to mitigate their tax liability by reducing emissions. The provision to use offsets allows emitters to access least cost mitigation options, thereby contributing to the reduction of greenhouse gas emissions, while limiting any adverse impacts on the domestic economy and society.
Sector Maximum Offsets Allowed
Electricity 10%
Petroleum (coal to liquid; gas to liquid) 10%
Petroleum – oil refinery 10%
Iron and steel 5%
Cement 5%
Glass and ceramics 5%
Chemicals 5%
Pulp and paper 10%
Sugar 10%
Agriculture, forestry and land use 0%1
Waste 0%
Fugitive emissions from coal mining 5%
Other 10%
Table 1: Sectoral limits on the use of offsets specified in the carbon tax policy paper
Dire
ct G
reen
hous
e G
as E
mis
sion
s 40% @R120/t
Effective rate of R48/t
60% @ zero
Dire
ct G
reen
hous
e G
as E
mis
sion
s
Relief – 10% for trade exposed
Relief – 10% for process emissions Effective
rate of R18/t
Effective rate of R30/t
Threshold +5%Threshold -5%
Figure 1: Structure of the South African carbon tax proposal
7 | P a g e
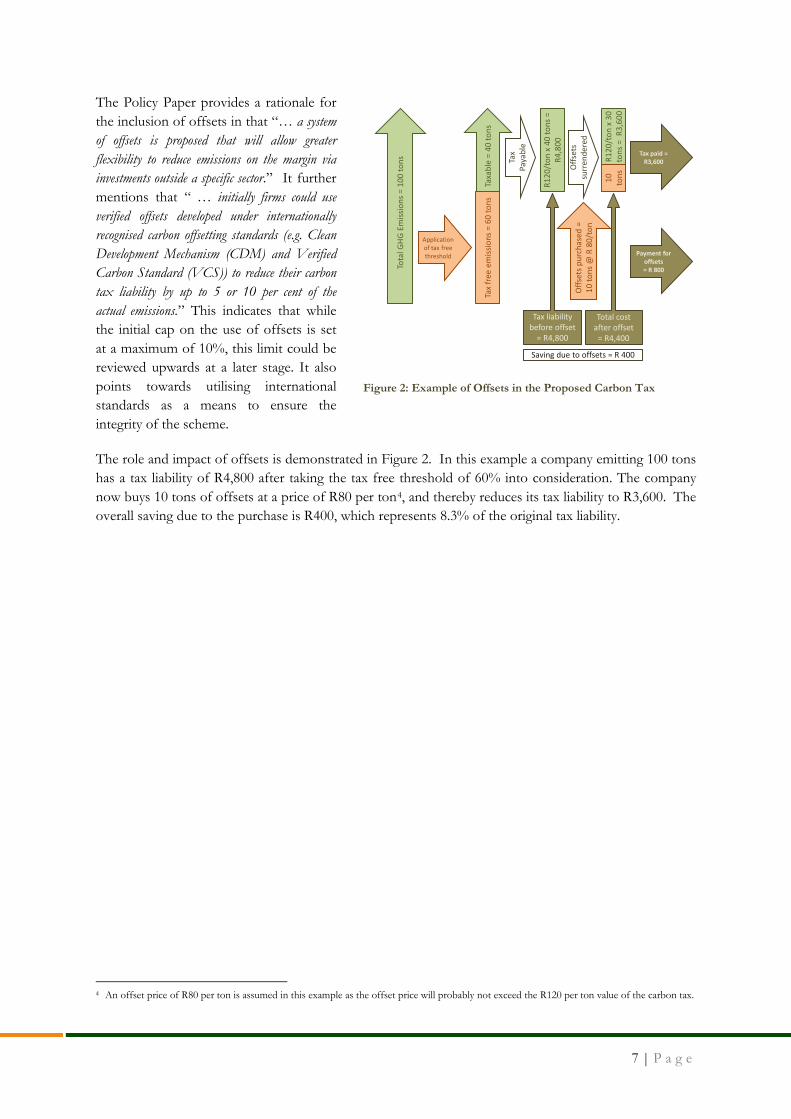
The Policy Paper provides a rationale for the inclusion of offsets in that “… a system of offsets is proposed that will allow greater flexibility to reduce emissions on the margin via investments outside a specific sector.” It further mentions that “ … initially firms could use verified offsets developed under internationally recognised carbon offsetting standards (e.g. Clean Development Mechanism (CDM) and Verified Carbon Standard (VCS)) to reduce their carbon tax liability by up to 5 or 10 per cent of the actual emissions.” This indicates that while the initial cap on the use of offsets is set at a maximum of 10%, this limit could be reviewed upwards at a later stage. It also points towards utilising international standards as a means to ensure the integrity of the scheme.
The role and impact of offsets is demonstrated in Figure 2. In this example a company emitting 100 tons has a tax liability of R4,800 after taking the tax free threshold of 60% into consideration. The company now buys 10 tons of offsets at a price of R80 per ton4, and thereby reduces its tax liability to R3,600. The overall saving due to the purchase is R400, which represents 8.3% of the original tax liability.
4 An offset price of R80 per ton is assumed in this example as the offset price will probably not exceed the R120 per ton value of the carbon tax.
Tota
l GHG
Em
issio
ns =
100
tons
Taxa
ble
= 40
tons
Tax
free
em
issio
ns =
60
tons
Application of tax free threshold
Tax
Paya
ble
R120
/ton
x 4
0 to
ns =
R4
,800
R120
/ton
x 3
0 to
ns =
R3,
600
Offs
ets p
urch
ased
=
10 to
ns @
R 8
0/to
n
10
tons
Offs
ets
surr
ende
red
Tax paid = R3,600
Payment for offsets= R 800
Tax liability before offset
= R4,800
Total cost after offset
= R4,400
Saving due to offsets = R 400
Figure 2: Example of Offsets in the Proposed Carbon Tax
8 | P a g e
3 FRAMING THE APPROACH
The project execution approach is framed by the requirement that this project should yield a proposal for a South African offset trading system that is implementable by mid-2015. This timeline would facilitate offset trade by the end of 2015, the proposed time when greenhouse gas emitting companies would start paying carbon tax. In addition to time constraints, it must be kept in mind that the system will be implemented in an economy that does not have excess resources to allocate to the establishment of a complex trading system.
The best approach to mitigate the risks imposed by the dual constraints of time and resources is to make maximum use of existing commercial and regulatory infrastructure. The approach taken in this respect differs from the approach taken in many other parts of the world. Many of the carbon trading schemes in operation or in design around the world are designed from the ground up as standalone systems; an approach that has unnecessarily complicated the implementation of carbon trading and carbon trading systems. Our approach considers that the most time and resource efficient option for an offset scheme in South Africa will be to incorporate carbon into existing trading infrastructure.
An understanding of the requirements for carbon tax offset trading in comparison to carbon trading under cap-and-trade schemes is required for the most appropriate design in the South African context.
3.1 CARBON TRADE CLASSIFICATION
The EU carbon market, as well as the CDM market, demonstrates that it is crucial that a clear definition of carbon, either as a commodity or a financial instrument, is provided at an early stage. One example of the confusion created by viewing carbon in isolation of existing infrastructure can be seen in the confusion around the classification of carbon in European markets. There remains no clear definition on whether or not carbon traded on the spot market is a commodity or a financial instrument. This is not only true of the European market, but also of the CDM market5.
Emission allowances are generally traded as commodities in existing trading systems. Certain challenges in Europe have however led to efforts to re-classify them as financial instruments. The following actions have been taken internationally in this regard:
• The EU proposed in October of 2011 to classify spot trades in carbon credits as financial instruments6 in terms of the Markets in Financial Instruments Directive ("MiFID II") Annex I Section C(4). This proposal created a separate category for marketable securities, derivatives and financial contracts. This inclusion in the MiFID II Directive will reclassify emission allowances as financial instruments. It is expected that MiFID II will be approved by the European Parliament in May 20147.
• France transferred the responsibility to oversee carbon trading from the French Energy Regulation Commission (CRE) to French Financial Markets Authority (AMF) in October 20108
5 Bennett L., ‘Are Tradable Carbon Emissions Credits Investments? Characterization and Ramifications under International Investment Law’, New York
University Law Review Vol. 85:1581, p 1581, http://www.nyulawreview.org/sites/default/files/pdf/NYULawReview-85-5-Bennett.pdf 6 EU MEMO/11/719 Brussels, 20 October 2011, Review of the Markets in Financial Instruments Directive (MiFID) and Proposals for a
Regulation on Market Abuse and for a Directive on Criminal Sanctions for Market Abuse: Frequently Asked Questions on Emission Allowances, http://europa.eu/rapid/press-release_MEMO-11-719_en.htm
7 MiFID II/MiFIR Trading Venues and Best Execution, Updated to June 10th, 2013, http://www.hatstand.com/insights 8 Climate Brief No16 · May 2012, Applying MiFID to the EU ETS: what are the implications? http://www.cdcclimat.com/IMG//pdf/12-
06_point_climat_no16_-_applying_mifid_to_the_eu_ets.pdf
9 | P a g e
in terms of the French Banking and Finance Regulation Act (Loi de Régulation Bancaire et Financière). This effectively classifies emission allowances as financial instruments in France.
• Romania classified EUA carbon credits as a financial instrument in February 20129 in a move to combat VAT fraud.
It appears that the reclassification of carbon in Europe does not result from challenges associated with the commodity nature of carbon allowances and offsets but rather to the chain of custody in European trans-border transactions, and the regulatory requirements to avoid issues such as VAT fraud.
Australia classified carbon credits as financial instruments under the Carbon Credits (Consequential Amendments) Bill 2011 (the Carbon Credits Bill)10. This includes all eligible international emissions units under the Australian National Registry of Emissions Units Act 2011 (eligible international emissions units) which would include AAU’s, CER’s and ERU’s as well as other future units such as those potentially from REDD+ projects or units from other schemes like NZUs and voluntary units such as under the Voluntary Carbon Standard. Emissions units are regulated as financial instruments under the Corporations Act (2001) and Australian Securities and Investments Commission Act (2001).
In Brazil carbon credits are not classified as securities, both because they do not have the nature of a derivative instrument and do not fit under the concept of a collective investment agreement, the two categories of securities with which financial instruments are commonly identified.11
1) This report focuses on the trading of carbon as a commodity, which can be covered by a financial instrument, to allow for existing infrastructure utilisation in the South African market. For ease of implementation it is suggested that the market starts trading with only actual verified emission reductions. The forward buying of credits, as is typically done in the CDM to finance projects, is not covered by the scope of the scheme proposed in this report. This trading can still be done on an over the counter (OTC) basis. Alternatively future developments could include the trading of derivatives.
3.2 OFFSET TRADING IN VARIOUS CONTROL REGIMES
The work in this project focuses primarily on the development of a trading scheme within the context of the South African Carbon Tax Policy paper. It is however important to note that offset trading can be used in a number of regulatory regimes, and that the work in the project can therefore be applicable to a broader suit of policy instruments or measures. Some examples are:
• Cap-and-trade: This is the traditional application of offset trading. In such a scheme offsets can used to meet an emitter’s commitment towards its emissions cap.
• Tax-and-trade: This is the proposal in the South African National Climate Change Response Policy Paper.
• Carbon budget: The Policy makes mention of the use of offsets by emitters to meet obligations in terms of Desired Emission Reduction Outcomes (DEROs). Under such a scheme an offset
9 Reuters, http://www.reuters.com/article/2010/02/24/us-romania-carbon-idUSTRE61N1PF20100224 10 Baker McKenzie, Financial Services and Climate Change Australia, Carbon Credits (Consequential Amendments) Bill 2011,
http://auslt01.bakernet.com/reaction/images/Legal%20Alert%20-%20Carbon%20Credits%20Bill.pdf 11 Ronald Herscovici and Mauricio Teixeira dos Santos, IFLR1000, Brazil - Carbon credits are not securities,
http://www.iflr1000.com/ViewLegislationGuide.aspx?LegislationGuideId=170&IsPrint=true
10 | P a g e
can be bought in the market and used towards the obligation of an emitter to meet a certain carbon budget.
3.3 OFFSET TRADING UNDER A CARBON TAX VERSUS A CAP-AND-TRADE-SCHEME
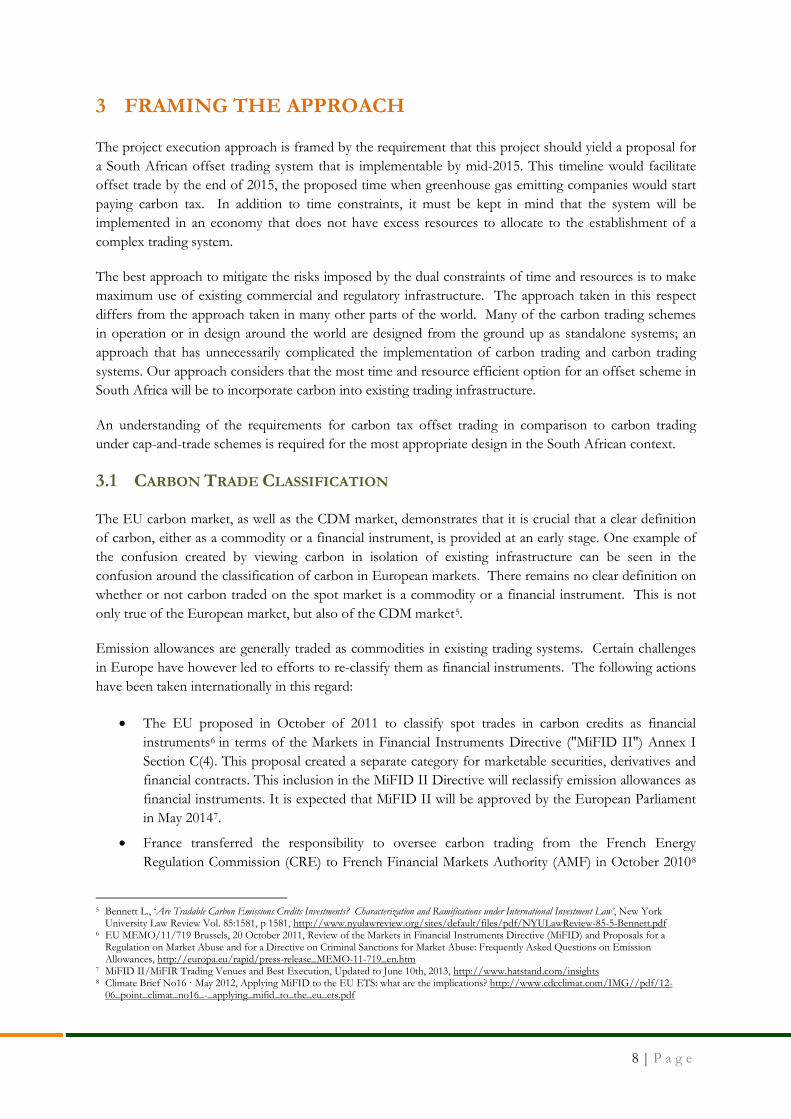
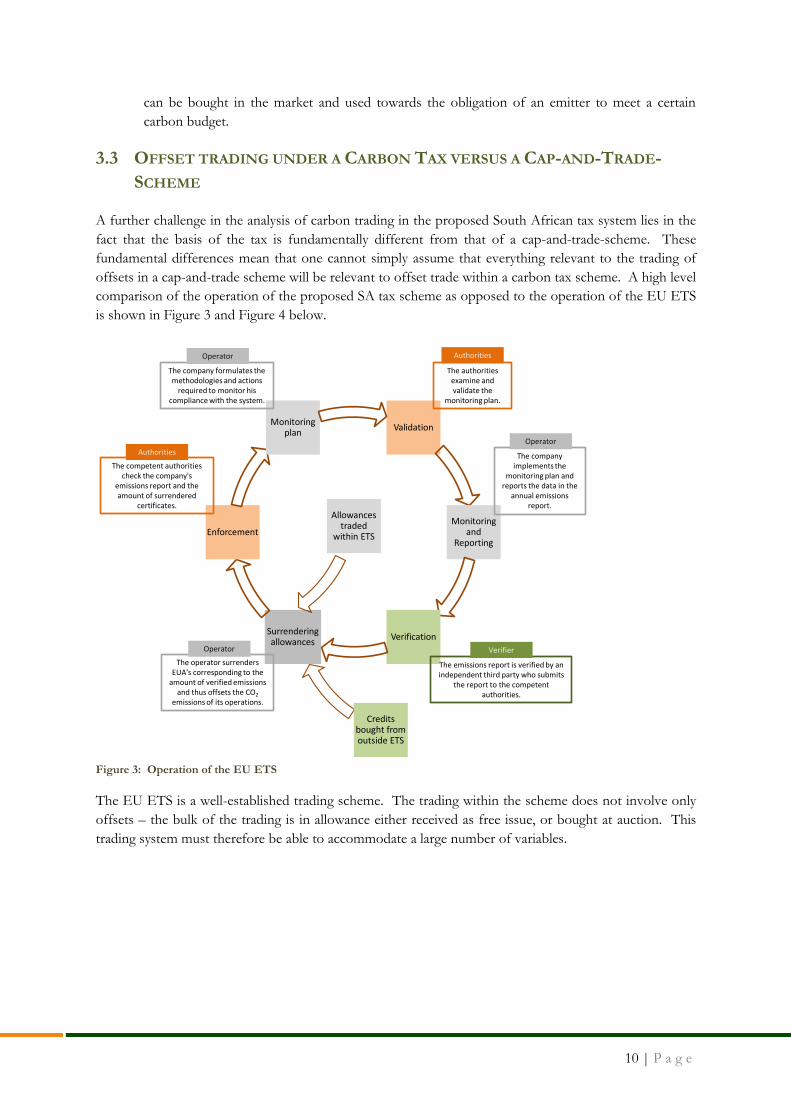
A further challenge in the analysis of carbon trading in the proposed South African tax system lies in the fact that the basis of the tax is fundamentally different from that of a cap-and-trade-scheme. These fundamental differences mean that one cannot simply assume that everything relevant to the trading of offsets in a cap-and-trade scheme will be relevant to offset trade within a carbon tax scheme. A high level comparison of the operation of the proposed SA tax scheme as opposed to the operation of the EU ETS is shown in Figure 3 and Figure 4 below.
Figure 3: Operation of the EU ETS
The EU ETS is a well-established trading scheme. The trading within the scheme does not involve only offsets – the bulk of the trading is in allowance either received as free issue, or bought at auction. This trading system must therefore be able to accommodate a large number of variables.
Validation
Monitoring and
Reporting
VerificationSurrendering allowances
Enforcement
Monitoring plan
The company formulates the methodologies and actions
required to monitor his compliance with the system.
The authorities examine and validate the
monitoring plan.
The company implements the
monitoring plan and reports the data in the
annual emissions report.
The emissions report is verified by an independent third party who submits
the report to the competent authorities.
The operator surrenders EUA's corresponding to the
amount of verified emissions and thus offsets the CO2
emissions of its operations.
The competent authorities check the company's
emissions report and the amount of surrendered
certificates.
Authorities
Authorities Operator
Operator
Operator Verifier
Allowances traded
within ETS
Credits bought from outside ETS
11 | P a g e
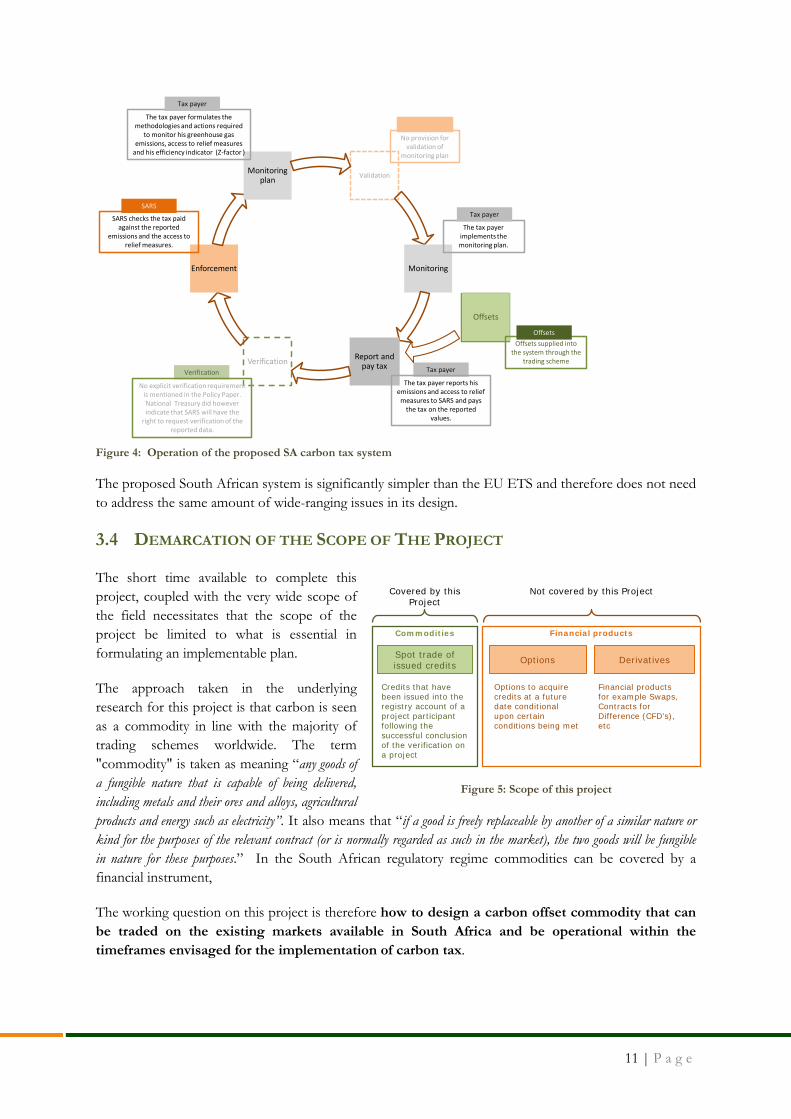
Figure 4: Operation of the proposed SA carbon tax system
The proposed South African system is significantly simpler than the EU ETS and therefore does not need to address the same amount of wide-ranging issues in its design.
3.4 DEMARCATION OF THE SCOPE OF THE PROJECT
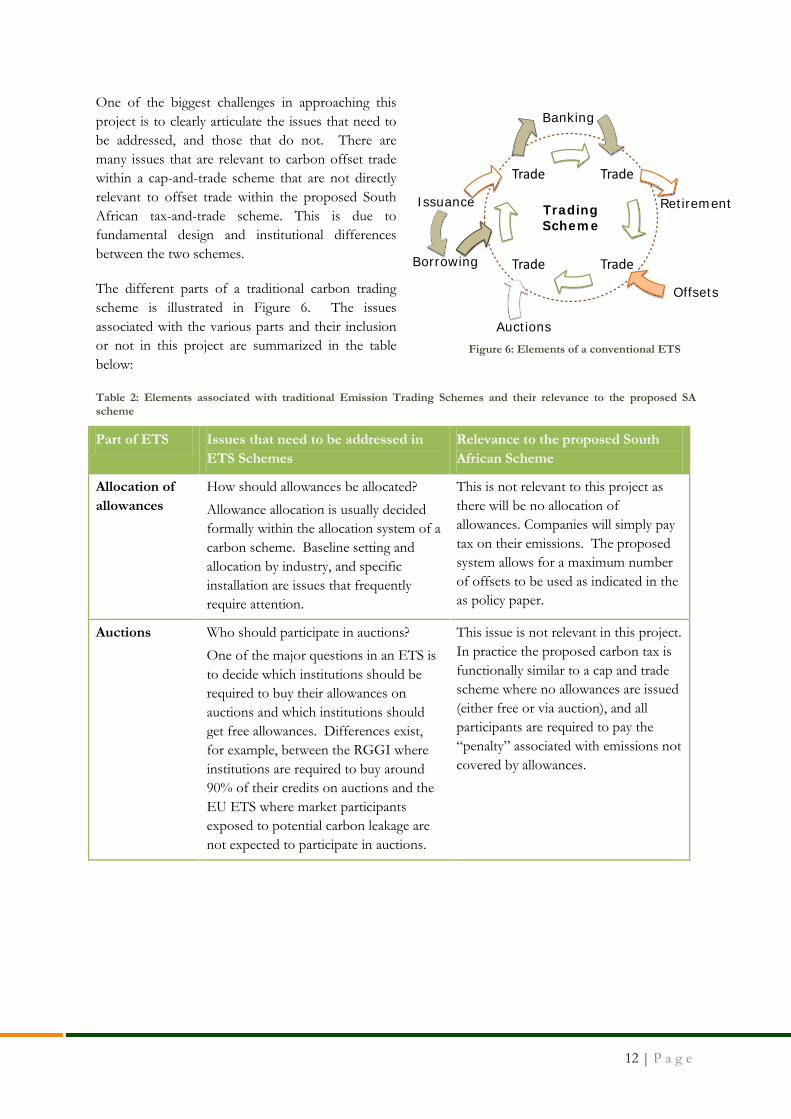
The short time available to complete this project, coupled with the very wide scope of the field necessitates that the scope of the project be limited to what is essential in formulating an implementable plan.
The approach taken in the underlying research for this project is that carbon is seen as a commodity in line with the majority of trading schemes worldwide. The term "commodity" is taken as meaning “any goods of a fungible nature that is capable of being delivered, including metals and their ores and alloys, agricultural products and energy such as electricity”. It also means that “if a good is freely replaceable by another of a similar nature or kind for the purposes of the relevant contract (or is normally regarded as such in the market), the two goods will be fungible in nature for these purposes.” In the South African regulatory regime commodities can be covered by a financial instrument,
The working question on this project is therefore how to design a carbon offset commodity that can be traded on the existing markets available in South Africa and be operational within the timeframes envisaged for the implementation of carbon tax.
Validation
Monitoring
Report and pay taxVerification
Enforcement
Monitoring plan
The tax payer formulates the methodologies and actions required
to monitor his greenhouse gas emissions, access to relief measures
and his efficiency indicator (Z-factor )
SARS checks the tax paid against the reported
emissions and the access to relief measures.
SARS
Tax payer
The tax payer implements the monitoring plan.
Tax payer
No explicit verification requirement is mentioned in the Policy Paper. National Treasury did however indicate that SARS will have the
right to request verification of the reported data.
Verification Tax payer
The tax payer reports his emissions and access to relief
measures to SARS and pays the tax on the reported
values.
No provision for validation of
monitoring plan
Offsets
Offsets supplied into the system through the
trading scheme
Offsets
Commodities Financial products
Spot trade of issued credits DerivativesOptions
Credits that have been issued into the registry account of a project participant following the successful conclusion of the verification on a project
Options to acquire credits at a future date conditional upon certain conditions being met
Financial products for example Swaps, Contracts for Difference (CFD’s), etc
Covered by this Project
Not covered by this Project
Figure 5: Scope of this project
12 | P a g e
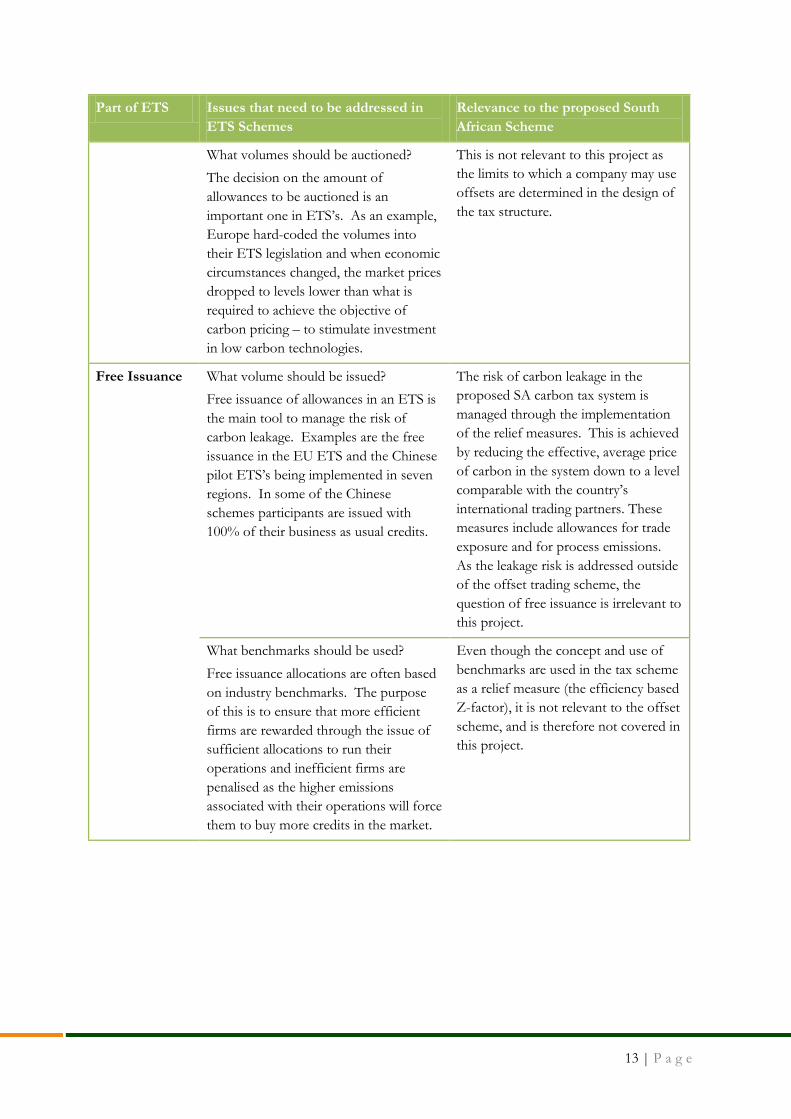
One of the biggest challenges in approaching this project is to clearly articulate the issues that need to be addressed, and those that do not. There are many issues that are relevant to carbon offset trade within a cap-and-trade scheme that are not directly relevant to offset trade within the proposed South African tax-and-trade scheme. This is due to fundamental design and institutional differences between the two schemes.
The different parts of a traditional carbon trading scheme is illustrated in Figure 6. The issues associated with the various parts and their inclusion or not in this project are summarized in the table below:
Table 2: Elements associated with traditional Emission Trading Schemes and their relevance to the proposed SA scheme
Part of ETS Issues that need to be addressed in ETS Schemes
Relevance to the proposed South African Scheme
Allocation of allowances
How should allowances be allocated? Allowance allocation is usually decided formally within the allocation system of a carbon scheme. Baseline setting and allocation by industry, and specific installation are issues that frequently require attention.
This is not relevant to this project as there will be no allocation of allowances. Companies will simply pay tax on their emissions. The proposed system allows for a maximum number of offsets to be used as indicated in the as policy paper.
Auctions Who should participate in auctions? One of the major questions in an ETS is to decide which institutions should be required to buy their allowances on auctions and which institutions should get free allowances. Differences exist, for example, between the RGGI where institutions are required to buy around 90% of their credits on auctions and the EU ETS where market participants exposed to potential carbon leakage are not expected to participate in auctions.
This issue is not relevant in this project. In practice the proposed carbon tax is functionally similar to a cap and trade scheme where no allowances are issued (either free or via auction), and all participants are required to pay the “penalty” associated with emissions not covered by allowances.
Trade
Trade Trade
Trade
Issuance Retirement
Offsets
Trading Scheme
Auctions
Banking
Borrowing
Figure 6: Elements of a conventional ETS
13 | P a g e
Part of ETS Issues that need to be addressed in ETS Schemes
Relevance to the proposed South African Scheme
What volumes should be auctioned? The decision on the amount of allowances to be auctioned is an important one in ETS’s. As an example, Europe hard-coded the volumes into their ETS legislation and when economic circumstances changed, the market prices dropped to levels lower than what is required to achieve the objective of carbon pricing – to stimulate investment in low carbon technologies.
This is not relevant to this project as the limits to which a company may use offsets are determined in the design of the tax structure.
Free Issuance What volume should be issued? Free issuance of allowances in an ETS is the main tool to manage the risk of carbon leakage. Examples are the free issuance in the EU ETS and the Chinese pilot ETS’s being implemented in seven regions. In some of the Chinese schemes participants are issued with 100% of their business as usual credits.
The risk of carbon leakage in the proposed SA carbon tax system is managed through the implementation of the relief measures. This is achieved by reducing the effective, average price of carbon in the system down to a level comparable with the country’s international trading partners. These measures include allowances for trade exposure and for process emissions. As the leakage risk is addressed outside of the offset trading scheme, the question of free issuance is irrelevant to this project.
What benchmarks should be used? Free issuance allocations are often based on industry benchmarks. The purpose of this is to ensure that more efficient firms are rewarded through the issue of sufficient allocations to run their operations and inefficient firms are penalised as the higher emissions associated with their operations will force them to buy more credits in the market.
Even though the concept and use of benchmarks are used in the tax scheme as a relief measure (the efficiency based Z-factor), it is not relevant to the offset scheme, and is therefore not covered in this project.
14 | P a g e
Part of ETS Issues that need to be addressed in ETS Schemes
Relevance to the proposed South African Scheme
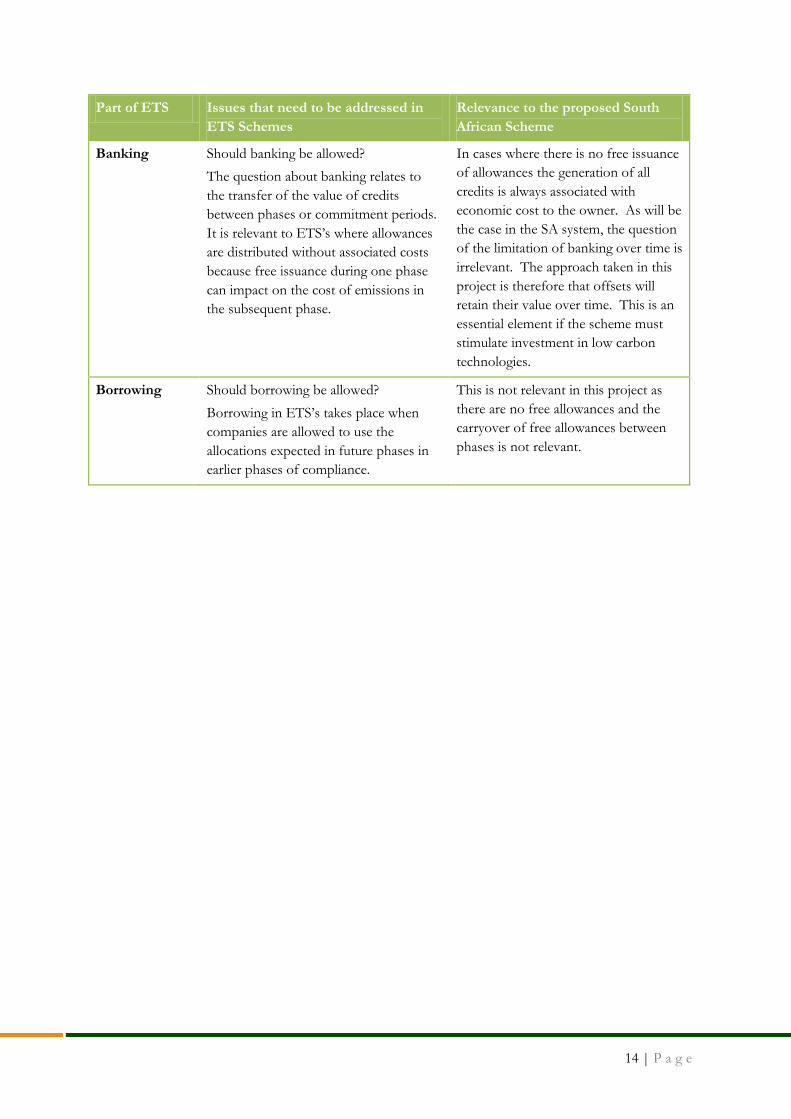
Banking Should banking be allowed? The question about banking relates to the transfer of the value of credits between phases or commitment periods. It is relevant to ETS’s where allowances are distributed without associated costs because free issuance during one phase can impact on the cost of emissions in the subsequent phase.
In cases where there is no free issuance of allowances the generation of all credits is always associated with economic cost to the owner. As will be the case in the SA system, the question of the limitation of banking over time is irrelevant. The approach taken in this project is therefore that offsets will retain their value over time. This is an essential element if the scheme must stimulate investment in low carbon technologies.
Borrowing Should borrowing be allowed? Borrowing in ETS’s takes place when companies are allowed to use the allocations expected in future phases in earlier phases of compliance.
This is not relevant in this project as there are no free allowances and the carryover of free allowances between phases is not relevant.
15 | P a g e
4 DESIGN OF THE CARBON OFFSET TRADING SCHEME
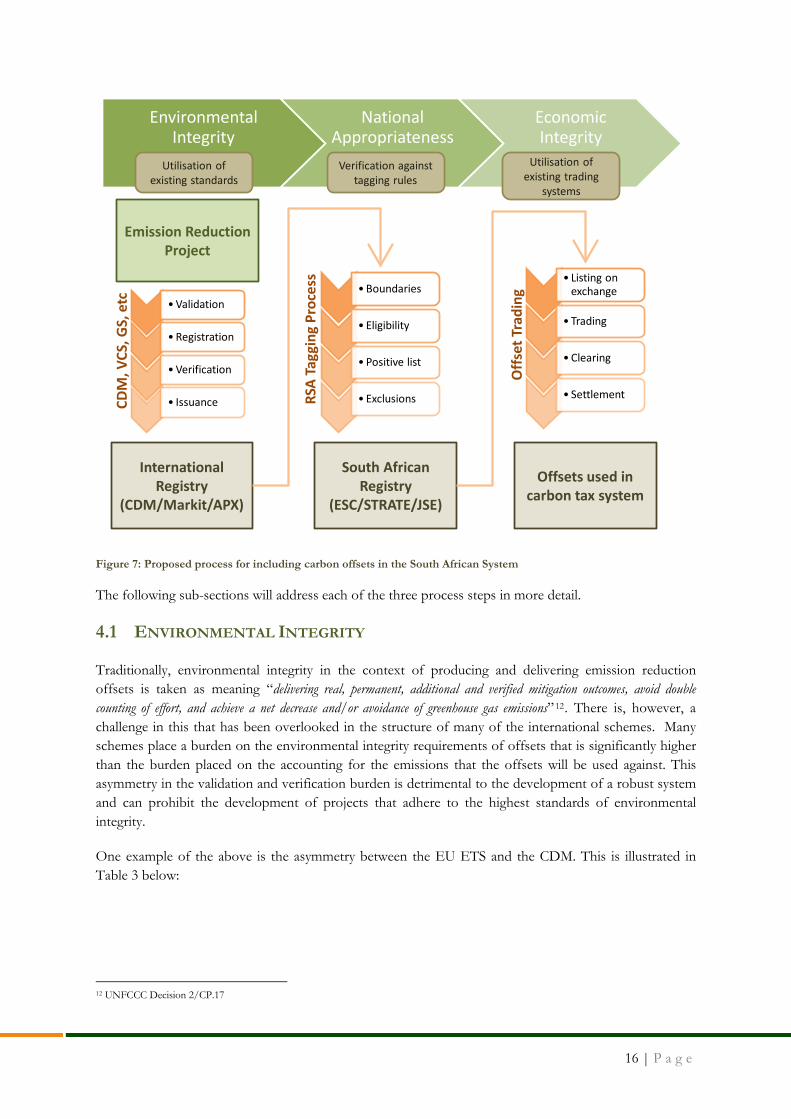
To design the basic carbon trading system with actual verified emission reductions, suitable for the South African Carbon Tax System and with a minimized risk of fraud, the following three process steps should be addressed (also depicted in Figure 7):
Step 1: Ensure environmental integrity by utilising existing standard
A large amount of effort has gone into the design of offset systems over the last decade and a half. The proposal made in this report is that the existing infrastructure with respect to offset credits be utilised. This is in line with the Carbon Tax Policy Paper that states that credits from the CDM, VCS and GS could potentially be used.
Step 2: Ensure National Appropriateness by applying tagging rules.
The critical issue in using offsets from existing schemes within the proposed SA carbon tax system is that none of these schemes takes the system-specific requirements of the tax scheme into consideration. It is important that a step be included where the appropriateness of the emission offsets can be tested and verified before the offsets are introduced into the system for use in the SA carbon tax scheme.
Step 3: Ensure economic integrity by utilising existing markets and market infrastructure
The next step is to introduce the offsets as commodities into the existing South African commodity trading system. Here, we recommend that the infrastructure of the existing commodity trading market be utilised.
Additional elements could be added to this basic carbon trading scheme in future development to reduce the costs of participation or expand the market. In addition optimisation over time of each of these three process steps can be expected.
16 | P a g e
Figure 7: Proposed process for including carbon offsets in the South African System
The following sub-sections will address each of the three process steps in more detail.
4.1 ENVIRONMENTAL INTEGRITY
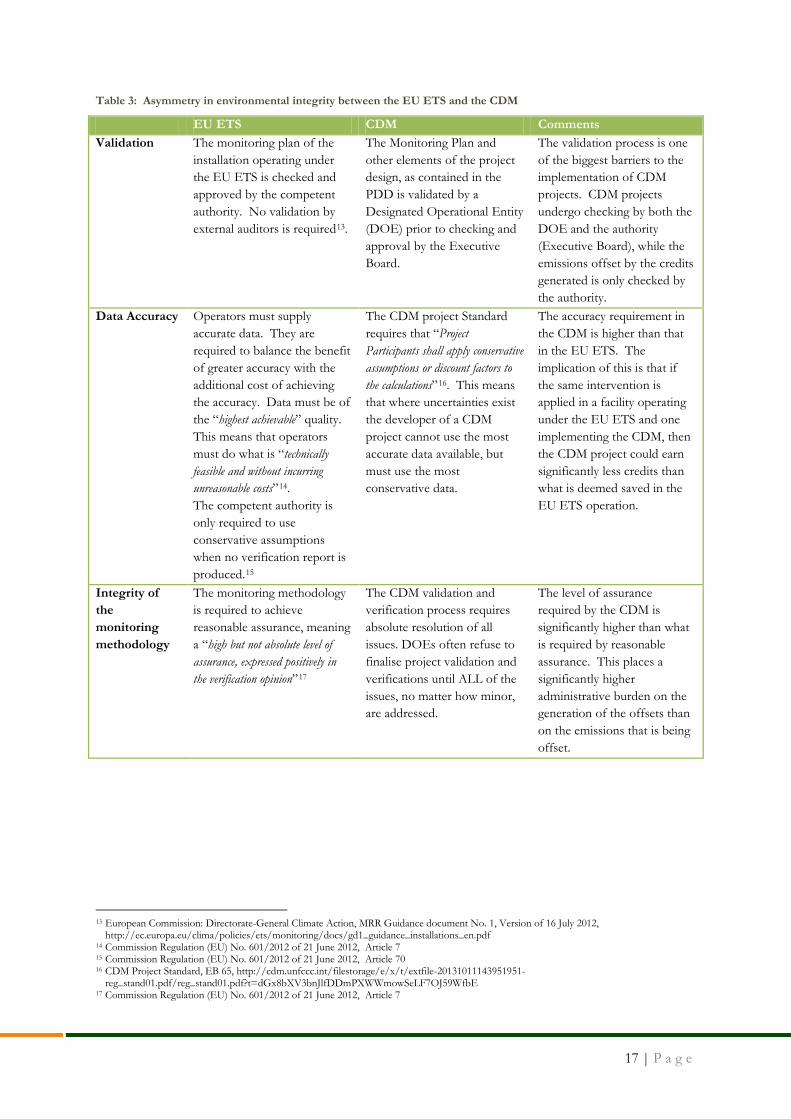
Traditionally, environmental integrity in the context of producing and delivering emission reduction offsets is taken as meaning “delivering real, permanent, additional and verified mitigation outcomes, avoid double counting of effort, and achieve a net decrease and/or avoidance of greenhouse gas emissions”12. There is, however, a challenge in this that has been overlooked in the structure of many of the international schemes. Many schemes place a burden on the environmental integrity requirements of offsets that is significantly higher than the burden placed on the accounting for the emissions that the offsets will be used against. This asymmetry in the validation and verification burden is detrimental to the development of a robust system and can prohibit the development of projects that adhere to the highest standards of environmental integrity.
One example of the above is the asymmetry between the EU ETS and the CDM. This is illustrated in Table 3 below:
12 UNFCCC Decision 2/CP.17
•Validation
•Registration
•Verification
• Issuance
International Registry
(CDM/Markit/APX)
Emission Reduction Project
Environmental Integrity
National Appropriateness
Economic Integrity
•Boundaries
• Eligibility
• Positive list
• Exclusions
South African Registry
(ESC/STRATE/JSE)
RSA
Tagg
ing
Proc
ess
CDM
, VCS
, GS,
etc
• Listing on exchange
• Trading
•Clearing
• Settlement
Offs
et T
radi
ng
Offsets used in carbon tax system
Utilisation of existing standards
Utilisation of existing trading
systems
Verification against tagging rules
17 | P a g e
Table 3: Asymmetry in environmental integrity between the EU ETS and the CDM
EU ETS CDM Comments Validation The monitoring plan of the
installation operating under the EU ETS is checked and approved by the competent authority. No validation by external auditors is required13.
The Monitoring Plan and other elements of the project design, as contained in the PDD is validated by a Designated Operational Entity (DOE) prior to checking and approval by the Executive Board.
The validation process is one of the biggest barriers to the implementation of CDM projects. CDM projects undergo checking by both the DOE and the authority (Executive Board), while the emissions offset by the credits generated is only checked by the authority.
Data Accuracy Operators must supply accurate data. They are required to balance the benefit of greater accuracy with the additional cost of achieving the accuracy. Data must be of the “highest achievable” quality. This means that operators must do what is “technically feasible and without incurring unreasonable costs”14. The competent authority is only required to use conservative assumptions when no verification report is produced.15
The CDM project Standard requires that “Project Participants shall apply conservative assumptions or discount factors to the calculations”16. This means that where uncertainties exist the developer of a CDM project cannot use the most accurate data available, but must use the most conservative data.
The accuracy requirement in the CDM is higher than that in the EU ETS. The implication of this is that if the same intervention is applied in a facility operating under the EU ETS and one implementing the CDM, then the CDM project could earn significantly less credits than what is deemed saved in the EU ETS operation.
Integrity of the monitoring methodology
The monitoring methodology is required to achieve reasonable assurance, meaning a “high but not absolute level of assurance, expressed positively in the verification opinion”17
The CDM validation and verification process requires absolute resolution of all issues. DOEs often refuse to finalise project validation and verifications until ALL of the issues, no matter how minor, are addressed.
The level of assurance required by the CDM is significantly higher than what is required by reasonable assurance. This places a significantly higher administrative burden on the generation of the offsets than on the emissions that is being offset.
13 European Commission: Directorate-General Climate Action, MRR Guidance document No. 1, Version of 16 July 2012,
http://ec.europa.eu/clima/policies/ets/monitoring/docs/gd1_guidance_installations_en.pdf 14 Commission Regulation (EU) No. 601/2012 of 21 June 2012, Article 7 15 Commission Regulation (EU) No. 601/2012 of 21 June 2012, Article 70 16 CDM Project Standard, EB 65, http://cdm.unfccc.int/filestorage/e/x/t/extfile-20131011143951951-
reg_stand01.pdf/reg_stand01.pdf?t=dGx8bXV3bnJlfDDmPXWWmowSeLF7OJ59WfbE 17 Commission Regulation (EU) No. 601/2012 of 21 June 2012, Article 7
18 | P a g e
EU ETS CDM Comments Liability of participants
In the event that the authorities become aware of errors in verification reports, they will inform the verifier, who must then correct the verification report.
In the event that there is excess issuance of credits, the DOE must transfer the equivalent amount of emission reduction units to the account of the Executive Board18. This means that the DOE must buy the credits in the market at his own expense.
The need to check the underlying fundamental of each project and the liability placed on DOE’s in the CDM is the biggest contributor to delays and costs in the CDM validation and verification process.
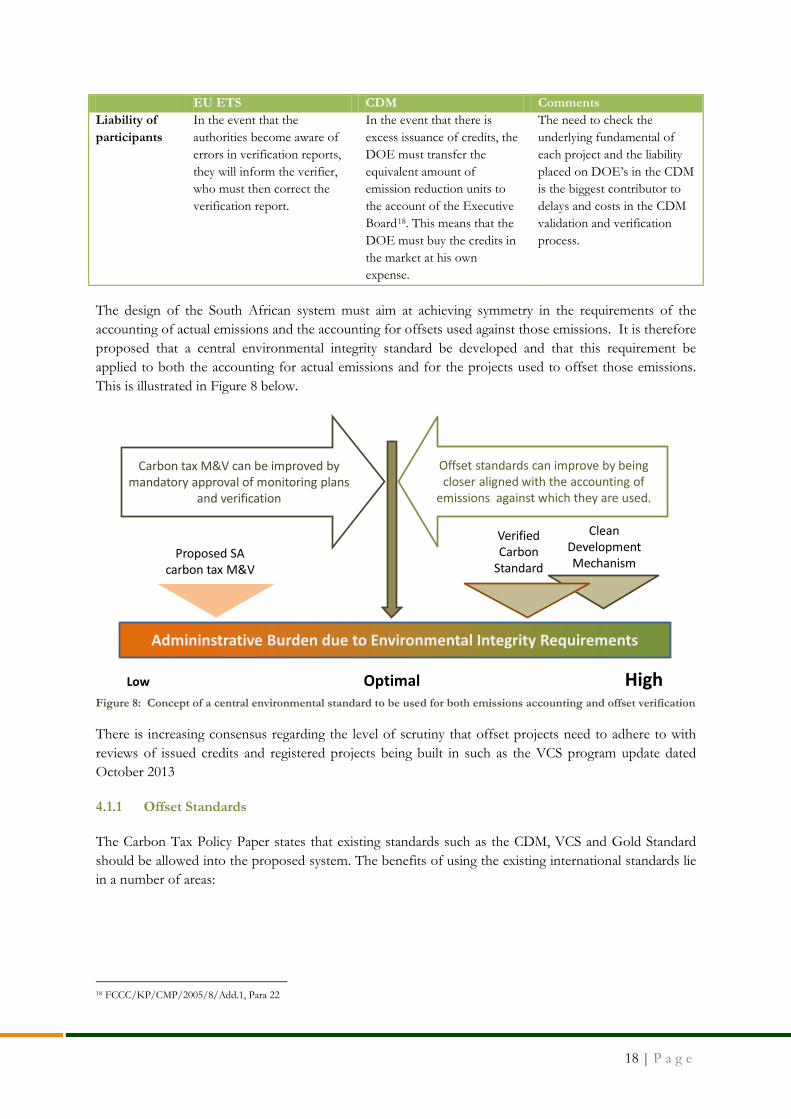
The design of the South African system must aim at achieving symmetry in the requirements of the accounting of actual emissions and the accounting for offsets used against those emissions. It is therefore proposed that a central environmental integrity standard be developed and that this requirement be applied to both the accounting for actual emissions and for the projects used to offset those emissions. This is illustrated in Figure 8 below.
Figure 8: Concept of a central environmental standard to be used for both emissions accounting and offset verification
There is increasing consensus regarding the level of scrutiny that offset projects need to adhere to with reviews of issued credits and registered projects being built in such as the VCS program update dated October 2013
4.1.1 Offset Standards
The Carbon Tax Policy Paper states that existing standards such as the CDM, VCS and Gold Standard should be allowed into the proposed system. The benefits of using the existing international standards lie in a number of areas:
18 FCCC/KP/CMP/2005/8/Add.1, Para 22
Admininstrative Burden due to Environmental Integrity Requirements
Low Optimal High
Proposed SA carbon tax M&V
Clean Development Mechanism
Verified Carbon
Standard
Carbon tax M&V can be improved by mandatory approval of monitoring plans
and verification
Offset standards can improve by being closer aligned with the accounting of
emissions against which they are used.
19 | P a g e
Time to market: One of the biggest advantages in using existing standards is the relatively short time to market that can be achieved with these systems. The introduction of the SA system will not have to be delayed by the design of a custom built standard.
Infrastructure: The existing standards all have well proven methodologies, auditors, registries etc. The use of these standards gives direct access to this infrastructure.
Environmental Integrity: The standards mentioned have all been accepted on an international level as having sufficient environmental integrity. This issue is described in more detail below.
Scope of supply: Regions that have opted to design their own standards (RGGI, California and Australia) have limited scope for the implementation of offset projects based on the slow rate of development of the methodologies.
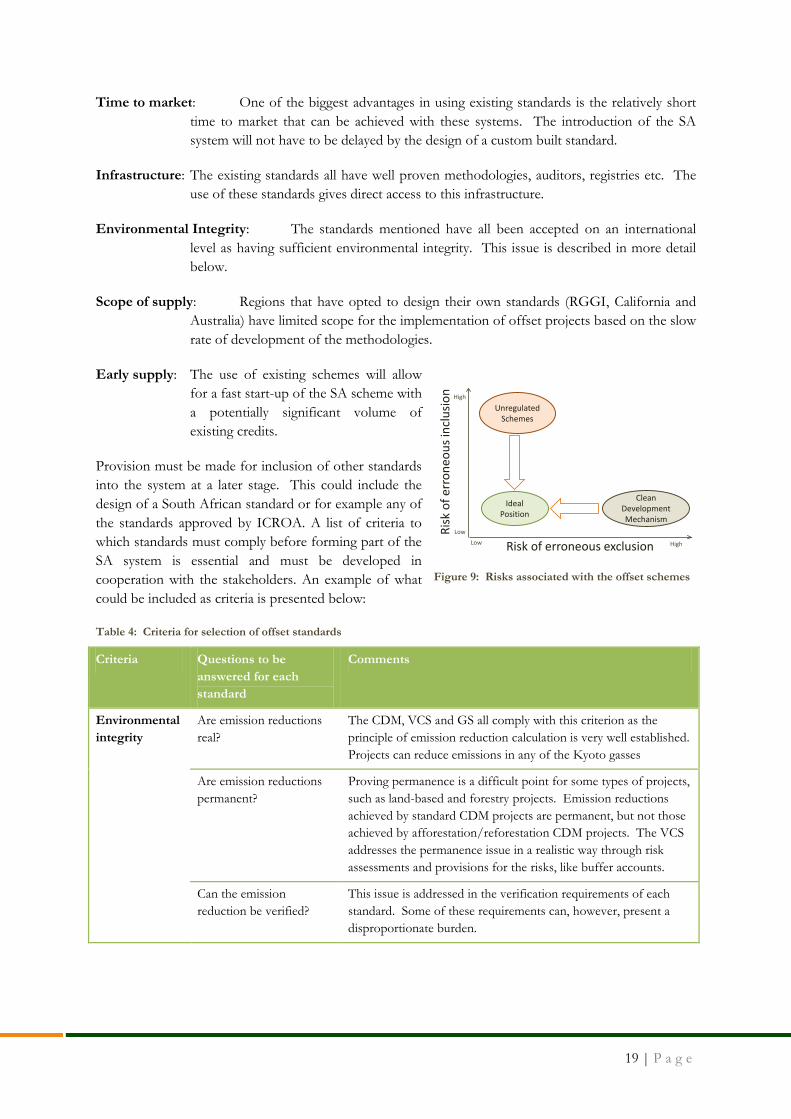
Early supply: The use of existing schemes will allow for a fast start-up of the SA scheme with a potentially significant volume of existing credits.
Provision must be made for inclusion of other standards into the system at a later stage. This could include the design of a South African standard or for example any of the standards approved by ICROA. A list of criteria to which standards must comply before forming part of the SA system is essential and must be developed in cooperation with the stakeholders. An example of what could be included as criteria is presented below:
Table 4: Criteria for selection of offset standards
Criteria Questions to be answered for each standard
Comments
Environmental integrity
Are emission reductions real?
The CDM, VCS and GS all comply with this criterion as the principle of emission reduction calculation is very well established. Projects can reduce emissions in any of the Kyoto gasses
Are emission reductions permanent?
Proving permanence is a difficult point for some types of projects, such as land-based and forestry projects. Emission reductions achieved by standard CDM projects are permanent, but not those achieved by afforestation/reforestation CDM projects. The VCS addresses the permanence issue in a realistic way through risk assessments and provisions for the risks, like buffer accounts.
Can the emission reduction be verified?
This issue is addressed in the verification requirements of each standard. Some of these requirements can, however, present a disproportionate burden.
Risk of erroneous exclusion
Risk
of e
rron
eous
incl
usio
n
Clean Development Mechanism
Unregulated Schemes
Ideal Position
Low High
Low
High
Figure 9: Risks associated with the offset schemes
20 | P a g e
Criteria Questions to be answered for each standard
Comments
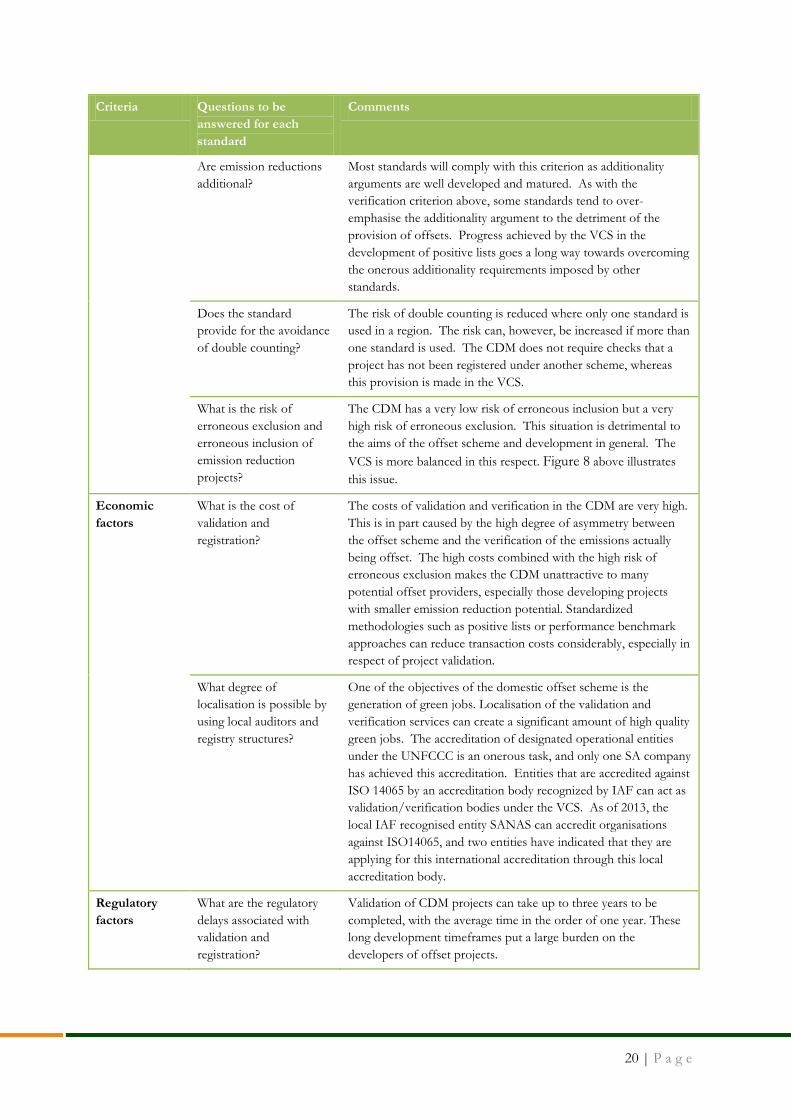
Are emission reductions additional?
Most standards will comply with this criterion as additionality arguments are well developed and matured. As with the verification criterion above, some standards tend to over-emphasise the additionality argument to the detriment of the provision of offsets. Progress achieved by the VCS in the development of positive lists goes a long way towards overcoming the onerous additionality requirements imposed by other standards.
Does the standard provide for the avoidance of double counting?
The risk of double counting is reduced where only one standard is used in a region. The risk can, however, be increased if more than one standard is used. The CDM does not require checks that a project has not been registered under another scheme, whereas this provision is made in the VCS.
What is the risk of erroneous exclusion and erroneous inclusion of emission reduction projects?
The CDM has a very low risk of erroneous inclusion but a very high risk of erroneous exclusion. This situation is detrimental to the aims of the offset scheme and development in general. The VCS is more balanced in this respect. Figure 8 above illustrates this issue.
Economic factors
What is the cost of validation and registration?
The costs of validation and verification in the CDM are very high. This is in part caused by the high degree of asymmetry between the offset scheme and the verification of the emissions actually being offset. The high costs combined with the high risk of erroneous exclusion makes the CDM unattractive to many potential offset providers, especially those developing projects with smaller emission reduction potential. Standardized methodologies such as positive lists or performance benchmark approaches can reduce transaction costs considerably, especially in respect of project validation.
What degree of localisation is possible by using local auditors and registry structures?
One of the objectives of the domestic offset scheme is the generation of green jobs. Localisation of the validation and verification services can create a significant amount of high quality green jobs. The accreditation of designated operational entities under the UNFCCC is an onerous task, and only one SA company has achieved this accreditation. Entities that are accredited against ISO 14065 by an accreditation body recognized by IAF can act as validation/verification bodies under the VCS. As of 2013, the local IAF recognised entity SANAS can accredit organisations against ISO14065, and two entities have indicated that they are applying for this international accreditation through this local accreditation body.
Regulatory factors
What are the regulatory delays associated with validation and registration?
Validation of CDM projects can take up to three years to be completed, with the average time in the order of one year. These long development timeframes put a large burden on the developers of offset projects.
21 | P a g e
4.2 NATIONAL APPROPRIATENESS
Traditionally the emphasis in the design of carbon trading schemes lies on how to ensure the economic and environmental integrity of the system. In these two areas, sufficient infrastructure is available that can be utilised in the design of a South African system.
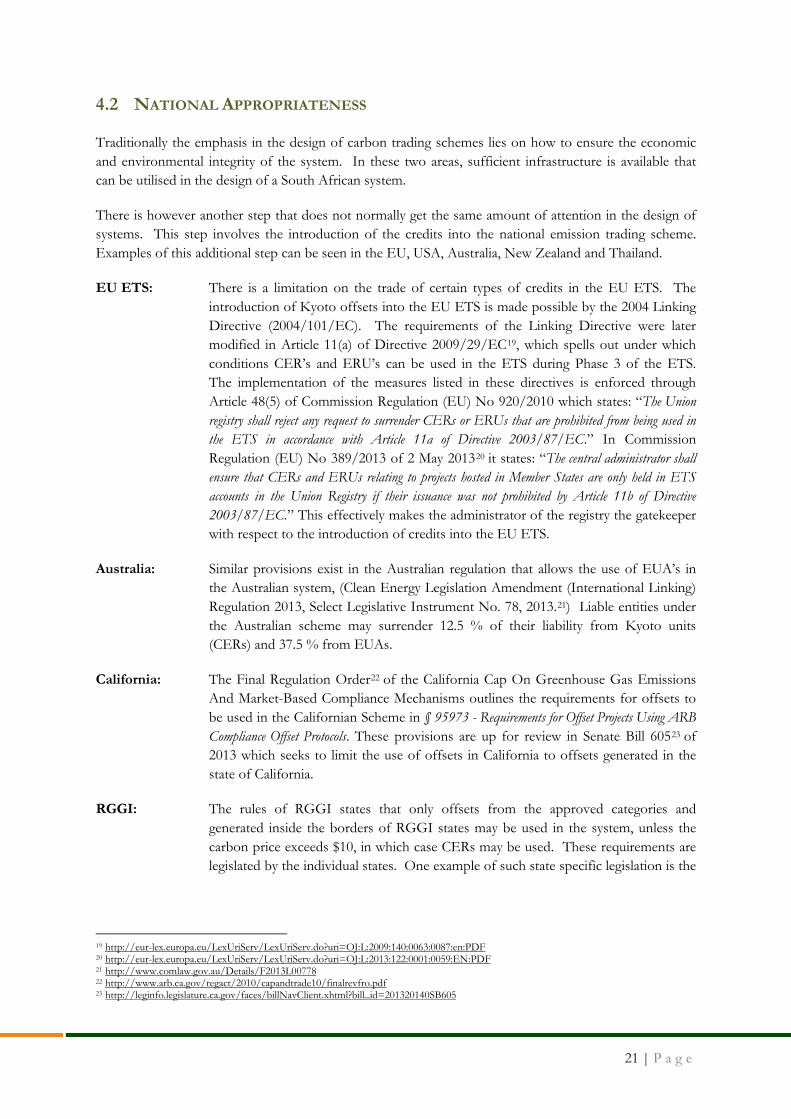
There is however another step that does not normally get the same amount of attention in the design of systems. This step involves the introduction of the credits into the national emission trading scheme. Examples of this additional step can be seen in the EU, USA, Australia, New Zealand and Thailand.
EU ETS: There is a limitation on the trade of certain types of credits in the EU ETS. The introduction of Kyoto offsets into the EU ETS is made possible by the 2004 Linking Directive (2004/101/EC). The requirements of the Linking Directive were later modified in Article 11(a) of Directive 2009/29/EC19, which spells out under which conditions CER’s and ERU’s can be used in the ETS during Phase 3 of the ETS. The implementation of the measures listed in these directives is enforced through Article 48(5) of Commission Regulation (EU) No 920/2010 which states: “The Union registry shall reject any request to surrender CERs or ERUs that are prohibited from being used in the ETS in accordance with Article 11a of Directive 2003/87/EC.” In Commission Regulation (EU) No 389/2013 of 2 May 201320 it states: “The central administrator shall ensure that CERs and ERUs relating to projects hosted in Member States are only held in ETS accounts in the Union Registry if their issuance was not prohibited by Article 11b of Directive 2003/87/EC.” This effectively makes the administrator of the registry the gatekeeper with respect to the introduction of credits into the EU ETS.
Australia: Similar provisions exist in the Australian regulation that allows the use of EUA’s in the Australian system, (Clean Energy Legislation Amendment (International Linking) Regulation 2013, Select Legislative Instrument No. 78, 2013.21) Liable entities under the Australian scheme may surrender 12.5 % of their liability from Kyoto units (CERs) and 37.5 % from EUAs.
California: The Final Regulation Order22 of the California Cap On Greenhouse Gas Emissions And Market-Based Compliance Mechanisms outlines the requirements for offsets to be used in the Californian Scheme in § 95973 - Requirements for Offset Projects Using ARB Compliance Offset Protocols. These provisions are up for review in Senate Bill 60523 of 2013 which seeks to limit the use of offsets in California to offsets generated in the state of California.
RGGI: The rules of RGGI states that only offsets from the approved categories and generated inside the borders of RGGI states may be used in the system, unless the carbon price exceeds $10, in which case CERs may be used. These requirements are legislated by the individual states. One example of such state specific legislation is the
19 http://eur-lex.europa.eu/LexUriServ/LexUriServ.do?uri=OJ:L:2009:140:0063:0087:en:PDF 20 http://eur-lex.europa.eu/LexUriServ/LexUriServ.do?uri=OJ:L:2013:122:0001:0059:EN:PDF 21 http://www.comlaw.gov.au/Details/F2013L00778 22 http://www.arb.ca.gov/regact/2010/capandtrade10/finalrevfro.pdf 23 http://leginfo.legislature.ca.gov/faces/billNavClient.xhtml?bill_id=201320140SB605
22 | P a g e
Connecticut regulations for abatement of air pollution, Section 22a-174-31a - Greenhouse Gas Emission Offset Projects24.
New Zealand: The NZ ETS allows for the unlimited use of international credits in the NZ ETS in Article 19 of the Climate Change Response (Emissions Trading) Amendment Act 200825.
Thailand: The Crown Standard provides a tag to Thai CDM or VCS projects that meet specific criteria of sustainable development. This is done according to a Thai scoring system evaluating environmental aspects, stakeholder consultation in the form of public participation process (not just to inform the public), and social aspects such as supporting social activities, culture and self-sufficient economy or improving the health and sanitation of workers and nearby communities. The project developer must furthermore demonstrate that it either shares the benefit from carbon credit income with local communities, or that the project contributes to Corporate Social Responsibility.
The provisions that regulate what credits can be introduced into a national emission trading scheme is best described as “National Appropriateness” measures.
Infrastructure to assess the National Appropriateness of carbon credits is the only part of the offset trading system that needs to be built in South Africa. This will require the following aspects to be addressed:
• The rules for establishing the National Appropriateness, also called the RSA-Tagging Rules, need to be formulated. This must be the outcome of a process in which all stakeholders are involved, but we list a number of suggestions below.
• The custodianship of the rules for National Appropriateness needs to be established. A custodian committee made up of both government and private sector representatives is suggested.
4.2.1 RSA Tagging Rules
The list below offers some suggestions with respect to RSA-Tagging rules as a starting point for discussions:
Location Projects must be located inside the boundaries of South Africa. Consideration to expanding this can be given at a later stage to, for example, countries connected to the Southern African Power Pool, the Southern African Development Community, or African countries in general.
Host Country Approval: Every project, whether CDM or VCS, should obtain Host Country Approval from the DNA.
Gasses Any project that reduces emissions from any of the Kyoto gasses can be included. Note that the restriction in the use of projects that reduce certain of the industrial gasses into the European Union is based on reports of gaming in the implementation
24 http://www.ct.gov/deep/lib/deep/air/regulations/mainregs/22a-174-31a.pdf 25 http://www.legislation.govt.nz/act/public/2008/0085/latest/DLM1130932.html
23 | P a g e
of certain HFC projects in China. Such restriction would not be relevant to South Africa as there are no HFC plants in SA and only SA projects will be eligible.
Forestry credits Afforestation or reforestation projects registered under the CDM are recommended to be excluded from carbon offset trading, as lCERs and tCERs do not address permanence issues. Projects utilizing VCS methodologies (which address permanence through risk assessments and buffer accounts on a program level) should be eligible for carbon offset trading. These permanence requirements are applied across the entire program and do not vary methodology by methodology thereby reducing uncertainty and costs for project developers
Though currently no such methodology or standard exist, it is recommended that credits generated under a ton-year accounting method26,27 for biologically sequestered carbon be included in the system. This approach shifts risk related to the permanence of forestry credits from the issuance phase to the financing phase.
Position in tax net: Projects implemented in industries that fall outside the tax net as defined in the Carbon Tax Policy Paper will qualify as offset projects.
Registration Date: Projects registered prior to the date of introduction should be eligible irrespective of the other tagging rules. The motivation for this lies in two areas. The first is that these projects will supply the initial volume into the market that is required to give liquidity to the trading system. Secondly, any CER or VCU that is eligible to be used as an offset elsewhere in the world and which was generated from a project registered when there was no carbon pricing mechanism implemented in SA, should be eligible to be used in SA as well.
Additionality: Projects registered under the CDM and for which the E-policy argument was used in the additionality should prove that the project will still be additional if the E-policy argument is not used.
Type E-policies: National and/or sectoral policies or regulations that give comparative advantages to less emissions-intensive technologies over more emissions-intensive technologies (e.g. subsidies to promote the diffusion of renewable energy) (EB 22, Annex 3, paragraph 6). Policies or regulations classified as an E- policy can be excluded from the baseline scenario and additionality analysis. A reason for this is that governments should be encouraged to create such incentives without being restrained in their access to the international carbon credit market.
The South African Demand Side Management and REIPPP incentives are classified as E- policies and therefore don’t form part of the financial additionality arguments of projects applying for registration with the CDM or VCS.
Though policy incentives should be excluded from CDM or VCS additionality analysis to prevent discouraging governments to support emission reduction projects, it is recommended that for additional South African benefits (i.e. to be classified as an offset project); all national incentives should be included in the financial additionality of a project.
26 McLaren & Ford-Robertson, Carbon accounting methodologies, Forest Research, Private Bag 3020, Rotorua, New Zealand. 27 IPCC Special Report on Land Use, Land-Use Change, and Forestry, 2000
24 | P a g e
This rule will prevent projects to obtain multiple benefits from the South African Government without needing it to overcome the barriers to implementation. By imposing this rule, it is believed that funds can be preserved and therefore more projects will be allowed to obtain financial support.
Projects registered under the CDM or VCS which used barrier analysis to prove additionality will be automatically allowed as offsets.
Positive List: Both the CDM and VCS allow for positive lists which identify project types that have been deemed to be additional through a series of analysis. Projects on the positive list are automatically additional.
In the supply and demand section, the impact of supply of a positive list is assessed. The proposed positive list includes all projects in the residential sector, as well as projects developed under the RE IPP Programme up to a penetration rate of 5% for each technology.
4.2.2 Custodianship of RSA Tagging Rules
If a project is successfully registered under a recognized offset standard and complies with the RSA Tagging rules, it should be issued an RSA Tag and allowed to be traded as an offset under the South African Carbon Tax system.
It is suggested that custodianship of the RSA Tagging Rules sits with a committee chaired by the Designated National Authority (DNA) of South Africa. Other members of the committee should include representatives from National Treasury, Department of Environmental Affairs, Department of Energy, Department of Trade and Industry, Industry (i.e. BUSA), civil society and Labour. The committee will deal with requests to updating and changing tagging rules, interpretation questions or objections.
The current mandate of the DNA (as per the regulations under Section 25(3) of the National Environmental Management Act, 1998: Establishment of a Designated National Authority for the CDM (December, 2004)) are only related to supporting CDM projects within South Africa and will therefore have to be modified to support the South African offset trading scheme
Compliance with RSA Tagging rules should be assessed by an auditor accredited against ISO14065.
Once compliance with tagging rules is established, credits are issued into the account of the offset provider in the RSA registry against delivery of the Tagging Audit report and cancelation certificate from the registry of origin.
4.3 ECONOMIC INTEGRITY
Economic integrity is related to the offset trading component of the carbon offset trading scheme. By using existing trading infrastructure, carbon trading can take place with minimum additional costs and risks related to new infrastructure.
4.3.1 Trading System
The trading system required for a carbon trading scheme has to provide the platform on which the trading can take place. The most important functions of the trading system are:
25 | P a g e
• Price discovery: The trading platform must provide the means for buyers and sellers to communicate with each other in a transparent way. The main items of information that needs to be communicated are the volume and price of credits offered by sellers, the volume and price of offers made by buyers and the volume and price of transactions concluded.
• Clearing and Settlement: The trading platform must provide a secure way of ensuring proper clearing, where the credit is transferred from the seller to the buyer, and settlement, where the money is paid by the buyer to the seller for the transaction.
Promethium Carbon had a number of meetings with the JSE and are of the opinion that the JSE can offer the services required in a practical and cost effective way.
4.3.2 Registry
The registry is the electronic database in which a carbon credit is stored. No carbon credit can exist outside of a registry, and a credit can only exist in one account at a time. The full life cycle of the carbon credit trading occurs inside the registry. This includes its issuance, trading and retirement.
The purpose of the registry is to keep an accurate record of the credits and ownership of the credits in the system. A registry records the holdings of credits, and any transactions involving those credits, through a structure of accounts. This is similar to the way that banks record balances and movements in money using accounts allocated to individuals or other entities. Process steps that are being addressed in a registry include issuance (bringing new credits into the registry), trade (transfer of credits from one owner to another) and cancelation (when a credit ceases to be valid to be used as offset). Other functions include the mechanism of transfer of credits between registries.
In general, registries need to:
i. Ensure administrative efficiency; ii. Provide access in the required way, such as via the internet; iii. Keep transaction costs low; iv. Ensure timeous execution of transfers; v. Ensure very low risk of fraud; and vi. Provide adequate administrative support.
The transfer of credits from one registry to the next requires special processes. An example of a transfer of credits process is the transfer of Australian-Issued International Units (AIIUs) to the EU’s Union Registry. The process is as follows1:
i. check the validity of the transfer request ii. send information to the European Union Transaction Log (EUTL) about the number of AIIUs
to be cancelled and the account in the Union Registry into which the corresponding number of EUAs must be issued
iii. if the transfer is validated by EUTL, then cancel the AIIUs in the Registry by removing the transferred amount from the account in which it was held
iv. advise the EUTL that the units have been cancelled v. arrange for an equivalent number of EUAs units to be transferred from the Commonwealth
foreign registry account in the Union Registry to the nominated account in the Union Registry
26 | P a g e
As the registry forms a central part of the trading system, it is important that its design and functioning is aligned with both the domestic SA market and the international registries from which credits will be introduced into the SA system, and to which credits may eventually be transferred if international linking is established in the future.
The carbon registries in the international arena include:
CDM Registry28: The CDM registry is defined in the decisions of the UNFCCC Conferences of Parties. It forms the basis on which many registries are based as all registries that accept CERs must link to the CDM registry.
Union registry: The Union Registry is the registry of the EU and has been in operation since 20 August 2012. It was created by consolidating all the individual country registries in the EU.
The Australian National Registry of Emissions Units: is the registry of the Australian trading system.
APX: APX is an infrastructure provider for environmental markets in greenhouse gases including carbon commodities. These commodities include emissions allowances and carbon offsets. APX has provided carbon trading registries for the ‘Climate Action Reserve’, ‘American Carbon Registry’ and the ‘Verified Carbon Standard’.
Promethium Carbon discussed the registry infrastructure requirements of South African carbon trade with APX Environmental Markets. APX indicated that using its existing systems would put APX in a position to provide a competitive rate for the development of a registry for South African offset trading. In terms of timing, APX indicated that it could operationalise a registry system within South Africa in about 2-3 weeks from the point in time that all government requirements are formalised.
Markit: The Markit Registry provides a tool for managing global carbon, water and biodiversity credits. Amongst others, Markit has established registries for the ‘UK Woodland Carbon Code’, ‘Gold Standard’ and the ‘Verified Carbon Standard’.
Promethium Carbon had a discussion regarding registry infrastructure requirements to allow for carbon offset trading within South Africa with Markit. Markit indicated that they are in a position to offer a cost effective solution to South Africa to host a carbon registry, should it be required. Such a registry could be “white labelled” and operated from South Africa. They highlighted the fact that a number of South African companies and financial institutions already have carbon accounts at Markit and are trading credits through the Markit registry.
Within South Africa, the following registries are used by the Johannesburg Stock Exchange:
Strate: South Africa’s Central Securities Depository, trading under the name Strate, provides electronic settlement for securities and tracker funds for the Johannesburg Stock Exchange (JSE).
28 UNFCCC 3/CMP.1, Annex, Appendix D
27 | P a g e
Promethium Carbon had discussions with Strate about the possibility of housing a carbon registry on the Strate platform. Whereas it will be technically possible, such a move will have some challenges due to regulatory uncertainty. Firstly the credits will have to be classified as a financial instrument (while the current recommendation is for the carbon credits to be treated as a commodity) and be subject to all the regulatory aspects associated with financial instruments, and secondly it will be much more costly than to trade carbon through registries where it can be treated as a commodity.
ESC Electronic Silo Certificates (ESC) is the registry through which commodities such as maize is traded on the JSE. The ESC register is administered by the Exordia Division of PricewaterhouseCoopers, independently of any industry player. The system is capable of taking on carbon as another commodity and trading can be done with minimal setup time required.
The cost of trading through the ESC is in the order of R1 per ton of maize for issuance and R2 per ton to trade. This price rage is compared to international carbon related admin costs very low and will support the development of medium sized projects, which are traditionally not viable under the CDM and VCS.
4.3.2.1 Criteria for Registries
During the analysis of the registries available to house carbon credits for trade in South Africa, we found that the registries interviewed (Strate, ESC, Markit and APX) can all accommodate South African credits with minimal additional effort. There are however differences in the registries that relate to their structure and regulatory frameworks, and these differences will translate into operational impacts on issues such as accessibility and costs.
Whereas we believe that a carbon trading system should not be built on allowing a single registry to establish a monopoly, there needs to be a set of minimum standards that will allow a registry to operate in the system. This set of standards will have to be established when the carbon trading system is set up, but a starting point could include the following aspects:
Quality and Validity: The registry must have the systems in place to ensure that credits are only listed when a valid claim for a credit exists.
Security: A registry needs to be secure in ensuring that:
• Ownership of credits are secure and credits cannot be transferred in a fraudulent manner;
• There must be mechanisms in place to ensure that fraud is detected in the unlikely event that it does occur;
• Procedures should be in place to ensure the correct actions are taken in the event that fraud is discovered and that trading is not affected by such events.
Administration: The registry must be able to prove that it has the required governance and administration in place.
Accessibility: The registry must be accessible to account holders and market participants.
28 | P a g e
Technical capacity: The registry must be able to prove that it has the technical capability to manage the functions of the registry in a efficient and professional way.
4.4 LONGER TERM DEVELOPMENT
4.4.1 South African Standard
The Carbon Tax Policy Paper makes mention of the potential to develop a South African standard. Such a move can have both positive and negative aspects to it.
On the positive side the development of such a standard can reduce costs by eliminating the need to go through the National Appropriateness step as described above. On the negative side such a move will counter the international movement to create a global carbon market.
The decision whether or not to develop a South African standard should be taken after carefully weighing up the pro’s and con’s of such a system.
4.4.2 Costs
One of the most important aspects of the design of an offset trading scheme lies in the costs to bring an offset credit to the market. The costs of schemes like the CDM has traditionally been high and adding additional steps such as the National Appropriateness to the process will add to these costs. There are however a number of issues that can mitigate the costs of bringing credits to the market. Some examples of such actions are:
• The CDM makes provision for the creation of standardised baselines. This is a development that can significantly reduce the cost of registering a CDM project. The CDM procedures require the DNA of a country to submit requests for the approval of standardised baselines to eth Executive Board of the CDM. Should the DNA of South Africa become actively involved in the development of standardised baselines for the country, it can significantly reduce the cost of CDM registration. The benefits to CDM projects will transfer automatically to VCS projects as the VCS allow projects to use CDM methodologies.
• The development of a local auditing industry will allow for reductions in costs associated with eth auditing of carbon credit projects. This can be achieved through the promotion of accreditation of local auditors under ISO14065. Once sufficient local auditors are available, the costs of carbon project registration will come down.
29 | P a g e
5 FUNCTIONING OF THE MARKET
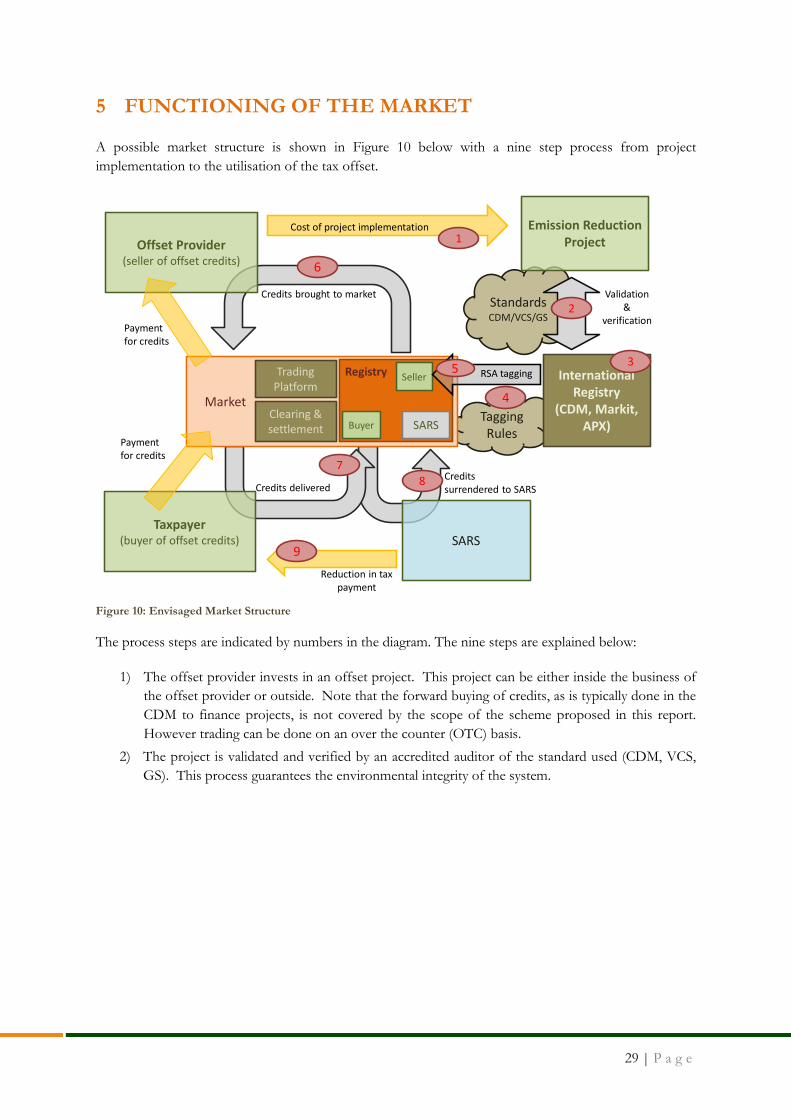
A possible market structure is shown in Figure 10 below with a nine step process from project implementation to the utilisation of the tax offset.
Figure 10: Envisaged Market Structure
The process steps are indicated by numbers in the diagram. The nine steps are explained below:
1) The offset provider invests in an offset project. This project can be either inside the business of the offset provider or outside. Note that the forward buying of credits, as is typically done in the CDM to finance projects, is not covered by the scope of the scheme proposed in this report. However trading can be done on an over the counter (OTC) basis.
2) The project is validated and verified by an accredited auditor of the standard used (CDM, VCS, GS). This process guarantees the environmental integrity of the system.
Tagging Rules
Taxpayer(buyer of offset credits)
Trading Platform
Clearing & settlement
Market
Payment for credits
Credits brought to market
Credits delivered
Payment for credits
Reduction in tax payment
Credits surrendered to SARS
StandardsCDM/VCS/GS
SARS
Offset Provider(seller of offset credits)
International Registry
(CDM, Markit, APX)
Emission Reduction Project
Cost of project implementation
Validation &
verification
1
2
3
4
7
Seller
Buyer
8
9
6
RSA tagging5
SARS
Registry
30 | P a g e
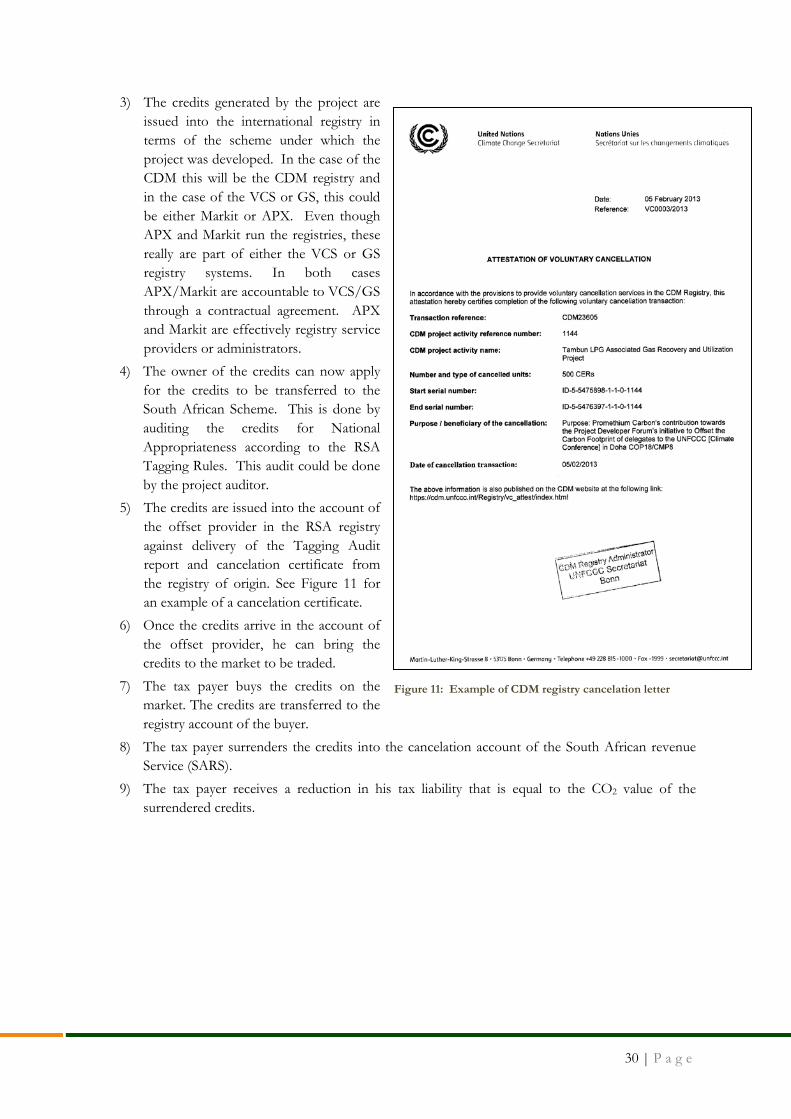
3) The credits generated by the project are issued into the international registry in terms of the scheme under which the project was developed. In the case of the CDM this will be the CDM registry and in the case of the VCS or GS, this could be either Markit or APX. Even though APX and Markit run the registries, these really are part of either the VCS or GS registry systems. In both cases APX/Markit are accountable to VCS/GS through a contractual agreement. APX and Markit are effectively registry service providers or administrators.
4) The owner of the credits can now apply for the credits to be transferred to the South African Scheme. This is done by auditing the credits for National Appropriateness according to the RSA Tagging Rules. This audit could be done by the project auditor.
5) The credits are issued into the account of the offset provider in the RSA registry against delivery of the Tagging Audit report and cancelation certificate from the registry of origin. See Figure 11 for an example of a cancelation certificate.
6) Once the credits arrive in the account of the offset provider, he can bring the credits to the market to be traded.
7) The tax payer buys the credits on the market. The credits are transferred to the registry account of the buyer.
8) The tax payer surrenders the credits into the cancelation account of the South African revenue Service (SARS).
9) The tax payer receives a reduction in his tax liability that is equal to the CO2 value of the surrendered credits.
Figure 11: Example of CDM registry cancelation letter
31 | P a g e
5.1 ROLES OF PROJECT PARTICIPANTS
The following project participants and their subsequent roles can be distinguished:
• Offset provider: the offset provider implements a project from which the carbon offsets will be generated for use either internally or sold on the market;
• Accredited auditor: an accredited auditor is required during the project validation phase in order to ensure environmental integrity of the carbon offset. Each standard prescribes the competencies required of the validators and verifiers. Currently this competency is either confirmed by the UNFCCC or under the ISO14065 standard. The ISO14065 accreditation can be obtained internationally but since 2013 also locally through SANAS. SANAS is the South African Accreditation services under the Department of Trade and Industry. Local accreditation could bring the cost of auditing down while creating jobs and building capacity in the green economy.
• Designated National Authority (DNA): it is proposed in this report to make the DNA the chair of the custodian committee of the SA tagging rules. Furthermore, the DNA must give Host Country Approval to every offset project. In the case of CDM projects such approval is granted before project registration. For standards such as the VCS where host country approval is not granted before project registration, such approval must be given by the DNA prior to the credits being listed on the RSA registry. It is further recommended that the DNA gets actively involved in the development of standardised baselines, as provided for in the rules of the CDM, so-as to help reducing the cost of carbon offset project registration.
• Tax payer: once the offset provider has brought its offsets to the market, the tax payer can purchase these offsets and surrender them into the cancellation account of SARS.
• South African Revenue Service (SARS): upon receiving the offset credits from the tax payer, SARS deduct these offsets from the total carbon tax liability of the tax payer. Note that the proposed system does not require any carbon offset knowledge or actions from SARS. The Tagging Rules Custodian Committee and the accredited auditors guard over the introduction of credits into the system. Cancelation of the used credits happens automatically when credits are transferred to the SARS account in the registry by virtue of the fact that the account will be set up as a cancelation account. SARS simply has to allow for a relief of the carbon tax equivalent to the amount of credits transferred into the account by a specific tax payer.
32 | P a g e
6 SUPPLY AND DEMAND
Any estimate of the potential market size for offsets in a potential trading scheme will always be theoretical in nature. Due to the limited scope of this research project no original research could be conducted on the potential supply and demand volumes in the South African Market. This work therefore focusses on the latest publically available information. These include the Department of Environmental Affairs’ Greenhouse Gas (GHG) Mitigation Potential Analysis study and data from the latest Integrated Energy Plan obtained from the Department of Energy.
6.1 DEMAND FOR SA CARBON OFFSET TRADING SCHEME
The demand for credits is determined by the provision in the carbon tax policy paper that limits the use of offsets to a percentage of the tax liability of a company. The analysis of the potential demand therefore focusses on estimating the taxable emissions falling in each of the identified sectors.
This analysis is prepared on the basis of the latest available data. Energy demand projections were obtained from the Department of Energy29, which is the same data as used for the Integrated Energy Plan for South Africa. By using IPCC emission factors, total emissions, excluding process emissions, were calculated. Process emissions were obtained from the report ‘South Africa’s Greenhouse Gas (GHG) Mitigation Potential Analysis’ prepared by Camco Clean Energy, for the Department of Environmental Affairs (2013).
The demand for credits will depend on the total emission projections. This was estimated by making certain assumptions about what portion of each industry will be covered by the tax net. These assumptions were made to project low end demand, as well as high end demand and are presented in Table 5 below.
29 Personal communication with Rebecca Maserumule and Philip Goyns, 16-01-201
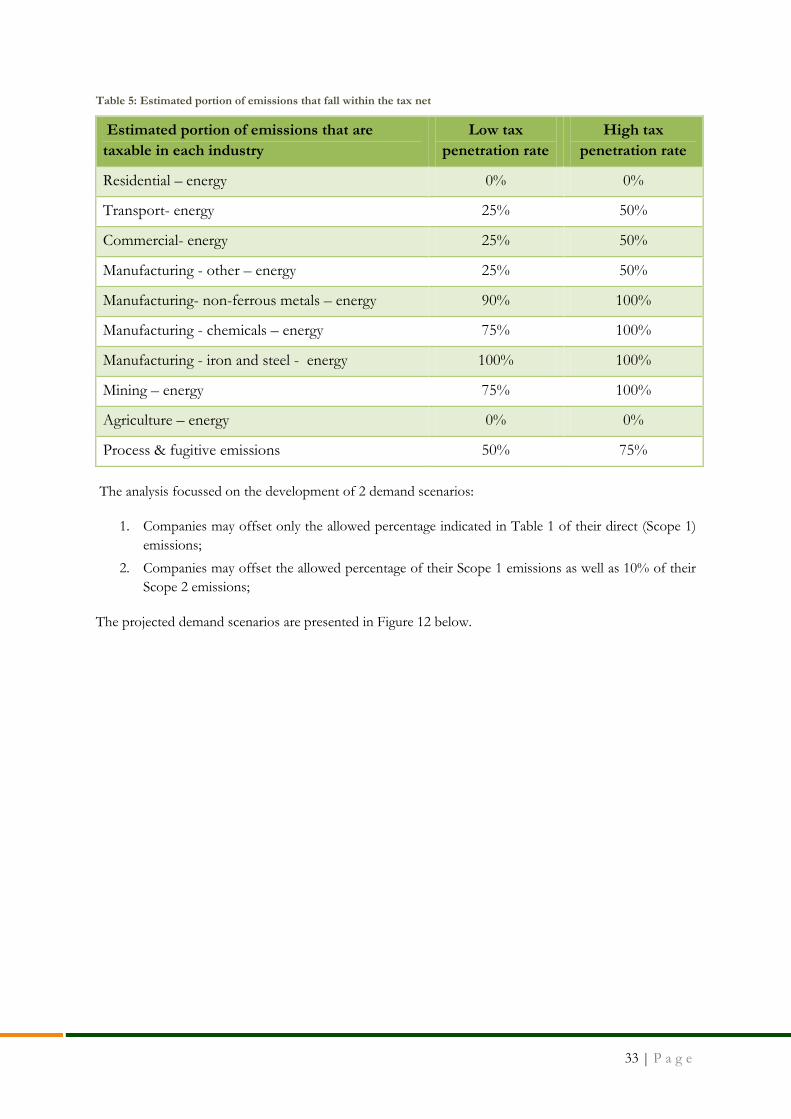
33 | P a g e
Table 5: Estimated portion of emissions that fall within the tax net
Estimated portion of emissions that are taxable in each industry
Low tax penetration rate
High tax penetration rate
Residential – energy 0% 0%
Transport- energy 25% 50%
Commercial- energy 25% 50%
Manufacturing - other – energy 25% 50%
Manufacturing- non-ferrous metals – energy 90% 100%
Manufacturing - chemicals – energy 75% 100%
Manufacturing - iron and steel - energy 100% 100%
Mining – energy 75% 100%
Agriculture – energy 0% 0%
Process & fugitive emissions 50% 75%
The analysis focussed on the development of 2 demand scenarios:
1. Companies may offset only the allowed percentage indicated in Table 1 of their direct (Scope 1) emissions;
2. Companies may offset the allowed percentage of their Scope 1 emissions as well as 10% of their Scope 2 emissions;
The projected demand scenarios are presented in Figure 12 below.
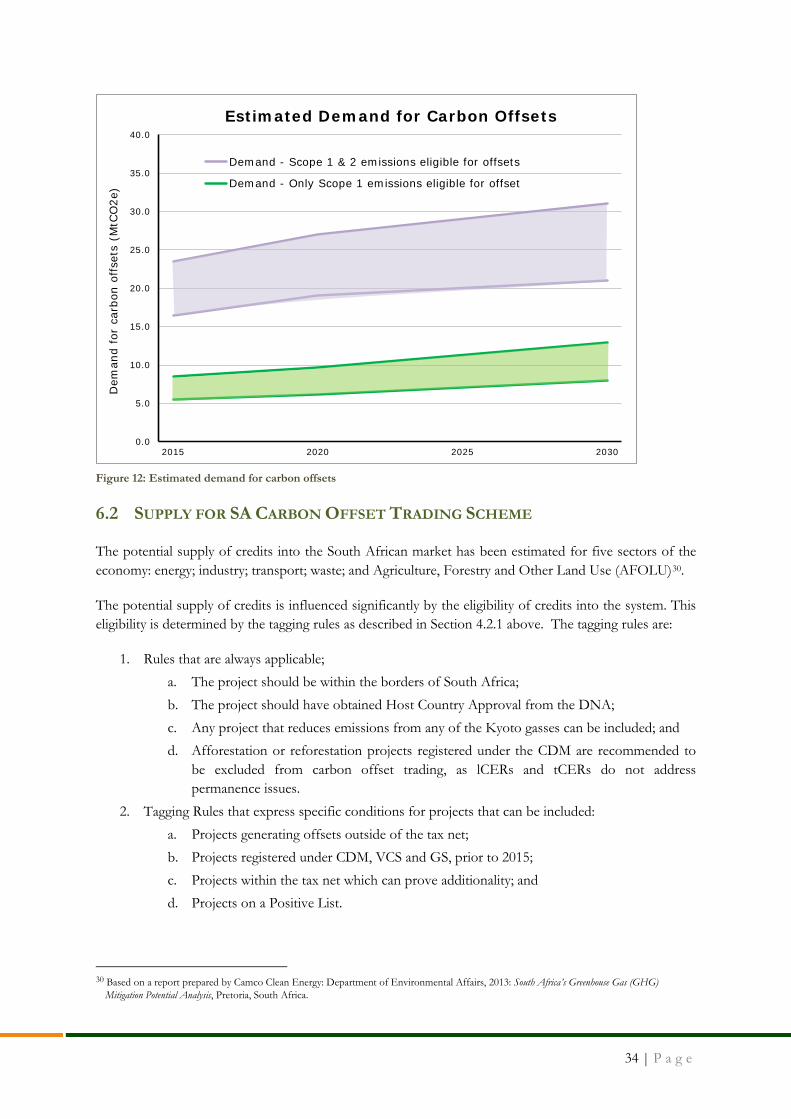
34 | P a g e
Figure 12: Estimated demand for carbon offsets
6.2 SUPPLY FOR SA CARBON OFFSET TRADING SCHEME
The potential supply of credits into the South African market has been estimated for five sectors of the economy: energy; industry; transport; waste; and Agriculture, Forestry and Other Land Use (AFOLU)30.
The potential supply of credits is influenced significantly by the eligibility of credits into the system. This eligibility is determined by the tagging rules as described in Section 4.2.1 above. The tagging rules are:
1. Rules that are always applicable; a. The project should be within the borders of South Africa; b. The project should have obtained Host Country Approval from the DNA; c. Any project that reduces emissions from any of the Kyoto gasses can be included; and d. Afforestation or reforestation projects registered under the CDM are recommended to
be excluded from carbon offset trading, as lCERs and tCERs do not address permanence issues.
2. Tagging Rules that express specific conditions for projects that can be included: a. Projects generating offsets outside of the tax net; b. Projects registered under CDM, VCS and GS, prior to 2015; c. Projects within the tax net which can prove additionality; and d. Projects on a Positive List.
30 Based on a report prepared by Camco Clean Energy: Department of Environmental Affairs, 2013: South Africa’s Greenhouse Gas (GHG)
Mitigation Potential Analysis, Pretoria, South Africa.
0.0
5.0
10.0
15.0
20.0
25.0
30.0
35.0
40.0
2015 2020 2025 2030
Dem
and
for
carb
on o
ffse
ts (
MtC
O2e
)Estimated Demand for Carbon Offsets
Demand - Scope 1 & 2 emissions eligible for offsets
Demand - Only Scope 1 emissions eligible for offset
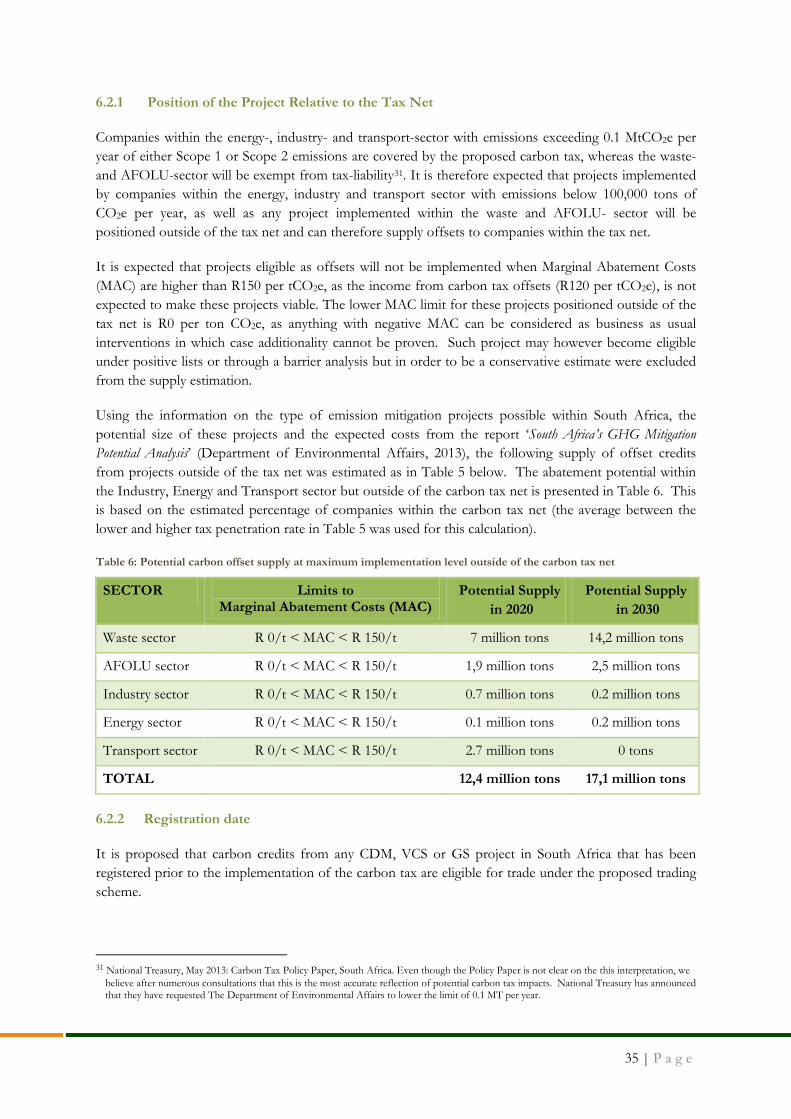
35 | P a g e
6.2.1 Position of the Project Relative to the Tax Net
Companies within the energy-, industry- and transport-sector with emissions exceeding 0.1 MtCO2e per year of either Scope 1 or Scope 2 emissions are covered by the proposed carbon tax, whereas the waste- and AFOLU-sector will be exempt from tax-liability31. It is therefore expected that projects implemented by companies within the energy, industry and transport sector with emissions below 100,000 tons of CO2e per year, as well as any project implemented within the waste and AFOLU- sector will be positioned outside of the tax net and can therefore supply offsets to companies within the tax net.
It is expected that projects eligible as offsets will not be implemented when Marginal Abatement Costs (MAC) are higher than R150 per tCO2e, as the income from carbon tax offsets (R120 per tCO2e), is not expected to make these projects viable. The lower MAC limit for these projects positioned outside of the tax net is R0 per ton CO2e, as anything with negative MAC can be considered as business as usual interventions in which case additionality cannot be proven. Such project may however become eligible under positive lists or through a barrier analysis but in order to be a conservative estimate were excluded from the supply estimation.
Using the information on the type of emission mitigation projects possible within South Africa, the potential size of these projects and the expected costs from the report ‘South Africa’s GHG Mitigation Potential Analysis’ (Department of Environmental Affairs, 2013), the following supply of offset credits from projects outside of the tax net was estimated as in Table 5 below. The abatement potential within the Industry, Energy and Transport sector but outside of the carbon tax net is presented in Table 6. This is based on the estimated percentage of companies within the carbon tax net (the average between the lower and higher tax penetration rate in Table 5 was used for this calculation).
Table 6: Potential carbon offset supply at maximum implementation level outside of the carbon tax net
SECTOR Limits to Marginal Abatement Costs (MAC)
Potential Supply in 2020
Potential Supply in 2030
Waste sector R 0/t < MAC < R 150/t 7 million tons 14,2 million tons
AFOLU sector R 0/t < MAC < R 150/t 1,9 million tons 2,5 million tons
Industry sector R 0/t < MAC < R 150/t 0.7 million tons 0.2 million tons
Energy sector R 0/t < MAC < R 150/t 0.1 million tons 0.2 million tons
Transport sector R 0/t < MAC < R 150/t 2.7 million tons 0 tons
TOTAL 12,4 million tons 17,1 million tons
6.2.2 Registration date
It is proposed that carbon credits from any CDM, VCS or GS project in South Africa that has been registered prior to the implementation of the carbon tax are eligible for trade under the proposed trading scheme.
31 National Treasury, May 2013: Carbon Tax Policy Paper, South Africa. Even though the Policy Paper is not clear on the this interpretation, we
believe after numerous consultations that this is the most accurate reflection of potential carbon tax impacts. National Treasury has announced that they have requested The Department of Environmental Affairs to lower the limit of 0.1 MT per year.
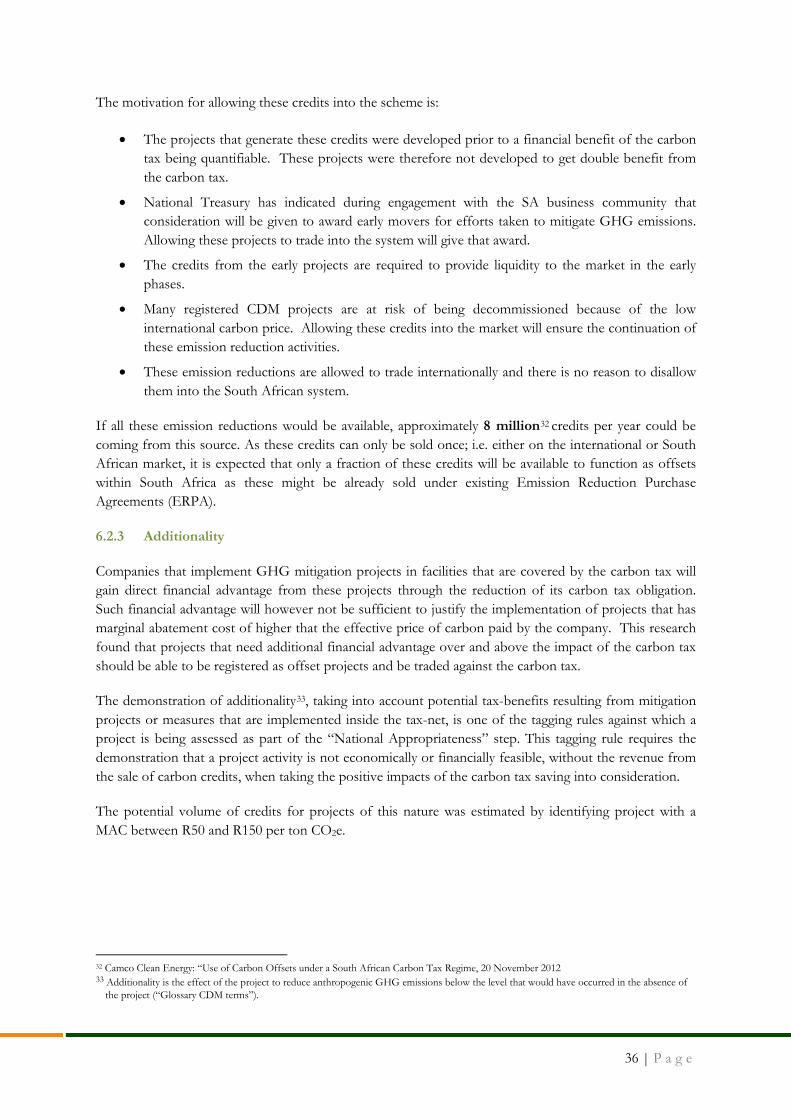
36 | P a g e
The motivation for allowing these credits into the scheme is:
• The projects that generate these credits were developed prior to a financial benefit of the carbon tax being quantifiable. These projects were therefore not developed to get double benefit from the carbon tax.
• National Treasury has indicated during engagement with the SA business community that consideration will be given to award early movers for efforts taken to mitigate GHG emissions. Allowing these projects to trade into the system will give that award.
• The credits from the early projects are required to provide liquidity to the market in the early phases.
• Many registered CDM projects are at risk of being decommissioned because of the low international carbon price. Allowing these credits into the market will ensure the continuation of these emission reduction activities.
• These emission reductions are allowed to trade internationally and there is no reason to disallow them into the South African system.
If all these emission reductions would be available, approximately 8 million32 credits per year could be coming from this source. As these credits can only be sold once; i.e. either on the international or South African market, it is expected that only a fraction of these credits will be available to function as offsets within South Africa as these might be already sold under existing Emission Reduction Purchase Agreements (ERPA).
6.2.3 Additionality
Companies that implement GHG mitigation projects in facilities that are covered by the carbon tax will gain direct financial advantage from these projects through the reduction of its carbon tax obligation. Such financial advantage will however not be sufficient to justify the implementation of projects that has marginal abatement cost of higher that the effective price of carbon paid by the company. This research found that projects that need additional financial advantage over and above the impact of the carbon tax should be able to be registered as offset projects and be traded against the carbon tax.
The demonstration of additionality33, taking into account potential tax-benefits resulting from mitigation projects or measures that are implemented inside the tax-net, is one of the tagging rules against which a project is being assessed as part of the “National Appropriateness” step. This tagging rule requires the demonstration that a project activity is not economically or financially feasible, without the revenue from the sale of carbon credits, when taking the positive impacts of the carbon tax saving into consideration.
The potential volume of credits for projects of this nature was estimated by identifying project with a MAC between R50 and R150 per ton CO2e.
32 Camco Clean Energy: “Use of Carbon Offsets under a South African Carbon Tax Regime, 20 November 2012 33 Additionality is the effect of the project to reduce anthropogenic GHG emissions below the level that would have occurred in the absence of
the project (“Glossary CDM terms”).
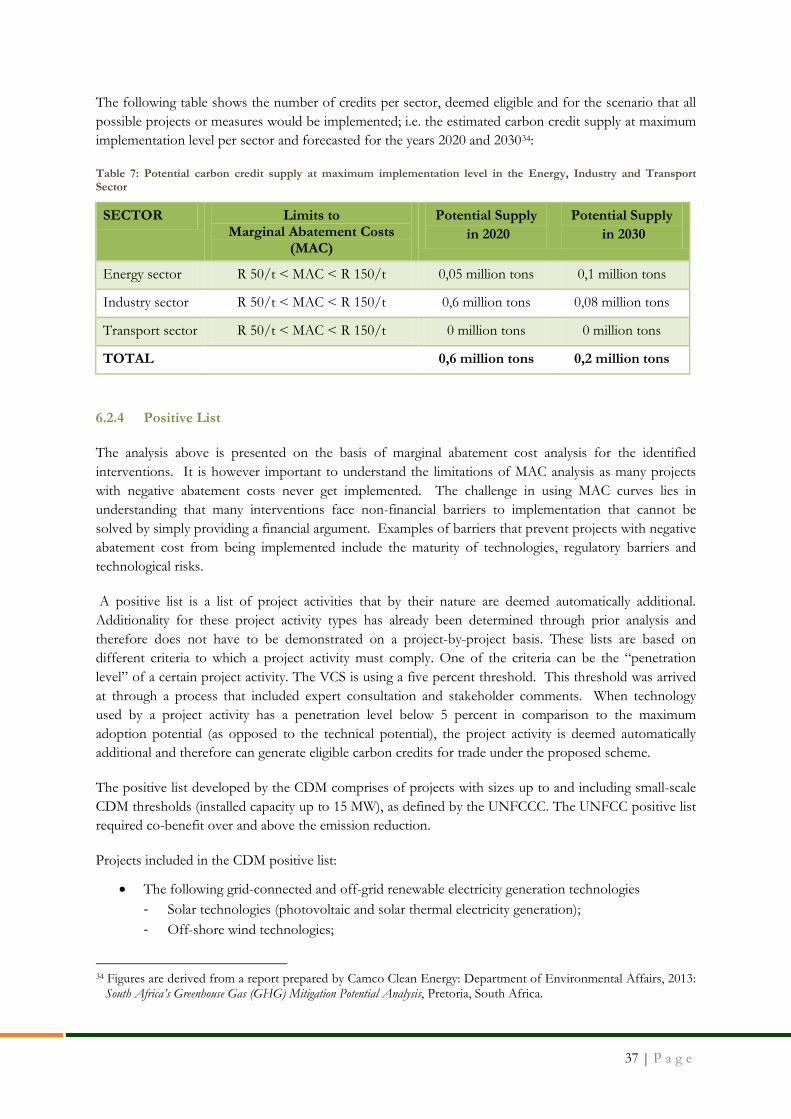
37 | P a g e
The following table shows the number of credits per sector, deemed eligible and for the scenario that all possible projects or measures would be implemented; i.e. the estimated carbon credit supply at maximum implementation level per sector and forecasted for the years 2020 and 203034:
Table 7: Potential carbon credit supply at maximum implementation level in the Energy, Industry and Transport Sector
SECTOR Limits to Marginal Abatement Costs
(MAC)
Potential Supply in 2020
Potential Supply in 2030
Energy sector R 50/t < MAC < R 150/t 0,05 million tons 0,1 million tons
Industry sector R 50/t < MAC < R 150/t 0,6 million tons 0,08 million tons
Transport sector R 50/t < MAC < R 150/t 0 million tons 0 million tons
TOTAL 0,6 million tons 0,2 million tons
6.2.4 Positive List
The analysis above is presented on the basis of marginal abatement cost analysis for the identified interventions. It is however important to understand the limitations of MAC analysis as many projects with negative abatement costs never get implemented. The challenge in using MAC curves lies in understanding that many interventions face non-financial barriers to implementation that cannot be solved by simply providing a financial argument. Examples of barriers that prevent projects with negative abatement cost from being implemented include the maturity of technologies, regulatory barriers and technological risks.
A positive list is a list of project activities that by their nature are deemed automatically additional. Additionality for these project activity types has already been determined through prior analysis and therefore does not have to be demonstrated on a project-by-project basis. These lists are based on different criteria to which a project activity must comply. One of the criteria can be the “penetration level” of a certain project activity. The VCS is using a five percent threshold. This threshold was arrived at through a process that included expert consultation and stakeholder comments. When technology used by a project activity has a penetration level below 5 percent in comparison to the maximum adoption potential (as opposed to the technical potential), the project activity is deemed automatically additional and therefore can generate eligible carbon credits for trade under the proposed scheme.
The positive list developed by the CDM comprises of projects with sizes up to and including small-scale CDM thresholds (installed capacity up to 15 MW), as defined by the UNFCCC. The UNFCC positive list required co-benefit over and above the emission reduction.
Projects included in the CDM positive list:
• The following grid-connected and off-grid renewable electricity generation technologies - Solar technologies (photovoltaic and solar thermal electricity generation); - Off-shore wind technologies;
34 Figures are derived from a report prepared by Camco Clean Energy: Department of Environmental Affairs, 2013:
South Africa’s Greenhouse Gas (GHG) Mitigation Potential Analysis, Pretoria, South Africa.
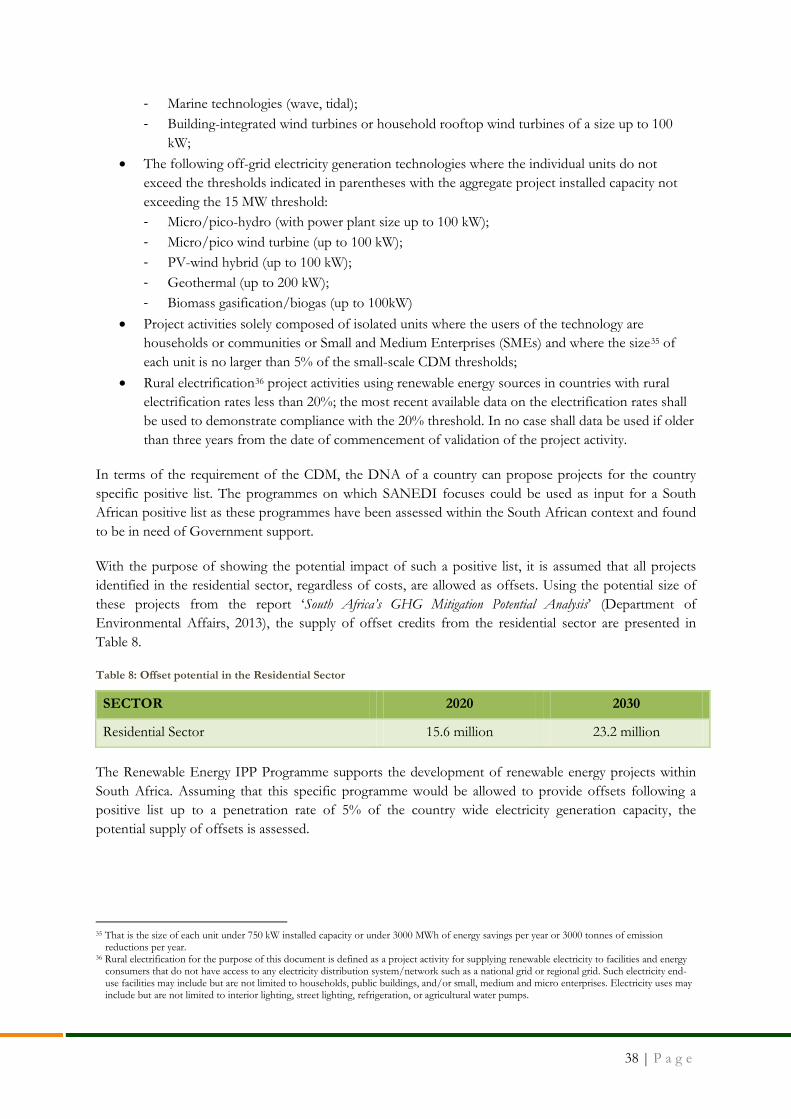
38 | P a g e
- Marine technologies (wave, tidal); - Building-integrated wind turbines or household rooftop wind turbines of a size up to 100
kW; • The following off-grid electricity generation technologies where the individual units do not
exceed the thresholds indicated in parentheses with the aggregate project installed capacity not exceeding the 15 MW threshold: - Micro/pico-hydro (with power plant size up to 100 kW); - Micro/pico wind turbine (up to 100 kW); - PV-wind hybrid (up to 100 kW); - Geothermal (up to 200 kW); - Biomass gasification/biogas (up to 100kW)
• Project activities solely composed of isolated units where the users of the technology are households or communities or Small and Medium Enterprises (SMEs) and where the size35 of each unit is no larger than 5% of the small-scale CDM thresholds;
• Rural electrification36 project activities using renewable energy sources in countries with rural electrification rates less than 20%; the most recent available data on the electrification rates shall be used to demonstrate compliance with the 20% threshold. In no case shall data be used if older than three years from the date of commencement of validation of the project activity.
In terms of the requirement of the CDM, the DNA of a country can propose projects for the country specific positive list. The programmes on which SANEDI focuses could be used as input for a South African positive list as these programmes have been assessed within the South African context and found to be in need of Government support.
With the purpose of showing the potential impact of such a positive list, it is assumed that all projects identified in the residential sector, regardless of costs, are allowed as offsets. Using the potential size of these projects from the report ‘South Africa’s GHG Mitigation Potential Analysis’ (Department of Environmental Affairs, 2013), the supply of offset credits from the residential sector are presented in Table 8.
Table 8: Offset potential in the Residential Sector
SECTOR 2020 2030
Residential Sector 15.6 million 23.2 million
The Renewable Energy IPP Programme supports the development of renewable energy projects within South Africa. Assuming that this specific programme would be allowed to provide offsets following a positive list up to a penetration rate of 5% of the country wide electricity generation capacity, the potential supply of offsets is assessed.
35 That is the size of each unit under 750 kW installed capacity or under 3000 MWh of energy savings per year or 3000 tonnes of emission
reductions per year. 36 Rural electrification for the purpose of this document is defined as a project activity for supplying renewable electricity to facilities and energy
consumers that do not have access to any electricity distribution system/network such as a national grid or regional grid. Such electricity end-use facilities may include but are not limited to households, public buildings, and/or small, medium and micro enterprises. Electricity uses may include but are not limited to interior lighting, street lighting, refrigeration, or agricultural water pumps.
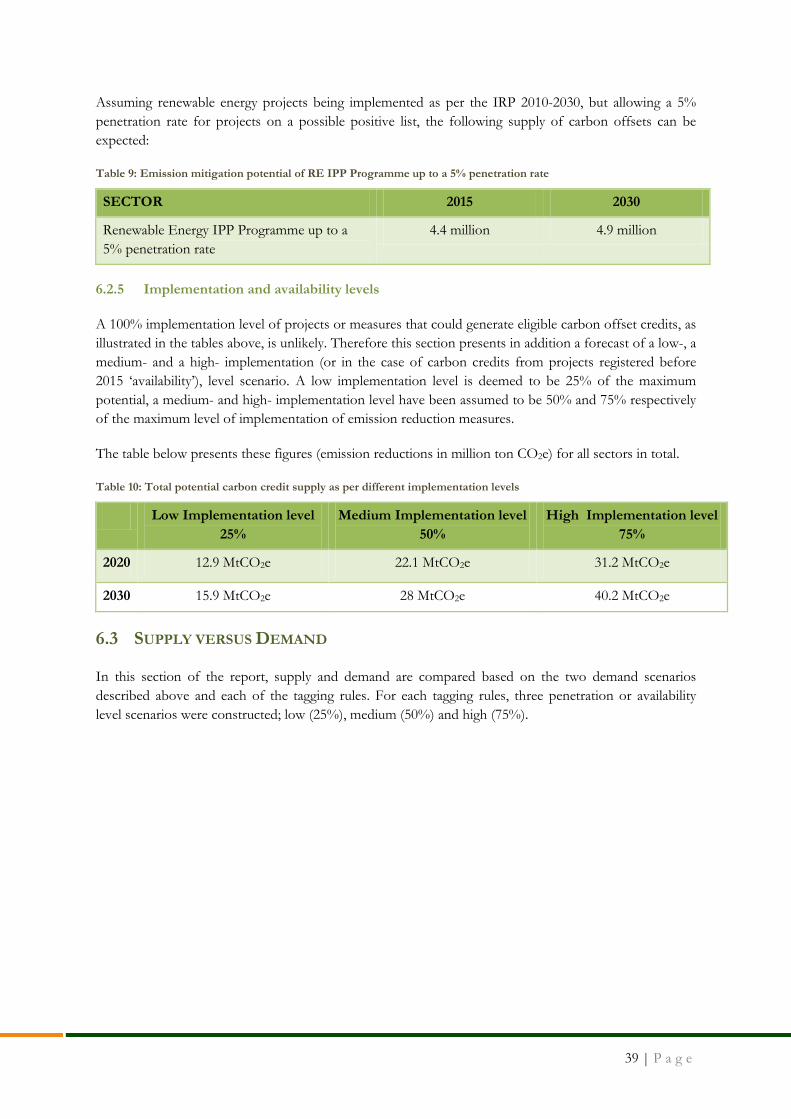
39 | P a g e
Assuming renewable energy projects being implemented as per the IRP 2010-2030, but allowing a 5% penetration rate for projects on a possible positive list, the following supply of carbon offsets can be expected:
Table 9: Emission mitigation potential of RE IPP Programme up to a 5% penetration rate
SECTOR 2015 2030
Renewable Energy IPP Programme up to a 5% penetration rate
4.4 million 4.9 million
6.2.5 Implementation and availability levels
A 100% implementation level of projects or measures that could generate eligible carbon offset credits, as illustrated in the tables above, is unlikely. Therefore this section presents in addition a forecast of a low-, a medium- and a high- implementation (or in the case of carbon credits from projects registered before 2015 ‘availability’), level scenario. A low implementation level is deemed to be 25% of the maximum potential, a medium- and high- implementation level have been assumed to be 50% and 75% respectively of the maximum level of implementation of emission reduction measures.
The table below presents these figures (emission reductions in million ton CO2e) for all sectors in total.
Table 10: Total potential carbon credit supply as per different implementation levels
Low Implementation level 25%
Medium Implementation level 50%
High Implementation level 75%
2020 12.9 MtCO2e 22.1 MtCO2e 31.2 MtCO2e
2030 15.9 MtCO2e 28 MtCO2e 40.2 MtCO2e
6.3 SUPPLY VERSUS DEMAND
In this section of the report, supply and demand are compared based on the two demand scenarios described above and each of the tagging rules. For each tagging rules, three penetration or availability level scenarios were constructed; low (25%), medium (50%) and high (75%).
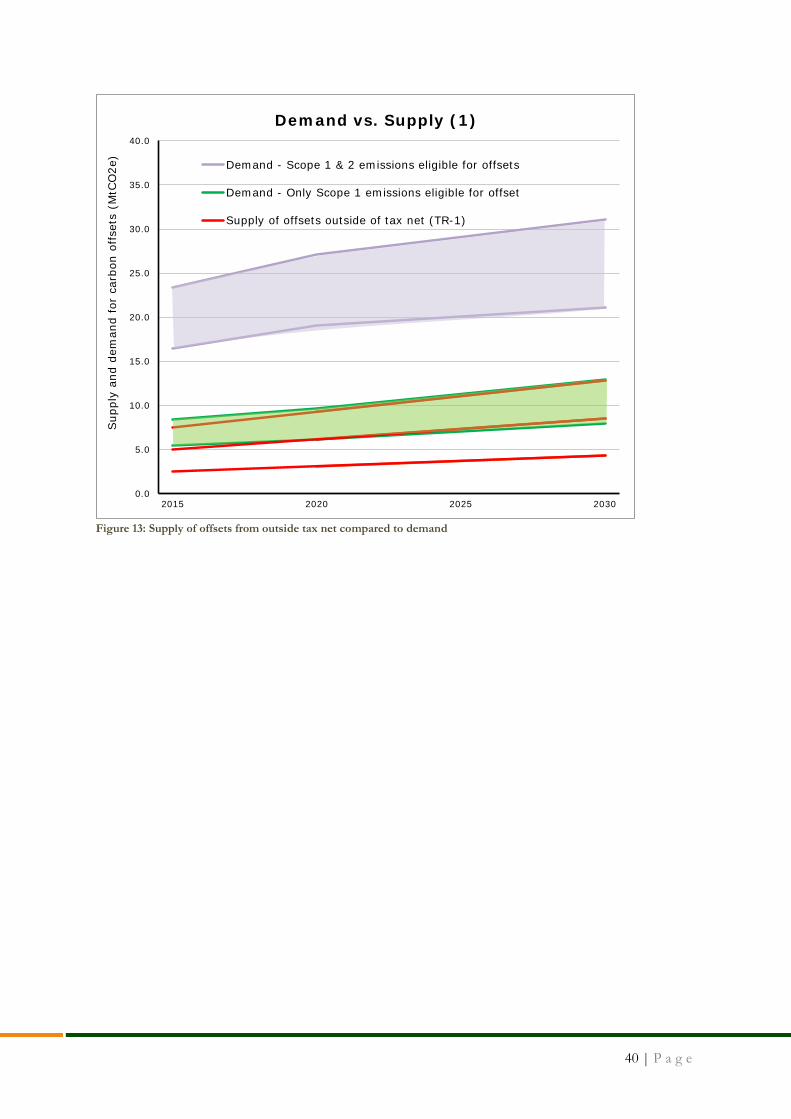
40 | P a g e
Figure 13: Supply of offsets from outside tax net compared to demand
0.0
5.0
10.0
15.0
20.0
25.0
30.0
35.0
40.0
2015 2020 2025 2030
Sup
ply
and
dem
and
for
carb
on o
ffse
ts (
MtC
O2e
)Demand vs. Supply (1)
Demand - Scope 1 & 2 emissions eligible for offsets
Demand - Only Scope 1 emissions eligible for offset
Supply of offsets outside of tax net (TR-1)
41 | P a g e
Figure 14: Supply of offsets from projects registered prior 2015 compared to demand
Figure 15: Supply of offsets from outside of the tax net, but additional
0.0
5.0
10.0
15.0
20.0
25.0
30.0
35.0
40.0
2015 2020 2025 2030
Sup
ply
and
dem
and
for
carb
on o
ffse
ts (
MtC
O2e
)
Demand vs. Supply (2)
Demand - Scope 1 & 2 emissions eligible for offsets
Demand - Only Scope 1 emissions eligible for offset
Supply of offsets prior 2015 Registration (TR-2)
0.0
5.0
10.0
15.0
20.0
25.0
30.0
35.0
40.0
2015 2020 2025 2030
Sup
ply
and
dem
and
for
carb
on o
ffse
ts (
MtC
O2e
)
Demand vs. Supply (3)
Demand - Scope 1 & 2 emissions eligible for offsetsDemand - Only Scope 1 emissions eligible for offsetSupply of offsets inside tax net but additional (TR-3)
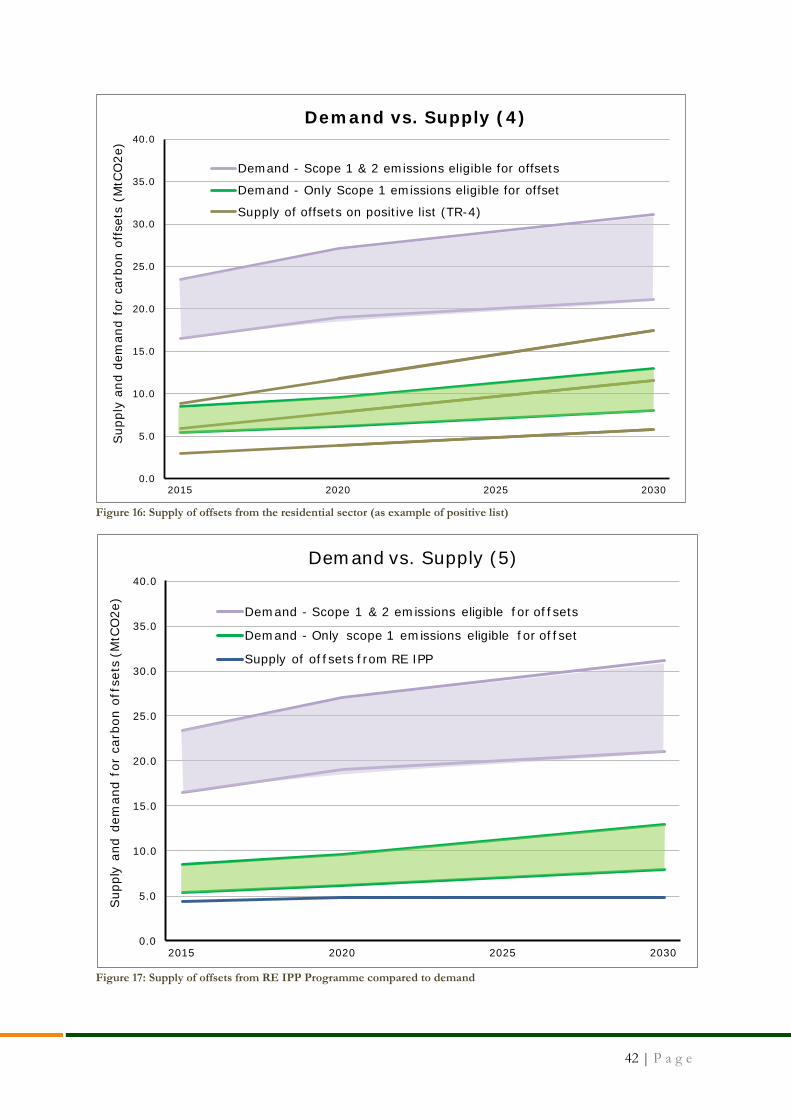
42 | P a g e
Figure 16: Supply of offsets from the residential sector (as example of positive list)
Figure 17: Supply of offsets from RE IPP Programme compared to demand
0.0
5.0
10.0
15.0
20.0
25.0
30.0
35.0
40.0
2015 2020 2025 2030
Sup
ply
and
dem
and
for
carb
on o
ffse
ts (
MtC
O2e
)Demand vs. Supply (4)
Demand - Scope 1 & 2 emissions eligible for offsets
Demand - Only Scope 1 emissions eligible for offset
Supply of offsets on positive list (TR-4)
0.0
5.0
10.0
15.0
20.0
25.0
30.0
35.0
40.0
2015 2020 2025 2030
Sup
ply
and
dem
and
for
carb
on o
ffse
ts (M
tCO
2e)
Demand vs. Supply (5)
Demand - Scope 1 & 2 emissions eligible for offsets
Demand - Only scope 1 emissions eligible for offset
Supply of offsets from RE IPP
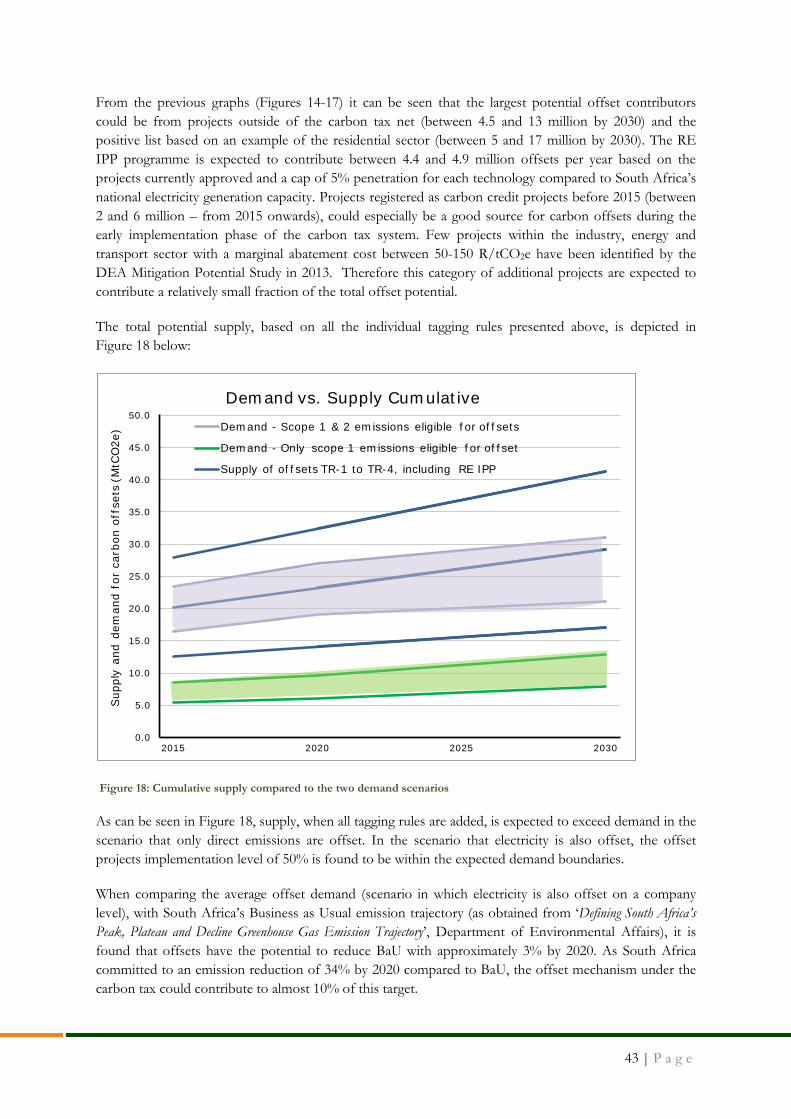
43 | P a g e
From the previous graphs (Figures 14-17) it can be seen that the largest potential offset contributors could be from projects outside of the carbon tax net (between 4.5 and 13 million by 2030) and the positive list based on an example of the residential sector (between 5 and 17 million by 2030). The RE IPP programme is expected to contribute between 4.4 and 4.9 million offsets per year based on the projects currently approved and a cap of 5% penetration for each technology compared to South Africa’s national electricity generation capacity. Projects registered as carbon credit projects before 2015 (between 2 and 6 million – from 2015 onwards), could especially be a good source for carbon offsets during the early implementation phase of the carbon tax system. Few projects within the industry, energy and transport sector with a marginal abatement cost between 50-150 R/tCO2e have been identified by the DEA Mitigation Potential Study in 2013. Therefore this category of additional projects are expected to contribute a relatively small fraction of the total offset potential.
The total potential supply, based on all the individual tagging rules presented above, is depicted in Figure 18 below:
Figure 18: Cumulative supply compared to the two demand scenarios
As can be seen in Figure 18, supply, when all tagging rules are added, is expected to exceed demand in the scenario that only direct emissions are offset. In the scenario that electricity is also offset, the offset projects implementation level of 50% is found to be within the expected demand boundaries.
When comparing the average offset demand (scenario in which electricity is also offset on a company level), with South Africa’s Business as Usual emission trajectory (as obtained from ‘Defining South Africa’s Peak, Plateau and Decline Greenhouse Gas Emission Trajectory’, Department of Environmental Affairs), it is found that offsets have the potential to reduce BaU with approximately 3% by 2020. As South Africa committed to an emission reduction of 34% by 2020 compared to BaU, the offset mechanism under the carbon tax could contribute to almost 10% of this target.
0.0
5.0
10.0
15.0
20.0
25.0
30.0
35.0
40.0
45.0
50.0
2015 2020 2025 2030
Sup
ply
and
dem
and
for
carb
on o
ffse
ts (M
tCO
2e)
Demand vs. Supply Cumulative Demand - Scope 1 & 2 emissions eligible for offsets
Demand - Only scope 1 emissions eligible for offset
Supply of offsets TR-1 to TR-4, including RE IPP
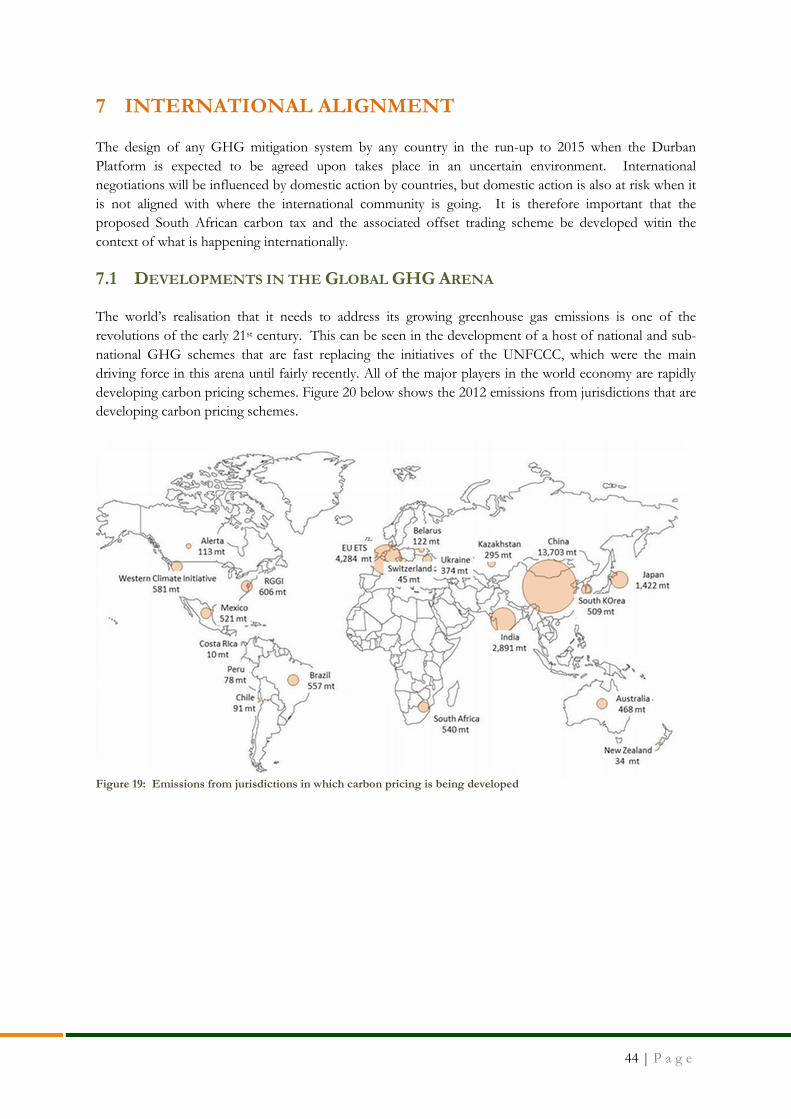
44 | P a g e
7 INTERNATIONAL ALIGNMENT
The design of any GHG mitigation system by any country in the run-up to 2015 when the Durban Platform is expected to be agreed upon takes place in an uncertain environment. International negotiations will be influenced by domestic action by countries, but domestic action is also at risk when it is not aligned with where the international community is going. It is therefore important that the proposed South African carbon tax and the associated offset trading scheme be developed witin the context of what is happening internationally.
7.1 DEVELOPMENTS IN THE GLOBAL GHG ARENA
The world’s realisation that it needs to address its growing greenhouse gas emissions is one of the revolutions of the early 21st century. This can be seen in the development of a host of national and sub-national GHG schemes that are fast replacing the initiatives of the UNFCCC, which were the main driving force in this arena until fairly recently. All of the major players in the world economy are rapidly developing carbon pricing schemes. Figure 20 below shows the 2012 emissions from jurisdictions that are developing carbon pricing schemes.
Figure 19: Emissions from jurisdictions in which carbon pricing is being developed
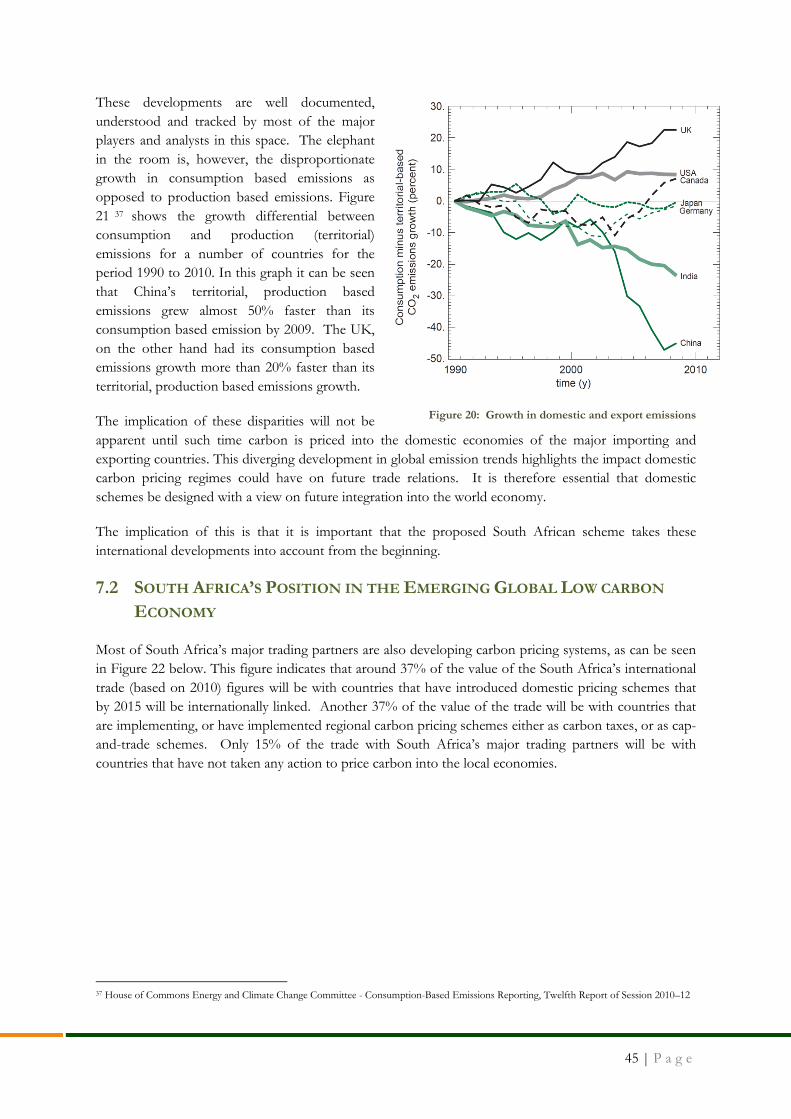
45 | P a g e
These developments are well documented, understood and tracked by most of the major players and analysts in this space. The elephant in the room is, however, the disproportionate growth in consumption based emissions as opposed to production based emissions. Figure 21 37 shows the growth differential between consumption and production (territorial) emissions for a number of countries for the period 1990 to 2010. In this graph it can be seen that China’s territorial, production based emissions grew almost 50% faster than its consumption based emission by 2009. The UK, on the other hand had its consumption based emissions growth more than 20% faster than its territorial, production based emissions growth.
The implication of these disparities will not be apparent until such time carbon is priced into the domestic economies of the major importing and exporting countries. This diverging development in global emission trends highlights the impact domestic carbon pricing regimes could have on future trade relations. It is therefore essential that domestic schemes be designed with a view on future integration into the world economy.
The implication of this is that it is important that the proposed South African scheme takes these international developments into account from the beginning.
7.2 SOUTH AFRICA’S POSITION IN THE EMERGING GLOBAL LOW CARBON
ECONOMY
Most of South Africa’s major trading partners are also developing carbon pricing systems, as can be seen in Figure 22 below. This figure indicates that around 37% of the value of the South Africa’s international trade (based on 2010) figures will be with countries that have introduced domestic pricing schemes that by 2015 will be internationally linked. Another 37% of the value of the trade will be with countries that are implementing, or have implemented regional carbon pricing schemes either as carbon taxes, or as cap-and-trade schemes. Only 15% of the trade with South Africa’s major trading partners will be with countries that have not taken any action to price carbon into the local economies.
37 House of Commons Energy and Climate Change Committee - Consumption-Based Emissions Reporting, Twelfth Report of Session 2010–12
Figure 20: Growth in domestic and export emissions
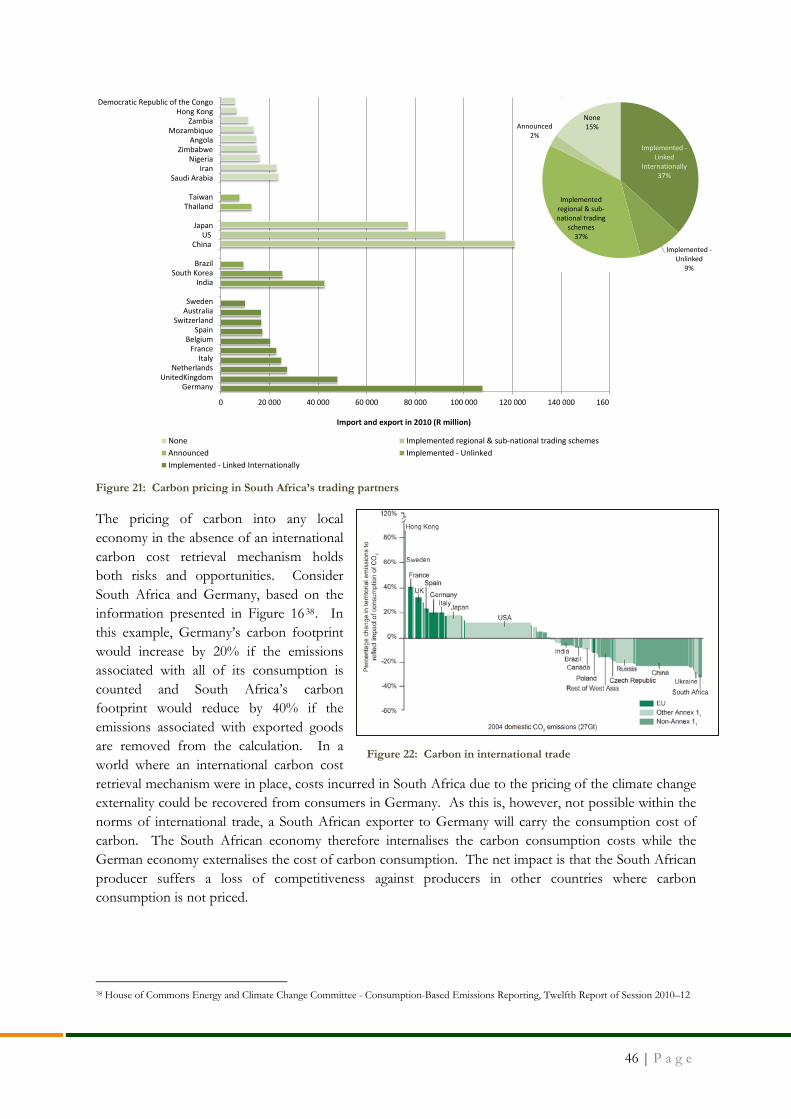
46 | P a g e
Figure 21: Carbon pricing in South Africa’s trading partners
The pricing of carbon into any local economy in the absence of an international carbon cost retrieval mechanism holds both risks and opportunities. Consider South Africa and Germany, based on the information presented in Figure 1638. In this example, Germany’s carbon footprint would increase by 20% if the emissions associated with all of its consumption is counted and South Africa’s carbon footprint would reduce by 40% if the emissions associated with exported goods are removed from the calculation. In a world where an international carbon cost retrieval mechanism were in place, costs incurred in South Africa due to the pricing of the climate change externality could be recovered from consumers in Germany. As this is, however, not possible within the norms of international trade, a South African exporter to Germany will carry the consumption cost of carbon. The South African economy therefore internalises the carbon consumption costs while the German economy externalises the cost of carbon consumption. The net impact is that the South African producer suffers a loss of competitiveness against producers in other countries where carbon consumption is not priced.
38 House of Commons Energy and Climate Change Committee - Consumption-Based Emissions Reporting, Twelfth Report of Session 2010–12
0 20 000 40 000 60 000 80 000 100 000 120 000 140 000 160
GermanyUnitedKingdom
NetherlandsItaly
FranceBelgium
SpainSwitzerland
AustraliaSweden
IndiaSouth Korea
Brazil
ChinaUS
Japan
ThailandTaiwan
Saudi ArabiaIran
NigeriaZimbabwe
AngolaMozambique
ZambiaHong Kong
Democratic Republic of the Congo
Import and export in 2010 (R million)
None Implemented regional & sub-national trading schemesAnnounced Implemented - UnlinkedImplemented - Linked Internationally
Figure 22: Carbon in international trade
Implemented -Linked
Internationally37%
Implemented -Unlinked
9%
Implemented regional & sub-national trading
schemes37%
Announced2%
None15%
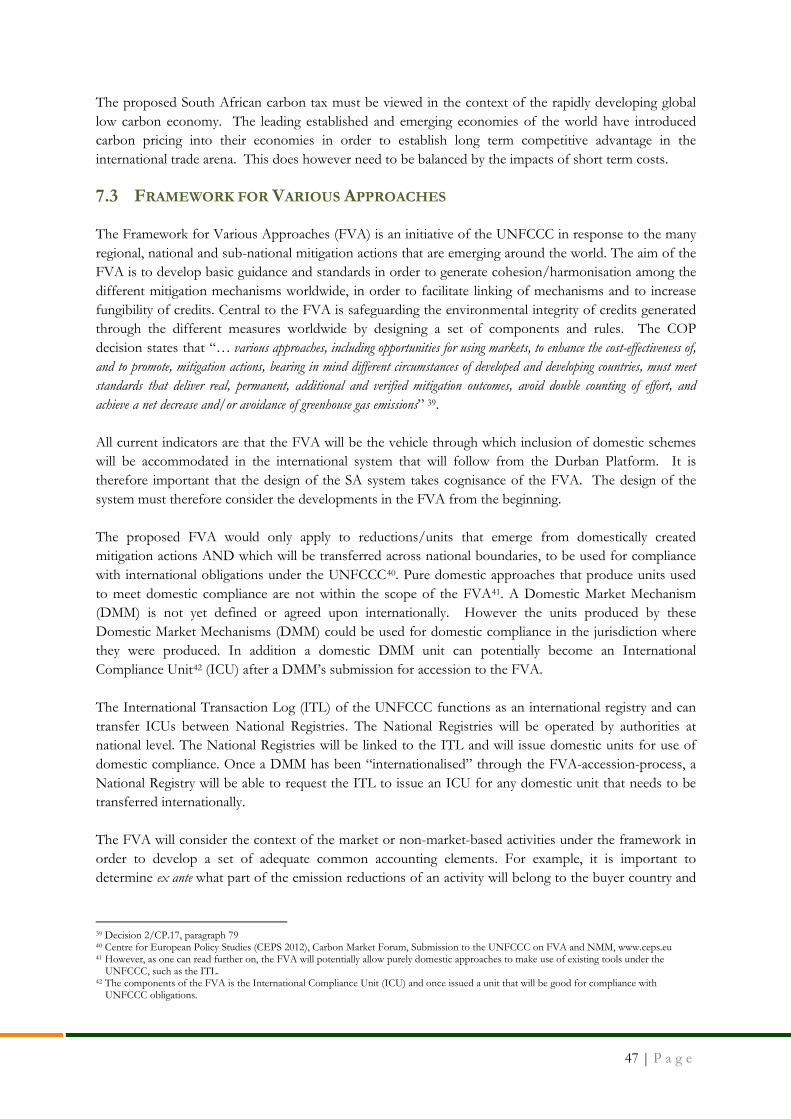
47 | P a g e
The proposed South African carbon tax must be viewed in the context of the rapidly developing global low carbon economy. The leading established and emerging economies of the world have introduced carbon pricing into their economies in order to establish long term competitive advantage in the international trade arena. This does however need to be balanced by the impacts of short term costs.
7.3 FRAMEWORK FOR VARIOUS APPROACHES
The Framework for Various Approaches (FVA) is an initiative of the UNFCCC in response to the many regional, national and sub-national mitigation actions that are emerging around the world. The aim of the FVA is to develop basic guidance and standards in order to generate cohesion/harmonisation among the different mitigation mechanisms worldwide, in order to facilitate linking of mechanisms and to increase fungibility of credits. Central to the FVA is safeguarding the environmental integrity of credits generated through the different measures worldwide by designing a set of components and rules. The COP decision states that “… various approaches, including opportunities for using markets, to enhance the cost-effectiveness of, and to promote, mitigation actions, bearing in mind different circumstances of developed and developing countries, must meet standards that deliver real, permanent, additional and verified mitigation outcomes, avoid double counting of effort, and achieve a net decrease and/or avoidance of greenhouse gas emissions” 39. All current indicators are that the FVA will be the vehicle through which inclusion of domestic schemes will be accommodated in the international system that will follow from the Durban Platform. It is therefore important that the design of the SA system takes cognisance of the FVA. The design of the system must therefore consider the developments in the FVA from the beginning. The proposed FVA would only apply to reductions/units that emerge from domestically created mitigation actions AND which will be transferred across national boundaries, to be used for compliance with international obligations under the UNFCCC40. Pure domestic approaches that produce units used to meet domestic compliance are not within the scope of the FVA41. A Domestic Market Mechanism (DMM) is not yet defined or agreed upon internationally. However the units produced by these Domestic Market Mechanisms (DMM) could be used for domestic compliance in the jurisdiction where they were produced. In addition a domestic DMM unit can potentially become an International Compliance Unit42 (ICU) after a DMM’s submission for accession to the FVA. The International Transaction Log (ITL) of the UNFCCC functions as an international registry and can transfer ICUs between National Registries. The National Registries will be operated by authorities at national level. The National Registries will be linked to the ITL and will issue domestic units for use of domestic compliance. Once a DMM has been “internationalised” through the FVA-accession-process, a National Registry will be able to request the ITL to issue an ICU for any domestic unit that needs to be transferred internationally. The FVA will consider the context of the market or non-market-based activities under the framework in order to develop a set of adequate common accounting elements. For example, it is important to determine ex ante what part of the emission reductions of an activity will belong to the buyer country and
39 Decision 2/CP.17, paragraph 79 40 Centre for European Policy Studies (CEPS 2012), Carbon Market Forum, Submission to the UNFCCC on FVA and NMM, www.ceps.eu 41 However, as one can read further on, the FVA will potentially allow purely domestic approaches to make use of existing tools under the
UNFCCC, such as the ITL. 42 The components of the FVA is the International Compliance Unit (ICU) and once issued a unit that will be good for compliance with
UNFCCC obligations.
48 | P a g e
what reductions will be accounted for by the host country in order to avoid double counting. This requires: a decision by the host country on the sectors, subsectors or policies (e.g. a NAMA) that it wants to open for market or non-market activities under the framework; a clear definition of the scope and type of the reduction activity; and an agreement on what part of the reductions will be accounted for respectively by the host country and the buyer country. The proposed design of the SA system will link with the FVA through the National Appropriateness step. The first point is to determine what is tradable under the DMM. This is the function of the SA National Appropriateness test. Once the parameters of the DMM are defined, then the inclusion of the domestic offsets in the international carbon markets can be addressed. In the case of the proposed National Appropriateness test for the SA system, the set of RSA-tagging-rules are the extra set of requirements to which a project activity that generates emissions reductions must conform. In order to facilitate accurate tracking of (international43) unit transfers, emission unit tracking systems must have the ability to track the path of an allowance or credit from where it was issued to where it was surrendered for compliance or otherwise cancelled (e.g. in cases where units are being converted from one scheme to another44). In other words, tracking of emission units should focus on where an allowance or credit was created and entered the market and where it was terminated and thus exited the market. Emission unit tracking systems must be able to transparently provide such data. As a minimum, a robust emission unit tracking system should comprise the following elements:
1) recording of the issuance and cancellation of allowances and offset credits issued as a result of net emission-reduction or removal activity and through a nationally or sub-nationally administered mechanism
2) provide for allocation of a unique serial identifier to every emission unit in the tracking system 3) recording of all transfers of emission units among accounts in the emission unit tracking system
These requirements were built into this basic offset trading scheme but must be recalibrated after implementation to ensure alignment with both domestic developments and international agreements.
43 Emission unit tracking systems could be national or sub-national in scope, depending on the scope of the mitigation-measure. 44 In many cases the program that issues and cancels an emission unit will be the same program. However, there may be instances where more
than one program is involved in the issuance and cancellation of an emission unit, e.g., where emission units are transferred or “exchanged” among programs. Often such an exchange scenario involves cancellation of a unit in one program and a corresponding issuance of a unit in another program.
49 | P a g e
8 CONCLUSION
The purpose of this report is to provide recommendations regarding the actions to be taken to allow for the implementation of a carbon offset trading system in South Africa by 2015.
Based on time limitations and financial constraints, it is proposed to utilise existing infrastructure as far as possible. Furthermore, instead of building a carbon offset trading system from scratch, it is recommended to benefit from learning and experience gained internationally in the carbon trading space. This approach is consistent with recommendations made by the ‘Partnership for Market Readiness’, which supports countries to build carbon market infrastructure, which is credible, consistent and potentially compatible. By building on existing national and international infrastructure, credibility and consistency is increased and therefore future linking with international carbon markets (compatibility) is expected to be easier.
A carbon offset trading system in South Africa should ensure environmental and economic integrity, as well as national appropriateness; concepts discussed and explained in this report.
As credible international standards, such as CDM, VCS and the Gold Standard exist it is recommended these be used, especially during the implementation phase of the carbon offset trading system. At a later stage the development of a South African standard might be beneficial, or other international standards might become available, therefore criteria for the acceptance of standards for SA offset projects have been developed.
Economic integrity is related to the offset trading component of the carbon offset trading scheme. Reliable trading infrastructure is available within South Africa and will require minimum modifications and investments. Interviews with both international, as well as local registries found both to be available and suitable to keep record of the ownership of credits in the trading system.
Apart from environmental and economic integrity, offset projects should also be suitable within the national context, or be ‘Nationally Appropriate’. The rules ensuring national appropriateness are referred to as ‘RSA Tagging Rules’. Four RSA Tagging Rules are always applicable;
1. The project should be within the borders of South Africa; 2. The project should have obtained Host Country Approval from the DNA; 3. Any project that reduces emissions from any of the Kyoto gasses can be included; and 4. Afforestation or reforestation projects registered under the CDM are recommended to be
excluded from carbon offset trading, as lCERs and tCERs do not address permanence issues.
The remaining Tagging Rules refer to the type of projects allowed under the offset trading system and are the following:
5. Projects generating offsets outside of the tax net; 6. Projects registered under either CDM, VCS or GS prior to 2015; 7. Projects within the tax net which can prove additionality; and 8. Projects on a Positive List.
It is proposed that the Designated National Authority (DNA) of South Africa chairs the custodian committee of the Tagging Rules, which should consist of representatives from the private sector and Government.
50 | P a g e
Reviewing projects’ compliance with Tagging Rules should be done by an ISO14065 accredited auditor.
The potential supply of carbon offsets has been modelled by applying the Tagging Rules always. The largest offset contributors are expected to be projects outside of the carbon tax net and from the positive list based on an example of automatic additionality of projects from the residential sector. The third largest contributor to offsets could be from projects registered as carbon credit projects before 2015, followed by the RE IPP programme limited at a 5% penetration rate for each technology compared to South Africa’s national electricity generation capacity as another example of a positive list. Projects within the tax net which can prove additionality where found to make up a relatively small fraction of the total offset potential.
When all tagging rules are allowed for (assuming a project implementation level of 50%), supply is found within the uncertainty boundaries of the demand scenario in which both direct emissions as well as electricity related emissions are offset by companies liable for carbon tax.
When comparing the average offset demand with South Africa’s Business as Usual emission trajectory (as obtained from ‘Defining South Africa’s Peak, Plateau and Decline Greenhouse Gas Emission Trajectory’, Department of Environmental Affairs), it is found that offsets have the potential to reduce BaU with approximately 3% by 2020. As South Africa committed to an emission reduction of 34% by 2020 compared to BaU, the offset mechanism under the carbon tax could contribute to almost 10% of this target.