Embed Size (px)
Citation preview
Case Study
CARE MODELS FOR
High-Need, High-Cost Patients
CareMore: Improving Outcomes and Controlling Health Care Spending for High-Needs Patients
Martha Hostetter, Sarah Klein, and Douglas McCarthy
PROGRAM AT A GLANCEKEY FEATURE As a Medicare Advantage plan that also provides medical care to its mem-bers, CareMore partners with primary care physicians to identify and refer high-risk patients who would benefit from support at its Care Centers, where multidisciplinary care teams manage patients’ needs holistically and oversee acute care.
TARGET POPULATION Medicare Advantage members with complex care needs.
WHY IT’S IMPORTANT By spending more to anticipate and address the medical chal-lenges its frail and chronically ill members will face, CareMore aims to prevent and slow the progression of disease rather than treat its complications.
BENEFITS In 2015, CareMore members had 20 percent fewer hospital admissions, 23 percent fewer bed days, and a 4 percent shorter length-of-stay than beneficiaries covered under fee-for-service Medicare. A comparative analysis of Medicare Advantage plan pricing for beneficiaries in average health indicates CareMore is more efficient in providing stan-dard Medicare benefits than market competitors on average.
CHALLENGES Cuts to Medicare Advantage reimbursement rates threaten CareMore’s business model. It has begun to diversify by serving Medicaid beneficiaries and by partner-ing with health systems that are moving toward risk-based contracting.
INTRODUCTIONWhen people talk about bending the health care cost curve, CareMore is often held up as an example that it’s possible. Founded more than 20 years ago by a group of physicians, the Cerritos, Calif.–based Medicare Advantage plan and medical provider operates on the premise that a third or more of health care spending on frail and chronically ill patients can be eliminated by restructuring the way their care is delivered.
CareMore has built its business around identifying high-risk patients who have a high likelihood of developing problems as they age, and surrounding them with coordinated services. CareMore’s effort to improve care for frail or chronically ill patients—especially the sickest 15 percent of its membership that accounts for some 75 percent of spending—is part of its strategy to spend more preventing and slowing the progression of disease than treating it. To do that, it invests the capitated
To learn more about new publications when they become available, visit the Fund’s website and register to receive email alerts.
Commonwealth Fund pub. 1937 Vol. 9
The mission of The Commonwealth Fund is to promote a high performance health care system. The Fund carries out this mandate by supporting independent research on health care issues and making grants to improve health care practice and policy. Support for this research was provided by The Commonwealth Fund. The views presented here are those of the authors and not necessarily those of The Commonwealth Fund or its directors, officers, or staff.
For more information about this brief, please contact:
Martha HostetterConsulting Writer and EditorThe Commonwealth [email protected]
March 2017
This case study is one in an ongoing series examining programs that aim to improve outcomes and reduce costs of care for patients with complex needs, who account for a large share of U.S. health care spending.
2 The Commonwealth Fund
payments it receives from Medicare in prevention and early intervention programs for all members and on supplemental benefits that Medicare’s fee-for-service program typically doesn’t cover—including patient education programs and trans-portation to its Care Centers. At the Care Centers, multidisciplinary teams of clinicians collaborate to identify what it will take to keep members with the most complex needs healthy.
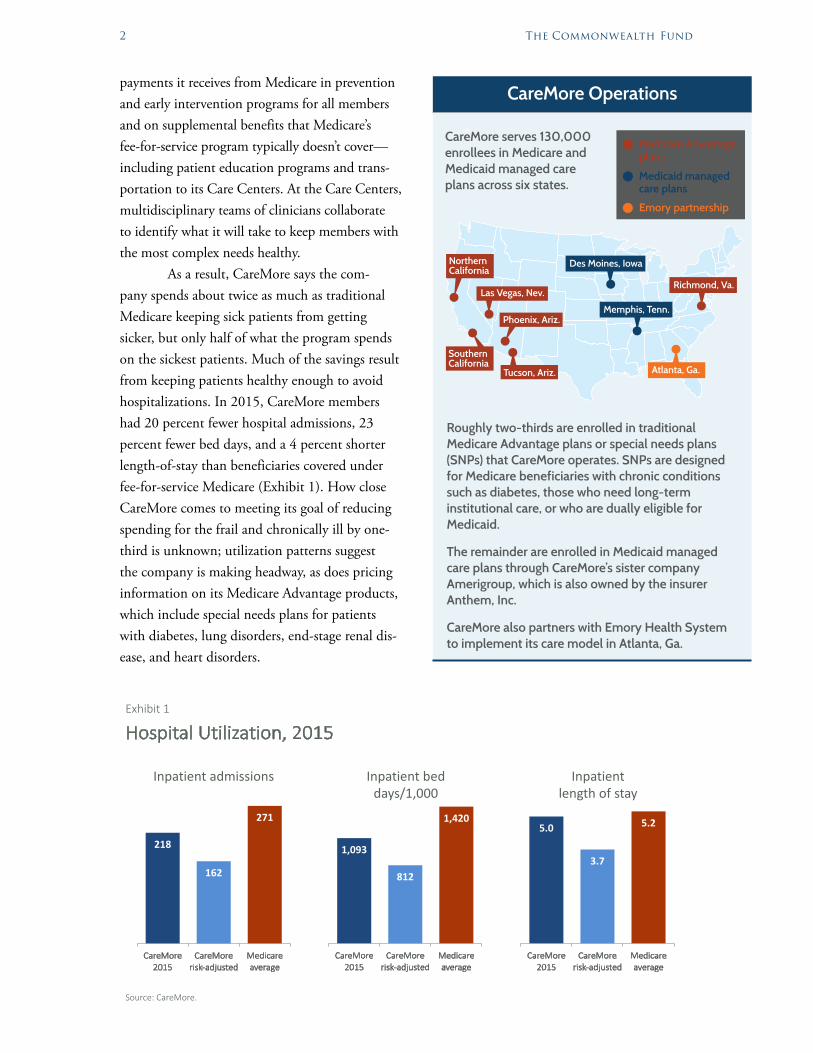
As a result, CareMore says the com-pany spends about twice as much as traditional Medicare keeping sick patients from getting sicker, but only half of what the program spends on the sickest patients. Much of the savings result from keeping patients healthy enough to avoid hospitalizations. In 2015, CareMore members had 20 percent fewer hospital admissions, 23 percent fewer bed days, and a 4 percent shorter length-of-stay than beneficiaries covered under fee-for-service Medicare (Exhibit 1). How close CareMore comes to meeting its goal of reducing spending for the frail and chronically ill by one-third is unknown; utilization patterns suggest the company is making headway, as does pricing information on its Medicare Advantage products, which include special needs plans for patients with diabetes, lung disorders, end-stage renal dis-ease, and heart disorders.
HospitalUtilization,2015Exhibit1
Source:CareMore.
218
162
271
CareMore2015
CareMorerisk-adjusted
Medicareaverage
Inpatientadmissions
1,093
812
1,420
CareMore2015
CareMorerisk-adjusted
Medicareaverage
Inpatientbeddays/1,000
5.0
3.7
5.2
CareMore2015
CareMorerisk-adjusted
Medicareaverage
Inpatientlengthofstay
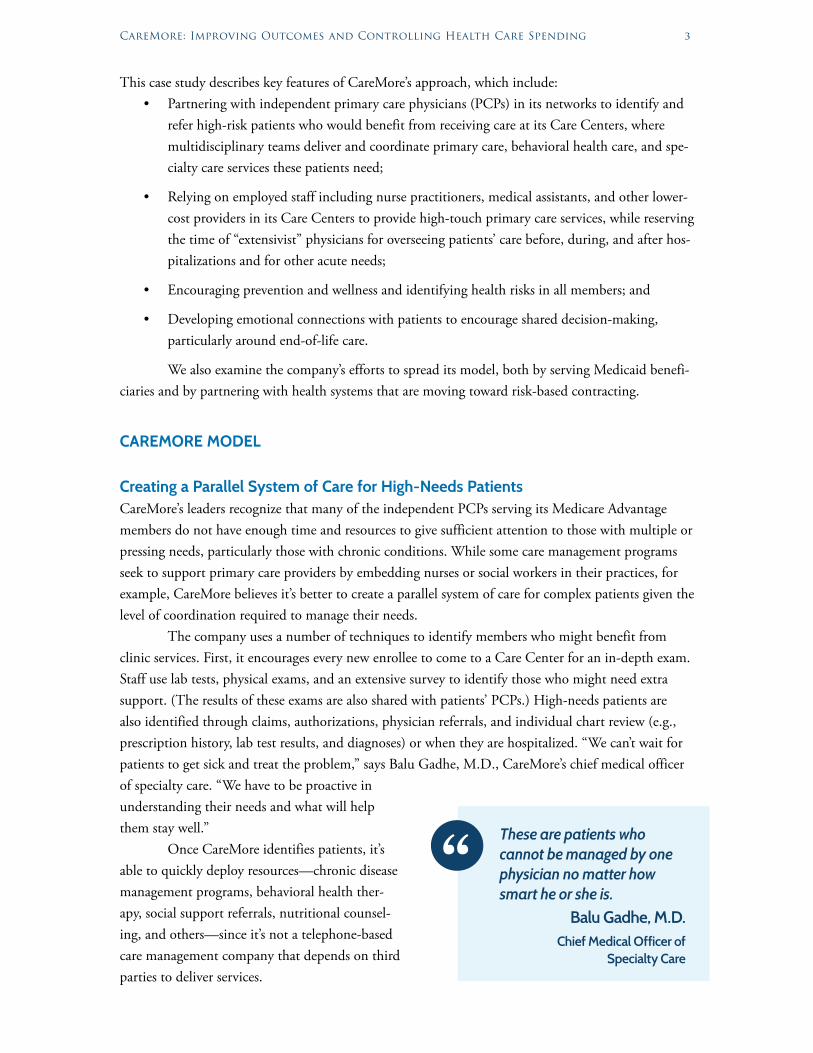
CareMore Operations
CareMore serves 130,000 enrollees in Medicare and Medicaid managed care plans across six states.
Medicare Advantage plans
Medicaid managed care plans
Emory partnership
Tucson, Ariz.
NorthernCalifornia
Las Vegas, Nev.
Phoenix, Ariz.
SouthernCalifornia
Richmond, Va.
Des Moines, Iowa
Memphis, Tenn.
Atlanta, Ga.
Roughly two-thirds are enrolled in traditional Medicare Advantage plans or special needs plans (SNPs) that CareMore operates. SNPs are designed for Medicare beneficiaries with chronic conditions such as diabetes, those who need long-term institutional care, or who are dually eligible for Medicaid.
The remainder are enrolled in Medicaid managed care plans through CareMore’s sister company Amerigroup, which is also owned by the insurer Anthem, Inc.
CareMore also partners with Emory Health System to implement its care model in Atlanta, Ga.
CareMore: Improving Outcomes and Controlling Health Care Spending 3
This case study describes key features of CareMore’s approach, which include:• Partnering with independent primary care physicians (PCPs) in its networks to identify and
refer high-risk patients who would benefit from receiving care at its Care Centers, where multidisciplinary teams deliver and coordinate primary care, behavioral health care, and spe-cialty care services these patients need;
• Relying on employed staff including nurse practitioners, medical assistants, and other lower-cost providers in its Care Centers to provide high-touch primary care services, while reserving the time of “extensivist” physicians for overseeing patients’ care before, during, and after hos-pitalizations and for other acute needs;
• Encouraging prevention and wellness and identifying health risks in all members; and
• Developing emotional connections with patients to encourage shared decision-making, particularly around end-of-life care.
We also examine the company’s efforts to spread its model, both by serving Medicaid benefi-ciaries and by partnering with health systems that are moving toward risk-based contracting.
CAREMORE MODEL
Creating a Parallel System of Care for High-Needs PatientsCareMore’s leaders recognize that many of the independent PCPs serving its Medicare Advantage members do not have enough time and resources to give sufficient attention to those with multiple or pressing needs, particularly those with chronic conditions. While some care management programs seek to support primary care providers by embedding nurses or social workers in their practices, for example, CareMore believes it’s better to create a parallel system of care for complex patients given the level of coordination required to manage their needs.
The company uses a number of techniques to identify members who might benefit from clinic services. First, it encourages every new enrollee to come to a Care Center for an in-depth exam. Staff use lab tests, physical exams, and an extensive survey to identify those who might need extra support. (The results of these exams are also shared with patients’ PCPs.) High-needs patients are also identified through claims, authorizations, physician referrals, and individual chart review (e.g., prescription history, lab test results, and diagnoses) or when they are hospitalized. “We can’t wait for patients to get sick and treat the problem,” says Balu Gadhe, M.D., CareMore’s chief medical officer of specialty care. “We have to be proactive in understanding their needs and what will help them stay well.”
Once CareMore identifies patients, it’s able to quickly deploy resources—chronic disease management programs, behavioral health ther-apy, social support referrals, nutritional counsel-ing, and others—since it’s not a telephone-based care management company that depends on third parties to deliver services.
These are patients who cannot be managed by one physician no matter how smart he or she is.
Balu Gadhe, M.D.Chief Medical Officer of
Specialty Care
4 The Commonwealth Fund
At any given time, about 20 percent of CareMore members receive services from teams. Among them are patients with multiple chronic conditions, the frail elderly, and those with comor-bid behavioral and physical health problems. Many of the patients are poor (about 30 percent of CareMore’s members are very low income1). Many choose CareMore because it offers benefits such as no-cost transportation to and from clinics, no copayments for medications or supplies needed to manage chronic conditions, and 24/7 access to providers. In most markets, there are no premiums and no copayments for primary care or Care Center visits.
Some patients use the Care Centers on a short-term basis, for instance after a hospitalization, and then transition back to their PCPs. Other very sick patients, such as those with end- stage renal disease, receive care there for years. As people’s conditions stabilize, they may receive less intensive oversight, but they are still monitored by CareMore’s team. “We learned that when members are stable and we discharge them back to their primary care provider, they fall off the wagon because somebody’s not holding them accountable,” says Heather Del Villar, C.N.P., chief nurse practitioner.
Relatively healthy CareMore members who do not need hands-on support may take advan-tage of CareMore’s wellness programs, including an exercise program customized for older adults (“Nifty After Fifty”), nutrition counseling, and a diabetes education program.
To encourage support for this model, CareMore offers PCPs an incentive package that rewards jointly supported goals such as the delivery of comprehensive health assessments and preven-tive tests, as well as performance on other quality measures including patient satisfaction. The plan pays PCPs capitated rates so PCPs face no disincentive for referring patients to the Care Centers. Comanagement of chronically ill patients also may give PCPs more time to see new patients.
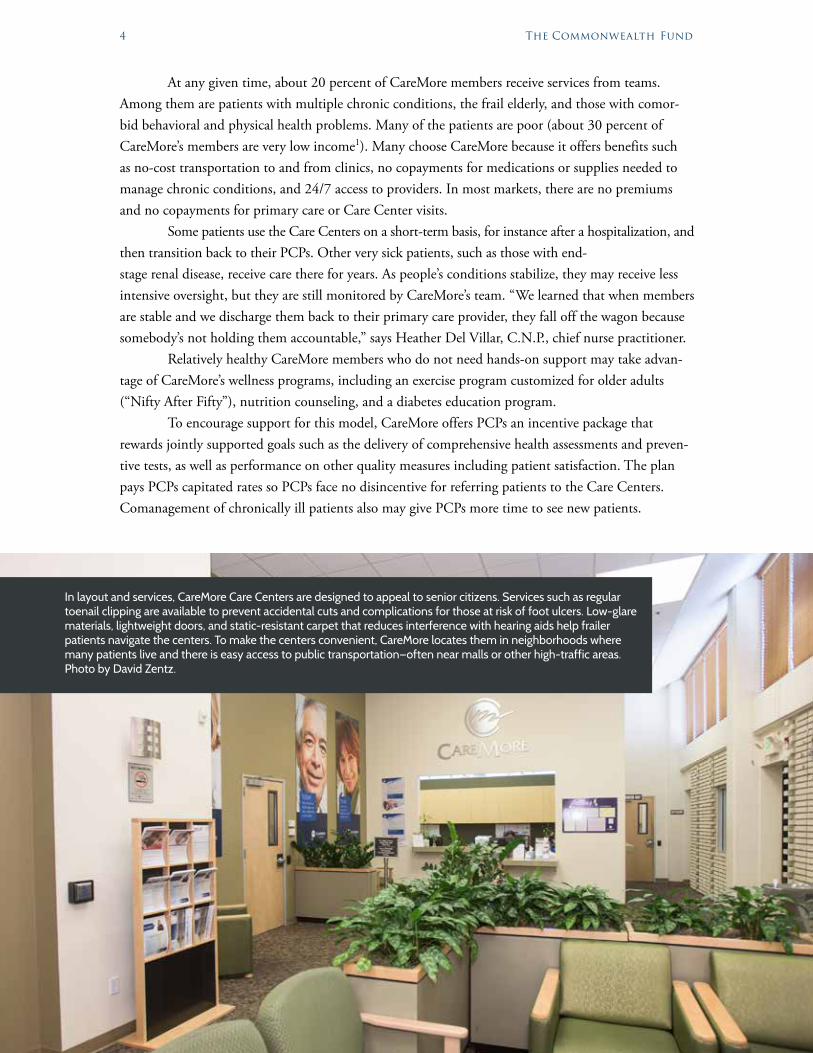
In layout and services, CareMore Care Centers are designed to appeal to senior citizens. Services such as regular toenail clipping are available to prevent accidental cuts and complications for those at risk of foot ulcers. Low-glare materials, lightweight doors, and static-resistant carpet that reduces interference with hearing aids help frailer patients navigate the centers. To make the centers convenient, CareMore locates them in neighborhoods where many patients live and there is easy access to public transportation—often near malls or other high-traffic areas. Photo by David Zentz.
CareMore: Improving Outcomes and Controlling Health Care Spending 5
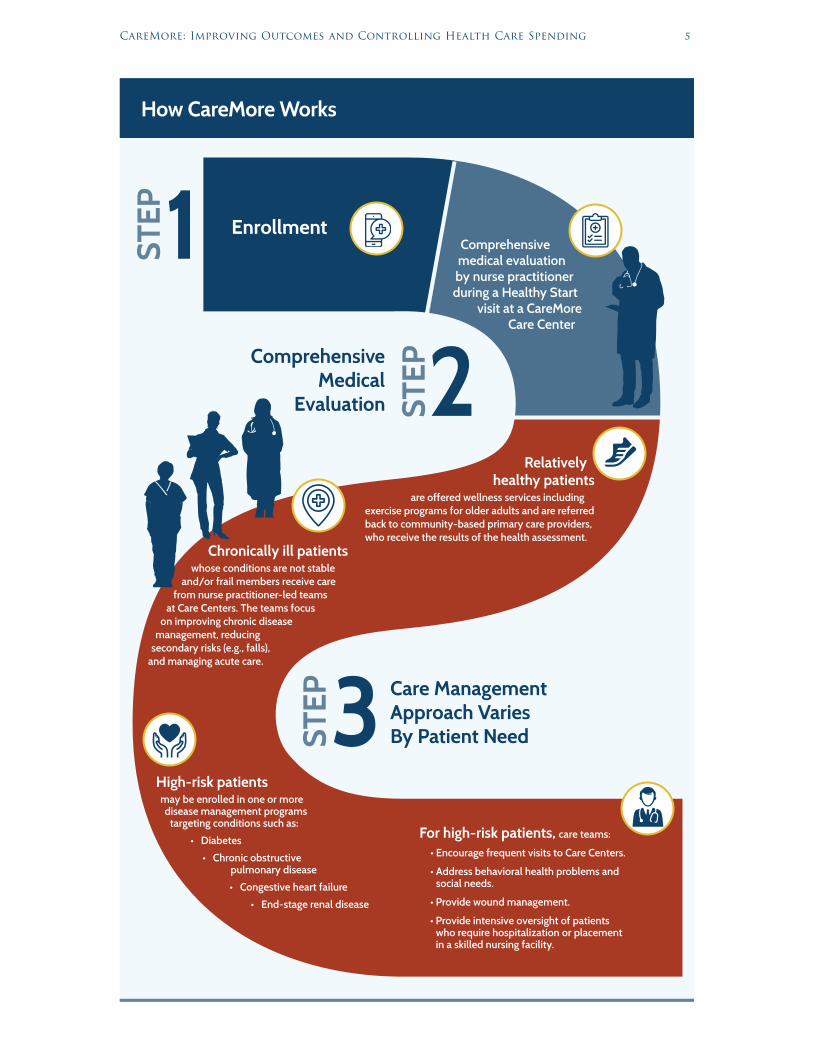
Chronically ill patients whose conditions are not stable
and/or frail members receive care from nurse practitioner-led teams
at Care Centers. The teams focus on improving chronic disease
management, reducing secondary risks (e.g., falls),
and managing acute care.
High-risk patients may be enrolled in one or more disease management programs
targeting conditions such as:
• Diabetes
• Chronic obstructive pulmonary disease
• Congestive heart failure
• End-stage renal disease
How CareMore Works
Enrollment1
2
Care Management Approach Varies By Patient Need 3
ComprehensiveMedical
Evaluation
For high-risk patients, care teams:
• Encourage frequent visits to Care Centers.
• Address behavioral health problems and social needs.
• Provide wound management.
• Provide intensive oversight of patients who require hospitalization or placement in a skilled nursing facility.
Relatively healthy patients
are offered wellness services includingexercise programs for older adults and are referred back to community-based primary care providers, who receive the results of the health assessment.
Comprehensive medical evaluation by nurse practitioner during a Healthy Start
visit at a CareMore Care Center
6 The Commonwealth Fund
Interdisciplinary Team CareAt each Care Center, teams work together to ensure coordinated care, following detailed care proto-cols and making parsimonious use of specialists in a narrow referral network.2 In addition to proto-cols for treatment of common diseases such as diabetes, chronic obstructive pulmonary disease, or dementia, CareMore has guidelines to address particular risks common to older adults, such as falls or drug interactions.
To make its high-touch model of care cost-effective, CareMore uses nurse practitioners, med-ical assistants, and other nonphysician clinicians to deliver most services, relying on more highly paid physicians to oversee care for hospitalized patients and those admitted to skilled nursing facilities. Clinicians use whiteboards and team meetings to track care plans. Team members who aren’t available for an in-person consult may use videoconferencing for quick consultations.
The care team is supported by nutritionists, social workers, psychiatrists, psychiatric nurse practitioners, behavioral health therapists, exercise specialists, and pharmacists. Pharmacy staff review lab test results (e.g., to monitor medication effects), which are then shared with patients during visits. Behavioral health providers, including a psychiatrist or psychiatric nurse practitioner and a therapist, work in Care Centers to provide as-needed consultations and therapy.
CareMore’s nurse practitioners deliver some services typically provided by physicians. For example, nurse practitioners care for diabetics’ wounds—treatment that might otherwise be under-taken by PCPs or, if the wounds are slow to heal, vascular surgeons. Working under the general supervision of physicians, nurse practitioners see patients every other day to ensure their wounds are healing and change their dressings. This approach helped CareMore achieve 66 percent fewer diabetic amputations from gangrenous infections than the average among Medicare fee-for-service beneficiaries.3
CareMore’s nurse practitioners also explore the root causes of patients’ problems. After treat-ing a diabetic patient’s wound, for example, they may assess whether his diet, home situation, or mood may be hurting his health, bringing in other team members as needed. “Half of what we do is education,” Del Villar says. Nurse practitioners also may be deployed to visit patients in postacute care settings or at home.
CareMore also has redefined the role of hospitalists, typically internists who provide general medical care for hospitalized patients. Its employed physicians are known as “extensivists” because their oversight extends beyond the hospital to monitor patients leading up to, during, and after their hospital stays. With responsibility for six to eight patients per day, extensivists check patients before procedures, visit them while they are hospitalized, then follow up with them until they are stabilized, making rounds in Care Centers and skilled nursing facilities.
Extensivists play a key role by overseeing the work of medical specialists and ensuring that treatment recommendations take into account the whole patient and his or her quality of life. Gadhe notes that well-informed patients and families often make conservative choices about treatment. He cites the example of an 89-year-old bedbound woman with advanced Alzheimer’s who was hospitalized after a gallbladder attack and—although a scan showed the gallstone had passed—was recommended by her gastroenterologist for surgery to remove her gallbladder in order to prevent future attacks.
After a CareMore extensivist stepped in to explain the risks of the surgery to the family, including worsening her dementia and potentially inducing life-threatening pneumonia, the family opted against surgery. She recovered and was able to go home and celebrate her birthday. Our goal is “dignity, palliation, and real end-of-life management,” Gadhe says.
CareMore: Improving Outcomes and Controlling Health Care Spending 7
Case management provided by nurses is “the glue that holds the model together,” he adds. Case managers meet daily with extensivists to review hospitalized patients’ progress and preparations for discharge. In collaboration with extensivists, they develop a plan of care for members who are experiencing care transitions and/or are at high risk for readmission. They also help to assess and vali-date member needs; act as a first point of contact and facilitate communication with members, their families, and other providers; educate members and their caregivers on self-management skills under the guidance of the extensivist and nurse practitioner; and coordinate care for very sick patients, such as those with end-stage renal disease.
Care coordinators (typically specially trained medical assistants) coordinate postacute care, under the direction of the care manager, by setting follow-up appointments and ensuring medical equipment and other supportive services are in place. Medical assistants perform diagnostic tests, help educate patients, and track their progress over time.
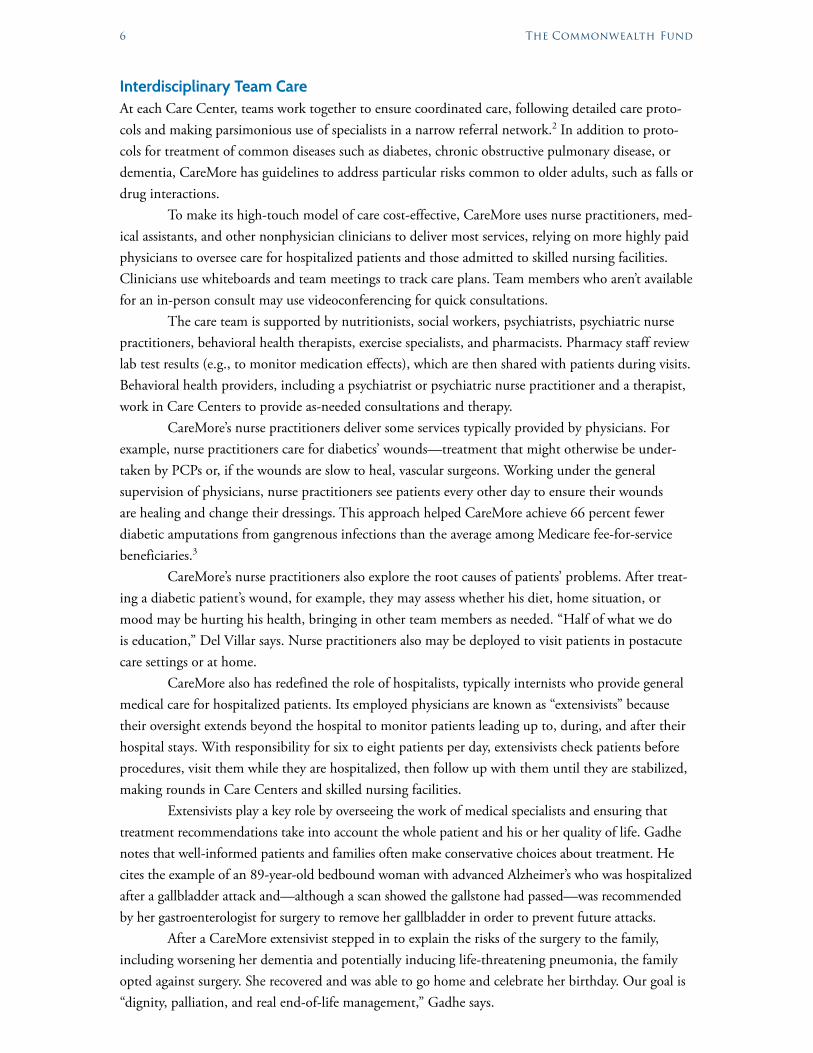
Patients in CareMore’s heart failure program receive wireless scales that alert their clinicians if they experience rapid weight gain. Same-day appointments are available to quickly address concerns. Photo courtesy of CareMore.
8 The Commonwealth Fund
Engaging Patients and Addressing Nonmedical NeedsNonmedical issues such as unstable housing, social isolation, food insecurity, stress, domestic abuse, unsafe neighborhoods, discrimination, and other factors can have an outsize impact on people’s health and ability to care for themselves. CareMore teams use a number of tactics to identify such issues, such as asking about patients’ social circumstances during initial interviews and making home visits. Social workers and case managers then link patients to services offered by their networks of community partners.
Instead of pointing the finger at “noncompliant” patients, CareMore teams make efforts to help patients manage their conditions. They charge no copayments for insulin and other maintenance medications and offer home visits for those who don’t or can’t come in to the Care Centers, along with remote monitoring and reminders to help people follow their treatment plans.
CareMore teams also seek to cultivate meaningful connections with patients by taking time to listen to them, and by offering practical advice and support. Building trust enables providers to persuade many of their patients that they can feel better—that it’s possible for them to avoid crises and control their conditions.
This also lays the groundwork for shared decision-making, particularly related to end-of-life care. CareMore teams initiate conversations about end-of-life care early and often, making sure patients and their families understand their options and potential consequences.
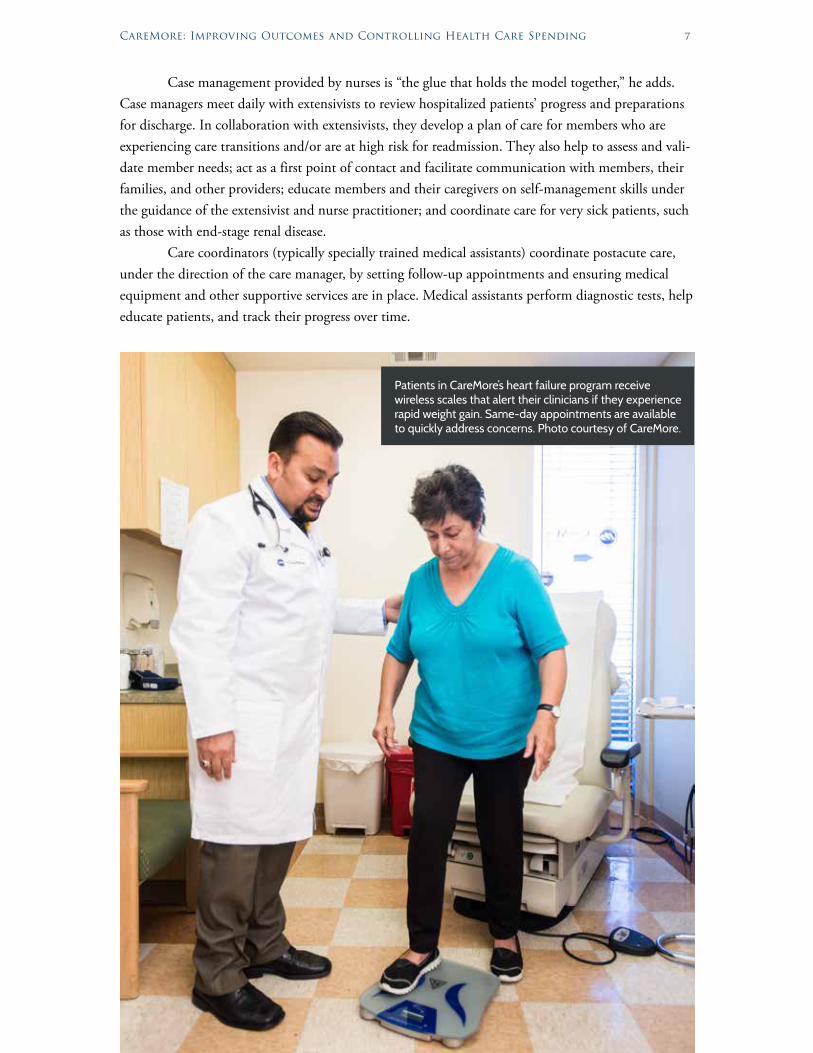
CareMore relies on interdisciplinary teams to meet patients’ needs. Photo courtesy of CareMore.
CareMore: Improving Outcomes and Controlling Health Care Spending 9
Integrated Behavioral Health CareCareMore is better able to care for the whole person because behavioral health care is central to its approach. If CareMore clinicians suspect one of their patients has a behavioral health problem, they are able to make “warm handoffs” to psychiatrists, psychiatric nurse practitioners, or therapists working on site at the Care Centers, and also can get help from staff social workers and addiction specialists.
Like other CareMore clinicians, behavioral health staff treat a patient’s symptoms but also work to uncover and address the root causes of problems. For example, when a behavioral health team encountered a 50-year-old member who had mood swings, heard voices, and struggled with addiction—leading to frequent hospitaliza-tions—they developed a plan to create greater stability in her health and her life. They prescribed a long-acting injectable antipsychotic medication and enrolled her in a group residential living program. Since then, she has not been hospitalized.
RESULTSCareMore’s approach improves management of chronic conditions and reduces hospitalizations. For example, close monitoring of members with chronic kidney disease, including secondary risk factors such as high blood pressure and uncontrolled diabetes, delays the onset of end-stage renal disease (ESRD) and reduces hospital admissions. According to the company, the 2015 hospital admission rate among CareMore’s ESRD patients is 45 percent lower than the national average, with 85 percent fewer bed days.
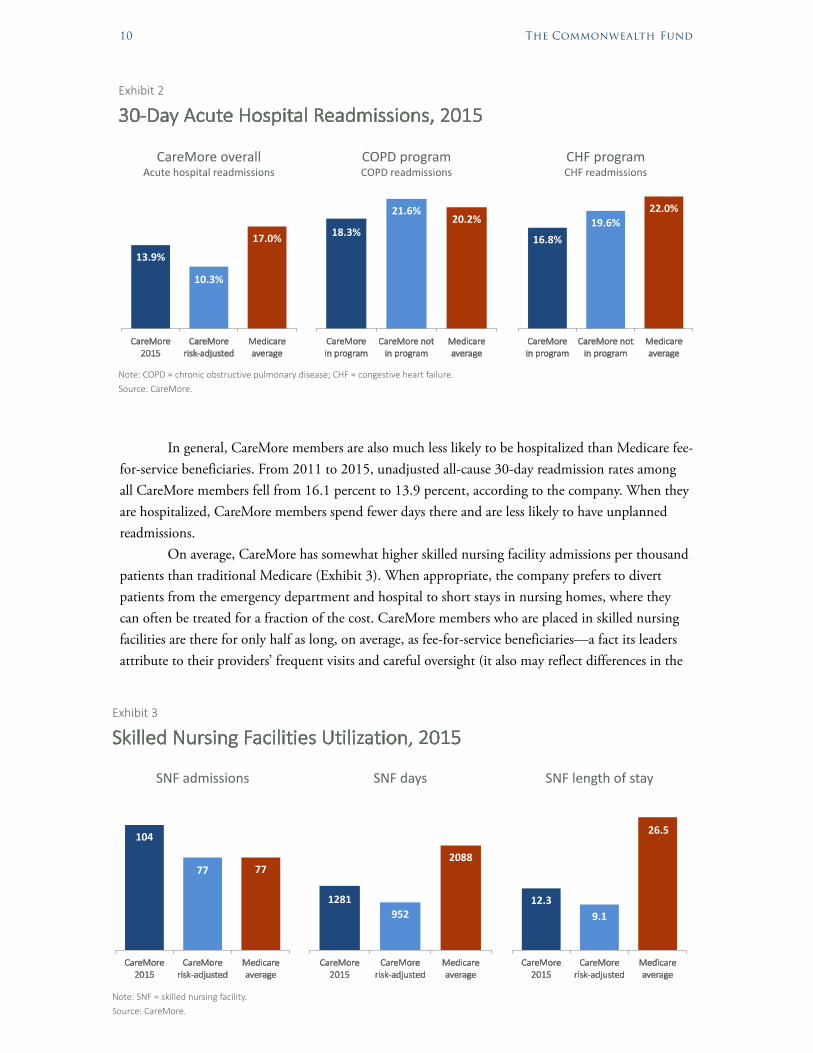
CareMore has seen similar results from careful management of patients with congestive heart failure and chronic obstructive pulmonary disease (COPD). Patients in the heart failure program receive wireless scales that alert clinicians about rapid weight gain. Same-day appointments are available to quickly address concerns. Patients with COPD and heart failure receive ongoing help with medica-tion management and coaching from nurse practitioners and dieticians in effective self-care. In 2015, readmissions for patients receiving these services were lower than compa-rable Medicare beneficiaries in the fee-for-service program (Exhibit 2).
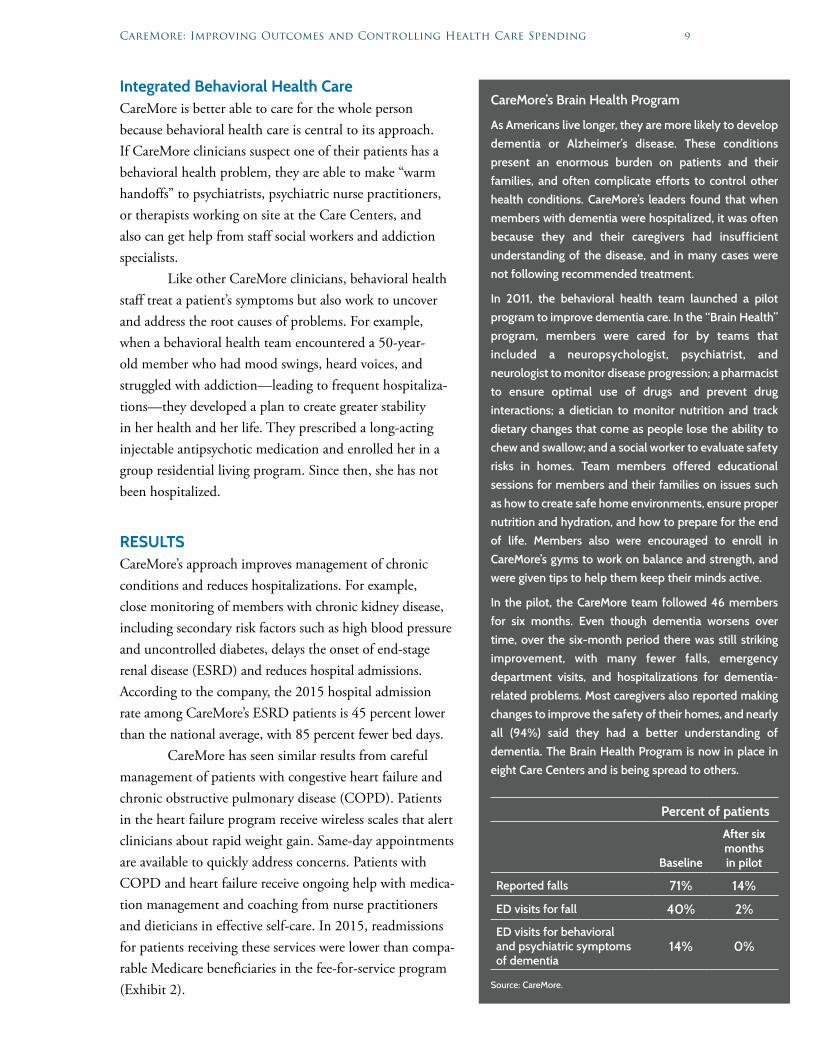
CareMore’s Brain Health Program
As Americans live longer, they are more likely to develop
dementia or Alzheimer’s disease. These conditions
present an enormous burden on patients and their
families, and often complicate efforts to control other
health conditions. CareMore’s leaders found that when
members with dementia were hospitalized, it was often
because they and their caregivers had insufficient
understanding of the disease, and in many cases were
not following recommended treatment.
In 2011, the behavioral health team launched a pilot
program to improve dementia care. In the “Brain Health”
program, members were cared for by teams that
included a neuropsychologist, psychiatrist, and
neurologist to monitor disease progression; a pharmacist
to ensure optimal use of drugs and prevent drug
interactions; a dietician to monitor nutrition and track
dietary changes that come as people lose the ability to
chew and swallow; and a social worker to evaluate safety
risks in homes. Team members offered educational
sessions for members and their families on issues such
as how to create safe home environments, ensure proper
nutrition and hydration, and how to prepare for the end
of life. Members also were encouraged to enroll in
CareMore’s gyms to work on balance and strength, and
were given tips to help them keep their minds active.
In the pilot, the CareMore team followed 46 members
for six months. Even though dementia worsens over
time, over the six-month period there was still striking
improvement, with many fewer falls, emergency
department visits, and hospitalizations for dementia-
related problems. Most caregivers also reported making
changes to improve the safety of their homes, and nearly
all (94%) said they had a better understanding of
dementia. The Brain Health Program is now in place in
eight Care Centers and is being spread to others.
Percent of patients
Baseline
After six months in pilot
Reported falls 71% 14%
ED visits for fall 40% 2%
ED visits for behavioral and psychiatric symptoms of dementia
14% 0%
Source: CareMore.
10 The Commonwealth Fund
In general, CareMore members are also much less likely to be hospitalized than Medicare fee-for-service beneficiaries. From 2011 to 2015, unadjusted all-cause 30-day readmission rates among all CareMore members fell from 16.1 percent to 13.9 percent, according to the company. When they are hospitalized, CareMore members spend fewer days there and are less likely to have unplanned readmissions.
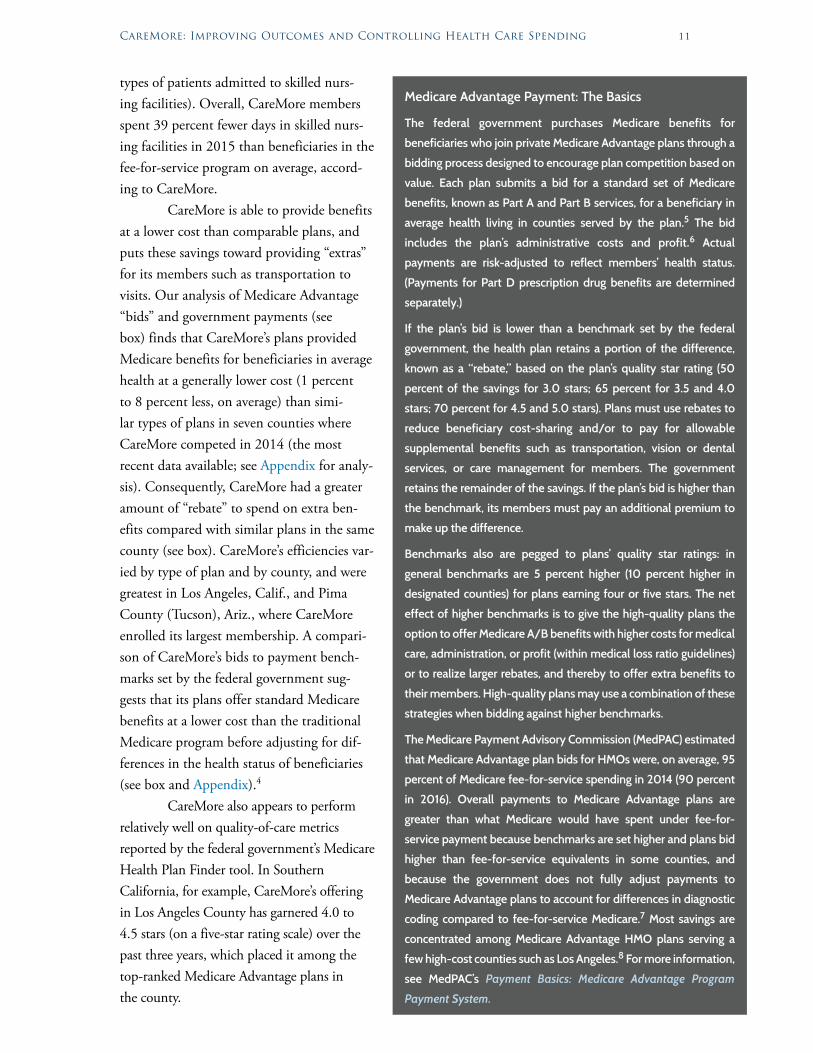
On average, CareMore has somewhat higher skilled nursing facility admissions per thousand patients than traditional Medicare (Exhibit 3). When appropriate, the company prefers to divert patients from the emergency department and hospital to short stays in nursing homes, where they can often be treated for a fraction of the cost. CareMore members who are placed in skilled nursing facilities are there for only half as long, on average, as fee-for-service beneficiaries—a fact its leaders attribute to their providers’ frequent visits and careful oversight (it also may reflect differences in the
30-DayAcuteHospitalReadmissions,2015Exhibit2
13.9%
10.3%
17.0%
CareMore2015
CareMorerisk-adjusted
Medicareaverage
CareMore overallAcutehospitalreadmissions
18.3%
21.6%20.2%
CareMoreinprogram
CareMorenotinprogram
Medicareaverage
COPDprogramCOPDreadmissions
16.8%19.6%
22.0%
CareMoreinprogram
CareMorenotinprogram
Medicareaverage
CHFprogramCHFreadmissions
Note:COPD=chronicobstructivepulmonarydisease;CHF=congestiveheartfailure.Source:CareMore.
SkilledNursingFacilitiesUtilization,2015Exhibit3
104
77 77
CareMore2015
CareMorerisk-adjusted
Medicareaverage
SNFadmissions
1281952
2088
CareMore2015
CareMorerisk-adjusted
Medicareaverage
SNFdays
12.39.1
26.5
CareMore2015
CareMorerisk-adjusted
Medicareaverage
SNFlengthofstay
Note:SNF=skillednursingfacility.Source:CareMore.
CareMore: Improving Outcomes and Controlling Health Care Spending 11
types of patients admitted to skilled nurs-ing facilities). Overall, CareMore members spent 39 percent fewer days in skilled nurs-ing facilities in 2015 than beneficiaries in the fee-for-service program on average, accord-ing to CareMore.
CareMore is able to provide benefits at a lower cost than comparable plans, and puts these savings toward providing “extras” for its members such as transportation to visits. Our analysis of Medicare Advantage “bids” and government payments (see box) finds that CareMore’s plans provided Medicare benefits for beneficiaries in average health at a generally lower cost (1 percent to 8 percent less, on average) than simi-lar types of plans in seven counties where CareMore competed in 2014 (the most recent data available; see Appendix for analy-sis). Consequently, CareMore had a greater amount of “rebate” to spend on extra ben-efits compared with similar plans in the same county (see box). CareMore’s efficiencies var-ied by type of plan and by county, and were greatest in Los Angeles, Calif., and Pima County (Tucson), Ariz., where CareMore enrolled its largest membership. A compari-son of CareMore’s bids to payment bench-marks set by the federal government sug-gests that its plans offer standard Medicare benefits at a lower cost than the traditional Medicare program before adjusting for dif-ferences in the health status of beneficiaries (see box and Appendix).4
CareMore also appears to perform relatively well on quality-of-care metrics reported by the federal government’s Medicare Health Plan Finder tool. In Southern California, for example, CareMore’s offering in Los Angeles County has garnered 4.0 to 4.5 stars (on a five-star rating scale) over the past three years, which placed it among the top-ranked Medicare Advantage plans in the county.
Medicare Advantage Payment: The Basics
The federal government purchases Medicare benefits for
beneficiaries who join private Medicare Advantage plans through a
bidding process designed to encourage plan competition based on
value. Each plan submits a bid for a standard set of Medicare
benefits, known as Part A and Part B services, for a beneficiary in
average health living in counties served by the plan.5 The bid
includes the plan’s administrative costs and profit.6 Actual
payments are risk-adjusted to reflect members’ health status.
(Payments for Part D prescription drug benefits are determined
separately.)
If the plan’s bid is lower than a benchmark set by the federal
government, the health plan retains a portion of the difference,
known as a “rebate,” based on the plan’s quality star rating (50
percent of the savings for 3.0 stars; 65 percent for 3.5 and 4.0
stars; 70 percent for 4.5 and 5.0 stars). Plans must use rebates to
reduce beneficiary cost-sharing and/or to pay for allowable
supplemental benefits such as transportation, vision or dental
services, or care management for members. The government
retains the remainder of the savings. If the plan’s bid is higher than
the benchmark, its members must pay an additional premium to
make up the difference.
Benchmarks also are pegged to plans’ quality star ratings: in
general benchmarks are 5 percent higher (10 percent higher in
designated counties) for plans earning four or five stars. The net
effect of higher benchmarks is to give the high-quality plans the
option to offer Medicare A/B benefits with higher costs for medical
care, administration, or profit (within medical loss ratio guidelines)
or to realize larger rebates, and thereby to offer extra benefits to
their members. High-quality plans may use a combination of these
strategies when bidding against higher benchmarks.
The Medicare Payment Advisory Commission (MedPAC) estimated
that Medicare Advantage plan bids for HMOs were, on average, 95
percent of Medicare fee-for-service spending in 2014 (90 percent
in 2016). Overall payments to Medicare Advantage plans are
greater than what Medicare would have spent under fee-for-
service payment because benchmarks are set higher and plans bid
higher than fee-for-service equivalents in some counties, and
because the government does not fully adjust payments to
Medicare Advantage plans to account for differences in diagnostic
coding compared to fee-for-service Medicare.7 Most savings are
concentrated among Medicare Advantage HMO plans serving a
few high-cost counties such as Los Angeles.8 For more information,
see MedPAC’s Payment Basics: Medicare Advantage Program
Payment System.
12 The Commonwealth Fund
SPREADING THE MODELCareMore’s model for managing and coordinating care for Medicare beneficiaries is possible because the company can leverage risk-adjusted capitated payments to offer intensive, flexible services. “Risk adjustment is frankly the fuel that we need for our clinical model, which is so focused on the frail elderly, people with chronic disease who need differentiated care delivery models,” says Sachin H. Jain, M.D., CareMore’s CEO.
This approach worked well until the federal government changed its risk adjustment methodol-ogy and reduced payments to Medicare Advantage plans out of concern plans were gaming the system.9 The declining reimbursement, which has made it more difficult to offer supplemental services to its high-needs members, led CareMore to develop new business lines. Under the banner of Anthem, Inc., which acquired CareMore in 2011, it is spreading the model to Medicaid beneficiaries in Tennessee and Iowa. And it entered into the competitive market of partnering with health systems to help them suc-ceed in risk-based contracts that depend on reducing utilization and improving health outcomes.
Spreading the CareMore Approach to Medicaid BeneficiariesSince January 2015, CareMore has been serving 42,645 Medicaid beneficiaries in Memphis, Tenn., including 6,413 who qualify for the program under the category of aged, blind, and disabled. For 14,400 of the Tennessee beneficiaries, CareMore is providing direct primary care through its Care Centers as well as care management services. This expanded model proved necessary because there was insufficient primary care capacity in some of the neighborhoods it serves. For the remaining members, CareMore provides supplemental services to high-needs patients.
While the Memphis approach is similar to the model CareMore uses for Medicare beneficia-ries—proactive chronic disease management and use of nurse practitioners in care teams—there is a much greater need to reach out to Medicaid members and engage them in their care. According to CareMore, Memphis members have almost twice as many emergency department visits (1,936 visits per thousand) than the state’s Medicaid population as a whole (891 visits per thousand), which the company attributes to the high prevalence of chronic conditions and behavioral health needs, as well as social challenges tied to poverty.
The Memphis team is taking several approaches to engage members. Three navigators work at each of the three Care Centers, trying to reach members by telephone and encourage them to come in for a visit. A community relations manager visits churches and schools, and clinicians make rounds at public housing complexes to offer health screenings and free flu shots to help spread the word about CareMore’s services. The Care Centers also offer extended and weekend hours, same-day appointments, and drop-in appointments for minor services such as wound care. Amerigroup, the Anthem subsidiary that runs the Medicaid plan, also alerts CareMore when one of its members visits an emergency department, giving staff members a chance to engage members while they wait to be seen there.
The 6,413 aged, blind, and disabled beneficiaries are the linchpin to making the Medicaid venture viable, because their greater use of services and correspondingly higher spending produces greater opportunities for savings. With those savings, CareMore is expecting to break even in two years. But the larger opportunity, leaders say, is in serving as a neighborhood resource for residents who have grown to distrust the care system and in some cases given up on their own health.
One challenge to spreading this model is that the company lacks longitudinal data on dis-ease prevalence and the impact of different interventions in the Medicaid population—data that’s
CareMore: Improving Outcomes and Controlling Health Care Spending 13
necessary to set performance expectations in a new market. “One of the biggest tools in our Medicare replication efforts is that every market measured the same metrics and published them so that every-one understands what outcomes are expected for all patients, in all disease categories. With Medicaid we’re managing adolescents for the first time, so we don’t know exactly what the norms are,” says Leeba Lessin, the company’s former CEO, who is now a consultant to the company.
Spreading the CareMore Approach to Health SystemsIn 2014, CareMore entered into a partnership with Atlanta’s Emory Health System to implement its care model among Emory patients enrolled in Medicare Advantage plans for whom Emory assumes financial risk. CareMore is training Emory clinicians in its approach to care management, serving as a consultant, and also sharing in financial risk and potential savings. “Health systems are looking for a way out of fee-for-service,” says Margaret Marcus, former vice president for clinical program develop-ment. “Because of this, a lot of opportunity opened up.” This approach allows CareMore to spread its model without hiring new staff and creating new facilities from the ground up.
An analysis of the program found that the readmission rate for patients who were seen by an extensivist physician was 8.9 percent (by contrast, the rate among all patients treated at Emory University Hospital is no different than the national rate of 15.6%).10
Still, as CareMore grows, it faces several challenges in building on its early success, as dis-cussed below.
CHALLENGES
Changing Clinical CulturesAs CareMore has branched into different markets, it has encountered some opposition to its model from physicians, health system leaders, and others whose ways of working may be disrupted by the company’s approach. To succeed in new markets, CareMore first seeks to earn the trust and support of the primary care physicians in its network so it has a critical mass of patients to serve. In some cases, PCPs have been reluctant to refer their patients to Care Centers—even though they don’t lose financially for doing so. Some may be concerned about further fragmenting primary care services. Others are hesitant to cede control to lower-level clinicians, Gadhe says, but tend to be convinced over time. “Once they have about 40 or 50 patients, they start realizing, ‘Okay, wow. I’m not seeing very many complex patients but my patients are doing better. They’re having better clinical outcomes. I’m having more time to expand my practice.’”
But this strategy doesn’t always work. In Arizona, for instance, CareMore has found greater success in Tucson than in Phoenix. In Tucson, the health plan was able to partner with a large inte-grated delivery system (Carondolet Health System), which offered an established physician network. It also helped that Tucson is a relatively small, tight-knit community where word about the CareMore model spread quickly, says Dan Peterson, senior general manager for CareMore’s central region. But without similar relationships with hospitals in the more competitive and sprawling Phoenix market, it was difficult for the company to refer members to facilities staffed by their extensivists. “When patients go to hospitals that are not manned by our extensivists, then the model falls apart,” says Peterson. Engaging specialists is also important—particularly in academic medical centers, which tend to be specialty-driven.
14 The Commonwealth Fund
Hiring and Training Staff Willing to Challenge the Status QuoIn addition to finding like-minded clinical partners, CareMore has had to refine its approach to recruiting and training staff to focus on changing practice patterns. Initially, new staff members learned by shadowing mentors, but as CareMore grew it found it needed more formal training meth-ods, including a CareMore Academy where all new staff members come together for case-based learn-ing and role-playing in teams. The approach, Marcus says, is to build on people’s enthusiasm for help-ing patients—something they look for when recruiting—by teaching the particular skills they’ll need to work in CareMore teams. “If they’re an extensivist, they need to be able to manage the specialists, for example, and if they’re a case manager they need to be able to make decisions on where the best care is provided,” she says.
“Through our training programs, we push our clinical staff to constantly question prevailing wisdom in the search for better patient care. Do certain types of care really require physician input or can care be safely delivered by a medical assistant? Does every patient with chest pain truly require a cardiology consult?” Jain says.
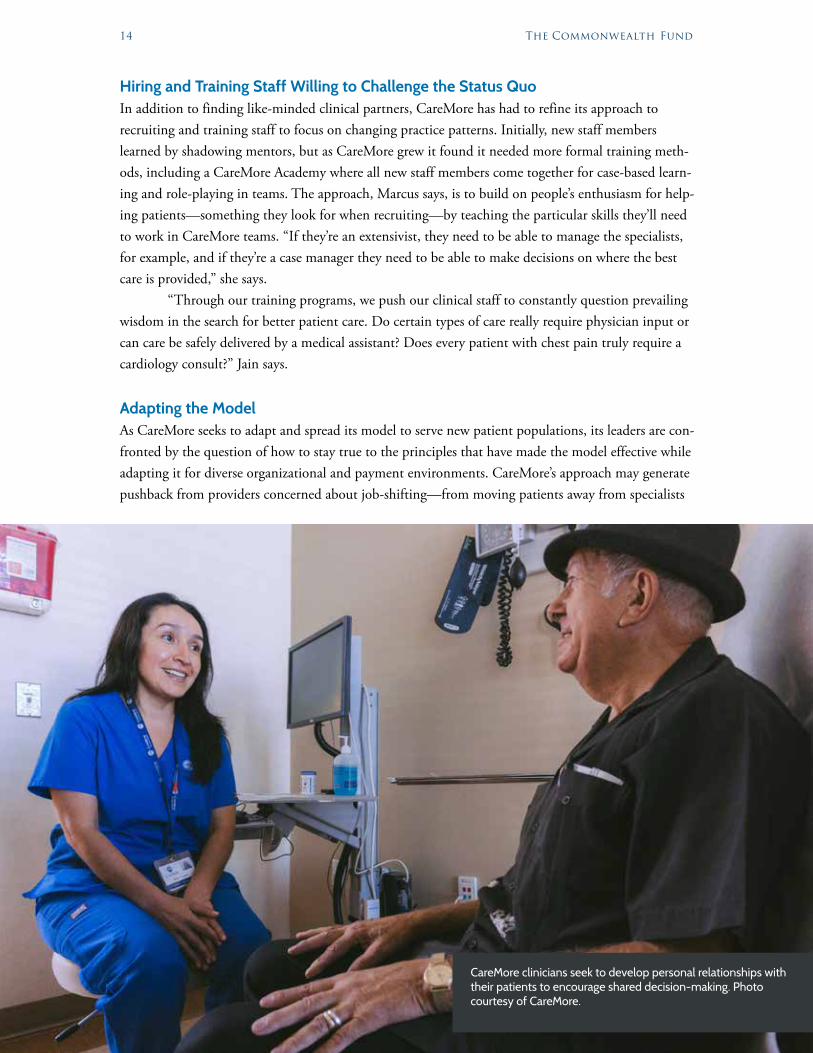
Adapting the ModelAs CareMore seeks to adapt and spread its model to serve new patient populations, its leaders are con-fronted by the question of how to stay true to the principles that have made the model effective while adapting it for diverse organizational and payment environments. CareMore’s approach may generate pushback from providers concerned about job-shifting—from moving patients away from specialists
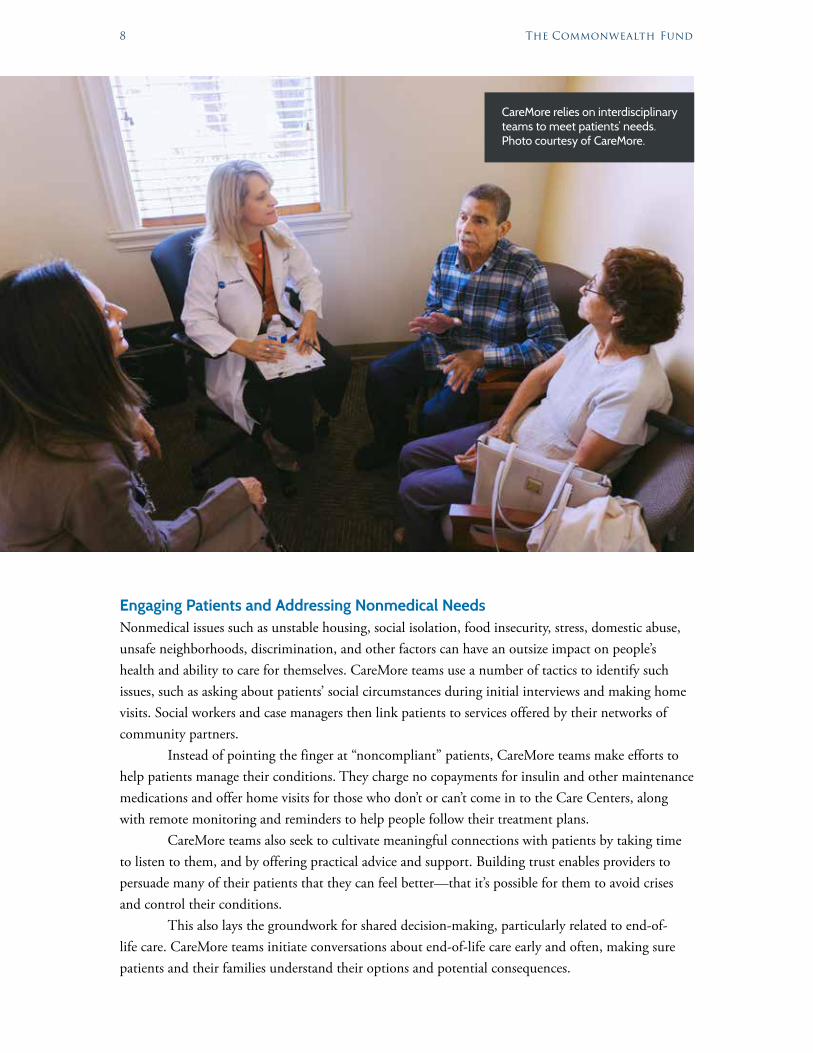
CareMore clinicians seek to develop personal relationships with their patients to encourage shared decision-making. Photo courtesy of CareMore.
CareMore: Improving Outcomes and Controlling Health Care Spending 15
and acute care toward lower-cost clinicians and outpatient care settings. The company has had dif-ficulty in places like Tennessee where scope-of-practice regulations limit what midlevel providers can do. In academic health systems, it may be important to create reimbursement models that include specialists and other providers in sharing the risk for total costs—as well as rewards for savings.
More broadly, CareMore faces an uphill battle to spread its model in a health system still dom-inated by fee-for-service reimbursement. But leaders of health systems such as Emory have approached CareMore precisely because they see the industry moving beyond paying for services to holistically managing patients, says Anthony Nguyen, M.D., former regional medical officer for provider col-laboration. “They want to be responsible and accountable for all those other aspects,” he says, naming social services, preventive care, patient and family education, and proactive end-of-life discussions.
CONCLUSIONAs these challenges suggest, spreading the CareMore model and achieving savings on a national scale may depend on the willingness of the country’s health systems and providers to reconsider their roles—to focus more attention on keeping patients out of hospitals, reduce dependence on some types of specialty care that could be provided by primary care physicians, and assign some of their duties to midlevel providers and medical assistants. Even institutions that have committed to accountable care contracts have difficulty challenging providers to change practice patterns, Lessin says. It’s part of the reason that Jain, when he was chief medical officer, was actively involved in hiring every new CareMore physician. “I want someone who can ask hard questions and push limits,” he says.
16 The Commonwealth Fund
APPENDIX. Medicare Advantage Payment Analysis
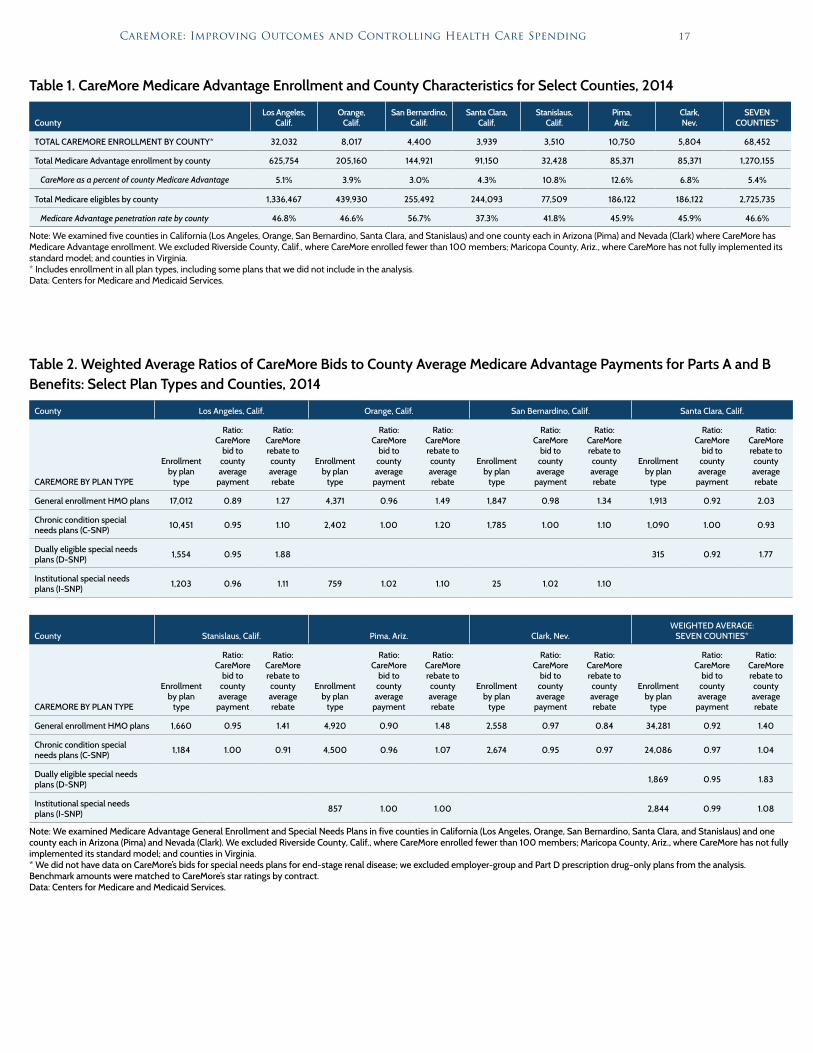
We compared CareMore’s 2014 Medicare Advantage plan bids to the government’s average payments for Parts A and B benefits made to Medicare Advantage plans of the same type in seven counties where CareMore competed in 2014 (Table 1).11 We also compared CareMore’s rebates to average rebate amounts for plans of the same type in these counties. These amounts are publicly reported by the federal government for beneficiaries in average health, allowing standardized comparisons without considering differences in actual health burden among plans’ enrolled populations. We made these comparisons for Medicare Advantage health maintenance organization (HMO) general enrollment plans and special needs plans (SNPs) for beneficiaries who have certain chronic conditions (C-SNPs), need long-term institutional care (I-SNPs), or are dually eligible for Medicare and Medicaid (D-SNPs).12
The relative efficiency of CareMore’s plans—as measured by the ratio of its plan bids to comparable county average Medicare Advantage plan bids for Medicare Parts A and B benefits for average-risk enrollees—varied by type of plan and county and was greatest where CareMore had its largest enrollments (Table 2).13 Rolling up these ratios across all seven counties, the average “cost” to the government of CareMore’s Parts A and B benefits (weighted by county membership) was 8 per-cent lower for its HMO plans, 5 percent lower for its D-SNP plans, 3 percent lower for its C-SNP plans, and 1 percent lower for its I-SNP plans compared with average county payments to Medicare Advantage plans of the same type (Table 2).14
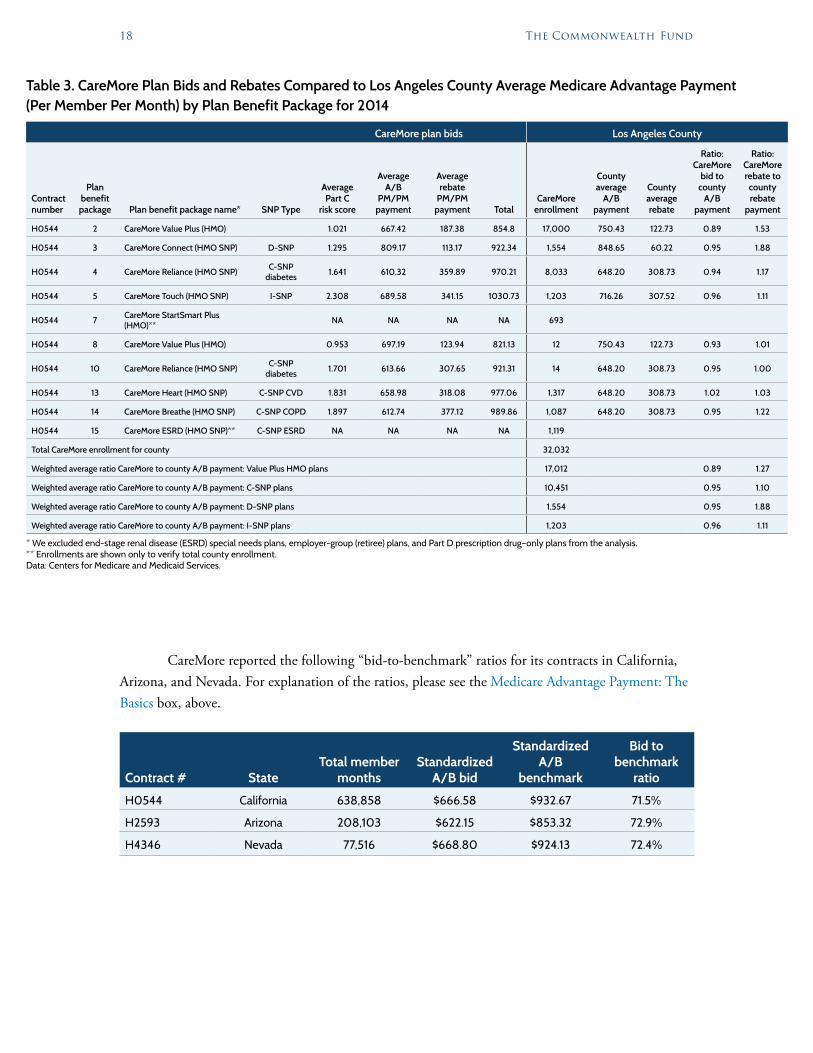
• In Los Angeles County—where CareMore had its largest enrollment of 17,000 members in its HMO product in 2014—the government paid CareMore 11 percent less than the average payment to Medicare Advantage HMO plans for Medicare Parts A and B benefits ($667 vs. $750 per member per month before risk adjustment; Table 3). Consequently, the value of extra benefits offered by CareMore (as reflected in its rebate) was 50 percent greater than the average rebate for HMO plans in the county ($187 vs. $123 per member per month).
• CareMore’s special needs plans in Los Angeles County, which enrolled roughly 13,000 mem-bers in 2014, were paid from 4 percent to 5 percent less, on average, than corresponding county average payments for Parts A and B benefits to Medicare Advantage plans of the same type. The value of CareMore’s extra benefits (rebates) was 10 percent to 88 percent greater than the corresponding county averages for these special needs plans, on average.
• In Pima County (Tucson), Ariz., where CareMore enrolled its second-largest county mem-bership (10,000 in all plan types) in 2014, CareMore realized efficiencies that were roughly similar to what it achieved in Los Angeles County (Table 2).
• CareMore’s efficiency relative to other plans was typically not as great in counties where it had smaller enrollments and, because of lack of scale, relatively higher cost per member of running and operating its Care Centers. For example, the government paid CareMore 2 percent less than the county average for Medicare Advantage HMO plans in San Bernardino County, Calif., east of Los Angeles, where CareMore enrolled 1,800 HMO mem-bers in 2014.
CareMore: Improving Outcomes and Controlling Health Care Spending 17
Table 1. CareMore Medicare Advantage Enrollment and County Characteristics for Select Counties, 2014
CountyLos Angeles,
Calif.Orange,
Calif.San Bernardino,
Calif.Santa Clara,
Calif.Stanislaus,
Calif.Pima, Ariz.
Clark, Nev.
SEVEN COUNTIES*
TOTAL CAREMORE ENROLLMENT BY COUNTY* 32,032 8,017 4,400 3,939 3,510 10,750 5,804 68,452
Total Medicare Advantage enrollment by county 625,754 205,160 144,921 91,150 32,428 85,371 85,371 1,270,155
CareMore as a percent of county Medicare Advantage 5.1% 3.9% 3.0% 4.3% 10.8% 12.6% 6.8% 5.4%
Total Medicare eligibles by county 1,336,467 439,930 255,492 244,093 77,509 186,122 186,122 2,725,735
Medicare Advantage penetration rate by county 46.8% 46.6% 56.7% 37.3% 41.8% 45.9% 45.9% 46.6%
Note: We examined five counties in California (Los Angeles, Orange, San Bernardino, Santa Clara, and Stanislaus) and one county each in Arizona (Pima) and Nevada (Clark) where CareMore has Medicare Advantage enrollment. We excluded Riverside County, Calif., where CareMore enrolled fewer than 100 members; Maricopa County, Ariz., where CareMore has not fully implemented its standard model; and counties in Virginia. * Includes enrollment in all plan types, including some plans that we did not include in the analysis. Data: Centers for Medicare and Medicaid Services.
Table 2. Weighted Average Ratios of CareMore Bids to County Average Medicare Advantage Payments for Parts A and B Benefits: Select Plan Types and Counties, 2014
County Los Angeles, Calif. Orange, Calif. San Bernardino, Calif. Santa Clara, Calif.
CAREMORE BY PLAN TYPE
Enrollment by plan
type
Ratio: CareMore
bid to county average
payment
Ratio: CareMore rebate to county average rebate
Enrollment by plan
type
Ratio: CareMore
bid to county average
payment
Ratio: CareMore rebate to county average rebate
Enrollment by plan
type
Ratio: CareMore
bid to county average
payment
Ratio: CareMore rebate to county average rebate
Enrollment by plan
type
Ratio: CareMore
bid to county average
payment
Ratio: CareMore rebate to county average rebate
General enrollment HMO plans 17,012 0.89 1.27 4,371 0.96 1.49 1,847 0.98 1.34 1,913 0.92 2.03
Chronic condition special needs plans (C-SNP) 10,451 0.95 1.10 2,402 1.00 1.20 1,785 1.00 1.10 1,090 1.00 0.93
Dually eligible special needs plans (D-SNP) 1,554 0.95 1.88 315 0.92 1.77
Institutional special needs plans (I-SNP) 1,203 0.96 1.11 759 1.02 1.10 25 1.02 1.10
County Stanislaus, Calif. Pima, Ariz. Clark, Nev.WEIGHTED AVERAGE:
SEVEN COUNTIES*
CAREMORE BY PLAN TYPE
Enrollment by plan
type
Ratio: CareMore
bid to county average
payment
Ratio: CareMore rebate to
county average rebate
Enrollment by plan
type
Ratio: CareMore
bid to county average
payment
Ratio: CareMore rebate to
county average rebate
Enrollment by plan
type
Ratio: CareMore
bid to county average
payment
Ratio: CareMore rebate to
county average rebate
Enrollment by plan
type
Ratio: CareMore
bid to county average
payment
Ratio: CareMore rebate to
county average rebate
General enrollment HMO plans 1,660 0.95 1.41 4,920 0.90 1.48 2,558 0.97 0.84 34,281 0.92 1.40
Chronic condition special needs plans (C-SNP) 1,184 1.00 0.91 4,500 0.96 1.07 2,674 0.95 0.97 24,086 0.97 1.04
Dually eligible special needs plans (D-SNP) 1,869 0.95 1.83
Institutional special needs plans (I-SNP) 857 1.00 1.00 2,844 0.99 1.08
Note: We examined Medicare Advantage General Enrollment and Special Needs Plans in five counties in California (Los Angeles, Orange, San Bernardino, Santa Clara, and Stanislaus) and one county each in Arizona (Pima) and Nevada (Clark). We excluded Riverside County, Calif., where CareMore enrolled fewer than 100 members; Maricopa County, Ariz., where CareMore has not fully implemented its standard model; and counties in Virginia.* We did not have data on CareMore’s bids for special needs plans for end-stage renal disease; we excluded employer-group and Part D prescription drug–only plans from the analysis. Benchmark amounts were matched to CareMore’s star ratings by contract.Data: Centers for Medicare and Medicaid Services.
18 The Commonwealth Fund
Table 3. CareMore Plan Bids and Rebates Compared to Los Angeles County Average Medicare Advantage Payment (Per Member Per Month) by Plan Benefit Package for 2014
CareMore plan bids Los Angeles County
Contract number
Plan benefit package Plan benefit package name* SNP Type
Average Part C
risk score
Average A/B
PM/PM payment
Average rebate
PM/PM payment Total
CareMore enrollment
County average
A/B payment
County average rebate
Ratio: CareMore
bid to county
A/B payment
Ratio: CareMore rebate to
county rebate
payment
H0544 2 CareMore Value Plus (HMO) 1.021 667.42 187.38 854.8 17,000 750.43 122.73 0.89 1.53
H0544 3 CareMore Connect (HMO SNP) D-SNP 1.295 809.17 113.17 922.34 1,554 848.65 60.22 0.95 1.88
H0544 4 CareMore Reliance (HMO SNP) C-SNP diabetes 1.641 610.32 359.89 970.21 8,033 648.20 308.73 0.94 1.17
H0544 5 CareMore Touch (HMO SNP) I-SNP 2.308 689.58 341.15 1030.73 1,203 716.26 307.52 0.96 1.11
H0544 7 CareMore StartSmart Plus (HMO)** NA NA NA NA 693
H0544 8 CareMore Value Plus (HMO) 0.953 697.19 123.94 821.13 12 750.43 122.73 0.93 1.01
H0544 10 CareMore Reliance (HMO SNP) C-SNP diabetes 1.701 613.66 307.65 921.31 14 648.20 308.73 0.95 1.00
H0544 13 CareMore Heart (HMO SNP) C-SNP CVD 1.831 658.98 318.08 977.06 1,317 648.20 308.73 1.02 1.03
H0544 14 CareMore Breathe (HMO SNP) C-SNP COPD 1.897 612.74 377.12 989.86 1,087 648.20 308.73 0.95 1.22
H0544 15 CareMore ESRD (HMO SNP)** C-SNP ESRD NA NA NA NA 1,119
Total CareMore enrollment for county 32,032
Weighted average ratio CareMore to county A/B payment: Value Plus HMO plans 17,012 0.89 1.27
Weighted average ratio CareMore to county A/B payment: C-SNP plans 10,451 0.95 1.10
Weighted average ratio CareMore to county A/B payment: D-SNP plans 1,554 0.95 1.88
Weighted average ratio CareMore to county A/B payment: I-SNP plans 1,203 0.96 1.11
* We excluded end-stage renal disease (ESRD) special needs plans, employer-group (retiree) plans, and Part D prescription drug–only plans from the analysis.** Enrollments are shown only to verify total county enrollment.Data: Centers for Medicare and Medicaid Services.
CareMore reported the following “bid-to-benchmark” ratios for its contracts in California, Arizona, and Nevada. For explanation of the ratios, please see the Medicare Advantage Payment: The Basics box, above.
Contract # StateTotal member
monthsStandardized
A/B bid
Standardized A/B
benchmark
Bid to benchmark
ratio
H0544 California 638,858 $666.58 $932.67 71.5%
H2593 Arizona 208,103 $622.15 $853.32 72.9%
H4346 Nevada 77,516 $668.80 $924.13 72.4%
CareMore: Improving Outcomes and Controlling Health Care Spending 19
Notes1 Thirty-one percent of members meet the qualification for low-income subsidies under Medicare’s Part D
Prescription Drug Program (i.e., have an income of $16,278 for individuals or less and limited assets).2 In Southern California, CareMore employs its own cardiologists, pulmonologists, and dermatologists. As
membership grows, CareMore may consider moving toward employed subspecialists in other markets.3 Source for data on nontraumatic lower extremity amputation rate among CareMore members is from
CareMore, 2013; rate is per thousand members per year, excluding individuals with end-stage renal disease. Source for data on nontraumatic lower extremity amputation rate among Medicare FFS beneficiaries is from S. Kuo, B. B. Fleming, N. S. Gittings et al., “Trends in Care Practices and Outcomes Among Medicare Beneficiaries with Diabetes,” American Journal of Preventive Medicine, Dec. 2005 29(5):396–403.
4 It is difficult to ascertain the actual plan-level savings to Medicare because of differences in diagnostic cod-ing by Medicare Advantage plans compared with fee-for-service Medicare; see General Accounting Office, Medicare Advantage: Substantial Excess Payments Underscore Need for CMS to Improve Accuracy of Risk Score Adjustments (GAO, Jan. 2013); Medicare Payment Advisory Commission, Report to the Congress: Medicare Payment Policy (MedPAC, March 2014); and Medicare Payment Advisory Commission, Report to the Congress: Medicare Payment Policy (MedPAC, March 2016).
5 Medicare Advantage special needs plans may be required, or in some cases allowed flexibility, to design bene-fit packages that go beyond Parts A and B benefits to meet the special needs of their populations; see Centers for Medicare and Medicaid Services, “Special Needs Plans (SNP) Frequently Asked Questions (FAQs)” (CMS, n.d.).
6 MedPAC reported that Medicare Advantage HMO plan bids for 2014 included a profit margin of 5 percent and administrative costs of 11 percent, on average. See Medicare Payment Advisory Commission, Report to the Congress: Medicare Payment Policy (MedPAC, March 2014).
7 Medicare Payment Advisory Commission, Report to the Congress: Medicare Payment Policy (MedPAC, March 2014); Medicare Payment Advisory Commission, Report to the Congress: Medicare Payment Policy (MedPAC, March 2016); and General Accounting Office, Medicare Advantage: Substantial Excess Payments Underscore Need for CMS to Improve Accuracy of Risk Score Adjustments (GAO, Jan. 2013).
8 B. Biles, G. Casillas, and S. Guterman, Does Medicare Advantage Cost Less Than Traditional Medicare? (The Commonwealth Fund, Jan. 2016).
9 R. Kronick and W. P. Welch, “Measuring Coding Intensity in the Medicare Advantage Program,” Medicare & Medicaid Research Review, published online July 17, 2014.
10 S. Jain, M. M. E. Johns, and J. S. Lewin, “One Path to Value-Based Care for Academic Medical Centers,” NEJM Catalyst, published online Sept. 12, 2016. For hospitalwide results from Emory University Hospital, see Medicare.gov’s Hospital Compare tool at https://www.medicare.gov/hospitalcompare/profile.html#profTab=4&ID=110010&Distn=6.3&dist=25&lat=33.7489954&lng=-84.3879824&cmprDist=6.3.
11 We examined five counties in California (Los Angeles, Orange, San Bernardino, Santa Clara, and Stanislaus) and one county each in Arizona (Pima) and Nevada (Clark) where CareMore enrolls Medicare Advantage members. We excluded Riverside County, Calif., where CareMore enrolled less than 100 members in 2014; Maricopa County, Ariz., where CareMore had not fully implemented its standard model; and counties in Virginia.
12 We did not have data on CareMore’s bids for special needs plans for end-stage renal disease; we excluded employer-group and Part D prescription drug–only plans from the analysis.
20 The Commonwealth Fund
13 Payments to CareMore are included in county averages, but its membership accounted for only a small share (from 2 percent to 13 percent) of total Medicare Advantage enrollment in these counties (Table 1). Counties served by CareMore tended to be highly penetrated by Medicare Advantage, which accounted for 37 percent to 57 percent of all Medicare beneficiaries in these counties, compared to a national average of 30 percent in 2014.
14 CareMore’s bids for C-SNP plans for cardiovascular conditions mostly exceeded county average Parts A and B payments to all C-SNP plans, while its bids for C-SNP plans for diabetes were mostly lower than corresponding county average payments for all C-SNP plans. We were not able to examine payments by type of chronic condi-tion SNP. Therefore, we report on the experience of all C-SNP plans together. Smaller enrollments for SNPs make these comparisons less reliable than for general enrollment HMO plans.
CareMore: Improving Outcomes and Controlling Health Care Spending 21
About the Authors
Martha Hostetter, M.F.A., is a writer, editor, and partner in Pear Tree Communications. She was a member of The Commonwealth Fund’s communications department from June 2002 to April 2005, serving as the associate editor and then creating the position of Web editor. She is currently a consulting writer and editor for the Fund. Ms. Hostetter has an M.F.A. from Yale University and a B.A. from the University of Pennsylvania.
Sarah Klein is editor of Transforming Care, a quarterly publication of The Commonwealth Fund that focuses on innovative efforts to transform health care delivery. She has written about health care for more than 15 years as a reporter for publications including Crain’s Chicago Business and American Medical News. Ms. Klein received a B.A. from Washington University in St. Louis and attended the Graduate School of Journalism at the University of California at Berkeley.
Douglas McCarthy, M.B.A., is senior research director for The Commonwealth Fund. He oversees The Commonwealth Fund’s scorecard project, conducts case-study research on delivery system reforms and innovations, and serves as a contributing editor to the Fund’s bimonthly newsletter Transforming Care. His 30-year career has spanned research, policy, operations, and consulting roles for government, corporate, academic, nonprofit, and philanthropic organiza-tions. He has authored and coauthored reports and peer-reviewed articles on a range of health care–related topics, including more than 50 case studies of high-performing organizations and initiatives. Mr. McCarthy received his bachelor’s degree with honors from Yale College and a master’s degree in health care management from the University of Connecticut. He was a public policy fellow at the Hubert H. Humphrey School of Public Affairs at the University of Minnesota during 1996–1997, and a leadership fellow of the Denver-based Regional Institute for Health and Environmental Leadership during 2013–2014. He serves on the board of Colorado’s Center for Improving Value in Health Care.
Acknowledgments
The authors gratefully acknowledge the following current and former CareMore staff who gener-ously shared information and insights: Heather Del Villar, C.N.P.; Balu Gadhe, M.D.; Sachin H. Jain, M.D.; Leeba Lessin; Scott Mancuso, M.D.; George Mangle, M.D.; Margaret Marcus; Zachary Myers; Anthony Nguyen, M.D; Dan Peterson; James Pratty, M.D.; Alicia Smith-Steele; and Sheldon Zinberg, M.D. The authors are grateful to Shawn Bishop, vice president for The Commonwealth Fund’s Controlling Health Care Costs and Advancing Medicare programs, for guidance in conducting the Medicare Advantage pricing analysis. The authors thank the Fund’s communications staff for editorial support and layout. Editorial support was provided by Ann B. Gordon.
Commonwealth Fund case studies examine health care organizations that have achieved high performance in a particular area, have undertaken promising innovations, or exemplify attributes that can foster high performance. It is hoped that other institutions will be able to draw lessons from these cases to inform their own efforts to become high performers. Please note that descriptions of products and services are based on publicly available information or data provided by the featured case study institution(s) and should not be construed as endorsement by The Commonwealth Fund.