Embed Size (px)
Citation preview
8/3/2019 Carl Kisslinger- The Generation of the Primary Seismic Signal by a Contained Explosion
http://slidepdf.com/reader/full/carl-kisslinger-the-generation-of-the-primary-seismic-signal-by-a-contained 1/96
UJNCLASSI FIED
AD 4'18
DEFENSE DOCUMENTATION CENTERFOR
SCIENTIFIC AND :TECHNICAL INORMATION
CAMERON STATION. ALEXANDRIA. VIRGINIA
UNCLASSIFIED
Reproduced From
\c A 4 Best Available Copy

8/3/2019 Carl Kisslinger- The Generation of the Primary Seismic Signal by a Contained Explosion
http://slidepdf.com/reader/full/carl-kisslinger-the-generation-of-the-primary-seismic-signal-by-a-contained 2/96
REPRODUCTION QUALITY NOTICE t
This document is the best quality available. The copy furnished
to DTIC contained pages that may have the following quality
problems:
" Pages smaller or larger than normal.
" Pages with background color or light colored printing.
" Pages with small type or poor printing; and or
" Pages with continuous tone material or color
photographs.
Due to various output media available these conditions may or
may not cause poor legibility in the microfiche or hardcopy output
you receive.
El Ifhis block is checked, the copy furnished to DTIC
contained pages with color printing, that when reproduced in
Black and White, may change detail of the original copy.
8/3/2019 Carl Kisslinger- The Generation of the Primary Seismic Signal by a Contained Explosion
http://slidepdf.com/reader/full/carl-kisslinger-the-generation-of-the-primary-seismic-signal-by-a-contained 3/96
NOTICI: Then gover nt or other drawings, spec.-fications or other data are used for any purpose
other than in connection with a definitely relatedgovernment procurement operationj the U. S.
Oovernment thereby incurs no responsibiity, nor ary
obliattion uhatsoeverj and the fact that the Oo-ern-
ment may have forzilated, furnished, or in any waysupplied the said drawings, specifications, or other
data is not to be regarded by impl=cation or other-
vise as in any manner licensing the holder or anyother person or corporation, or conveying any rights
or permission to manufacture, use or sell anypatented invention that my in any way be related
thereto.
Is:
8/3/2019 Carl Kisslinger- The Generation of the Primary Seismic Signal by a Contained Explosion
http://slidepdf.com/reader/full/carl-kisslinger-the-generation-of-the-primary-seismic-signal-by-a-contained 4/96
63 -3 -Y
coO
O VESIAC State-ef-tha-Art Report
THE GENERATION OF THE PRIMARY
SEISMIC SIGNAL BY A CONTAINED
EXPLOSION
Co*CARL KISSLINGER
- ACOUSTICS AND SEISMICS LABORATORY
THE U N I V E R S I T Y O F M I C H IG A N
April 1963
Contract SD-78
8/3/2019 Carl Kisslinger- The Generation of the Primary Seismic Signal by a Contained Explosion
http://slidepdf.com/reader/full/carl-kisslinger-the-generation-of-the-primary-seismic-signal-by-a-contained 5/96
4410-48 - X
VESIAC Sv~fe-of-the-Art Reoe 4
THE GENERATION OF THE PRIMARY
SEISMIC SIGNAL BY A CONTAINED
EXPLOSION
CARL KISSLINQER
Professor
St. Louis University
April 1963
Acoustic%and SeismIcs Laboratory
'9"U~e4
4 ee~e a1~ 7ee4dg&THE UNIVERSITY OF MICHIGAN
Ann Arbor, Michigan
8/3/2019 Carl Kisslinger- The Generation of the Primary Seismic Signal by a Contained Explosion
http://slidepdf.com/reader/full/carl-kisslinger-the-generation-of-the-primary-seismic-signal-by-a-contained 6/96
Ins;ute of Science and Technology The University of Michigan
NOTICES
Sponsorship. The work reported herein wa s condue$ by the Institute of
Science and Technology for the U. S. Department of Defense under Pz':je't SD-
78. Contracts and grants to Th e University of Michigan for the support of sport
sored research by the Institute of Science and Technology are administered
through the Office of the Vice-President for Research.
ASTIA Availability. Qualifiedc-euesters may obtain copips of this oocu-
ment from:
Armed Services Tecinical Information AgencyArlington Hail Station
Arlington 12, Virginia
Final Disposition. After this document has served Its purpose, it may be
destroyed. Please do no t return It to the Institute of Science and Technology.
iii
8/3/2019 Carl Kisslinger- The Generation of the Primary Seismic Signal by a Contained Explosion
http://slidepdf.com/reader/full/carl-kisslinger-the-generation-of-the-primary-seismic-signal-by-a-contained 7/96
institute of Science and Technology The University of Michigan
PREFACE
This review is an attempt to summarize the prerint state of knowledge of the
process by which a seismic wave is generated by an underground exp!,sicoa. An at-
tempt has been made to start with the highly compressed volume of gas formed at thei
completion of detonation and proceed step by step to the seismic signal. Research
investigators in this field will recognize immediately that tbere -ire gaps in our knowl-
edge about critical parts of this process that mst be bridged by reasonable asump-
teons about material beha ior. o
The author is a seismoligist, and this report is directed primarily to other seis-
malogists. For this reason, experts in shock-wave physics may find that the sections
on the highly stressed region around the explosion contain too much detailed discussion
of fundamental principles, without a corresponding coverage in the sections on elastic
waves.
The author wishes to acknowledge with gratitude the invaluable assistance given
him in the preparation of this report by the staff of VESIAC, Institute of Science and
Technology, The University of Michigan. In particular, Mr. Thomas Caless, Mr.
Robert Haven, and Mrs. Elaine Medor have provided services without which the com-pletion of this work would have been ver: dilfficult.
Finally, the author wishes to express his gratitude to his colleague, Prof. Otto
W. Nuttli, Department of Geophysics and Geophysical Engineering, St. Louis Uni-
versity, who read the manuscript during Its preparation and offered many helpful
suggestions.
8/3/2019 Carl Kisslinger- The Generation of the Primary Seismic Signal by a Contained Explosion
http://slidepdf.com/reader/full/carl-kisslinger-the-generation-of-the-primary-seismic-signal-by-a-contained 8/96
Institute of Science and Technology The University of Michigan
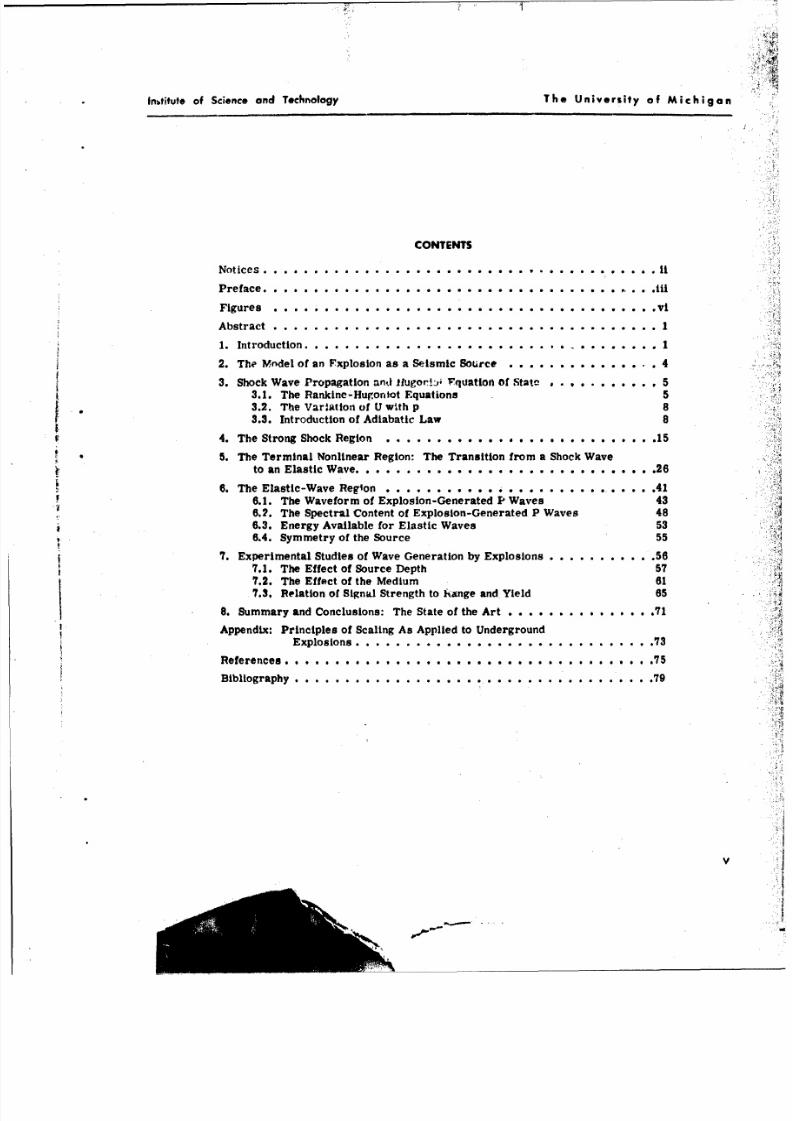
CONTENTS
Notices. .. .. .. ... ... ... .... ... ...... ... .... . .. j
Preface....... ......... ...... ... .. . .. .. .. .. .. .. .. . . .. i.
Figures .. .. ... ... ... .... ... ... .... ... ... .... .vi
Abstract .. .. .. ... ... .... ... ... .... ... .... ... ....
1. Introduction. .. .. .. .. .... ... ... .... .. .. .... ....
2. The Model of an Fxplosion as aSeismic Source .. .. ... ... ... .. 4
3. Shock Wave Propagation anti flugoriL; Vquation Of State .. .. .. *. 53.1. The Rankine -Huron to t Equations 53.2. The Vari~ation of U with p 83.3. Introduction of Adiabatic Law8
4. The Strong Shock Region. .. .. .... ..... . . . . . .. .. .. .. .. 15
* 5. The Terminal Nonlinear Region: Th e Transition from a Shock Waveto anElastic Wave........ .. .. .. .. .. .. .. .. .. .. ...... 2
8. The Elastic-Wave Regon .. .. .. ... ...................... 41
8.1. The Waveform of Explosion -Generated P Waves 436.2. The Spectral Content of Explosion-Generated P Waves 486.3. Energy Available for Elastic Waves 536.4. Symmetry of the Source 55
7. Experimental Studies of Wave Generation by Explosions. .. .. .. ... .567.1. The Effect of Source Depth 577.2. The Effect of the Medium 617.3. Relation of Signal Strength to Jhange and Yield 65
8. Summary and Conclusions: The State of the Art. .. .. .. .... ... .71
Appendix: Principles of Scaling As Applied to UndergroundExplosions. .. .. .. ... ... ... ... .... ... ... .73
References . * . . . . . ............................. . *. . .75
Bibliography ...................................... 79
V
8/3/2019 Carl Kisslinger- The Generation of the Primary Seismic Signal by a Contained Explosion
http://slidepdf.com/reader/full/carl-kisslinger-the-generation-of-the-primary-seismic-signal-by-a-contained 9/96
Ins*tuto of Science an d Technology The University of Michigan
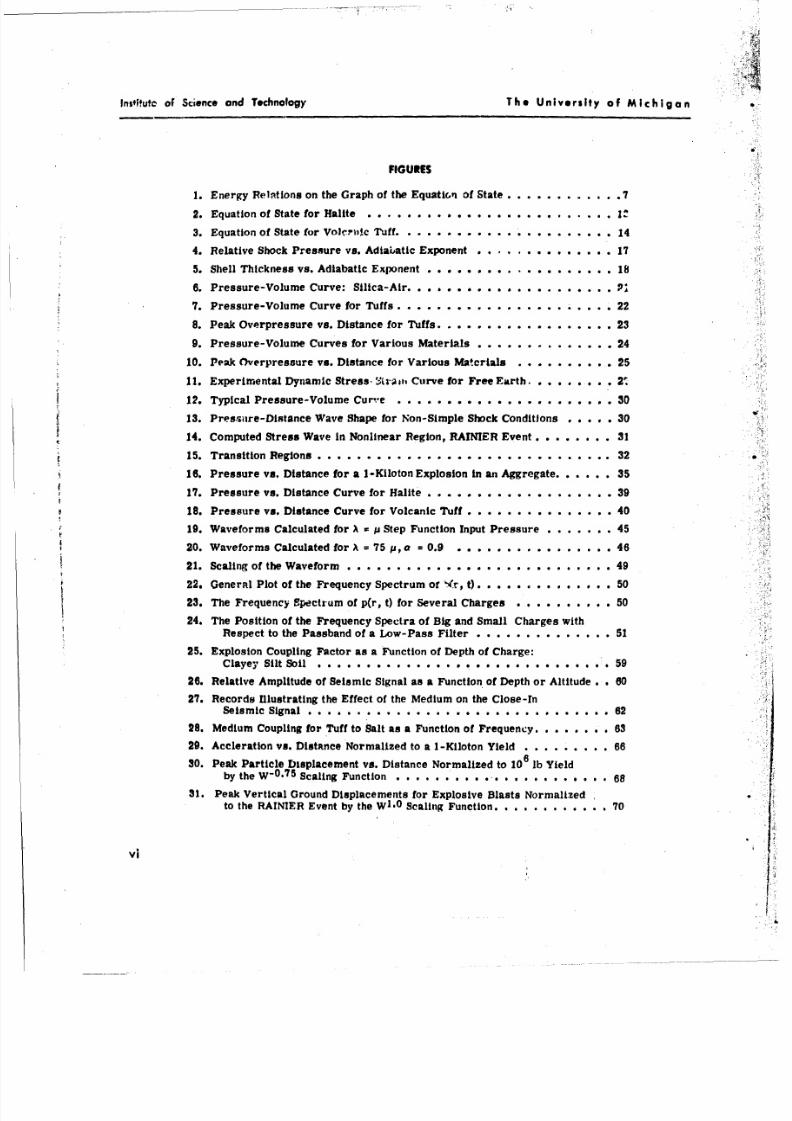
FIGURES
1. Energy Relations on the Graph of the Equatcn of State ............... 7
2. Equation of State for Halite ....................
3. Equation of State for Volcrifc Tuff ......................... .14
4. Relative Shock Pressure vs. Adiabatic Exponent .... .............. 17
5. Shell Thickness vs. Adiabatic Exponent . . . . ........... 18
6. Pressure-Volume Curve: Silica-Air .....................
7. Pressure-Volume Curve for Tuffs; ..................... ..... 22
8. Peak Overpressure vs. Distance for Tuffs ................... .. 23
9. Pressure-Volume Curves for Various Materials ..... ............ 24
10. Peak Overpressure vs. Distance for Various Matrials ... .......... 25
11. Experimental Dynamic Stress- rati,, Curve for Free Earth ...... ..
12 . Typical Pressure-Volume Cur,'e ...... ...................... 30
13. Presgsare-Distance Wave Shape for Non-Simple Shock Conditions ..... .30
14 . Computed Stress Wave In Nonlinear Region, RAINIER Event . .... ... 31
15. Transition Regions ....... .............................. 32
16 . Pressure vs. Distance for a 1-Kiloton Explosion In an Aggregate ...... .35
17. Pressure vs. Distance Curve for Halite ................. 39
18. Pressure vs. Distance Curve for Volcanic Tuff .................. 40
19. Waveforms Calculated for A = p Step Function Input Pressure ......... 45
20 . Waveforms Calculated for A = 75 p, a = 0.9 ..... ................ 46
21. Scaling of the Waveform ....... ........................... 4922 . General Plot of the Frequency Spectrum of r t) ................. 50
23 . The Frequency Spectrum of p(r, t) for Several Charges ............. 50
24 . The Position of the Frequency Spectra of Big and Small Charges with
Respect to the Passband of a Low-Pass Filter .... .............. 51
25 . Explosion Coupling Factor as a Function of Depth of Charge:
Clayey Silt Soil .................... . . .. .. .. .. . 59
28. Relative Amplitude of Seismic Signal as a Function of Depth or Altitude . . 60
27 . Records Illustrating the Effect of the Medium on the Close-In
Seismic Signal . . . ..... ............ .. 62
28. Medium Coupling for Tuff to Salt as a Function of Frequency ........ . 63
29. Accleration vs. Distance Normalized to a 1-Kiloton Yield ........... 66
30 . Peak Particle Displacement vs. Distance Normalized to 106 lb Yield
by the W-0 . 7 5
Scaling Function .............. .............. 68
31. Peak Vertical Ground Displacements for Explosive Blasts Normalized
to the RAINIER Event by the W1 . 0Scaling Function ............... 70
Vi
8/3/2019 Carl Kisslinger- The Generation of the Primary Seismic Signal by a Contained Explosion
http://slidepdf.com/reader/full/carl-kisslinger-the-generation-of-the-primary-seismic-signal-by-a-contained 10/96
THE GENERATION OF THE PRIMARY SEISM!C .iGNAL
BY A CONTAINED EXPLOSION
ABSTRACT
In order to analyze the mechanism by which buried explosions generat. -elsmic
waves, the region around the detonation Is divided intu three zones: (1) a strong-
shock (hydrodynamic) zone, (2) a transitional, nonlinear zone, and (3) the elastic
region. Experimental equation-of-state data are used in calculating the history of
the propagating stress wave, because there is as yet no comoicte theory of the re-sponse of solids to rapidly applied stresses which exceed their yield and crushing
strengths. Results indicate that the proper equations of motion are known. as r.re
analytic and numerical methods !:'r rolving them. The theory of shock waves in afluid is applicable to the close-Ir, region, and several failure mec.,an!sms have been
postulated for the transition rcolon
The objective of the analysis is the determination of the stress waveform at the
inner boundary of elastic behavior. The peak amplitude and spectral content depend
on the yield, the type of medium, and the ambient stress (depth of burial). T;ie ex-perimental determination of the shortest range at which elastic behavior begins Isdifficult in principle, because solutions valid at great distances are not applicable.
Experimental determinations of the amplitude-yield relationship must take Into
account (1) the combined effect of the shift of the spectral peak to lower frequencies
as the yield increases and (2) the low-pass filtering properties of the earth. Em-
pirical studies of the effect of the shot-point medium are influenced by the properties
of the explosive material. The effect of source depth is difficult to isolate because
in most test sites the medium changes with depth.
INTRODUCTION
Of the three physical processes involved In seismic ex-ploration, namely the initiation of the seismic waves, their
propagation, reflection, refraction, and dispersion, and therecording of some function of the motion of the surface, we
possess the least satisfactory understanding of the initiation
process.
J. A. Sharpe, 1942
An assumption underlies the entire research program on the Identification of underground
nuclear explosions by the seismic signal recorded at suitably placed stations; that'is, such ex-
plosions represent sources having unique properties which are adequate to distingish them from
1
8/3/2019 Carl Kisslinger- The Generation of the Primary Seismic Signal by a Contained Explosion
http://slidepdf.com/reader/full/carl-kisslinger-the-generation-of-the-primary-seismic-signal-by-a-contained 11/96
Institute of Science and Technology The University of Michigan
all other seismic sources. The discovery of these properties will permit the establishment of
criteria for deciding that a particular seismogram oi set of Ecismograms could have been pro-
duced only by an explosion.
The theory of wave propagatlo, !r,hp rth has progressed to the point where it would be
possible to compute the seismogram resulting from an input of k'own form at the source, given
the detailed properties of the geologic structure between a seismic source and observing point,
and the response characteristics of the seismograph. Theoretical seismograms for sinplifind
structures are being computed for a number of applications. Of course, not enough Is known of
the constitution of the crivt cr mantle to make this ;ossible at present, but ambitious research
efforts now in progress promise to yield the required data eventually.
An excellent example of current abilkity to derive a particular wave on the sismogiam from
a detonation of known yield is offered by the computation of P arrivals for three nuclear explo-
sions by Werth et al. f 1]. Their methods and results indicate both the potential of the analytic
tools available and the severe limitations of the data available to perform the computations.
The progress that has been made in the computation of theoretical seismograms makes the
question of the properties of the source a pressing one, for we are asking,"What should be the
Input to our computation?"
All efforts to answer this question have begun by surrounding the source with a sphere with
a radius large enough that all processes outside of this sphere can be described by infinitesimal
strain theory, either elastic or allowing for friction.al lobses. Then the question becomes one of
the proper loadlng (or set of stresses) to distribute ov;r this surface to represent the output of
the explosion In the form ot seismic energy.
This report will summarize present knowledge of the seismic loading from a contained ex-
plosion. Of particular interest are the effects on the resulting signal of the yield of the explosive de-
vice, the medium in which It Is buried, and the depth below the earth's surface. Because small-
and large-scale geologic factors, which are not an intrinsic part of the wave-generating process, in-
fluence the character of the signal profoundly even at moderate distances, only the close-in effects
will be considered-that is, ffects at the shortest ranges at which tie signal is carried by elas-
tic waves. For example, Adams et al. [21 have found (at the Nevada Test Site) that Inhomopeneitles
In the medium seriously disturb measurements of ground motion at scaled ranges beyond 800 to
1000 feet.d
'Scaled range -range/[W(kilotons)] 1/3; see the appendix for discutssinn of scaling.
8/3/2019 Carl Kisslinger- The Generation of the Primary Seismic Signal by a Contained Explosion
http://slidepdf.com/reader/full/carl-kisslinger-the-generation-of-the-primary-seismic-signal-by-a-contained 12/96
Institute of Science and Technology The University of Michigan
A great deal of important work on close-in effects of explosive sources has been done by
researchers who are interested primarily in weapois eftects and protectlve cnnstruction. For
obvious reasons, much of this work has dealt with surface or air burst . 1,.eauge G' , loading
due to the Intense air blast con!"Itutes an important part of the source mechanism for these shots,
the results of this work will not be considered here. Only corta;nea"explosions are of interest
here, and throughout this paper the term "explosion" will be ;y -o.ymous with "contained er-
plosion" unless otherwise indicated. Minor venting often occurs when burled explr:itos are de-
tonated; an explosion will be considered contained as long as the associated air blast has a negli-
gible effect on ground motion. Any treatment of viscous or other losses in the seismic waves
during propagation is also outside the scope of this report. There are important, as representing
a slmtficant effect of the medium through which the signal travels. This discussion. how2.- r,
will concern only those loss mechanidms which represent an effect ,f the medium In which the
explosion occurs.
Until very recently, most of the work on the factors affecting the seismic output of an ex-
plosion was done by persons who were interested in the use of explosives as controlled energy
sources: exploration seismologists, seismologists working with quarry- and mine-blast oper-
ations, and, to a lesser extent, demolition experts.
Seismic exploration detonation conditions pertain more closely to the underground nuclear
test identification and detection problem than do quarry blasts. Even though the size of a large
quarry or construction bias4
is somewhat closer to the scale of a nuclear explosion, the fact that
the shot Is always near a free face and is desIfn-d to move rock meant that a quarry shot is
never contained. This fact significantly alters t, * seismic output. Furthermore, large commer-
cial blasts are always dtstr buted in space and time through the delayed firing of a number of
holes. For these reasons, the results of theoretical and experimental research carried out In
connection with the use of explosives in exploration are of more value for this study than those
based on observations of quarry blasts. However, some excellent basic work on the mechanism
of rock breakage, especially that carried out by the U. S. Bureau of Mines, bears directly on the
subject of this report.
Because of the differences between chemical and nuclear detonations, research based on the
study of high explosives alone cannot possibly solve this problem. Consequently, only very recent
or in-progress research (theoretical and experimental) on nuclear sources will aid In elucidating
the wave-generating processes. Most of the important Information on the behavior of earth ma-
terials In the highly strepised region around the explosion Is still to be gathered. As this report
was being written, an extensive series of underground explosions is In progyress under the spon-
sorship nf the U. S. Atomic Energy Commission; it is very likely that analysis of data from these
8/3/2019 Carl Kisslinger- The Generation of the Primary Seismic Signal by a Contained Explosion
http://slidepdf.com/reader/full/carl-kisslinger-the-generation-of-the-primary-seismic-signal-by-a-contained 13/96
institute of Science and Technology The University of Michigan
experiments will provide numerical values to be used in the theoretical resultb outlined here, at
least for the selected materials at the tesit sites.
2
THE MODEL or AN EXPLOSION AS A SEISMIC SO1RCE
If it were possible to surround an explosion with a surtace of known shape on which the oi-
plete stress history at each point was known as a function of the parameters descrfl-, ag the ex-
plosion (yield, type of explosive, medium around the charge, depth of burial), and if this surface
were so chosen that only elastic processes took place outside of it, the differential equations de-
scribing elastic wave propagation could be integrated to give the groundi naotior, at any point in the
neighborhood oitside this source region.
The theory of wave generation by explosions has advanced tlrotgh. succession of efforts to
get an increasingly ccurate picture of thc loading function. The earliest efforts [3, 4, 5] simply
ignored the complex processes Inside the hypothetical surface, and proceeded from an Intelligent
conjecture of the nature of the loading. This approach made It impossible to relat, actual ampli-
tudes and waveforms of ground motion, stress, or strain to the yield, but made possible a qual..
itative picture of the manner in which the explosion parameters aaiect the results to be obtained.
The next stage was to discuss qualitatively the effects of the nonlinear, irreversible region
[6, 7, 8, 9]. Some early studies have been followed up by the present concerted efforts to treat
in detail the processes occurring in the highly stressed region. Authorities generally agree on
how to handle the "strong" shock zone immedistpy around a nuclear detonation; and, as mentioned
above, there is no serious problem in the elastic %ne. It is true that loss mechanisms at in-
finitesimal strains must he tnken Into account if the seismic waveform is to be accurately pre-
dicted 10]. The greatest uncertainty lies In the transition zone, where stresses are falling to
the neighborhood of the crushing strength and then the yield strength of the medium. However, as
pointed out by Fugelso [11, p. I],he unknown factors in the identification of a seismic event as
a blast lie in this region. The various approaches outlined in this report can almost be categorized
by the number of subregions into which this zone of transition Is divided.
Cushing and Relly [12] suggest a useful coarse division of the zones around the shot. They
refer to the close-in nonlinear region, In which shock pressure far exceeds the crushing strength
and shear stresses are negligible compared to compressive stresses, and to the terminal non-
linear region, In which the shock pressures are at or above the elastic limit of the medium, and
are generally comparable to the medium's crushing stress, and in which the shear strength must
be considered. It is possible and desirable to define the limits of these regions quantitatively, and
to further subdivide the terminal nonlinear region [13].
8/3/2019 Carl Kisslinger- The Generation of the Primary Seismic Signal by a Contained Explosion
http://slidepdf.com/reader/full/carl-kisslinger-the-generation-of-the-primary-seismic-signal-by-a-contained 14/96
Institute of Science and Technology The University of Michigan
This report will present the theory of wave geyieration, starting from the immediate neighbor-
hood of the explusion and proceeding outward. Th,- main features of thp ,"l.rs-In nonlinear region
will be discussed first. Then the variots v ewoints on the transition r wihln'l' revlewel.
and finally the character of the seismic stgnal at the beginning of elastic-wave propagation will be
described. Present knowledge of the waveform (time history) r spectrum (frequency content) of
the input seismic signal will be summarized. The report w!Il also review field data from chetn-
Ical and nuclear explosions, and will present the various empirical scaling rulcs that have been
developed, compared with the theoretical results.
The physics of the explosion itself will not. be discussed. Detailed discussion of the detona-
tion process for chemical explosions may he found in Cole [14], Cook [151, rnd Jones ard Miller
(16]. It will be assumed that the detonation results in in Initial spherically symmt, ric intense
shock front. Evidence of departures from symmetry of the seismnic ml from an explosion will
be discussed in Section 6.4.
3
SHOCK WAVE PROPAGATION AND THE HUGONIOT EQUATION OF STATE
3.1. THE RANKINE- HUGONIOT EQUATIONS
Stresses in the immediate vicinity of the explosion reach levels of hundreds of kilobars or
megabars, and exceed the strength of any earth material enough that the rigidity is completely
negligible and the phenomena may be described by treating the medium as a perfect fluid. Studies
that attemptto
work indetail from the explosion outward treat the shock wave as propagating in
a fluid. The phenomena in this case are governled by the Rankine-Hugoniot equations for a shock
wAve in a fhlid. These equations will be reviewL4 here because they are basic to much that fol-
lows. More detailed treatments of these relations may be found in worksdevoted to the present
problem [13, 18, 20].
The Rankine-Hugonlot relationships are derived from the principles of conservation of mass,
momentum, and energy across a steep front at which pressure, density, and particle velocity are
discontinuous. If the shock front is advancing with a speed U Into an undisturbed region of fluid
in which the density is p and the ambient pressure Po, conservation of mass across the front
requires that the particle velocity u and the density p immed!ately behind the front satisfy the
equation ps(U - u) -PoU, which may be written as
u 1 - (1U P Vo
5 0
where v I/p Is the specific volume.
8/3/2019 Carl Kisslinger- The Generation of the Primary Seismic Signal by a Contained Explosion
http://slidepdf.com/reader/full/carl-kisslinger-the-generation-of-the-primary-seismic-signal-by-a-contained 15/96
Institute of Science and Technology The University of Michigan
Conservation of momentum is used to relate the pressure Jump across the front to the other
parameters: pe - pc wpo U2 ps (U - u) 2 . If ps is climinated by using Equation I and calling the
overpressure Ps - P p, then
P=P Uu (2)
Conservation of energy requires that the work done by t::.' pressures at the front equals the
change In the total energy of the fluid. Referred to a unit mass where I° repreq-nts the initial
internal energy and I I the change at the front, the total change In energy per unit masb hI..s 0
2 _ U2]ternal and kinetic), assuming an adiabatic process, Is (IW I) + L - u ) Equating this
POU - PO -u) P P,
to work per unit mess, U yields _o 1 2 2
rewritten, using Equation 2: a
12 Psu
-P5 (vO v) (3a)
These three basic relations can be combined In various ways to obtain the desired shock
parameters In terms of those that are more easily measured. The velocity of shock propagation
and the particle velocity In termsWof pressure and specific volume are found from Equations 1
and 2:
.'v (4)V0 8e O..)
2u (P. - PO) (v vs) (5)
0
From Equations 5 and 3a, the change in internal energy Is
(Is . 0 ) 2 (Ps+
PO)
(vo "vs) (6)
Equation 6 is called the Hugonlot equation of the fluid [171. It is the locus of all final states P.,
vathat can be attained from an Initial state PO, v0by passing a shock through the fluid.
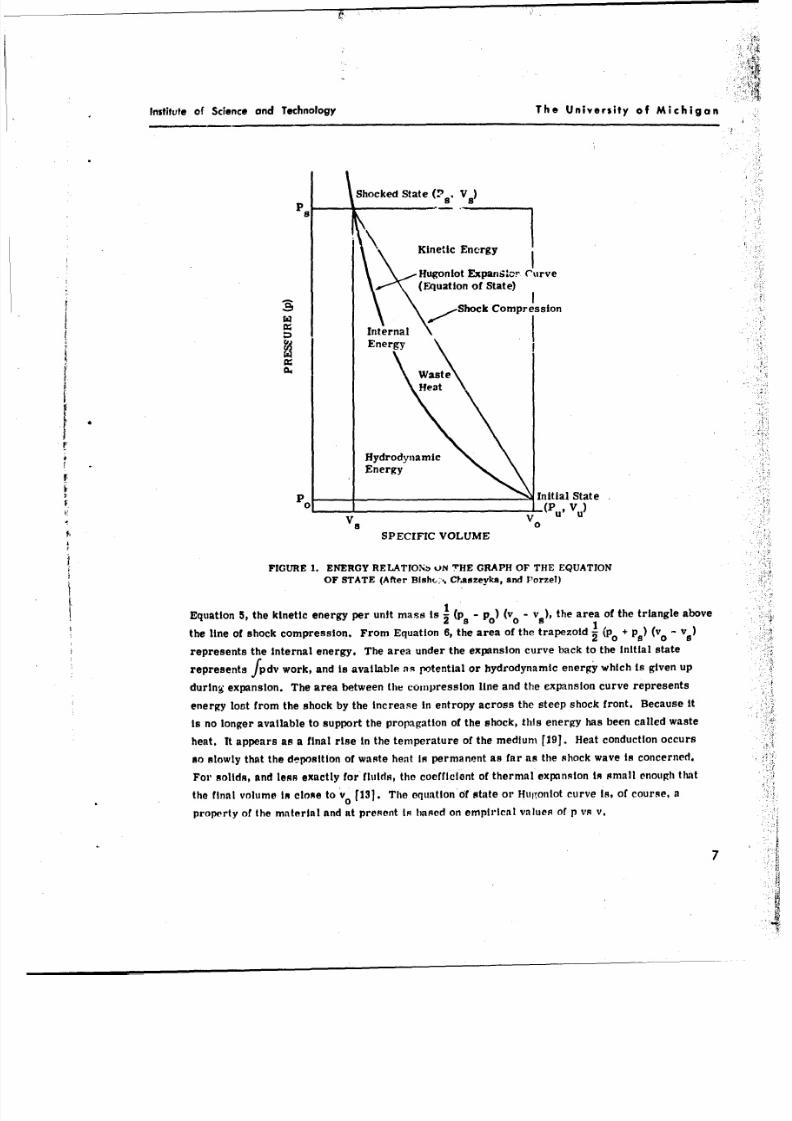
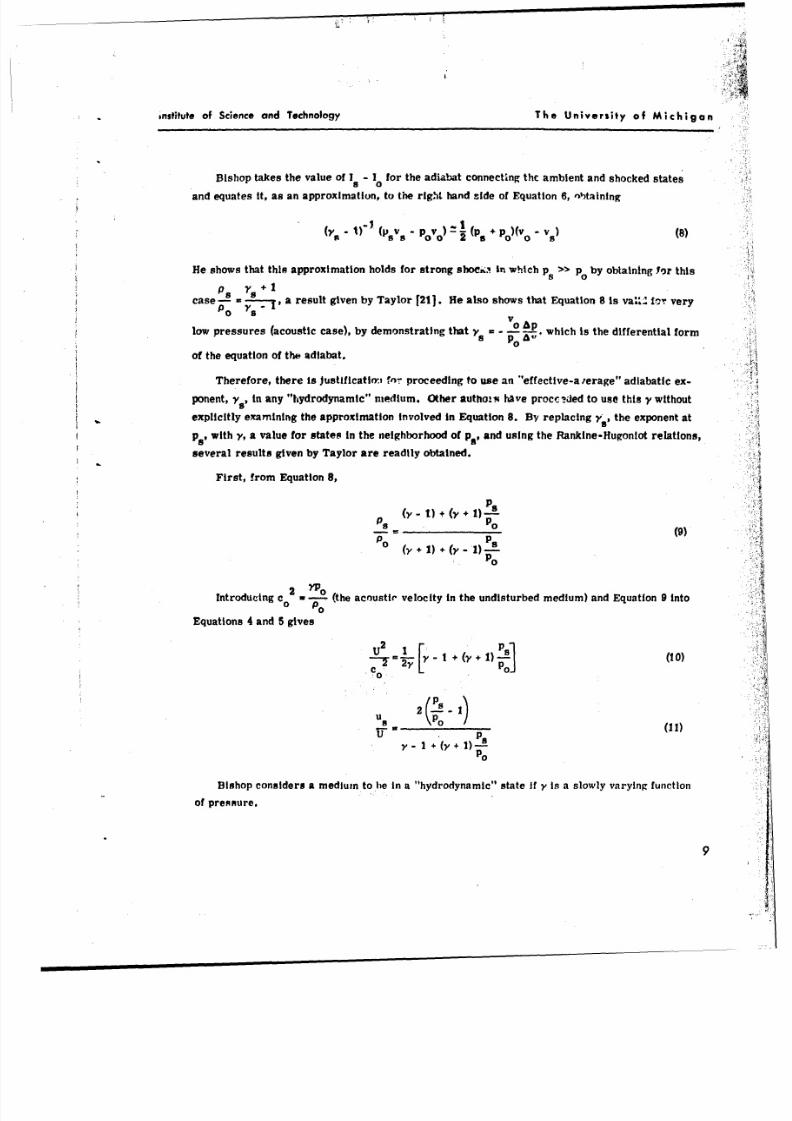
The significance of the various expressions derived above can be visualized through the
pressure-volume diagram in Figure 1 (see Reference 13, Figure 4.1, Reference 18, Figure 1,
and Reference 19, Figure 3.3). From Equation 3a, the total energy per unit mass behind the
shock imp (No v ) the area of the rectangle bounded by p-p , v -v o , and vvs . From
6.5
6
8/3/2019 Carl Kisslinger- The Generation of the Primary Seismic Signal by a Contained Explosion
http://slidepdf.com/reader/full/carl-kisslinger-the-generation-of-the-primary-seismic-signal-by-a-contained 16/96
Institute of Science and Technology The University of Michigan
Shocked State (P' Vs)p S.
S8
Kinetic Energy
Hugonlot ExpanSkcM Curve
(Equation of State)
Shock Compression
rInternalEnergy
WasteHeat
HydrodynamicEnergy
Initial StateP0 1 1_______
_ .(PVV s ~~u V0 VUi:
SPECIFIC VOLUME
FIGURE 1. ENERGY RELATIONb ON THE GRAPH OF THE EQUATIONOF STATE (After Bish,;.. Chaszeyka, and Porzel)
Equation 5, the kinetic energy per unit mass Is 1 (ps - po) (v - v ), the area of the triangle above
the line of shock compression. From Equation 6, he area of the trapezoid (Po+ Ps) (vo - vs)
represents the internal energy. The area under the expansion curve back to the Initial state
represents fpdv work, and is available aq potential or hydrodynamic energy which Is given up
during expansion. The area between the compression line and the expansion curve represents
energy lost from the shock by the Increase In entropy across the steep shock front. Because it
is no longer available to support the propagation of the shock, this energy has been called waste
heat. It appears as a final rise in the temperature of the medium [191. Heat conduction occurs
so slowly that the deposition of waste heat Is permanent as far as the shock wave is concerned.
For solids, and less exactly for fluids, the coefficient of thermal expansion is small enough that
the final volume Is close to vo [131. The equation of state or Huiponlot curve Is, of course, a
property of the material and at present Is based on empirical values of p vs v.
7
8/3/2019 Carl Kisslinger- The Generation of the Primary Seismic Signal by a Contained Explosion
http://slidepdf.com/reader/full/carl-kisslinger-the-generation-of-the-primary-seismic-signal-by-a-contained 17/96
Institute of Science and Technology The University of Michigan
3.2. THE VARIATION OF U WITH p
A useful property of shock wave propagation can be derived from Equation 4 by differentiating
with respect to Ps:
I
+ ps pON-45
dU 0\v V d,-S=T 1.e/2 1 /
dp 05 50
The quantity d-sis obtained from the Hugonlot eq. ttion of state for the medium and is a function
of v s.The shock velocity U will increase with increasing pressure as long as
p -p dv
0o s 8
r For all materials, both sides of the inequality as written are positive (pressure decreases with
increasing specific volume), and the inequality is satisfied If the line joining the shocked state to
the initial state makes a smaller angle with the negative v-axis than does the tangent to the equa-
tion of state at the point (P v ). As shown by Rice et al. [171 and discussed by Cushing and Reily
[121, if the equation of state has a cusp (as it will in any solid with a non-zero yield stress), and
a somewhat greater crushing stress, there will be a region in which shock velocity Increases
with decreasing pressure, and in place of a stable single shock front, a two-wave structure forms.
This will occur when the shock-front pressure ,ha:;d-cayed to the neighborhood of the crushing
stress of the medium in the terminal nonlinear ret".n. The shock front velocity can become less
than the velocity of the elasatic compressional wave, so that an elastic precursor runs ahead of
the shock front.
3.3. INTRODUCTION OF ADIABATIC LAW [13, 201
The internal energy can be eliminated from the equation of state (Equation 6) by introducing
the law for adiabatic expansion of an Ideal gas. The change in internal energy of the system in
V
going from an initial to a final state is If I .fv[ pdv, where tho integration Is taken along an
adiabat, pvY u const.; i - ratio of specific heats. Integrating,
If-I Y,- I (a)
8
8/3/2019 Carl Kisslinger- The Generation of the Primary Seismic Signal by a Contained Explosion
http://slidepdf.com/reader/full/carl-kisslinger-the-generation-of-the-primary-seismic-signal-by-a-contained 18/96
institute of Science and Technology The University of Michigan
Bishop takes the value of I -I for the adiabat connecting the ambient and shocked statesa 0
and equates it, as an approximation, to the right hand side of Equation 6, 41htaining
(pav - o (s+P)v-v8
He shows that this approximation holds for strong shoe.-: in which p. > p0 by obtaining Yo r this
case- y a result given by Taylor [21. He also shows that Equation 8 Is vaIi~i 1-T very
p 0 0 Alow pressures (acoustic case), by demonstrating that V. - which is the differential form
03
of the equation of the adiabat.
Therefore, there is )ustIf Icatori lnr proceeding to use an "effective-a terage" adiabatic ex-
ponent, y5 in any "hydrodynamic" medium. Other authois have proccJed to use this v without
explicitly examining the approximation Involved in Equation 8. By replacing y' , the exponent at
p., with v, a value for states In the neighborhood of p3 and using the Rankine -Hugoniot relations,
several results given by Taylor are readily obtained.
First, from Equation 8,
p0
p 0 +
U2 1 10
U2 PV~~- - I ( +I)
U- p
Bishop considers a medium to he In a "hydrodynamic" state IfV is a slowly varying function
of prennure.
8/3/2019 Carl Kisslinger- The Generation of the Primary Seismic Signal by a Contained Explosion
http://slidepdf.com/reader/full/carl-kisslinger-the-generation-of-the-primary-seismic-signal-by-a-contained 19/96
Institute of Science and Technology The University of Michigan
A shock is considered "strong" If Ps is sufficiently greater than po ro that Equations 9 through
11 take the form r21]:
pg . -(9a)
c 2 +' Po (10a)
0ua 2 pIa v+ls
us 2 (Ua)
A very useful form of the equation of state Is obtained by intreducing vh v - v (the chat.,e
In specific volume) and p - ps - Po (the overpresmure) Into Equation 9.
Then 2 and Equation 9 becomes
2(s-1) 2___1)
VOVh = P
0 Y Wy)+Y+ 1)-L 2y +(y + I)-
t2Y.
PO
or
V ypVO r + +Po(12)
h
Bishop interprets yPo as the adiabatic elastic modulus for a condensed medium, where y is
VPO 2at the ambient state. If c Is the ambient compressional wave velocity, then o c so that
0 PO 0
vpo "poce 2 K0' n elputic modulus. Therefore, Equation 12 becomes
V Kv" h " ( + 1) +
10
8/3/2019 Carl Kisslinger- The Generation of the Primary Seismic Signal by a Contained Explosion
http://slidepdf.com/reader/full/carl-kisslinger-the-generation-of-the-primary-seismic-signal-by-a-contained 20/96
Institute of Science and Techno'ogy The University of Michigan
K p/KDividing through by--
2 h
=1 1/4 (y + 1) P (14)
p 'vh/VO kK)
If the overpressure p Is small comrk.red to the elastic constant Ko, h IF sr..1I, lt n Equation
13 becomes
1, or K ° P PV h / Vo 11- 0 & F
This merely confirms the interpretation of K as an elastic modulus, i.e., the ratio of small
stress to small strain. Then, for large stress.%
K (1 x) K
where
x 1/2 (v + 1) po (K8 /'Ko1 1 (16)
K0
and K is the elastic modulus for finite strains. The quantity x is a factor to correct the infin-S
itesimal strain modulus to a finite strain modulus, and is a function of the stress.
4
In notation more familiar to seismologists, c° is the P-wave velocity, K0 k + A - X + A,
in which k is the bulk modulus, p the rigidity modulus, and A is Lam6's constant. If the velocity
of propagation of elastic shear waves is designated by cs, hen
z2
2 Xk ji 1 c
From Equations I and 2, Equation 13 becomes
1/2 (y + 1) UQ) c02
u (17)
y an then be determined from the experimental propagation data, U, u, and co. From Equations
U2
16 and 17, another form for x is x -U. - 1.
CO0
Following Bishop, we shall use the value of x to describe the regime in which the processes
are taking place; I.e., when x is very large, the shock is strong, and when x is very small, th.,
behavior is elastic. Thus transitional states can be specified for a given medium by values of x,
11
8/3/2019 Carl Kisslinger- The Generation of the Primary Seismic Signal by a Contained Explosion
http://slidepdf.com/reader/full/carl-kisslinger-the-generation-of-the-primary-seismic-signal-by-a-contained 21/96
Institute of Science and Technology The University of Michigan
if observational data are available. If overpressure is used to specify t-1 regime, Equation 12
can be expressed as
Y+1 +1IZy (18)
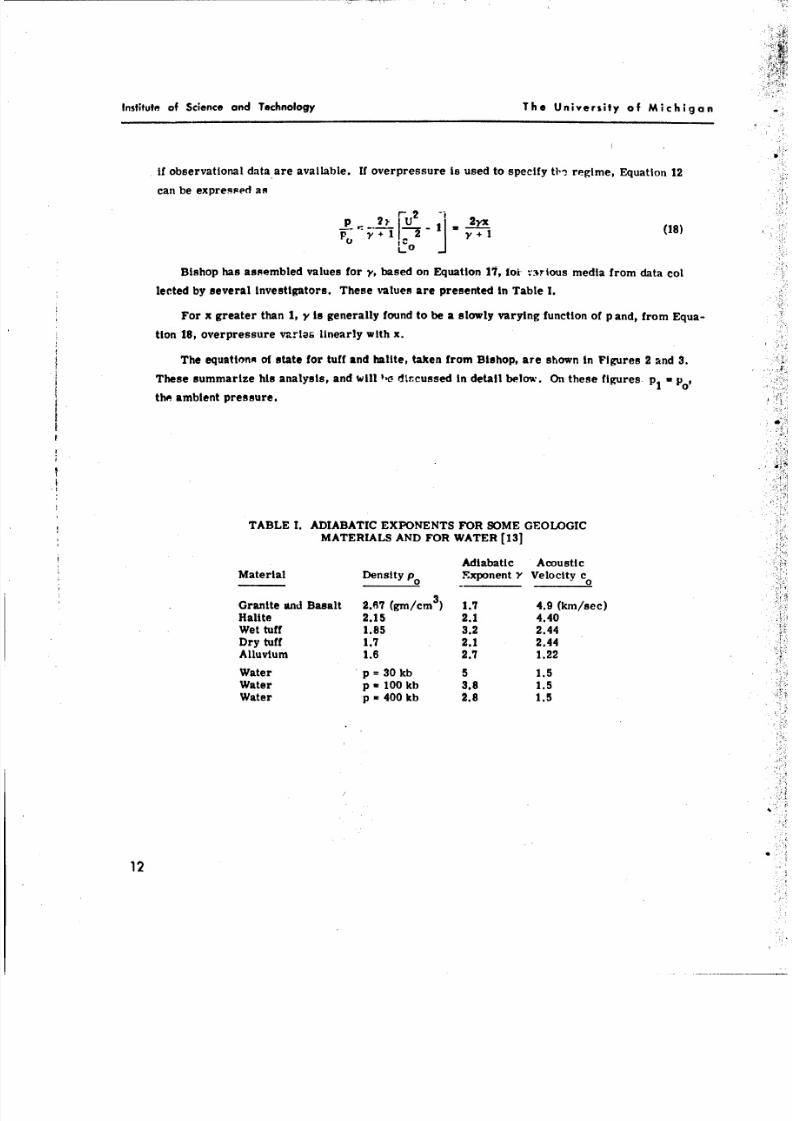
Bishop has assembled values for y, based on Equation 17, oi -'3rious media from data co l
lected by several investigators. These values are presented in Table !.
For x greater than 1, y is generally found to be a slowly varying function of p and, from Equa-
tion 18, overpressure varies linearly with x.
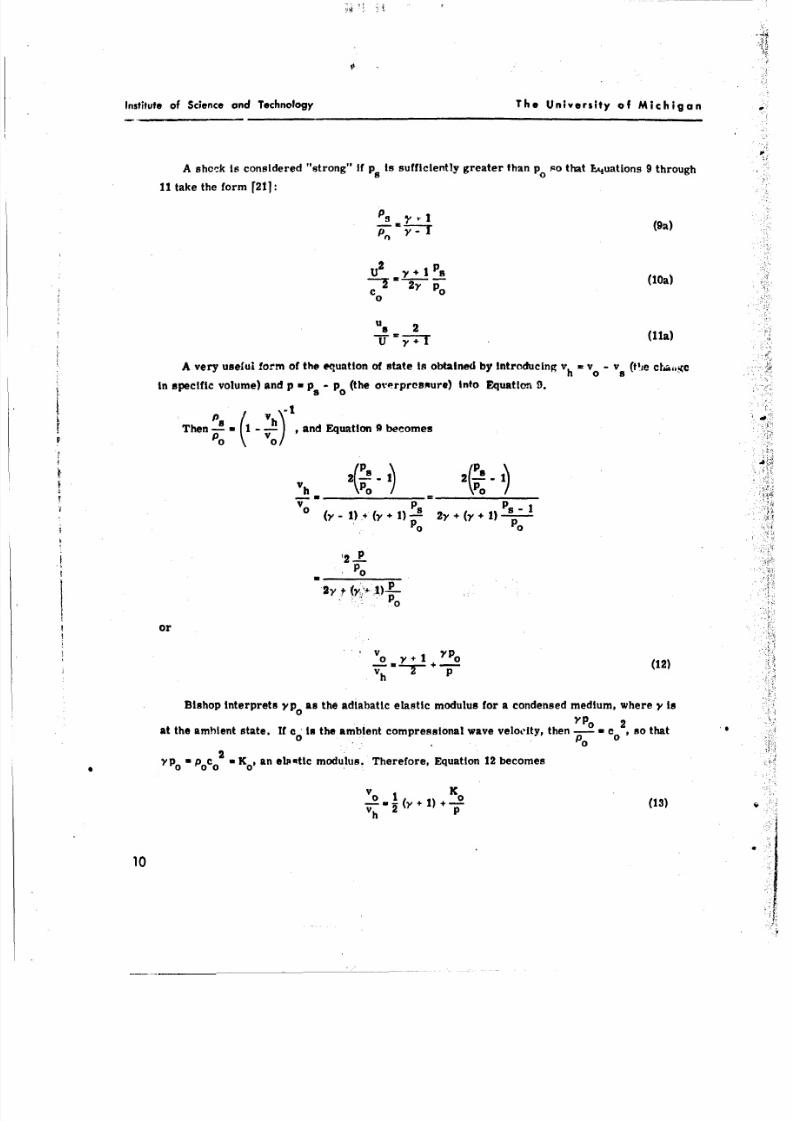
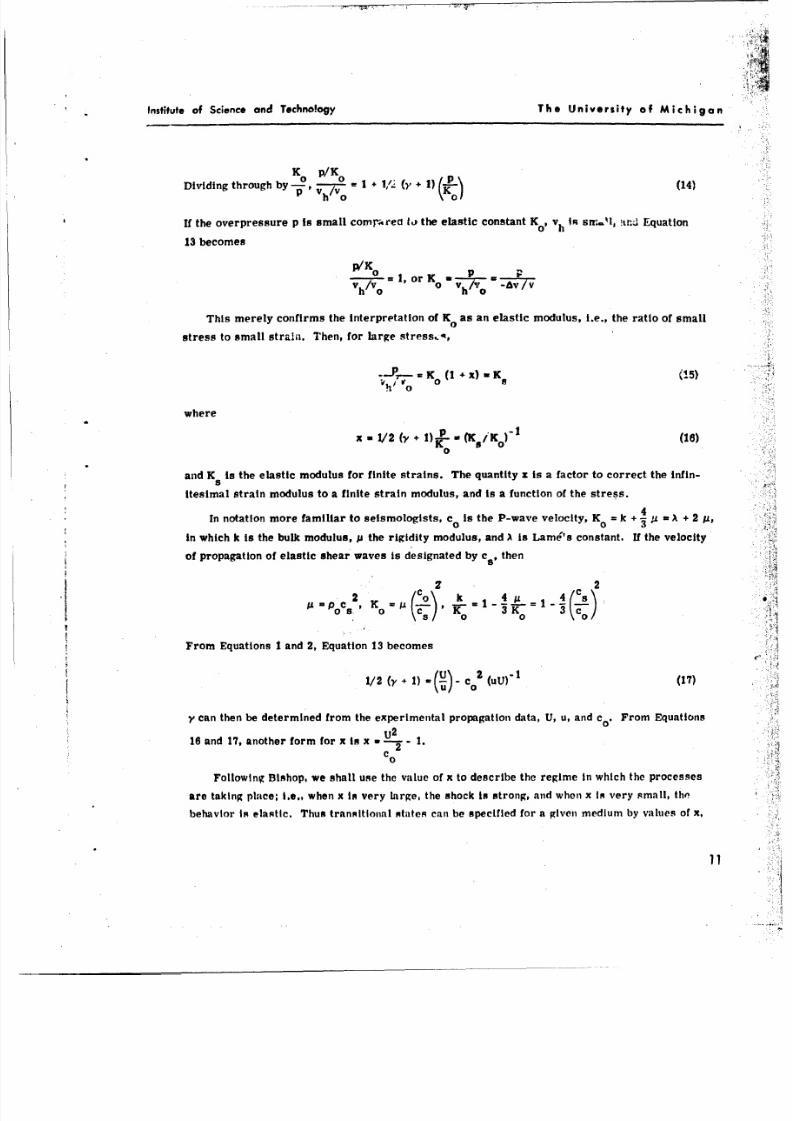
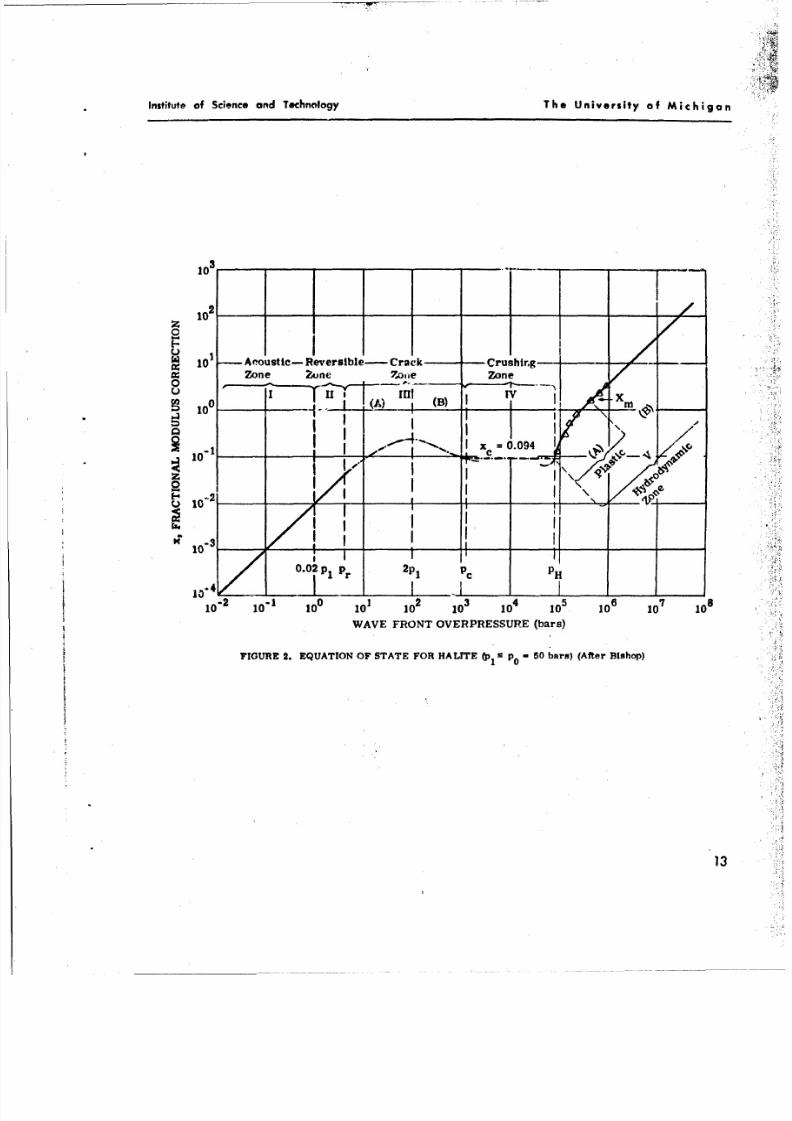
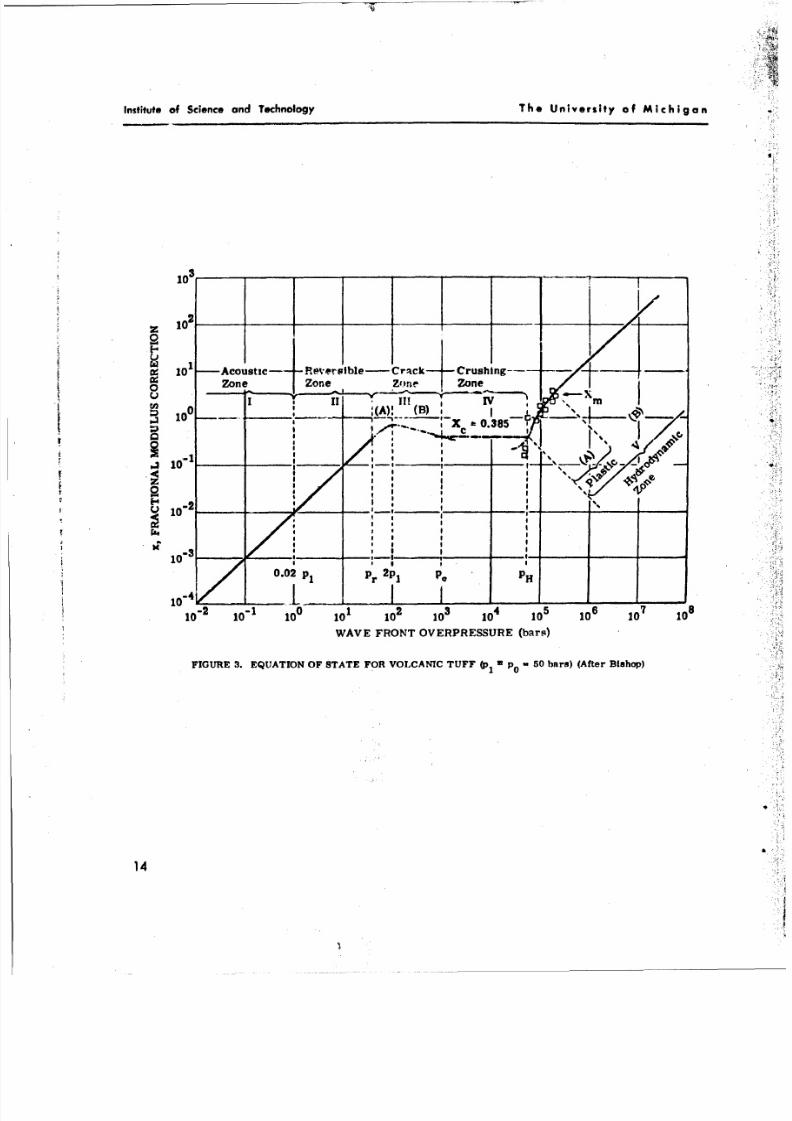
The equations of state for tuff and halite, taken from Bishop, are shown in Figures 2 and 3.
These summarize his analysis, and will '4n d.rcussed in detail below. On these figures p1 o
the ambient pressure.
TABLE I. ADIABATIC EXPONENTS FOR SOME GEOLOGIC
MATERIALS AND FOR WATER [131
Adiabatic AcousticMaterial Density Po Exponent Y Velocity c0
Granite and Basalt 2.67 (gm/cm3 ) 1.7 4.9 (km/sec)
Halite 2.15 2.1 4.40
Wet tuff 1.85 3.2 2.44
Dry tuff 1.7 2.1 2.44
Alluvium 1.6 2.7 1.22
Water p = 30 kb 5 1.5Water p a 100 kb 3.8 1.5Water p w 40 0 kb 2.8 1.5
12
8/3/2019 Carl Kisslinger- The Generation of the Primary Seismic Signal by a Contained Explosion
http://slidepdf.com/reader/full/carl-kisslinger-the-generation-of-the-primary-seismic-signal-by-a-contained 22/96
Institute of Science and Technology The University of Michigan
10 __L
z
101 Aeoustic- Reversible- Crack %,ulhirg
Zone Zune ,ooe Zone
. . ... .__ _________
0 1 ,0 n)
- W) (B) I I
Sx 0.094
_ _ I I _ _ I-10- -F--- I -
I e
0.0 Pl Pr 2p , PC PH
1 3 .... ... I ,. 1_
1020 0 101 102 10 10 10 106 10 108
WAVE FRONT OVERPRESSURE (bars)
FIGURE 2. EQUATION OF STATE FOR HALITE (plI P0 - 50 bars) (After Bishop)
13
8/3/2019 Carl Kisslinger- The Generation of the Primary Seismic Signal by a Contained Explosion
http://slidepdf.com/reader/full/carl-kisslinger-the-generation-of-the-primary-seismic-signal-by-a-contained 23/96
institute of Science and Technology Th e University of Michigan
3I
101.
z' 1
10 Acoustic-- Reveaslbe-CrcCrsn---
0%Zone Zone Zone Zone
TV m10 0a A: (3~ io 2
_ a, _0.385_
a1 t _______
0.' Q
0.0 pP a
100-1
2 -1 0 1 i 2 3o 4 5 i6 7 08
WAVE FRONT OVERPRESSURE (bars)
FIGURE 3. EQUATION OF STATE FO R VOLCANIC TUFF (p IP 0 -50 bars) (After Bishop)
14
8/3/2019 Carl Kisslinger- The Generation of the Primary Seismic Signal by a Contained Explosion
http://slidepdf.com/reader/full/carl-kisslinger-the-generation-of-the-primary-seismic-signal-by-a-contained 24/96
Institute of Science and Technology The University of Michigon
4
THE TRON'G SHOCK REGION
According to the qualitative classification of Cushing and Relly [121, the cln ,n-tn nonlinear
region is that In which a hydrndynamic shock-wave analysis is valid. At, sLated above, this re-
quires that shock pressures greatly exceed crushing pressure ,.:1 that shear stresses be neg-
ligible. The formidable task of determining the thermot eamirc properties of the itrongly
shocked material must then be accomplished. The objective, from the vie.polnk of this report,
Is to determine where the transition to the terminal nonlinear region occurs and how mucih
energy remains In the shock wave at that radius [22, p. 75].
The Rankine-Hugonlot equation of state is requIred for the m.ed!um; at present, this infor-
mation is primp.rily empirical. The equation-of-statc work or, metals giveF useful fnsghlt Into
the problem, but little has been doi,- oii orous materials. The work of CIaszeyku [22] and
Chaszeyka and Porzel [18] seems tu be the best available on materials, resembling earth ma-
teri 1N : work is In progress, however, by Fugelso f1] and Bishop [13].
Fugelso points out that, owing to the characteristics of earth materials (i.e., Inhomogeneity,
complex mineralogical structure, porosity, and small-scale structural defects), there is no
hope of finding an analytic equation of state to fit the experimental data over the entire range
of interest.
Bishop defines the hydrodynamic region as that in which the effective adiabatic exponent Y
varies slowly with pressure. The lower limit of the hydrodynamic range Is a critical pressure
at which crushing ends and hydrodynamic flow begins. Because this pressure falls in a region
of plastic flow, it is somewhat indeterminate. Bisi~op approximates this critical value PH the
hydrodynamic termination pressure, with a valu. 'p2 which corresponds to a value of x - x 2
0.5. For p > pa, the x - p curve (see Figures 2 and 3) Is almost a straight line (Y=constant),
except for values close to P2' where a transition zone of large plastic deformations occurs.
A shock is then defined as being "strong" initially if x > 100 for any radial distance. This
occurs for nuclear explosions, but never for chemical detonations. Figure 3 shows that x • 00
for tuff at about 1.5 megabars.
Porzel [19] maintains that the waste heat is the controlling mechanism for a well contained
spherically symmetric explosion, such as the RAINIER event. This viewpoint is supported by
analysis of soil-like mixtures of air and solid particles[18,
22]. Waste heat was defined above
as heat which remains In the material after it expands adiabatically back to the ambient pres-
sure following the passage of the shock wave. Chaszeyka has shown [22] that for even small
amounts of air included in the soil or rock-like material, virtually all of the energy of shock
compression goes into waste heat.4
15
8/3/2019 Carl Kisslinger- The Generation of the Primary Seismic Signal by a Contained Explosion
http://slidepdf.com/reader/full/carl-kisslinger-the-generation-of-the-primary-seismic-signal-by-a-contained 25/96
Institute of Science and Technology The University of Michigan
For all materials, there is some pressure value high enough to hept and vaporize the ma-
terial irreversibly, and leave it in a gaseous state even aftpr expansion to the ambient pressure.
All of the material inside the shock radius corresponotig to this "vapori'ation pressure" be-
comes part of the cavity. For very strong shocks, there will be energy Irn thc 'sste-heat part
of the p-v diagram in excess of that requ:red to vaporize the materi-±1 this will appear as super-
heat in the gas. Since this energy is available by expansion -.he gas, it is not part of the
waste heat defined above. Thus, for pressures far in excess of the vaporizaiont prcssilre. all
materials are good transmitters of shock energy [19]. Nuckolls [23] used a value of 1.0 iiagz-
bar as the peak shock pressure required to deposit enough heat to vaporize the tuff in his cal-
culatton of the phenomena associated with the RAiIER event.
Bishop handln the question of the energy available to the shock at any radius by dinIri
an "effective shell thickness." The co,.eept Is based on the fact that a spherical shell carrying
some fraction of the original energy of th e explosion eventually breaks R,ay from the hot gas
core, and olce this has happened, no energy to support the shock can be received from the core.
In the strong shock region with which the discussion Is presently concerned, the shell is still in
complete contact with the core.
Peet [24, p. 528] points out that Sharpe's calculations of the seismic signal from a sphericalcavity show that the shape of the radial pressure profile away from the front has only a minor
effect on the results. Both theory and observations Indicate that the total pulse duration is short
in the close-in region [23]. Basic communication theory asserts that if 100 cps isaken as the
upper limit of useful energy for seismic observations, the record of the seismic signal from apulse shorter than 0.01 second can reveal nothing abot the wave shape or spectral content of
the input [12, 23]. Therefore, no recoverable infor hation is lost if the shock energy in the source
region Is considered to be confined to a thin shell.
The effective thickness of the shell is defined as having a volume equal to the total energy
in the shock divided by the energy per unit volume at the shock front, taken to be the kinetic
energy portion of Figure 1. The thickness, y, of this shell in the strong shock region is given
by Bishop [13, p. 48]:
1 Z p u 2
in which the subscript f refers to the shock front
r
8/3/2019 Carl Kisslinger- The Generation of the Primary Seismic Signal by a Contained Explosion
http://slidepdf.com/reader/full/carl-kisslinger-the-generation-of-the-primary-seismic-signal-by-a-contained 26/96
Institute of Science and Technology Th e University of Michigaon
and R is the radius of the front. The radial profile of density p and particle velocity u must be
known to apply this relationship.
In the case of a TNT detonation wave, F/R a 0.064, which meais 01- vrf !! the kinetic
energy I confined to a sh'?! bounded by the front and an Inner radius only 6% smpaller than the
rstdius-of the frot't.
Taylor's theory of strong shocks f211 provides the requirpd radit viriation of p and u.
These profiles are a function of V, the adiabatic exponent. The shell thickness Is U-in n'nly a
function of y, which, of course, Is a property of the medium.
The analyuis for the strong shock and hydrodynamic regioins will be sqummarized on the
basis of Bishop's procedure. After a nuclear explosion, there will be an Initial ?one Jr! whla~
the parameter x ->100. Taylor'or thoory of very Intense shon'ks gives the folloviing equations:
I- 2 Y lW) 0 %o2 1 (20)
Rrp 1-W B )] (21)
where p, Is the shock front pressure for x1 100 and R, Is the radius of the front for this
pressure. W is the explosion energy release, and B (y) Is a function of y graphed In Figure 4.t
y Is calculated from Equation 17 .
1.0
0.6
0.4 -_ ___ ___ _
1.0 1.5 2.0 2.5 3.0 3.5 4.0 4.5 5.0ADIABATIC EXPONENT
FIGURE 4. RELATIVE SHOCK PRESSUIRE VIS. ADIABATIC EXPONE~NT (After flIshoo)
17
8/3/2019 Carl Kisslinger- The Generation of the Primary Seismic Signal by a Contained Explosion
http://slidepdf.com/reader/full/carl-kisslinger-the-generation-of-the-primary-seismic-signal-by-a-contained 27/96
Institute of Science and Technology The University of Michigan
As the pressure falls below the "strong shock" level (in the sense that Taylor's equations
no longer give good results), but is still hydrodynamic (pa> P2) ' the following equations may be
used to follow the shock history:
P,=l (22)
log log- (2b 1) log )
where p f overpressure at radius R in the hydrodynamic range, and b - a heat loss parameter
given by
b -1/3 (2+ qa ) (24)
where
qa 0.4zl (1 + xm ) [1 - 1.82 (1 + A1 -1
(25)
The plastic flow limit, xm , is determined from experimental Hugoniot data as the smallest
value of x for which the log x - log p graph is a straight line (for tuff this value is about 3.5;
see Figure 3); z R is the ratio of shock front radius tc effective shell thickness, given Iny
Figure 5, and z is the value at R1 .
0.20,t
0.15
~~Fy/R
S0.10
0.01), ---
O.10 - --J
1.0 1.5 2.0 2.5 3.0 3.5 4.0 4.5 5.0
ADIABATIC EXPONENT y
FIGURE 5. SHE LL THICKNE.SS VS . ADIABATIC EXPONENT (After Blthop)
18
8/3/2019 Carl Kisslinger- The Generation of the Primary Seismic Signal by a Contained Explosion
http://slidepdf.com/reader/full/carl-kisslinger-the-generation-of-the-primary-seismic-signal-by-a-contained 28/96
Institute of Science and Technology The University of Michigan
The shell thickness ratio in the hvdrodynamic region is given uy
1 - -,_ Ii'
3 log ( b lp ( 2b- )- ] Ing LiT ~
Chaszeyka [221 describes the behavior of an aggregate of silica bh . ds and air intended to
simulate some actual earth materials under strong shock conditions. When a shock .-.n.s
through an aggregate, the solid particles undergo compression, bending, and shear. When siz-
able voids exist in the aggregate, the compres:ion of the included air causes the temperature
of the mixture to increase beyond that which would occur if a uniform sample of the solid were
shocked. The resaltn~g thermal ntrespc. in the solid add to the destructive effect (A he shockon the solid component. The result Is that the aggregate cr':shes down. to its solid fraction at a
pressure that Is low compared to its static crushing pressure.
Even though the shock propagates faster in a gas than a solid, the braking effect of the sur-
rounding solid tends to hold back the shock through the air, resulting In an essentially uniform
shock front.
Th e heat-transfer process from the compressed air to the solid particles is complex. In
developing the Rankine-Hugoniot equation of state for the aggregate, Chaszeyka assumes that
as the particles are crushed down (fillingthe Lvolds), they break up Into very small fragments
which are thoroughly Intermixed with the air so that temperature equilibrium occurs in about
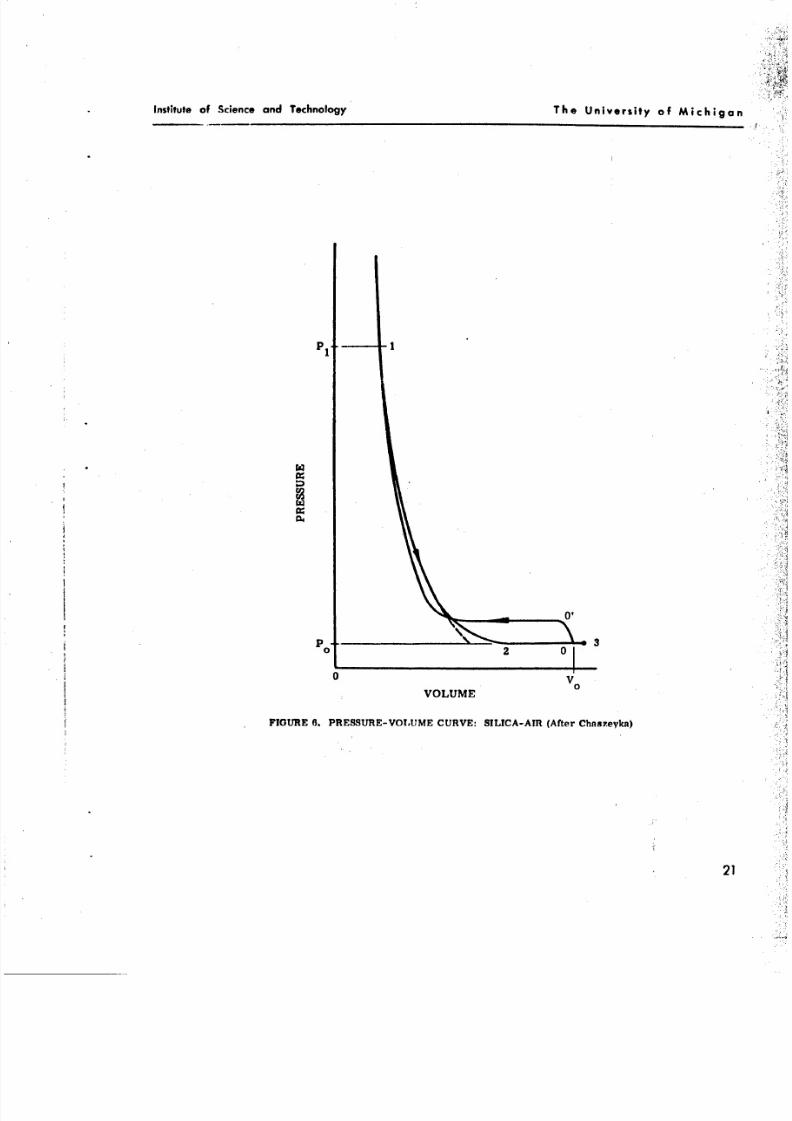
one microsecond. His equation of state will not be repeated here, bu t the resulting cycle for a
strong shock is shown In Figure 6. The equatci,. uf state Is derived by shocking the air and
the aggregate to the peak pressure, and then letting them reach all equilibrium temperature.
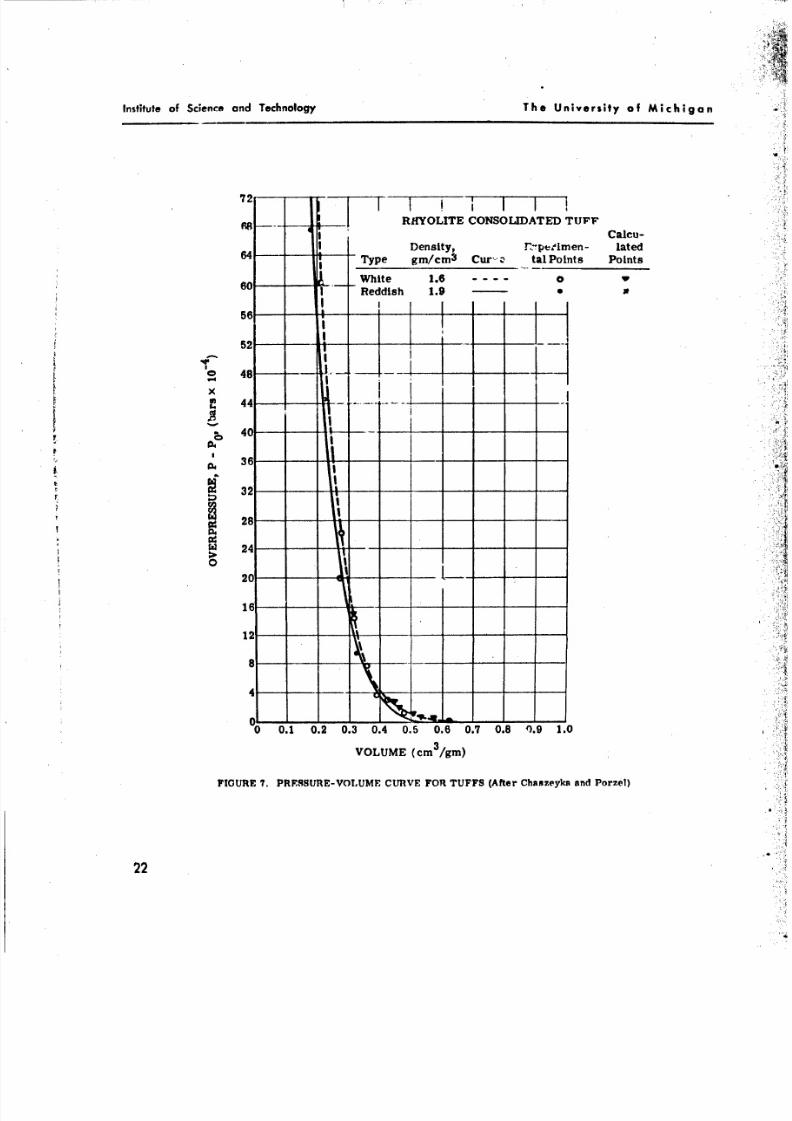
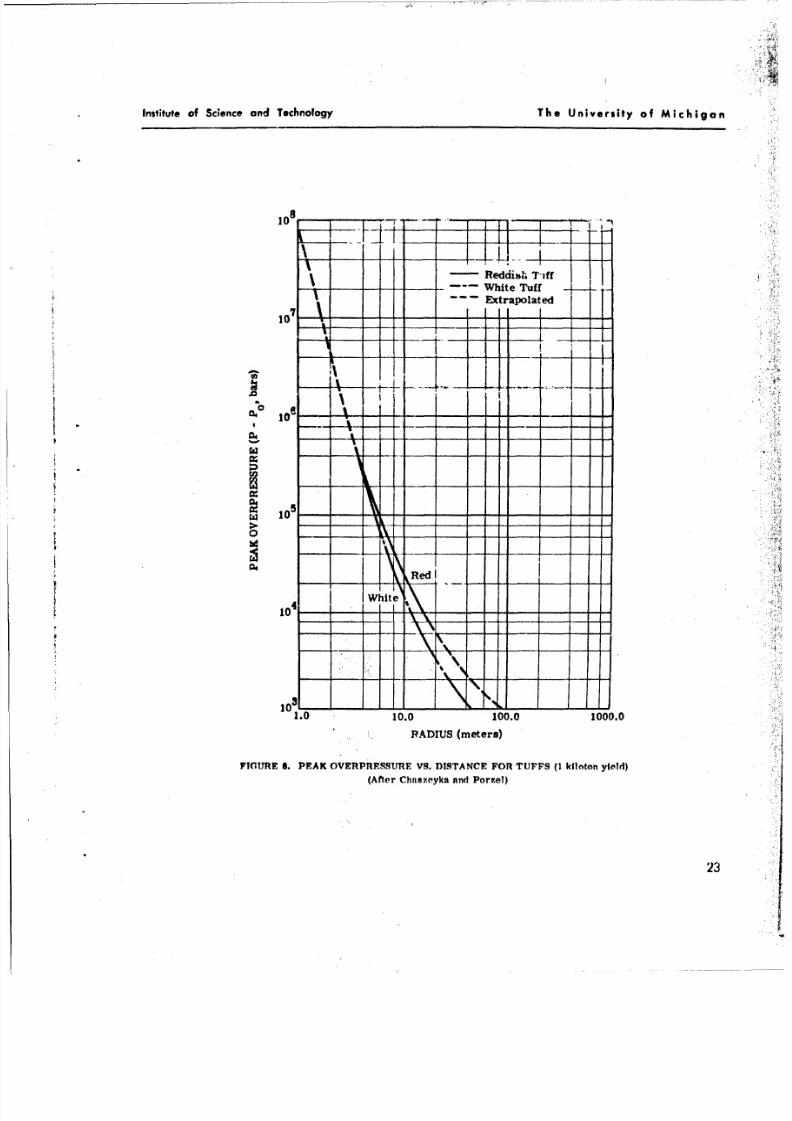
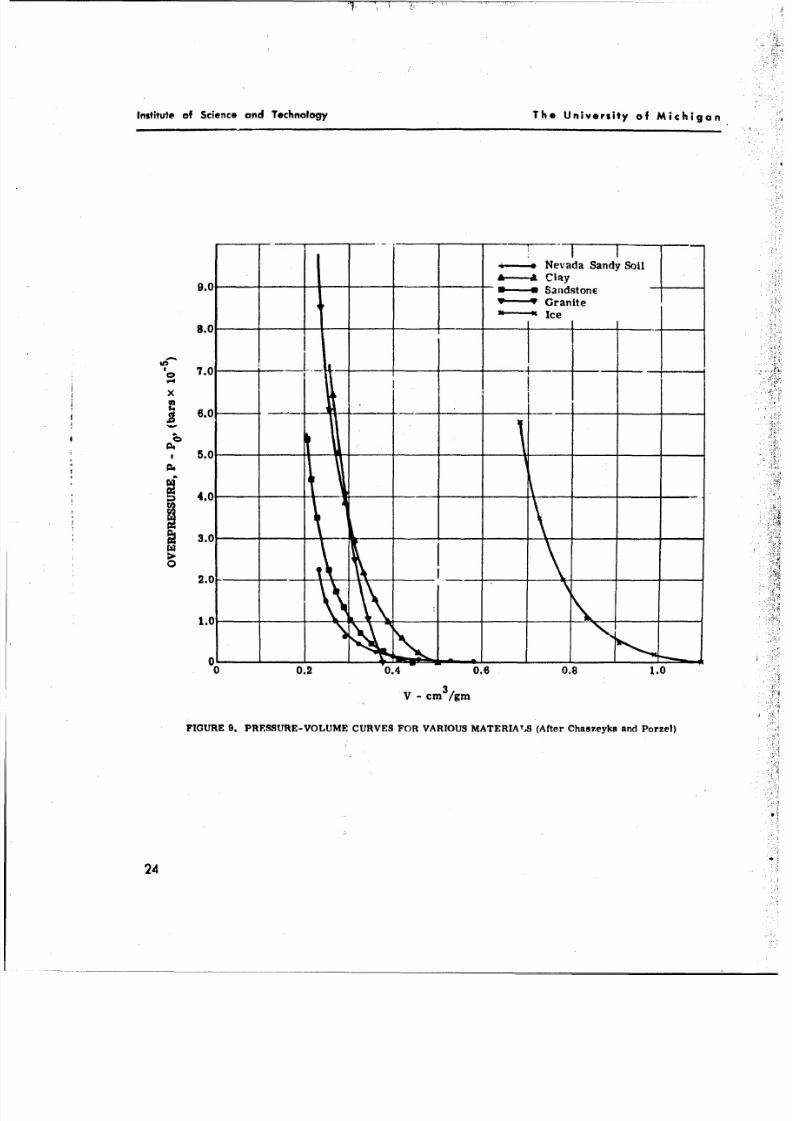
Results of an earlier study of equations of state and blast-wave properties by Chaszeyka
and Porzel [18] are shown In Figures 7 through 10. The materials selected were two types of
tuff, sand, clay, sandstone, granite, and Ice. The overpressure-distance curves are for a 1-kt
explosion.
This discussion requires an additional note on chemical explosions in solids. The shock is
never strong (in the quantitative sense of x > 100 [13, p. 1281), and it is known [22, p. 53-54]
that shock waves from nuclear explosions do not scale directly to those produced by chemical
explonions. Dishop explains how the Initial shell thickness ratio, xl, at the boundary between
the detonation wave In the explosion and the medium can be calculated in terms of the detonation
velocity in the explosive and the pressure at the boundary between explosive and medium. This
Input pressure may not be great enough to make the process hydrodynnniic; If It is high enough,
19
8/3/2019 Carl Kisslinger- The Generation of the Primary Seismic Signal by a Contained Explosion
http://slidepdf.com/reader/full/carl-kisslinger-the-generation-of-the-primary-seismic-signal-by-a-contained 29/96
Institute of Science and Technology The University of Michigan
however, then it is a straightforward calculation to use the value oi zI to get the other input
quantities needed to Ppply Equations 22 through 25 for the hydrodynamic region. Tf It is not, the
values are used as input to the equations in the crushing and cracking zone to e deelor-d in the
next section.
Brode [26] provides a complete example of the calculation W. he pressures on the wall of
a cavity enclosing a chemical explosion. His calculations Indicate thAL the cavIty pressure is
affected by the loading density of the explosive, the equation of state of the explosion lioducta.
the presence of air in the cavity, and the details of the detonation of the explosive material. It
is of greatest Importance to the present discussion #hat he was able to calculate cavity pressures
which, when used as Inputs to the calculation of elastic waves [27], gave results agreeing closely
with observed values.
Nicholls [28] has also done recent work on the manner in which thw pronerties of the ex-
plosive affect the energy appearing in the form of seismic waves. He concludes that the maximum
seismic energy is generated when the characteristic impedance of the explosive (product of load-
Ing density and detonation velocity) is equal to the impedance of the medium (product of density
and compressional wave velocity).
All investigators agree that progress In the analysis of strong shocks depends on additional
experimental data on the behavior of earth materials at the pressures Involved. As we have
seen, the pressure-vs.-specific-volume curve over the entire range of pressures from ambient
to the highest value of peak shock pressure enters Into the calculation of the response of the
medium.
Cushing and Relly [1r] point out the fact that avai, ble data are based on: (1) static tests,
(2) dynamic tests using small amplitude elastic waves, and (3) dynamic tests using shock waves.
Consequently, there is a lack of information about the behavior of soils and rocks at pressures
In the neighborhood of the crushing strength. The result Is that the response in the terminal
nonlinear region (discussed in the following section) is the greatest source of uncertainty in the
sequence of events from the explosion to the seismic signal.
20
8/3/2019 Carl Kisslinger- The Generation of the Primary Seismic Signal by a Contained Explosion
http://slidepdf.com/reader/full/carl-kisslinger-the-generation-of-the-primary-seismic-signal-by-a-contained 30/96
Institute of Science and Technology The University of Michigan
p I
04,
p30 2 01
0V0
VOLUME
FIGURE 6. PRESSURE- VOLUME CURVE: SILICA-AM (After Chamr~eyka)
21
8/3/2019 Carl Kisslinger- The Generation of the Primary Seismic Signal by a Contained Explosion
http://slidepdf.com/reader/full/carl-kisslinger-the-generation-of-the-primary-seismic-signal-by-a-contained 31/96
8/3/2019 Carl Kisslinger- The Generation of the Primary Seismic Signal by a Contained Explosion
http://slidepdf.com/reader/full/carl-kisslinger-the-generation-of-the-primary-seismic-signal-by-a-contained 32/96
Institute of Science and Technology Th e University of Michigan
108 -
Reddibl' T-iff~Wite Tuff
Extrapolated
C 10
0
1.0 10.0 100.0 1000.0
RADIUS (meters)
FIOU1RE S. PEAK OVERPRESSURE VS . DISTANCE FOR TUFS (I kiloton yield)
(After Chnmzeyka rind Porvzel)
23
8/3/2019 Carl Kisslinger- The Generation of the Primary Seismic Signal by a Contained Explosion
http://slidepdf.com/reader/full/carl-kisslinger-the-generation-of-the-primary-seismic-signal-by-a-contained 33/96
Institute of Science and Technology The University of Michigan
~-.Nevada Sandy Soil
9.0A Clay
9.0 S-4SandstonE
YYGranite
SIce
8.0 t 1~-*7.0
6.0-
* , 5.0 _
* 14.0 __
* 3.0 -
I Ilk
0 0.2 0.4 0.6 0.8 1.0
V - cm3 /gm
FIGURE 9. PRESSURE-VOLUME CURVES FOR VARIOUS MATERIATS (After Chaszeyka and Porzel)
24
8/3/2019 Carl Kisslinger- The Generation of the Primary Seismic Signal by a Contained Explosion
http://slidepdf.com/reader/full/carl-kisslinger-the-generation-of-the-primary-seismic-signal-by-a-contained 34/96
Institute of Science and Technology The University of Michigan
-4-- Nevada S~andy SOil,- -- Clay---
Sandctone.- 4--- Granite
0
106
0
1.0 10 .0 ADU 100.0 1000.0
RAIS(meters)
FIOtflE 10. PEAK OVE.RPRESSURE VS. DISTANCE FOR VARIOUS
MATERIALS (1 kilaton yield) (After ChRureyka and Porrel)
25
8/3/2019 Carl Kisslinger- The Generation of the Primary Seismic Signal by a Contained Explosion
http://slidepdf.com/reader/full/carl-kisslinger-the-generation-of-the-primary-seismic-signal-by-a-contained 35/96
Institute of Science and Technology The University of Michigan
THE TERMINAL NONLINEAR REGION: THE TRANSITION FROM A SHOCK
WAVE TO AN ELASTIC WAVE
In the region discussed here, he material no longer behaves hydrodynatnicatly because the
shear strength cannot be neglected, but the stresses still exceed t.- :a3tic limit. The processes
taking place in this region hold the key to many of the most i .lprtant questions within the scew.
of this report. The actual transition from a shock wave to a seismic wave occursat an overpres-
sure less than the crushing strength of the medium. The limits of this region of transition and
the characteristics of shock propagation within it are controlled by the crushing stress, the yield
stress, and the elastic limit. These properties may be the best parame-era to use in describing
quantitatively the effect of the medium on the seismic output of an explosion.Furthermore, the
entire pressure-volume curve for the p-vsinre range correspondiniu to the zon3 of traisition will
determine the waste heat deposited in It, and thereby determines the energ;, available to the seis-
mic waves. Many investigators retain the term "pressure" for this region, using it synonymously
with "mean stress," one third the sum of the principal stresses.
It was stated above that there Is no hope of recovering Information on the short-duration
pulse in the initial shock from seismic waves with the periods usually observed. If there are
processes which tend to lengthen the pulse, however, they must occur in this zone of transition,
and it may be possilble to deduce the character of the pulse at the output of this region from the
recorded elastic waves [12]. This pulse lengthening is not an apparent increase in the predomi-
nant period because of selective transmission of low frequencies by the earth.
The pressure range of interest here is almost untxplored both theoretically and experi-
mentally, except for work on metals [13, p. 69]. T' .iretlcal nalyses of waves in this region
are very difficult and have been approached through the application of theories of plastic flow,
fracture, and compaction.
The significance of this region's existence has long been recognized by exploration selsmol-
ogists, but apparently no workers in this field have seriously attempted to determine the effects
quantitatively. Clewell and Simon [29] recognized that the rise time of the input seismic signal
is very much lengthened relative to the detonation pulse from a high explosive because of inelastic
processes in this region. The result is a limitation on the power of reflected waves to resolve
thin beds in the sedimentary section.
Morris f6] also discusses the types of effects to be expected in this region. He recognizes
that earth materials are much weaker in tension than In compression, and points out that the
growth of cracks will accompany tensile stresses and that energy from the compressive shock
will be required to replace the strain energy released through cracking. lie also Indlcntes the
26
8/3/2019 Carl Kisslinger- The Generation of the Primary Seismic Signal by a Contained Explosion
http://slidepdf.com/reader/full/carl-kisslinger-the-generation-of-the-primary-seismic-signal-by-a-contained 36/96
Institute of Science and Technology The University of Michigan
change in pulse shape to be expected because large stresses undergr greater attenuation than
small ones in many earth media.
This last point is made clear by an examnin,ion of the Oynamic strci--kr-ln ,'rve for s:ltv
clay, Figure 11 [30]. Becaus,, iie unloading curve is almost vertical, considerable compaction
results from a stress cycle. The area between the loading a',d unloading curves represents en-
ergy lost from the stress wave. Lampson f30j comments thW 3.a'-ge stresses not only undcrgo
greater attenuation, but also propagate with a lower velocity, so that the waveforr. is spread
out in time and diminished in amplitude. The seismic wave velocity ordinarily observed is de-
termined by the slope of the curve for very low stresses.
Peet, In discussing seismic waves from a shock, assumes -n abrupt transition from a hydro-
dynamic region to elastic brhavior [241. He states that the nonlinear effects may ba confin ,d oa small region between the two zones, or the region miiy scalp with charge weight in the same
way the shock wave region does, so that his model of the source does not change. The boundary
between the two types of behavior is specified in terms of "a certain yield stress," and is no t
further defined. Peet's results will be discussed in more detail in the section on elastic wave
propagation.
Aoki [10) has obtained expressions for the seismic waves generated in this region and for the
wave form at its termination. His analysis is based on Tresca's yield condition for plastic flow
[311. He defines a plastic wave as any kind of wave with a propagation velocity less than an
elastic wave. But since these intermediate stress level phenomena may propagate In the form
160
14
120C-
, 100-
80 /
, 60-/
.20
0 0.004 0.008 0.012 0.016
STRAIN 8(m/m)
FIGURE 11. EXPERIMENTAL DYNAMIC
STRESS-STRAIN CURVE FO R FREE EARTH
(SILTY CLAY) (After Lampson)
27
8/3/2019 Carl Kisslinger- The Generation of the Primary Seismic Signal by a Contained Explosion
http://slidepdf.com/reader/full/carl-kisslinger-the-generation-of-the-primary-seismic-signal-by-a-contained 37/96
Institute of Science and Technology The University of Michigan
of cracks produced by brittle fracture, Aoki states that the term "fracture wave" may be more
appropriate than "plastic wave." He considers the cages of waves traveline behind the elastic
wave with speeds given by (k/p)1/2
and (pj/p) 1 1 ', w.ere k and p are thN in'nompressibility an d
rigidity, respectively. In either case, an elastic precursor runs aheadof the xi1ain shock, and as
the pressure decreases, the two merge to form th e elastic pulea.
Cushing and Reily rl2J have established an elastic-plastic static mnO-., using a procedure
very similar to Aoki's. They do , however, devote more attention to the equation of stpt' n he
region. They have also started work on a dynamic model in which the previous stress-strain
history of the medium is taken into account, an.v have set up a statistical model of a porous
medium.
Zvolinskii r521 assumes a fledrtn: bIwhich there is an abrupt change f-om linar elastic
behavior to an incompressible compqcted state. Since plaslit flow In th e compacted state is
irrever.!blo, he proposes.a model in which the plastic work is proportional to the change in the
greatest shear, with the proportionality constant depending on the mean stress. Essentially, he
generalizes the work of Aoki and Cushing and Reily by using a more general yield condition, in
which the difference between the maximum compressional and tensile stresses is a function of
the mean stress rather than a constant. He is one of several authors who model this region by
allowing the material to crush to an incompressible state.
Haskell [331 has also developed a static theory for the transition zone, using an incoherent
granular aggregate rather than a plastic as a model of the material. Then the stress in the zone
of failure is determined by the Coulomb-Mohr -vtterion [311 instead ofaTresca or von Mises
yield condition. Haskell compares his final resuits with data from chemical explosions in halite
and from the RAINIER event. He finds that he can match the data to his theory, but to do so he
must use values for the internal friction parameter that are much lower than those obtained from
compression tests on unconsolidated materials. lie suggests that plastic flow and fracturing both
may occur In the zone, giving this result.
Fugelso fIII points out several shortcomings of any application of present plastic deforma-
tion theories to cases in which the loads are applied very rapidly, or for a very short time. The
inherent difficulties in developing a theory of dynamic plastic deformation result from the nonlin-
earity of the equations and the fact that the stress-strain curve itself is a function of the loading
rate. Fugelso has developed a theory of plastic deformation based on the theory of dislocations
within a crystalline body, and applied it to the problem of impact loading of a rod, combining the
effects of elastic distortion and the movement of dislocations.
28
8/3/2019 Carl Kisslinger- The Generation of the Primary Seismic Signal by a Contained Explosion
http://slidepdf.com/reader/full/carl-kisslinger-the-generation-of-the-primary-seismic-signal-by-a-contained 38/96
Institute of Science and Technology The University of Michigan
Fugelso's conclusions include the following:
1. Th e deformation resulting from the ar-lva! of the stress wave z, .r in two steps: an
instantaneous elastic deforiatit and A ime-depetident plastic dtru:,rtl", .
2. Th e elastic wave propagater aQ a distinct wave, but ther, ' no distinct plastic wave.
3. The stress-strain curve for any material is not uilk,%, bu t is dependent on the strain
rate and the duration and magnitude of the stress.
In view of the work done also by Aoki and Zvolinskii (above), the conclusion reached here is
important: that th, eo!utlon gives no forward. ropagating wave that moves with a velocity lower
than that of the elastic compressional wave. Th e solution Is valid, of course, only for the one
type of nonelastic deformntinn mechanism assumed. Fugelso states that his model is Inten~ded
for crystalline bodies, and soils are specifically rntfln ned among n..dia for which more corn-
plicated mechanisms may be involved.
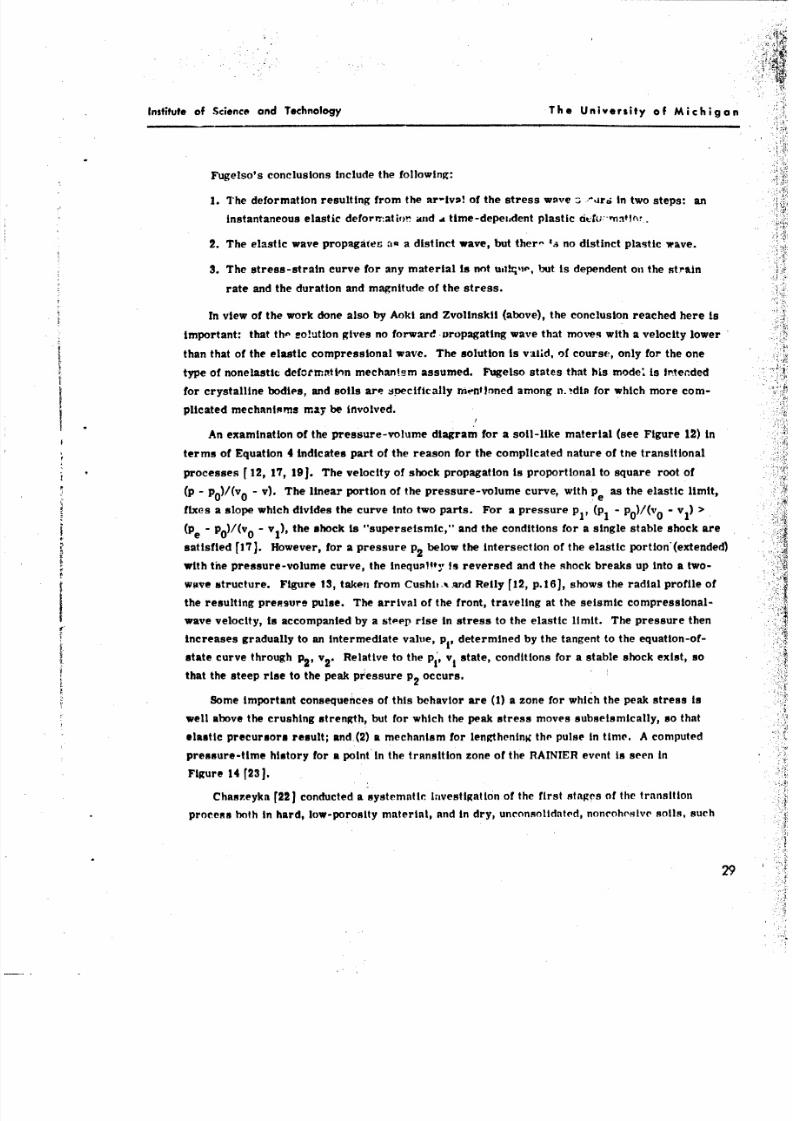
An examination of the pressure-volume diagram for a soil-like material (see Figure 12) in
terms of Equation 4 indicates part of the reason for the complicated nature of the transitional
processes [ 12, 17, 19). Th e velocity of shock propagation is proportional to square root of
(p - p0 )/(v0 - v). The linear portion of the pressure-volume curve, with pe as the elastic limit,
fixes a slope which divides the curve into two parts. For a pressure pl , (p1 - P0 )/(v0 - V) >
(Pe - p0)/(v 0 - vl), the shock is "superseismic," and the conditions for a single stable shock are
satisfied f17]. However, for a pressure P2 below the intersection of the elastic portion (extended)
with the pressure-volume curve, the inequality is reversed and the shock breaks up into a two-
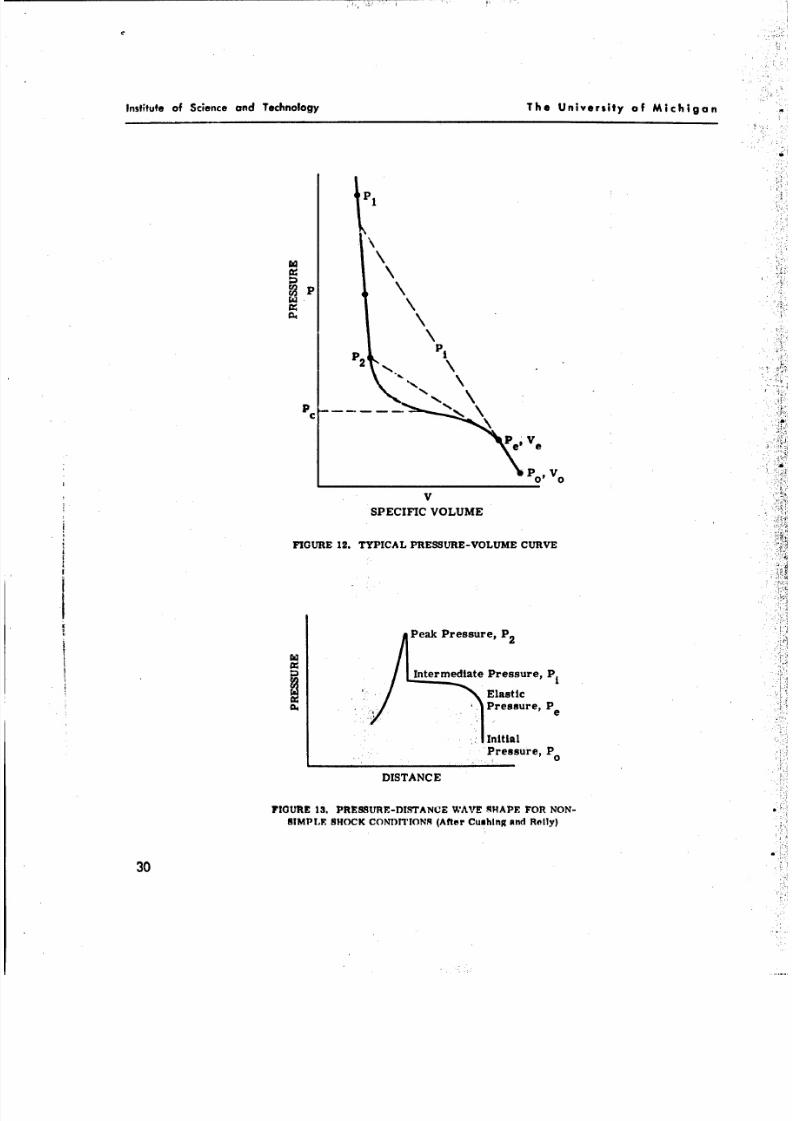
wave structure. Figure 13, taken from Cushit. and Relly f12, p.161, shows the radial profile of
the resulting pressure pulse. The arrival of the front, traveling at the seismic compressional-
wave velocity, is accompanied by a steep rise in stress to the elastic limit. The pressure then
increases gradually to an intermediate value, p, determined by the tangent to the equation-of-
state curve through v2 ' Relative to thep, vI state, conditions for a stable shock exist, so
that the steep rise to the peak pressure P2 occurs.
Some important consequences of this behavior are (1) a zone for which the peak stress is
well above the crushing strength, but for which the peak stress moves subsetsmically, so that
elastic precursors result; and.(2) a mechanism for lengthening the pulsein time.
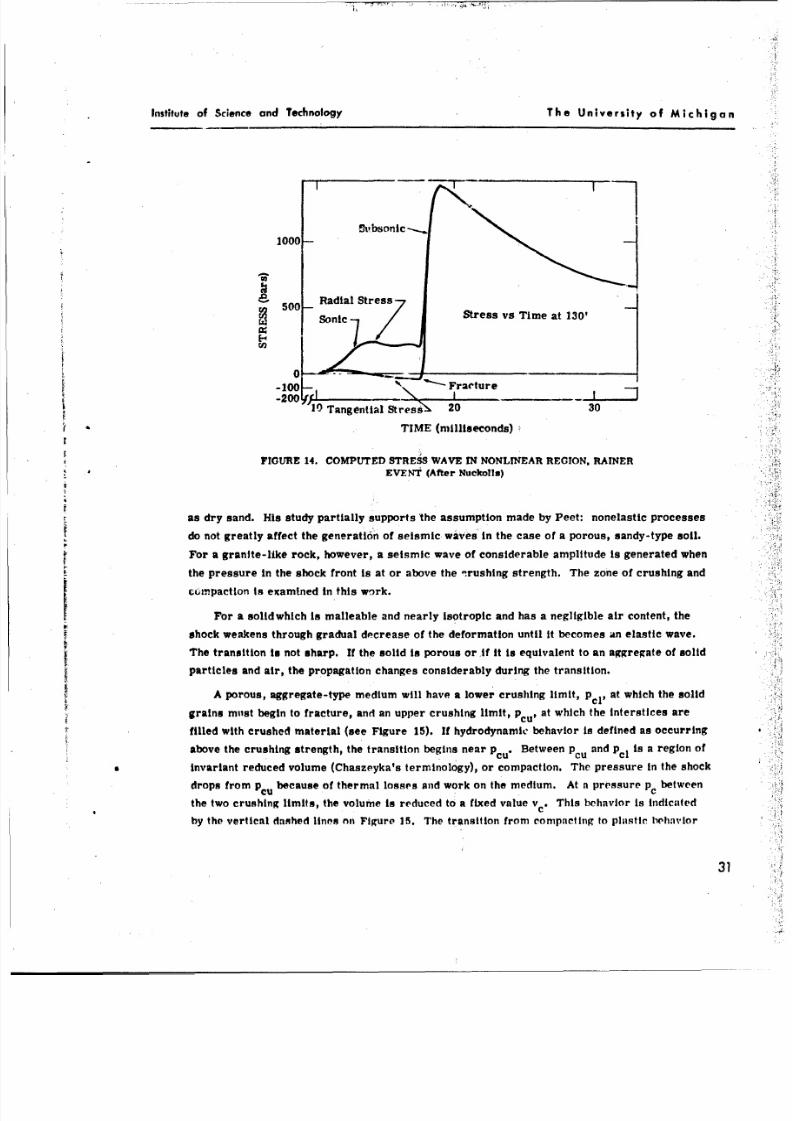
A computedpressure-time history for a point in the transition zone of the RAINIER event is seen in
Figure 14 [23).
Chaszeyka [221 conducted a systematic Ivestigation of the first stages of the transition
process both in hard, low-porosity material, and in dry, unconsolidated, noncoherslve soils, such
29
8/3/2019 Carl Kisslinger- The Generation of the Primary Seismic Signal by a Contained Explosion
http://slidepdf.com/reader/full/carl-kisslinger-the-generation-of-the-primary-seismic-signal-by-a-contained 39/96
Institute of Science and Technology The University of Michigan
gI
p
p1
pc*%
p ,Ve e
PoVo
V
SPECIFIC VOLUME
FIGURE 12. TYPICAL PRESSURE-VOLUME CURVE
Peak Pressure, P2
Intermediate Pressure, P1i
Elastic
Pressure, Pe
InitialPressure, P0
DISTANCE
FIGURE 111.PRESSURE-DISRTANCE WAVE 14HAPF FOR NON-
SIMPLE SHOCK CONDITIONS (After Cushing and Roily)
30
8/3/2019 Carl Kisslinger- The Generation of the Primary Seismic Signal by a Contained Explosion
http://slidepdf.com/reader/full/carl-kisslinger-the-generation-of-the-primary-seismic-signal-by-a-contained 40/96
Institute of Science and Technology The University of Michigan
th'bbonic1000
50 Radial Stres00 1
on Stress vs Time at 130'
0-100 -- ' Fratture
- 0Tangential Stres 20 30
TIME (milliseconds)
FIGURE 14. COMPUTED STRESS WAVE IN NONLINEAR REGION, RAINER* EVENT (After Nuckotls)
as dry sand. His study partially supports the assumption made by Peet: nonelastic processes
do not greatly affect the generation of seismic waves in the case of a porous, sandy-type soil.
For a granite-like rock, however, a seismic wave of considerable amplitude is generated when
the pressure in the shock front is at or above the -rushing strength. The zone of crushing and
comrpaction Is examined in this work.
For a solidwhich Is malleable and nearly isotropic and has a negligible air content, the
shock weakens through gradual decrease of the deformation until it becomes an elastic wave.
The transition is not sharp. If the solid is porous or if it is equivalent to an aggregate of solid
particles and air, the propagation changes considerably during the transition.
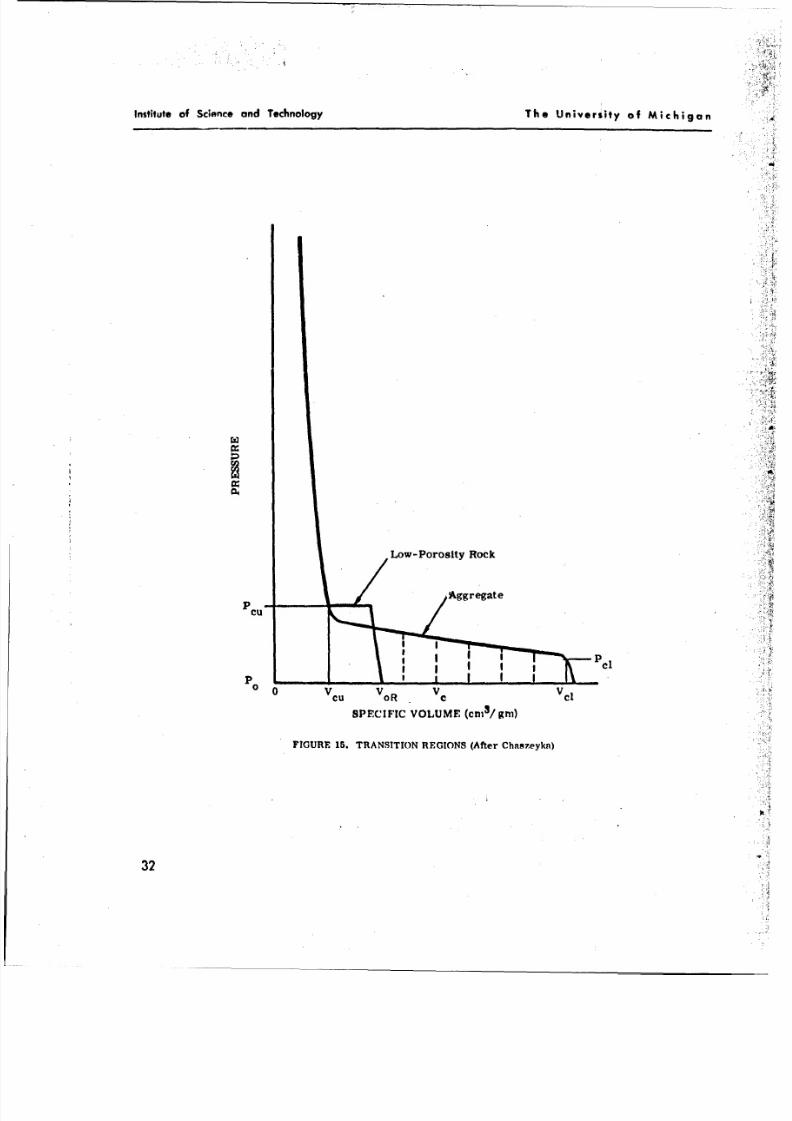
A porous, aggregate-type medium will have a lower crushing limit, pcl' at which the solid
grains most begin to fracture, and an upper crushing limit, ,cu't which the interstices are
filled with crushed material (see Figure 15). If hydrodynamic behavior is defined as occurring
above the crushing strength, the transition begins near pcu" Between pcu and pcl is a region of
invariant reduced volume (Chaszeyka's terminology), or compaction. The pressure In the shock
drops from Pcu because of thermal losses and work on the medium. At n pressure pc between
the two crushing limits, the volume Is reduced to a fixed value vc. This behavior is Indicated
by the vertical dashed lines on Figure 15 . The transition from compacting to plastic behavior
31
8/3/2019 Carl Kisslinger- The Generation of the Primary Seismic Signal by a Contained Explosion
http://slidepdf.com/reader/full/carl-kisslinger-the-generation-of-the-primary-seismic-signal-by-a-contained 41/96
Institute of Science and Technology The University of Michigan
Low-Porosity Rock
Aggregate
Pcu-
I Il
P -
00 Vcu V R Vc Vcl
SPECIFIC VOLUME (crn3/ gnj)
FIGURE 15 . TRANSITION REGIONS (After Chnmzeykn)
32
8/3/2019 Carl Kisslinger- The Generation of the Primary Seismic Signal by a Contained Explosion
http://slidepdf.com/reader/full/carl-kisslinger-the-generation-of-the-primary-seismic-signal-by-a-contained 42/96
Institute of Science and Technology The University of Michigan
occurs near pC ; the final transition to a seismic pulse occurs at ag overpre~qure below the
limit for plastic flow.
The solid particles are comprcssed during the compacting proceqs, bW . 'ir. 'Li-gen volume
from this caus, is negligWIb L-vpsf-'d to that arising from fracturing of the grains. The air
shock in this region is low. Th e energy loss that attenuatpvs the shock from Pcu to P is nearly
all due to work done In crushing the solid portion of the aggregil;,.
The behavior of a hard low-porosity rock is indicated by the step on Figure 15. .re a de-
finite value of the crushing stress exists at which the material crushes to hydrodynamic behavior;
below this value it behaves nearly elastically.
Chaszeyka gives a form for the variation in density, particle velocity, and pressure,troug.1-
the transition zone. Since the denity to which the material Is compacted decreases as the peakpressure drops with increasing ralkl ftstance, the density will be low.er at the shock front than
behind It. A density-distance relation of the form
p Ps(R/r)q (27)
is assumed, in which r is the distance to a point behind the front (r < R), and q = a log p
a log r'
By conservation of mass (and using the fact that p is constant behind the shock in the com-
pacted zone), the following expression for q is obtained:
I (R/R )q ()U/R)3]
q- Po 1 (R u R)3
in which Ru is the radiuscorresponding to pcu and is the smallest radius at which compaction
to constant density occurs.
For a particle velocity u1 at the front, the velocity at a point in the zone is
u uspOR (29)
pr2
33
8/3/2019 Carl Kisslinger- The Generation of the Primary Seismic Signal by a Contained Explosion
http://slidepdf.com/reader/full/carl-kisslinger-the-generation-of-the-primary-seismic-signal-by-a-contained 43/96
institute of Science and Technology The University of Michigan
The pressure distribution is found from conservation of moinentur.,. In terms of quantities
already defined,
4 (2- (q .R4[of (p s -PO)
O L 4- (2 - Zi (q- ]
R - d log us (-d log (p- - Po) 1 (:O
dlog (p -po - )50_1 ~ I R 1 r 1
This equation shows that fo r an aggregate the pressure decreases toward the origin from the
shock front.
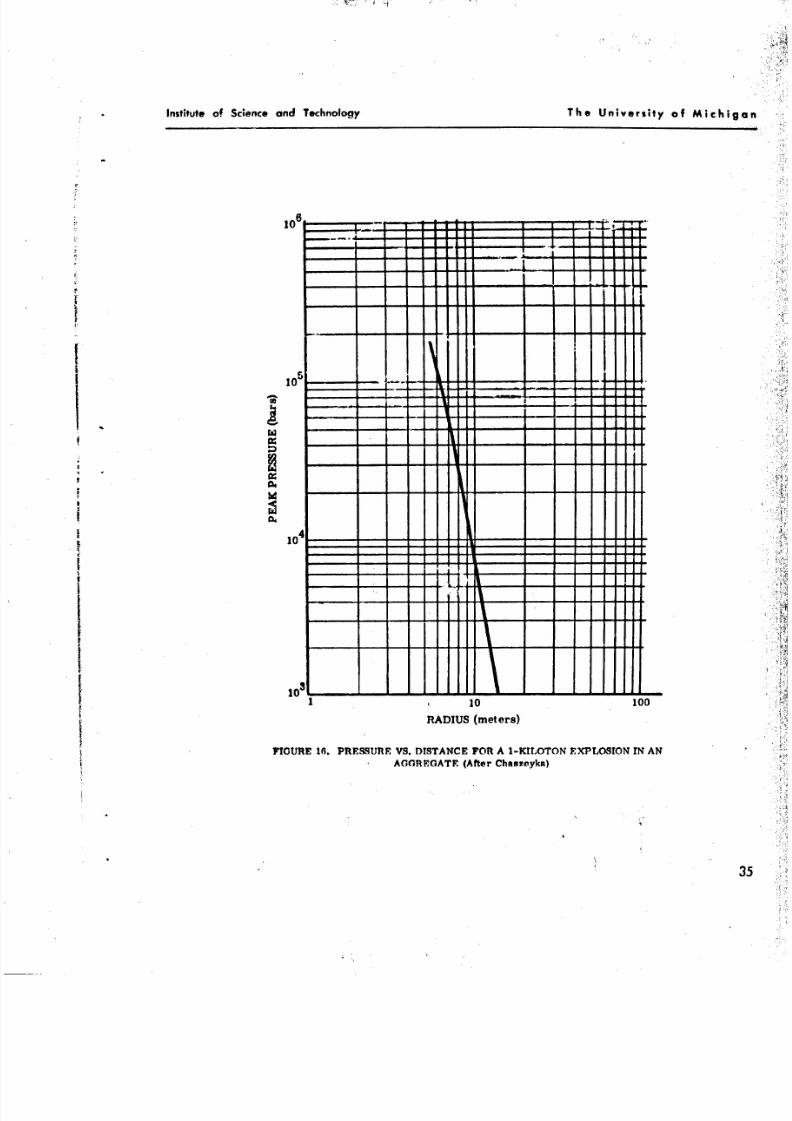
Th e decrease of peak pressure with radius of the Phoek is found by r technique of blast wave
integration developed by Chaszeyka a3. Porzel r181. Th e computed result for an aggregate of
69% silica And 31% air is shown in Figure 16; p falls off at about R"6 . Comparison with
Figures 2 and 3 shows that the pressure range covers the region of the crushing zone designated
by Bishop. The radius at which the upper crushing limit occurs can be found for any material
from a curve like the one shown In Figure 16 if adequate experimental information is available.
For a porous medium in the zone R > Ru , the value of q in Equation 27 varies from about
1.5 (when R Is 10% greater than Ru) to Zero (as R approaches Infinity). In this case, the small
part of the original energy from the explosion still remaining (less than 3%) Is dissipated in
crushing the solid particles; the shock weakens as a result of both this crushing work and spher-ical spreading.
For a hard rock, ps approaches p rapidly as the stress drops below the sharply defined
crushing limit. The exponent q has a low value and approachem zero quickly, being about 0.02
when R is 10% greater than Ru. Th e result is a relatively small energy decrease, and a strong
seismic pulse will be generated at a pressure only slightly below the crushing limit.
The transition discussed here is only the first in the sequence leading to the seismic pulse
[22, p. 144). For later transitions, associated with lower overpressures, we return to Bishop's
treatment. He divided the equation of state Into five regions, with several subregions (see
Figures 2 and 3). Starting from the high pressure end, Region V Is the previously discussed
hydrodynamic region fo r which x > 1, and , is nearly constant. A subrange in which large plastic
deformations occur is seen just above the hydrodynamic termination pressure, pH-
The pressure PH is approximated by p2 , corresponding to x = 0.5, and marks the upper limit
of Region TV, the rone of crushing. The crushing pressure Pc determines the lower boundary of
8/3/2019 Carl Kisslinger- The Generation of the Primary Seismic Signal by a Contained Explosion
http://slidepdf.com/reader/full/carl-kisslinger-the-generation-of-the-primary-seismic-signal-by-a-contained 44/96
Institute of Science and Technology The University of Michig
10
10
IsI
10
11 1010I RADIUS (meters)
FIGURE 111. PRESSURE VS. DISTANCE FO R A 1-KILOTON EXPLOSION IN AN
AGORFOATE (After Chaszoyka)
8/3/2019 Carl Kisslinger- The Generation of the Primary Seismic Signal by a Contained Explosion
http://slidepdf.com/reader/full/carl-kisslinger-the-generation-of-the-primary-seismic-signal-by-a-contained 45/96
Institute of Science and Technology The University of Michigan
crushing. The crack zone, Region TIT, is subdivided into two parts: Ilk, a region of hoop-stress
tensile cracks, 11b, in which shear stress cracks cccur. The lower limit of the crack zone is
designated pr' which denotes the highest presstire in ttsC stress wave for whien processes are
reversible. The boundary between th;. tw o types of crack occurs at the mtx!mu in the x - p
curve, at a pressure near twice the ambient pressure. Regions IIT z::. V represent trreversi-
ble, nonhydrodynamic behavior.
Region 11 is that in which processes are reversible, but strains are finite; Itegios I Is the
zone of elastic waves. Region 11 (called the "semlacoustic zone" by Bishop) begins at an over-
pressure of about 0.02 P PO.!
The low-pressure end of the x - p diagram will be considered in etail first. For strictly
infinitesimal strains, the adtahatic exponent Is y= Oo/Po see derivation of Equatio. 13). For
condensed media (liquids or solids), v0 is large compared to one for Po etir one bar. For small
but finite strains, the transtion across the shock will be nearly reversible. As Porzel 19, p. 41]
states, all materials are excellent transmittersof shock energy at low pressures. Bishop postu-
lates a form for y for the finite-strain, nearly reversible case that is analogous to that forYO
above:
,rev PoP o 31)
in which v is the semiacoustic exponent, and the compressional wave velocity c has beenrev 0
replaced by the shock velocity U. Vrev is also a large number, so that the value of x for reversi-
bie processes Is approximated by
xr = 1/2 o (32)
where p is small enough for the assumption of reversibility to hold. It follows that xr must be
small compared to one. In ordcr to carry on without experimental data, Bishop assumes 0.5 as
the maximum value of x for the semiacoustic region. From Equation 32, this requires that pr"
the reversible limit in terms of pressure,be less than or equal to POP the ambient pressure.
This choice of the reversible limit is based on the .fact that most earth materials have very
low tensile strengths. They will fail in tension as soon as the tensile hoop stresses associated
with the radial compressive stress overcome the lithostatic compression. This will occur at an
overpressure close to the ambient pressure.
By analogy with the elastic case, dynamic bulk and shear moduli can be defined such that
K s 0 K (1 x) - k + 4/3 ps. In the semiacoustic region, it is not unreasonable to take k s/,
a k/i, and Bishop postulates that this relation may be approximately true up to p 2po, the maxi-
mum pnint shown on Figures 2 and 3.
36
8/3/2019 Carl Kisslinger- The Generation of the Primary Seismic Signal by a Contained Explosion
http://slidepdf.com/reader/full/carl-kisslinger-the-generation-of-the-primary-seismic-signal-by-a-contained 46/96
Institute of Science and Technology The University of Michigan
The behavior in crushing has been discussed in the review of Chaszeyka's work; Bishop's
treatment, however, will be summarized here for" he 6ake of continuity. Tn the crushing region,
the dynamic bulk modulus ks is almost constant, w'hile the dynamic shea:- modultra p s is very
small. The x - p curve is v:!.Iy flat, with a constant value of x given by
x -1 2k/ I - .:c )2(33)
(see the discussion following Equation 16). Bishop concludes that no equation of state ca.i be
established for the crushing zone except by measurements on specific materials.
The onset of Region III (coming up from the low pressure envt) occurs when the medium is
first broken up into large fragments by radial cracks from the hoop stresses. This occurs
when the tensile stress exceeds the resiltant of the ambient stress and the tensilf, strc.gib of
the medium. It is not possible to assign a precise valuo to pr at which cracking begins because
of the tmperfcct nature of earth materials. The value p0 seems io be a reasonable estimate.
, As the stress increases above pr' the fragments are broken into smaller and smaller pieces
until the medium Is reduced to an almost homogeneous aggregate of particles of relatively high
strength; crushing then begins at pressure PC. Radial cracking predominates up to a pressure
of about2p^; above this pressure, circumferential cracks produced by shear stresses combine
with the radial cracks to make the smaller pieces. In the zone of shear stress cracks (see
Figures 2 and 3) the x - p curve has a negative slope, the shock velocity decreases with increas-
Ing pressure, and the previously discussed elasticprecursors result.
Bishop has developed equations, on the basic of numerous assumptions and approximations
iiecessitoted by the lack of experimental data, -.hich make it possible to follow the history of the
shock through the transition zone. He discusses these equations thoroughly; no attempt to justify
them fully will be made here.
The output of the hydrodynamic zone is the input to the crushing zone. Therefore, the cal-
culations start by finding R2 and p2 , the approximate radius and pressure of the shock at hydro-
dynamic termination, from Equations 22 through 25. The effective shell thickness ratio z2 is
found from Equation 26. Then, for PC < p < p2 :
-1 R
2 2
log P log + (35)p -.
3
8/3/2019 Carl Kisslinger- The Generation of the Primary Seismic Signal by a Contained Explosion
http://slidepdf.com/reader/full/carl-kisslinger-the-generation-of-the-primary-seismic-signal-by-a-contained 47/96
Insftiute of Science and Technology The University of Michigan
where x is given by Equation 33.
Some assumption about losses from the shock as it passes over the r is essential to
the development of these equations. Thr- blag. -wa-'e integratirn procedure - .!-V
Chaszeyka and Porzel f181 is w',thod of keeping track of the waste heat deposited durina prop-
agation of the shock. Bishop treats the problem in the followi;:1, inanner.
The heat loss per unit mass from the &hell 0 is found in terms of thc "aste heat Q (defined" "S
above) by Qs =GmGXQ, in which Gx Is a shock-strength factor which is zero for very str!",.
xIshocks, and G is a factor which depends on the medium. By assuming that Gx = (1 + x)
" , it
is possible to write Gm (1 + x) Qs/Q. A valne t Gm = 2.0 was found to agree well with experi-
mental data in the crushing zone for halite, tuff, and alluvium, the only earth materials investi-
gated. Equations 34 and 36 are hsuqed on this value.
In the cracking zone, with the overp-essure between the eru h.ing and reversible pressure,
good res lts were obtained by the use of an Inverse square law for o, erpressure decay:
log (pC/p) = 2 log (R/RC) (36)
where R is the shock radius at which Pc occurs.
In the semi-acoustic zone, p < prlog(~~=F log () +2 log 3 (37)
o, ,o< ,0:j<,The results of applying the theory to available datl from explosions in alite (COWBOY and
GNOME events) and volcanic tuff (HOBO and RAINIER projects) are shown in Figares 17 and 18.
Equation-of-state data were taken from Lombard r341, and ambient stress values are taken from
Adams and Swift [351. The COWBOY data are taken from Murphey ra]; the GNOME values are
from preliminary results obtained by the Sandia Corporation.
On these figures, R1 is the radius In feet of a sphere of pelletol TNT. With the pelletol1 3 .- 1/3 : '
density taken as 1.0 gm/cm , R/R 6.38 R W', whereW is the charge weight in pounds.
The value of R for the GNOME npiclear event was taken Ian 28.5 ft, the radius of a pelletol sphere
with the same energy release, 3 kilotons. Thecube root scaling brings the nuclear and small
chemical explosion data into good agreement.
Using the properties of pelletol and halite, Bishop"shows that the input pressure of 100
kilobars corresponds io the upper limit of the zone of crushing. There Is c'onsequently no hydro-
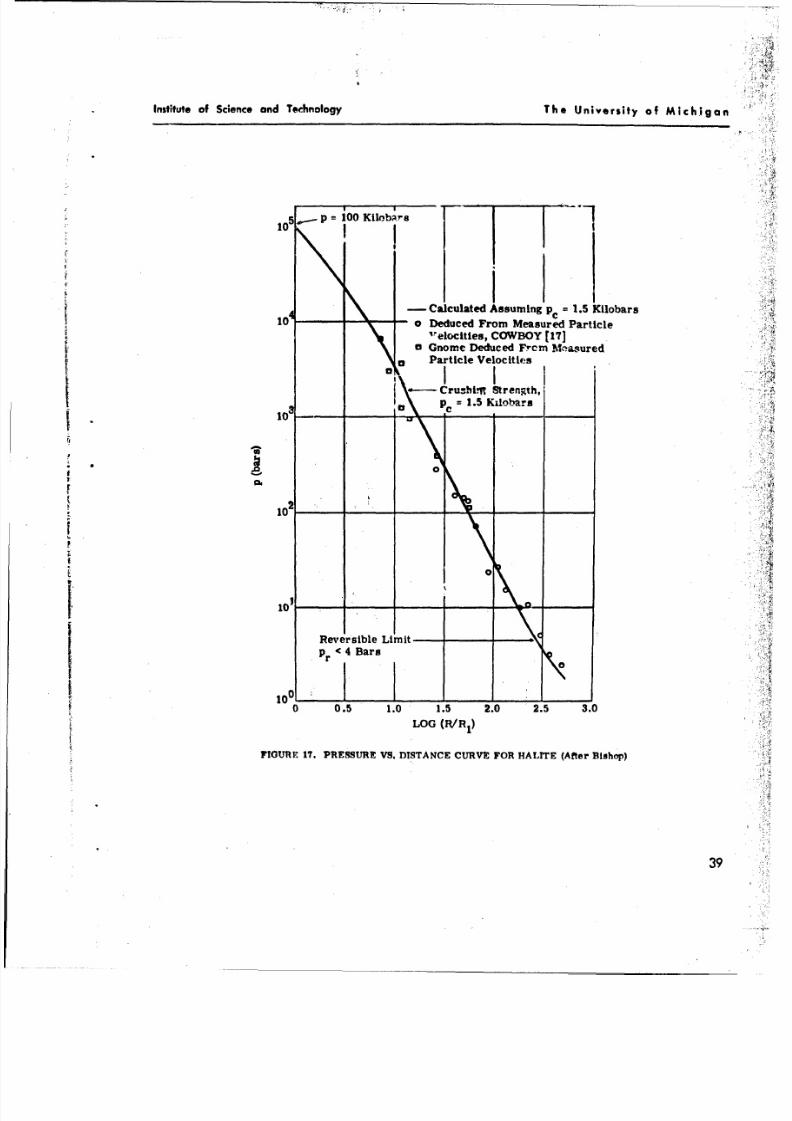
8/3/2019 Carl Kisslinger- The Generation of the Primary Seismic Signal by a Contained Explosion
http://slidepdf.com/reader/full/carl-kisslinger-the-generation-of-the-primary-seismic-signal-by-a-contained 48/96
Institute of Science and Technology Th e University of Michga n
5 .. P 100 Kiobare10j
104 - acltdAssuing Pc 1.5 Kilobars10 - a Deduced From Measured Particle
'"elocities, COWBOY (17]a Gnome Deduced F'cn iMasured
Particle Velocitie~s
-Cru--hi~ Strength,PC\ 1.5 Kilobars
10 -
100
0
101
Reversible L iit--j Pr<Bars
1000__ I -
0 0.5 1.0 1.5 2.0 2.5 3.0
LOG (R/R 1 )
FIOUtRr 17. PRESSUREP VS. DISTANCE CURVE FOR HALITE (After Bishop)
39
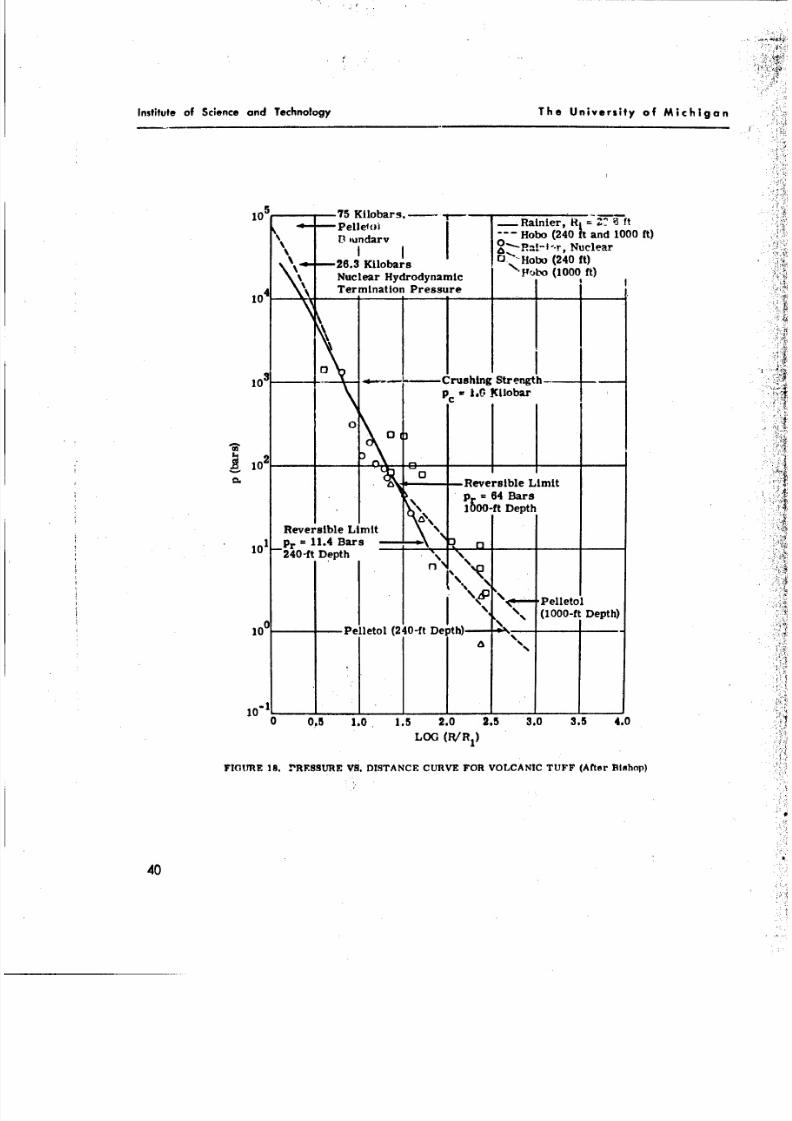
8/3/2019 Carl Kisslinger- The Generation of the Primary Seismic Signal by a Contained Explosion
http://slidepdf.com/reader/full/carl-kisslinger-the-generation-of-the-primary-seismic-signal-by-a-contained 49/96
Institute of Science and Technology The University of Michigan
10 ~ 75 Kilobars.- r -~~ane 3f
Pe-eiunda- Hobo (240 hand 1000 ft)
P mundrv 0-Pa-l,-r, Nuclear
II O'Hobo(240 ft)-- 26.3 Kilobars N11oo(10 t
Nuclear Hydrodynamic '~i( 10 t
4 \ Termination Pressure - __j-
10 ~Crushing StrengthI-
PC IX.0 lobar
0I
10I D
10 e
RReversible Limit
i~~ ~ p6 Bars4Bas21&30-f Depth
101 ~ ~ ~ ~ 100f Dr=1.eBxp20ftDpt)
100 Pelletol (240-ft De(00-ftDeth
010 0.5 1.0 1.5 2.0 2.5 3.0 3.5 4.0
LOG (RR 1)
FIGUYRE 18, rRESSURE VS . DISTANCE CURVE FOR VOLCANIC TUFF (After Bishop)
40
8/3/2019 Carl Kisslinger- The Generation of the Primary Seismic Signal by a Contained Explosion
http://slidepdf.com/reader/full/carl-kisslinger-the-generation-of-the-primary-seismic-signal-by-a-contained 50/96
Institute of Science and Technology The University of Michigan
dynamic region, and all pressures from the COWBOY series are in "he cracking region. The
plotted pressures in the figures were not measured, but %ere calculated from observed particle
velocities, using equations developed in the theory.
For tuff, the Input pressur-_- for pelletol is 75 kilobars. Values derived from Equations 34
and 35 are shown on Figure 18. The first quantitative resull.i 0,i the effect of source depth en-
countered in this review can be seen in the HOBO data. The ic-,-sble limit Pr is seen to n-
crease significantly as the depth of the shot (and therefore the ambient stress) Ine-eapes. The
maximum value this limit can attain has been set as the resultant of the ambient stress and the
tensile strength of the medium. The actual value may be smaller than this because of pre-
existing cracks or other departures from uniformity of the medl,.,ro. For the tuff, the reversible
limit is near the maximum, but it appears to be much less than the maximum of 59 birs fc;" the
COWBOY data on Figure 17 .
The tw o methods of ai.;dysis, Chaszyka's and Bishop's, can be compared by the results
presented on Figures 8 and 18 for explosions in tuff. The abscissas of Figure 8 are to be divided
by 6.0 (the value of Rin meters) for one kiloton, and the logarithm taken. Thus six meters on
Figure 8 corresponds to 0.0 on Figure 18, 30 meters to 0.7, and 60 meters to 1.0. The region of
overlap is therefore limited, but within this region the agreement is very good. The tendency for
the pressure-distance curve to be slightly concave to the distance axis shown on Figure 18 is no t
seen on Figure 8. It is concluded that both tnethods of analysis are sound, and the principal need
is for more experimental data.
Although the nonlinear processes have be,,, analyzed for the manner in which they absorb
energy from the shock pulse, no analysis has b* ,, made of the seismic signal proceeding from
these disturbances directly. Only the radial compressional pulse is followed. A growing crack
is a source of seismic waves, and experimental evidence has been accumulated that these waves
can be observed [37]. It has been suggested also that the boundary between the expanding explo-
sion products and the surrounding medium may be unstable, developing wave-like perturbations
so that the output from the source may not be spherically symmetrical [38].
Propagation in the elastic region will be reviewed next on the assumption that the source is
spherically symmetrical; the evidence of nsymmetry will be discussed subsequently.
6TH E ELASTIC-WAVE REGION
The entire earth, outside of the hydrodynamic and nonlinear regions discussed In the pre-
vious sections, constitutes the region of elastic wave propagation, This report does no t consider
41
8/3/2019 Carl Kisslinger- The Generation of the Primary Seismic Signal by a Contained Explosion
http://slidepdf.com/reader/full/carl-kisslinger-the-generation-of-the-primary-seismic-signal-by-a-contained 51/96
Institute of Science and Technology The University of Michigan
the details of the effects of departures from ideal elasticity in this region on the shape and am-
plitude of the seismic signal. Also omitted are the de'alis of the structure of the crust and upper
mantle, which must be taken into account in deternlning the actual amplith of the vi.'ous
seismic waves a observed at distlit points f1]. Attention is directed to the signal at short
ranges, and at long ranges if the medium ib homogeneous and 't,.*e in extent.
Theoretical and experimental studies of explosion-generated elAtic wa.ts have been car-
ried out for many years, starting with the early work in exploration seismology, soniewhat
later extending to quarry and mine-blast observations, and most recently to nuclear explosions.
Some of the experimental work has been designed 'o test theoretical results, buit most of it has
been directed to empirical correlations of maximum seismic wave amplitude with various
parameters characterizing tho explosion and observation condition's. Results of the serrch ftor
empirical scaling relations are covered in. a later sectln of this report. The early theoretical
papers made no attempt to deterrulne numerical values of amplitude in terms of charge weight.
In a classic paper, Sharpe (3 ] attempted to explain certain facts known from experience to
exploration seismologists. Referring specifically to seismic reflections from horizons in the
sedimentary section, he summarized these observations as follows:
1. A given amount of explosive detonated in a clay or water-saturated sand formation re-
suIts in a greater amplitude of reflected motion than an equal charge detonated in a dense, rigid
formation such as limestone.
2. If a hole is sprung by an initial large charvP In order to form a sizable cavity, later
small charges will result in a larger amplitude of .NklEcted motion than would be produced in
the absence of springing.
3. The frequency spectrum of reflected motion is a function of the formation in which the
charge is fired: shots fired in the low velocity zone result in very low frequency motion com-
pared to shots fired below the low velocity zone; shots fired in a rigid material (such as a
limestone) result in a much higher frequency motion than shots made in , for example, a shale;
in a general way, the high frequency content of reflected motion increases with an increase In
shooting depths.
4. The frequency spectrum of reflected motion Is a function of charge size; a large charge
has a tendency to increase the proportion of low frequencies in the reflected motion.
5. The amplitude of reflected motion produced by a given quantity of a high explosive Is
much greater than that produced by a quantity of low-speed explosive, even when the maximum
pressure is the same.
42
8/3/2019 Carl Kisslinger- The Generation of the Primary Seismic Signal by a Contained Explosion
http://slidepdf.com/reader/full/carl-kisslinger-the-generation-of-the-primary-seismic-signal-by-a-contained 52/96
Institute of Science and Technology The University of Michigan
These statements touch upon every point of concern within this presnt report: I.e., the effect
on the amplitude aind spectral content of the seismic ignal of the medium P'lund the shot, the
depth of burial, the yield, the coupling, and thWe prop rties of the explostvo materla!.
6.1. THE WAVEFORM OF EXPLOSION-GENERATED P WAVE!'
Sharpe took as his source model a spherical cavity ariird the shot having a radius, a, Ierge
enough so that only elastic processes took place at or outside the surface. 'rids ca 'lty is desig-
nated the "equivalent cavity" or the "equivalent radiator" by various authors. An exponentially
decaying pressure pulse, with the pressure equal at all points of the spherical surface, was
postulated as the loading equivalent to the explosion: p(a, t) = pe = ~~r"e ...;i
No attempt wac made to relate a, P_ or a to the site of the charge and the proerties of
the medium.
Although Sharpe obtained his results for the special case in which Poisson's ratio a 0 .2-9
or X fi it is useful to generalize the result for an arbitrary elastic medium. This has beei.
done by Blake [5], but the solution will be given in a slightly different notation. The ratio of shear
modulus to Lam6's constant, ji/i a m, will be used in place of the parameter K introduced by
Blake. Thus, a - 2 ( m), and m = for =0.25.
The displacement potential for the exponential pressure on the cavity wall Is given by
a~ 1 f mu0i"ap a)- 2 , Wi (-t)ix
+ -o .
0os W + sin wo (38)
in which p u density
r m distance from center of cavity
2cvm +
C , -_2y_ compressional wave velocity in the medium
r -ac
43
8/3/2019 Carl Kisslinger- The Generation of the Primary Seismic Signal by a Contained Explosion
http://slidepdf.com/reader/full/carl-kisslinger-the-generation-of-the-primary-seismic-signal-by-a-contained 53/96
Institute of Science and Technology The University of Michigan
The displacement, which is purely radial under the assumptions, .s the derivative of the
potential in Equation 38 . For the important special ,ase uf a step in pressur"', v- 0, and the
displacement' is
ap r x ]-+mi'!
sin 7- + tan"1 + 2' 1rm exp ( sin wt (39)1W m + m 2
The first te'rm represents the permanent displacement resulting from the fact that.the
pressure p continues to act on the cAvitY forever. At large ranges; (r >> a), the last term in
Equation 39 predominates.
U 2 m ( sin Wt (40)
Th e displacement is thus a damped sinusoid with angular frequency Wo, which varies directly as
the compressional wave velocity and inversely as cavity radius, and becomes low for small
values of m, characteristic of soils.
For small values of m, the amplitude becomesz large (and g becomes small), assuming that
the peak pressure and radius at the inner bounda,.% of the elastic region are unchanged.
The damping factor (fraction of critical damping) C is a function of the properties of the
medium:
2 ,n1/2 1)/2 (4 1)
The motion in rock (for which ni islneir'1.0) will be more highly damped, or less oscillatory,
than In soil. Aoki [101 presents waveforms for particle velocity which illustrate this for m 1.0
and 1/75 (mee Figures 19 and 20). The effect of including elastic precursors from the nonlinear
region, as Aoki does, is to increase the rise time of the signal. The following notation applies
to these two figures:
'The symbol "u" is widely used for particle velocity in hydrodynamics and particle displace-ment in elasticity theory. Rather than introduce a new symbol, the same symbol is used forboth in different parts of this report. From this point, "u" is displacement, "v " it; velocity.
44
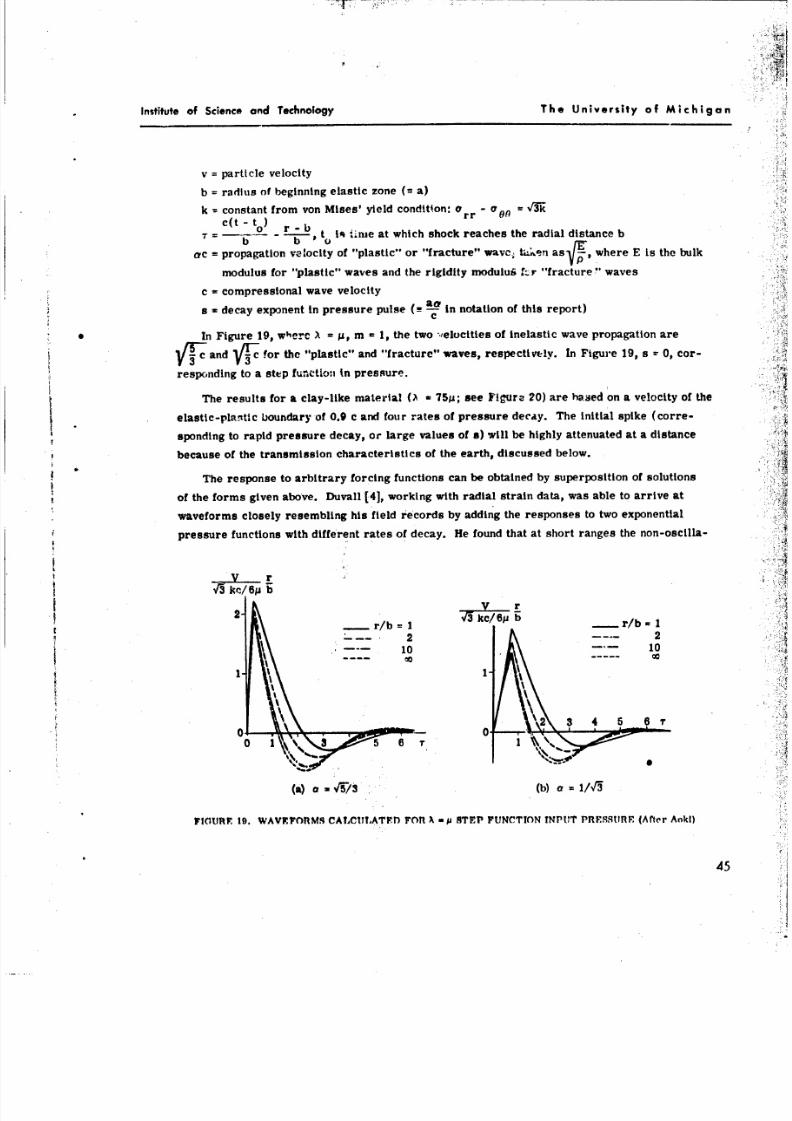
8/3/2019 Carl Kisslinger- The Generation of the Primary Seismic Signal by a Contained Explosion
http://slidepdf.com/reader/full/carl-kisslinger-the-generation-of-the-primary-seismic-signal-by-a-contained 54/96
Institute of Science and Technology The University of Michigan
v = particle velocity
b = radius of beginning elastic zone (0 a)
k = onstant from von Mises' yield condition, r O0n 3c(t - t0 rr
to-) , ime at which shock reaches the radial distance bb to
tc= propagation velocity of "plastic" or "fracture" wavc t"en asF-_,here E is the bulk
modulus for "plastic" waves and the rigidity modulus I---r "fracture" waves
c a compressional wave velocity
s r decay exponent in pressure pulse (e.2 in notation of this report)c
S-In Figure 19, wherc X = r,1, the two -,,elocities of inelastic wave propagation are
and for the "plastic" and "fracture" waves, respectively. In Figure 19, s 0, cor-
responding to a step function in pressure.
The results for a clay-like material (A a 7511; see Figure 20) are based on a velocity of the
elastic-plantic boundary of 0.9 c and four rates of pressure decay. Th e initial spike (corre-
spending to rapid pressure decay, or large values of a) will be highly attenuated at a distance
because of the transmission characteristics of the earth, discussed below.
Th e response to arbitrary forcing functions can be obtained by superposition of solutions
of the forms given above. Duvall [41, working with radial strain data, was able to arrive at
waveforms closely resembling his field records by adding the responses to two exponential
pressure functions with different rates of decay. He found that at short ranges the non-oscilla-
Sr7. 7
Vr3 kcc/6jib
_r/b=I r/bi I!!
2 2
oko
2 3 4 5 6 7
0 0-
(a) a - '/3 (b) a= l/I3
FtOURE 19. WAVEPORMS CALCULATrD FOR X •/ STEP FUNCTION INPUT PRESSURE (After Aoki)
45
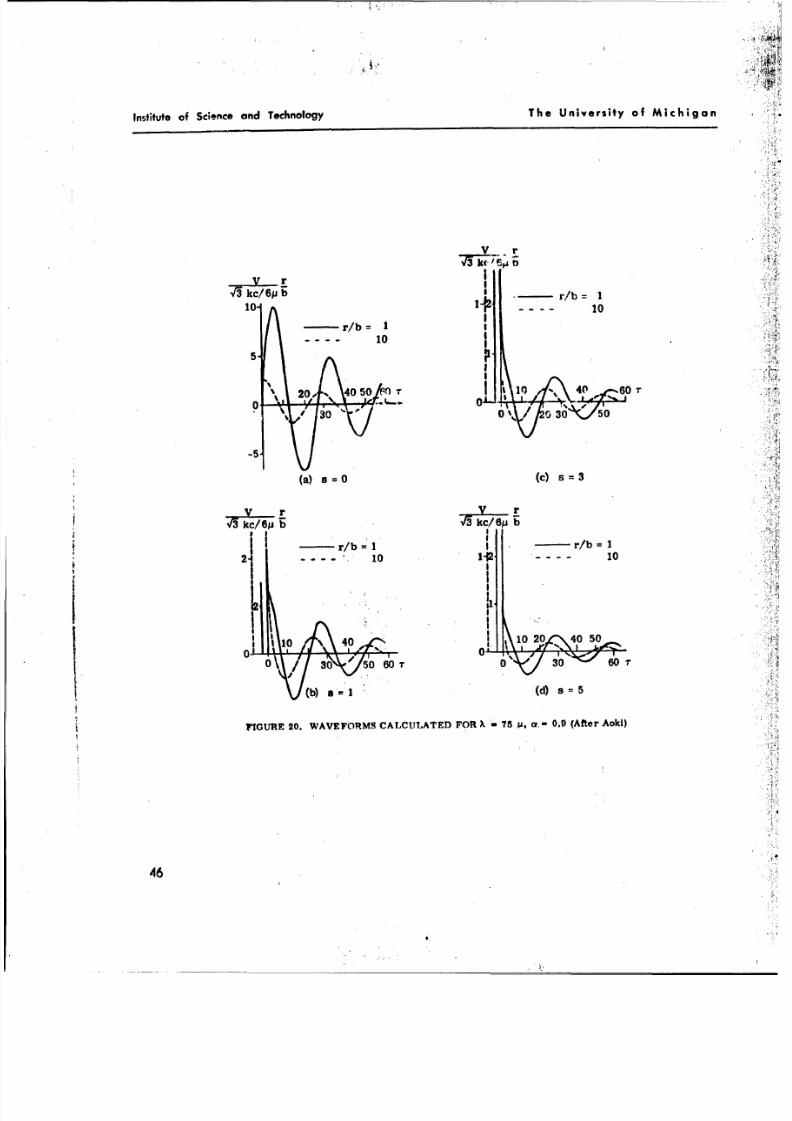
8/3/2019 Carl Kisslinger- The Generation of the Primary Seismic Signal by a Contained Explosion
http://slidepdf.com/reader/full/carl-kisslinger-the-generation-of-the-primary-seismic-signal-by-a-contained 55/96
Institute of Science and Technology The University of Michigan
V r
'/3 kc/6p b Ir/b=
10-1f 10
r/b=- - - - 10
\ 20., 40 50/ T0 1In 40 0
30 D\/~30'V,/50
(a) s=0 (c) S 3
V r73 kc/61ib 3kc/ 6,ub
2 -r/b=I I r/b=11
40
0 30 500 00 10r
(b) I= (d) a= 5
FIGURE 20. WAVEFORMS CALCULATED FOR X~ 75 sA,a. -0.9 (After Aoki)
46
8/3/2019 Carl Kisslinger- The Generation of the Primary Seismic Signal by a Contained Explosion
http://slidepdf.com/reader/full/carl-kisslinger-the-generation-of-the-primary-seismic-signal-by-a-contained 56/96
Institute of Science and Technology The University of Michigan
tory part of the solution predominates, and the time of the first zero crossing is not accurately
predicted by taking a half period corresponding to wo . He also points out '= t the range at whici0
elastic behavior begins cannot be determined by lo.ating the limit of fvo-cillat.;-v wave s.pes.
Vanek [39, 40, 41] has cx:'nfned the effect of the higher power terms In 1/r in so!utions like
Equation 39 . These terms produce a region two or three ti!.,s the radius a in which the peak
amplitude of the spherical compressional waves decays faster ta n r-1. Since the material is
assumed to respond in a perfect elastic manner, this requires an abnormal attetwiation die to
geometric spreading. Vanek concludes that the peak amplitude propagates faster than the wave
front in this zone, the more rapid propagation -ielding the faster attenuation. This conclusion
implies that the beginning of the elastic zone cannot be determined experimeatally by finding
the shortest range at n-hI'h the peak displacement decays as the inverse first powe., of the dis-
tance.
An exeellcnt opportunity to test thit: entire approach to the theory of explosion-generated
seismic waves was offered by the Project COWBOY experimental series. The objective of thet
program was to test the use of cavities to decouple underground explosions [36, 42, 43, 44].
* The subject of decoupling itself is outside of the scope of this report, but the results of some
of the investigations carried out in connection with COWBOY are directly related to the topic.
Data obtained from some of the shots in this series apply directly to this discussion; the
shots were fired in cavities of sufficient size that the response of the salt was nearly elastic,
if not exactly so. The conditions of the theory outlined above were therefore satisfied at thecavity boundary. Comparisons of theoretical wavnforms (based on elastic response) with
observed ones are presented by Parkin [27] anc. y Herbst, Werth, and Springer [431.
Parkin used the theoretical pressures on the cavity boundaries calculated by Brode [26] as
the input to his computation of displacement and other motion parameters as functions of range
and time. The results for the decoupled shots were excellent; those for the "overdriven" cayt-
ties showed departures which could be ascribed to plastic deformation. Parkin obtained his
results by the direct numerical evaluation of the integral solution for the displacement for an
arbitrary pressure waveform on the cavity wall.
Herbat et al. [43] present a theoretical waveform for one of the cavity shots in the COWBOY
series which agrees very closely with that observed. The technique used here also was numer-
ical integration of the equations for elastic response.
As shown earlier in this report, the smallest radial distance at which the stress is low
enough for the response to be elastic is a function of the medium, the depth of the source, and
the yield. For a given medium an d depth, the peak pressu.'e, Pr at the boundary between the
47
8/3/2019 Carl Kisslinger- The Generation of the Primary Seismic Signal by a Contained Explosion
http://slidepdf.com/reader/full/carl-kisslinger-the-generation-of-the-primary-seismic-signal-by-a-contained 57/96
Institute of Science and Technology The University of Michigan
elastic region and the nonlinear zone is a constant. The basis of decouplIng a shot is that the
radius at which the pressure is down to pm i much smaller for a cavity shot than for one tightly
tamped in the medium [44], and therefore the radiated ainplitudn is found to be smaller from
solutions like Equation 40.
6.2. THE SPECTRAL CONTENT OF EXPLOSION-GENERATeD P WAVES
Solutions of the form of Equations 39 or 40 suggest that a natural frequency vco eetermined
by the properties of the medium and the size of the charge, will characterize the compressiaiali
wave. However, this conclusion ignores the fact that the earth acts as a low-pass filter upon
elastic waves [29, 44]. Using numbers suggested by O'Brien [7] for a !00 lb shot in a medium
with a P-wave velocity of 5000 fps and Poisson's ratio of 0.25, we f!nd that w is 471 rad/sec,
corresponding to a frequency of 75 cps. Fr.oaencles in this range are commonly observed in
the reflection method of seismic prospecting, but they are not ticcuntered in observationg at
larger distances. Even if they are transmitted, most of the instrumrnta tion used for recording
at distances of more than a few km will not pass frequencies higher than about 10 cps.
Therefore it is necessary to examine the amplitude spectrum corresponding to the solution
above, and attempt to determine the effect on the observed amplitude of the low-pass character
of the transmission-recording system.. This has been done by several investigators, all of whom
arrive at similar conclusions [7, 24, 45, 46, 47].
Peet has developed a theory in his attempt to relate amplitude to yield, in which the shock-
wave and elastic-wave regions are in juxtaposition. Th e validity of his results for the elastic-
wave region is not in any way affected by the fact thp terminal nonlinear region has been neg-
lected, as long as the actual radial distance to the ela6.lc zone increases as the cube root of the
yield. Only the numerical value radius of the equivalent cavity in terms of the yield may be
incorrect. In turn, this affects only the numerical values of amplitude.
On the basis of the output from the hydrodynamic region, Peet finds the following relations
at the input to the elastic wave region, r =,a:
p(a, t) pm exp 4cW 1 42)
where a (c/pm)•/nWI/3
pm radial stress at which elastic behavior begins (a property of the medium)
t a time from start of shock %,Ave
c-, c- constants
n a enmpirical quantity '1.16
48
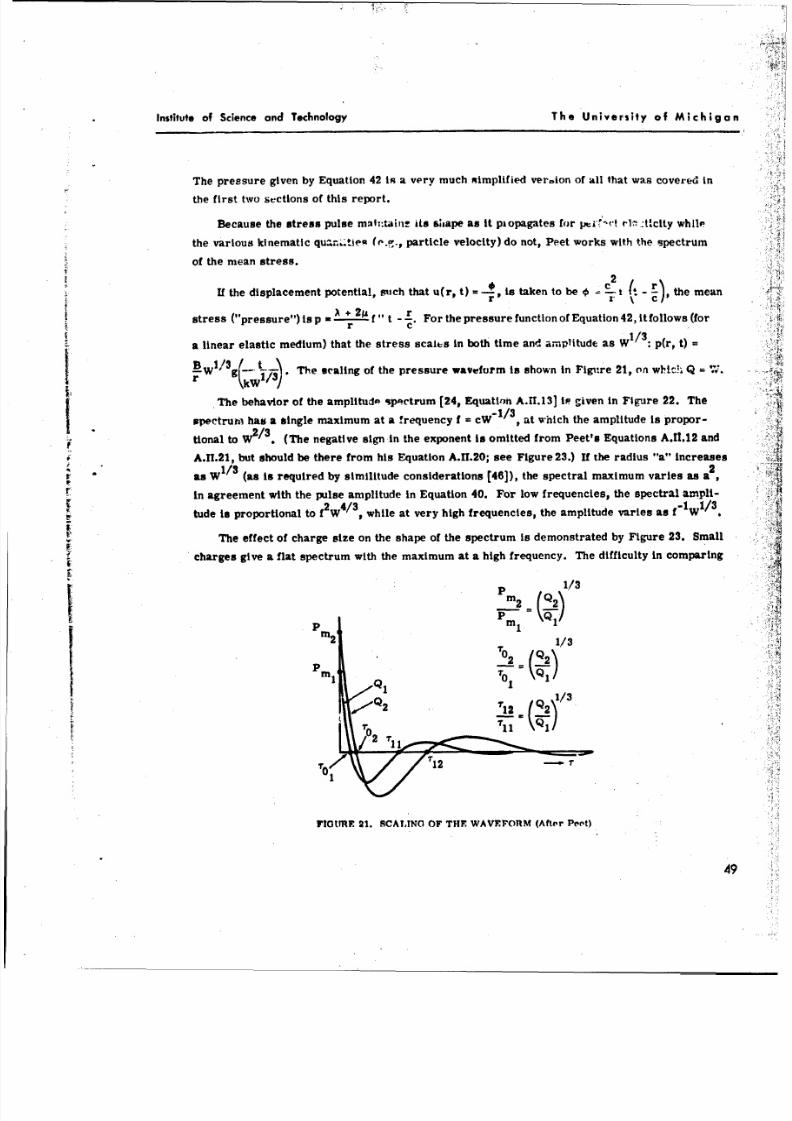
8/3/2019 Carl Kisslinger- The Generation of the Primary Seismic Signal by a Contained Explosion
http://slidepdf.com/reader/full/carl-kisslinger-the-generation-of-the-primary-seismic-signal-by-a-contained 58/96
Institute of Science and Technology The University of Michigan
The pressure given by Equation 42 is a very much simplified verion of all that was covered inthe first twvo se~ctions of this report.
Because the stress pulse mst:ftiiiibi its s~aape as it piopagates for ptitrct 4-V!.:ticity while
the various kinematic qu:.. .tieste'. particle velocity) do not, Peet works with the spectrum
of the mean stress.
2 \ em aIf the displacement potential, such that u(r, t) =,is taken to be 0 1 thema
r r C
stress ("pressure")Is p - rk 4f" t -1 For thepressure function of Equation 42 , it follows (for
a linear elastic medium) that the stress scails in both time and am~plitude as W1 : p(r, t)
g-il/- t Th e scaling of the pressure waivefurm is shown in Figu~re 21, onm wih!, Q =W
Th e behavior of the amplitud" spactrumn (24, Equation A.rl.13] IF.given in Figure 22. The
spectrumi has a single maximum at a !requency f cW13 , at wnich the amplitude is propor-
tional to W/.(The negative sign in the exponent in omitted from Peet's Equations A.11.12 and
A.fl.21, but should be there from his Equation A.11.20; see Figure 23.) If the radius "a" increases1/3 2
as W (as is required by similitude considerations (46]), the spectral maximum varies as a
r In agreement with the pulse amplitude In Equation 40. For low frequencies, the spectral amnpli-
2 4/3 /tude is proportional to fW ,. while at very high frequencies, the amplitude varies as COW 1 1I
The effect of charge size on the shape of the spectrum is demonstrated by Figure 23. Small
j charges give a flat spectrum with the maximum at a high frequency. The difficulty In comparing
1/3IM
2 1/3
rTO2 (Q2 )1 Ql 7, QI
FtOUR 2.ATNO F Tt WVEIORM(Afer1/3t
,'-Q2'124Q
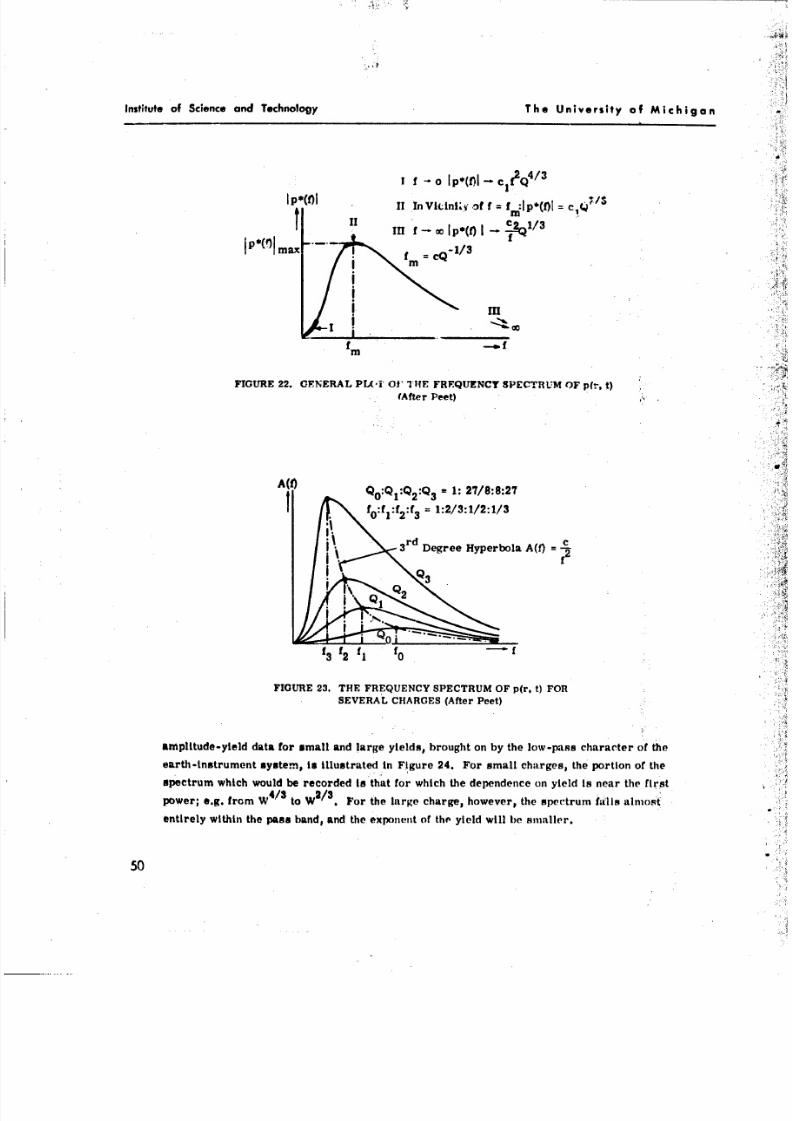
8/3/2019 Carl Kisslinger- The Generation of the Primary Seismic Signal by a Contained Explosion
http://slidepdf.com/reader/full/carl-kisslinger-the-generation-of-the-primary-seismic-signal-by-a-contained 59/96
"I44
Institute of Science and Technology Th e University of Michigan
I f -o 01p*(f)I-c £Q1 3
f1 * ( I k1/3~f= :p(O 1 "
mm
m
FIGURE 22. GENERAL PL(1i OV TIfE REQUENCY SPECTRUM OF p(r, t)
(After Peet)
A)QO:Q I:Q 2:Q3 =1: 27/8:8:27I fo:f1:f:f = 1:2/3:1/2:1/3
rdI"3 Degree Hyperbola AQ) = -
f
f3 f2 fl f -
FIGURE 23. THE FREQUENCY SPECTRUM OF p(r. t) FORSEVERAL CHARGES (After Peet)
anplitude-yield data for small and large yields, brought on by the low-pass character of the
earth -instrument system, is illustrated in Figure 24. For small charges, the portion of the
spectrum which would be recorded Is that for which the dependence on yield is near the first
power; e.g. from W41 to W2 . For the large charge, however, the spectrum fAlls almost
entirely within the pass band, and the exponent of the yield will be smaller.
50
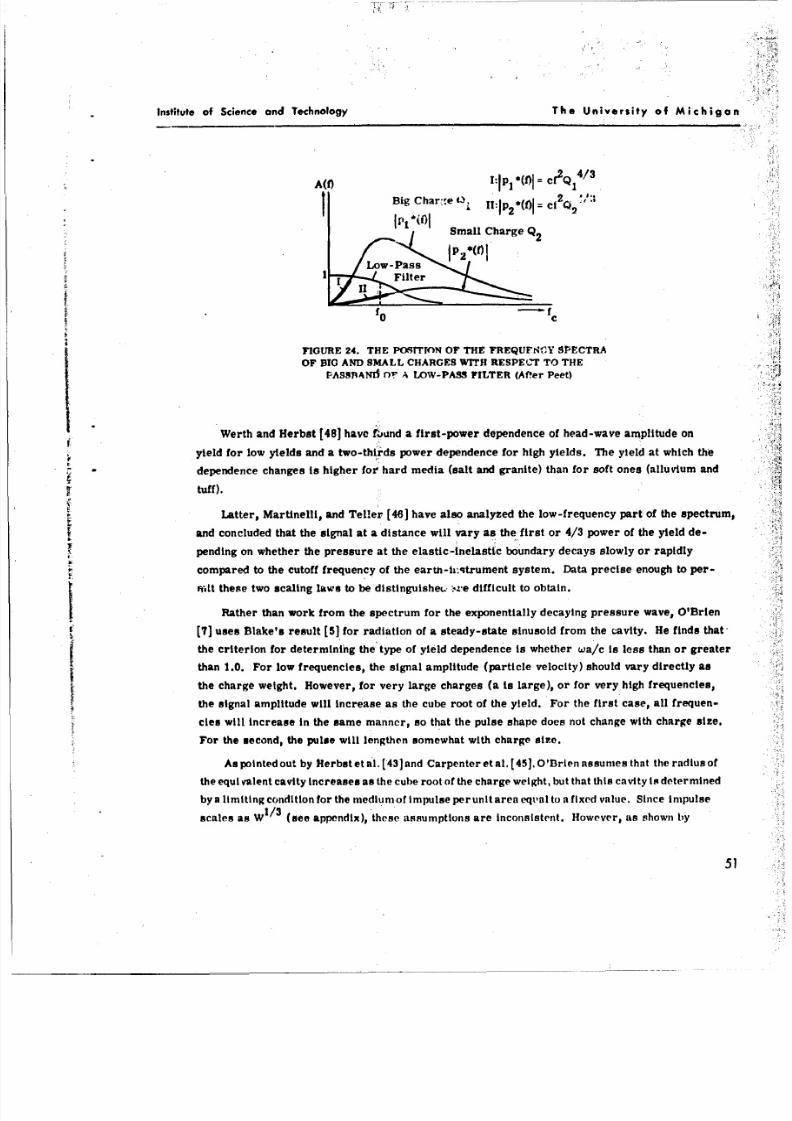
8/3/2019 Carl Kisslinger- The Generation of the Primary Seismic Signal by a Contained Explosion
http://slidepdf.com/reader/full/carl-kisslinger-the-generation-of-the-primary-seismic-signal-by-a-contained 60/96
Institute of Science and Technology The University of Michigan
A(f)I:p1 = cf
2 Q14 / 3
Big Chare.0 .(Oi = c /
Small Charge Q
1Po2P2*lf)
Low-Pass1Filter P
fo
FIGURE 24. THE POSITION OF THE FREQUFS-"Y SPECTRA
OF BIG AND SMALL CHARGES WITH RESPECT TO THE
FABSANIS f1F A LOW-PASS FILTER (Afer Peet)
Werth and Herbst [48] have round a first-power dependence of head-wave amplitude on
yield for low yields and a two-thirds power dependence for high yields. The yield at which the
t dependence changes is higher for hard media (salt and granite) than for soft ones (alluvium and
~~~tuff).
Latter, Martinelli, and Teller [46] have also analyzed the low-frequency part of the spectrum,
and concluded that the signal at a distance will vary as the first or 4/3 power of the yield de-
pending an whether the pressure at the elastic-inelastic boundary decays slowly or rapidly
compared to the cutoff frequency of the earmh-licqtrunent system. Data precise enough to per-
wlt these two scaling laws to be distinguishec. ,.a'e difficult to obtain.
Rather than work from the spectrum for the exponentially decaying pressure wave, O'Brien
[7] uses Blake's result [5] for radiation of a steady-state sinusoid from the cavity. He finds that
the criterion for determining the type of yield dependence is whether wa/c is less than or greater
than 1.0. For low frequencies, the signal amplitude (particle velocity) should vary directly as
the charge weight. However, for very large charges (a is large), or for very high frequencies,
the signal amplitude will increase as the cube root of the yield. For the first case, all frequen-
cies will increase in the same manner, so that the pulse shape does not change with charge size.
For the second, the pulse will lengthen somewhat with charge size.
As pointed out by Herbst et at. [43] and Carpenter et al. [451. O'Brien assumes that the radius of
the equivalent cavity increases as the cube root of the charge weight, but that this cavity is determined
by a limiting condition for the medium of impulse per unit area eqt'al to a fixed value. Since impulse
scales as W1/ 3(see appendix), these assumptions are inconsistent. However, as shown by
51
8/3/2019 Carl Kisslinger- The Generation of the Primary Seismic Signal by a Contained Explosion
http://slidepdf.com/reader/full/carl-kisslinger-the-generation-of-the-primary-seismic-signal-by-a-contained 61/96
Institute of Scienc~e and Technology The University of Michigan
Carpenter et al., the step function approximation for the stress at the boundary also gives afirst-power depcndence on yield for low frequencies.
Proceeding from very general conihiPratlons ui the relation between pulse 6 ;"m-- -i.d he
slope of the spectrum, Weston [47j po!ntr nrut that for most disturbances, the total impulse at
distances more than a few wavelengths is close to zero, and thC .Amplitude spectrum of the pres-
sure at low frequencies varies as f. Under conditions thatlength- and tim,-.,',ale as W1/ 3 , he
then shows that the low-frequency amplitude is proportional to W. Th e variation of tie low-
frequency amplitude spectrum with the first power of the frequency and yield results from the
particular pulse shape, ore for which dt = 0 t !' nite time, but dtdt does not. In the
case ofa
pilso forwhich the integral of the impulse is also zero at infinity, the low-frequency
spectral amplitude varies as f2 and W 2s in Peet's result. Other exponenti for f Pnd W are
appropriate for other pulse shapes.
In applying these general results to underground explosions, Weston looks for the type of
source conditions that would be consistent with these relations, for the equivalent cavity model
of an explosion. A step in pressure is the simplest loading that will give the prescribed first-
power dependence of amplitude on frequency at a distance. The actual decay in pressure in the
cavity will not affect the results as long as it is slow compared to the longest waves of interest.
For a fast pressure decay, spherical elastic-wave theory may not apply right up to the radius
at which elastic behavior begins, and the cavity model may have to be abandoned. Wcston states,
in conclusion, that the first-power dependence of amplitude on yield applies for frequencies much/ /
less than 1000 W" cps, and for ranges greater thai, about 700 WI! 3 ft (W in lb).
Carpenter, Savill, and Wright [45] have recently examined the amplitude-yield relation in
terms of Iscaling. After considering the results for a single frequency (which would
correspond to the response of a very sharply tuned seismograph), they conclude that the band-
width of the instrument must be taken into account when determining this relation from field
data. As they point out, and as wa s seen above, different results can be obtained for different
passbands of the earth-instrument system. They conclude that a simple W '0 dependence is
likely to apply to any particular frequency band up to some limiting value of W, beyond which the
increase is less rapid.
These authors also point out an Inherent difficulty In applying any kind of scaling laws to
wave generation and propagation in the real earth. Scaling is assumed for wave generation; for
transmission, however, a constant geometry is assumed, and these are incompatible except for
an Infinite homogeneous medium. The opinion hold by Carpenter et al. is that this conflict in
not of primary Importance In many practical situations.
52
8/3/2019 Carl Kisslinger- The Generation of the Primary Seismic Signal by a Contained Explosion
http://slidepdf.com/reader/full/carl-kisslinger-the-generation-of-the-primary-seismic-signal-by-a-contained 62/96
Institute of Science and Technology The Univ'-r'ity of Michigan
6.3. ENERGY AVAILABLE FOR ELASTIC WAVES
The fraction of energy originally released that Is available at the begirning of the elastic
zone can be calculated by the methods outlined for the high-pressure regions, onro adequate
data on tho pertinent propertir- of the medium have been collected. The actual energy that is
transmitted to long distances can only be determined by tnr!u 'nng effects of absorption and
scattering.
Parkin [27] presents a table of cadculated values of released and radiated e,.ergy for TN T
shots of 20 lb to 2000 Ib fired in various sized cavities in salt. The values are based on Brode's
results [26]. The fraction of the energy radiated varies from 4 x 10 . (for a completely de-0-4
coupled shot) to 8 X 10⁴ (for an overdrivpn cavity). No estimates~ for tamped shots are given.
Howell and Budensteh [491 perforned energy calculations for seismic waves generat ,d by
explosive charges of about 1.0 lb at depths of about 10 ft In 'inennsolidated material tamped with
water. Their result for the total energy In the wave train (not the P wave alone) for a surface
distance of 10 ft Indicates that about 5% of the source energy is present in the frequency range
of six to 120 cps. O'Brien [7] estimates that the energy In the low frequencies "3no more than
3% of the source energy for an underground explosion, and .nay be much less. In view of the
fact that the low-frequency amplitude spectrum increases as the first or second power of the
frequency (energy as the second or fourth power), the energy reaching large distances is likely
to be much less than 1%of the yield.,
Berg and Cook [50] calculated the total energy in the wave trains recorded at distances of
6.78 to 22 km from tw o very large quarry blaatz, by extrapolation back to the source, they
estimated that 2.7% of the total energy content !f the explosive charge appeared in the form of
elastic waves.
Nicholls [28] used the known properties of the explosive material to determine yield
energy, and calculated the energy transmitted into the medium from strain measurements.
His calculations Indicate that 2% tp 4% of the chemical energy is coupled to the rock, but he
believes that values of 10 % to 20% may be more realistic. The measurements were made from
experiments using three different types of dynamite and granular TNT, tightly tamped in salt.
He quotes the results of earlier Bureau of Mines Investigations for granite, in which 10% to 18%
of the explosive energy is coupled to the earth. These values seem far higher than any othersreported.
Working with the RAINIER event, Porzel [19] finds that only 3% of the original energy wa s
left at the termination of the crushing stage (130 ft), and concludes that roughly 99% of the energy
Is deposited an heat in the cavity 4n d in a thin shell of compressed material near the source.
53
8/3/2019 Carl Kisslinger- The Generation of the Primary Seismic Signal by a Contained Explosion
http://slidepdf.com/reader/full/carl-kisslinger-the-generation-of-the-primary-seismic-signal-by-a-contained 63/96
institute of Science and Technology The University of Michigan
These figures are in general agreement with estimates given above. Porzel cucludes also that
the energy available to produce seismic waves besp.rs no direct relation with the original energy
release," but is determined by the geometry of the cl-,rge and hole in which the charge is placed,
and the properties of the medium (vaporizaton pressure and dynamic crihin Uiength). At
long distances the "apparent energy" wl'l be of the order of 10 of t9,e original yield. This
value agrees with that cited by Griggs and Press [51] for a 23--kt underground nuclear exploso-
(presumably the BLANCA event).
Although the statements above are in full accord with the concepts that have been developed
in this report, Porzel arrives at some additional conclusions that are somewhat startling. He
doubts that the acoustic approximation ever applies (in the sense of constant energy in the wave)
and that it is a misnomer to talk about partition of energy betweei the source region ard the
radiated signal. The available energy dcc-eases constantly with distance and rapidly approaches
zero, because of known departures from homogeneity and lhicar elasticity. His conclusion is
that even the 1%of the explosion energy available at the termination of the nonlinear zone be-
came insignificant. He suggests that the seismic signals "alleged to be observed as a result of
the RAINIER event" are the result of minor earthquakes triggered by the passage of the shock
wave through jointed and faulted material. By this reasoning, the energy observed on the sets-
mogram is principally tectonic strain energy accumulated in the test site through geologic time.
Press and Archambeau [52] have examined this hypothesis, and present convincing argu-
ments that, although an explosion will release accumulated strain, the magnitude of the energy
involved is too small to affect the resulting seismic waves.
Porzel's argument that the duration of the pi esure pulse is too short to be resolved by
seismic instruments overlooks (1) mechanisms in the terminal nonlinear region which act to
lengthen the pulse somewhat, and (2) the fact that the observed seismogram will not be the
pulse incident on the elastic wave region,.but the response of the earth -instrument system to
this pulse. In fact, a nuclear explosion, because of its short duration, is valuable to seismolo-
gists in that it provides a direct observation of the impulse response of the transmission path
and seismograph, which in turn can be used to study earthquake focal mechanisms [51, 53].
The energy radiated in the form of seismic waves depends upon many factors besides the
yield of the explosion; Parkin's recent work [27] on correlation oi various parameters charac-
terizing elastic waves, therefore, merits careful consideration. He correlates the theoretical
peak values of displacement, particle velocity, acceleration, and stress in salt with scaled range
by employing a variation on established scaling procedures. In the following discussion, it is
assumed that the medium behaves elastically.
54
8/3/2019 Carl Kisslinger- The Generation of the Primary Seismic Signal by a Contained Explosion
http://slidepdf.com/reader/full/carl-kisslinger-the-generation-of-the-primary-seismic-signal-by-a-contained 64/96
Institute of Science and Technology The Univsrsity of Michigan
Parkin first correlates the calculated values of radiated energy with the energy released by
the explosion. He finds a good correlation of radiated energy with the ratio of released energy
to cavity radius. The mechanism of energy releabe enters as a parameter. Certainly a gen-
eralized law, in which the elastic constants of the medium are includedo would be of great value.
Parkin next suggests that even though radiated and r,:Tlsed energy can be correlated,
these two quantities are of such greatly different magnitudes la t it is worthwhile to contder
two different scale factors. For those effects directly related to the explosion, W1 " te cube
root of the yield is to be used, as in conventional procedures; for quantities associated with
propagation in the elastic medium, W'11 3 , thi cube root of the radiated energy is introduced.
He presents correlations of the various quantities mentioned above. Only the peak dis-
placement gave a good correlation t, "imenstonless form. By testing various co'nbinatiuil of
dimensionless velocity, acceleration, and stress with thin scale factor for the elaqtIc medlum,
he was able tu get quite satisfactory ccrrelations; the poorest was for the acceleration. He
U au a2Uw 1/3 (W )-nfinds that if the dimensionless quantities --j Wu ;- -- r are multilied by -
W t c
n = 0, 1, 2 for displacement, velocity, or acceleration, respectively, the resulting quantities are
inversely proportional to the scaled range r/W /3. Dimensionless radial stress, ar/E , when
multiplied by W"1 3also is inversely proportional to r/W 1 . E is Young's modulus.
This theory was tested by using experimental values of peak particle velocity from the
COWBOY cavity shots. The exponent of scaled range turned out to be -1.3, rather than 1.0.
He suggests that the disagreement can be expItino'd by dissipation of energy due to plasticity
an&d other Inelastic effects in the salt at small iiralns.
6.4. SYMMETRY OF THE SOURCE
The entire development of the theory of explosion-generated waves has proceeded on the
assumption that the source produ'66s'a spherically symmetrical stress wave. Very few obser-
vations of the azimuthal distribution of wave amplitudes have been published, and some of these
are difficult to interpret because of known variations in geological structure between the source
and various observing points and differences in the geology at the various recording sites.
The vrtical and longitudinal components of motion recorded at short range from small
explosions in soil have been found to show negligible variation with azimuth [10, 31]. On the
other hand, marked variations in amplitude are found for all components for similarexperi-
ments in rock [311.
55
8/3/2019 Carl Kisslinger- The Generation of the Primary Seismic Signal by a Contained Explosion
http://slidepdf.com/reader/full/carl-kisslinger-the-generation-of-the-primary-seismic-signal-by-a-contained 65/96
Institute of Science and Technology The University of Michigan
Denoyeretal. [54] report observatiorq of symmetrical radiation of P andS
waves asrecorded at distances of 190 to 28 5 km in two differeht directions. They to-t,.ite that this
variation is caused at least in part by th fact that the source -,s located ,r l,-velr,, Ity
basin fill bordered by htgh-velom,1. material. The two azimuths (-1500 apart) at which the
data were available were not oriented in any special way with r-.spect to the axes of the basin.
The authors recognized that the differences in local geology at i.c recording sites and the
presence of complicated structure between the source and these sites add to the difti-ulty of
evaluating the hypothesis.
Additional evidence or, the extent to which thc source is asymmetrical is that underground
explosions always generate prominent SH- or Love-type waves [9, 37, 38 , 52, 55]. If the source
were completely symmeti;i, horizontally polarized shear waves could not be generated in P-n
isotropic, homogeneous, or horizontally ;tratified mediurt. Such motion can be explained by
mode conversion at geologic' or topographic irregularities along the transmission path and by
reflection of P or BV waves from nonhorizontal boundaries. However, insistence that the
source is symmetrical requires the introduction of a variety of ad hoc assumptions to explain
a regularly observed phenomenon.
Processes in the nonlinear region around the explosion (discussed in earlier parts of this
report) seem to be an adequate source of SH-wave generation, and even nonsymmetric P- and
Rayleigh-wave generation. Wright and Carpenter [38] sLggest cracking in hard rock and in-
stability of the gas-soil boundary in unconsolidated material as possible sources. Kisslinger et
al. [37] have suggested radial crack production as thc zource of SH motion that they have observed.
Apparently no one but Aoki has attempted to cM'.ulate the elastic waves proceeding from
the nonlinear region, and he starts with the assumption of spherical symmetry. Short has
observed that cracking in salt does not occur equally in all directions, but that large cracks
extend in a few directions [56]. If this is generally true, it would seem difficult but not Impos-
sible to attempt an analysis of the wave motion generated by cracking. The distribution of
first-motion amplitude of P and 8 waves around a growing crack is given by Knopoff and Gilbert
[57]. It is necessary to estimate the number and direction of cracks, their rate of growth in
terms of the properties of the medium , and the amplitude of displacement normal to the crack.
7
EXPERIMENTAL STUDIES, OF WAVE GENERATION BY EXPLOSIONS
Knowledge concerning the characteristics of explosion-generated seismic waves is based
primarily on observations, because of the many uncertainties involved in the behavior of the
explosion, the coupling to the earth,ild the properties of the medium. In pte(!edlnl. sections
56
8/3/2019 Carl Kisslinger- The Generation of the Primary Seismic Signal by a Contained Explosion
http://slidepdf.com/reader/full/carl-kisslinger-the-generation-of-the-primary-seismic-signal-by-a-contained 66/96
Institute of Science and Technology The University of Michigan
some empirical relations have been I.clud,d along with the theoretical development presented
in order to Illustrate particular points. This section presents 11 brief. a1.,4,matic review of
published observations.
It is not practical to dialwsz, e1 published paper on this subiect in detail, owing to the
large number in existence. Fortunately, a number of r,'lw papers consolidate information
from several investigations; such reviews will be the primary sourc, of the material presented
herein. Each review paper contains an appropriate bibliography, and the reader Interosted in
the details of experimental methods and conditions will find it advisable to go back to the orig..
inal papers.
Fxperlmental studies are valuable for gaining insight into the phenomena involved and for
predicting the results of further tperlments. In the absence of a complcte theory, it t Loi-
portant to be able to treat a given eperiment as a mode! of all experiments. This requires an
understanding of ho w the effects of the explosion scale with the various parameters that char-
acterize the experiment. Some scaling relations have been presented in the previous section.
A brief discussion of the principles of scaling is presented in the appendix.
The following discussion covers effects of depth of burial, medium, and the combination of
yield and distance.
7.1. THE EFFECT OF SOURCE bEPTH
When the effect of the depth of burial on ,cXesulting seismic signal is considered, it is
necessary to distinguish between effects on Nx V waves (the P wave in particular) and effects
on surface waves. By their very'nature, surface waves depend for their existence on the pres-
ence of a free surface, and are strongly affected by the distance of the source from this sur-
face [58, 591. Several studies of sourface-wave generation and propagation h~ave been published,
but they will not be reviewed here [59, 60, 61, 621..
There is no such direct effect for body waves. It is apparent from the theory presented
above, however, that the radial distance at which elastic behavior begins is a function of the
litthostatc (or ambient) pressure,, In turn, this radius has been shown to directly affect the
signal amplitude. Bigger "equivalent cavities" give bigger signals. In a homogeneous medium,the P-wave amplitude can be expcted to increase rather sharply as the depth of the charge Is
increased from zero to that requted forcomplete containment, and then decrease gradually
for greater shot depths (increast ambient stress). At most test sites, it is very likely that
beds of rock of differing propertt s are encountered as the shot depth is increased, so that
depth alone is not the controllinvdctor.
.5
8/3/2019 Carl Kisslinger- The Generation of the Primary Seismic Signal by a Contained Explosion
http://slidepdf.com/reader/full/carl-kisslinger-the-generation-of-the-primary-seismic-signal-by-a-contained 67/96
institute of Science and Technology The University of Michigan
Experiments on the effect of source depth on the P wave are subject to sot-a inherent dif-
ficulties. If the observations are made aL short ranges with fixed detector positions, the effects
of source-detector distance may overwhelm the eifec,.-f epth. Since ab~oi-,)' on losses are
imperfectly known, corrections for va.iations in distance are uncertain. If a st.-;.oi,,eter is
located on the surface, another proLlem arises. As is well known, thp surface displacement
is not the same as the incident displacement, but is a resul.-.:nit of the incident and reflected
waves. The observed displacement is a complicated function of the ingle .- nr'dence and the
elastic properties of the medium [63]. At short ranges for which the angle of incidence d-
creases rapidly with increasing depth, therefore, the data must be interpreted with care. The
use of deeply buried dT'tcctors eliminates this pr.:lem.
On the other hand, when observations are made at distances great enough so that the ancle
of incidence is not greatly affected by ',e ,4.pth, normal geologic conditions %IlI usually result
in the first arrival being a head wave from some subsurface bmindary. 0' course, the effect of
depth on this head wave may be of interest, but examination of the direct P wave becomes dif-
ficult.
Stengel has studied shot-depth effect for 1.5-1bchargesof dynamite[64]; the principal results
are reported in a more easily accessible paper by Howell [65]. The depth was varied from 7
to 102 ft , and the media were dolomite, weathered dolomite, and gravel and sand near the sur-
face. A close-in instrument was moved as the depth changed to keep the angle of incidence
roughly the same, and an instrument at 200 ft from the shot hole was kept fixed. Relative
energy in the wave train was calculated from particle velocity records.
The energy-depth data for the close seismon Ver oscillate through an order of magnitude
for changes in depth of about 10 ft. The extreme excursions are bounded by parallel trends
corresponding to an exponential increase of energy with depth, given by Ed = Eo exp (0.047 d).
The total relative energy at 20 0 ft is described quite well by the same relation. For the deeper
shots a strong refraction arrival increased in energy at a slightly higher rate. Obviously, an
exponential increase of relative energy with depth can be valid only for relatively shallow
depths.
In his pioneering study of-blast effects in soil, Lampson [30] found that at scaled ranges of
r/W1/3 between 2 and 15, both pressure and positive impulse per unit area were linearly de-
pendent on a coupling factor wbich depended on depth. This factor for one of the soils in which
he worked is presentad in Figure 25. The factor has a maximum at a depth of about 2W1/3
(W in pounds); it falls off rapidly for shallower depths, and more slowly for great depths.
58
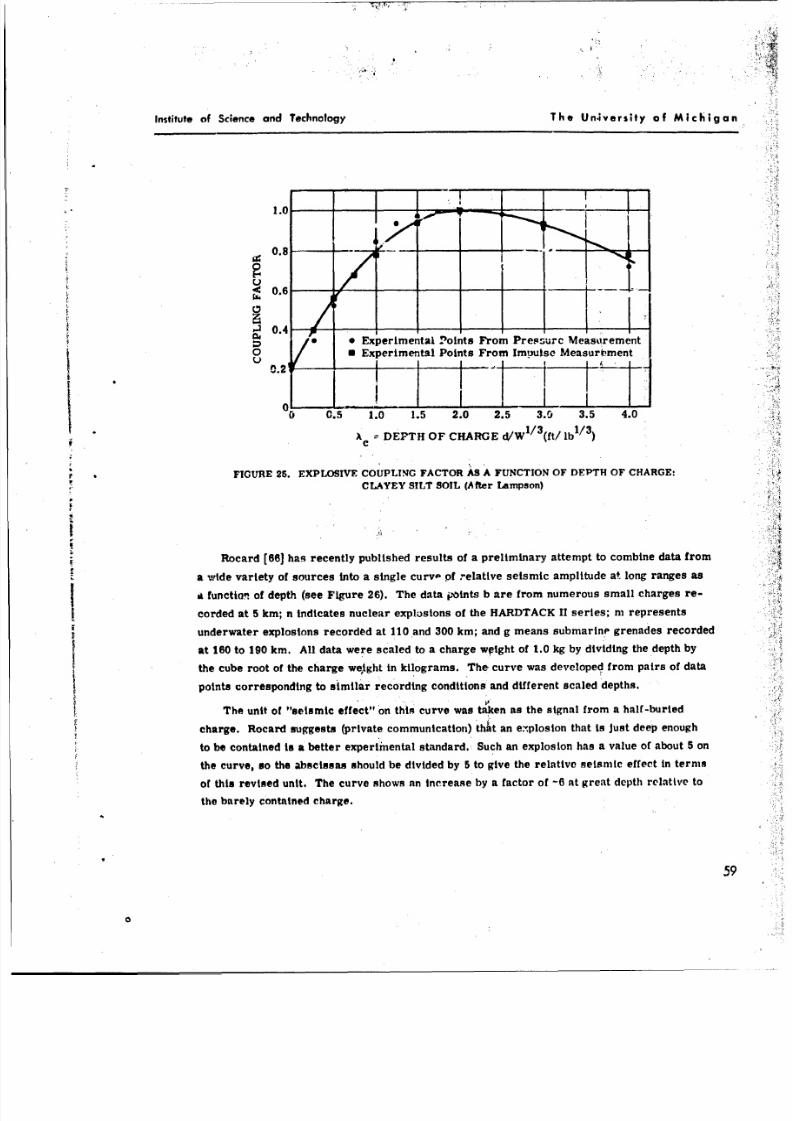
8/3/2019 Carl Kisslinger- The Generation of the Primary Seismic Signal by a Contained Explosion
http://slidepdf.com/reader/full/carl-kisslinger-the-generation-of-the-primary-seismic-signal-by-a-contained 68/96
Institute of Science and Technology The University of Michigan
0 0.4 '
* Experimental Points From Pressurc Measurement
o d Experimental Points From Impulse Measurement00.21/..-,ii
0 0.5 1.0 1.5 2.0 2.5 3.0 3.5 4.0
kc DEPTH OF CHARGE d/Wl 3(ft/ Ib1 3)
FIGURE 25. EXPLOSIVE COUPLING FACTOR AS A FUNCTION OF DEPTH OF CHARGE:
CLAYEY SILT SOIL (After Lampson)
Rocard [66] ha s recently published results of a preliminary attempt to combine data from
a vide variety of sources into a single curva pf relative seismic amplitude at long ranges as
a function of depth (see Figure 26). Th e data iotnts b are from numerous small charges re-I corded at5m; n ndicates nuclear explosions of the HARDTACK IIseries; m represents
underwater explosions recorded at 110 and 300 km; and g means submarine grenades recorded
at 160 to 190 km . All data were scaled to a charge weight of 1.0 kg by dividing the depth by
the cube root of the charge weight in kilograms. The curve was developed from pairs of data
points corresponding to similar recording conditions and different scaled depths.
Th e unit of "seismic effect" on this curve wa s taken as the signal from a half-buried
charge. Rocard suggests (private communication) that an e-plosion that is just deep enough
to be contained is a better experimental standard. Such an explosion has a value of about 5 on
the curve, so the abscissas should be divided by 5 to give the relative seismic effect in terms
of this revised unit. The curve shows an Increase by a factor of -6 at great depth relative to
the barely contained charge.
59
0
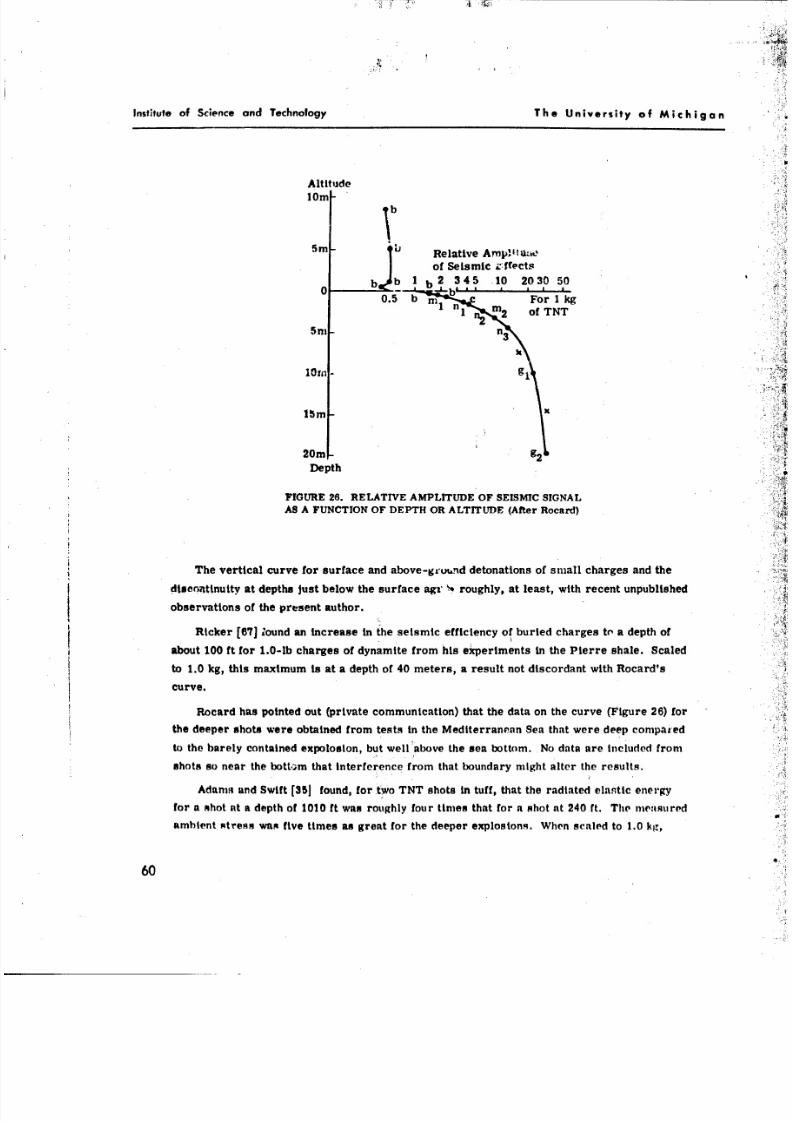
8/3/2019 Carl Kisslinger- The Generation of the Primary Seismic Signal by a Contained Explosion
http://slidepdf.com/reader/full/carl-kisslinger-the-generation-of-the-primary-seismic-signal-by-a-contained 69/96
Institute of Science and Technology The University of Michigan
AltitudeI om
5m ' Relative Arop!lttae
of Seismic xffects
b Jb 1 b 2 345 10 2030 50
0.5 b m For 1 kg
' of TN T5m -n 3
20m g
Depth
FIGURE 26. RELATIVE AMPLITUDE OF SEISMIC SIGNAL
AS A FUNCTION OF DEPTH OR ALTITUDE (After Rocard)
The vertical curve for surface and above-ground detonations of small charges and the
dtservittnutty at depths Just below the surface agr roughly, at least, with recent unpublished
observations of the present author.
Ricker [67] lound an increase in the seismic efficiency of buried charges to a depth of
about 10 0 ft for 1.0-lb charges of dynamite from his experiments in the Pierre shale. Scaled
to 1.0 kg , this maximum is at a depth of 40 meters, a result not discordant with Rocard's
curve.
Rocard has pointed out (private communication) that the data on the curve (Figure 26 ) for
the deeper shots were obtained from tests in he Mediterranean Sea that were deep compared
to the barely contained expolosion, but well above the sea bottom. No data are included from
shots so near the boti,:m that interference from that boundary might alter the results.
Adams and Swift [351 found, for tw o TN T shots in tuff, that the radiated elastic energy
for a shot at a depth of 1010 ft was roughly four times that for a shot at 24 0 ft. The measured
ambient stress was five times as great for the deeper explosions. When scaled to 1.0 kg,
60
8/3/2019 Carl Kisslinger- The Generation of the Primary Seismic Signal by a Contained Explosion
http://slidepdf.com/reader/full/carl-kisslinger-the-generation-of-the-primary-seismic-signal-by-a-contained 70/96
Institute of Sc;ence and Technology The University of Michigan
these depths are 44 and 9.4 meters, and an amplitude increase by a factor at 2 is concordant
with an extension of Rocard's curve.
7.2. TH E EFFECT OF TH E MEDIUM
Th e manner in which the properties of the medium enter int. '.e wave-generation process
was indicated in the sections concerning theoretical deve:npment. The Hugontot equation of
state, the crushing strength, elastic limit, porosity, fluid content, and britt"#ners all play roles
implied by the equations describing the progress of the pressure pulse.
The value of Potsson's ratio plays a key role in the elastic-wave region at short range,
determining whether the pulse is highly oscillatory cr pulse-like. Tn e size of the inelastic
region and the psak pressure at its boundary (both deitendent ,on he medium) determine ti.tamplitude for a given yield. The p.edoilnInnt period in the P wave dpend's on thf size of the
equivalent cavity, the compresloR.az wve velocity, and Polssun's ratio.
As suggested by the quotation from Sharpe at the beginning of this section, a shot in weath-
ered material produces a broader pulse than one in unweathered material, and shot in hard
rock produces a sharper pulse than one In softer material. This has been confirmed expert-
mentally [68]. Field records illustrating the effect of the medium at short ranges are shown
in Figure 27 (69]. Th e limestone records are characterized by much higher frequencies than
the other media. At distances over 100 meters, the P wave is attenuated below the level of
sensitivity of the instrumentation and the records are dominated by surface waves, which are
of much greater amplitude in the boll than In rock.
Although every experimental study of expl ,,!on-generated seismic waves includes the
effect of the mediurn, only a few have been devoted specifically to this problem. Lampson
[30, p. 26] concludes that the type of soil' Is the most important single variable governing the
transmission of the stress wave from an underground explosion. His work pertains only to
soil, of which five different types were included. He defines a soil constant (with dimensions
of an elastic modulus) which was found to vary from an average value of 800 for loess to
100,000 for saturated clay. The pressure at a given scaled range was found to depend linearly
on this constant. This "constant" is variable over a rather wide range for a given soil, depend-
ing on the moisture content and the compaction. A reasonably good correlation of the soil con-
stant and the compressional seismic-wave velocity was found. This is a bit unexpected, since
the seismic wave veloctty pertains to small strains and the soil constant the entire (nonlinear)
stress-strain curve up to the peak stress.
A recent set of experiments, specifically designed to test the effect of the medium on
coupling, was carried out for the two media which have received the greatcst attention In this
61
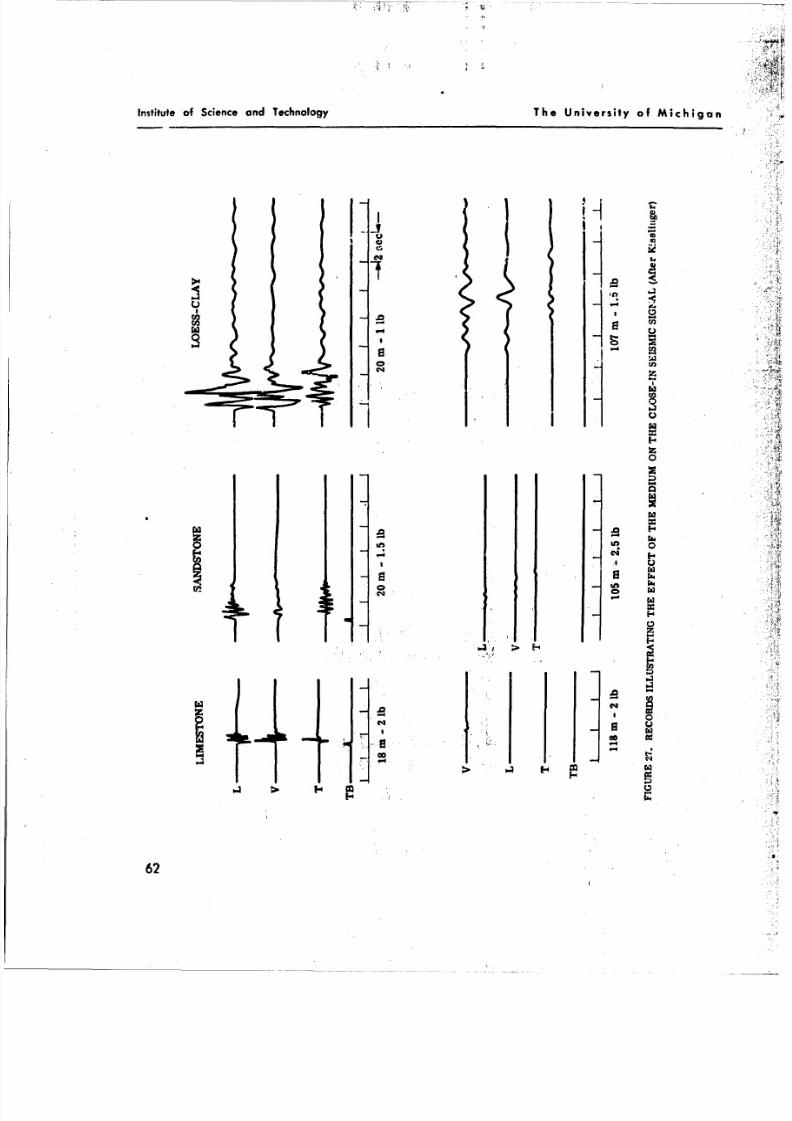
8/3/2019 Carl Kisslinger- The Generation of the Primary Seismic Signal by a Contained Explosion
http://slidepdf.com/reader/full/carl-kisslinger-the-generation-of-the-primary-seismic-signal-by-a-contained 71/96
Institute of Science and Technology The University of Michigan
HP
.0 I 0
>a rj
6L CO 1
CO
62a
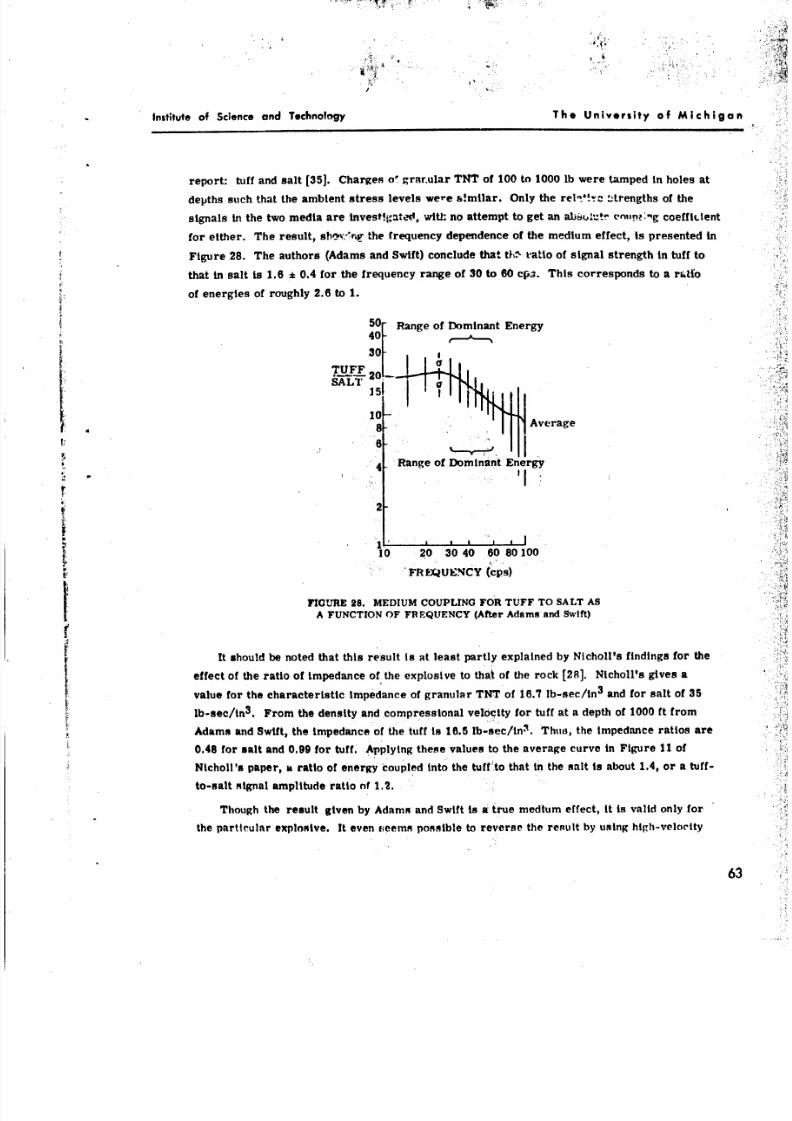
8/3/2019 Carl Kisslinger- The Generation of the Primary Seismic Signal by a Contained Explosion
http://slidepdf.com/reader/full/carl-kisslinger-the-generation-of-the-primary-seismic-signal-by-a-contained 72/96
Institute of Science and Technology The University of Michigan
report: tuff and salt [35). Charges o' grar.ular TNT of 100 to 1000 lb were tamped in holes atdepths such that the ambient stress levels were s mtlar. Only the rel .... trengths of the
signals in the two media are nvest!gate0, witi,: no attempt to get an abitr e'nut>'.g coeff ilent
for either. The result, sh '#-gr"the frequency dependence of the medium effect, is presented in
Figure 28. The authors (Adams and Swift) conclude that th. ratlo of signal strength In tuff to
that in salt is 1.6 * 0.4 for the frequency range of 30 to 60 cpa. This corresponds to a r ,tfo
of energies of roughly 2.6 to 1.
50' Range of Dominant Energy
40-
30
20-
108- Average
4 - Range of Dominant Energy
* 2-
1' '* I0 Il~i
10 20 30 40 60 80100FREQUENCY (cps)
FIGURE 28. MEDIUM COUPLING FOR TUFF TO SALT ASA FUNCTION OF FREQUENCY (After Adams and Swift)
It should be noted that this result is at least partly explained by Nicholl's findings for the
effect of the ratio of impedance of the explosive to that of the rock [28]. Nicholl's gives a
value for the characteristic impedance of granular TN T of 16.7 lb-sec/in 3and for salt of 35
lb-sec/in3 . From the density and compressional velocity for tuff at a depth of 1000 ft from
Adams and Swift, the impedance of the tuff is 16.5 lb-sec/tn3. Thua, the impedance ratios are
0.48 for salt and 0.99 for tuff. Applying these values to the average curve in Figure 11 of
Nicholl's paper, a ratio of energy coupled into the tuff to that in the salt Is about 1.4, or a tuff-
to-salt signal amplitude ratio nf 1.2,
Though the result given by Adams and Swift is a true medium effect, it is valid only for
the partlcular explosive. It even ceems possible to reverse the result by using high-velocity
63
8/3/2019 Carl Kisslinger- The Generation of the Primary Seismic Signal by a Contained Explosion
http://slidepdf.com/reader/full/carl-kisslinger-the-generation-of-the-primary-seismic-signal-by-a-contained 73/96
Institute of Science and Technology The University of Michigan
dynamite (impedance of 32.3 lb-sec/in3), although Nicholls gives no dciission nf behavior for
impedance ratios greater than 1.0. It would seem h,,t future experiments on thp effect of the
medium, using chemical charges, should employ seve, al types of explosivpn.
Werth and Herbst [48] havc .tudied qmplitudes of seismic waves generated by nuclepr ex-
plosions in tuff, salt, granite, and alluvium. They Isolate tI*,e ^7%ect of the medium at the source
by including in their analysis the effects of coupling out of the sour .e region and of the crustl.I
structure between the source and the recording site. The theory developed in Reference 1 iR
applied. All results are scaled to a yield of 5 kt by the W1
/3
relationship. The amplitudes,
at distances of the order of 50 0 km relative to tpift, are: tff, ; alluvium, 0.25; granite, 1.11;
and salt, 1.61. If realistic models of the crusta structure are inciuded, the amplitude ratios
for the first half-cyele of thi sead wave from the Mohorovicic discontinuity are: tuff., 1;alluvium, 0.18; granite, 2.26; and salt. P.l. The result ot Adams ahd S Aft for the tuff-to-salt
ratio is seen to be reversed.
Although the experimental work tinder discussion is 1 1marily field work, worthwhile
information on the wave-generating processcan be gaine-6from laboratory experiments. Such
tests lend themselves especially well to work on the properties of the medium, since there Is
an obvious limit to the range of yields and e ffective source depths that is practical to investi-
gate.
The basic principles of shock-wave propagation, as outlined in the discussion of the
Rankine-Hugoniot equations, have been used directly by Hughes and McQueen [70] to measure
rock densities at pressures from 150 to 750 kLkuaz. Although their objective was to obtain
Information of direct importance to geophysical sc '*ies of the earth's interior, it is obvious
from the many comments on the lack of data pertaining to rock properties at high pressures
that experiments of this type are highly important to the solution of the present problem.
Ito, Terada, and Sukurat [71] used similar techniques in their investigation of wave gen-
eration In sandstone and marble. Shock waves produced by blasting caps and 300-gram high-
explosive charges were used to load the specimens. Stress was measured by shock-wave
techniques, and strain was directly recorded by suitable gauges.
The stress wave showed a decrease in rise time with increasing peak pressure for marble,
but not for sandstone. These conclusions are based on peak pressures from blasting caps of
about 0.3 to 1.6 kilobara. Dynamic values of Young's modulus were determined to be two or
three times greater than static values;' dynamic sti ength is also greater than static strength.
Evidence of plastic flow was found for the explosive charges, but not for the caps.
64
8/3/2019 Carl Kisslinger- The Generation of the Primary Seismic Signal by a Contained Explosion
http://slidepdf.com/reader/full/carl-kisslinger-the-generation-of-the-primary-seismic-signal-by-a-contained 74/96
Institute of Science and Technology The University of Michigan
The internal structure of the marble sp' cimen was altered much more than that of thesandstone for the same loading. This conclusion sAs reached by runninc, 4.ttic compression
tests on the samples after the shock wave tests. Direct evidence of th l", ,plocit. of shock
propagation In certain parts of "Jie onlinear region was found.
The peak pressure was found to decrease very raple-1 4ith distance from the source, and
differences in peak pressures for different kinds of exploste matertalt 'ne.re evident only in
a narrow range close to the source.
7.3. RELATION OF SIGNAL STRENGTH TO RANGE AND YIELD
Whether an investigator is interested in cxplosion-generated waves from the viewpoint of
Z! quarry blasting, seismic exploration, or detection, he obviously is concerned with the .nanner in
which the various parameters associated with the sire-in wave vary tA.th the yield and the dis-
tance from the Rource. Consequently, the published studies on this aspect of the problem are
numerous, and a complete review of all the literature on this subject will not be undertaken.
The effects of the medium around the shot and the depth of the source enter into all of
these studies. The results presented herein are empirical relations pertaining to the parttcu-
lar conditions of the test on which they are based, and extrapolation to other situations must
be approached cautiously.
A large number of reports have been published covering individual projects connected with
the explosion program of the U. S. Atomic Energy Commission. Most of these are in the form
of project reports that are not widely accessible. However, papers reviewing large parts of
tis work have recently appeared in the regulai natentiftc periodicals, and these will be used
as the primary references.
The work of the U. S. Coast and Geodetic Survey and several other Individuals and organi-
zations on the measurements of surface motion is summarized by Carder and Mickey [72).
t' Surface displacements and accelerations produced by yields of 180 lb to 19.2 kilotons (equiva-
lent) of TN T have been measured at distances from 0.1 to 90 0 km. These shots have been
fired in salt, tuff, alluvium, limestone, quartzite, and basalt. It will be noted that these meas-
urements are outside of the ftee-field region, and are influenced by geologic structure and the
resulting reflections and refractions. The results are entirely concerned with maximum values
of dispalcement and acceleration, without regard to the particular wave type or path with which
the values are associated. In a sense, the results do not directly relate to the principal sub-
ject of this report, the initial P wave. These results are included, however, because they are
certainly a measure of the effectv ness of the explosion as a seismic source.
65
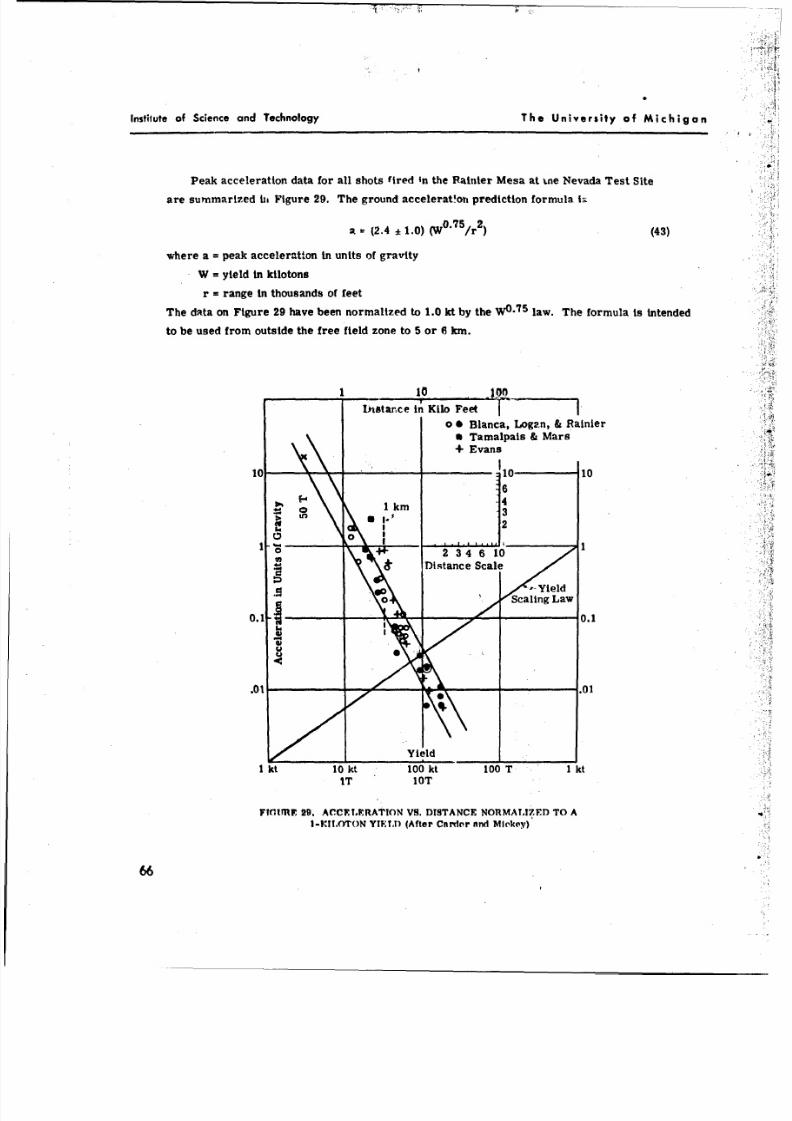
8/3/2019 Carl Kisslinger- The Generation of the Primary Seismic Signal by a Contained Explosion
http://slidepdf.com/reader/full/carl-kisslinger-the-generation-of-the-primary-seismic-signal-by-a-contained 75/96
Instimue of Science and Technology The University of Michigan
Peak acceleration data for all shots fired in the Painter Mesa at %.ne Nevada Test Site
are sumnmarized WiFigure 29. Th e ground accelerat'on prediction formula ig
a - (2.4 :k1.0) (W.7 /r )(43)
where a = peak acceleration in units of gravity
W = yield in kilotons
r = range in thousands of feet
Th e data on Figure 29 have been normalized to 1.0 Id by the WO7 law. Th e formula is intended
to be used from outside the free field zone to 5 or 6 km .
itstance in Kilo Feet
0 6 Blanca, Logan, &Rainiera Tamalpais &Mars+ Evans
10 - 10
'6-4
29 0 1 km -32
I ~ TDi~tance Scale
0. : Scaling Law0.
.1
I kt 10 kt 100 kt 100T Ikt
IT lOT
FlOURY 29. A0CCELERATioN vs. DISTANCE NORMALIZED TO AI-UI.OTON YIELD (After Carderr and Mickey)
66
8/3/2019 Carl Kisslinger- The Generation of the Primary Seismic Signal by a Contained Explosion
http://slidepdf.com/reader/full/carl-kisslinger-the-generation-of-the-primary-seismic-signal-by-a-contained 76/96
Institute of Science and Technology The University of Michigan
A general scaling law for maximumearth displacement has go;.e through a number of re-
visions. The forn offered by Carder and Mickey !9
10.08.
A - C W00 5r '[- x 1
where A = maximum surface displacement (cm)
C = a constant
r - source-to-detector distance (f0)
n, k are constants
f = dominant frequency by visual examination (cps)
The values of the constants have been found to depend upon the distance range. With reference
to the 300 tn Q00-ft range in Figure 30 , C is 104/57, n is 2, and k is 1.75 X 10"6; in the
9800-ft to 100-mi range, C is 10 0'A, n is 1, and k is 1.83 x 10 -q . From It0 to 60J mt, C is
10-2.82, n is 0.5, and k is 7.6 x 19- 7 .These amplitudes are multiplied by about 3 for instru-
ments nounted on alluvium.
The work conducted by several agencies on strong motion from underground ntirlear shots
is summarized in the report by Adams et al. [2]. Since these data were taken in the free-field
zone, they pertain directly to the present report. The largest amplitude of acceleration or
displacement in the direct wave is used in the studies of surface motion.
Subsurface peak radial acceleration was found to decrease as the cube or fourth power of
the slant range. A tendency toward a second or first power dependence is indicated at larger
ranges, but is masked by effects produced bv local geology. Adams et al. point out that accel-
eration data, especially those collected at the -vrtace, are greatly affected by the presence of
bedding planes or other s'irfaces of discontinuity in the medium. They also point out that par-
titcle velocity may prove to be a better parameter than acceleration to use as a reference, be-
cause it is closer in waveform to the stress pulse,
Vertical, radial, and tangential components of surface acceleration were all found to follow
the same formula with satisfactory precision:
w0 .7 -2 1 0.5/r x 10
where a units of gravity
W a kilotons
r a slant range (ft)
This formula may be compared with that of the Coast an d Geodetic Survey by expreqsing r in
thousands of ft. The coefficient in Equation 43 becomes 1.6, near the lower limit of the Coast
67
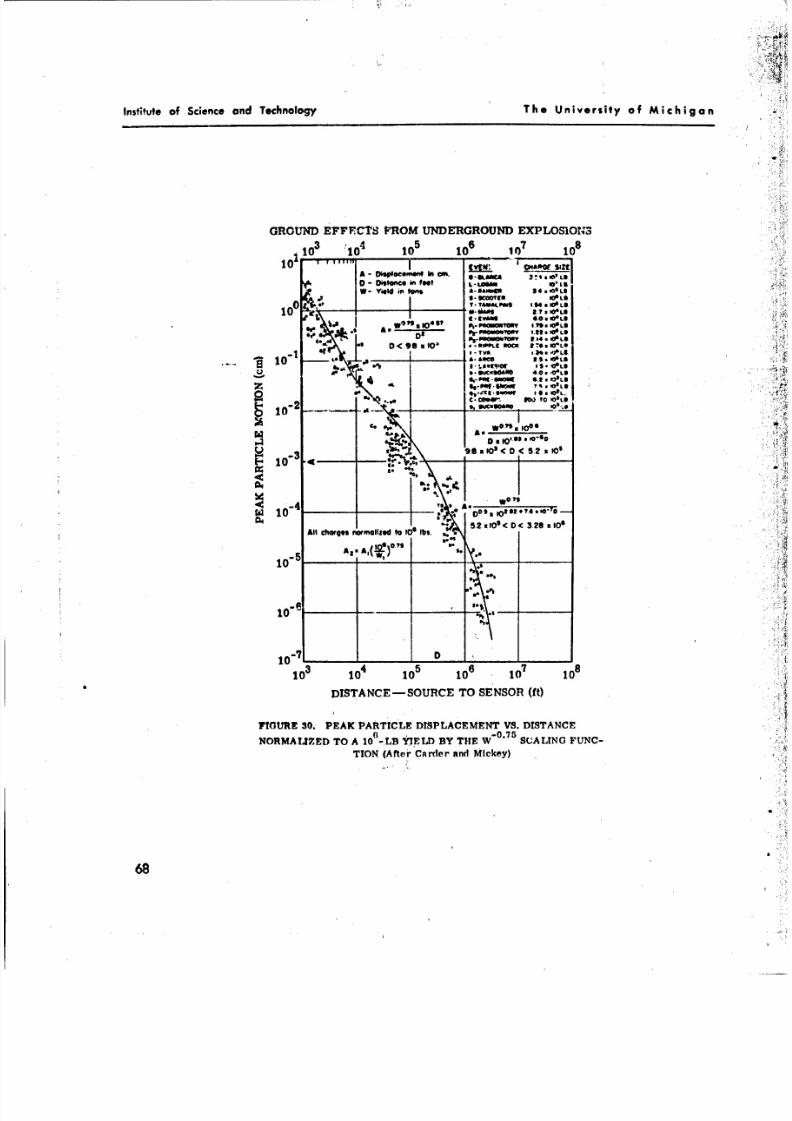
8/3/2019 Carl Kisslinger- The Generation of the Primary Seismic Signal by a Contained Explosion
http://slidepdf.com/reader/full/carl-kisslinger-the-generation-of-the-primary-seismic-signal-by-a-contained 77/96
institute of Science and Technology The University of Michigan
GROUND EFFFCTS PROM UNDERGROUND EXPLOSIONS3 4 5 6 ()7
110 '1 10 10 10810 1 fil" ____.__low
A- DWeeemwit In con. GAS" 341OWL
W0- WW'on fmt L -LOM1'LW.Yield in loft a- NiOIm It .*O
tLS
I -TA40ALPOS 194. OSLO.
LKooS 6O.OI.?Lfd J I. :__10"___
goo.,wsow DR 3T.RY~N., ,<e,- em ma 17.1
-9I-6VA04. PdL&
10S~SW *1L6
c-ac..--f IS~ O0S
6. 00"LOz A 70 tL
All~~A we"tp tr~t~086fb.
100,0 o____ *63
*.3 * < . O
3.
1010 106 0,D
DITACESORC TO 9ESOD(32810
FIGURE~~~~~~e t0.EAK PTCLDsPLCMN S.DSAC
NOR M AED TO A 1~0.7L9IL Y H .5SCLN UC
TIO (fterCrran iky
68W
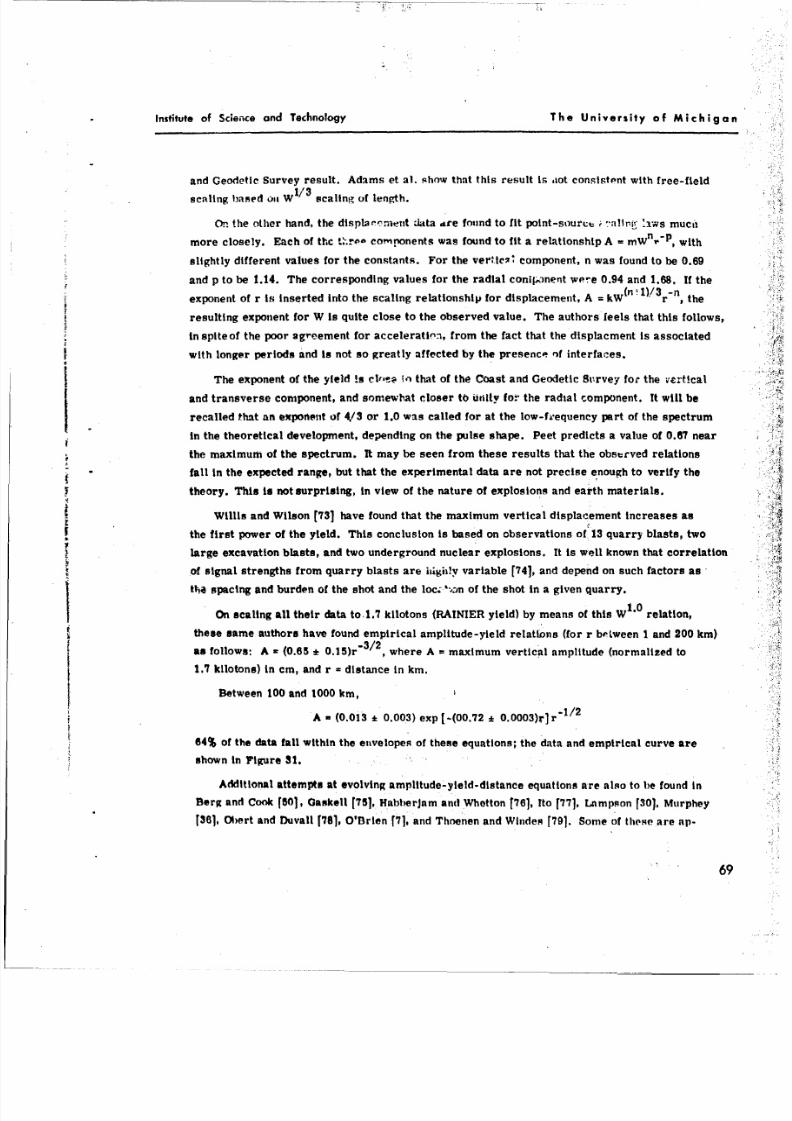
8/3/2019 Carl Kisslinger- The Generation of the Primary Seismic Signal by a Contained Explosion
http://slidepdf.com/reader/full/carl-kisslinger-the-generation-of-the-primary-seismic-signal-by-a-contained 78/96
Institute of Science and Technology The University of Michigan
and Geodetic Survey result. Adams et al.]how that this result is ,iot consistent with free-field1/3scaling based o,, W scaling of length.
On the other hand, the displarrment data -re found to fit point-source " tlir.w, 'lw.Vs muci,
more closely. Each of thc t-.r.. components was found to fit a relationship A . mW"- p , with
slightly different values for the constants. For the ver'cs, component, n wa s found to be 0.69
and p to be 1.14. Th e corresponding values for the radial conipnent were 0.94 and 1,68. If theW(n l)!3r-n '
exponent of r is inserted into the scaling relationship for displacement, A = kW r , the
resulting exponent for W is quite close to the observed value. The authors feels that this follows,
in spiteof the poor agreement for acceleration, from the fact that the displacment Is associated
with longer periods and is not so greatly affected by the presence nf interfaces.
The exponent of the yield is cl,,ae io hat of the Coast and G eodetic 8trvey for the vert!caland transverse component, and somewhat closer to unity for the radial component. It will be
recalled that an exponent of 4/3 or 1.0 was called for at the low-frequency part of the spectrum
in the theoretical development, depending on the pulse shape. Peet predicts a value of 0.67 near
the maximum of the spectrum. It may be seen from these results that the observed relations
fall in the expected range, but that the experimental data are not precise enough to verify the
theory. This is not surprising, in view of the nature of explosions and earth materials.
Willis and Wilson [73] have found that the maximum vertical displacement increases as
the first power of the yield. This conclusion is based on observations of 13 quarry blasts, two
large excavation blasts, and two underground nuclear explosions. It is well known that correlationof signal strengths from quarry blasts are iig ly variable [74], and depend on such factors as
the spacing and burden of the shot and the loc. ',.-n of the shot in a given quarry.
On scaling all their data to 1.7 kilotons (RAINIER yield) by means of this W1.0 relation,
these same authors have found empirical amplitude-yield relations (for r bstween I and 200 km)
as follows: A - (0.65 + 0.15)r " 3/ 2 , where A - maximum vertical amplitude (normalized to
1.7 kilotons) in cm, and r - distance in km.
Between 100 and 1000 kim,
Au (0.013 a 0.003) exp [-(00.72 0.0003)r r1/2
64% of the data fall within the envelopes of these equations; the data and empirical curve areshown in Figure 31.
Additional attempts at evolving amplitude-yield-distance equations are also to be found in
Berg and Cook [50], Caskell [75], Hablerjam and Whetton [76], Ito [77], Lampson [30], Murphey
[361, Ohert and Duvall [781, O'Brien [7], and Thoenen and Windes [791. Some of those are ap-
69
8/3/2019 Carl Kisslinger- The Generation of the Primary Seismic Signal by a Contained Explosion
http://slidepdf.com/reader/full/carl-kisslinger-the-generation-of-the-primary-seismic-signal-by-a-contained 79/96
institute of Science and Technology The University of Michigan
to-,
S-2
, 10- . . .•
A (001'° '('02b00)
"
RIIio 2A:i, V
0.
-6 0 Nuclear .17(R), 5(L), & 19(B) Kilotons , l
10.6 8 HE > 00 Tons
_..
+H E 2 to 30 TonsHE
I Ton
o101I' 1 1 1 1 1 11 1 - )
1 2 4 6 810 20 40 60 100 20 0 400600 1000
DISTANCE (km)
, ~ ~FIGURE1. PEAK VERTICAL GROUND DISPLACEMENTS FOR EXPLOSIVE BLASTS
NORMALIZED TOTHE RAINIER EVENT Y T!!
1 0SCALING FUNCTION (After
Wllis nd 'v ll n
plicable to specific media, .g., Larps6n's work on soils and Murphey's in alt. Others are
' ~ ~primarily concerned with quarry blasts, e.g., the pioneering work of Thoenen and Windes, and
the studies of HabberJaand Whetton.
T
~~Fundamenta l studies on stress-wave generation are described In long series of papers
~by investigators at the U. . Bureau of Mines. In addition to the report of Ohert and Duvall cited
~~above, work by Ncholls [281 and by Fogelson et al. rsol ontain data on strain propagation in
rocks. References to ear. ier Bureau of Mines studies ay be found in hese papers.
There seems little value In ecounting here In detail the specific formulas at whichthese
many Investigators arrived, since an evaluation of their pertinence requires a ull description
of the experimental procedures and condtionsas well as the methods of analysis. Both O'Brien
and to preent summaries of om e of these studies In ddition to their originatdata. Yield de-,-
70 II
8/3/2019 Carl Kisslinger- The Generation of the Primary Seismic Signal by a Contained Explosion
http://slidepdf.com/reader/full/carl-kisslinger-the-generation-of-the-primary-seismic-signal-by-a-contained 80/96
Institute of Science and Technology The University of Michigan
pendencies ranging from the 0.4 powe. to the 1.1 power have been roind. O'Brien finds that,
for those studies in which wa/c (see Section 6.1) is known to be less thI'- !.i, the fPrst power
dependency seems to hold.
Although empirical relations of e.vnal strength and range ca- ,e found, any study which
ignores attenuation resulting from inelastic behavior of 'we medium is an oversimplification,
SUMMARY AND CONCLUSIONS: THE STATE OF THE ART
The study of explosion-generated seismic waves is still pri'trlly an empirical science.
In the absence of a complete theory of the processes that result in the radiated wave, progress
in further understanding of the sub,-ri ,- dependent on well designed experiments Untortusiate-
ly, the complex properties of earth materials and geotoge Structure in ,vhich full-scale tests
must h erirled out make the design of experiments difficult.
It has been seen that the analytic tools needed to develop the theory are known, and seem
to be adequate. Numerical techniques exist for evaluating solutions that cannot readily be put
into closed form. Th e greatest need is for additional experimental evidence concerning the
nature of the processes involved, so that the theoretical development can be guided along realistic
lines. This Is particularly true for the terminal nonlinear region. Although both experimental
and theoretical work in this zone are difficult, it Is in this region that the answers to many of
the outstanding questions lie.,
Information is required on the dynamic bt.',vior of earth materials (rocks and soils) over
all ranges of stress from the vaporization pressure to the region of infinitesimal strains.
These data must be collected for a wide variety of materials. The search for correlations
between these dynamic properties and convenient laboratory tests should be carried on vigorously.
In the analysis of data relating amplitude to yield, the effect of the properties of the medium
and the explosive material cannot be ignored. This is particularly true for chemical explosives.
In addition, it is only recently that the influence of ambient stress level or, equivalently, the
depth of burial in a particular test site, has been Included in a quantitative manner.
Because the relation between amplitude and yield Is diagnostic of processes at the source,
detailed measurements should be made at every opportunity. Th e uncontrollable variability of
parameters affecting amplitude will make the result of any single experiment of doubtful value
for wide application. The results of many experiments ma y reveal the correct formula. It
Peorns that problems of Instrument placement and departures from homogeneity of the earth
71

8/3/2019 Carl Kisslinger- The Generation of the Primary Seismic Signal by a Contained Explosion
http://slidepdf.com/reader/full/carl-kisslinger-the-generation-of-the-primary-seismic-signal-by-a-contained 81/96
institute of Science and Technology Th e University of Michigan
between the source and the instrument may be as much a source of variability as the r~onkitions
at the souj.ce.
The dependence of the amplitude-yi#.'d r.'!ation on the part of the speci ira- 'hot hP: been
observed on a particular selsrnO,.m must not be overlooked. Apparent scale effects In roing
from small to large yieidb may be explained In terms of the f1*110et~cy at which the spectrum
reaches Its peak value and the passband of the surrounding earth.
i
72
8/3/2019 Carl Kisslinger- The Generation of the Primary Seismic Signal by a Contained Explosion
http://slidepdf.com/reader/full/carl-kisslinger-the-generation-of-the-primary-seismic-signal-by-a-contained 82/96
Institute of Science and Technology The University of Michigan
Appendix
PRINCIPLES OF SCALING AS APPLIED TO UNDERGROUND EXPLOSIONS
Throughout this report, the us.- of tbo cub* root of the yield W Ian Urn ttv"d to fix dhe
scale of the explosion. A by;,:i diseussion of the principles underlying scaling procedures will
be presented. Several authors have treated modeling and V'.e theory of similitude thoroughly,
but two in particular have devoted themselves specifically tcu tl.t ground-shock problem: Lamp-
son [301 and Parkin [811. Parkin's paper contains an extensive bibliography.
Parkin's discussion is more comprehensive because he considers scaling from one medium
to another as well as scaling from one set o. limensions to another in the same medium. He
also includes scaling for visco-elastic and elastic-plastic substanses, in addition tc' elastic
media. Only the case in whicb a s~n.t-c medium is involved will be Included here. From another
viewpoint, it Is assumed that in goig from one exploulon (treated ab a model of all explosions
in a given mmdlur,) to another, the vel.city of elastic wave propagation does not depend on the.
scale of the experiment.
The scale factor is designated by S, and relates lengths in two experiments by L2 - SL I .
On the assumption that the velocity of propagation is independent of the scale, the time will
scale in the same manner; i.e., T = ST 1 . The third dimension needed to describe the quantit!es
involved in the analysis, mass, is treated by using density as a parameter characterizing the
medium, and then M2 , S3 L3 or M = S M2 2 1
These fundamental dimensions can be introduced into a dimensional analysis of any of the
quantities of interest in order to determine tbe ecaling relations. For example, stress, with
ML1 2 3 -1 - 2 -2 -1L2dimensione MLT , scales to S M S- L- L L- , ML T , so that at the scaled distanceSL, at time ST , the same stress is predicted as was observed at L and T in the original system.
A similar result follows for particle velocity. On the other hand, particle displacement u at a
distance r would appear as a displacementSu at a distance Sr in the new system. It must be
understood that this analysis tells nothing about ho w the quantities vary with distance; one does
not find the value at a distance other than the scaled distance from such considerations.
The choice of the scale factor Is arbitrary. In the case of an underground explosion, the
seale of the experiment is certainly set by the yield. For a spherical charge of weight W, of
constant density, the radius of the explosive charge becomes a length representative of the
scale. For this rason, a length numerically equalto the cube root of yield has been selected
as the scale length. If charge weight is thought of as equivalent to energy, the cube root of
the weight obviously does not have dimensions of length. Actually this is no problem as long
as the origin and function of thin number are understood. However, In order to remove this
73
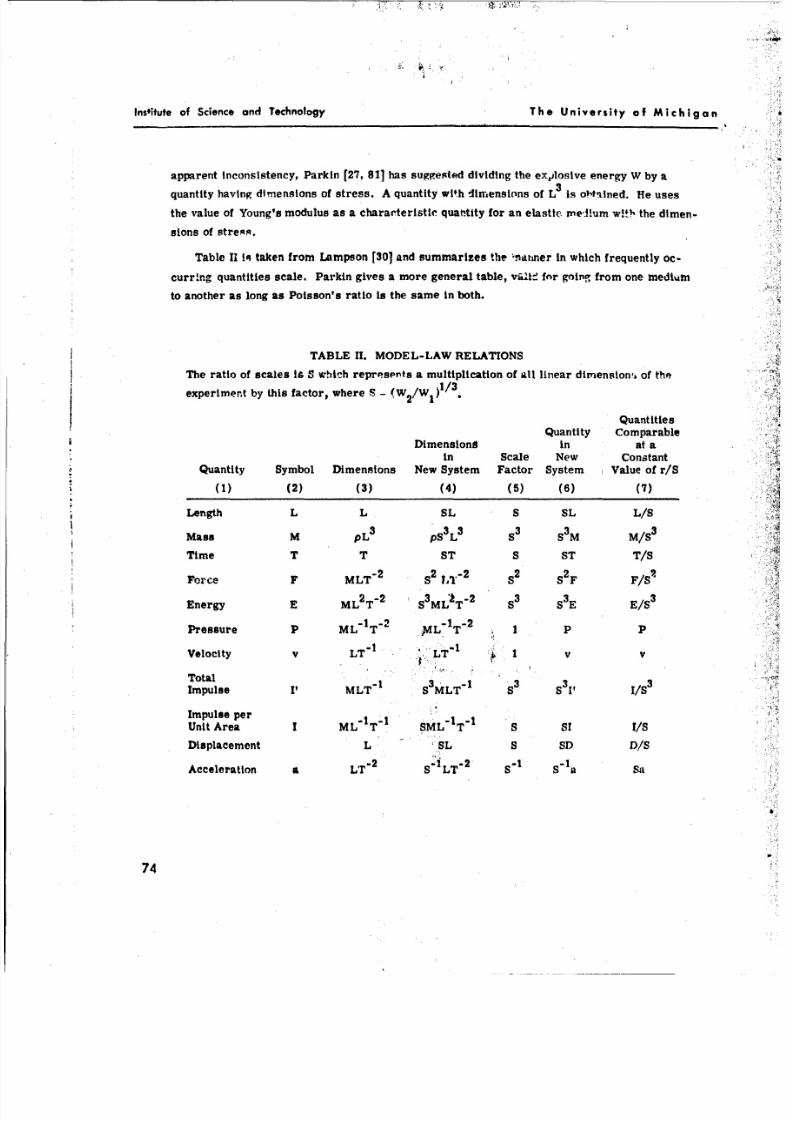
8/3/2019 Carl Kisslinger- The Generation of the Primary Seismic Signal by a Contained Explosion
http://slidepdf.com/reader/full/carl-kisslinger-the-generation-of-the-primary-seismic-signal-by-a-contained 83/96
Institute of Science and Technology Th e University of Michigan
apparent inconsistency, Parkin [27, 811 has suggested dividing the exilosive energy W by a
quantity having dimensions of stress. A quantity with dimensions of L3is obhtined. He uses
the value of Young's modulus as a charadteristic quatflity for an elastic ridium W~t!h the dimen-
sions of stress.
Table 11 iR taken from Lampson f301 and summarizes the ,natiner In which frequently oc-
curring quantities scale. Parkin gives a more general table, vrs'.1: for going from one mediumn
to another as long as Poisson's ratio is the same In both.
TABLE 11 . MODEL-LAW RELATIONS
The ratio of scales Is 5 which represents a multiplication of all linear dimensiont. of tho
experiment by this factor, where 8- Quantities
Quantity ComparableDimensions in at a
in Scale New ConstantQuantity Symbol Dimensions New System Factor System Value of r/S
(1) (2) (3) (4) (5) (6) (7)
Length L L SL S SL L/S
Mass M pL 3PS 3L3 S 3 S3M M/S 3
Time T T STS ST T/SForeT 2 2 -2 ~ 2 2F
Force'l- F F/S~
Energy E 2 -2 3M'IT 2 S3 3EE/S 3
Pressure P MLT2 M~L T2 I PP
Velocity v LT 1 LT1 1 v vt
Total M T 3 - ~ISImpulse It'L_ MLT_ 1 /
Impulse perII IUnit Area I ML' T_ SML 1
T_ S SI I/S
Displacement L SL S SD D/S
Acceleration ia LT" S"iL'2 S" 1Ia Sit
74
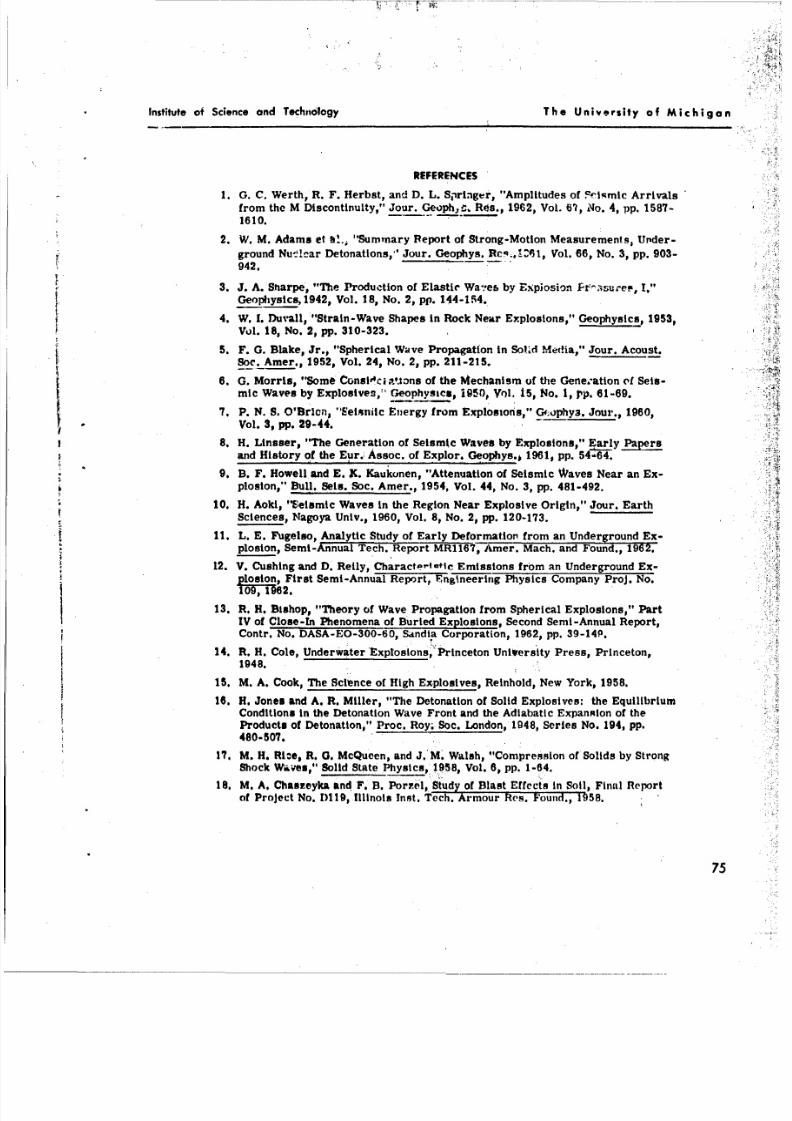
8/3/2019 Carl Kisslinger- The Generation of the Primary Seismic Signal by a Contained Explosion
http://slidepdf.com/reader/full/carl-kisslinger-the-generation-of-the-primary-seismic-signal-by-a-contained 84/96
Institute of Science and Technology The University of Michigan
REFERENCES
1. G. C. Werth, R. F. Herbst, and D. L. Springer, "Amplitudes of Srisqmic Arrivals
from the M Discontinuity," Jour. Geophj . Ros., 1962, Vol. 6'?, No. 4, pp . 1587-
1610.
2. W. M. Adams et hl., "Summary Report of Strong-Motion Measurements, Under-
ground Nu.lear Detonations, Jour. Geophys._Rcq.,.61, Vol. 66 , No . 3, pp . 903-
942.
3. J. A. Sharpe, "The Production of Elastic Wa,es by Expiosion Pr st'e, I,"-
Geophysics, 1942, Vol. 18 , No . 2, pp. 144-154.
4. W. I. Duvall, "Strain-Wave Shapes in Rock Near Explosions," Gophysics, 1953,
Vol. 18 , No . 2, pp . 310-323.
5. F. G. Blake, Jr., "Spherical Wave Propagation in Sol.d Media," Jour. Acoust.Soc. Amer., 1952, Vol. 24, No. 2, pp . 211-215.
6. G. Morris, "Some Conslici atons of the Mechanism of the Gene.-ation of Seis-
mic Waves by Explosives," Geophysics, 1950, Vol. i5, o. 1, pp . 61-69.
7. P. N. S. O'BrIon, "Eeisnitc Energy from Explosions," G;ophya. Jour., 1960,Vol. 3, pp . 29-44.
8. H. Llnsser, "The Generation of Seismic Waves by Explosions," Early Papersand History of the Eur.: Assoc. of Explor. Geophys.p 1961, pp. 5464.
9. B. F. Howell and E. K. Kaukonen, "Attenuation of Seismic Waves Near an Ex-
plosion," Bull. Sets. Soc. Amer., 1954, Vol. 44 , No. 3, pp . 481-492.
10 . H. Aoki, "STeismic Waves in the Region Near Explosive Origin," Jour. EarthSciences, Nagoya Univ., 1960, Vol. 8, No . 2, pp. 120-173.
11. L. E. Fugelso, Analytic Study of Early Deformation from an Underground Ex-
plosion, Semi-Annual Tech. Report MR1167, Amer. Mach. and Found., 1962.
12. V. Cushing and D. Reily, Characte,mi t ic Emissions from an Underground Ex-
pissio, First Semi-Annual Report, Fngineering Physics Company Proj. No.109,7 6 .'
13. R. H. Bishop, "Theory of Wave Propagation from Spherical Explosions," Part
IV of Close-In Phenomena of Buried Explosions, Second Semi-Annual Report,
14. R. H. Cole, Underwater Expiosions,'Princeton Uniersity Press, Princeton,
1948. C 196, p......
15. M. A. Cook, The Science of High Explosives, Reinhold, Ne w York, 1958.
16. H. ones and A. R. Miller, "The Detonation of Solid Explosives: the EquilibriumConditions In he Detonation Wave Front and the Adiabatic Expansion of the
Products of Detonation," Proc. Roy. Soc. London, 1948, Series No . 194, pp.
480-507.
7 M. H. Rize, R. G. McQueen, and J. M. Walsh, "Compression of Solids by Strong
Shock Waves," Solid State Physics,, 1958, Vol. 6, pp. 1-64.
18. M. A. Chaszeyka and F. B. Porzel, Study of Blast Effects in Soil, Final Report
of Project No. D119, Illinois Inst. tech. Armour Res. Found., 1958.
75
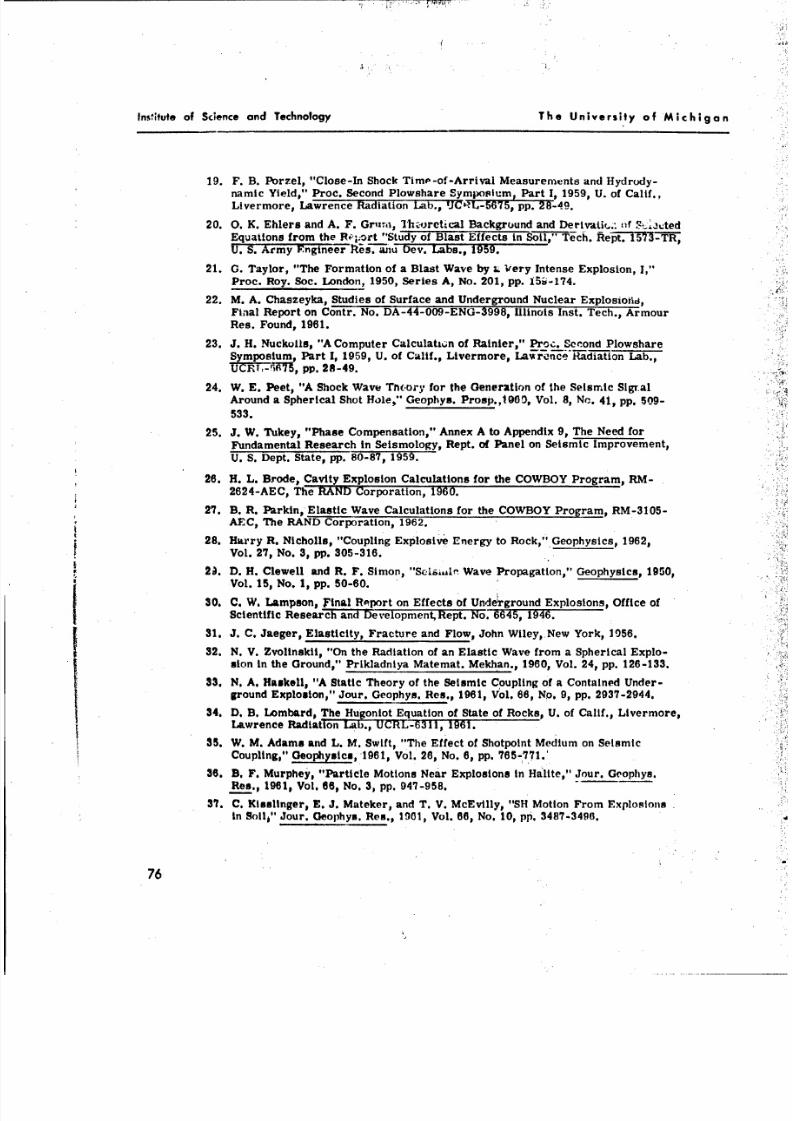
8/3/2019 Carl Kisslinger- The Generation of the Primary Seismic Signal by a Contained Explosion
http://slidepdf.com/reader/full/carl-kisslinger-the-generation-of-the-primary-seismic-signal-by-a-contained 85/96
Institute of Science and Technology The University of Michigan
19. F. B. Porzel, "Close-In Shock Time-of -Arrival Measurements and Hydrudy-namic Yield," Proc. Second Plowshare Symposium, Part 1, 1959, U. of Calif.,
Livermore, Lawrence Radiation Lab., juRL-575,ppT. N49.
20 . 0. K. Ehlers and A. F. Grizrn, 1*haretical Background and Derivaik.. of S-ItedEquations from the Rq'>;:rt "Study of Blast Effects in Soil," Tech. f(ejpTM75'i ;U. S. Army Fng-ineer A-eiiii1u 0ev. Labs., 1959.
21 . G. Taylor, "The Formation of a Blast Wave by L Very Intense Explosion, 1,"1
Proc. Roy. Soc. London, 1950, Series A, No. 201, pp . 156,-174.
22. M. A. Chaszeyka, Studies of Surface and Underground Nuclear Explosioi.a,Final Report on Contr. No . DA-44-009-ENG-3998, Illinois Inst. Tech., Armour
Res. Found, 1961.
23 . J. H. Nuckoils, "A Computer CalculatL;n of Rainier," Pro. Scrond PlowshareSympsium, Part 1, 1959, U. of Calif., Livermore, La rnce Radiation Lab.,
UCR1-") ,pp. 28-49.
24 . W. E. Peet, "A Shock Wave Ticory for the Generation of the Seismic Sigral
Around a Spherical Shot Hole," Geophys. Proso.,t000, Vol. 8, No. 41 , pp. 509-4
533.
25 . J. W. Tukey, "Phase Compensation," Annex A to Appendix 9, The Need for
Fundamental Research In Seismology, Rept. of Panel on Seismic Improvement,
U. S. Dept. State, pp. 80-87, 1959.
26. H. L. Brode, Cavity Explosion Calculations for the COWBOY Program, RM -2624-AEC, Thie RAND Corporation, 1960.
27. B. R. Parkin, Elastic Wave Calculations for the COWBOY Program, RM-3105-
AEC, The RAND Corporation, 196 2.
28. Harry R. Nicholls, "Coupling Explosive Energy to Rock," Geophysics, 1962,
Vol. 27, No.*3, pp. 305-316.M~ D. H. Clowell and R. F. Simon, "Scei,,~In Wave Propagation," Geophysics, 1950,
Vol. 15 , No . 1, pp. 50-60.
30. C. W. Lampion, )Final Report on Effects of Unde~lground Explosions, Office ofj Scientific Research and Dev'elopmentRept. No . 6645, 1946.
31. J. C. Jaeger, Elasticity, Fracture and Flow, John Wiley, Ne w York, 1056.
32 . N. V. Zvolinskii, "On the Radiation of an Elastic Wave from a Spherical Explo-sion in the Ground," Prikladniya Matemnat. Mekhan., 1960, Vol. 24, pp. 126-133.
33 . N4.A. Haskell, "A Static Theory of the Seismic Coupling of a Contained Under-ground Explosion," Jour. Geophys. Res., 1961, 'Vol. 68 , No . 9, pp. 2937-2944.
34 . D. B. Lombard, The Hugoniot Equation of State of Rocks, U. of Calif., Livermore,Lawrence Radiation Lab., UCRL-6311, 1961.
35. W. M. Adams and L. M. Swift, "The Effect of Shotpoint Medium on SeismicCoupling," Geophysics -1961, Vol. 26, No. 6, pp. 765-771.'
36. B. F. Murphey, "Particle Motions Near Explosions in Halite," Jour. Geophys.
Res. , 1961, Vol.*66, No.* 3, pp. 947-958.
37. C. Kisslinger, E. J. Mateker, and T.*V. McEvilly, "1SH Motion From Explosions
In Soil," Jour. Geophys. Res., 1901, Vol. 66 , No . 10, pp. 3487-3496.
76
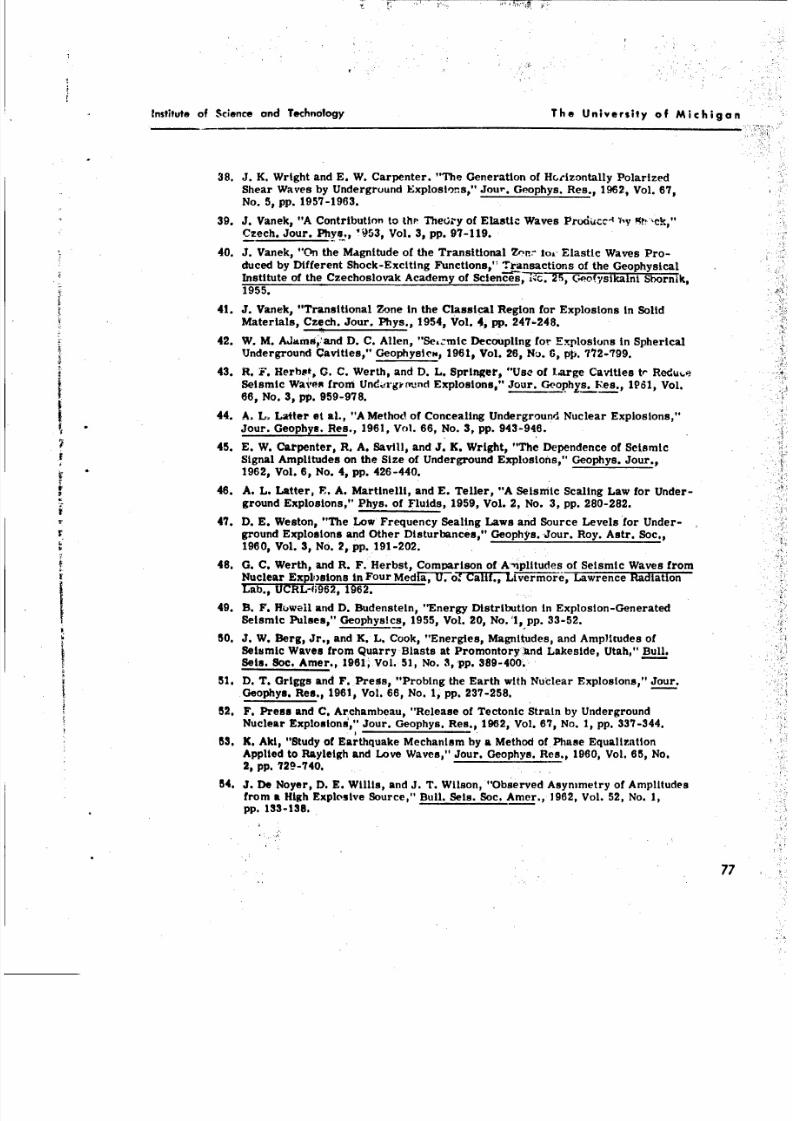
8/3/2019 Carl Kisslinger- The Generation of the Primary Seismic Signal by a Contained Explosion
http://slidepdf.com/reader/full/carl-kisslinger-the-generation-of-the-primary-seismic-signal-by-a-contained 86/96
Institute of Science and Technology The University of Michigan
38 . J. K. Wright and E. W. Carpenter. "The Generation of Hc rizontally Polarized
Shear Waves by Underground Explosions," Jour. Geophys. Res., 1962, Vol. 67,
No. 5, pp . 1957-1963.
39 . J. Vanek, "A Contribution to th. Theory of Elastic Waves Proudcc-
'y lt!ck,99
Czech. Jour. Phys., ,453, Vol. 3, pp . 97-119.
40. J. Vanek, "On the Magnitude of the Transitional Znr.- to , Elastic Waves Pro-
duced by Different Shock-Exciting Functions," Transactions of the Geophysical
Institute of the Czechoslovak Academy of Scien"-e--. 25, Cpof-ysikalni -Sornik,
1955.
41. J. Vanek, "Transitional Zone in the Classical Region for Explosions in Solid
Materials, Czech. Jour. Phys., 1954, Vol. 4, pp . 247-248.
42 . W. M. Adams 'and D. C. Allen, "Se.mic Decoupling for Explosions in Spherical
Underground Cavities," Geophysics, 1961, Vol. 26, No,. 6, pp . 772-799.
43 . R. F. Herbust, 0. C. Werth, and D. L. Springert "Use of large Cavities tr Redu...Seismic Waves from Undirgrmnd Explosions," Jour. Geophys. Res., 191, Vol.
6, No . 3, pp . 959-978.
44 . A. L. Latter et al., "A Method of Concealing Underground Nuclear Explosions,"
Jour. Geophys. Res., 1961, Vol. 66 , No . 3, pp. 943-946.
45 . E. W. Carpenter, R. A. Savill, and J. K. Wright, "The Dependence of SeismicSignal Amplitudes on the Size of Underground Explosions," Geophys. Jour.,
* 1962, Vol. 6, No. 4, pp . 426-440.
46 . A. L. Latter, F. A. Martinelli, and E. Teller, "A Seismic Scaling Law for Under-
ground Explosions," Phys. of Fluids, 1959, Vol. 2, No. 3, pp . 280-282.
47. D. E. Weston, "The Lo w Frequency Sealing Laws and Source Levels for Under-ground Explosions and Other Disturbances," Geophys. Jour. Roy. Astr. Soc.,
1960, Vol. 3, No. 2, pp . 191-202.
48. G. C. Werth, and R. F. Herbst, Comparison of A'iplitudes of Seismic Waves fromNuclear Explosions in Four Medli-. of Calif., Lvermore, Lawrence RadiationLab., UCRL-f962, 1962.
49. B. F. Howell and D. Budenstein, "Energy Distribution in Explosion-Generated
Seismic Pulses," Geophysics, 1955, Vol. 20, No.'l, pp . 33-52.
50 . J. W. Berg, Jr., and K. L. Cook, "Energies, Magnitudes, and Amplitudes ofSeismic Waves from Quarry Blasts at Promontory bnd Lakeside, Utah," Bull.
Seis. Soc. Amer., 1961, Vol. 51, No. 3, pp. 389-400. 1
51. D. T. Griggs and F. Press, "Probing the Earth with Nuclear Explosions," Jour.
Geophys. Res., 1961, Vol. 66, No. 1, pp . 237-258.
52. F. Press and C. Archambeau, "Release of Tectonic Strain by Underground
Nuclear Explosions," Jour. Geophys. Res., 1962, Vol. 67 , No. 1, pp . 337-344.
53. K. Aki, "Study of Earthquake Mechanism by a Method of Phase EqualizationApplied to Rayleigh and Love Waves," Jour. Geophys. Res., 1960, Vol. 65 , No.2, pp. 729-740.
54. J. De Noyer, D. E. Willis, and J. T. Wilson, "Observed Asymmetry of Amplitudesfrom a High Explosive Source," Bull. Sets. Soc. Amer., 1962, Vol. 52, No. 1,pp. 133-138.
77
8/3/2019 Carl Kisslinger- The Generation of the Primary Seismic Signal by a Contained Explosion
http://slidepdf.com/reader/full/carl-kisslinger-the-generation-of-the-primary-seismic-signal-by-a-contained 87/96
Institute of Science and Technology The University of Michgan
55. D. S. Carder and W. K. Cloud, "Surface Mutions from Lar re Undergiound Ex-
plosions," Jour. Geophys. Reb., 1959, Vol. 64 , No . 10, pp . 1471-1487.
56. N. M. Short, Fracturing of Rock Salt by a 'ontained High Evp!cz :e, U. ot Calif.,
Livermore, Lawrence Radiatin t.,11. UCh L-b054. 1960 .
57. L. Knopoff, and F. Gtl.Lert, "First Motion from Seismic Sources," tull. Sets.
Soc. Amer., 1960, Vol. 50 , Nu . 1, pp. 117-134.
58 . M, Ewing, W. Jardetsky, and F. Press, "Elastlt Waves in Layered Media,"
McGraw-Hill, Ne w York, 1957.
59. L. G. Howell, N. F. ,Neuenschwander, and A. L. Pierson, "Gulf Coast Si: iaceWaves," Geophysics, 1953, Vol. 15, No . 1, pp. 41-53.
60. M. B. Dobrin, R. F. Simon, and P. L. Lawrience, 'Rayleigh Waves from Small
Explosions," Trans. Amer. Geophys. Union, 1951, Vol. 12, No. 6, pp. 822-832.
61. 0 V. Keller, "Dispersion of Seismic Waves Near a Synall Explosion," Tran.
Amer. Geophys. Union. 1955. Vol. 36 , No. 6, pp . 103r1-1043.62 . J. W. C. Sherwood and T. W. Spencer, "Sigoal-to-Noiie Rat:- and Spectra of
Explosion-Generated Rayl igh Waves," Bull. Sets. Soc. Amer., 1962, Vol. 152,
No. 3, pp . 573-594.
63 . 0. W. Nuttli, and J. D. Whitmore, "A n Observational Determination of the Vari-
ation of the Angle of Incidence of P Waves with Epicentral Distance," Bull. Sets.
Soc. Amer., 1961, Vol. 51, No. 21, pp . 269-276.
64 . E. Stengel, Effect of Shot Depth on the Generation of Seismic Energy, Tech.Rept. 2, ON R Proj. NRO81-12, Penn. State Univ., 1955.
65. B. F. Howell, "Ground Vibrations Near Explosions, II," Earthquake Notes, 1957,
Vol. 28, No. 4, pp. 21-28.
66 . Y. Rocard, "Effect of Depth or Height of an Explosion on Seismic Signals,"
Acad. Set. Paris Compt. Rend., 1962, Vol. 254, No. 13, pp. 2404-2406.
67 . N. A. Ricker, "The Form and Laws oi Propagation of Seismic Wavelets," Geo-physics, 1953, Vol. 15, pp . 10-40.
68. G. R. Pickett, "Seismic Wave Propagation and Pressure Measurements NearExplosions," Quart. Colo. School Mines, 1955, Vol. :50, No . 4, pp . 1-78.
69. C. Kisslinger, Seismic Waves Generated by Chemical Explosions, Semi-Annual
Tech. Report No. 1, Contr. AF 19(604)-7402, St. lrouis University, 1961.
70. D. S. Hughes and It. G. McQueen, "Density of Bas tc Rocks at Very High Pres-
sures," Trans. Amer. Geophys. Union, 1958, Vol. 39 , No. 5, pp. 959-966.
71. I. Ito, M. Terada, and T. Sakurai, "Stress Waves Jn Rocks and Their Effects onRock Breakage," Mer. Fac. Eng., Kyoto Univ., 1060, Vol. 22, No. 1, pp. 12-29.
72 . D. S. Carder, and W. V. Mickey, "Ground Effects from Underground Explosions,"
Bull. Seis. Soc. Amer., 1962, Vol. 52, No. 1, pp . 67--6.
73 . D. E. Willis and J. T. Wilson, "Maximum Vertical Displacement of SeismicWaves Generated by Explosive Blasts," Bull. Sets. Soc. Amer., 1960, Vol. 50,
No. 3, pp . 455-460.
74 . J. B. Macelwane, et al., The Variability of Vibrations from Quarry Blasts, St.
Louis Univ., Inst. of Tech., 1948.
78
8/3/2019 Carl Kisslinger- The Generation of the Primary Seismic Signal by a Contained Explosion
http://slidepdf.com/reader/full/carl-kisslinger-the-generation-of-the-primary-seismic-signal-by-a-contained 88/96
Institute of Science and Technology The University of Michigan
75. T. E. Gaskell, "The Relation Between Size of Charge and Amplitude of Refracted
Wave," Geophys. Prosp., 19 ,, Vol. A No. 2, pp. 185-193.
76. G. M. Habberjam and J. T. Whetton, "O1. 'he Relatiorship Between Seismic
Amplitude and Charge of Fxplu, e rlred in Routine Blastin~g O/in: ' Geo-
physics, 1952, Vol. 17, No . 1i pp . 116-128.
77 . I. Ito, "O n the Relationship fBetween Seismic Ground kiplitude and the Quantity
of Explosives in Blasting," Mem. Fac. Eng., F->Lo Univ., 1953, Vol. 15, No . 2,
pp. 79-87.
78. L. Obert and W. I. Duvall, Generation of Strain Waves in Rock, Part t, Ti. S.
Bur. Mines, Rept. of Invest., No. 4683, 1950o
79 . J. R. Thoenen and S. L. Windes, Seismic Effects of Quarry Blasting, U. S. Bur.
Mines, Bull. 442, 1942.
80 . E. E. Fogelson, T. C. Atchison, and W. I. Duvall, "Propagation of Peak Strain
aind Strain Energy for Explosion-Generated Strain Pulses in Rock," Thir Syrh-posium on Rock Mechanii, Zart. Colo. Sch. Mines, 1959, Vol. 34, No. 3,
pp . 271-284.
81. B. P, Parkin, A Review of Similitude Theory in Ground Fhock Problems, RM-2173,
The RAND Corporation, 1958.
1BLIOGRAPHY
B1th, M., and E. Tryggvason, "Amplitudes of Explosion-Generated Seismic Waves.
Part I: Icelandic Explosions in 1959 and 1960," Geofisica Pura e Applicata, 1962,
Vol. 51, pp . 91-99
Ben-Menahem, A.,and H. Cisternas, The Dynamic Response of an Elastic Half-Space
to an Explosion in a Spherical Cavity, Contr. No . 1098, Div. Geol. Sci., Cal. Inst.Tech., 1962
Brinkley, S. R.,and J. Go . Kirkwood, "Ahcqry of Propagation of Shock Waves," Phys.
Rev., 1947, Vol. 71, No . 9, pp . 606-611
Carder, D. S., "Seismic Investigations of Large Explosions," Jour. Coast & Geod.Survey, 1948, No . 1, pp . 71-73
Carder, D. S. , W. V. Mickey, L. D4. Murphy, W. . Cloud, J. N. Jordan, and D. W.
Gordon, Seismic Waves from an Underground Explosion in a Salt Bed, Project
GNOME, U. S. Coast an d Geod. Survey Internal Repqrt, 1962.
Diment, W. H., 5. W. Stewart, and J. C. Roller, "Maximum Ground Acceleration
Caused by Nuclear Explosions at Distances of 5 to 30 0 Kilometers," U. S. Geol.
Survey, Prof. Paper 400B: B180-B161, 1960
Dix, C. H. , "The Mechanism of Generation of Long Waves from Explosions," Geo-
physics , 1955, Vol. 20, No. 1, pp . 87-103
Dobyns, D. R., "A Study of Seismic Character and Energy Return from Shooting
High and Luw Velocity Explosives," Geophysics, 1947, Vol. 12, No. 4, pp . 618-
63 8
Duvall, 0. E., "Concepts of Shock Wave Propagation," Bull. Seism. Soc. Amer.,1962,'Vol. 52, No. 4, pp . 869-894
79
8/3/2019 Carl Kisslinger- The Generation of the Primary Seismic Signal by a Contained Explosion
http://slidepdf.com/reader/full/carl-kisslinger-the-generation-of-the-primary-seismic-signal-by-a-contained 89/96
Institute of Sciencee and Technology The University of Michigan
k'ugelsu, L. E. , "Analytic Study of F,&rly D~eformation from an Underground Explo-sion," DA~k Report No. 1297, Final Tectiril. Rtetxrt MR1167, Amer07an Mach.
and Found., 1962
Grine, D. R. and G. R. Fowles, "The Actenuation of Shock Waves in Solid iv tturLaISwith Seismic Applicatit"t," Third Symposium on Rock Mechanics, Quart. Colo.Sch. Mines, 195i9, Vol. 54, No. 3, p 21-6 T
Grossling, B. F., "Seismic Waves from the Undergrouztd Atomic Explosion in No -
vada," Bull. Seisni. Soc. Amer., 1959, Vol. 49, No. 1, pp. 11-32
Hamada, H. (Editor)i "Symposium on the Equation of State for Earth Matc : 1q1
SWC TDR 62-126, Air Force Special Weapons Center,Kirkland AFB, N.1962
Howell, B. F., Jr., "Energy Represented by Seismic Waves fromn s'niall Explosions,"
Publications de Bureau Central Se'is~nologique International, Serrie A, Travaux
Scientitique3, Fare. 20, 1957
Howell, B. F., "Ground Vibrations Ncar Exp~osinrs," Dull.,geinm. 90c. Amer., 1949,Vol. 39, No. 4, pp. 284-310
Hud~or', D. E., 1. L. Alford, and W. D. Iwan, "Ground Accelerattans Caused by Large
Quarry Blasts," Bull. Seism, Soc. Amler., 1961, Vol. 51., No. 2, pp. 191-202
IIkegami, R., "On Ground Vibrations Cau'sed by Explosions," Bull. Earthq. Rcs. bist.
Tokyo Univ., 1951, Vol. 29, No. 1, pp.i 197-208
Inst. Fiz. Zemli im . 0. Yu. Shmidta, "Seismic Effect of Underground Explosions,"
Trudy No. 15(182), Akad. Nauk USSR, 1960
Johnson, G. W., G. H. Higgins, and C. E. Violet, "Underground Nuclear Detonations,"
Jour. Geophys. Res., 1959, Vol. 64, No. 10, pp. 1457-1479Lamb, G. L., Jr., Some b'elF~lr Fffects of Underground Explosions In Cavities,
Rept. LA-2405,TU- Alamos Scientific Lab., 1960-
Langefors, U., H.*We sterberg, and B. KihIstrooi, "Ground Vibrations in Blasting,"
Parts 1, 11 , 111, Water Power, Sept., Oct., 'w,1958
Latter, A. L., E. A. Martinelli, J.*Mathews, and W. 0. MeMillaln, "The Effect ofPlasticity on Decoupling of Underground Explosions," Jour..Geophys. Ries., 1961,Vol. 66, No. 9, pp. 2929-2936
Lest, L. D., "Blasting Vibration Effectsi," Part 1, 11 , 111, Explosives Engineer, 1950-
1951, Vol. 28, No. 6, p.176; Vol. 29, No. 1,,p. 12; Vol. 29, No. 2, p. 42
Lombard, D. B., and D. V.Power, Close-in Shpck Studies,- Preliminary Report,
Project GNOME, UCRL, March U, IFV5I
McKeown, F. A. and D. ~.Dickey, "Some Relations BEktween Geology and Effects of
Underground Nuclear' Explosions at Nevada Test Site, Nye County, Nevada,"U. S. Geol. Survey, Prof. Paper 400B, pp. B415-418, 19601
McReady, H. S., "Shot HOle Characteristics In Reflection Seilsmology," Geophysics,Vol. 5, No. 4, pp. 373, 380
Meecham, W. C., and J. DeNoyer, "Azimuthal Asymmetry of a Point Source in aCylindrical Low Velocity Medium," Bull. Sets. Soc. Amer. 1962, Vol. 52, No. 1,pp. 130-144
80
8/3/2019 Carl Kisslinger- The Generation of the Primary Seismic Signal by a Contained Explosion
http://slidepdf.com/reader/full/carl-kisslinger-the-generation-of-the-primary-seismic-signal-by-a-contained 90/96
*Institute of Science and Technology Th e University of Michigan
Nash, H. E.* nd J. M. Martin, "Significance of Some 1Fundar.,ental Proplertles of
Explosives with Special Reference to Geophysical Prospecting," GeophyWss 1936,
Vol. 1, pp. 239-251
O'Brien, P. N. S., "The Re1%atonshti Bekween Seismic Amplitude and ?tItfhs! .~f
Charge," Geophys, P::-odp., 1957i Vol. 6j No. 3, pp. 349-352
Richard, H. and H1 . Pleuchot, "Seismic Efficiency of F xpij'lovest, Geophys. Prosp.,
1956, Vol. 4, No. 2, pp. 167-184
Romney, C., "Amplitudes of Seismice Body Waves from Undergrund NIuclear Explo-
sions," Jour. Geophys. Res., 1959, Vol. 64, No. 10, pp. 1489-1498
Shock, L., "The Progressive Detonation of Multiple Charges In a Single Seismic
Shot"ephyscs,1950, Vol. 15, No. 2, pp. 208-1
Taylor, J., 0. Morris, and T. C. Richards, "The Effect of Velocity of Detonation on
the Efficiency of Explosives used in Seismic Prospecting," Geophysics, 1946,
Vol. IA. No. ?, pp, 350- 361Willis, D. E., A Study of Seamic-Wave Pro~et-ion and DetecUlon, U. of Mich., Inist.
of Set. and Tech., 1ST Rept. N,) Z41 -F,1966d
* Willis, D. E. and J. T. Wilson, "Effects of Decoupling on Spectra of Seismic Waves,"
Bull. Sets. Soc. Amer., 1962, Vol. 52, No. 1, pp. 123-131
Wright, J. KC., E. W. Carpenter, and R. A. Savill, "Some Studies of the P Waves from
Underground Nuclear Explosions," Jour. Geophys. Res., 1962, Vol. 67, No. 3,
pp. 1155-1160
Yoshikawa, Soji, "The Grouid Motion Near Ekplo toN," Disaster Prevention Research
Institute, Bull. No. 49 , Novemnber. 1961
81

8/3/2019 Carl Kisslinger- The Generation of the Primary Seismic Signal by a Contained Explosion
http://slidepdf.com/reader/full/carl-kisslinger-the-generation-of-the-primary-seismic-signal-by-a-contained 91/96
Institute of Science and Technology Th e University of Michigan
DISTRIBUTION LIST
AA.,,adReearchl P,.juIs Agency,The Peatat. W.hiela, i. Comood. bwtihato t e gkta. Dea t,.t..t . .*At.;Al Moe.-D C. tim,,, 9341ro1 3..i flod, N. W.. Washinton. Ui.C.
Air Fares. Cembrd.o Reearch iabeflie.. I- G. Ceatat.. aapbiepal Cupetatift. p. 0. amC. Admiral Station,
N".m-u 1141d.Ndi .d. Mooaehuw.tts T.l.. is, obba
A TX; Capt. Robert A. Cray. VUtAl' CRZOW (5) ATTN-. A, A. lbroam#.
A . Force (Write Of141-leot Neemsrth.Wshigton 25. 0. C. CSNWta .apbyti. 'e~i P. 0. Id.. C. Admifral tta.n
A rT4:* SAPC.Miller W111Ifin. Soft, USAF 45) Tailam4. (kihtomm.ATTN- J. I. A. T. W.dbu.
At Parts TeotewiftAoPPle~ti-no Center. Wooknltmtgas, 0. C.
ATTrC, 70.1. Li. Col. NIttattew (61 V .LCas a" Goodeil, as v . Contiv-rcet. Ne..d.iAlliS 1. IL P" ..
Allied Research Aesottites .00P luet'td,irginia Road.CeOWod.Mauch~ot Dapwe~ of Camisie. Coast wildGoeti ft.,ey, Gooples
ATl* Mr. Arno~ldIBWd Division. Issabbagti IS. 0. C.
All , I D. Dae L. Carder.Armet Servie~a whelmI itnfomtion A wty. Arlbagtut Phil Station,Atimitec 11. Virginia 4201 vmta.%sta Cocuterv. V. 4. ces.t ni. dmedtiUy. Ooaplty.
pca. Di~eis Wdm Is 0. C.
A?74i Mr. And,.., Ungar Daild 4. 1 eaeeed %aelip e A-'btey. Gooahys"c
Amtmy bigi..or Reearcth add oveP11t1 Labo"reteie. V. ii., 'a"t AlliS Mr. UaidedM;AYp~3.1.01.., Virgina
AT". l,.D.taaV~~ Coeftab oi Cemllo, P.;~ Dwio.. 251. Pc... City. Cklmhowa.
Relmed . NIMtc. amu,.ltd. P. 0. Illow 3 AlewaCEi.. VlI~g . ATTN:. Dr. JobsM. Crawford
ATTN: Roland?. Rears Date. Lto bgmfl Apea. Plaid Comelo.M om -adc., olondis111.11Afl-weu4.e. It" Mase
3.11TolpoeptcaAbomoilriec, 10wray Nil. New ersey
*77211 D.. Sn& . Mosemm.f AWI lop ert Age..y. N.dimow, Wsiliss IS. D. C.
AThT SoftO0. LA.MSell 7.lopS.,. tAbwasiaie. Mean IA.2lS, MairmyHil. erseey
Arri~ 0..5.1stV.aqDeader alet a aC. n Diiian P. 0. amc III15. NaustoI,'
1161ell -aelw.tAboratile. wblip"Y. N..ieey ATT +, Mrs. MhlatadB3.a.. L: btria, 42)
ATT~lsD.IA. WlsrEdeton. Oartmablam anmDLri. Dirater CE oseer., 180 reak.
Sell Tlephonse Liaborstariea Wetern tiactrie Ccatpsay.Whippety. l.Avoo. 3.ato.. Ismmikoltsta
N_. Jet.y AlliS, Clyde Debbie
fldger. as sevmeeatm 1 0ropst~.W Brookine A,*-
C6110".Park. Maryland AT h P. 7. Stroelie
W 3i.41OfOlV. . Cade 44 D. Weheis 5 ~C. AtT. D, Freda . Marris,
ATTM1 Mr. A, N. *l :L
aftleae. afdel fied Dft*.3eal e~t MiW. DolteleftCalifoenia nalitv afTecnology. aptwlueisll Lokeatery. 220i mrsmich.Fort Po.I..i. VIilgbt'
tNult, 4.. Rafael A-onas,Pasadea.Californ~ia ATI* . O. & .L 5tulAlT*, Dr. Htupemieff
C&it~r,, hetiect.l CEa?MiG&, 5016imm tals ltAboueloy. 22o Compswsls ftc.tdolpl Ilaslt. Ree.1.a
NuIollSanP.15.1ANaaa.Posados. Cllientl Marylantd
A~l~4 0..L KnpeifATTN. Mr. Ybtiatti Caehlage
Csiiuei.heliataTatmeag..uctaalela~i~. toGenerc~al Atreakti.Comersiit tDl. Ared. Rait-Cyted,Null. ft" Rafael A-ot.. tao't , 4!1 1 P mtis
AfTT~i, F ank Pro". ATTNS,Mr. Joseph . tal , Il
Ifiverelly CE aliforttia, lawromo aa diation tAbeestery. Licetmer.. 0qn.l G*epb3It,ia Co~ne 7 11ete ClubBuilding. IllioneCalionia T ....
AtTN. W..Polard P. W..bat. 0.. Clarisel. Visit% Iiil ATTN. Dr. lewla W. Wel.t ih
VftiV~ralty CE aliforntia, arippa InSiltll CEDo ..soohpiy, 1 jollo. aaepitalooi andPola st eee, Cc.ta. 031.91tlt Highlantdplad,California Madicon , Wlgeto.10
AlISt Dr. V.11.. Meotb AlliS, ProfessoarorgeS Ibealiar, Dirulsr
VUtrly CE aliforntia' Ses fvp~.Ntobn,Rbal%0y4, al"f... 0*9lyeleal flarviev, Itteopperaea,P. 0, POat31iO4, Dallas 4,
A7TTMProfessor P. 11.erly A Dr.0.lae ledara
82
8/3/2019 Carl Kisslinger- The Generation of the Primary Seismic Signal by a Contained Explosion
http://slidepdf.com/reader/full/carl-kisslinger-the-generation-of-the-primary-seismic-signal-by-a-contained 92/96
Institufe of Science and Technology The University of Michigan
Goveanol Corpowatio. *MaoD.P. 0. Som Wt1.LA."a. .i~bew t4MlIW bwwowk1W T-t01011100 Istee"I E%-loolo, P. 0.is) man31. a. am.5, Mi'..'..
c000..k.h corpoation.. F. 0. oft 'r:-7. in.33. M0.TellsI~U~ .34
AT71f* Dr. 1. Nwer' J. (W mumi awl"b Mw$"- Coner. 311Sta. Pa awalmh-aa
0rag o.m.."1 ente~lr. P. 06 Us 003, Dallas 5. Tdosl ON3-S *A1TN, Dr. L3.d ..kia. iso
Methanl b3oes ml.. Ian,03113aw.ItionAvenu. N. W, 100,.11-0,1 3.owreh a Darwinis" Dlisam. Goompkylml mmeb IS. ingum. D. C..lalon. P. 0. Dre. 2039, Pittsbu.rgh SO.Pateylv3.mb ATTN. Dr. Ito It Musm
ATTN-, Dr. T. J. 0DmmtI Dirniar
bfealApeTIMian" ... 00 . 1N w ... b akeS .
AiT* rl.I DankCa. IbsailmWllbrth O..pkevo. Holy~Wet4.fbl talw~r.V.ktrw Diags U. Cellist-
ATT13 ~ ~ ~ ~ ~ ATNmkr Lmae m s~ ban.130.
A77* D,. A. sf b eb.m Emlkwe w0.5 b.5
Deartent atsaelwila. wtw%.~dCrwwb V34..3.Copeoima Coulomb
Mab. kalWe inkinwa im I u iembs.n *7115T Dr. 5,S -uwg
JATTT*D. 4.im#Ea*wk o..~T.D.P m1
Aom", 14111woP. e etem 7k.k"i.I D.r.tlA. Dtmuee .. e. bSe. tre. a"A~~~rr~~i Louis C,~~A li Dr.oo intoalebs a o ml rt r ste..* M I 4
* ~ ~ ~ ~ ~ f~ue ofTIw.~w V. L' Ollolmosa Owrty Sbmateo Federal P....lmolft..t Pr . a
Cener ea erws J.obra" i 35.% Mr 90.IL
~ATTIN..r. M..Memofa..~~~~~gim~ve ratehr7au~w~'.I~Si.Crsr~l..esS.uteCrea , . ra ls o~
14hLabraores *7175ler. 0.wahstT. Dr .oe
LAIM, MrIga* ~3a. Cok4 Dhaalyloating. Prlla, Ntle Jwlm.p* te 1oewapy o"' l r#
ATYATT Dr.. LAwir
Tutu10,Oklaoa.4Th VAWWr&"s.f . 310*koom re S let.te Museem. C.MisC.I
ATTXL Mr. Pek . stinia 5AOT eff. qaiw i tickorl.Te~ eWY
CeeTIs ow. IL 3..Sembe AS. 44ul",nb.4..3.20.Khg ig. 44.1.3 Par,.44 l
Malper.~ ~ ~ ~ ~ ~ ~ AT Dr.pn~ipella bFe. Walsall. Jr...S m.t~lri
WLmosent ?Seiot bserva.l olds aorlyrle". o$Crpaton of 3,or" Cmis ,MaS"
£771York. ATTAkiMesr.£75u.0. . . i l l#rmakf.lseM.'4 e~e
M.~r i~arpes~o... 3133bn*bs C.i., 300 AliA~ 3m ASaliersatitofari... David gfira, NOri CeSn.
X" .e riATTss Dr.~kVlvjLpso
ATTN1:D. . L. *71: . I.IleN t*.spSlA
S3.Oa~sy U~wiae,lk,. 4 Talel.. blat 5 Mw. 44 Raiw crprtion, Dow.la 10blebI," sm.., mAdl.5a5195, N
MeIS&sre4010111"1 U,"'latllmae out"Al1lieIAT r Ptad AlTurnp4MSC3.4.iusp spo1. 71 r 0 .P.a
ATTNr.** ILivr Mmmoomor1OWImisrIstiuteTr" Ma 83
8/3/2019 Carl Kisslinger- The Generation of the Primary Seismic Signal by a Contained Explosion
http://slidepdf.com/reader/full/carl-kisslinger-the-generation-of-the-primary-seismic-signal-by-a-contained 93/96
Instittite of Science and Technology The University of M ichigan,
Owels. Cor Minnlu. blebeq 112, laiaS U.... AARq-Rv. X0. St. lftI* hhmstal' Thebhw*. of I n-0'
ATM?4 Mr. M. L Merritt ATM: Or. . R. IL,,kr~h
bsdim carp. .s. Dii.sion ?*It eWts.Us", AWheqeItuee." U114attle ftlors"T. S ... 4 CeePlystre. 31111 il". Sreet
Wels Corpouation,edS. ill", ARentalqee. ?$. Want". LATT~ Dr. WUtb. Rftvde. 5..
ATTX: WWS..eH. Perrot Tns@Instuents h.enPori". b-. 0. ... , 3S. Dauls 35, Towns
bedS. ceo s tio. DineS..t ?26. bedS. Via A"eenq. 11. A1TM R. A. Arnett 2
Melen 0.1amselty of Tema. A.0I. 32. Tells
ATTNVA. D. Tbrmbfi A1T Proessor W. T. Mee1tlbergr. DoetrSeeS of tOnelgy
bell D.elpem'it Com.pany. . 0. 3n "I. intenio 1. TO-*e Wihed0-6 Sblame. Divsio. P. 0. We 3114.AltnumndrS..irginia
ATTNX Dr. Sifbey KadLbe AT 1I Mr. F. IL Coker tS.
Ssedre ~ttedI'el~rul,..Dessie~.' l O~hw fu...Tb. I3b.rsa0rrn o a~r~t".NC AiS..sdeI.old, ft.dem
ATT. Dr. U"was T. Harris CALbemi.
~eee.Swr1 Cpers~em.??YPhewN..' * ~ATI l t Mrs. ofuvt A. Allens4%)
AuTT Mr. A. P. Alhb 11105f im,64)1u0n.bg~iec . 00 A'Jeo~bh e". Vene.
VVIeerleyesmhmS. a.~ , lefo. Ca"eruh ATIVI C. 3. 7en6"
ATTIs Dr. blew L USh..Ib~tet~ere~y~ be tretd,20 Allendale Reed.Psbomilos
spe.oewnraCorpraion. "I Flew. &psnet,Glendale1. Culfforaf CaldsS. . i.,,
fteled Rooee nsbtitte. MeSWOort, Califonia M.0.Oeelqtesl mar.". US6Mme'si lo od, mis.s" at%. Clver.
A77% C. M. AM..wATflb Lft.rSba
Rueslendee Arch betS.... Monk Park. Calf~misltslneelty at13".A Deparsmot of Oeepl'yse. Milan ftildingi OWt
ATTN+ I*. fid Ubonees. .~ ,.
mnfod Reeamrchation. Wall Police alifornia ATMi Preteie n COW
AMC~ I*. 0..rp IL Dwell . w'hOettn.Wd~ S ~,oe.~"NMlee Roose et eteo. PMeltb Lberdwb, monut Fa55; a*-. A"%2 ailwift"43maelel 1.1e6km.U;J.
AT'TN..Dr 0.JosMb t iy or..*1 mn46017 walle -4 Ots, flemselt Center.tuieiveslty Arens, Ma ti..1, *laeeoSn
Modrir R.esef Imette. 3m eout . C"Wienaka AlowS. inwl.4 Cincinnti 1. Ohiok
ATTNMDr. USterd M. A'~u mie3'md U. A. bratdS.tt.9.j.
US.d Rooeelte betete 3Mb Poll. CWheen -060 il tooeCIde"UINrd. Pars t. Proe.
ATTN. V. ". arthe AM N Proessor T. Renard
Uwemiend'Oftreh bmetie. Palo Aft., Calkht"s Atle Insitteof oth AerifAe 3410RhdPoS trolt, montroeels.
ATYT '10. AllenPeee P.Q.* Ceassi
SS~e~rdUeeen~ IstltlePu~irbeitei.. 3m pul, at - ATMSSMr. John C. Mood. fterattve Director
fbre o leeAbel, Abae, 10Re CI*e Venseff, ParisV. Pris"*
USkaftfrdeseearetbeimlee. mesheuft, Califonia AIM Dr. James. ovealy
ATTSh L. M. SWMf , U.Seetlei. Loberitry. ttppees, We-ed.
Uenfrd RooesevSelt~ t 111fll~ MO.MeuS.1 anth. &LfOM16' ATTNh Dr. 3.55cc 1111t
ATM Dr. Roertn 11. Yell., Jr., D~nIMUP,tsyelte niv1l". tlieplly of Tommie, Departente f Phyeie. Toronto 6. Canada
RMeiturdMilnreolty. 010 bw'w Phroes airolnry. Sanford, Cai. Af# rbin3 .Wl.fonta Woi..hm ..nsiu aoee, P. 0. Ilee to, Ueounetb, lurid
ATT14 tip, Wltpq N. L. Pmweky ATM Professor, C. L. "evnl
IN. Jamie tatieiretp, The belsis of Tehelogy. 1411MwlifSree, Uiveesity of Wlailierovnii. baSti f Uinstrd Pri-O. OtttelniOh. Asste . mleeeer Research. Johanesbu~srg.leutsh frira
ATTN, be, Caenltieegkege, ATTW, Dr. A. L. Wa~s
84
8/3/2019 Carl Kisslinger- The Generation of the Primary Seismic Signal by a Contained Explosion
http://slidepdf.com/reader/full/carl-kisslinger-the-generation-of-the-primary-seismic-signal-by-a-contained 94/96
In;';ute of Science and Technology the University of Michigan
Advanced Research Projects AgencyThc entage,., Washington 25, D. C. (.V
Advanced Research Projects Agencymheentagn, Washington 25, D).C.
ATTN: Mr. PhuaseUl Baird
Advanced Research Projects AgencyThe Pentagon, Washigton 25, D. C.
ATTN: '&. R. Bi"ck
Advanced Research Projects AgencyThe Pentagon, WaxehIrwton 25. T).C.
ATTN: Mr. Donald CIsmenta
A& d~ Rsesrch Projects Agency
The Pentagon, wa"Az~ntrm P4 31.VATTh: Mr. MIN.R. VArrle
Advanced Research Projects AgencyTh e Pentagon, Washington 25,.P r
ATTNt: Vri. ack Ruina
85
8/3/2019 Carl Kisslinger- The Generation of the Primary Seismic Signal by a Contained Explosion
http://slidepdf.com/reader/full/carl-kisslinger-the-generation-of-the-primary-seismic-signal-by-a-contained 95/96
~ ~pi0
-j I. rj I t
is~~~ wj. 41 w
*Jr~w! -i 2a
6. ZC
Sous!. ~CS
~ .04
.vS..AN Pig 2
~ *'IL
8/3/2019 Carl Kisslinger- The Generation of the Primary Seismic Signal by a Contained Explosion
http://slidepdf.com/reader/full/carl-kisslinger-the-generation-of-the-primary-seismic-signal-by-a-contained 96/96
.9 I . ' II N
fi Ji l 'C11,1
JA I