Embed Size (px)
Citation preview
Case-Control Study
Chunhua Song
2007.10

Warm up

exposed
unexposed
a
b
c
d
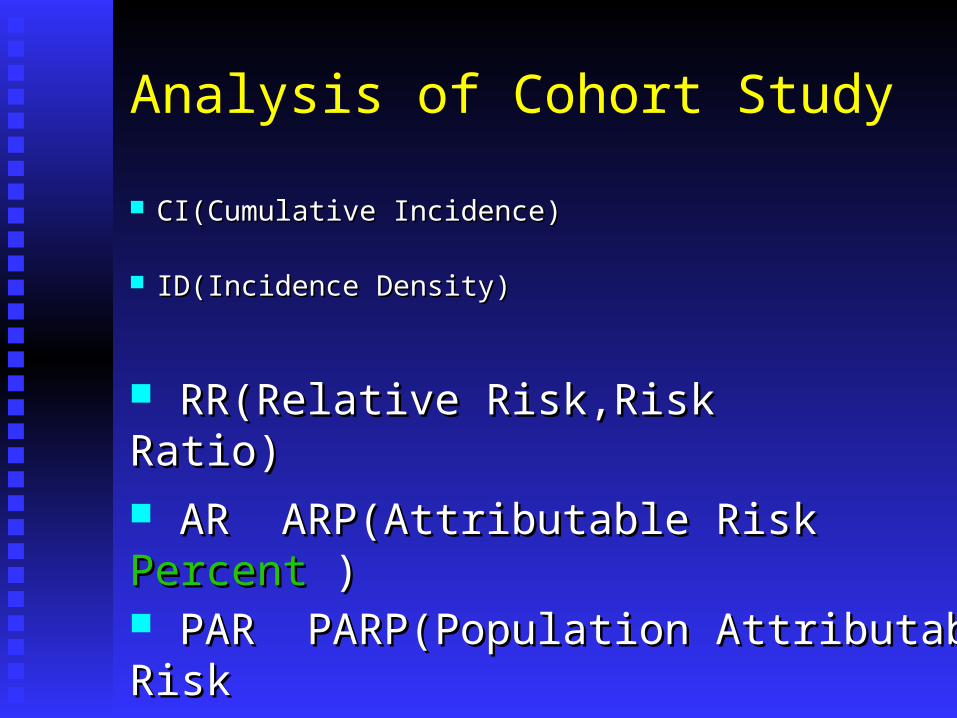
Analysis of Cohort Study
CI(Cumulative Incidence)CI(Cumulative Incidence) ID(Incidence Density)ID(Incidence Density)
RR(Relative Risk,Risk RR(Relative Risk,Risk Ratio)Ratio) AR ARP(Attributable Risk AR ARP(Attributable Risk Percent Percent )) PAR PARP(Population Attributable RiskPAR PARP(Population Attributable Risk
PercentPercent))
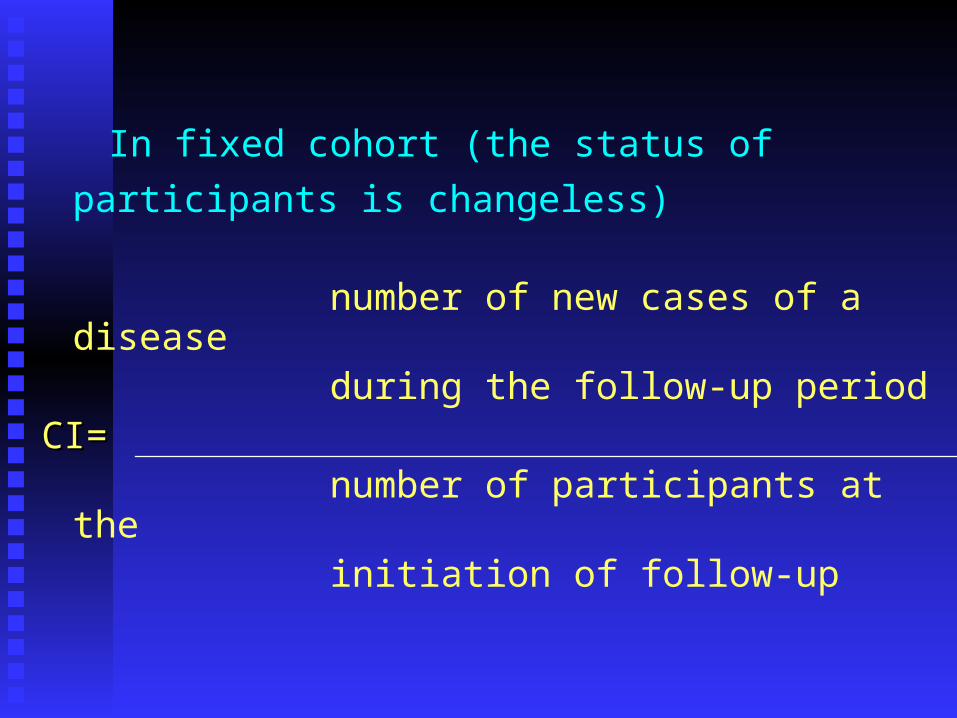
In fixed cohort (the status of participants
is changeless)
number of new cases of a disease during the follow-up periodCI=CI= number of participants at the initiation of follow-up
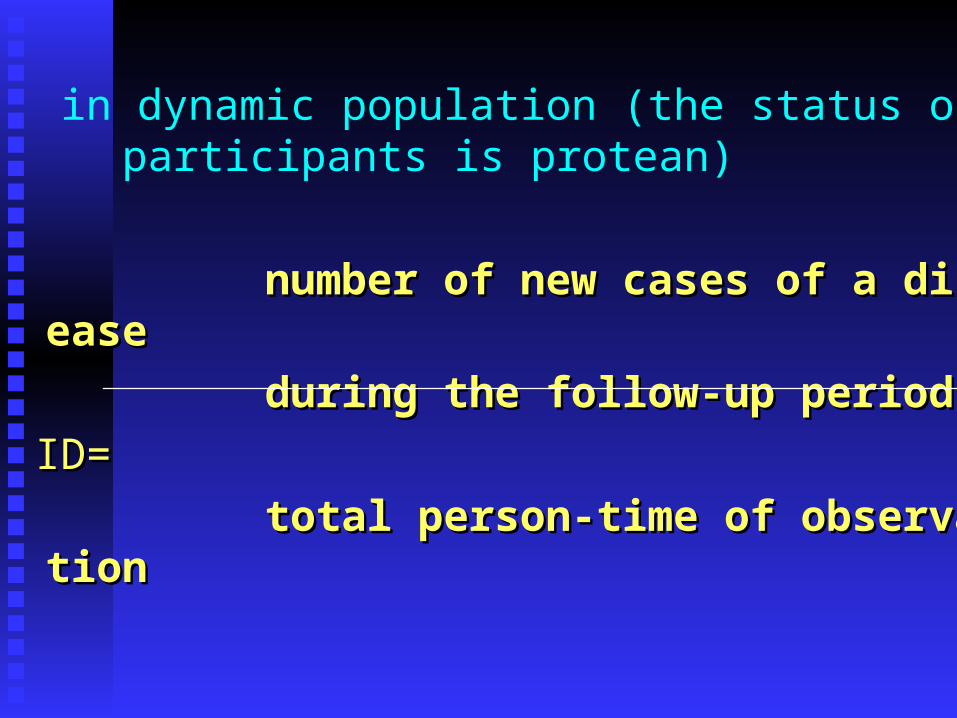
in dynamic population (the status of participants is protean)
number of new cases of a disease number of new cases of a disease during the follow-up period during the follow-up period ID=ID= total person-time of observationtotal person-time of observation
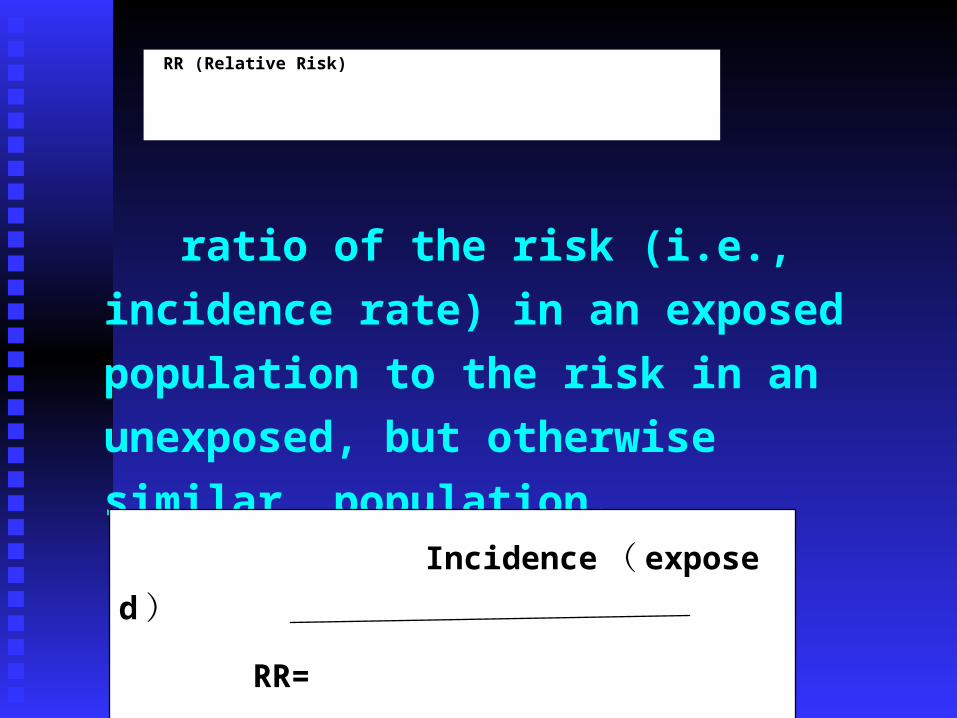
RR (Relative Risk)
ratio of the risk (i.e., incidence
rate) in an exposed population
to the risk in an unexposed, but
otherwise similar, population.
Incidence ( exposed )
RR=
Incidence ( unexposed )
indicator of the strength
(biological significance) of an
association between an expose
and disease.
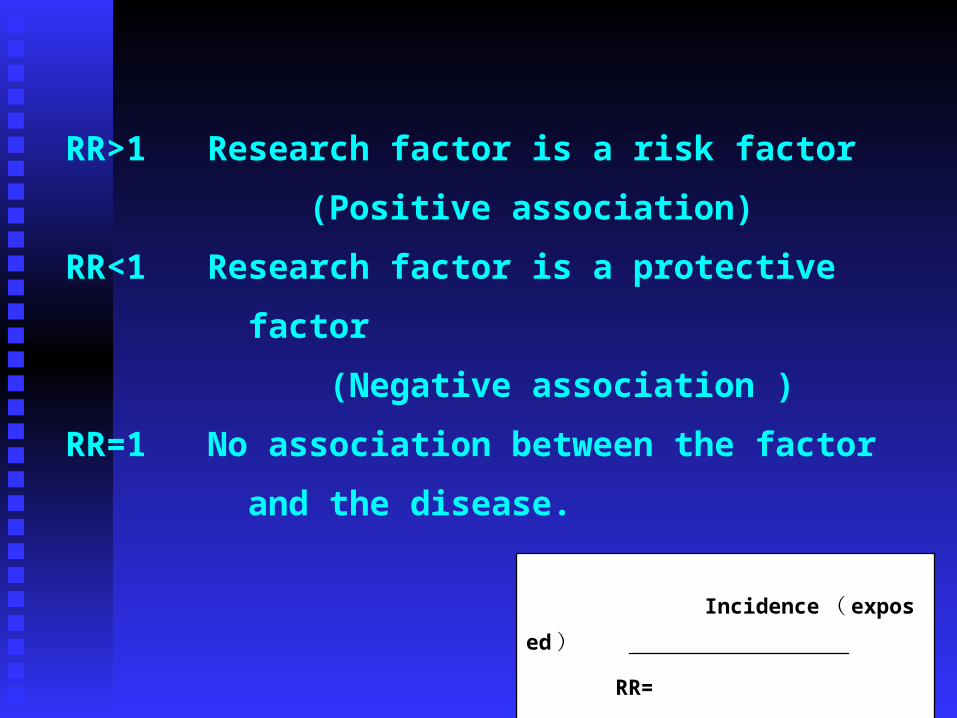
RR>1 Research factor is a risk factor
(Positive association)
RR<1 Research factor is a protective
factor
(Negative association )
RR=1 No association between the factor
and the disease. Incidence ( exposed )
RR=
Incidence ( unexposed )
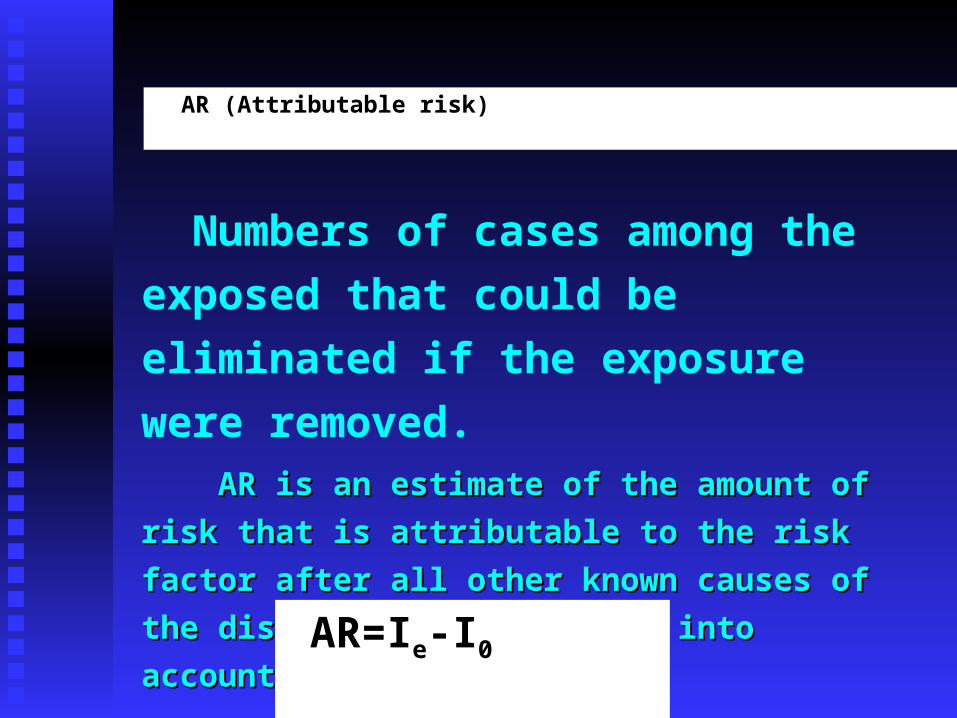
AR (Attributable risk)
Numbers of cases among the
exposed that could be
eliminated if the exposure
were removed. AR is an estimate of the amount of risk AR is an estimate of the amount of risk
that is attributable to the risk factor after that is attributable to the risk factor after
all other known causes of the disease all other known causes of the disease
have been taken into accounthave been taken into account AR=Ie-I0
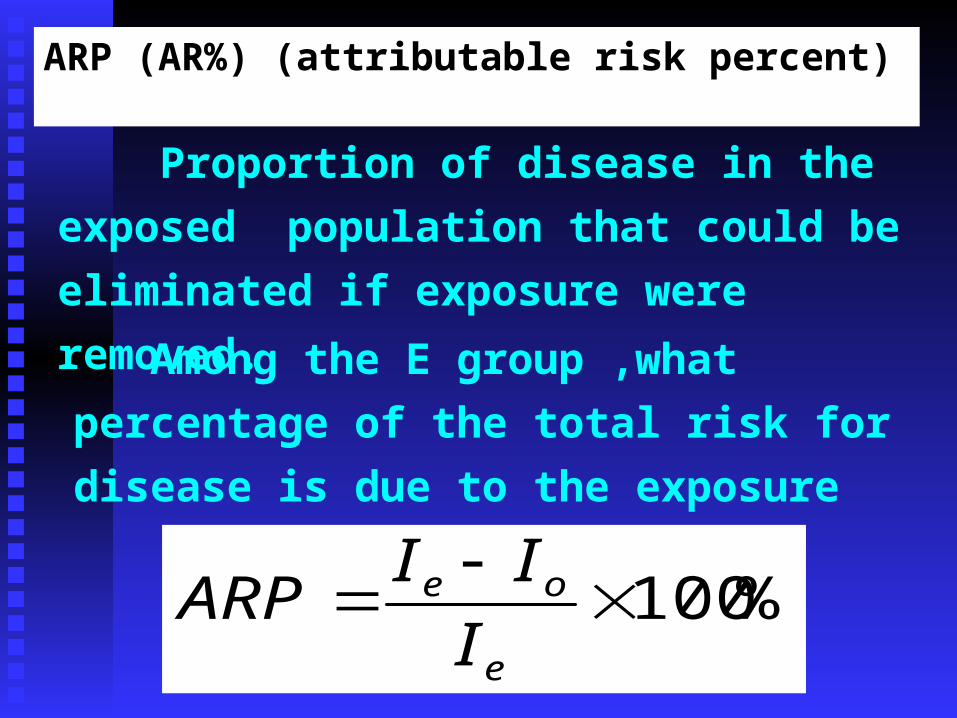
ARP (AR%) (attributable risk percent)
%100
e
oe
I
IIARP
Proportion of disease in the
exposed population that could be
eliminated if exposure were
removed. Among the E group ,what
percentage of the total risk for
disease is due to the exposure
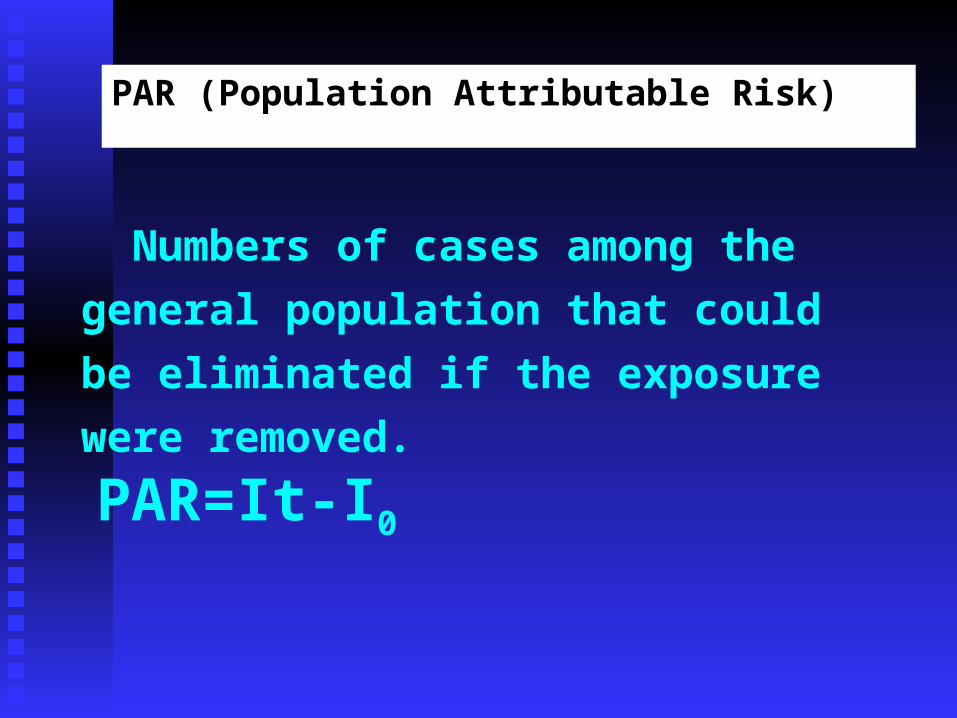
PAR (Population Attributable Risk)
Numbers of cases among the
general population that could be
eliminated if the exposure were
removed.
PAR=It-I0
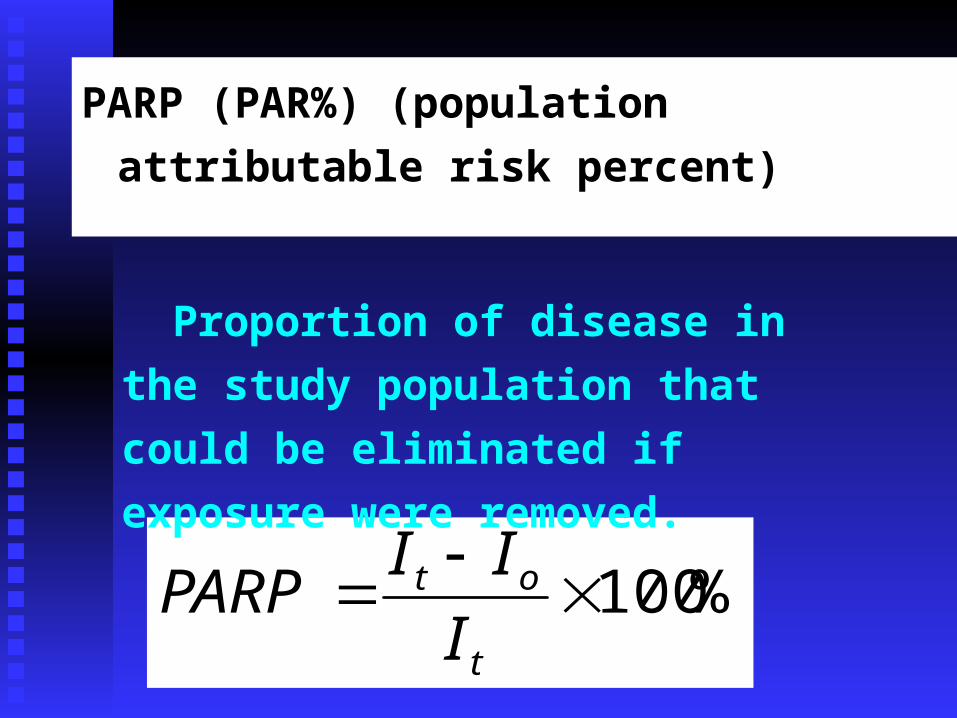
PARP (PAR%) (population
attributable risk percent)
%100
t
ot
I
IIPARP
Proportion of disease in the
study population that could be
eliminated if exposure were
removed.
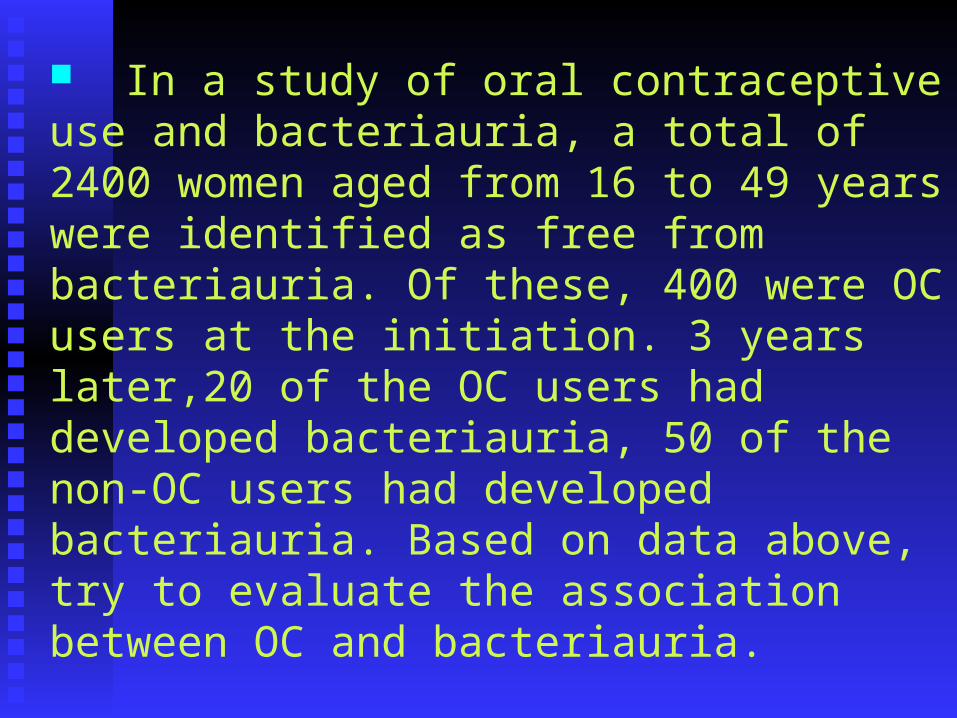
In a study of oral contraceptive use and bacteriauria, a total of 2400 women aged from 16 to 49 years were identified as free from bacteriauria. Of these, 400 were OC users at the initiation. 3 years later,20 of the OC users had developed bacteriauria, 50 of the non-OC users had developed bacteriauria. Based on data above, try to evaluate the association between OC and bacteriauria.
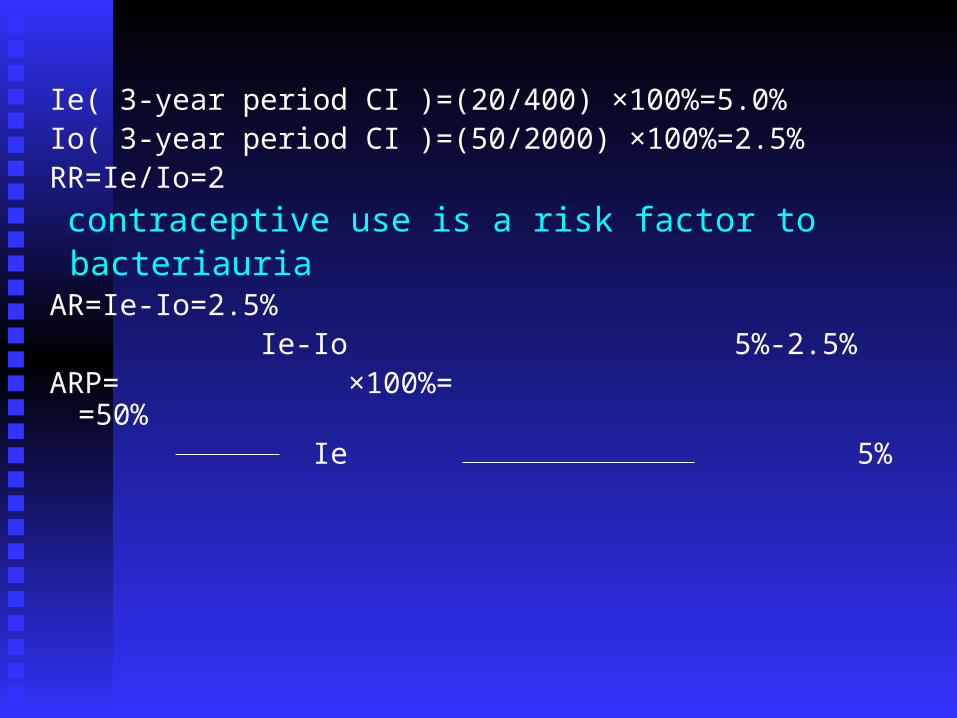
Ie( 3-year period CI )=(20/400) ×100%=5.0%Io( 3-year period CI )=(50/2000) ×100%=2.5%RR=Ie/Io=2 contraceptive use is a risk factor to bacteriauria AR=Ie-Io=2.5% Ie-Io 5%-2.5%ARP= ×100%= =50% Ie 5%
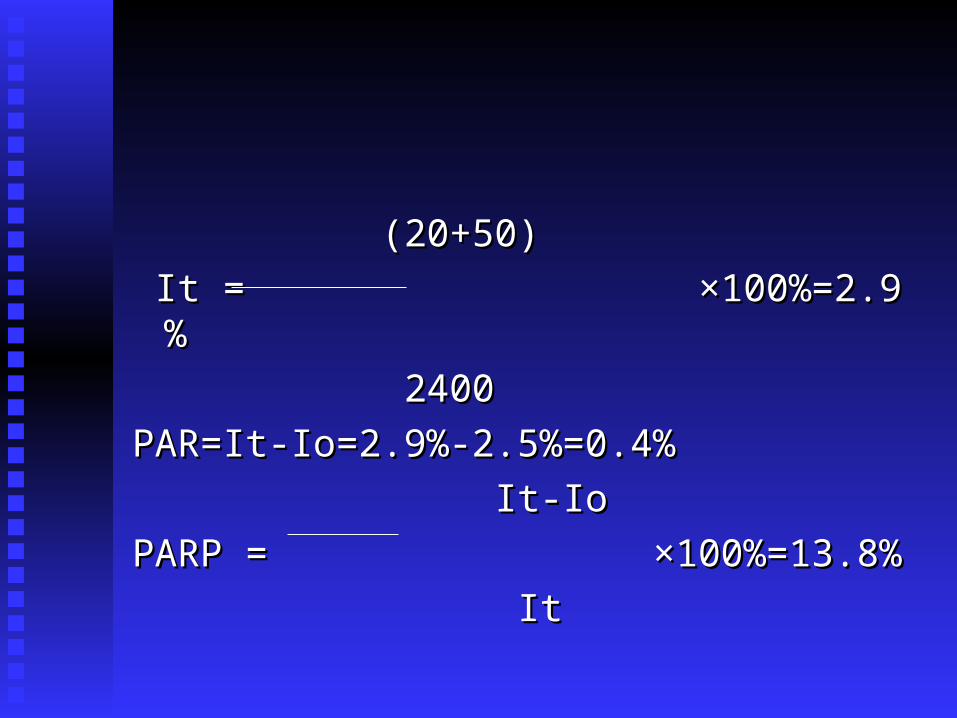
(20+50)(20+50)
It = ×100%=2.9 % It = ×100%=2.9 %
24002400
PAR=It-Io=2.9%-2.5%=0.4%PAR=It-Io=2.9%-2.5%=0.4%
It-IoIt-Io
PARP = ×100%=13.8%PARP = ×100%=13.8%
ItIt
Case-Control Study
Postulate of Case-Control Study
Types of Case-Control Study Design of Case-Control Study Analysis of Case-Control Study
Case Control Study: Subjects are selected on the basis of wheth
er they have a particular disease or not .The association between the exposure and the disease is evaluated by comparing the two groups with respect to the proportion having a history of an exposure of interest.
Postulate of Case-Control Study
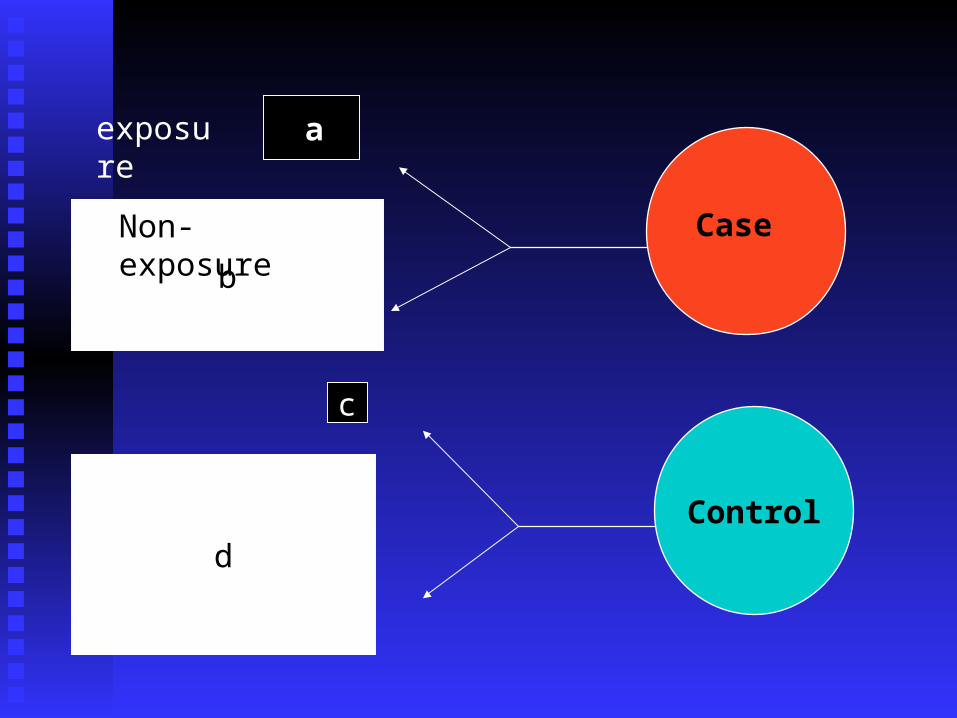
Case
Control
c
b
c
d
Case
aexposure
Non-exposure
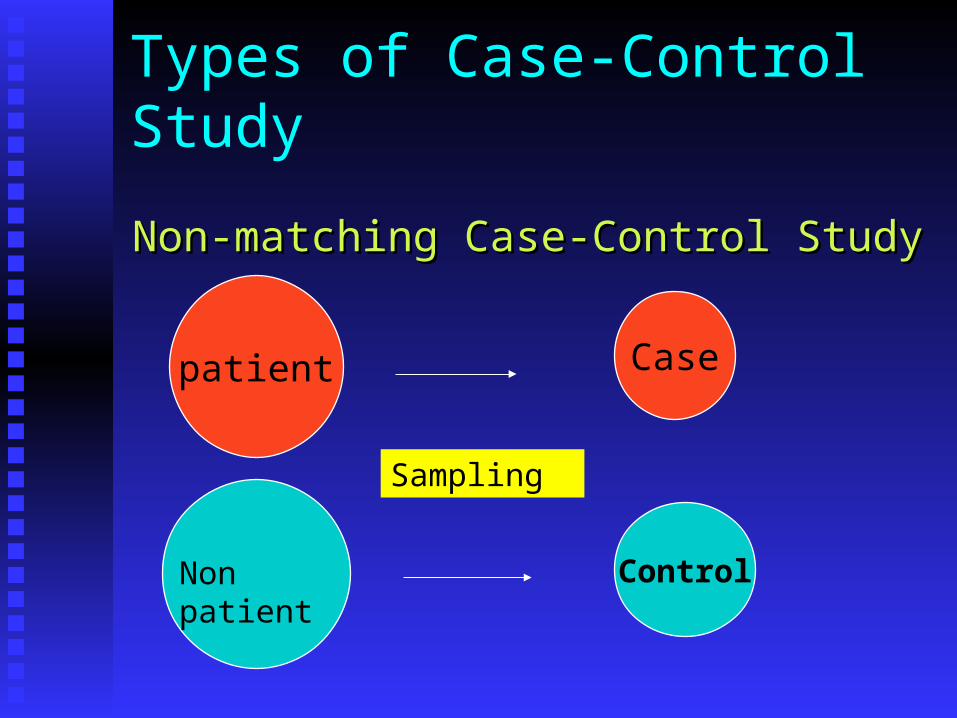
Types of Case-Control Study
Non-matching Case-Control StudyNon-matching Case-Control Study
patient
Control
Case
Sampling
Non patient
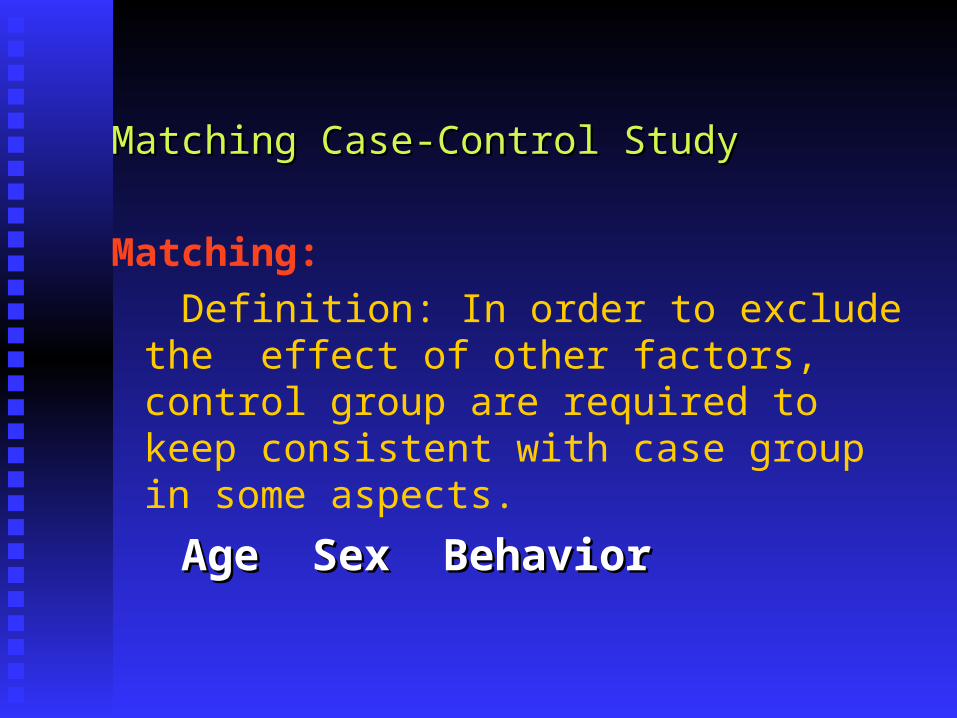
Matching Case-Control StudyMatching Case-Control Study
Matching: Definition: In order to exclude the
effect of other factors, control group are required to keep consistent with case group in some aspects.
Age Sex BehaviorAge Sex Behavior

Smoke -------Lung cancer
Smoking
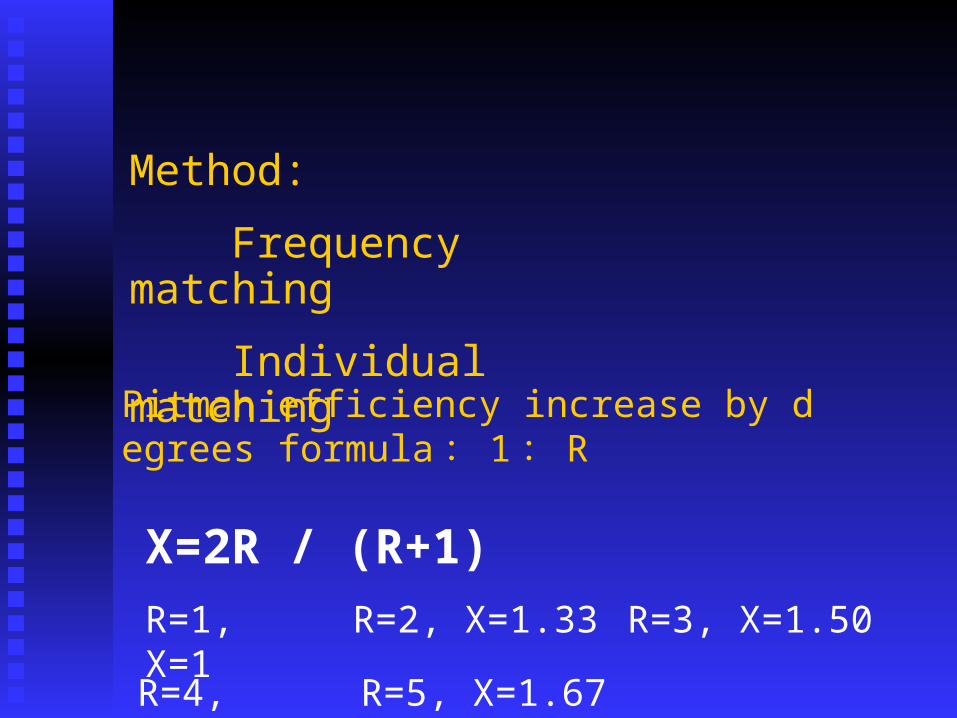
Pitman efficiency increase by degrees formula: 1 : R
X=2R / (R+1) R=1, X=1
R=2, X=1.33
R=4, X=1.6
R=5, X=1.67
Method:
Frequency matching
Individual matching
R=3, X=1.50
Over Matching
But if we let risk factors as matching factor, that is ,control group are required to keep consistent with case group in risk factors. We call it as over matching
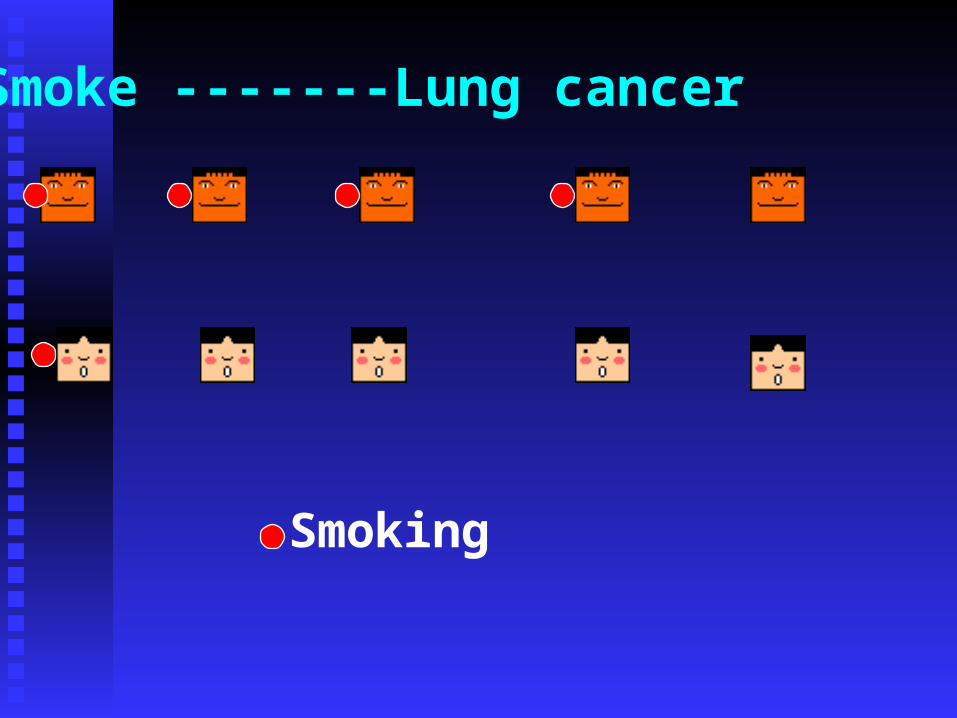
Smoke -------Lung cancer
Smoking
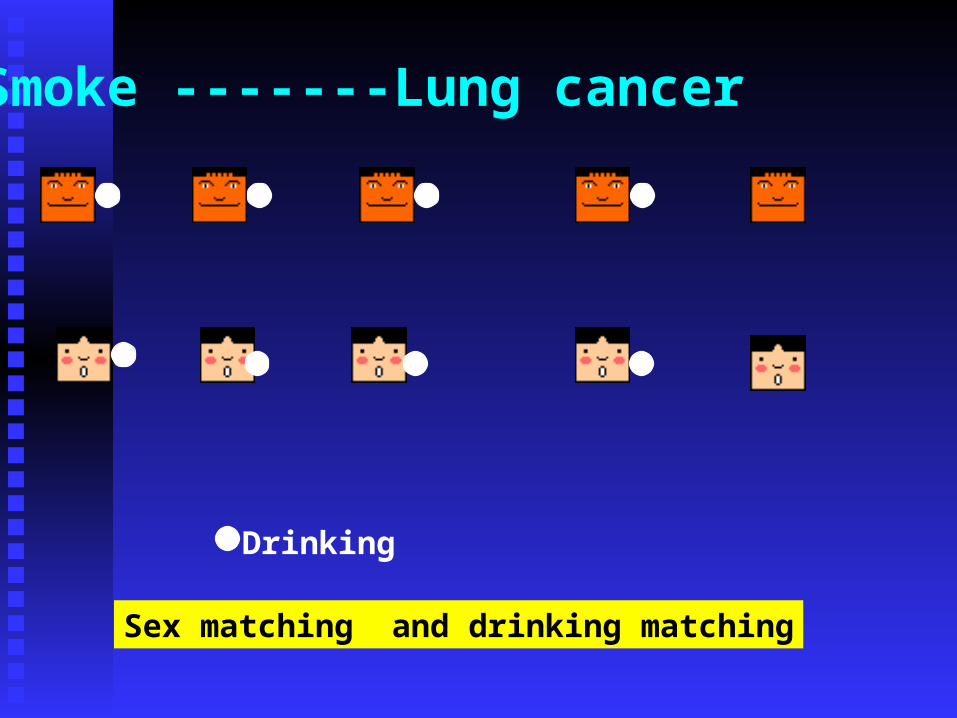
Smoke -------Lung cancer
Drinking
Sex matching and drinking matching
If the persons who If the persons who smoke are all drinkingsmoke are all drinking
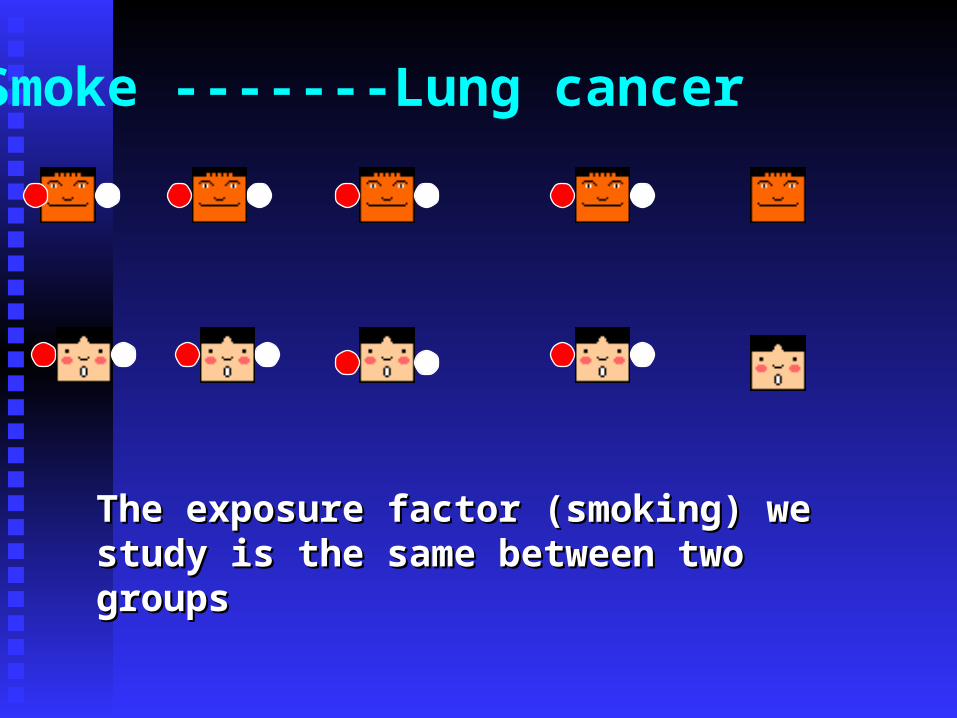
Smoke -------Lung cancer
The exposure factor (smoking) we The exposure factor (smoking) we study is the same between two study is the same between two groupsgroups
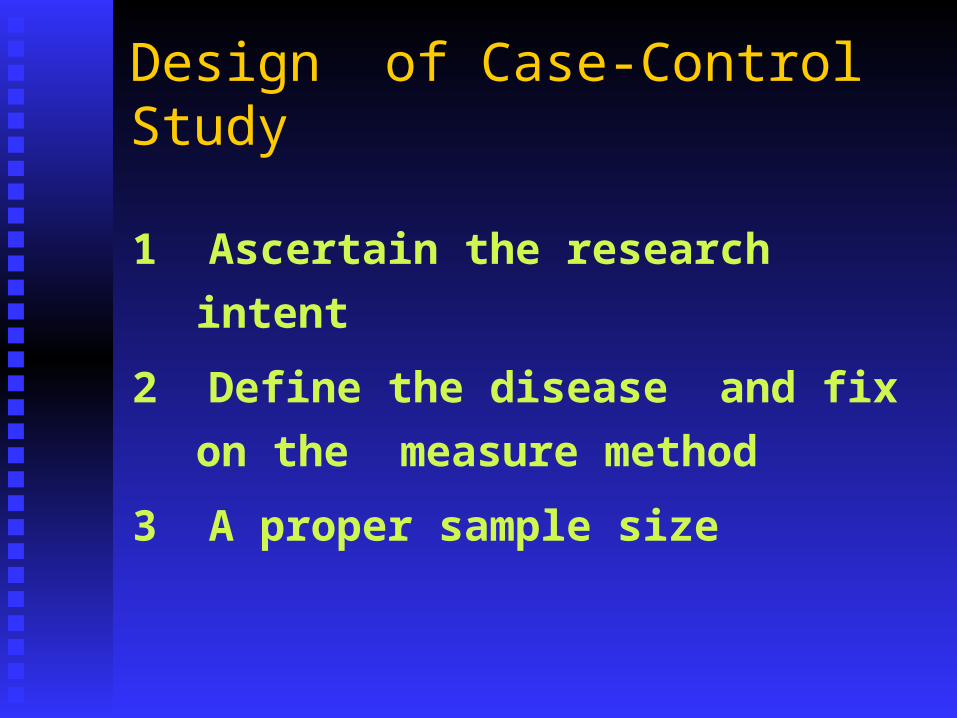
Design of Case-Control Study
1 Ascertain the research intent
2 Define the disease and fix on
the measure method
3 A proper sample size
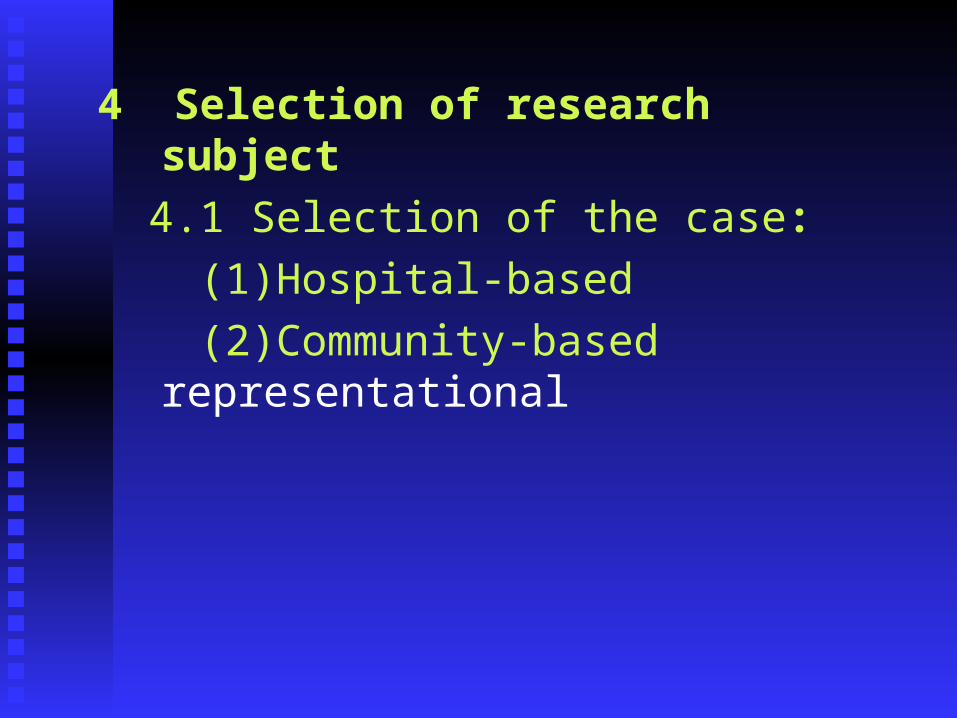
4 Selection of research subject 4.1 Selection of the case: (1)Hospital-based (2)Community-based
representational
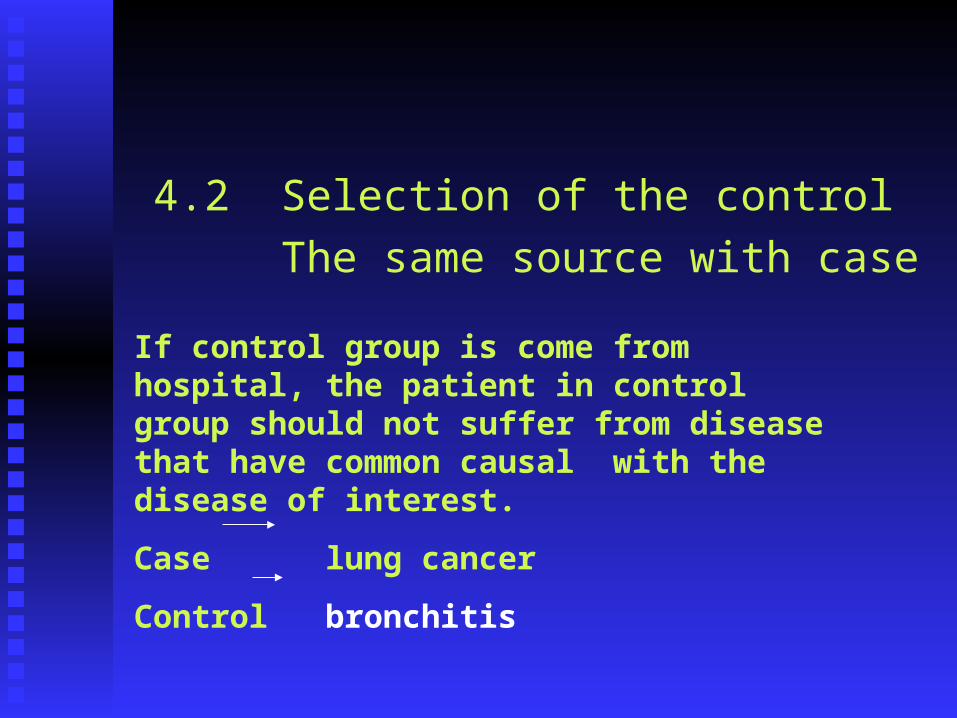
4.2 Selection of the control The same source with case
If control group is come from hospital, the patient in control group should not suffer from disease that have common causal with the disease of interest.
Case lung cancer
Control bronchitis

5 Institute questionnaire5 Institute questionnaire
(1)Selection of variable(1)Selection of variable The factors are relate to the disease The factors are relate to the disease
and perhaps are the causes of and perhaps are the causes of diseasedisease
(2)Definition of variable(2)Definition of variable
(3)Measurement of variable(3)Measurement of variable
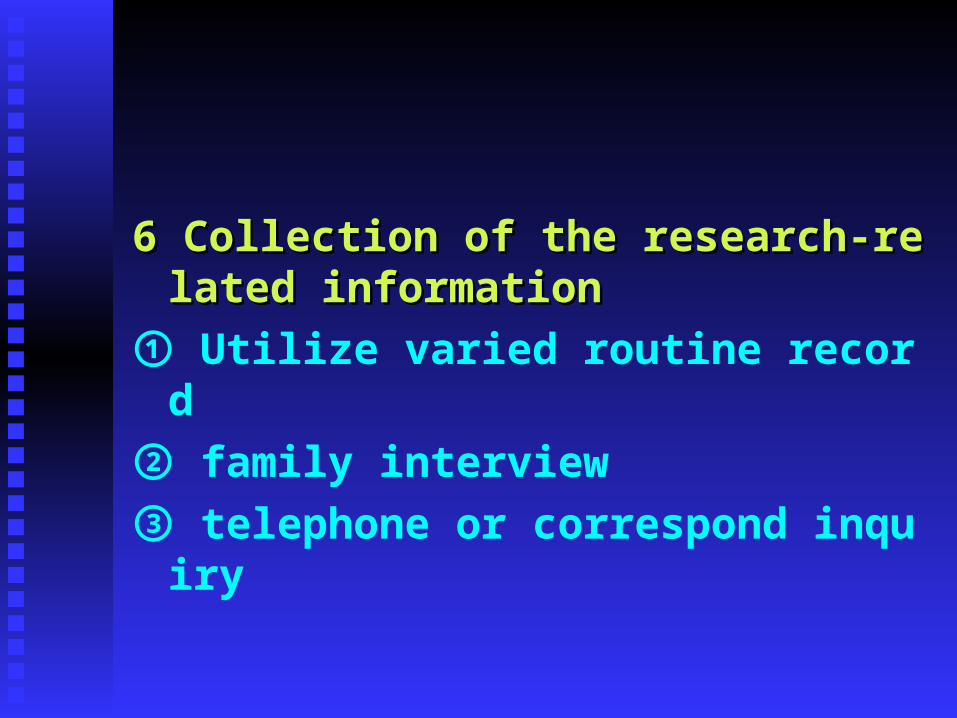
6 Collection of the research-related in6 Collection of the research-related informationformation ① Utilize varied routine record
② family interview
③ telephone or correspond inquiry
7 7 Clean-up ,enter & analyze data
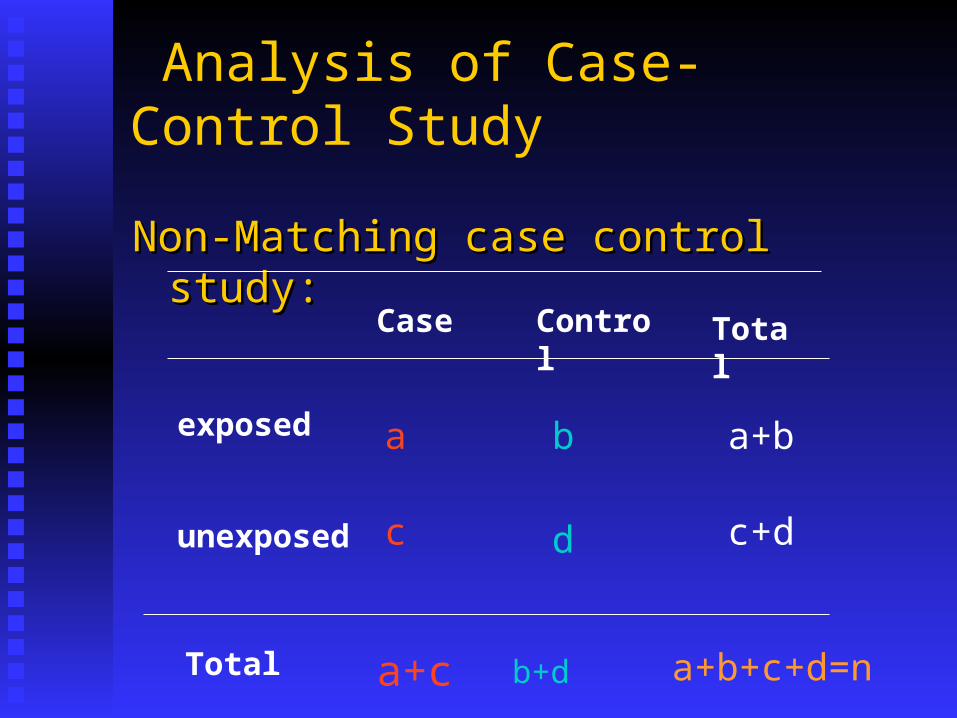
Analysis of Case-Control Study
Non-Matching case control study:Non-Matching case control study:
Case Control
Total
exposed
a b a+b
unexposed
c d c+d
Total a+c b+d a+b+c+d=n

1 Test whether difference of exposure proportion in 2 groups.
))()()((
)( 22
dcbadbca
nbcad
Statistics: p-value p<0.05 indicates the likelihood that a study’s findings are due to chance in data analysis
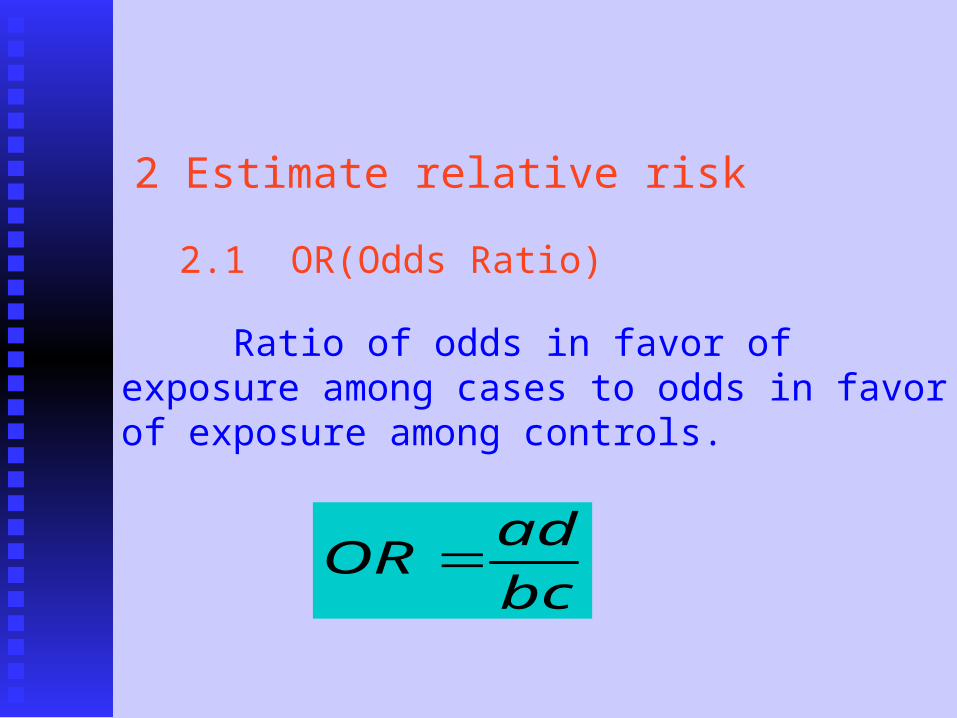
2 Estimate relative risk
bc
adOR
2.1 OR(Odds Ratio)
Ratio of odds in favor of exposure among cases to odds in favor of exposure among controls.
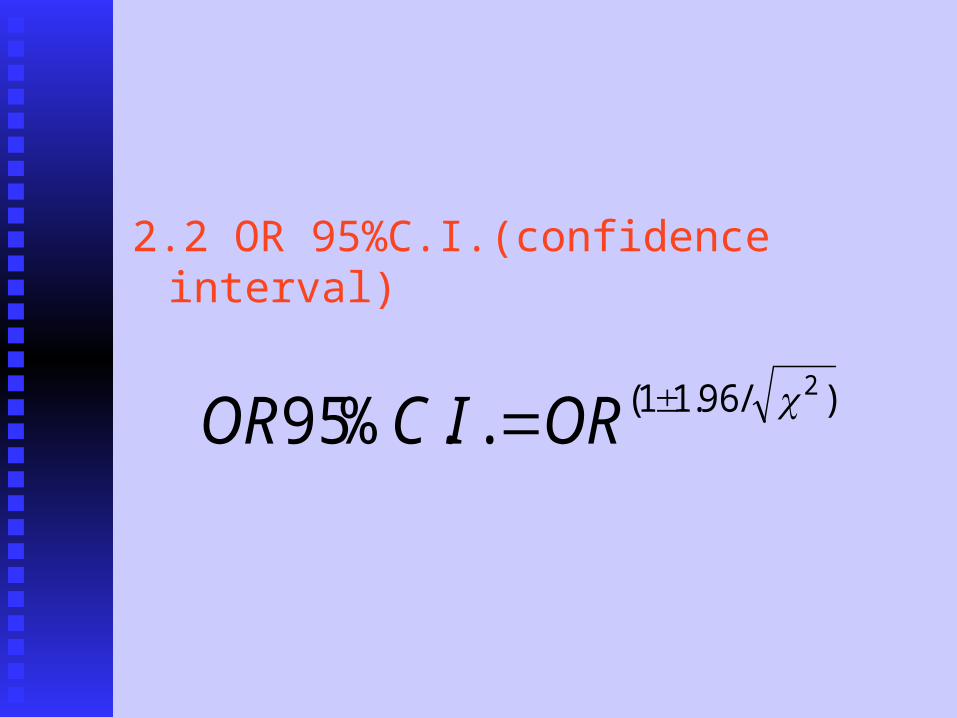
2.2 OR 95%C.I.(confidence interval)
)/96.11( 2
..%95 ORICOR
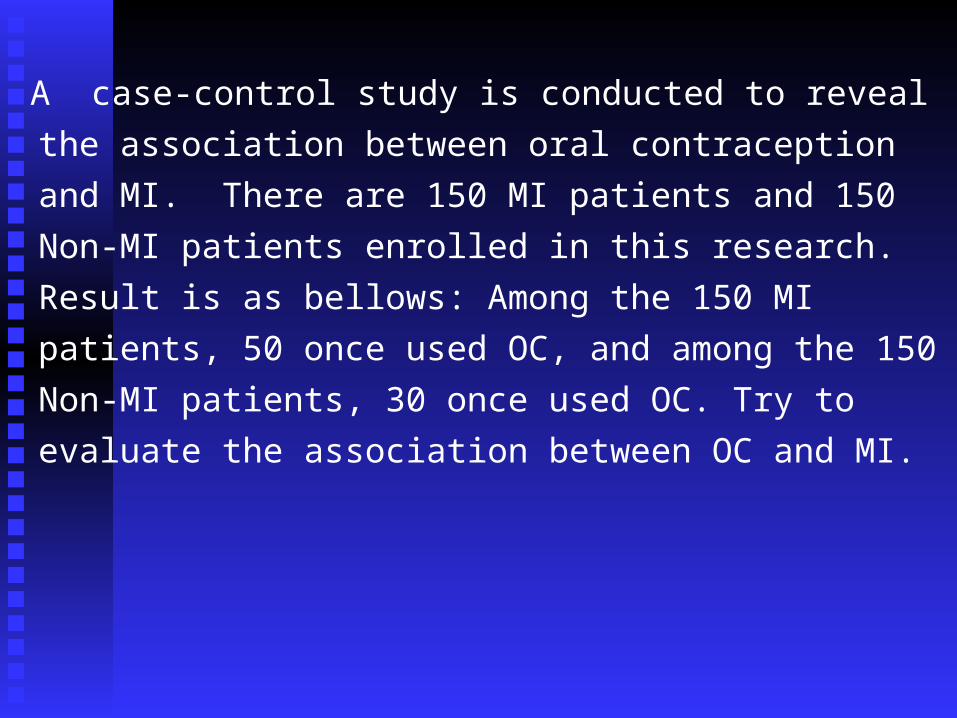
A case-control study is conducted to reveal the
association between oral contraception and MI.
There are 150 MI patients and 150 Non-MI
patients enrolled in this research. Result is as
bellows: Among the 150 MI patients, 50 once
used OC, and among the 150 Non-MI patients, 30
once used OC. Try to evaluate the association
between OC and MI.

MI Non-MI Total
Exposed to OC
50 30 80
Unexposed
To OC
100 120 220
Total 150 150 300
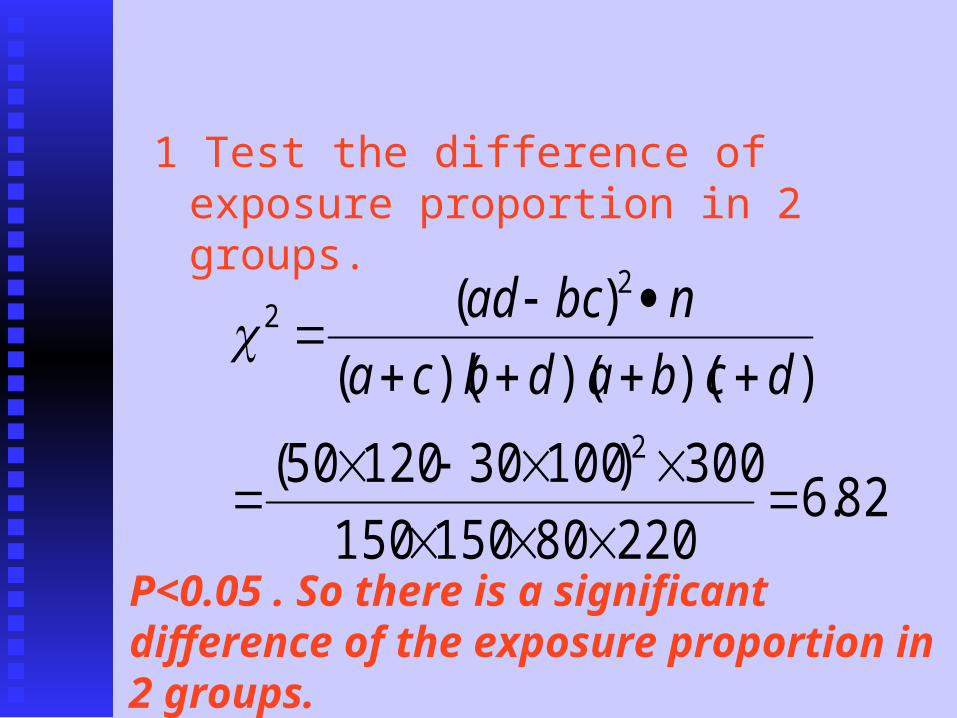
1 Test the difference of exposure proportion in 2 groups.
82.622080150150
300)1003012050(
))()()((
)(
2
22
dcbadbca
nbcad
P<0.05 . So there is a significant difference of the exposure proportion in 2 groups.
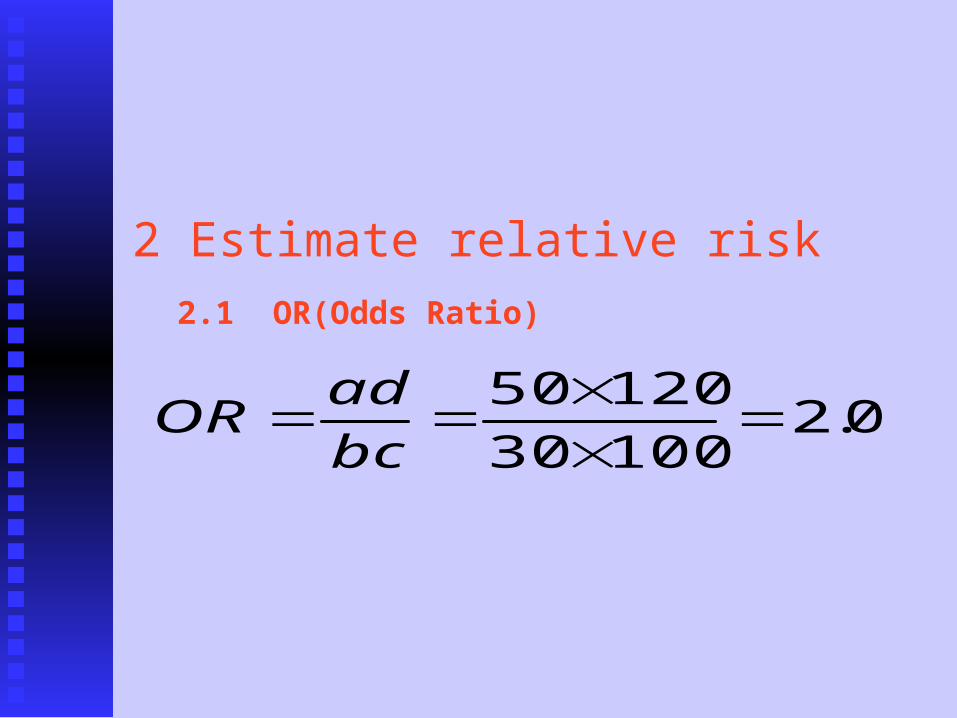
2 Estimate relative risk
0.210030
12050
bc
adOR
2.1 OR(Odds Ratio)
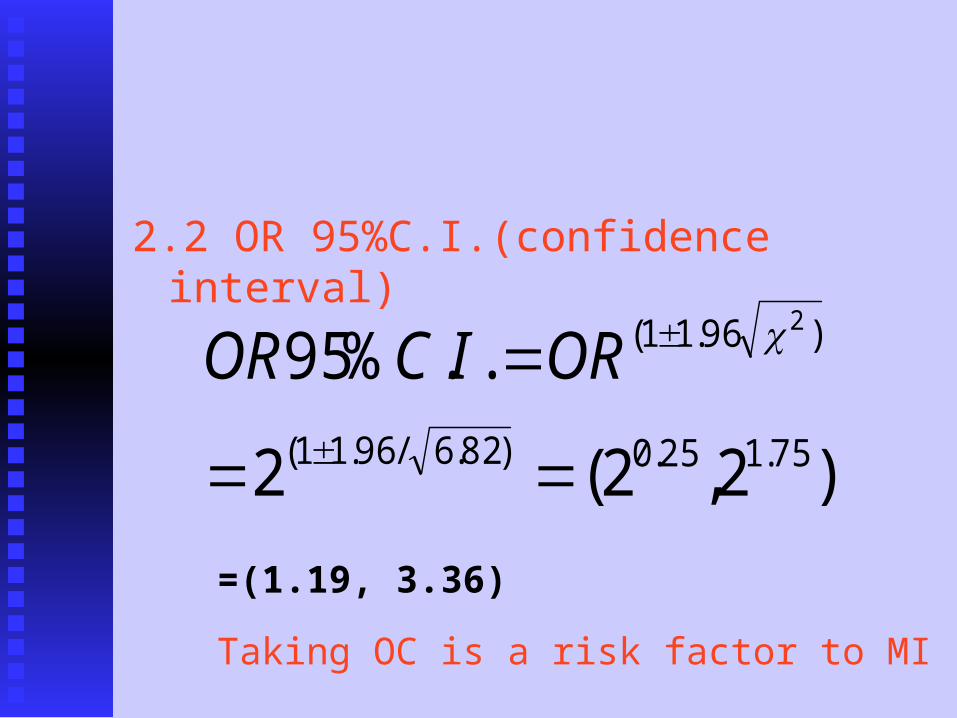
2.2 OR 95%C.I.(confidence interval)
)2,2(2
..%9575.125.0)82.6/96.11(
)96.11( 2
ORICOR
Taking OC is a risk factor to MI
=(1.19, 3.36)
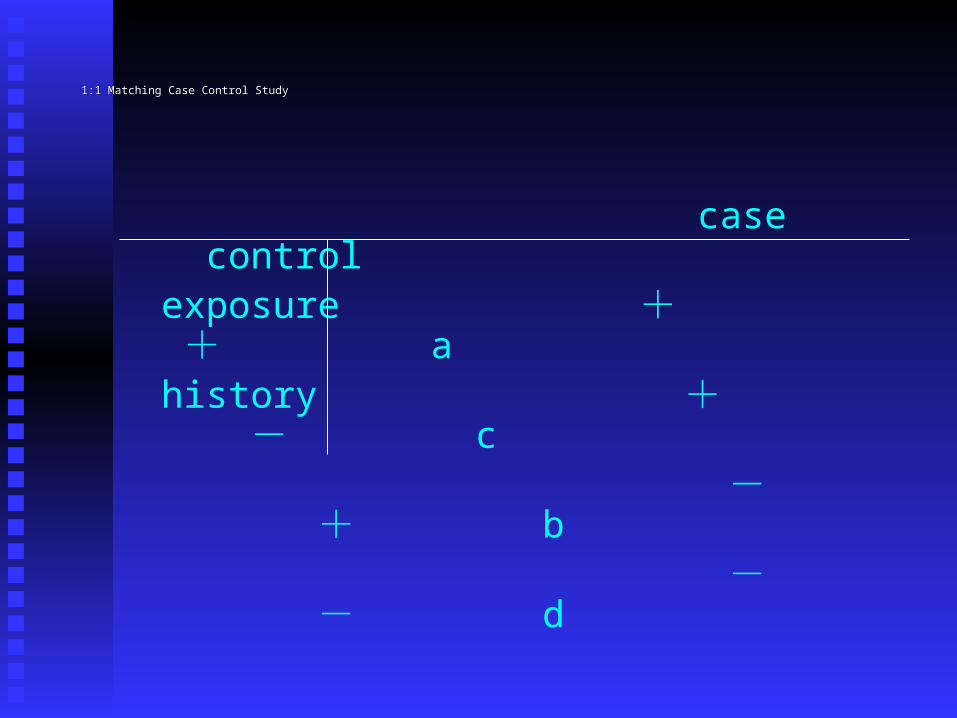
1:1 Matching Case Control Study1:1 Matching Case Control Study
case control exposure + + a history + - c - + b - - d
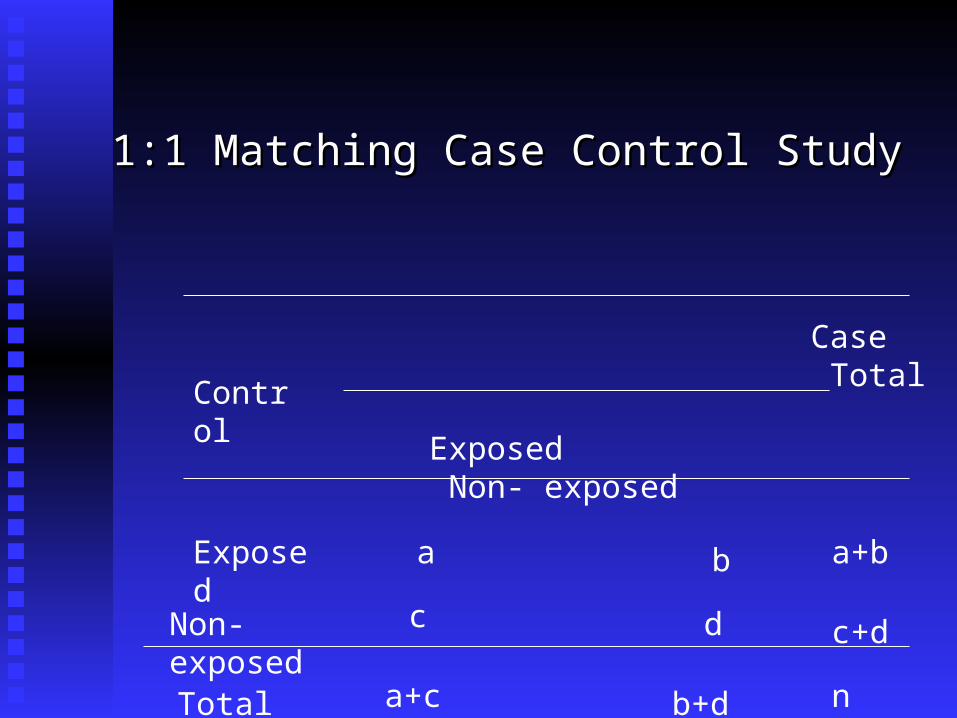
1:1 Matching Case Control Study1:1 Matching Case Control Study
Case Total
Exposed Non- exposed
Control
Exposed
Non-exposed
a
c
b
d
a+b
c+d
Total a+c b+d n

b
cOR
cb
cb
)(
)( 22
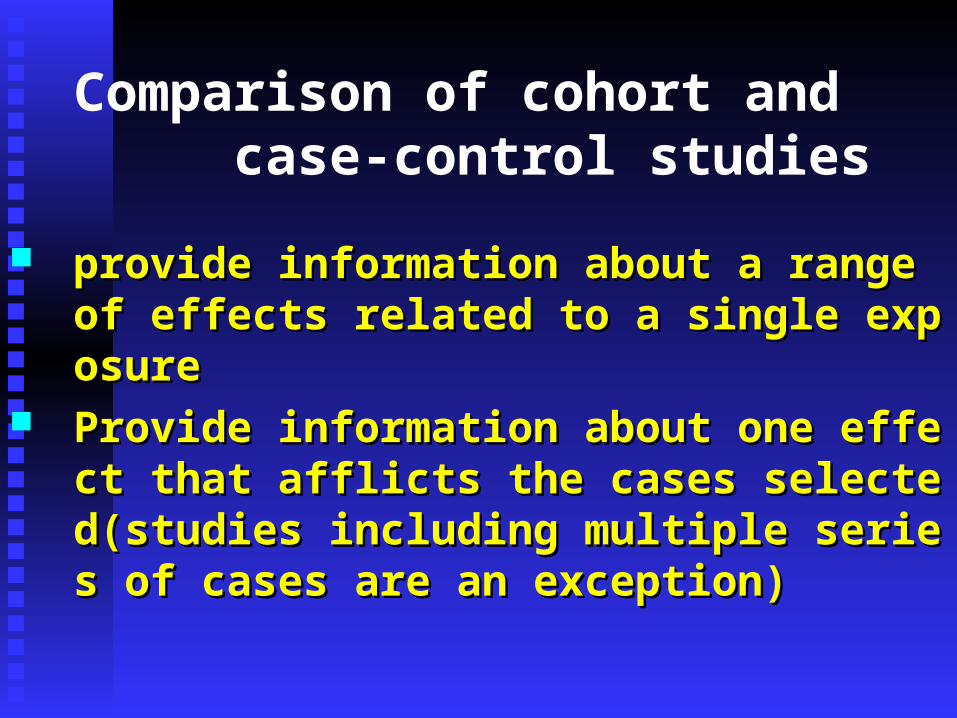
Comparison of cohort and case-control studies
provide information about a range of effeprovide information about a range of effects related to a single exposurects related to a single exposure
Provide information about one effect thaProvide information about one effect that afflicts the cases selected(studies includt afflicts the cases selected(studies including multiple series of cases are an exceptiing multiple series of cases are an exception)on)
Comparison of cohort and case-control studies
Typically follow-up studies focus on Typically follow-up studies focus on one exposureone exposure
Provide information about a wide raProvide information about a wide range of potentially relevant exposuresnge of potentially relevant exposures
Comparison of cohort and case-control studies
Evaluation of effects on rare Evaluation of effects on rare disease is problematic in disease is problematic in follow-up studies.follow-up studies.
Evaluation of effects on rare Evaluation of effects on rare disease are well suited to case-disease are well suited to case-control studies.control studies.
Comparison of cohort and case-control studies
Concern is in the follow-upConcern is in the follow-up Concern is in the determination Concern is in the determination
of a correct exposure of a correct exposure classificationclassification
Comparison of cohort and case-control studies
Exposure status is determined Exposure status is determined before the presence of disease. before the presence of disease. No possibility for the disease No possibility for the disease outcome to influence exposure outcome to influence exposure classificationclassification
Exposure information comes from Exposure information comes from the subject (or proxies) after the subject (or proxies) after disease onset. Knowledge of disease onset. Knowledge of disease could affect exposure disease could affect exposure data. Greater possibility of biasdata. Greater possibility of bias
Comparison of cohort and case-control studies
Large, expensive, take timeLarge, expensive, take time Smaller, less expensive, quickSmaller, less expensive, quick
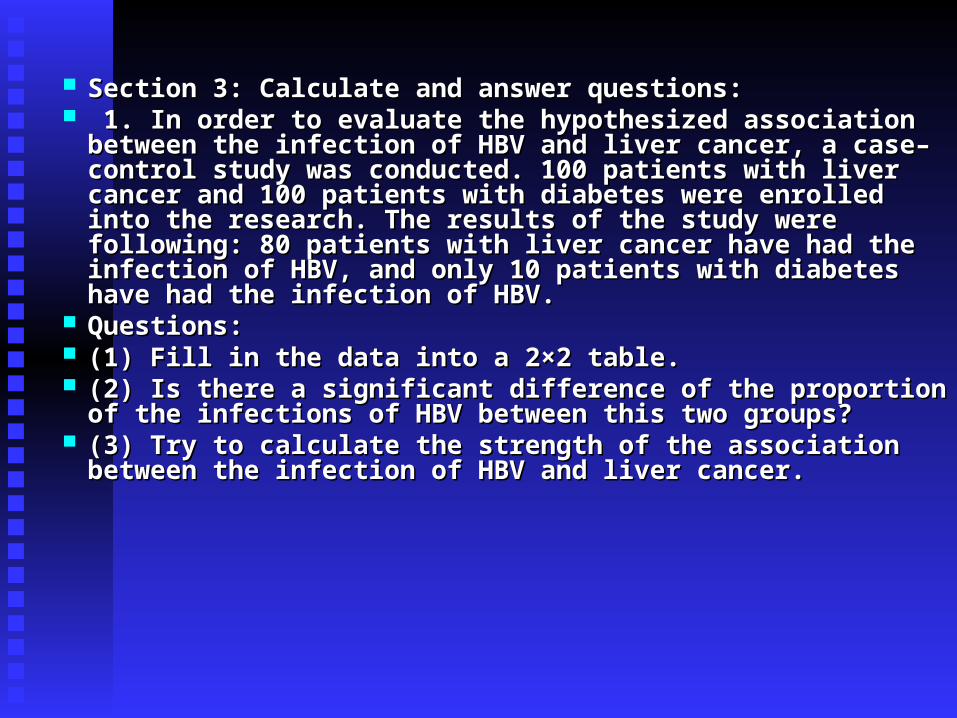
Section 3: Calculate and answer questions:Section 3: Calculate and answer questions: 1. In order to evaluate the hypothesized association between the 1. In order to evaluate the hypothesized association between the
infection of HBV and liver cancer, a case–control study was infection of HBV and liver cancer, a case–control study was conducted. 100 patients with liver cancer and 100 patients with conducted. 100 patients with liver cancer and 100 patients with diabetes were enrolled into the research. The results of the study diabetes were enrolled into the research. The results of the study were following: 80 patients with liver cancer have had the infection were following: 80 patients with liver cancer have had the infection of HBV, and only 10 patients with diabetes have had the infection of of HBV, and only 10 patients with diabetes have had the infection of HBV. HBV.
Questions:Questions: (1) Fill in the data into a 2×2 table.(1) Fill in the data into a 2×2 table. (2) Is there a significant difference of the proportion of the (2) Is there a significant difference of the proportion of the
infections of HBV between this two groups?infections of HBV between this two groups? (3) Try to calculate the strength of the association between the (3) Try to calculate the strength of the association between the
infection of HBV and liver cancer.infection of HBV and liver cancer.
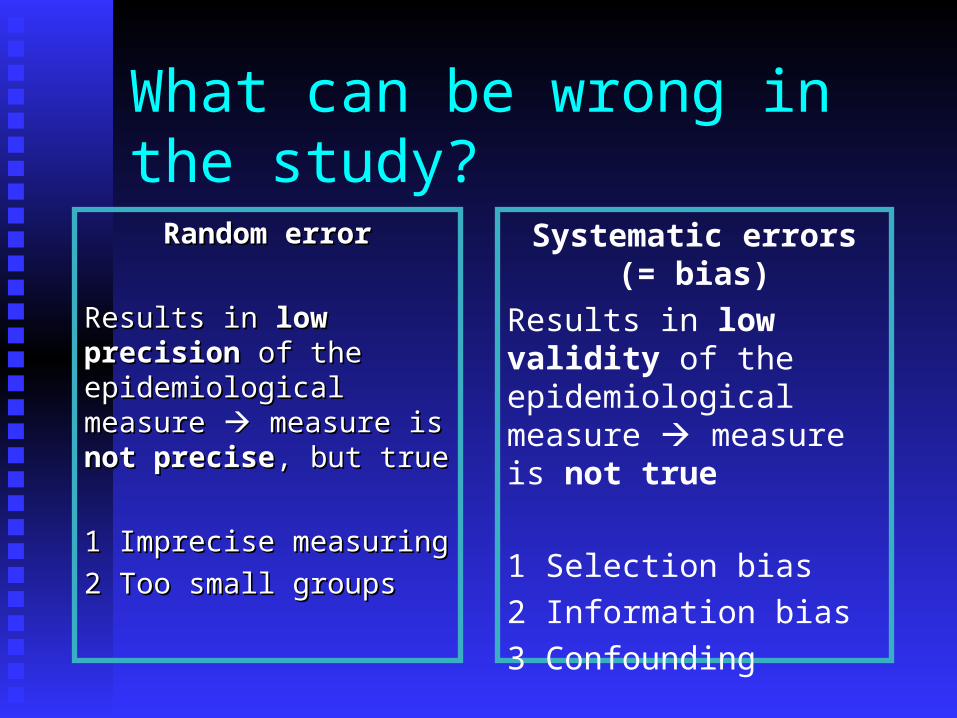
What can be wrong in the study?
Random errorRandom error
Results in Results in low precision low precision of the epidemiological of the epidemiological measure measure measure is measure is not precisenot precise, but true, but true
1 Imprecise measuring1 Imprecise measuring
2 Too small groups2 Too small groups
Systematic errors(= bias)
Results in low validity of the epidemiological measure measure is not true
1 Selection bias
2 Information bias
3 Confounding
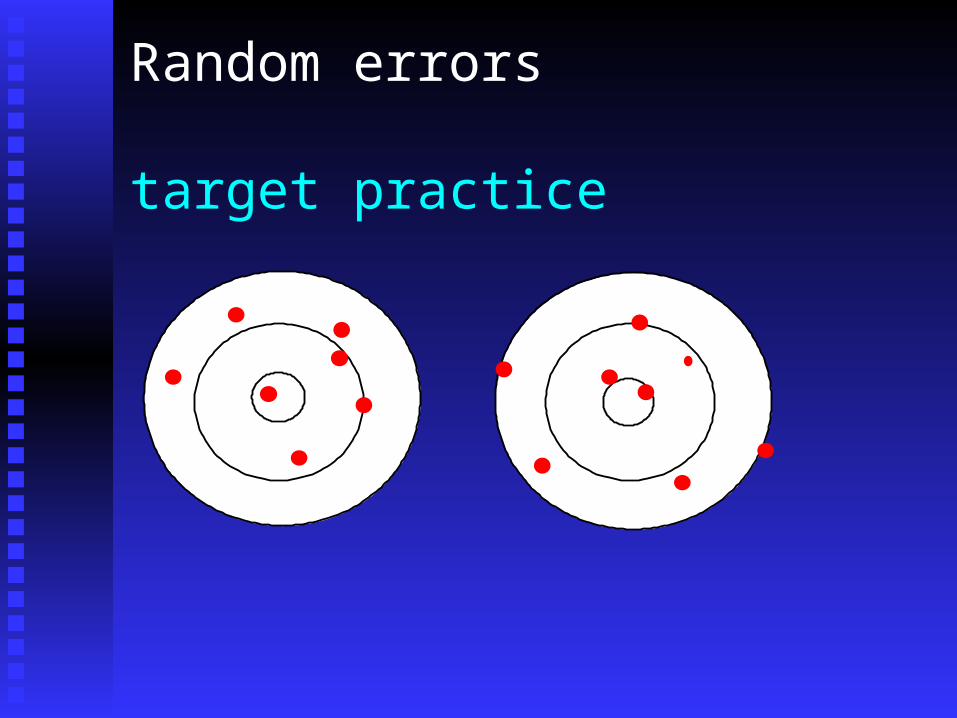
Random errors
target practice
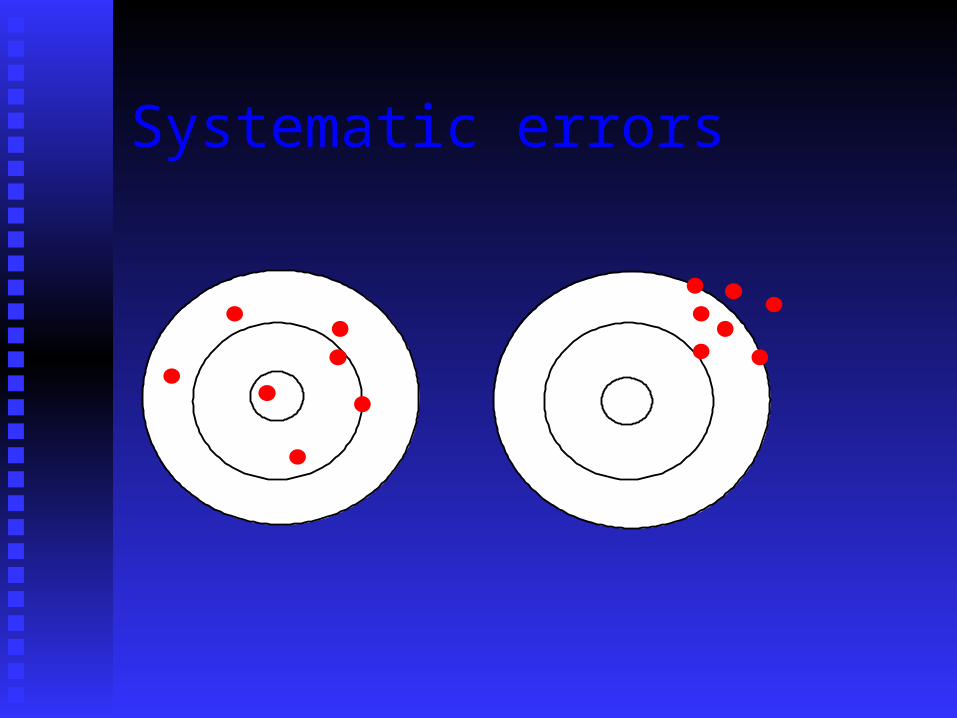
Systematic errors
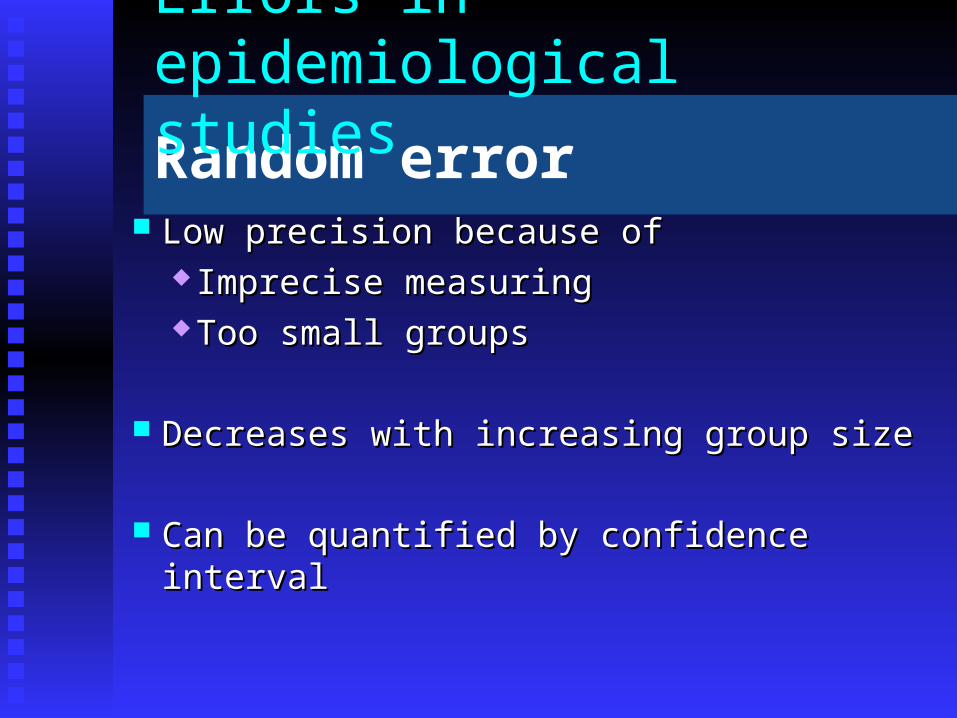
Random error Low precision because ofLow precision because of
Imprecise measuringImprecise measuring Too small groupsToo small groups
Decreases with increasing group sizeDecreases with increasing group size
Can be quantified by confidence intervalCan be quantified by confidence interval
Errors in epidemiological studies
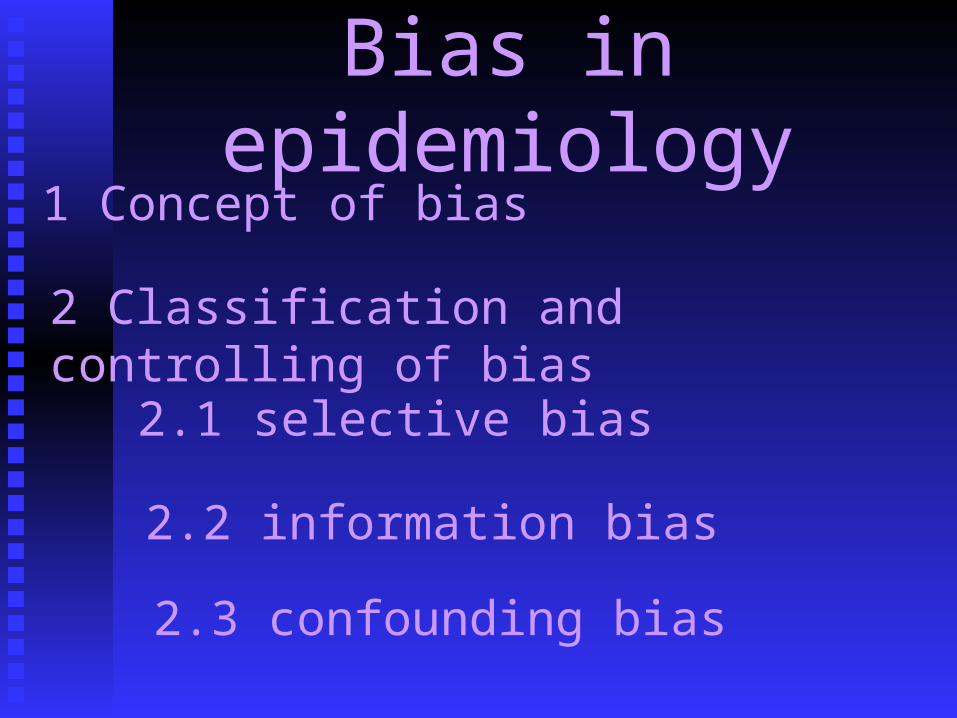
Bias in epidemiology1 Concept of bias
2 Classification and controlling of bias
2.1 selective bias
2.2 information bias
2.3 confounding bias
Overestimate?
Underestimate?
Random error :
Definition
Deviation of results and inferences
from the truth, occurring only as a
result of the operation of chance.
Definition: Systematic, non-random deviation of results and inferences from the truth.
Bias:
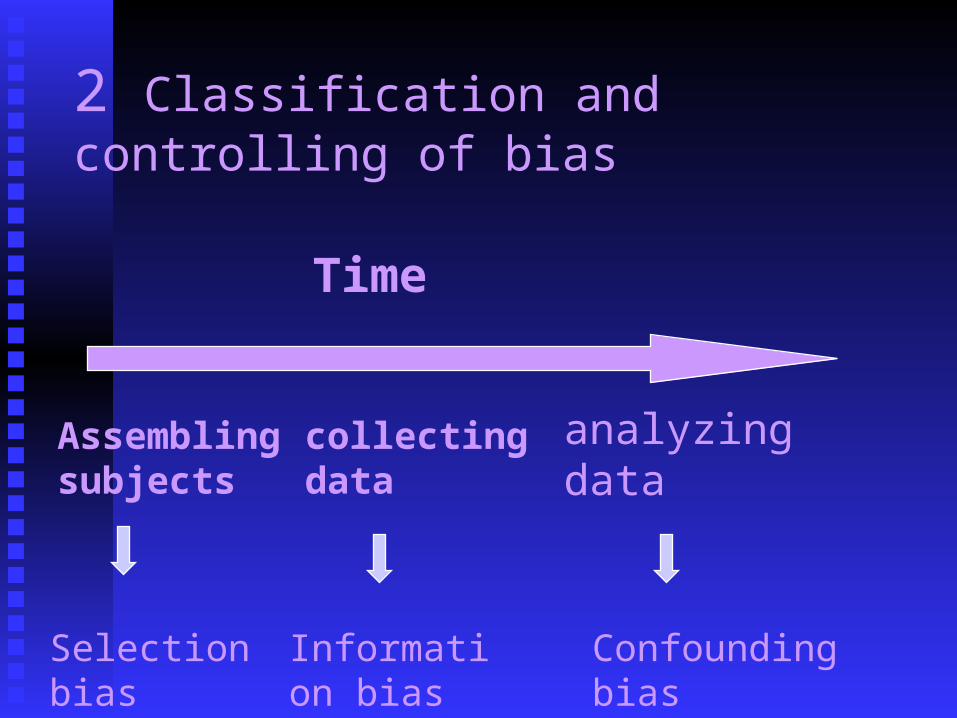
2 Classification and controlling of bias
Assembling subjects
collecting data
analyzing data
Selection bias
Information bias
Confounding bias
Time
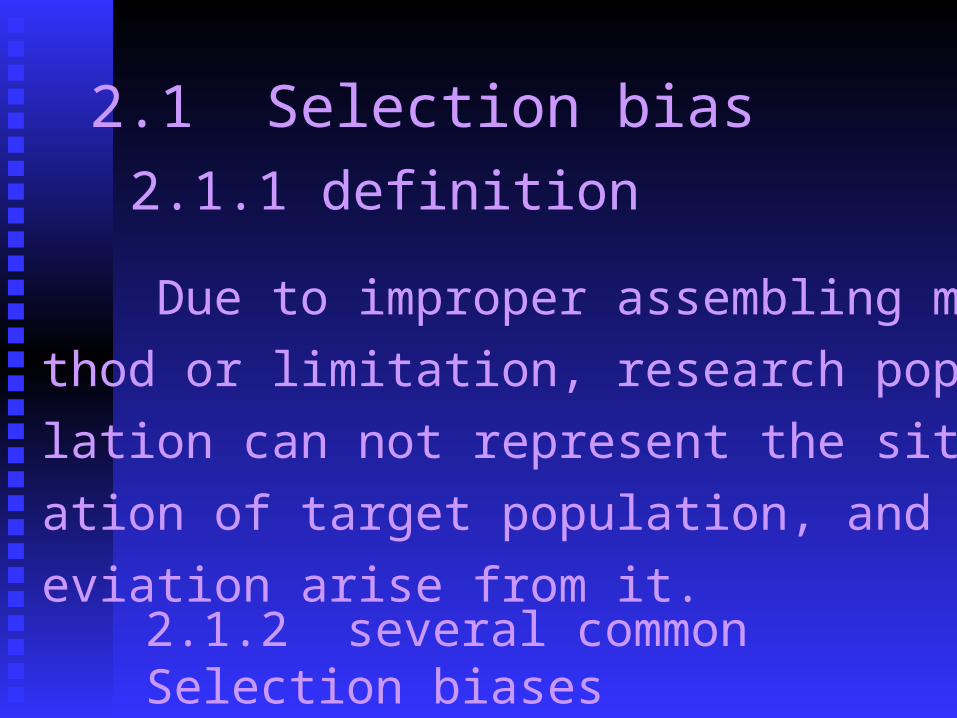
2.1 Selection bias2.1.1 definition
Due to improper assembling method or limitation, research population can not represent the situation of target population, and deviation arise from it.
2.1.2 several common Selection biases
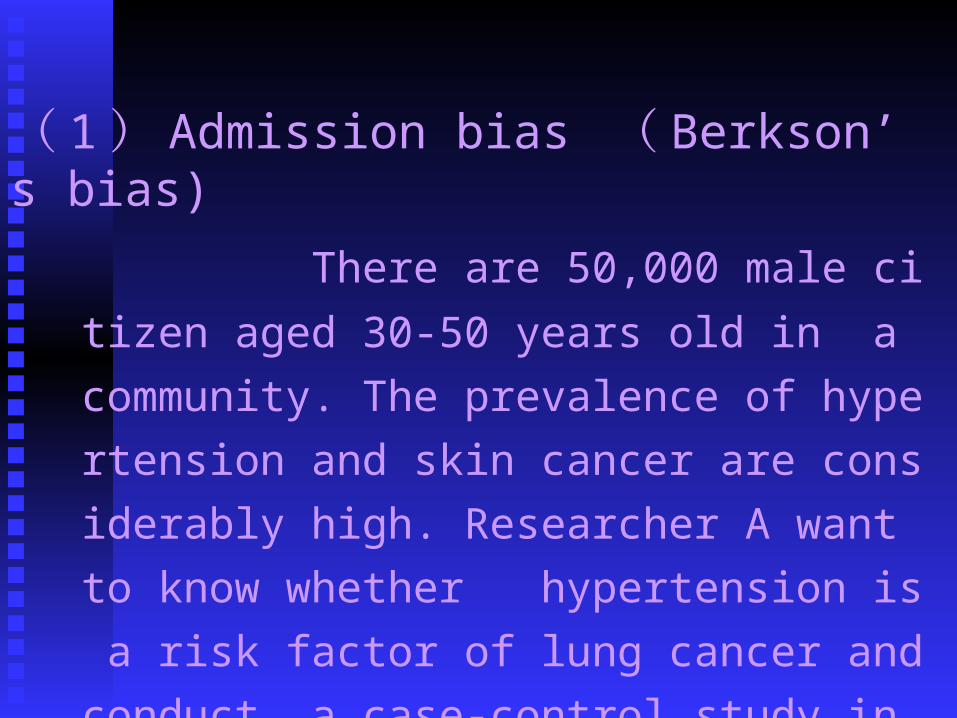
( 1 ) Admission bias ( Berkson’s bias)
There are 50,000 male citizen aged 30-50 years old in a community. The prevalence of hypertension and skin cancer are considerably high. Researcher A want to know whether hypertension is a risk factor of lung cancer and conduct a case-control study in the community .
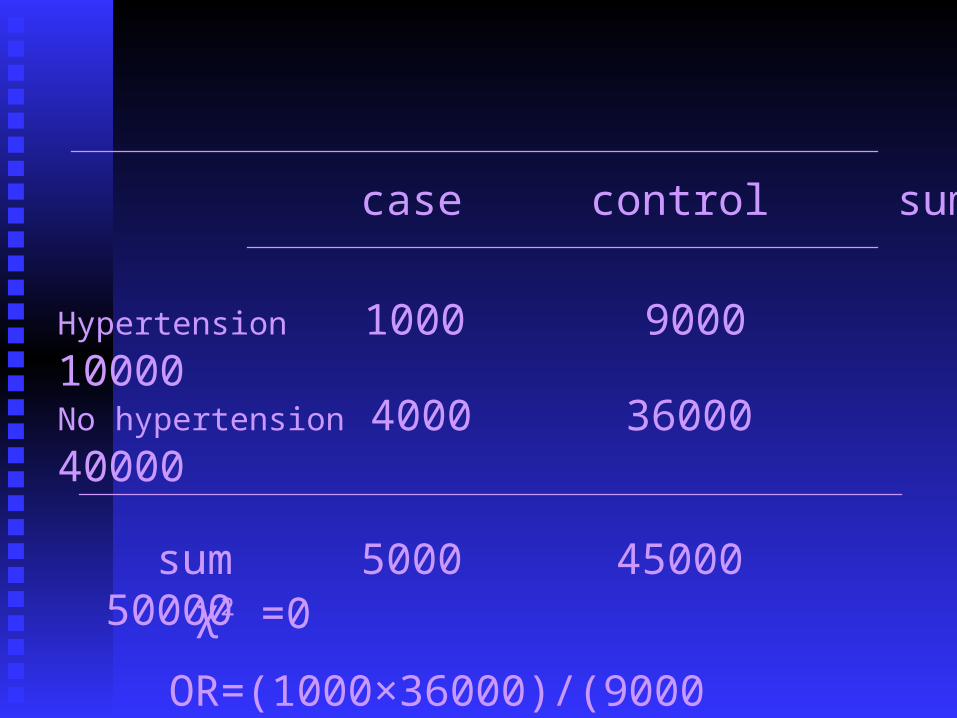
case control sum
Hypertension 1000 9000 10000
No hypertension 4000 36000 40000
sum 5000 45000 50000 χ2 =0
OR=(1000×36000)/(9000 ×4000)=1

No association between hypertension and chronic gastritis
Researcher B conduct another case-control study in hospital of the community.(chronic gastritis patients as control) .
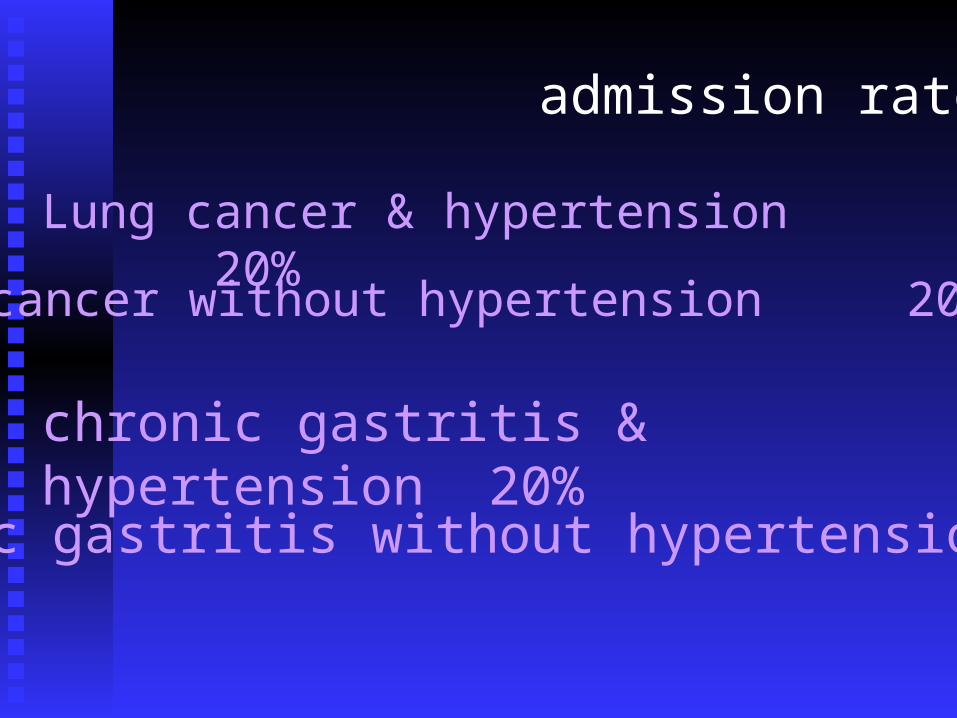
admission rate
Lung cancer & hypertension 20%
Lung cancer without hypertension 20%
chronic gastritis & hypertension 20%
chronic gastritis without hypertension 20%
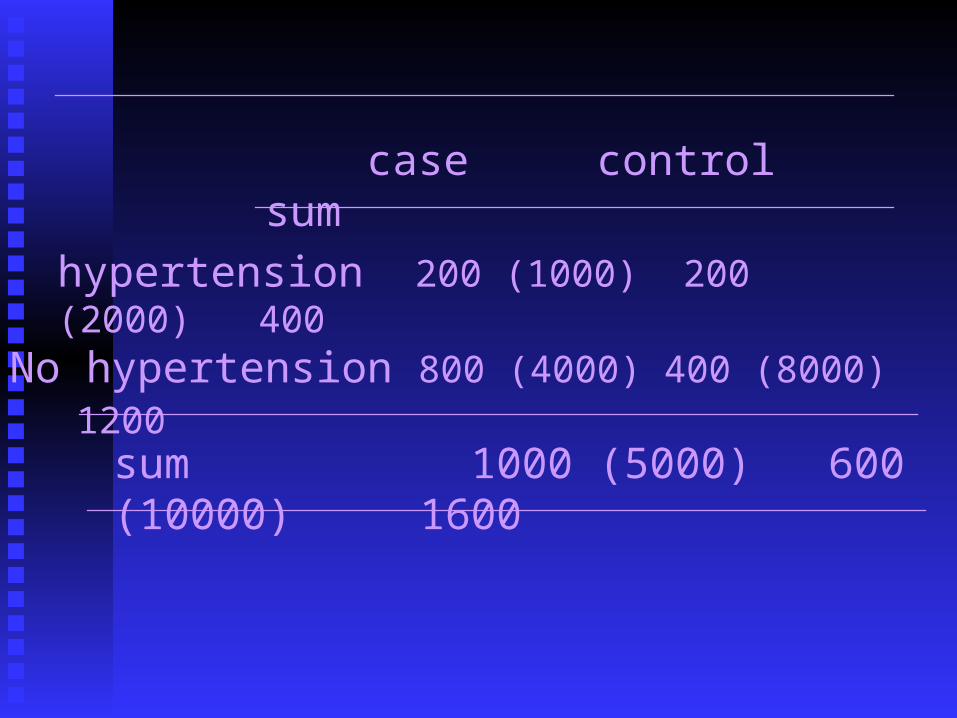
case control sum
hypertension 200 (1000) 200 (2000) 400
No hypertension 800 (4000) 400 (8000) 1200
sum 1000 (5000) 600 (10000) 1600
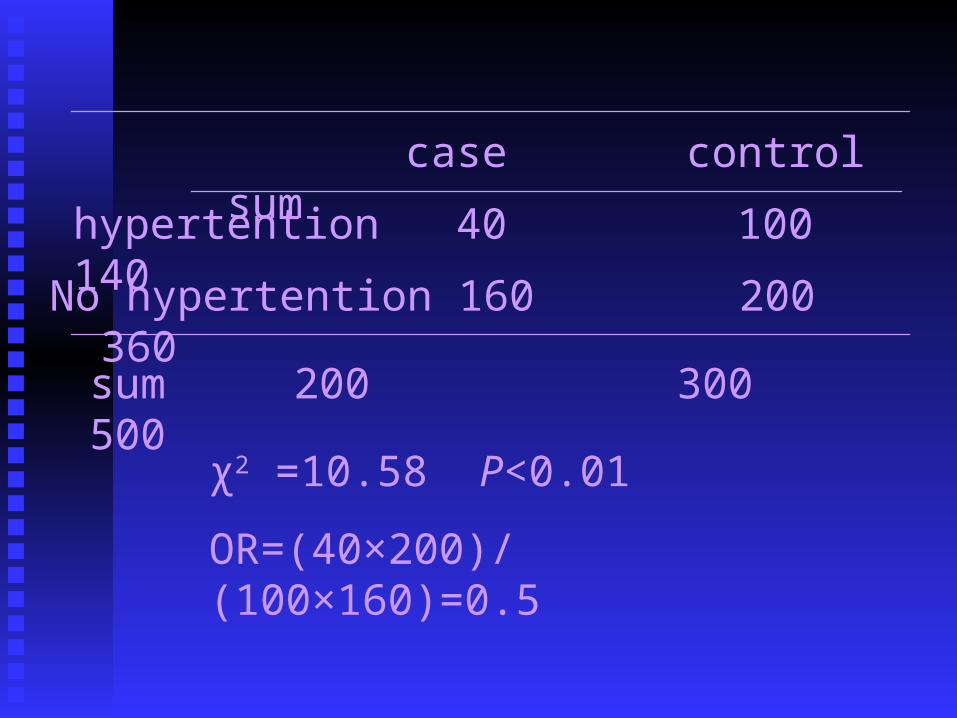
case control sum hypertention 40 100 140
No hypertention 160 200 360
sum 200 300 500
χ2 =10.58 P<0.01
OR=(40×200)/(100×160)=0.5
2.2 Information Biasrecalling bias
2 ) report bias
3 ) diagnostic/exposure suspicion bias
Measurement bias
2.3 Confounding bias
Definition:
The apparent effect of the exposure of interest is distorted because the effect of an extraneous factor is mistaken for or mixed with the actual exposure effect.
Properties of a Confounder:
• A confounding factor must be a risk factor for the disease.
• The confounding factor must be associated with the exposure under study in the source population.
• A confounding factor must not be affected by the exposure or the disease.
The confounder cannot be an intermediate step in the causal path between the exposure and the disease.
2.3.2 Control of confounding bias
1 ) restriction
2) randomization
3) matching
1 In designing phase
2 In analysis phase
1) Stratified analysis (Mantal-Hazenszel’s method)2) Standardized
3) logistic analysis