Embed Size (px)
Citation preview
CASE FINANCIAL RATIO ANALYSIS – COMMUNICATIONS INDUSTRY (2012-2016) July 21, 2017
Alberto Calva Acus Consulting 1 of 12 www.AcusConsulting.com Neither Acus Consulting nor Alberto Calva are responsible for any decisions made based on the information or comments here presented, neither for the
accuracy of the figures or information.
CASE OF FINANCIAL RATIO ANALYSIS:
COMMUNICATIONS INDUSTRY IN CANADA (2012-2016) (BCE BELL - COGECO – ROGERS – SHAW – TELUS)
Alberto Calva // Acus Consulting Ltd [email protected] // Twitter: @acalva
July 21, 2017
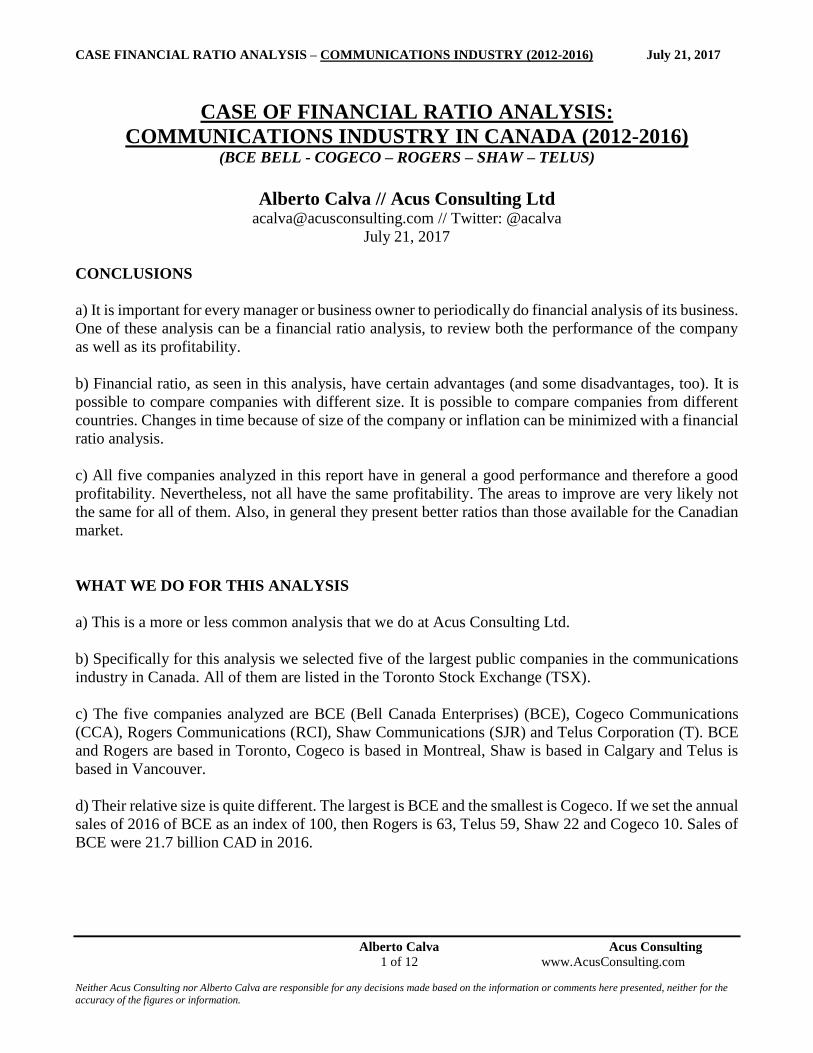
CONCLUSIONS
a) It is important for every manager or business owner to periodically do financial analysis of its business.
One of these analysis can be a financial ratio analysis, to review both the performance of the company
as well as its profitability.
b) Financial ratio, as seen in this analysis, have certain advantages (and some disadvantages, too). It is
possible to compare companies with different size. It is possible to compare companies from different
countries. Changes in time because of size of the company or inflation can be minimized with a financial
ratio analysis.
c) All five companies analyzed in this report have in general a good performance and therefore a good
profitability. Nevertheless, not all have the same profitability. The areas to improve are very likely not
the same for all of them. Also, in general they present better ratios than those available for the Canadian
market.
WHAT WE DO FOR THIS ANALYSIS
a) This is a more or less common analysis that we do at Acus Consulting Ltd.
b) Specifically for this analysis we selected five of the largest public companies in the communications
industry in Canada. All of them are listed in the Toronto Stock Exchange (TSX).
c) The five companies analyzed are BCE (Bell Canada Enterprises) (BCE), Cogeco Communications
(CCA), Rogers Communications (RCI), Shaw Communications (SJR) and Telus Corporation (T). BCE
and Rogers are based in Toronto, Cogeco is based in Montreal, Shaw is based in Calgary and Telus is
based in Vancouver.
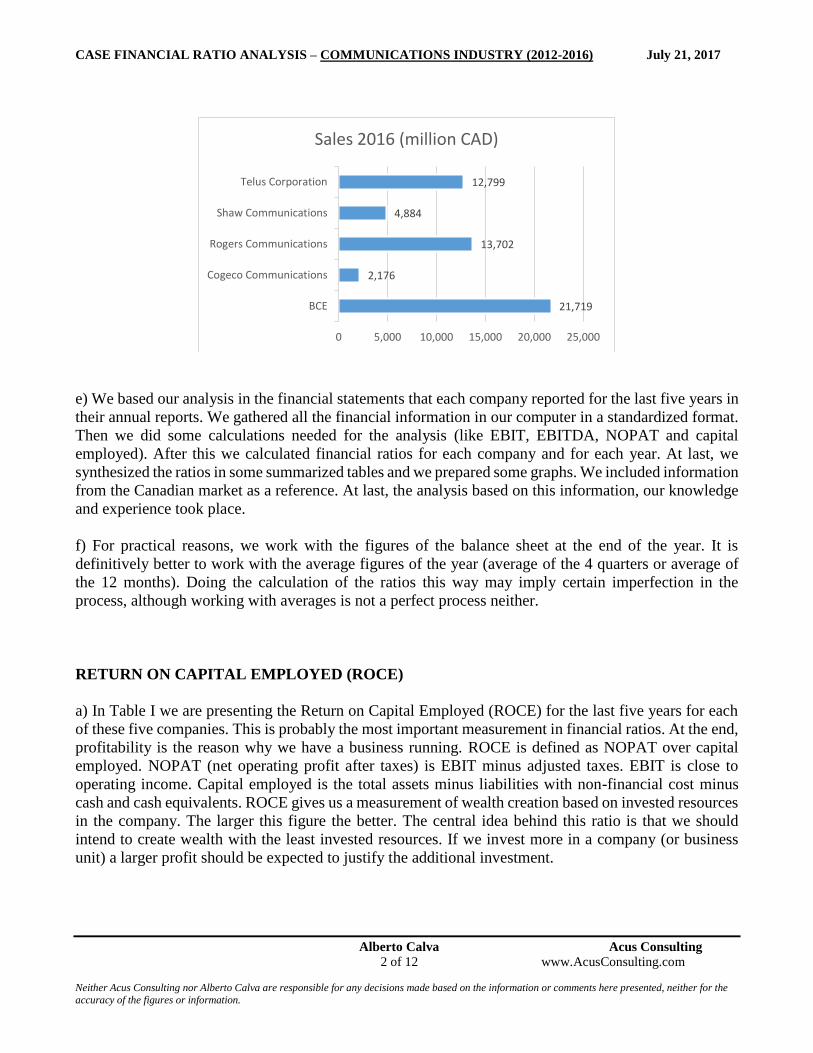
d) Their relative size is quite different. The largest is BCE and the smallest is Cogeco. If we set the annual
sales of 2016 of BCE as an index of 100, then Rogers is 63, Telus 59, Shaw 22 and Cogeco 10. Sales of
BCE were 21.7 billion CAD in 2016.
CASE FINANCIAL RATIO ANALYSIS – COMMUNICATIONS INDUSTRY (2012-2016) July 21, 2017
Alberto Calva Acus Consulting 2 of 12 www.AcusConsulting.com Neither Acus Consulting nor Alberto Calva are responsible for any decisions made based on the information or comments here presented, neither for the
accuracy of the figures or information.
e) We based our analysis in the financial statements that each company reported for the last five years in
their annual reports. We gathered all the financial information in our computer in a standardized format.
Then we did some calculations needed for the analysis (like EBIT, EBITDA, NOPAT and capital
employed). After this we calculated financial ratios for each company and for each year. At last, we
synthesized the ratios in some summarized tables and we prepared some graphs. We included information
from the Canadian market as a reference. At last, the analysis based on this information, our knowledge
and experience took place.
f) For practical reasons, we work with the figures of the balance sheet at the end of the year. It is
definitively better to work with the average figures of the year (average of the 4 quarters or average of
the 12 months). Doing the calculation of the ratios this way may imply certain imperfection in the
process, although working with averages is not a perfect process neither.
RETURN ON CAPITAL EMPLOYED (ROCE)
a) In Table I we are presenting the Return on Capital Employed (ROCE) for the last five years for each
of these five companies. This is probably the most important measurement in financial ratios. At the end,
profitability is the reason why we have a business running. ROCE is defined as NOPAT over capital
employed. NOPAT (net operating profit after taxes) is EBIT minus adjusted taxes. EBIT is close to
operating income. Capital employed is the total assets minus liabilities with non-financial cost minus
cash and cash equivalents. ROCE gives us a measurement of wealth creation based on invested resources
in the company. The larger this figure the better. The central idea behind this ratio is that we should
intend to create wealth with the least invested resources. If we invest more in a company (or business
unit) a larger profit should be expected to justify the additional investment.
21,719
2,176
13,702
4,884
12,799
BCE
Cogeco Communications
Rogers Communications
Shaw Communications
Telus Corporation
0 5,000 10,000 15,000 20,000 25,000
Sales 2016 (million CAD)
CASE FINANCIAL RATIO ANALYSIS – COMMUNICATIONS INDUSTRY (2012-2016) July 21, 2017
Alberto Calva Acus Consulting 3 of 12 www.AcusConsulting.com Neither Acus Consulting nor Alberto Calva are responsible for any decisions made based on the information or comments here presented, neither for the
accuracy of the figures or information.
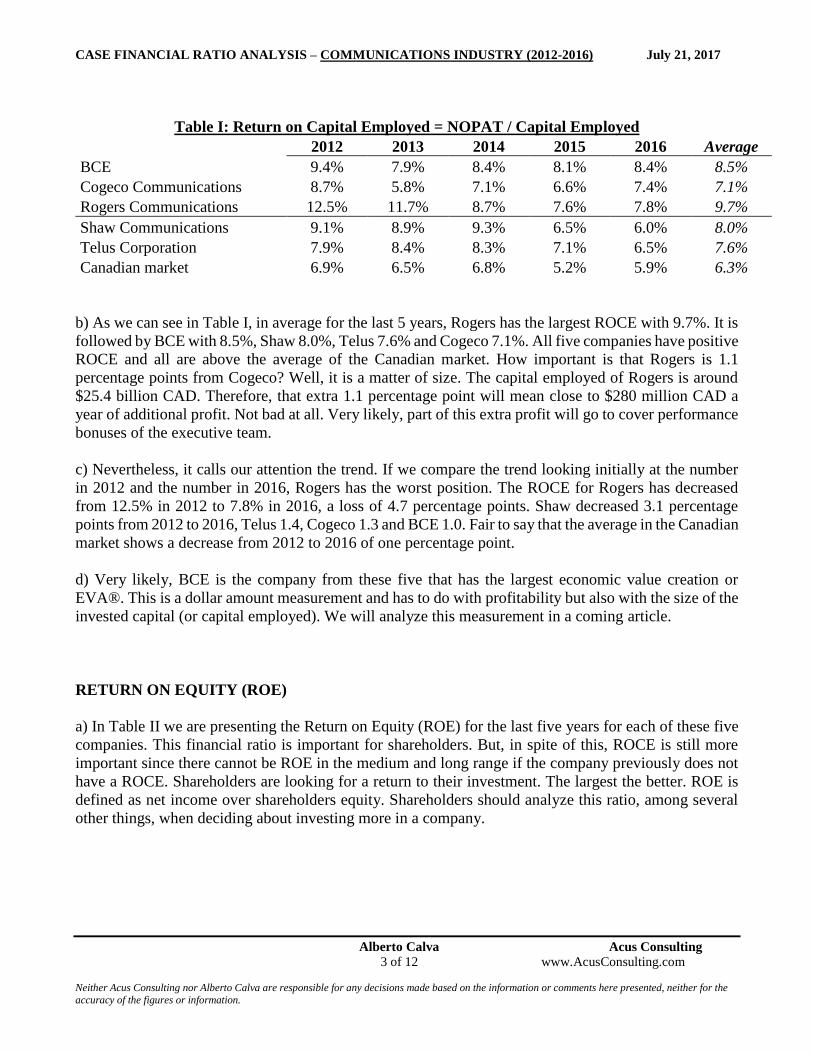
Table I: Return on Capital Employed = NOPAT / Capital Employed
2012 2013 2014 2015 2016 Average
BCE 9.4% 7.9% 8.4% 8.1% 8.4% 8.5%
Cogeco Communications 8.7% 5.8% 7.1% 6.6% 7.4% 7.1%
Rogers Communications 12.5% 11.7% 8.7% 7.6% 7.8% 9.7%
Shaw Communications 9.1% 8.9% 9.3% 6.5% 6.0% 8.0%
Telus Corporation 7.9% 8.4% 8.3% 7.1% 6.5% 7.6%
Canadian market 6.9% 6.5% 6.8% 5.2% 5.9% 6.3%
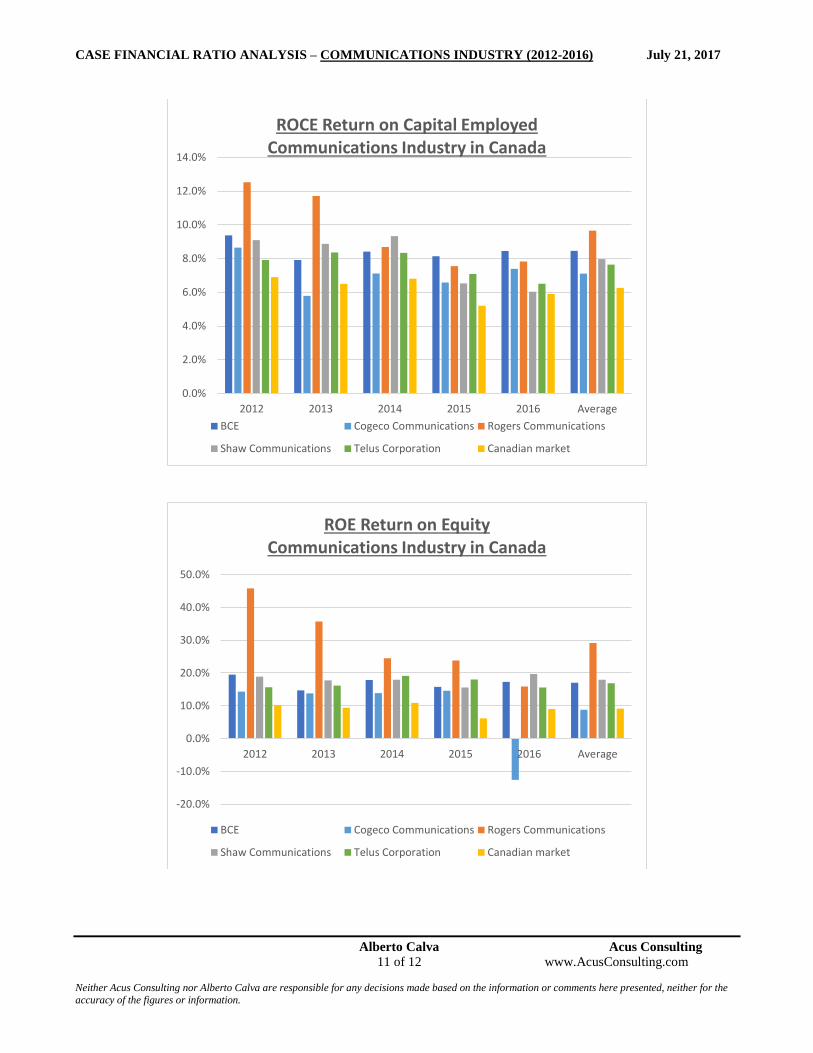
b) As we can see in Table I, in average for the last 5 years, Rogers has the largest ROCE with 9.7%. It is
followed by BCE with 8.5%, Shaw 8.0%, Telus 7.6% and Cogeco 7.1%. All five companies have positive
ROCE and all are above the average of the Canadian market. How important is that Rogers is 1.1
percentage points from Cogeco? Well, it is a matter of size. The capital employed of Rogers is around
$25.4 billion CAD. Therefore, that extra 1.1 percentage point will mean close to $280 million CAD a
year of additional profit. Not bad at all. Very likely, part of this extra profit will go to cover performance
bonuses of the executive team.
c) Nevertheless, it calls our attention the trend. If we compare the trend looking initially at the number
in 2012 and the number in 2016, Rogers has the worst position. The ROCE for Rogers has decreased
from 12.5% in 2012 to 7.8% in 2016, a loss of 4.7 percentage points. Shaw decreased 3.1 percentage
points from 2012 to 2016, Telus 1.4, Cogeco 1.3 and BCE 1.0. Fair to say that the average in the Canadian
market shows a decrease from 2012 to 2016 of one percentage point.
d) Very likely, BCE is the company from these five that has the largest economic value creation or
EVA®. This is a dollar amount measurement and has to do with profitability but also with the size of the
invested capital (or capital employed). We will analyze this measurement in a coming article.
RETURN ON EQUITY (ROE)
a) In Table II we are presenting the Return on Equity (ROE) for the last five years for each of these five
companies. This financial ratio is important for shareholders. But, in spite of this, ROCE is still more
important since there cannot be ROE in the medium and long range if the company previously does not
have a ROCE. Shareholders are looking for a return to their investment. The largest the better. ROE is
defined as net income over shareholders equity. Shareholders should analyze this ratio, among several
other things, when deciding about investing more in a company.
CASE FINANCIAL RATIO ANALYSIS – COMMUNICATIONS INDUSTRY (2012-2016) July 21, 2017
Alberto Calva Acus Consulting 4 of 12 www.AcusConsulting.com Neither Acus Consulting nor Alberto Calva are responsible for any decisions made based on the information or comments here presented, neither for the
accuracy of the figures or information.
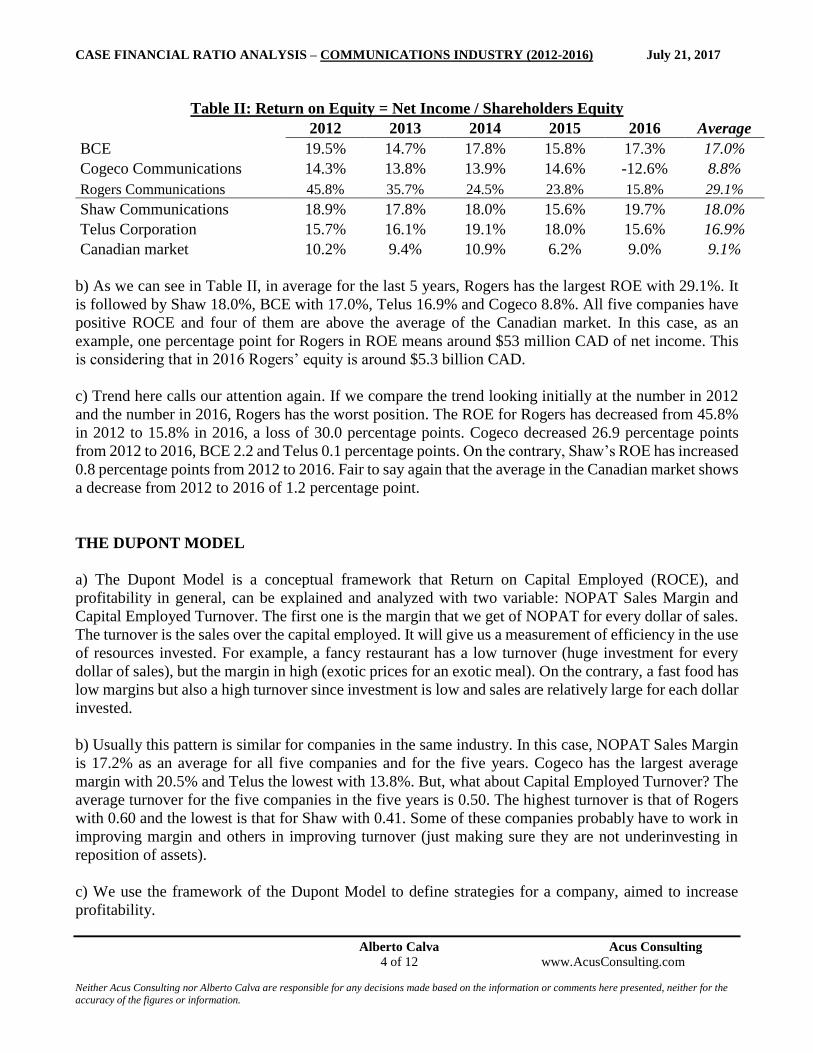
Table II: Return on Equity = Net Income / Shareholders Equity
2012 2013 2014 2015 2016 Average
BCE 19.5% 14.7% 17.8% 15.8% 17.3% 17.0%
Cogeco Communications 14.3% 13.8% 13.9% 14.6% -12.6% 8.8%
Rogers Communications 45.8% 35.7% 24.5% 23.8% 15.8% 29.1%
Shaw Communications 18.9% 17.8% 18.0% 15.6% 19.7% 18.0%
Telus Corporation 15.7% 16.1% 19.1% 18.0% 15.6% 16.9%
Canadian market 10.2% 9.4% 10.9% 6.2% 9.0% 9.1%
b) As we can see in Table II, in average for the last 5 years, Rogers has the largest ROE with 29.1%. It
is followed by Shaw 18.0%, BCE with 17.0%, Telus 16.9% and Cogeco 8.8%. All five companies have
positive ROCE and four of them are above the average of the Canadian market. In this case, as an
example, one percentage point for Rogers in ROE means around $53 million CAD of net income. This
is considering that in 2016 Rogers’ equity is around $5.3 billion CAD.
c) Trend here calls our attention again. If we compare the trend looking initially at the number in 2012
and the number in 2016, Rogers has the worst position. The ROE for Rogers has decreased from 45.8%
in 2012 to 15.8% in 2016, a loss of 30.0 percentage points. Cogeco decreased 26.9 percentage points
from 2012 to 2016, BCE 2.2 and Telus 0.1 percentage points. On the contrary, Shaw’s ROE has increased
0.8 percentage points from 2012 to 2016. Fair to say again that the average in the Canadian market shows
a decrease from 2012 to 2016 of 1.2 percentage point.
THE DUPONT MODEL
a) The Dupont Model is a conceptual framework that Return on Capital Employed (ROCE), and
profitability in general, can be explained and analyzed with two variable: NOPAT Sales Margin and
Capital Employed Turnover. The first one is the margin that we get of NOPAT for every dollar of sales.
The turnover is the sales over the capital employed. It will give us a measurement of efficiency in the use
of resources invested. For example, a fancy restaurant has a low turnover (huge investment for every
dollar of sales), but the margin in high (exotic prices for an exotic meal). On the contrary, a fast food has
low margins but also a high turnover since investment is low and sales are relatively large for each dollar
invested.
b) Usually this pattern is similar for companies in the same industry. In this case, NOPAT Sales Margin
is 17.2% as an average for all five companies and for the five years. Cogeco has the largest average
margin with 20.5% and Telus the lowest with 13.8%. But, what about Capital Employed Turnover? The
average turnover for the five companies in the five years is 0.50. The highest turnover is that of Rogers
with 0.60 and the lowest is that for Shaw with 0.41. Some of these companies probably have to work in
improving margin and others in improving turnover (just making sure they are not underinvesting in
reposition of assets).
c) We use the framework of the Dupont Model to define strategies for a company, aimed to increase
profitability.
CASE FINANCIAL RATIO ANALYSIS – COMMUNICATIONS INDUSTRY (2012-2016) July 21, 2017
Alberto Calva Acus Consulting 5 of 12 www.AcusConsulting.com Neither Acus Consulting nor Alberto Calva are responsible for any decisions made based on the information or comments here presented, neither for the
accuracy of the figures or information.
FINANCIAL LEVERAGE
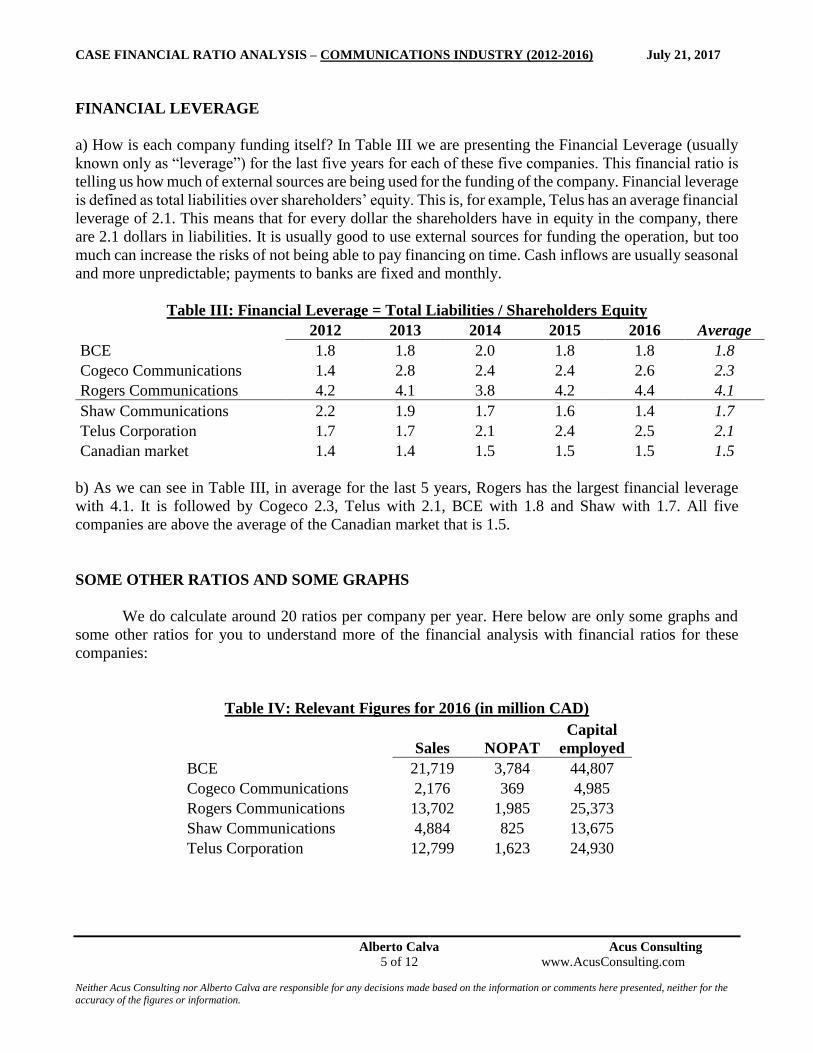
a) How is each company funding itself? In Table III we are presenting the Financial Leverage (usually
known only as “leverage”) for the last five years for each of these five companies. This financial ratio is
telling us how much of external sources are being used for the funding of the company. Financial leverage
is defined as total liabilities over shareholders’ equity. This is, for example, Telus has an average financial
leverage of 2.1. This means that for every dollar the shareholders have in equity in the company, there
are 2.1 dollars in liabilities. It is usually good to use external sources for funding the operation, but too
much can increase the risks of not being able to pay financing on time. Cash inflows are usually seasonal
and more unpredictable; payments to banks are fixed and monthly.
Table III: Financial Leverage = Total Liabilities / Shareholders Equity
2012 2013 2014 2015 2016 Average
BCE 1.8 1.8 2.0 1.8 1.8 1.8
Cogeco Communications 1.4 2.8 2.4 2.4 2.6 2.3
Rogers Communications 4.2 4.1 3.8 4.2 4.4 4.1
Shaw Communications 2.2 1.9 1.7 1.6 1.4 1.7
Telus Corporation 1.7 1.7 2.1 2.4 2.5 2.1
Canadian market 1.4 1.4 1.5 1.5 1.5 1.5
b) As we can see in Table III, in average for the last 5 years, Rogers has the largest financial leverage
with 4.1. It is followed by Cogeco 2.3, Telus with 2.1, BCE with 1.8 and Shaw with 1.7. All five
companies are above the average of the Canadian market that is 1.5.
SOME OTHER RATIOS AND SOME GRAPHS
We do calculate around 20 ratios per company per year. Here below are only some graphs and
some other ratios for you to understand more of the financial analysis with financial ratios for these
companies:
Table IV: Relevant Figures for 2016 (in million CAD)
Sales NOPAT
Capital
employed
BCE 21,719 3,784 44,807
Cogeco Communications 2,176 369 4,985
Rogers Communications 13,702 1,985 25,373
Shaw Communications 4,884 825 13,675
Telus Corporation 12,799 1,623 24,930
CASE FINANCIAL RATIO ANALYSIS – COMMUNICATIONS INDUSTRY (2012-2016) July 21, 2017
Alberto Calva Acus Consulting 6 of 12 www.AcusConsulting.com Neither Acus Consulting nor Alberto Calva are responsible for any decisions made based on the information or comments here presented, neither for the
accuracy of the figures or information.
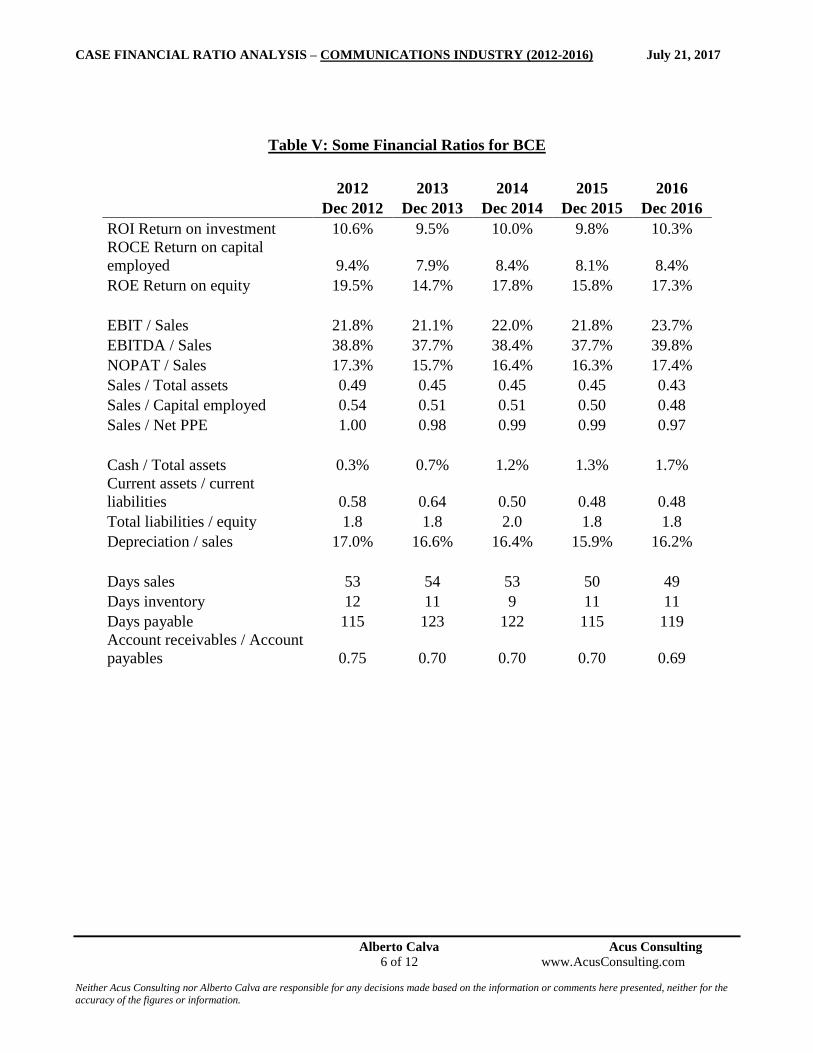
Table V: Some Financial Ratios for BCE
2012 2013 2014 2015 2016
Dec 2012 Dec 2013 Dec 2014 Dec 2015 Dec 2016
ROI Return on investment 10.6% 9.5% 10.0% 9.8% 10.3%
ROCE Return on capital
employed 9.4% 7.9% 8.4% 8.1% 8.4%
ROE Return on equity 19.5% 14.7% 17.8% 15.8% 17.3%
EBIT / Sales 21.8% 21.1% 22.0% 21.8% 23.7%
EBITDA / Sales 38.8% 37.7% 38.4% 37.7% 39.8%
NOPAT / Sales 17.3% 15.7% 16.4% 16.3% 17.4%
Sales / Total assets 0.49 0.45 0.45 0.45 0.43
Sales / Capital employed 0.54 0.51 0.51 0.50 0.48
Sales / Net PPE 1.00 0.98 0.99 0.99 0.97
Cash / Total assets 0.3% 0.7% 1.2% 1.3% 1.7%
Current assets / current
liabilities 0.58 0.64 0.50 0.48 0.48
Total liabilities / equity 1.8 1.8 2.0 1.8 1.8
Depreciation / sales 17.0% 16.6% 16.4% 15.9% 16.2%
Days sales 53 54 53 50 49
Days inventory 12 11 9 11 11
Days payable 115 123 122 115 119
Account receivables / Account
payables 0.75 0.70 0.70 0.70 0.69
CASE FINANCIAL RATIO ANALYSIS – COMMUNICATIONS INDUSTRY (2012-2016) July 21, 2017
Alberto Calva Acus Consulting 7 of 12 www.AcusConsulting.com Neither Acus Consulting nor Alberto Calva are responsible for any decisions made based on the information or comments here presented, neither for the
accuracy of the figures or information.
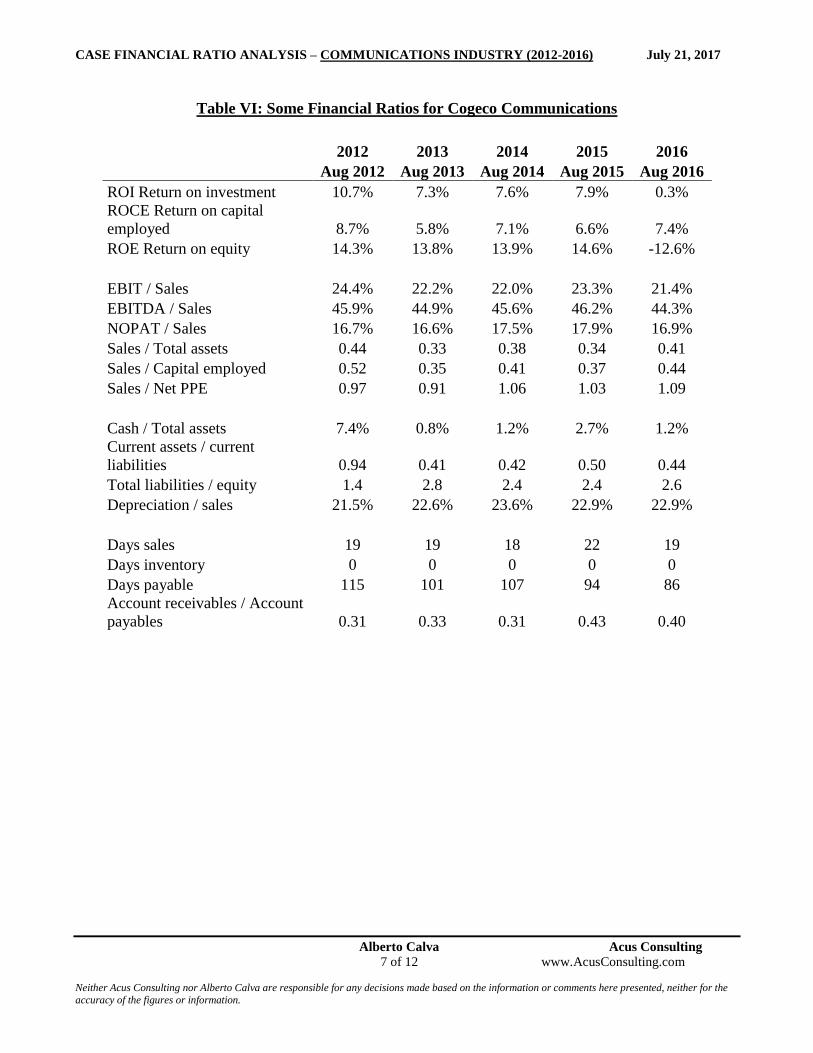
Table VI: Some Financial Ratios for Cogeco Communications
2012 2013 2014 2015 2016
Aug 2012 Aug 2013 Aug 2014 Aug 2015 Aug 2016
ROI Return on investment 10.7% 7.3% 7.6% 7.9% 0.3%
ROCE Return on capital
employed 8.7% 5.8% 7.1% 6.6% 7.4%
ROE Return on equity 14.3% 13.8% 13.9% 14.6% -12.6%
EBIT / Sales 24.4% 22.2% 22.0% 23.3% 21.4%
EBITDA / Sales 45.9% 44.9% 45.6% 46.2% 44.3%
NOPAT / Sales 16.7% 16.6% 17.5% 17.9% 16.9%
Sales / Total assets 0.44 0.33 0.38 0.34 0.41
Sales / Capital employed 0.52 0.35 0.41 0.37 0.44
Sales / Net PPE 0.97 0.91 1.06 1.03 1.09
Cash / Total assets 7.4% 0.8% 1.2% 2.7% 1.2%
Current assets / current
liabilities 0.94 0.41 0.42 0.50 0.44
Total liabilities / equity 1.4 2.8 2.4 2.4 2.6
Depreciation / sales 21.5% 22.6% 23.6% 22.9% 22.9%
Days sales 19 19 18 22 19
Days inventory 0 0 0 0 0
Days payable 115 101 107 94 86
Account receivables / Account
payables 0.31 0.33 0.31 0.43 0.40

CASE FINANCIAL RATIO ANALYSIS – COMMUNICATIONS INDUSTRY (2012-2016) July 21, 2017
Alberto Calva Acus Consulting 8 of 12 www.AcusConsulting.com Neither Acus Consulting nor Alberto Calva are responsible for any decisions made based on the information or comments here presented, neither for the
accuracy of the figures or information.
Table VII: Some Financial Ratios for Rogers Communications
2012 2013 2014 2015 2016
Dec 2012 Dec 2013 Dec 2014 Dec 2015 Dec 2016
ROI Return on investment 14.1% 12.4% 10.0% 8.9% 7.4%
ROCE Return on capital
employed 12.5% 11.7% 8.7% 7.6% 7.8%
ROE Return on equity 45.8% 35.7% 24.5% 23.8% 15.8%
EBIT / Sales 23.5% 23.7% 22.1% 20.1% 20.1%
EBITDA / Sales 38.1% 38.6% 38.8% 37.1% 36.7%
NOPAT / Sales 17.3% 17.5% 16.0% 14.8% 14.5%
Sales / Total assets 0.64 0.54 0.48 0.46 0.48
Sales / Capital employed 0.72 0.67 0.54 0.51 0.54
Sales / Net PPE 1.30 1.24 1.21 1.22 1.27
Cash / Total assets 1.1% 9.7% 0.7% 0.0% 0.0%
Current assets / current
liabilities 0.74 0.94 0.48 0.52 0.50
Total liabilities / equity 4.2 4.1 3.8 4.2 4.4
Depreciation / sales 14.6% 14.9% 16.7% 17.0% 16.6%
Days sales 44 43 45 48 51
Days inventory 14 13 11 14 13
Days payable 99 108 118 116 116
Account receivables / Account
payables 0.72 0.64 0.62 0.66 0.70
CASE FINANCIAL RATIO ANALYSIS – COMMUNICATIONS INDUSTRY (2012-2016) July 21, 2017
Alberto Calva Acus Consulting 9 of 12 www.AcusConsulting.com Neither Acus Consulting nor Alberto Calva are responsible for any decisions made based on the information or comments here presented, neither for the
accuracy of the figures or information.
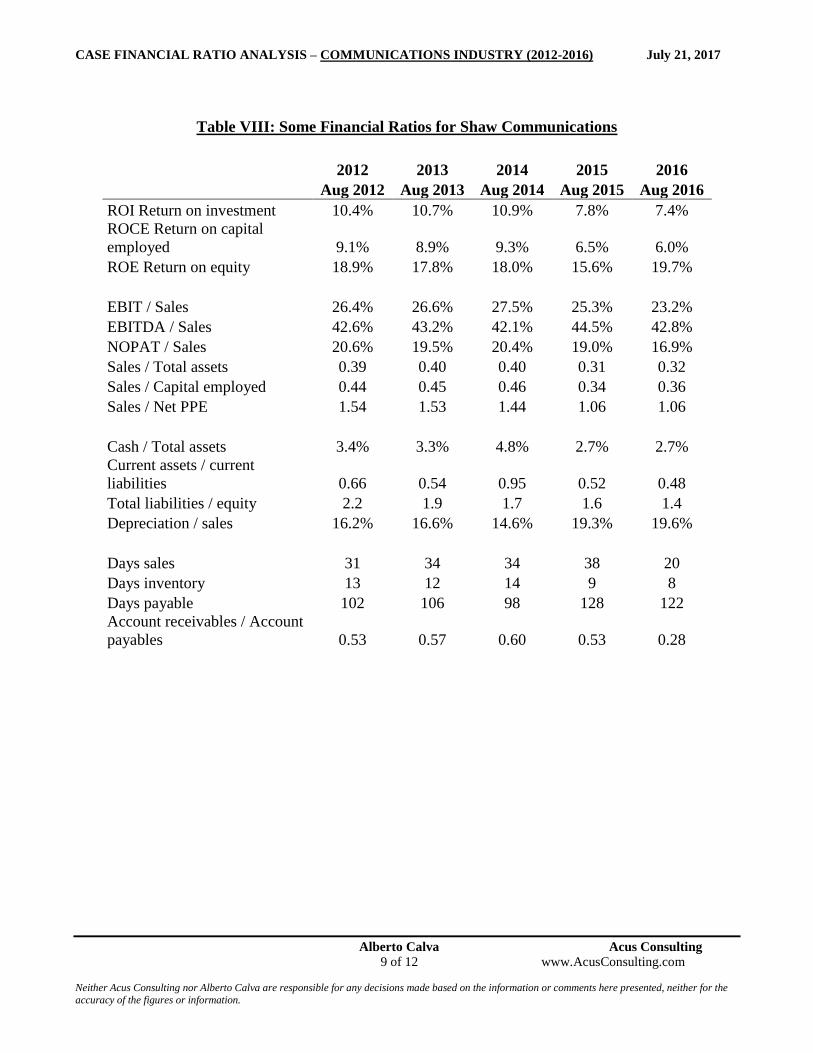
Table VIII: Some Financial Ratios for Shaw Communications
2012 2013 2014 2015 2016
Aug 2012 Aug 2013 Aug 2014 Aug 2015 Aug 2016
ROI Return on investment 10.4% 10.7% 10.9% 7.8% 7.4%
ROCE Return on capital
employed 9.1% 8.9% 9.3% 6.5% 6.0%
ROE Return on equity 18.9% 17.8% 18.0% 15.6% 19.7%
EBIT / Sales 26.4% 26.6% 27.5% 25.3% 23.2%
EBITDA / Sales 42.6% 43.2% 42.1% 44.5% 42.8%
NOPAT / Sales 20.6% 19.5% 20.4% 19.0% 16.9%
Sales / Total assets 0.39 0.40 0.40 0.31 0.32
Sales / Capital employed 0.44 0.45 0.46 0.34 0.36
Sales / Net PPE 1.54 1.53 1.44 1.06 1.06
Cash / Total assets 3.4% 3.3% 4.8% 2.7% 2.7%
Current assets / current
liabilities 0.66 0.54 0.95 0.52 0.48
Total liabilities / equity 2.2 1.9 1.7 1.6 1.4
Depreciation / sales 16.2% 16.6% 14.6% 19.3% 19.6%
Days sales 31 34 34 38 20
Days inventory 13 12 14 9 8
Days payable 102 106 98 128 122
Account receivables / Account
payables 0.53 0.57 0.60 0.53 0.28

CASE FINANCIAL RATIO ANALYSIS – COMMUNICATIONS INDUSTRY (2012-2016) July 21, 2017
Alberto Calva Acus Consulting 10 of 12 www.AcusConsulting.com Neither Acus Consulting nor Alberto Calva are responsible for any decisions made based on the information or comments here presented, neither for the
accuracy of the figures or information.
Table IX: Some Financial Ratios for Telus Corporation
2012 2013 2014 2015 2016
Dec 2012 Dec 2013 Dec 2014 Dec 2015 Dec 2016
ROI Return on investment 9.8% 10.3% 10.3% 8.9% 7.9%
ROCE Return on capital
employed 7.9% 8.4% 8.3% 7.1% 6.5%
ROE Return on equity 15.7% 16.1% 19.1% 18.0% 15.6%
EBIT / Sales 18.3% 19.4% 19.8% 18.8% 17.0%
EBITDA / Sales 35.3% 35.2% 35.1% 34.1% 33.0%
NOPAT / Sales 13.6% 14.2% 14.7% 13.6% 12.7%
Sales / Total assets 0.53 0.53 0.52 0.47 0.46
Sales / Capital employed 0.58 0.59 0.57 0.52 0.51
Sales / Net PPE 1.34 1.35 1.32 1.28 1.22
Cash / Total assets 0.5% 1.6% 0.3% 0.8% 1.6%
Current assets / current
liabilities 0.63 0.71 0.62 0.55 0.50
Total liabilities / equity 1.7 1.7 2.1 2.4 2.5
Depreciation / sales 17.1% 15.8% 15.3% 15.3% 16.0%
Days sales 51 46 44 41 41
Days inventory 18 16 15 16 13
Days payable 77 85 93 87 98
Account receivables / Account
payables 1.02 0.84 0.73 0.72 0.63
CASE FINANCIAL RATIO ANALYSIS – COMMUNICATIONS INDUSTRY (2012-2016) July 21, 2017
Alberto Calva Acus Consulting 11 of 12 www.AcusConsulting.com Neither Acus Consulting nor Alberto Calva are responsible for any decisions made based on the information or comments here presented, neither for the
accuracy of the figures or information.
0.0%
2.0%
4.0%
6.0%
8.0%
10.0%
12.0%
14.0%
2012 2013 2014 2015 2016 Average
ROCE Return on Capital EmployedCommunications Industry in Canada
BCE Cogeco Communications Rogers Communications
Shaw Communications Telus Corporation Canadian market
-20.0%
-10.0%
0.0%
10.0%
20.0%
30.0%
40.0%
50.0%
2012 2013 2014 2015 2016 Average
ROE Return on EquityCommunications Industry in Canada
BCE Cogeco Communications Rogers Communications
Shaw Communications Telus Corporation Canadian market
CASE FINANCIAL RATIO ANALYSIS – COMMUNICATIONS INDUSTRY (2012-2016) July 21, 2017
Alberto Calva Acus Consulting 12 of 12 www.AcusConsulting.com Neither Acus Consulting nor Alberto Calva are responsible for any decisions made based on the information or comments here presented, neither for the
accuracy of the figures or information.
DISCLAIMER
This analysis and conclusions have the sole purpose of exemplifying the use of financial analysis with
financial ratios in companies. Neither Acus Consulting Ltd nor Alberto Calva are responsible for any
decision made based on the information or comments here presented, neither for the accuracy of the
figures or information. Neither Acus Consulting Ltd nor Alberto Calva represents, warrants or guarantees
the accuracy or completeness of the information contained in this document and we are not responsible
for any errors or omissions in or your use of, or reliance on, the information provided.
We do not have any relationship with the companies here presented and up to today neither of them is a
client of Acus Consulting Ltd.
< E N D >
About Acus Consulting. This firm supports companies, organizations and government agencies in financial and strategic
analysis, investment project evaluations, financial modeling, valuation of ongoing companies, financial planning, risk analysis
and decision making. Acus Consulting works in consulting projects and offers seminars and workshops of finance for
executive training. It is based in Toronto.
About Alberto Calva. His expertise field is finance and economy. He has been a business consultant for more than 20 years.
He has given seminars and workshops in 8 different countries having trained with this around 10,000 executives and
entrepreneurs from 20 different countries. He has a unique mix of academic, practical, entrepreneurial, hands on experience
and board member background. He holds a Bachelor degree of Industrial Engineering, a Master degree of Economics and an
MBA with a major of Finance.
About this report. We prepare several reports every month regarding financial, economic and business issues. These reports
are sent free of any charge to our database of clients and friends. We have been preparing and sending our reports for 20 years.
We send each report to around 16,000 people.
Neither Acus Consulting nor Alberto Calva are responsible for any decisions taken based on the information or comments
here presented, neither for the accuracy of the figures or information.
| Alberto Calva | [email protected] | [email protected] | Cell & WhatsApp +1-416-824-1924 |