Embed Size (px)
Citation preview
NIST GCR 16-002
Case Studies of Community Resilience Policy
Nayanee Gupta Christopher T. Clavin
Zoe E. Petropoulos Austin B. Mudd
Rashida Nek Sally S. Tinkle
IDA Science and Technology Policy Institute
This publication is available free of charge from: http://dx.doi.org/10.6028/NIST.GCR.16-002
NIST GCR 16-002
Case Studies of Community Resilience Policy
Prepared for U.S. Department of Commerce
Engineering Laboratory National Institute of Standards and Technology
Gaithersburg, MD 20899
By Nayanee Gupta
Christopher T. Clavin Zoe E. Petropoulos
Austin B. Mudd Rashida Nek
Sally S. Tinkle IDA Science and Technology Policy Institute
This publication is available free of charge from: http://dx.doi.org/10.6028/NIST.GCR.16-002
May 2016
U.S. Department of Commerce Penny Pritzker, Secretary
National Institute of Standards and Technology Willie May, Under Secretary of Commerce for Standards and Technology and Director
i
Executive Summary
As part of its Community Disaster Resilience Program, the National Institute of Standards and Technology (NIST) is examining approaches that various communities have employed that establish or support community resilience policy in municipal or regional government. NIST tasked the IDA Science and Technology Policy Institute to examine how communities develop economic development and hazard mitigation plans and to understand the barriers that exist that prevent resilience from being incorporated into economic development plans, including governance, organizational, and management processes. Part I presents readily available metrics for characterizing communities with varying population sizes (small, medium, large), demographics, and infrastructure systems for readily available data. The series of metrics was applied to 14 communities that are geographically dispersed around the US and exposed to a range of hazards (e.g., hurricane, tornado, earthquake, tsunami, and flood). The metrics were further developed for seven (7) of the communities with recent efforts related to community resilience. In Part II, three of these communities were examined in more detail to provide insight to specific resilience policy issues and decisions. The case studies include a summary of current policies and practice for community resilience and observations of practices that encourage resilience as a part of economic development planning.
For Part I, literature on community characteristics was reviewed to identify existing indicators of community resilience and available information on community demographics and infrastructure systems was gathered from publicly available data sets. This information was used to identify an initial set of candidates to be considered for case study. Available data to characterize communities was sufficient to ensure a diverse set of candidate case study communities. These data provided context on the candidate case study communities, but additional study and information is necessary to understand the relationship between these contextual factors and resilience planning and policy outcomes.
The community case studies in Part II provide insights of ongoing resilience efforts in three communities that illustrates how communities with different challenges address resilience, and how resilience-focused efforts are undertaken by their local governments. The three communities examined are: Los Angeles, California; Flagstaff, Arizona; and Norfolk, Virginia. Major resilience initiatives in each city are as follows:
• Los Angeles, California
– Resilience by Design, a city report issued in December 2014, established astrategic resilience policy statement and provided specific recommended
ii
actions in three priority areas for resilience investments: structural integrity of buildings, public water infrastructure integrity, and telecommunications infrastructure reliability. The report recommends the city council adopt two mandatory building codes, and building rating standards. The report marked the culmination of years of work by members of the city mayor’s office, the city’s water and power departments, and other city agencies in collaboration with the United States Geological Survey.
• Flagstaff, Arizona
– The city adopted the Wildland-Urban Interface (WUI) code, which prescribes the use of fire-resistant building materials and requires clearing defensible space around structures in the WUI. The code is mandatory for all new construction in the WUI. Extensive community outreach helped form the coalition necessary to gain public support.
– The Flagstaff Watershed Protection Project was motivated by the 2010 Schultz Fire, which demonstrated Flagstaff’s vulnerability to wildland fire and subsequent debris flows from post-fire thunderstorms. The city manager’s office led a community outreach initiative to seek public support for bond sales to fund a watershed protection program, which would employ fuels-reduction activities on city-managed and National Forest lands, via a memorandum of understanding signed with the U.S. Forest Service. The Flagstaff Watershed Protection Project is being implemented by staff from city, state, and federal organizations as well as Northern Arizona University.
• Norfolk, Virginia
– The City of Norfolk’s near-term resilience efforts focus on three areas: coastal resilience, neighborhood development, and economic planning. A proposed long-term initiative is captured in the strategic document Vision 2100. This strategic initiative will identify the goals and vision for the community’s development by the year 2100. The nearly 100-year time horizon was selected to reduce concerns about current property ownership and land use.
– Neighborhood Asset Mapping is an initiative being implemented that collects input from individuals about their neighborhoods and the value of services that are provided by public infrastructure, including the built environment.
iii
Findings This study considered outcomes of resilience-focused initiatives, highlighting
multiple policy-related outcomes. They include enhancing the city’s awareness of risk, facilitating engagement with city stakeholders, collaboration between entities that have historically operated in distinctly separate jurisdictions, providing community policy decision makers with objective information, identifying budgetary sources for resilience and risk reduction measures, and capitalizing on favorable opportunities to implement policy. These actions are also seen as examples of success in efforts of local officials to make their communities more resilient, and are highlighted as such in the case studies.
Findings from this study are as follows:
• Resilience policy development in the communities studied was most often observed to be a collection of outcomes from multiple initiatives across the government. These observed outcomes originate from multiple efforts across government rather than a standing resilience function of the local government. Specific initiatives were being planned and implemented within the context of their long-standing hazard mitigation efforts and within existing government policy planning functions (e.g., land use planning).
• Resilience initiatives are often driven from the highest levels of municipal leadership. Staff within municipal agencies demonstrated interest in addressing risks posed by hazards, however the top-level strategic policy guidance from leadership was necessary to establish initiatives and actions. Staff supporting resilience efforts were either elected officials or acting within their normal job descriptions for their positions in the mayor’s office, the city manager’s office, and other city offices.
• Scientific and technical support, generally from an unbiased, trusted, source, is critical to maintaining credibility in discussions of policy proposals and associated trade-offs.
• Collaboration across departments, stakeholder groups, and jurisdictions is seen as a key differentiator between traditional emergency management and long-term community-focused resilience activities. While regional coordination of resilience and hazard mitigation programs has worked well in some communities, in others it has run into obstacles arising from differing priorities and differing perceptions of risk.
• All three case study communities identified outreach, education, and communication tools as critical to providing support for their leadership and decision makers’ ability to adopt resilience policies and programs.
iv
• Long-term economic impacts of disasters, beyond the loss of life and property, combined with community priorities for economic redevelopment were cited as major motivating factors for resilience and hazard mitigation policy development.
• Resilience policy design processes differ from traditional hazard mitigation policy design processes due to long-term planning horizons and a holistic planning approach required across departments and infrastructure types.
• Design and implementation of resilience initiatives are influenced by external factors. Successful implementation depends on leadership recognizing the need to influence multiple factors, stakeholder groups to achieve expressed public support, and identification of windows of opportunity to push for implementation (e.g., recent disaster events, unexpected availability of funding).
v
Contents
Introduction ..........................................................................................................................1
Part 1: Data and Analysis for Characterizing Communities for a Resilience Policy Case Study ....................................................................................3
1. Identifying Community Characteristics and Indicators of Resilience .........................5 A. Major Themes Identified in Literature Review ...................................................6 B. Identifying Indicators for Population and Governance .....................................10 C. Identifying Indicators for Built Environment, Social Dimensions,
and Economics ..................................................................................................10 D. Community Characteristics and Resilience Indicators ......................................11
2. Identifying Candidate Communities ..........................................................................13 A. Hazard Profile Development for All U.S. Cities ...............................................13
1. Locate Most Hazardous Counties ................................................................14 2. Create Hazard Region Maps ........................................................................16 3. Locate Metropolitan and Smaller Communities in Each
Hazard Region .............................................................................................20 4. Identify the MSAs with Highest Frequencies of Damaging Hazards .........22
B. Social Vulnerability and Economic Profile .......................................................22 C. Identifying Initial Candidate Case Study Communities ....................................23
3. Resilience-Relevant Attributes as a Basis for Selecting Candidate Case Study Communities ..........................................................................................27 A. Los Angeles, California .....................................................................................27 B. Flagstaff, Arizona ..............................................................................................28 C. Norfolk, Virginia ...............................................................................................29 D. Galveston, Texas ...............................................................................................29 E. Providence, Rhode Island ..................................................................................30 F. Huntsville, Alabama ..........................................................................................31 G. Ames, Iowa ........................................................................................................31
4. Summary of Findings for Part 1 ................................................................................33
Part 2: Case Studies of Community Resilience Policy and Planning Activities .........35 5. Case Study of the City of Los Angeles .....................................................................37
A. Natural Hazard Experience ...............................................................................37 B. Resilience Policy Development .........................................................................38
1. Resilience Policy Planning Team Structure ................................................39 2. Soft-Story and Non-ductile Concrete Structure Mandatory Retrofits .........40 3. Water Infrastructure Retrofits .....................................................................42
C. Observations ......................................................................................................47
vi
6. Case Study of the City of Flagstaff ...........................................................................49 A. Natural Hazard Experience ...............................................................................49 B. Resilience Policy Development .........................................................................50
1. Proactive Forest Management .....................................................................50 2. Flagstaff Watershed Protection Project .......................................................55
C. Observations ......................................................................................................58 7. Case Study of the City of Norfolk .............................................................................61
A. Natural Hazard Experience ...............................................................................61 B. Resilience Policy Development .........................................................................62
1. Initial Coastal Flooding Focus ....................................................................62 2. Outcomes .....................................................................................................63 3. Norfolk’s Expansion of Policy to Address Economic and
Neighborhood Resilience ............................................................................64 4. Integrated Resilience Policy Proposal: Vision 2100 ...................................65 5. Resilience Decision Making Structure ........................................................66 6. Proposed Approaches for Implementing Resilience Policy ........................66
C. Observations ......................................................................................................68 8. Summary and Analysis for Part 2 ..............................................................................69
A. Major Resilience Initiatives ...............................................................................69 B. Los Angeles .......................................................................................................69 C. Flagstaff .............................................................................................................69 D. Norfolk ..............................................................................................................70 E. Summary of Observations .................................................................................70 F. Overarching Findings ........................................................................................71
Appendix A. National-Level Data on Community Characteristics and Resilience Indicators .............................................................................................. A-1
Appendix B. Collection and Processing of Hazards Data and MSAs within Regional Hazard Zones ...........................................................................................B-1
Appendix C. Indicator Data for Seven Case Study Community Candidates ...................C-1 Appendix D. Discussion Topics ..................................................................................... D-1 Appendix E. Community Contacts .................................................................................. E-1 References ........................................................................................................................ F-1 Abbreviations .................................................................................................................. G-1
1
Introduction
Presidential Policy Directive 8, National Preparedness, and Presidential Policy Directive 21, Critical Infrastructure Security and Resilience, establish the Federal Government’s policy definition of resilience as “the ability to adapt to changing conditions and withstand and rapidly recover from disruption due to emergencies” that include “deliberate attacks, accidents, or naturally occurring threats or incidents.” At the national level, federal policies, programs, and initiatives support state- and community-scale decisions on how to prepare for, respond to, and recover from disaster events. At the community level, resilience planning involves tangible tradeoffs and resource decisions on disaster preparedness, risk awareness, and recovery planning.
The National Institute of Standards and Technology (NIST) Community Disaster Resilience Program is a multi-faceted approach to convening community stakeholders, subject matter experts, resilience and disaster preparedness practitioners, and state and federal stakeholders to develop tools that support community resilience and assist decision makers. NIST’s approach to resilience planning includes the identification of a community’s social needs as a basis for understanding the types of service that the built environment should provide, including recovery from disruptive events.
NIST’s “Community Resilience Planning Guide for Buildings and Infrastructure Systems” (NIST 2015) provides a community planning process that can be employed by municipal or regional governments to determine long-term resilience goals, develop plans, and identify approaches and actions to improve built environment performance and community resilience. Building upon both traditional hazard mitigation, response, and recovery efforts and traditional risk assessment methodologies, this guide considers organizational influences, service and performance expectations, and social dependencies upon the built environment.
The guide has a 6-step process for structuring the organizational, social, planning, and technical aspects of community resilience planning and implementation. It is well-recognized that communities face a diversity of hazards, and social, economic, and built environment challenges, and need to address these challenges in a manner tailored to each community.
The approaches used by communities to translate resilience planning processes and documents into programs, rules, ordinances, or other measures that aim to establish resilience policy in municipal or regional government can further inform community resilience guidance. NIST tasked the IDA Science and Technology Policy Institute (STPI)

2
to examine the governance, organizational, management, and policy-making processes involved in creating resilience policy, from establishing policy proposals to codified resilience policies. Commonalities and differences were identified among communities in their approaches to designing and implementing resilience policies. A case study approach was employed, examining three communities from a larger pool of candidate communities that reflect a diversity of hazard, social, and economic community profiles.
This report has two parts. The first part describes research to identify the 14 candidate communities considered for the case study. That research included a literature review on community characteristics and indicators of community resilience and an examination of publicly available federal data sets. The second part of the report describes examination of resilience policy making in the three communities selected for closer examination, Los Angeles, California; Flagstaff, Arizona; and Norfolk, Virginia.
The authors acknowledge the intellectual contributions of NIST staff, in particular, Therese McAllister, Erica Kuligowski, Stephan Cauffman, and Nancy McNabb.
3
Part 1: Data and Analysis for Characterizing Communities for a Resilience Policy Case Study
This part of the report describes the process of identifying candidate communities for potential case study examination.
Chapter 1 provides the outcome of a literature review of various models for identifying community characteristics that are indicators of resilience. Dimensions of community characteristics and resilience indicators formed the basis for data collection to support community selection in subsequent chapters.
Chapter 2 describes the analysis of national-level data to identify an initial set of 14 candidate communities for resilience policy and planning case study. Data identified in this chapter describe exogenous hazard exposure and endogenous characteristics that contribute to the communities’ vulnerability.
Chapter 3 describes the application of additional selection criteria to narrow the 14 candidate case study communities to 7. An overview of each of the 7 final candidates is presented. The selection of 3 of these communities and detailed case studies of their resilience policies and planning are described in Part 2 of the report.

5
1. Identifying Community Characteristics and Indicators of Resilience
This chapter describes the result of a literature review aimed at identifying a series of indicators, community characteristics, and dimensions of resilience that form the basis for further data collection and selection of candidate communities for case study analysis.
According to a National Research Council (NRC) report, federal expenditures on natural disasters have been growing steadily over the past nearly 60 years from a total of $20.9 million in 1953 to $1.4 billion in 2009 (NRC 2012). These numbers do not include economic damages and other losses incurred by cities, industries, and communities as a result of natural disasters. This data supports the argument that there is an urgent need to increase the resilience of our communities and the Nation. Ongoing efforts include:
• Resilience is being incorporated into community planning through such programs as the Rockefeller Foundation’s 100 Resilient Cities Challenge and the United Nations Environment Program (UNEP) Financial Initiative’s Principles for Sustainable Insurance (UNEP 2015). The Rockefeller Foundation’s 100 Resilient Cities Challenge program has made recent notable investments in communities. To date, it has funded resilience initiatives in 65 cities, of which 12 are in the United States. The objective is to provide resources for resilience implementation through (1) financial support of a new chief resilience officer position in the city government, (2) technical support for the city to develop a resilience strategy, (3) networking support with relevant stakeholders to implement said strategy, and (4) connections with the other involved cities for support and best practices.
• Resilience standards and measures, such as the Social Vulnerability Index (Hazards and Vulnerability Research Institute 2015) or the Fire Protection Research Foundation’s Disaster Resiliency and National Fire Protection Association (NFPA) Codes and Standards (NFPA 2015) are being developed and used.
• Technical reports by RAND (Chandra et al. 2011), International Federation of Red Cross and Red Crescent Societies (2012), American Planning Association (2010), National Research Council (NRC 2012), and others are being published.
Resilience efforts can also encompass public health, as is the case with the Los Angeles County Community Disaster Resilience Project (Los Angeles County Community
6
Disaster Resilience 2015, or national security, such as a National Academies workshop on resilience to chemical, biological, radiological, nuclear, and explosive events (NRC 2014). Our study focuses only on community resilience efforts related to natural disasters.
A. Major Themes Identified in Literature Review Within a socio-ecological context, resilience has been defined as a system’s capacity
to absorb disturbance and re-organize into a fully functioning system. Norris et al. (2008) propose the following definition: “a process linking a set of adaptive capacities to a positive trajectory of functioning and adaptation after a disturbance.”
Within hazards research, resilience is defined as the ability to cope with a disaster with minimum impact and damage. In this context, resilience is considered an outcome, and incorporates the capacity to reduce or avoid losses, withstand the hazard, and recover with minimal social disruptions.
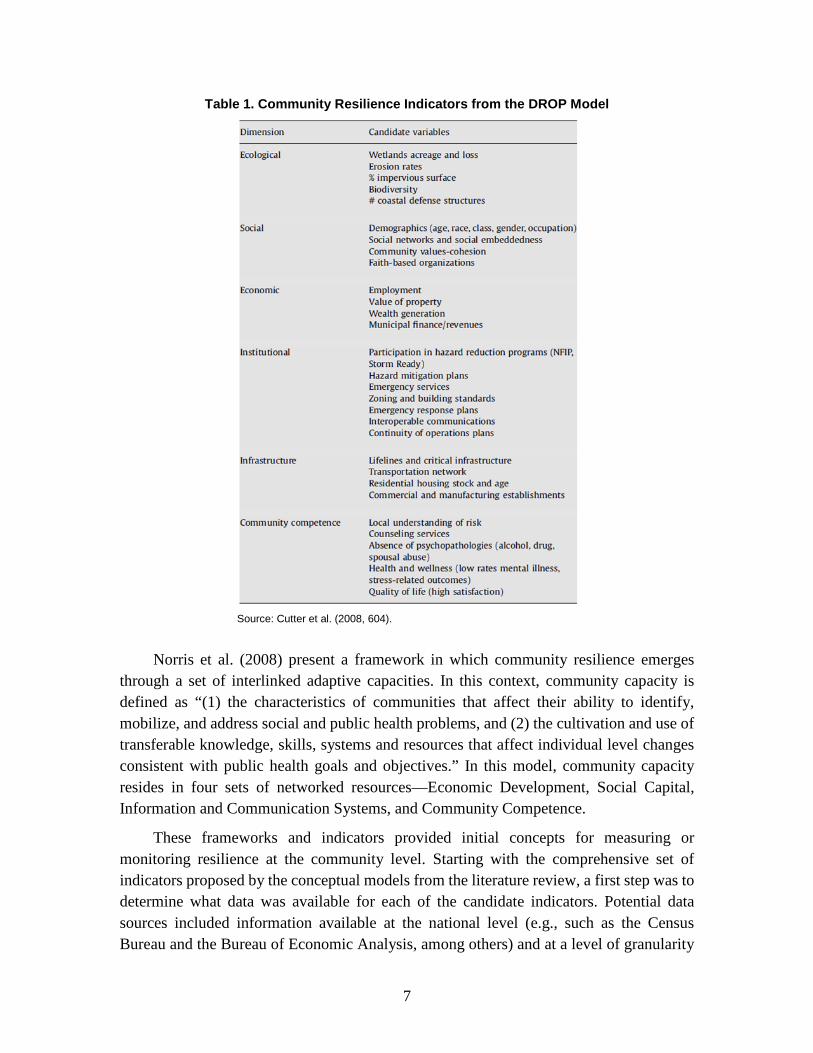
In their 2008 paper, Cutter et al. identify the shortcomings of commonly cited vulnerability models (such as failure to consider the root causes of social vulnerability and failure to consider the temporal dimension of vulnerability), as well as weaknesses in the commonly cited social resilience models (such as the absence of local level social factors and exclusion of vulnerability to the natural environment). To overcome such shortcomings in existing resilience models, and to provide a new conceptualization of natural disaster resilience, Cutter et al. proposed the Disaster Resilience of Place (DROP) model, a framework for measuring disaster resilience at the local and community levels. This model is designed to characterize the relationship between vulnerability and resilience. The DROP model was considered as a starting point for developing a conceptual framework for this analysis for three primary reasons. First, the model considers rapid-onset hazards (natural or otherwise) that demand a certain type of preparation and response both pre- and post-event. This is in contrast to the slower time horizons of events like global temperature variations, sea-level rise, or drought, where the planning horizon is different, and the adaptive capacity of the community is a factor to be considered in addition to resilience. Second, the focus of the model is the social resilience of places; thus, indicators of social resilience, which include demographic characteristics and access to resources, are considered as input to the analysis of community resilience. Third, the DROP model focuses on social resilience at the community level. This distinguishes it from models developed to assess resilience at the regional or global levels. Community resilience indicators recommended in the DROP model are listed in Table 1. The variables are divided into six dimensions: ecological, social, economic, institutional, infrastructure, and community competence.
7
Table 1. Community Resilience Indicators from the DROP Model
Source: Cutter et al. (2008, 604).
Norris et al. (2008) present a framework in which community resilience emerges
through a set of interlinked adaptive capacities. In this context, community capacity is defined as “(1) the characteristics of communities that affect their ability to identify, mobilize, and address social and public health problems, and (2) the cultivation and use of transferable knowledge, skills, systems and resources that affect individual level changes consistent with public health goals and objectives.” In this model, community capacity resides in four sets of networked resources—Economic Development, Social Capital, Information and Communication Systems, and Community Competence.
These frameworks and indicators provided initial concepts for measuring or monitoring resilience at the community level. Starting with the comprehensive set of indicators proposed by the conceptual models from the literature review, a first step was to determine what data was available for each of the candidate indicators. Potential data sources included information available at the national level (e.g., such as the Census Bureau and the Bureau of Economic Analysis, among others) and at a level of granularity
8
suitable to characterize communities of all sizes (i.e., data at the metropolitan statistical area [MSA] level or higher could not be used to characterize smaller cities). While data for social and economic variables were readily available, national data at the desired granularity for built environment was more difficult to obtain. In particular, transportation and energy data are mostly aggregated at the state level, as described in subsequent sections.
Drawing from the work of Cutter et al. and Norris et al., community resilience dimensions and variables were identified. The initial categories, and indicators were refined to into four dimensions:
• Population and governance
• Economic development
• Built environment
• Social Dimensions
Taken together, these four dimensions comprehensively describe the attributes of a community, including aspects of the built environment and how it supports community social functions. The four dimensions and the variables associated with each are shown in Table 2 and are described in more detail in the following sections.
9
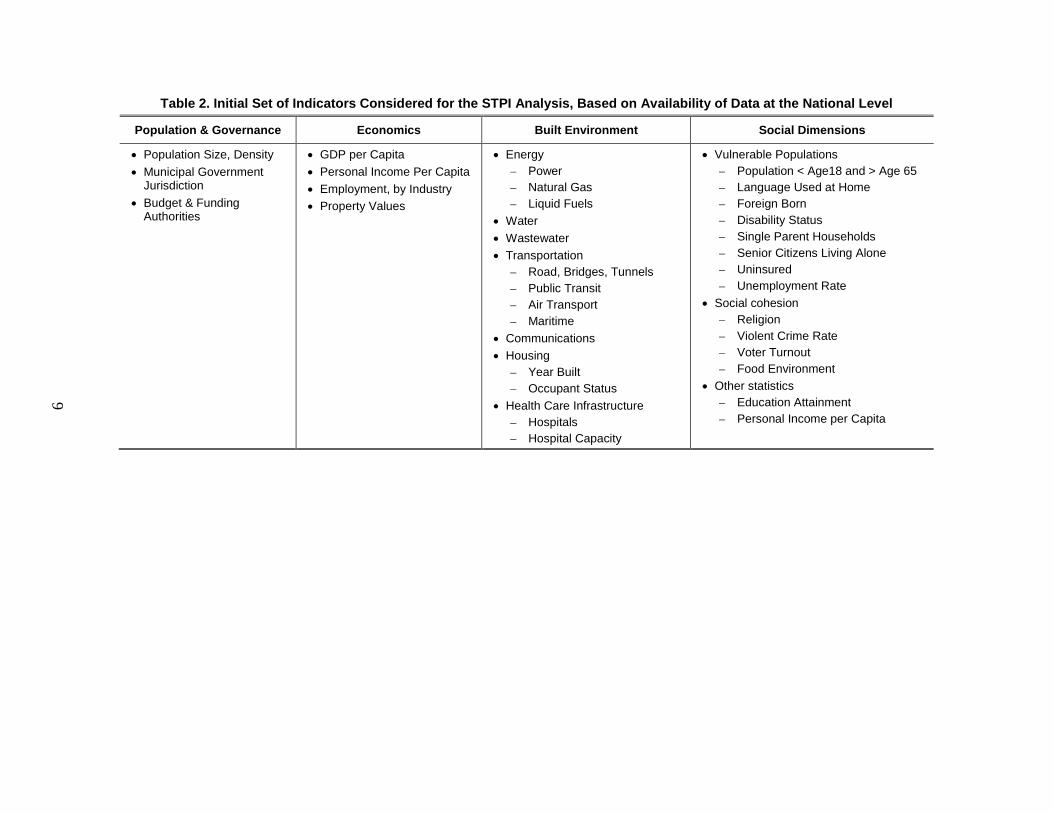
Table 2. Initial Set of Indicators Considered for the STPI Analysis, Based on Availability of Data at the National Level
Population & Governance Economics Built Environment Social Dimensions
• Population Size, Density • Municipal Government
Jurisdiction • Budget & Funding
Authorities
• GDP per Capita • Personal Income Per Capita • Employment, by Industry • Property Values
• Energy – Power – Natural Gas – Liquid Fuels
• Water • Wastewater • Transportation
– Road, Bridges, Tunnels – Public Transit – Air Transport – Maritime
• Communications • Housing
– Year Built – Occupant Status
• Health Care Infrastructure – Hospitals – Hospital Capacity
• Vulnerable Populations – Population < Age18 and > Age 65 – Language Used at Home – Foreign Born – Disability Status – Single Parent Households – Senior Citizens Living Alone – Uninsured – Unemployment Rate
• Social cohesion – Religion – Violent Crime Rate – Voter Turnout – Food Environment
• Other statistics – Education Attainment – Personal Income per Capita
10
B. Identifying Indicators for Population and Governance At a conceptual level, governance is related to “the processes of interaction and
decision-making among the actors involved in a collective problem that lead to the creation, reinforcement, or reproduction of social norms and institutions” (Hufty 2011, 405). The jurisdiction and governance dimension attempts to capture relevant characteristics of the level of authority (city, district, county, state, etc.) at which resources are allocated and services are provided and accessed. The authority to allocate funds and personnel is considered a proxy for decision-making authority.
To better understand how communities organize for resilience, we analyzed the emergency management of five city governments. The examples chosen were—one major metropolitan county (Miami-Dade County, Florida), two medium-sized cities (Tucson, Arizona, and Iowa City, Iowa) and two small cities (Fairfax, Virginia, and Hialeah, Florida). The emergency management comparison indicates that governance structures for emergency management were strongly community and context dependent. Thus, defining standard structure or set of indicators or metrics would likely fail to characterize the resilience capacity attributed to governance structures of local governments. Recognizing the need for an examination of the roles of governance in supporting resilience policy planning, identification of management and governance roles and policies are addressed in the case studies. Indicators for population size and density are available, and are included in Appendix A.
C. Identifying Indicators for Built Environment, Social Dimensions, and Economics Built environment, social dimensions, and economic development can be considered
static phenomena for measurement purposes, representing the current conditions on which resilience planning and implementation depends.
Built environment resilience includes both the physical infrastructure systems themselves, such as housing stock, miles of roadway and pipelines, and energy and transportation hub structures, and the interdependence of those systems, which impact their ability to become functionally operational after a disaster event.
Community resilience depends on citizen participation and the functional needs of the community. Consequently, the social dimensions of this framework attempts to characterize the vulnerable population of the community (i.e., those that most need post-disaster support and services but might have the most difficulty accessing them). Citizen participation is characterized by community engagement in formal organizations and processes such as religious groups and electoral processes. Research indicates that three interconnected areas of citizen participation—who participates and why, how organizations and other engagement avenues affect participation, and the effects of
11
participation on community conditions—explain the nature and extent of grass-roots participation in hazard mitigation and resilience efforts (Norris et al. 2008). The variables listed under social dimensions attempt to capture—directly or as proxies—these attributes of a community.
The economic development component of community resilience encompasses economic growth, stability of livelihoods, and equitable distribution of income and assets within populations. Research has shown that community resilience depends on the volume of economic resources accessible to a community as well as the diversity and distribution of these resources (Norris et al. 2008). Dependence on a narrow range of natural resources can increase variance in incomes and decrease social resilience. In addition, poor communities are often not only at greater risk for disaster-related damage, but also less successful in mobilizing support and recovering from disasters.
D. Community Characteristics and Resilience Indicators Appendix A provides a list of characteristics and indicators associated with the four
dimensions in the conceptual framework—population (but not governance), economics, built environment, and social dimensions—for which data were available in a form that could be used to characterize a community.

13
2. Identifying Candidate Communities
Using national data sources, a preliminary set of 14 candidate communities were identified for characterizing through the selected dimensions and indicators. The selection criteria were intended to aid in the selection of communities with geographic, hazard, social, and economic diversity.
The goal of Part I of the study was to identify data originating from publicly available federal data sources to provide quantitative data for the four dimensions of resilience. For example, communities that share similar hazard profiles, geographic region, population scale, economic profile, or demographic profile could be considered categories for potential study.
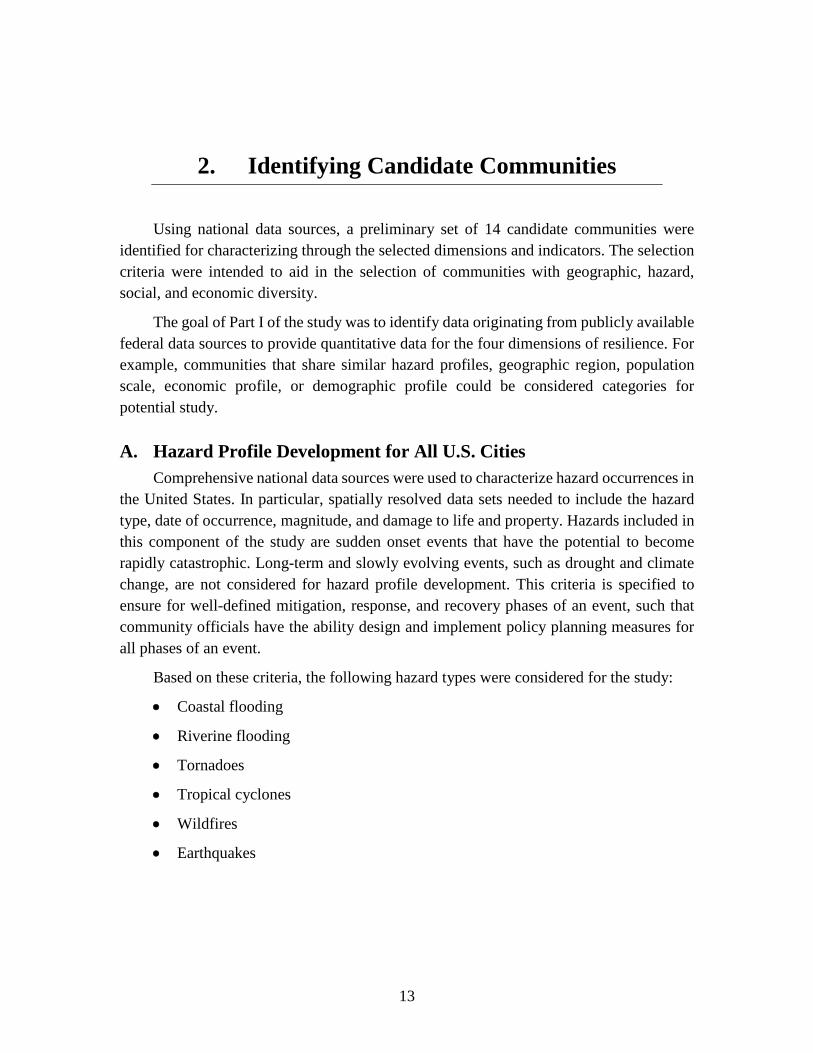
A. Hazard Profile Development for All U.S. Cities Comprehensive national data sources were used to characterize hazard occurrences in
the United States. In particular, spatially resolved data sets needed to include the hazard type, date of occurrence, magnitude, and damage to life and property. Hazards included in this component of the study are sudden onset events that have the potential to become rapidly catastrophic. Long-term and slowly evolving events, such as drought and climate change, are not considered for hazard profile development. This criteria is specified to ensure for well-defined mitigation, response, and recovery phases of an event, such that community officials have the ability design and implement policy planning measures for all phases of an event.
Based on these criteria, the following hazard types were considered for the study:
• Coastal flooding
• Riverine flooding
• Tornadoes
• Tropical cyclones
• Wildfires
• Earthquakes
14
The primary data sources used to extract spatially resolved data for occurrence of these hazards were:
• NOAA National Climatic Data Center (NCDC) Storm Event Database (NOAA NDCD 2015),
• United States Department of Agriculture (USDA) Forest Service’s Spatial Wildfire Occurrence Data for the United States (Short 2013), and
• Department of the Interior, United States Geological Survey (USGS) Advanced National Seismic System Comprehensive Catalog for Earthquake Events (USGS 2015b).
The spatially resolved hazard data was used to develop an across-hazard profile of regions, and subsequently communities, that experience the most frequent occurrences of the hazard types selected for this study. The steps in the data analysis are described in the subsections that follow. Appendix B provides data extraction and processing details.
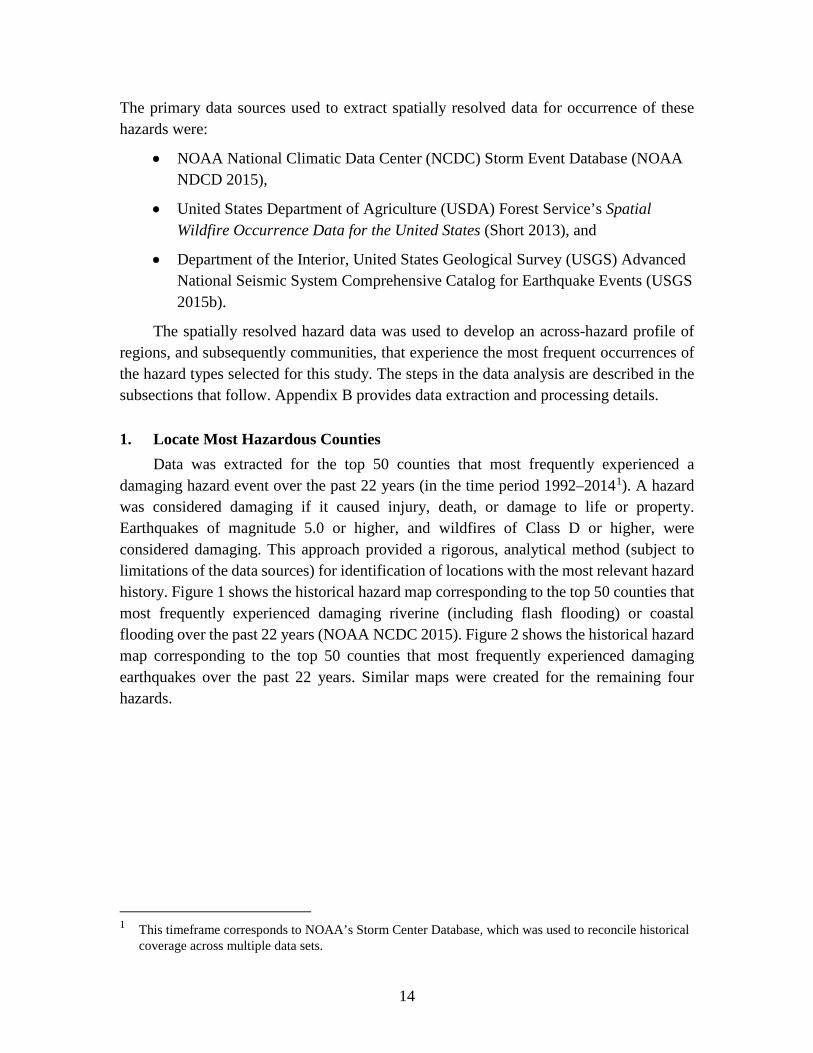
1. Locate Most Hazardous Counties Data was extracted for the top 50 counties that most frequently experienced a
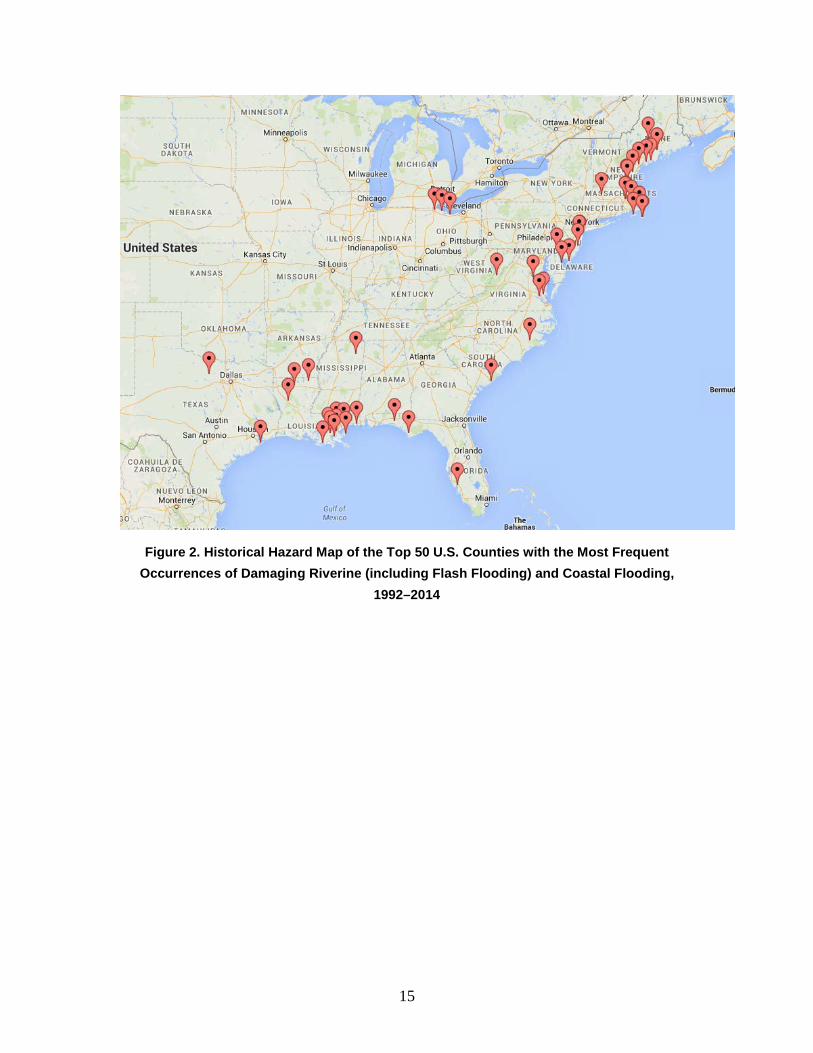
damaging hazard event over the past 22 years (in the time period 1992–20141). A hazard was considered damaging if it caused injury, death, or damage to life or property. Earthquakes of magnitude 5.0 or higher, and wildfires of Class D or higher, were considered damaging. This approach provided a rigorous, analytical method (subject to limitations of the data sources) for identification of locations with the most relevant hazard history. Figure 1 shows the historical hazard map corresponding to the top 50 counties that most frequently experienced damaging riverine (including flash flooding) or coastal flooding over the past 22 years (NOAA NCDC 2015). Figure 2 shows the historical hazard map corresponding to the top 50 counties that most frequently experienced damaging earthquakes over the past 22 years. Similar maps were created for the remaining four hazards.
1 This timeframe corresponds to NOAA’s Storm Center Database, which was used to reconcile historical
coverage across multiple data sets.
15
Figure 2. Historical Hazard Map of the Top 50 U.S. Counties with the Most Frequent
Occurrences of Damaging Riverine (including Flash Flooding) and Coastal Flooding, 1992–2014
16
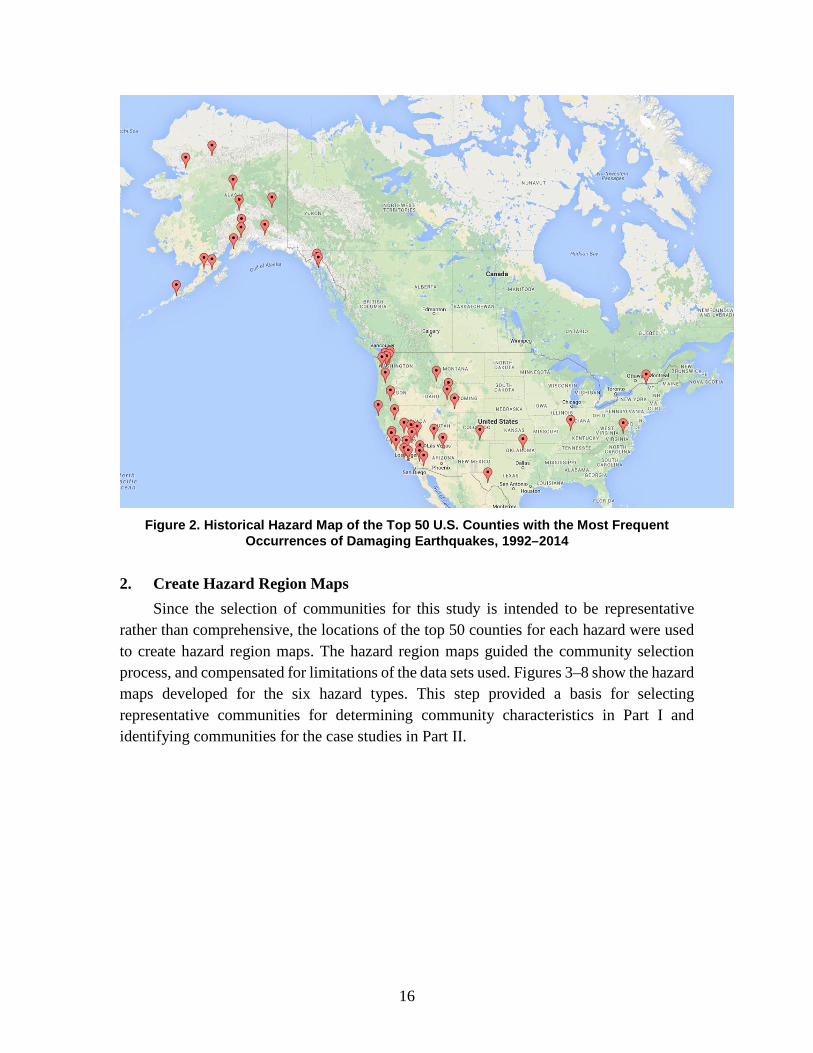
Figure 2. Historical Hazard Map of the Top 50 U.S. Counties with the Most Frequent
Occurrences of Damaging Earthquakes, 1992–2014
2. Create Hazard Region Maps Since the selection of communities for this study is intended to be representative
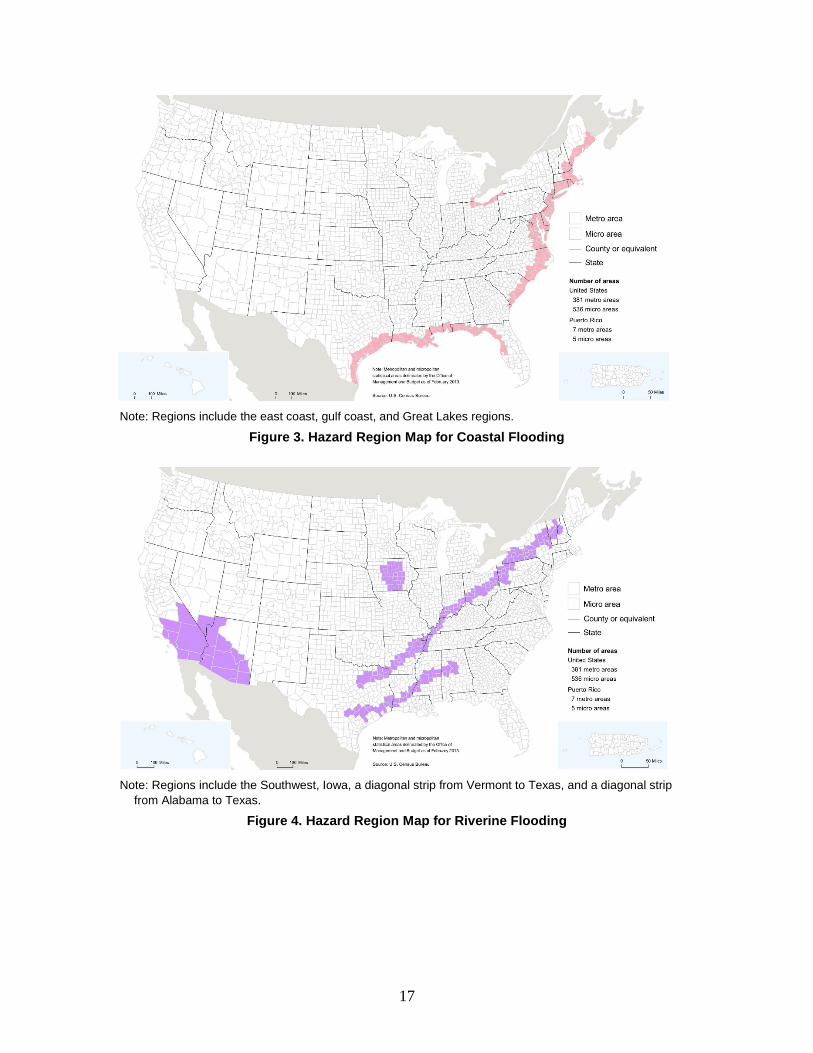
rather than comprehensive, the locations of the top 50 counties for each hazard were used to create hazard region maps. The hazard region maps guided the community selection process, and compensated for limitations of the data sets used. Figures 3–8 show the hazard maps developed for the six hazard types. This step provided a basis for selecting representative communities for determining community characteristics in Part I and identifying communities for the case studies in Part II.
17
Note: Regions include the east coast, gulf coast, and Great Lakes regions.
Figure 3. Hazard Region Map for Coastal Flooding
Note: Regions include the Southwest, Iowa, a diagonal strip from Vermont to Texas, and a diagonal strip
from Alabama to Texas.
Figure 4. Hazard Region Map for Riverine Flooding
18
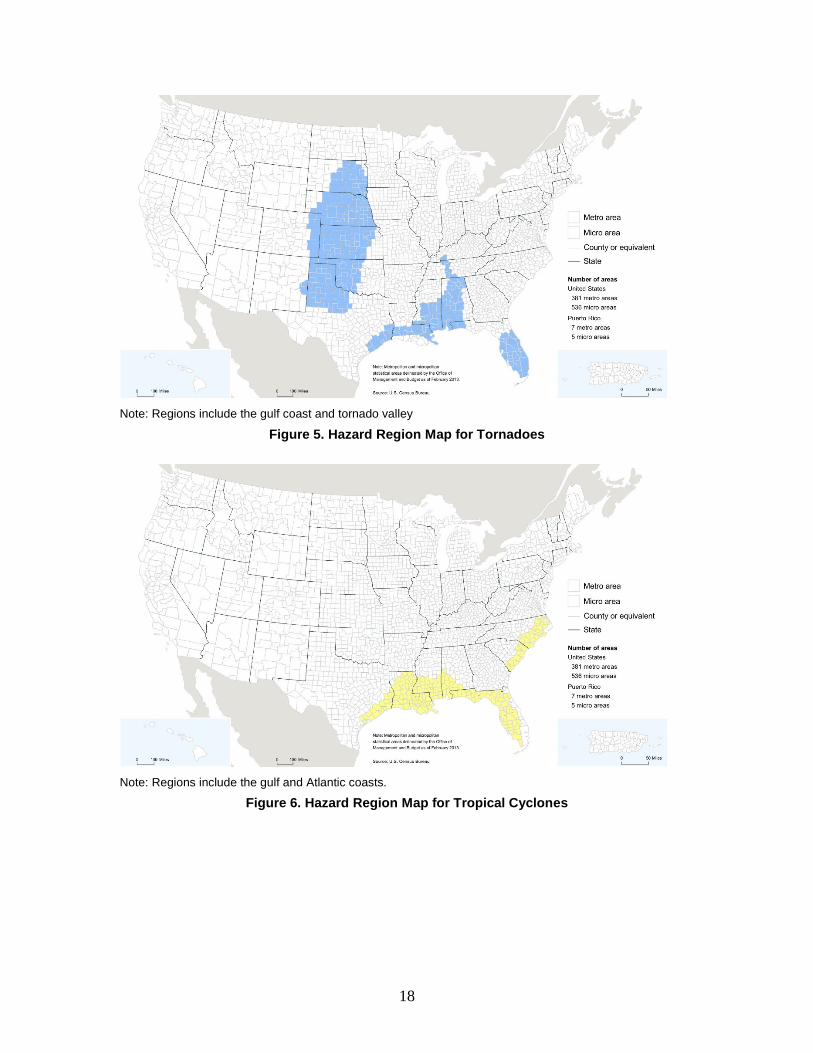
Note: Regions include the gulf coast and tornado valley
Figure 5. Hazard Region Map for Tornadoes
Note: Regions include the gulf and Atlantic coasts.
Figure 6. Hazard Region Map for Tropical Cyclones
19
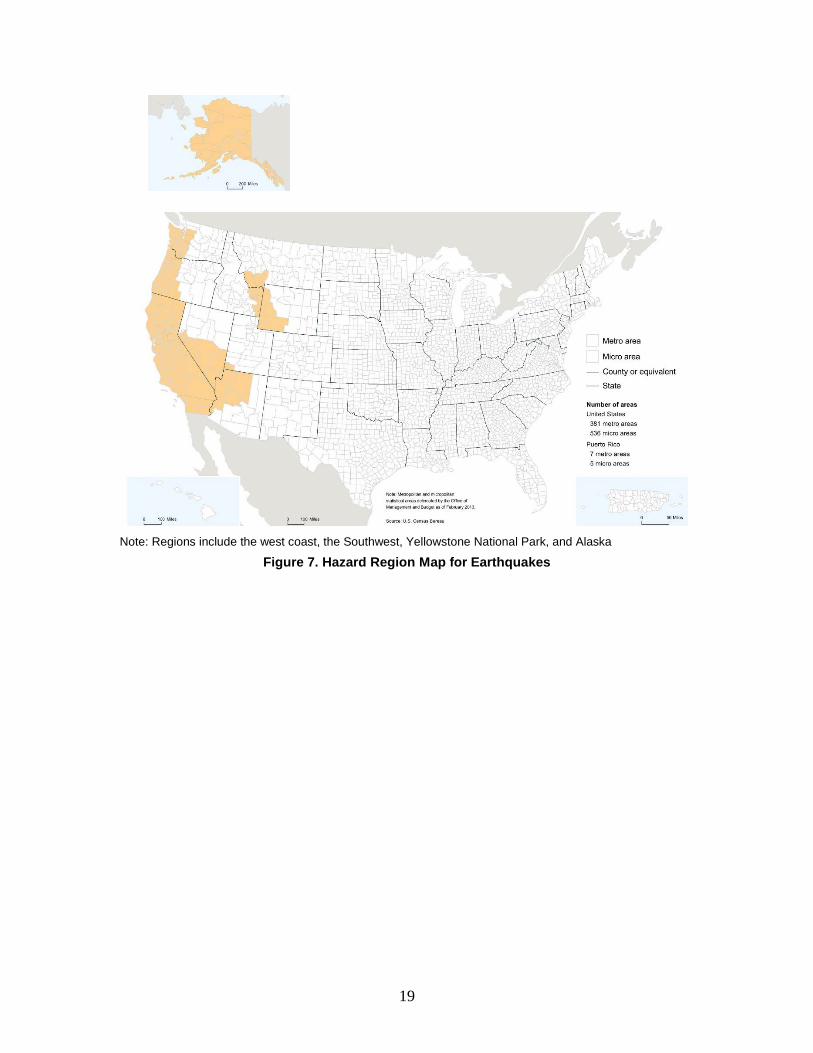
Note: Regions include the west coast, the Southwest, Yellowstone National Park, and Alaska
Figure 7. Hazard Region Map for Earthquakes
20
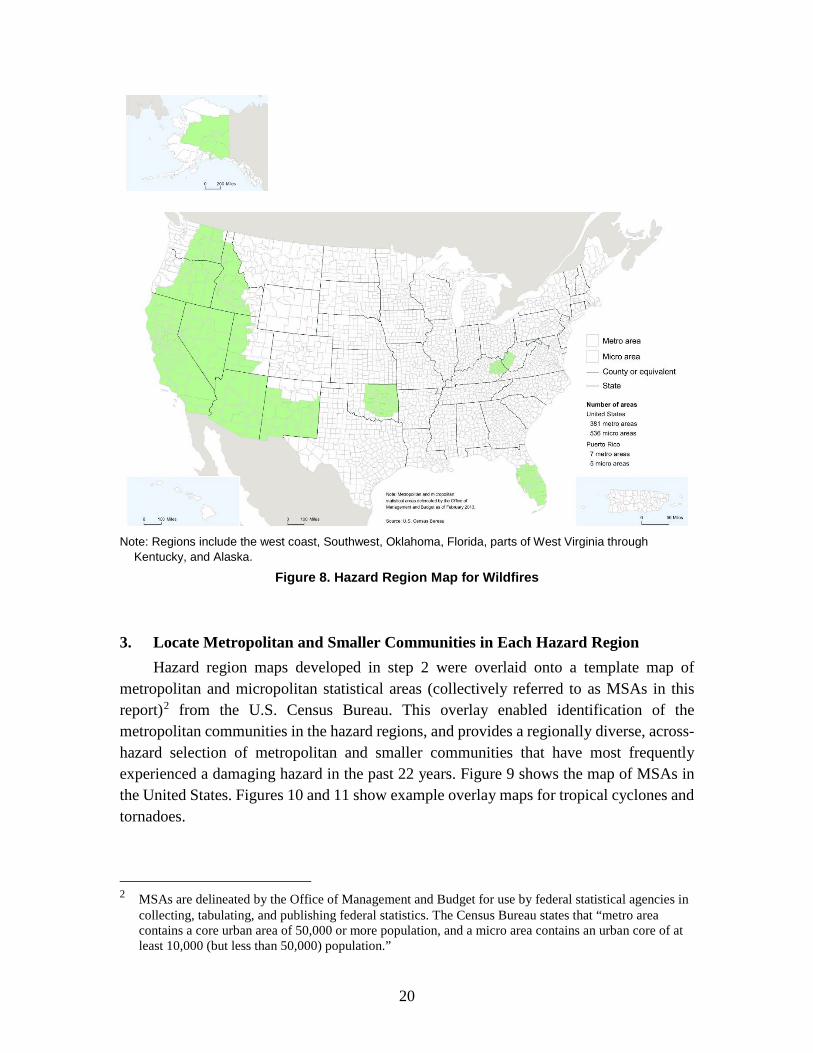
Note: Regions include the west coast, Southwest, Oklahoma, Florida, parts of West Virginia through
Kentucky, and Alaska.
Figure 8. Hazard Region Map for Wildfires
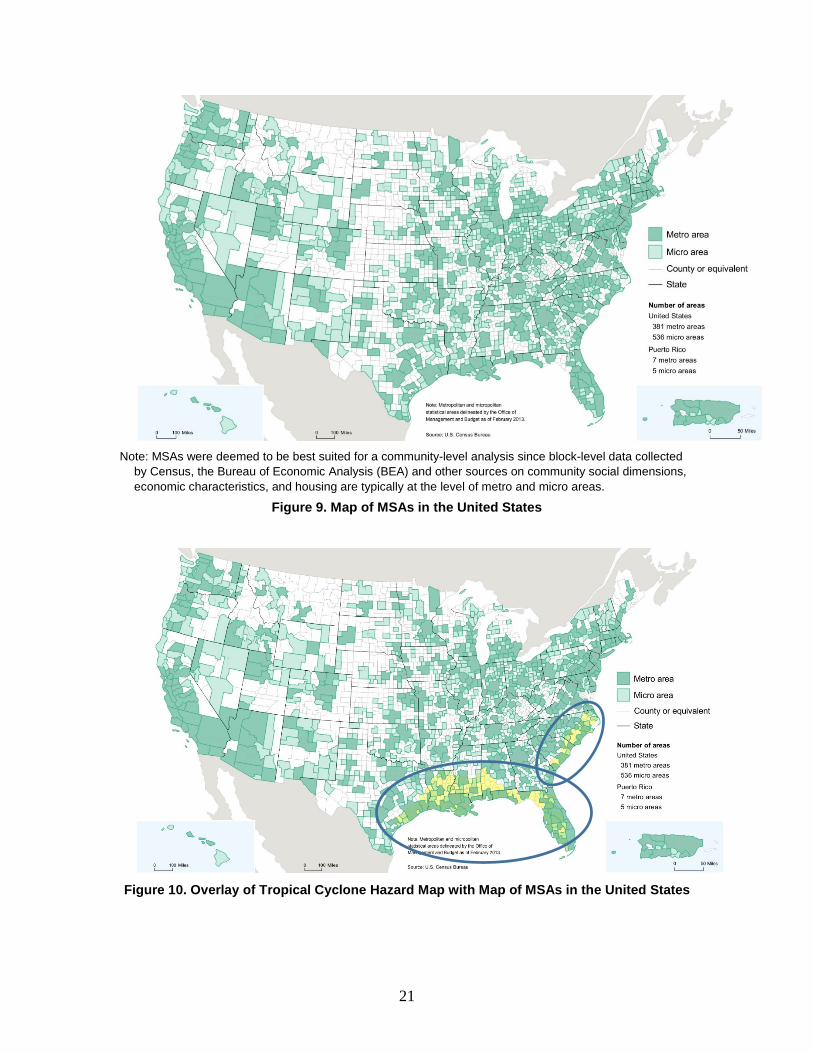
3. Locate Metropolitan and Smaller Communities in Each Hazard Region Hazard region maps developed in step 2 were overlaid onto a template map of
metropolitan and micropolitan statistical areas (collectively referred to as MSAs in this report)2 from the U.S. Census Bureau. This overlay enabled identification of the metropolitan communities in the hazard regions, and provides a regionally diverse, across-hazard selection of metropolitan and smaller communities that have most frequently experienced a damaging hazard in the past 22 years. Figure 9 shows the map of MSAs in the United States. Figures 10 and 11 show example overlay maps for tropical cyclones and tornadoes.
2 MSAs are delineated by the Office of Management and Budget for use by federal statistical agencies in
collecting, tabulating, and publishing federal statistics. The Census Bureau states that “metro area contains a core urban area of 50,000 or more population, and a micro area contains an urban core of at least 10,000 (but less than 50,000) population.”
21
Note: MSAs were deemed to be best suited for a community-level analysis since block-level data collected
by Census, the Bureau of Economic Analysis (BEA) and other sources on community social dimensions, economic characteristics, and housing are typically at the level of metro and micro areas.
Figure 9. Map of MSAs in the United States
Figure 10. Overlay of Tropical Cyclone Hazard Map with Map of MSAs in the United States
22
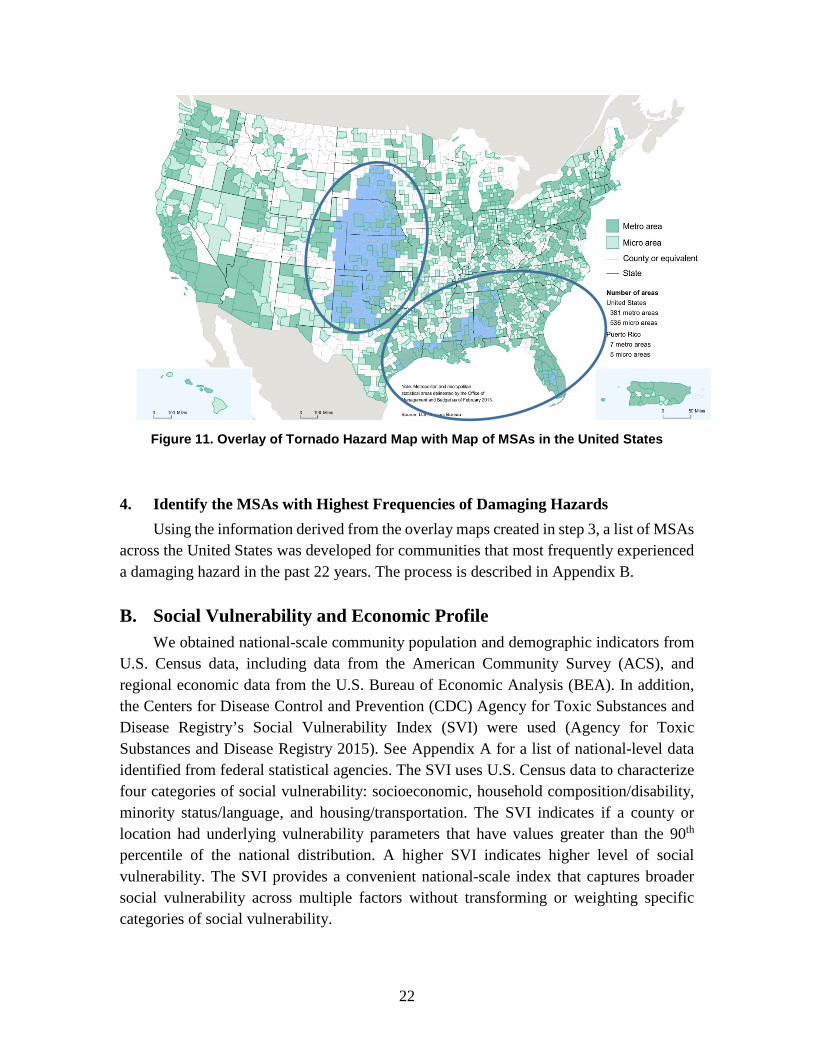
Figure 11. Overlay of Tornado Hazard Map with Map of MSAs in the United States
4. Identify the MSAs with Highest Frequencies of Damaging Hazards Using the information derived from the overlay maps created in step 3, a list of MSAs
across the United States was developed for communities that most frequently experienced a damaging hazard in the past 22 years. The process is described in Appendix B.
B. Social Vulnerability and Economic Profile We obtained national-scale community population and demographic indicators from
U.S. Census data, including data from the American Community Survey (ACS), and regional economic data from the U.S. Bureau of Economic Analysis (BEA). In addition, the Centers for Disease Control and Prevention (CDC) Agency for Toxic Substances and Disease Registry’s Social Vulnerability Index (SVI) were used (Agency for Toxic Substances and Disease Registry 2015). See Appendix A for a list of national-level data identified from federal statistical agencies. The SVI uses U.S. Census data to characterize four categories of social vulnerability: socioeconomic, household composition/disability, minority status/language, and housing/transportation. The SVI indicates if a county or location had underlying vulnerability parameters that have values greater than the 90th percentile of the national distribution. A higher SVI indicates higher level of social vulnerability. The SVI provides a convenient national-scale index that captures broader social vulnerability across multiple factors without transforming or weighting specific categories of social vulnerability.
23
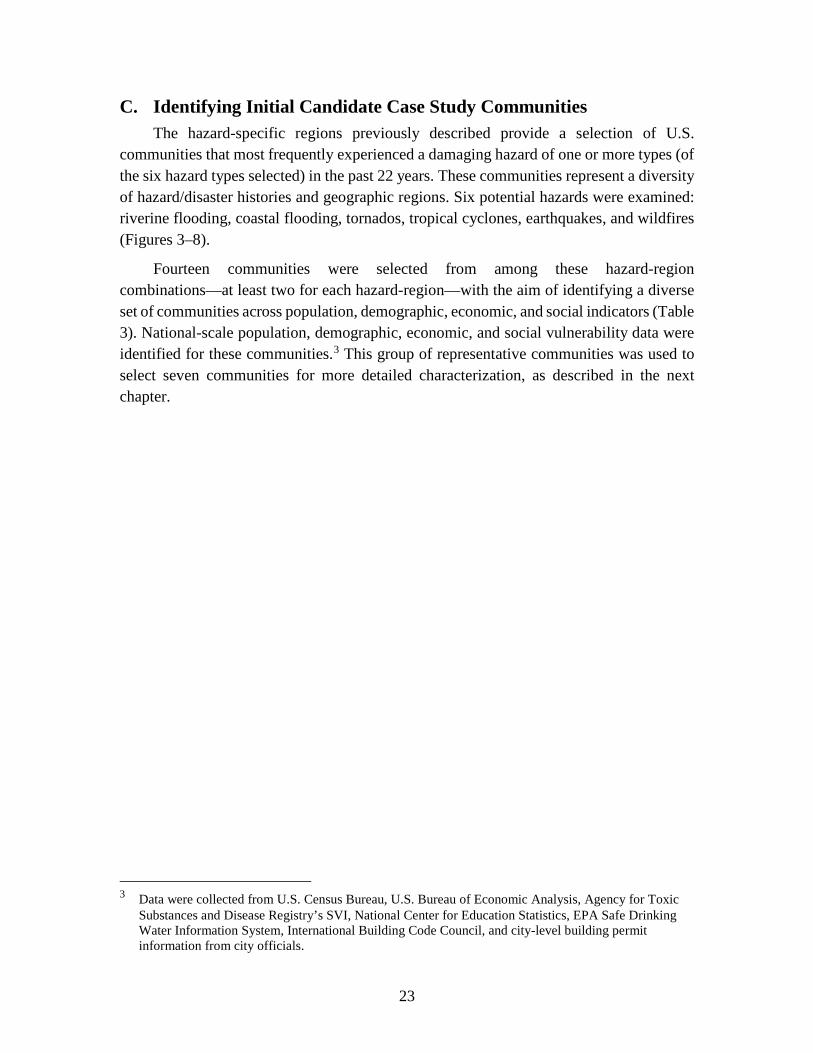
C. Identifying Initial Candidate Case Study Communities The hazard-specific regions previously described provide a selection of U.S.
communities that most frequently experienced a damaging hazard of one or more types (of the six hazard types selected) in the past 22 years. These communities represent a diversity of hazard/disaster histories and geographic regions. Six potential hazards were examined: riverine flooding, coastal flooding, tornados, tropical cyclones, earthquakes, and wildfires (Figures 3–8).
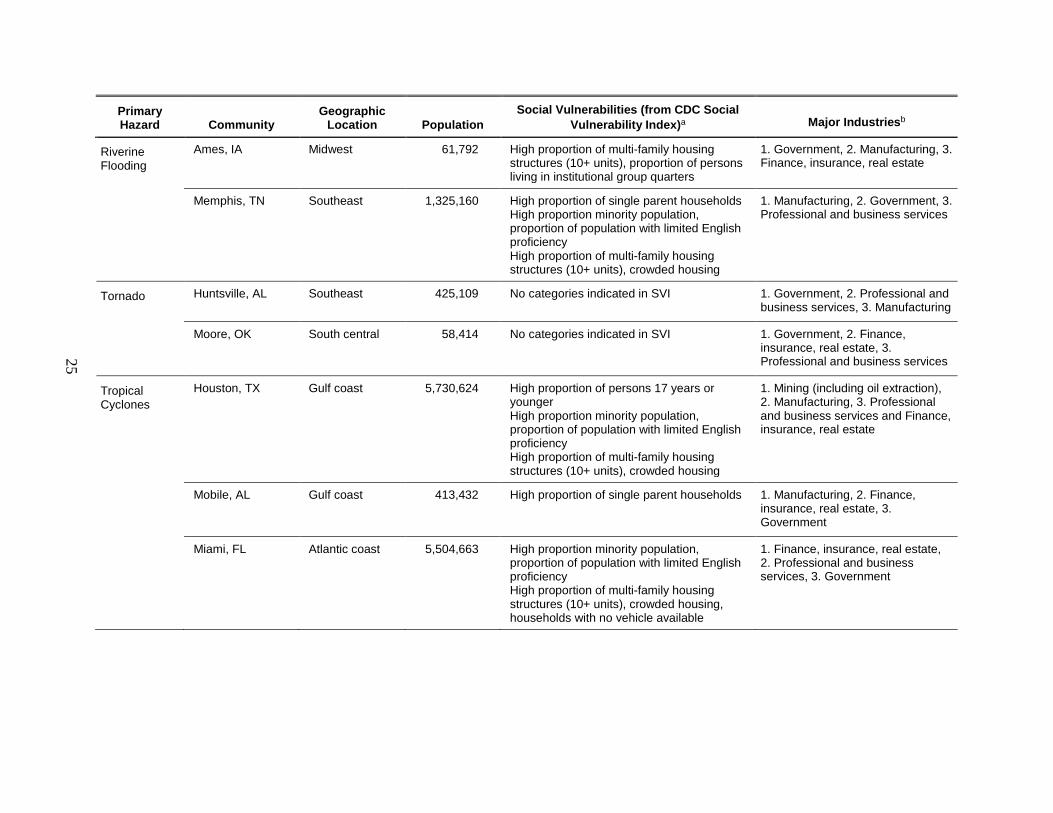
Fourteen communities were selected from among these hazard-region combinations—at least two for each hazard-region—with the aim of identifying a diverse set of communities across population, demographic, economic, and social indicators (Table 3). National-scale population, demographic, economic, and social vulnerability data were identified for these communities.3 This group of representative communities was used to select seven communities for more detailed characterization, as described in the next chapter.
3 Data were collected from U.S. Census Bureau, U.S. Bureau of Economic Analysis, Agency for Toxic
Substances and Disease Registry’s SVI, National Center for Education Statistics, EPA Safe Drinking Water Information System, International Building Code Council, and city-level building permit information from city officials.
24
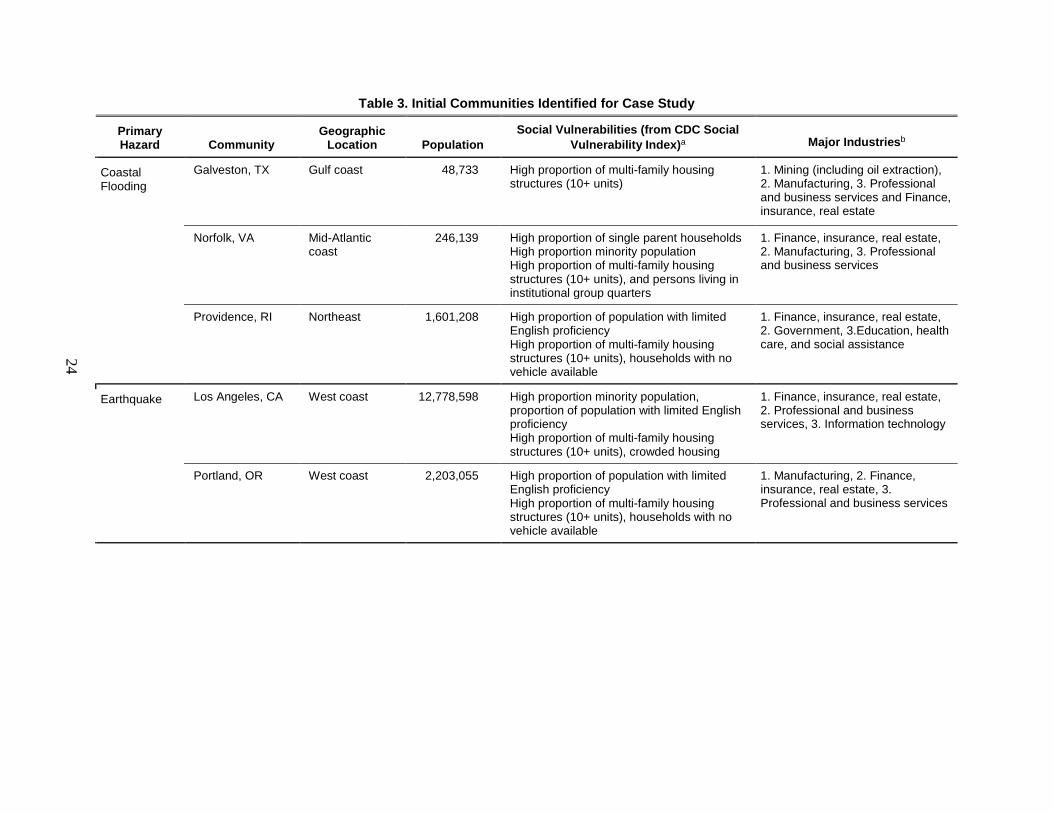
Table 3. Initial Communities Identified for Case Study
Primary Hazard Community
Geographic Location Population
Social Vulnerabilities (from CDC Social Vulnerability Index)a Major Industriesb
Coastal Flooding
Galveston, TX Gulf coast 48,733 High proportion of multi-family housing structures (10+ units)
1. Mining (including oil extraction), 2. Manufacturing, 3. Professional and business services and Finance, insurance, real estate
Norfolk, VA Mid-Atlantic coast
246,139 High proportion of single parent households High proportion minority population High proportion of multi-family housing structures (10+ units), and persons living in institutional group quarters
1. Finance, insurance, real estate, 2. Manufacturing, 3. Professional and business services
Providence, RI Northeast 1,601,208 High proportion of population with limited English proficiency High proportion of multi-family housing structures (10+ units), households with no vehicle available
1. Finance, insurance, real estate, 2. Government, 3.Education, health care, and social assistance
Earthquake Los Angeles, CA West coast 12,778,598 High proportion minority population, proportion of population with limited English proficiency High proportion of multi-family housing structures (10+ units), crowded housing
1. Finance, insurance, real estate, 2. Professional and business services, 3. Information technology
Portland, OR West coast 2,203,055 High proportion of population with limited English proficiency High proportion of multi-family housing structures (10+ units), households with no vehicle available
1. Manufacturing, 2. Finance, insurance, real estate, 3. Professional and business services
25
Primary Hazard Community
Geographic Location Population
Social Vulnerabilities (from CDC Social Vulnerability Index)a Major Industriesb
Riverine Flooding
Ames, IA Midwest 61,792 High proportion of multi-family housing structures (10+ units), proportion of persons living in institutional group quarters
1. Government, 2. Manufacturing, 3. Finance, insurance, real estate
Memphis, TN Southeast 1,325,160 High proportion of single parent households High proportion minority population, proportion of population with limited English proficiency High proportion of multi-family housing structures (10+ units), crowded housing
1. Manufacturing, 2. Government, 3. Professional and business services
Tornado Huntsville, AL Southeast 425,109 No categories indicated in SVI 1. Government, 2. Professional and business services, 3. Manufacturing
Moore, OK South central 58,414 No categories indicated in SVI 1. Government, 2. Finance, insurance, real estate, 3. Professional and business services
Tropical Cyclones
Houston, TX Gulf coast 5,730,624 High proportion of persons 17 years or younger High proportion minority population, proportion of population with limited English proficiency High proportion of multi-family housing structures (10+ units), crowded housing
1. Mining (including oil extraction), 2. Manufacturing, 3. Professional and business services and Finance, insurance, real estate
Mobile, AL Gulf coast 413,432 High proportion of single parent households 1. Manufacturing, 2. Finance, insurance, real estate, 3. Government
Miami, FL Atlantic coast 5,504,663 High proportion minority population, proportion of population with limited English proficiency High proportion of multi-family housing structures (10+ units), crowded housing, households with no vehicle available
1. Finance, insurance, real estate, 2. Professional and business services, 3. Government
26
Primary Hazard Community
Geographic Location Population
Social Vulnerabilities (from CDC Social Vulnerability Index)a Major Industriesb
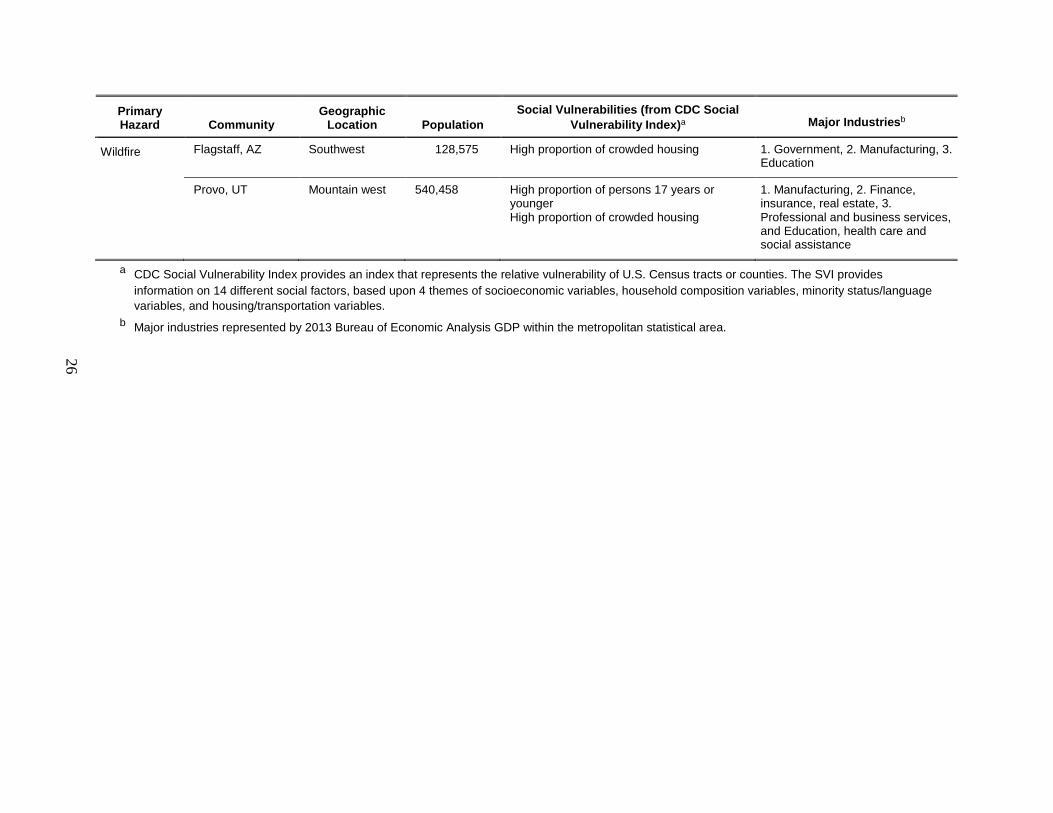
Wildfire Flagstaff, AZ Southwest 128,575 High proportion of crowded housing 1. Government, 2. Manufacturing, 3. Education
Provo, UT Mountain west 540,458 High proportion of persons 17 years or younger High proportion of crowded housing
1. Manufacturing, 2. Finance, insurance, real estate, 3. Professional and business services, and Education, health care and social assistance
a CDC Social Vulnerability Index provides an index that represents the relative vulnerability of U.S. Census tracts or counties. The SVI provides information on 14 different social factors, based upon 4 themes of socioeconomic variables, household composition variables, minority status/language variables, and housing/transportation variables.
b Major industries represented by 2013 Bureau of Economic Analysis GDP within the metropolitan statistical area.
27
3. Resilience-Relevant Attributes as a Basis for Selecting Candidate Case Study Communities
The 14 candidate communities were evaluated for each community’s experiences with hazard events and designing and implementing resilience policy measure. Selection criteria for the following communities were as follows:
• Primary criteria: candidate communities should be representative of multiple U.S. geographic regions and hazards, and the four dimensions.
• Secondary criteria: candidate communities should have a unique or recent hazard event or history, economic composition (such as sector-specific concentration of economic activity), social vulnerability, or notable efforts or activities that aim to increase community resilience.
Based on these, the following seven communities were identified as candidates for further characterization: Los Angeles, California; Norfolk, Virginia; Flagstaff, Arizona; Galveston, Texas; Huntsville, Alabama; Providence, Rhode Island; and Ames, Iowa. This section provides an overview of each of these seven communities. Appendix C contains tables of indicators and SVI ratings. A description of each community is provided to supplement the information given in Table 3 and Appendix C.
A. Los Angeles, California Los Angeles has a population of nearly 3.9 million people. Los Angeles’s SVI value
is 4, representing potential social vulnerabilities due to a large minority population, high proportion of households where English is not the primary language, a high proportion of multi-family housing, and a high proportion of housing with more people than rooms available. The Los Angeles regional economy is the second largest in the country ($827 billion GDP), and the city maintains an annual $8.1 billion budget. The City of Los Angeles and the Greater Los Angeles region may experience earthquakes, wildfires, flooding, mudslides, and tsunamis. Notable events include the 1994 Northridge earthquake (6.7 magnitude) and major wildfires such as the 2009 Station Fire (161,000 acres, 209 structures, and 2 deaths) and the 2006 Day Fire (163,000 acres, 11 structures).
The city has taken several notable actions to increase community resilience. In December 2014, the mayor issued Resilience by Design, which identifies resilience policy gaps and actions to address them. The city engaged the United States Geological Survey (USGS) to provide a scientific basis to address the report issued by the mayor. The Los
28
Angeles County Department of Public Health Emergency Preparedness and Response Program, in coordination with RAND, University of California at Los Angeles, and the Robert Wood Johnson Foundation, designed and implemented a study that examined 16 communities within Los Angeles county that were assigned to an experimental resilience training group or a control group. The report provides outcome indicators to measure changes in community resilience due to experimental interventions (Eisenman et al 2014).
B. Flagstaff, Arizona Flagstaff is a rural-suburban community with a population of nearly 69,000 residents.
This population is well-educated with nearly 91% and 42% of the population attaining high school level education and bachelor’s degrees, respectively. The city has a SVI index of 1, representing potential vulnerabilities related to a high proportion of housing with more people than rooms available. Commercial and residential building stock is relatively new, with only 8% of the housing constructed before 1960, and current permit data suggesting little new development (2013–14 saw a 9% reduction in permits issued). The City of Flagstaff and surrounding region have a $5.2 billion GDP, of which 28% is government services. Manufacturing; finance/real estate; education and health care; and arts, recreation and tourism each represent 11–14% of economic activity. The annual city budget is $238 million.
The city is located in a mountainous and forested region of Arizona, and is surrounded by Coconino National Forest. Due to the dry local climate and forested environment, Flagstaff’s primary hazard is wildfires with periodic flash flooding. The Slide Fire in 2014 (21,000 acres, cut off road between Flagstaff and Sedona) and Schultz Fire in 2010 (15,000 acres, near Flagstaff in Coconino National Forest) are recent fires in proximity to Flagstaff that presented significant risks to the city, but ultimately did not result in major losses in the urban and suburban developed area.
Flagstaff resilience planning is based on their primary hazard (wildfire) and the diversity of land owners and managers in the region. The city land is managed by private owners and municipal government. Forested areas outside the city are generally managed by the U.S. Forest Service (Coconino National Forest), the National Park Service manages two national monuments in the greater Flagstaff region (Walnut Canyon and Sunset Crater), the Arizona State Land Department manages nearby State trust lands, and tribal government manages the land of the Navajo Nation Reservation northeast of the city. The diverse set of stakeholders and land managers in the greater Flagstaff region presents a unique challenge for designing and implementing land use policies to support community resilience goals.
The City of Flagstaff has taken steps to address resilience in the city. Notable actions include a city resilience and preparedness study (City of Flagstaff 2012), which includes information on regional climate change impacts, issuing local bonds to fund wildfire
29
mitigation activities on local and federal lands (Vock 2014), and partnerships with local fire authorities and community associations for joint wildfire mitigation planning. (e.g., Greater Flagstaff Forests Partnership and Ponderosa Fire Advisory Council 2005).
C. Norfolk, Virginia Norfolk has a mid-sized urban city population of approximately 246,000. Norfolk’s
SVI value is 5, which indicates potential for social vulnerability due to a high proportion of single-parent households, a large minority population, and a high proportion of apartment-style housing, a low proportion of the population with vehicle access, and a high proportion of individuals living in institutionalized quarters. Building stock in Norfolk is relatively old with nearly half of buildings constructed before 1959 and few structures replaced on an annual basis (800–900 new starts per year in 2013–14). Norfolk is a major military city and is home to Naval Station Norfolk, which is a major employment center and land manager for Norfolk’s coastal lands. With a GDP of $88.6 billion in the MSA, government services represent nearly a third of the region’s economic activity. The city government’s annual budget is $1.1 billion.
Norfolk primarily faces coastal and riverine flooding hazards that can be associated with tropical cyclone hazards. Hurricane Isabel (2003, $1.9 billion damage) resulted in the State of Virginia issuing mandatory evacuation orders, the U.S. Navy moving ships to sea to avoid potential damage, and coastal flooding throughout coastal Virginia (including Norfolk), and riverine flooding throughout the state. Norfolk is projected to be exposed to significant sea-level rise through the combination of sea-level rise with local land subsidence. (Eggleston and Pope 2013; Sallenger, Doran, and Howd 2012). Low-lying assets, including many military installations and assets, are expected to be directly affected without mitigating actions.
The City of Norfolk is taking several steps to address these risks. Norfolk is taking into consideration climate change impacts such as sea-level rise in the update to the city’s general plan (NRDC 2011). The city also plans to conduct a coastal flooding study that identifies mitigation opportunities (City of Norfolk, Virginia 2015b).
D. Galveston, Texas The City of Galveston has a population of nearly 49,000, whereas neighboring
Houston has a population of 2.2 million. A case study of Galveston would also consider the regional influences of the City of Houston and economic activity within the greater Houston area. Galveston has a SVI value of 1, representing potential vulnerabilities related to a high proportion of housing with more people than rooms available. The city is part of the Houston metropolitan area, which maintains a $517 billion GDP, primarily from mining, oil, gas (23%), and manufacturing (22%). The City of Galveston’s economic activity is based on wholesale and retail trade (50%), health care services (24%) and hotels
30
and accommodation (9%) (Resilient Rhode Island Act of 2014 2015). The city maintains an annual budget of $108 million.
Galveston is subject to hurricane and other tropical cyclone hazard events, due to its location as a barrier island. The September 1900 Galveston hurricane is recognized as the deadliest disaster in U.S. history. The category 4 hurricane resulted in 6,000–12,000 deaths and the destruction of over 3,600 structures (NOAA National Ocean Service 2015). More recently in 2008, Hurricane Ike and the associated storm surge, coastal inundation, and flooding, especially on the bay side of the island, caused significant property damage and an estimated 17 deaths (Zane et al. 2011). A review of public materials by the City of Galveston did not identify resilience activities. Recent efforts include a U.S. Global Change Research Program workshop on climate change preparedness and resilience held in October 2014 (Islam, Merrell, and Seitz 2010).
E. Providence, Rhode Island The City of Providence contains approximately 178,000 people, while the combined
city and county contains approximately 800,000 people. Providence County’s SVI value is 3, which represents potential vulnerabilities originating from the number of households where English is not the primary language, multi-family housing, and households with limited vehicle access. The economic activity of the region is dispersed across a large metropolitan area, which includes nearly all of Rhode Island and parts of southern Massachusetts (Bristol County). The Providence metropolitan statistical area maintains a GDP of $58 billion, which is primarily financial and real estate, government, and education and health care activity. The City of Providence maintains an annual budget of $678 million.
Providence is vulnerable to flooding and coastal inundation. A notable historical hazard mitigation effort was the construction of a hurricane flood barrier spanning the Providence River in 1966 to protect the city from storm surge and coastal flooding during hurricane events (Joukowsky Institute for Archaeology and the Ancient World 2015). The construction of the Fox Point Hurricane Barrier was included in the Flood Control Act of 1958, with the Federal Government contributing 70% of the cost, and state and local government contributing the remaining 30%. (City of Providence Rhode Island 2015a). More recently, the city of Providence’s Emergency Management Agency is working with the Northeast Disaster Recovery Information X-Change to develop the Rhode Island Business Alliance (City of Providence Rhode Island 2015b). The alliance is focused on promoting best business practices and identifying public-private collaboration opportunities to support local business disaster preparedness. At the state level, the Rhode Island State Legislature passed the Resilient Rhode Island Act of 2014 (2015). This act describes the state’s policy for climate change mitigation, vulnerability assessments to support local climate change resilience, designates the Department of Administration’s
31
Division of Statewide Planning as the coordination agency responsible for adaptation measures, and creates a state scientific advisory council to review climate change mitigation and adaptation programs.
F. Huntsville, Alabama Huntsville has a population of roughly 180,000. Huntsville’s SVI value is 0,
indicating minimal social vulnerability. The Huntsville metropolitan area’s GDP ($22.9 billion) is dominated by government services ($6.0 billion), professional and business services ($4.8 billion), and manufacturing ($3.3 billion). Huntsville is home to NASA’s Marshall Space Flight Center, which employs over 2,400 civil service employees and supports thousands more as NASA contractors (U.S. Office of Personnel Management 2015). The city’s FY 2015 budget ($514 million) and tax revenue for the same year ($197 million) both fall around the median for the selected communities.
In April 2011, northern and central Alabama experienced an outbreak of severe tornado events over the course of 4 days. On one of these days (April 27), the National Weather Service reported 39 tornadoes in the Huntsville Forecast Area, including EF4 and EF5 tornadoes (on the Enhanced Fujita [EF] scale) and peak winds of 210 mph. The entire outbreak, dubbed the Super Dixie Outbreak, resulted in 354 deaths (including 72 deaths from the EF5 tornado that hit Madison County, Alabama) and over $1 billion in damage throughout the southeastern United States (NOAA NWS 2015). The Huntsville-Madison County Emergency Management Agency lists thunderstorms, hazardous materials incidents, floods, and heat waves as other hazards of concern based on probability and impact (Madison County Emergency Management Agency 2015).
Following the 2011 tornado outbreak, the City of Huntsville has taken steps to prepare for future events relating to multiple hazards. The Cyber Huntsville Initiative and the Energy Huntsville Initiative state are intended to increase the resilience of Huntsville’s cyber infrastructure and energy infrastructure (Robertson 2011). One of the motivations for these initiatives is the extensive power outages that Huntsville experienced during the 2011 tornado outbreak. The City of Huntsville has also been proactive in reducing floodplain risks through the relocation of houses, the development of watershed models, and the acquisition and protection of flood prone areas (City of Huntsville, Alabama, 2015).
G. Ames, Iowa Ames has a population of about 61,000 people. It is predominantly a university town
with the Iowa State University being the main employer, and that affects many of Ames’ social and demographic characteristics, such as young median age of 23.8 years. Ames has a higher than average literacy rate, and over 97% of adults attain high school graduation or higher. Ames has a low level of social vulnerability with an SVI value of 2, representing potential vulnerabilities due to housing and transportation. Ames residential building stock
32
is relatively new with 80% of residential buildings constructed after 1960. Ames also has a high proportion of housing structures with 10+ units and a high proportion of institutionalized quarters. Ames is one of the top ten cities in the country where the highest percentage of residents walk to work, indicating the possibility of low vehicle ownership rates.
The City of Ames operates on a budget of $190 million. Ames is home of Iowa State University of Science and Technology, the U.S. Department of Agriculture’s National Animal Disease Center, Ames National Laboratory (which specializes in research related to materials, energy, and environment), and the main offices of the Iowa Department of Transportation. State and Federal Government institutions are the largest employers in Ames.
The primary natural hazards facing the city of Ames are riverine flooding and tornadoes, and flooding historically has been the more damaging event. The topography of the city and the surrounding area combine to create a floodplain in the center of the city. The regional hydrology concentrates precipitation in large, single rainfall events. In August 2010, 14 inches of rainfall over the course of 4 days led to one of the most costly natural disasters experienced by Ames. Iowa State University estimated the university experienced about $40–50 million in damage (Haas 2010). In response, the City of Ames commissioned a Flood Mitigation Study in 2011 and, with community input and participation, has implemented floodplain zoning restrictions and other mitigation strategies recommended by the study report (City of Ames 2014a; 2014b). The Climate Science program at Iowa State University has also conducted research into Climate Change Adaptation and Resilience using Ames as a case study (Anderson 2011).
33
4. Summary of Findings for Part 1
Four dimensions of community resilience-population and governance, economic development, built environment, and social dimensions-were used to evaluate and select communities with available data. Natural hazard exposure was treated as an exogenous factor that influences policy and investment decision-making within a community. The combination of exogenous natural hazard exposure with the endogenous community characteristics collectively describe the exposure and vulnerability, respectively, representing the risks posed by hazards to a community.
We next used the community resilience characteristics in combination with publicly available national-level data to identify patterns of community resilience characteristics that would support the selection of candidate communities for further study. This process aimed to select a diverse set of communities that represent diversity across hazard profile, social and economic characteristics, and built environment characteristics.
Data to characterize communities was lacking in some areas, but the available data was used to identify a diverse set of candidate case study communities. Community indicator data provided context on the candidate case study communities, however additional examination of governance, management and policy design processes is required to understand the connection between contextual factors and resilience planning and policy outcomes. Information from NOAA’s National Climactic Data Center, USGS’s Advanced National Seismic System Comprehensive Catalog for Earthquake Events, and U.S. Forest Service’s spatial hazard data for wildland fire hazards were used to identify of historical hazard events. Social and economic indicators were obtained from the U.S. Census Bureau and BEA, and integrated social vulnerability data was obtained from the CDC’s Social Vulnerability Index product. Data to support characterization of the built environment in communities was difficult to obtain. Most built environment data was owned and maintained by municipal governments and not readily available. Due to this challenge, data for all infrastructure and building types was not acquired. These data were sufficient to identify a preliminary set of communities that were diverse across hazard, social, and economic profiles. Additional examination of governance characteristics and resilience policies and programs is necessary to further refine the preliminary set of candidate case study communities. This examination is discussed in further detail in part 2 of the report.

35
Part 2: Case Studies of Community Resilience Policy and Planning Activities
The community case studies provide insights of ongoing resilience policy design and planning activities in three communities to illustrate how communities with different challenges are addressing resilience: Los Angeles, California; Flagstaff, Arizona; and Norfolk, Virginia. These three communities were selected from candidate communities identified in part 1 of the report, to address differences in hazards and community profiles. The community case studies describe the community resilience policy planning processes and implement approaches and programs to improve resilience. Observations, based on discussions with city officials, are presented here to set the stage for the case studies that follow.
Resilience efforts were seen to be relatively new for the three cities, and the case studies illustrate this. For example, Norfolk’s approach to resilience planning is in nascent stages, and provides examples of how a community is currently attempting to adapt best practices in community resilience to its own specific local challenges (such as the need for economic diversification to counter the long-term effect of sea-level rise).
At this point in time, the communities’ resilience initiatives are largely being planned and implemented as part of their hazard mitigation efforts. For example, the city of Flagstaff’s collaboration with the U.S. Forest Service in proactive forest management to reduce the risk of wildfire (the biggest natural hazard faced by the community and surrounding areas) is the community’s primary resilience focus; this initiative comprises actions taken by the city towards proactive forest health management to protect the community from long-term impacts of wildland fires.
Each case study provides a description of the role of the municipal departments involved. City staff supporting resilience planning and program implementation were observed to be incorporating resilience as a concept in existing job functions and responsibilities. Staff involved in resilience activities were located in the mayor’s office, the city manager’s office, and other city offices, or were elected officials. Norfolk is the only city currently with a new full-time resilience-focused position occupied by the city’s Chief Resilience Officer. However, in all cases, strong executive leadership or a champion was identified as the main motivation behind the community’s development or implementation of resilience plans.
Examples of programmatic efforts that have led to community-scale or regional hazard risk reduction are given. For example, Los Angeles’s work to reduce building
36
vulnerabilities to seismic hazards through mandatory retrofit policies is described in some detail to highlight the local policymaking process involved, and the ultimate decision to make certain building upgrades mandatory while opting to make other upgrades voluntary.
The case studies in Chapters 5, 6, and 7 identify municipal resilience planning and implementation of the three communities. The case studies are based on discussions with city officials and other stakeholders who had a role in planning and implementing resilience initiatives. Discussions included a broad perspective of outcomes of resilience-focused initiatives, aiming to highlight multiple policy-related outcomes including development and implementation of codes and standards. Other resilience outcomes considered include enhancing risk awareness, facilitating engagement with city stakeholders, enabling collaboration between entities that have historically operated in distinctly separate jurisdictions, providing community policy decision makers with objective information, and identifying budgetary support for resilience initiatives. The discussion topics are provided in Appendix D, and a list of contacts is provided in Appendix E. Discussions were supplemented with a review of the relevant literature and planning documents developed by the communities. Chapter 8 summarizes the potential best practices derived from the individual community analyses and presents overarching findings.
37
5. Case Study of the City of Los Angeles
The city of Los Angeles is unique in terms of its population and budget. It is the second largest city in the United States (3.8 million) (U.S. Census Bureau 2014), and the metropolitan area represents the second largest economy in terms of GDP ($820 billion) (U.S. BEA 2014). Los Angeles also has a foreign-born population of approximately 1.5 million, and the number of individuals who do not speak English at home is approximately 2.2 million (U.S. Census Bureau 2013). Housing in Los Angeles is very dense; 28 percent of all housing units are in structures that contain 20 or more units (U.S. Census Bureau 2013).
A. Natural Hazard Experience Due to its location on active faults, its distinctively warm climate, and its proximity
to the Angeles National Forest, Los Angeles is prone to earthquakes, landslides, floods, and wildland fires. In February 1978, the La Crescenta community of Los Angeles County experienced 9 inches of rain resulting in flooding and mudslides that led to 20 fatalities (County of Los Angeles Hazards and Threats 2012). In October 1993, Southern California, including Los Angeles County, experienced a series of wildfires that resulted in 4 fatalities and $1 billion in damages (California Office of Emergency Services n.d).
The last major disaster experienced by the city of Los Angeles was the Northridge earthquake in 1994, which registered at a magnitude of 6.7. Sixty fatalities, more than 7,000 injuries (U.S. Geological Survey 2015a), and over $20 billion in insured losses were sustained—greater than any other earthquake in U.S. history (Daniell et al. 2012). The city also experienced an outbreak of valley fever (coccidioidomycosis) following the earthquake, which was most likely caused by exposure to spore-contaminated clouds of dust created by the earthquake-induced landslides (Schneider, Hajjeh, and Spiegel 1997). Dozens of hospitals experienced considerable damage in the earthquake, resulting in amendments to strengthen the Alfred E. Alquist Hospital Facilities Seismic Safety Act of 1973, which dictates seismic requirements for hospitals and deadlines for compliance (Office of Statewide Health Planning and Development 2005). The significant financial impact on the insurance industry resulted in a sharp decrease in the number of homeowners’ policies that were issued because California law mandates that insurance companies must offer earthquake insurance if they sell homeowners’ insurance. In 1996, the State of California formed the California Earthquake Authority (CEA) to issue earthquake policies through participating insurance companies that cover only basic structural losses (Wiley 2000).
38
B. Resilience Policy Development The damage inflicted by the Northridge earthquake highlighted the vulnerability of
the city’s soft story structures, non-ductile (brittle) concrete structures and water infrastructure to seismic events that are prone to sudden failure and possible collapse. The risks presented by the vulnerability of these types of structures in Northridge earthquake also occurred in international disasters such as the 2011 Christchurch earthquake where two non-ductile concrete structures collapsed, and in the 1995 Kobe, Japan, earthquake, where many deaths were attributed to failing concrete structures.
Although major earthquake events are fairly infrequent, the region’s population is fairly risk-aware due to regular annual exercises, such as the annual Great ShakeOut earthquake drill. The drill presents a scenario where a 7.8-magnitude earthquake strikes the Los Angeles region. City government leaders estimate that without mitigation actions to improve structural integrity of the built environment and critical infrastructure, a 7.8-magnitude event would lead to an estimated 1,800 deaths, and $213 billion in economic losses ($47.7 billion from shaking damage, $65 billion from fire damage, $96.2 billion from business interruption, and $4.3 billion from traffic delays).
The city’s current mayor, Eric Garcetti, has focused on the persistent risks posed to the city’s population by vulnerabilities in the built environment. Much of the resilience activity in Los Angeles has been initiated through leadership from the mayor’s office. The Resilience by Design report (City of Los Angeles, Office of the Mayor 2014) represents years of stakeholder outreach, technical analysis, and policy formulation by multiple city agencies and input from federal scientists.
Resilience by Design outlines four areas of seismic vulnerability in which the city should invest resources in improving its resilience: soft-first-story buildings, non-ductile reinforced concrete buildings, the water system infrastructure, and the telecommunications infrastructure. Under each of these four areas, the report outlines recommended initiatives to achieve their overarching resilience goals. Highlights of those recommendations follow:
• Buildings (“Strengthen Our Buildings”)
– Mandatory retrofit of soft-first-story buildings
– Mandatory retrofit of non-ductile concrete buildings
– Adopt a “Back to Business” Program to supplement building inspection workforce
– Voluntary rating of buildings based upon U.S. Resiliency Council system
• Water Infrastructure (“Fortify Our Water System”)
– Protect water infrastructure (aqueducts) importing water to Los Angeles
– Develop alternate water sources for firefighting
39
– Protect and develop local water storage
• Telecommunications (“Enhance Reliable Telecommunications”)
– Enhance telecommunication coverage in a disaster via partnerships with cellular service providers
– Strengthen cellular towers
– Protect electrical infrastructure at fault crossings to prevent cascading failures
– Advance and implement earthquake early warning technology
1. Resilience Policy Planning Team Structure Resilience policy and initiative planning originates from priorities set by the mayor
and initiatives are driven by leadership from the mayor’s office. The Deputy Mayor for Public Safety and Law Enforcement was charged with coordination and implementation of the city’s overall resilience plan, while the mayor maintained final executive authority over policies recommended in the Resilience by Design report. In addition to establishing this charge to the deputy mayor, the mayor appointed a Science Advisor for Seismic Safety. Dr. Lucy Jones of U.S. Geological Survey (USGS) was appointed to this position through a Technical Assistance Agreement with USGS. The Science Advisor for Seismic Safety directly advised the mayor and participated in outreach efforts for resilience policy recommendations put forward by the mayor’s office. Profiles of these and other key stakeholders follow:
• Mayor Eric Garcetti has played a critical role in initiating and championing the Resilience by Design process. He was instrumental in appointing Dr. Jones as the science advisor for seismic safety for the city. The mayor also made some final decisions about the implementation, such as whether retrofitting of buildings is mandatory or voluntary.
• Dr. Lucy Jones, a seismologist at USGS, was appointed as the independent science advisor for seismic safety to the City of Los Angeles. She was crucial in communicating the scientific data from previous earthquakes and forecasting the impacts of future earthquakes. She was involved in the developing Resilience by Design, and its implementation.
• Deputy Mayor Eileen Decker coordinated the implementation of the Resilience by Design recommendations. Ms. Decker was responsible for assembling the interagency team, departmental recommendations, and coordinating all municipal efforts resulting in the resilience policy recommendations considered by the mayor.
40
The deputy mayor formed the Mayoral Seismic Task Force to develop recommendations for the Mayor’s Resilience by Design report. Through the deputy mayor’s direction, multiple city government agencies developed policy proposals. Agencies included the Mayor’s office, Los Angeles Department of Water and Power, the Department of Public Works (Bureau of Sanitation and Bureau of Engineering), the Los Angeles Fire Department, the Department of General Services (Office of Public Safety), the Department of City Planning, the Housing and Community Investment Department, and groups external to city government such as telecommunications infrastructure owners and operators, and USGS.
2. Soft-Story and Non-ductile Concrete Structure Mandatory Retrofits
a. Motivation and Goal Non-ductile concrete structures contain structural components, such as columns and
frame connectors, that are brittle and prone to sudden failure in strong shaking events, and buildings constructed before 1980 are at risk of damage and potential collapse in seismic events. These types of buildings were designed prior to the enactment of the 1976 Uniform Building code that meets the Basic Safety Objective in ASCE 41. The Northridge earthquake also demonstrated weakness in soft-story structures, particularly residential structures. Several non-ductile structures failed to various degrees as well (i.e., hospital, high school, hotel, and office building). International earthquake events since the Northridge earthquake, notably the 2011 Christchurch 6.3 magnitude earthquake, have experienced non-ductile concrete structure failures, which have led to significant loss of life. The mayor’s office believes that in future earthquakes, even if soft-story and non-ductile concrete structures do not fail catastrophically, many structures will be damaged and need to be demolished and rebuilt.
In 1933, a 6.3-magnitude earthquake struck Long Beach, California, causing major damage to unreinforced masonry structures. In 1981, the City of Los Angeles passed a first-ever mandatory retrofit ordinance for all unreinforced masonry buildings (Federal Emergency Management Agency [FEMA] 2009; California Seismic Safety Commission 2004; McMilla 1991). The State of California followed with a state-level requirement in 1986.
b. Policy Design and Implementation Process The Mayoral Seismic Task Force used collapse data from the Northridge earthquake
to determine which buildings were the most vulnerable. The analysis indicated that approximately 12,000 soft-story buildings and 1,500 non-ductile concrete structures needed to be retrofit to address these seismic vulnerabilities. The study also found that many of the soft-story buildings were affordable housing units, which introduced a
41
significant barrier to recovery for Los Angeles’s vulnerable populations. The potential adverse impact on vulnerable populations was of particular importance for city officials.
The science advisor and deputy mayor engaged in months of stakeholder outreach by meeting with business associations to discuss these structural vulnerabilities, consequences of building failure, and actions required to address these risks. Technical input and realistic disaster scenarios were critical elements of the outreach process. Using the existing Great ShakeOut scenario, stakeholder outreach focused on translating technical information on the seismic risks into potential life, safety, and economic consequences for each specific stakeholder group the city was engaging. Realistic, non-catastrophic scenarios presented feasible and economic tradeoffs that could be discussed with stakeholder groups. Discussions focused on communicating the technical requirements for addressing vulnerabilities in structural design, understanding tradeoffs in economic performance of these resilience investments, and identifying policy design accommodations that could be made to address concerns raised by multiple stakeholder groups (e.g., return on investment, principal-agent conflicts in cost recovery for retrofits, and timing of retrofit upgrades with existing upgrade schedule).
c. Outcomes All outcomes from this initiative are reflected in the Mayor’s resilience policy
recommendations in Resilience by Design. Three major structural mitigation recommendations and a recovery recommendation resulted from this initiative:
• Adopt ordinance requiring mandatory soft-story building retrofits: The mayor recommended that the city council adopt a mandatory retrofit ordinance for soft-story buildings. The recommended ordinance requires retrofit of all soft-first-story buildings except for single-family homes or multi-unit structures with 3 or fewer units. The recommended ordinance provides a 5-year compliance period. A draft ordinance is presented in Resilience by Design. The ordinance was adopted by the City Council and Mayor on October 9, 2015.
• Adopt ordinance requiring mandatory non-ductile concrete structure retrofit: The mayor recommended that the city council adopt a mandatory retrofit ordinance for concrete buildings. The recommended ordinance requires mandatory retrofitting for all concrete buildings designed to a building code prior to the 1976 Uniform Building Code, and requires a minimum standard specified in the Basic Safety Objective in ASCE 41. Building owners are required to perform a structural engineering evaluation within 5 year of the enactment of the ordinance, and then have 25 years to complete the retrofit. A draft ordinance is presented in Resilience by Design. The ordinance was adopted by the City Council and Mayor on October 9, 2015.
42
• Adopt voluntary building rating system: The mayor’s office recommended the voluntary adoption of the U.S. Resiliency Council’s rating system for building seismic resilience. As part of this policy recommendation, the Mayor’s Office directed the city government to adopt the rating system for city-owned buildings and to identify how dissemination of the building ratings could be used to inform the public.
• Supplement the city’s building inspection capacity for major earthquake events: The mayor’s office proposed the development of a “Back to Business Program” that aims to provide additional private-sector emergency inspectors to supplement public building inspectors to accelerate building safety inspections after an event. This effort build on a model program developed by the city of Glendale. The recommendation aims to reduce business interruption due to a backlog of inspections required after an event.
3. Water Infrastructure Retrofits
a. Motivation and Goal The mayor’s office requested that the Los Angeles Department of Water and Power
(LADWP) develop a program to ensure the resilience of water infrastructure to seismic hazards. In coordination with the mayor’s office, LADWP developed the Seismic Resilience and Sustainability Program in April 2014. The program’s efforts focused on defining the characteristics of a seismically resilient water infrastructure for Los Angeles, identifying current resilience status of the water infrastructure, and identifying actions to improve water infrastructure seismic resilience.
b. Policy Design and Implementation Process The LADWP Seismic Resilience and Sustainability Program was tasked with
providing recommendations to the mayor’s office by September 2014 in four specific areas: (1) water supply infrastructure, (2) resilient piping networks, (3) firefighting water supply, and (4) local water supply sources. The program was staffed with 20 managers from across the LADWP organization that could develop holistic recommendations outside of traditional organizational and management boundaries. These managers met multiple times each month, holding leadership meetings and convening smaller technical working sessions. Program leadership required mandatory attendance from each of LADPW’s divisions and offices in each meeting.
Resilience by Design defined a near-term goal of September 2014 for the LADWP program, but staff indicated that the organizational mechanism created by this mayoral initiative could also support other improvements to the resilience of the Los Angeles Water System. The program focused on seismic resilience, but the management team anticipates
43
that it will evolve to incorporate additional hazards. The long-term and organizationally integrative perspective informed many of the program’s recommendations for activities to address ongoing risks to the city’s water infrastructure.
c. Overview of Program Summary Report A September 2014 summary report on the program, Water System Seismic Resilience
and Sustainability Program, outlined the recommendations to enhance water system resilience. A copy of the report was provided to STPI for use in this study. The recommendations informed the water infrastructure chapter of the mayor’s Resilience by Design policy report (City of Los Angeles, California, Office of the Mayor 2014). The Seismic Resilience and Sustainability Program estimated that $12–15 billion in funding over two decades would be required to upgrade water system infrastructure to address seismic hazards.
1) Task and Goal LADWP was asked to focus efforts on three tasks: (1) defining characteristics of a
seismically resilient Los Angeles Water System, (2) identifying the current status of the water system seismic resilience, and (3) recognizing aspects which may improve water system seismic resilience (City of Los Angeles, California, Office of the Mayor 2014).
The program defined seismic resilience and sustainability as achieved when the water system “has the systematic ability to provide water services in a manner allowing the community to effectively respond to earthquake events, recover quickly from them, and adapt to changing conditions, while also taking measures to reduce future seismic risks” and “is prepared to manage all threatening seismic hazards in a manner that minimizes and contains the hazard impacts while continuing a comprehensive approach to natural resource conservation and maintaining environmental quality.” According to the report, the program measured resilience as the extent of economic loss and the time lapse between a hazard event and recovery of water system functions. An event that requires several years from which to recover was termed a disaster.
A service-based model was developed for understanding how seismic hazards and events affect the ability of LADWP and city water infrastructure to deliver water to various customers. The report divides recovery into five water-related services that may be affected by a hazard event: water delivery, water quality, water quantity, water for firefighting, and system functionality. Infrastructure performance and functionality before and after a seismic event are measures of system resilience used by the organization. The goal of a resilient system, as defined by the program, is to reduce both the number of services lost in an event and the time it takes to restore any lost services to the population.
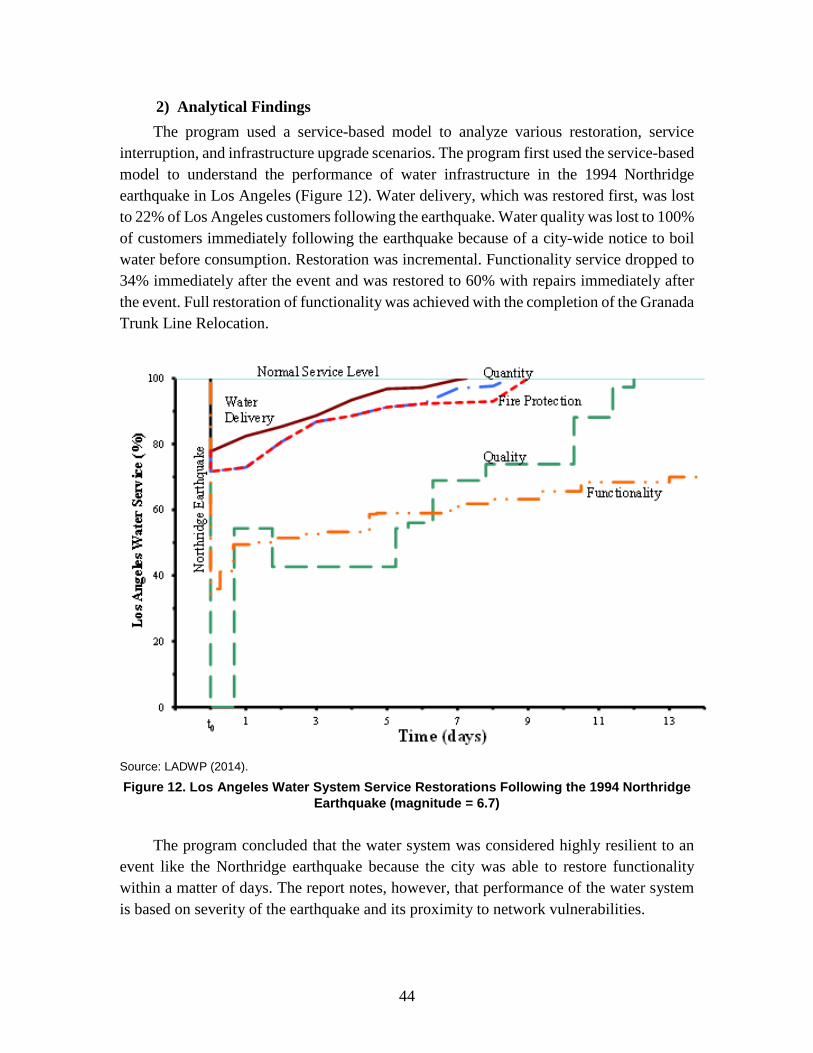
44
2) Analytical Findings The program used a service-based model to analyze various restoration, service
interruption, and infrastructure upgrade scenarios. The program first used the service-based model to understand the performance of water infrastructure in the 1994 Northridge earthquake in Los Angeles (Figure 12). Water delivery, which was restored first, was lost to 22% of Los Angeles customers following the earthquake. Water quality was lost to 100% of customers immediately following the earthquake because of a city-wide notice to boil water before consumption. Restoration was incremental. Functionality service dropped to 34% immediately after the event and was restored to 60% with repairs immediately after the event. Full restoration of functionality was achieved with the completion of the Granada Trunk Line Relocation.
Source: LADWP (2014).
Figure 12. Los Angeles Water System Service Restorations Following the 1994 Northridge Earthquake (magnitude = 6.7)
The program concluded that the water system was considered highly resilient to an
event like the Northridge earthquake because the city was able to restore functionality within a matter of days. The report notes, however, that performance of the water system is based on severity of the earthquake and its proximity to network vulnerabilities.
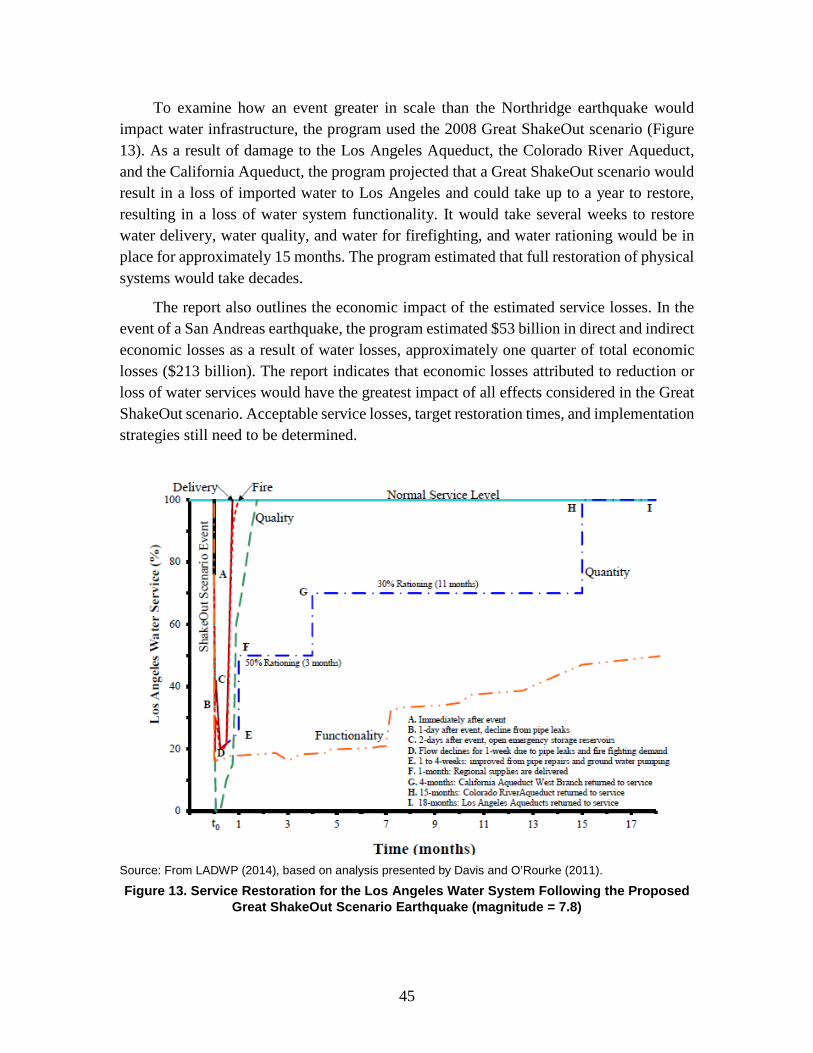
45
To examine how an event greater in scale than the Northridge earthquake would impact water infrastructure, the program used the 2008 Great ShakeOut scenario (Figure 13). As a result of damage to the Los Angeles Aqueduct, the Colorado River Aqueduct, and the California Aqueduct, the program projected that a Great ShakeOut scenario would result in a loss of imported water to Los Angeles and could take up to a year to restore, resulting in a loss of water system functionality. It would take several weeks to restore water delivery, water quality, and water for firefighting, and water rationing would be in place for approximately 15 months. The program estimated that full restoration of physical systems would take decades.
The report also outlines the economic impact of the estimated service losses. In the event of a San Andreas earthquake, the program estimated $53 billion in direct and indirect economic losses as a result of water losses, approximately one quarter of total economic losses ($213 billion). The report indicates that economic losses attributed to reduction or loss of water services would have the greatest impact of all effects considered in the Great ShakeOut scenario. Acceptable service losses, target restoration times, and implementation strategies still need to be determined.
Source: From LADWP (2014), based on analysis presented by Davis and O’Rourke (2011).
Figure 13. Service Restoration for the Los Angeles Water System Following the Proposed Great ShakeOut Scenario Earthquake (magnitude = 7.8)
46
d. Resilience by Design Outcomes The Resilience by Design report recommends six major strategic and organizational
changes as necessary to achieve a seismically resilient water system: (1) Establish an on-going task force within LADWP to oversee progress and provide staff resource, (2) prepare a Program implementation plan, (3) conduct seismic hazard evaluation and monitoring along the LA Aqueducts, (4) develop a seismically resilient pipe network, (5) increase water storage and supply reliability by improving San Andreas fault infrastructure crossings, evaluating dam safety, identifying alternative firefighting water supplies, and developing local supply sources, and (6) enhancing LADWP’s emergency response capabilities (LADWP 2014).
The mayor’s office established the following actions and decisions to improve the city’s water infrastructure:
1. Develop an alternative water system for firefighting, such as using reclaimed water or pressurized seawater, and building seismically resilient pipes
2. Fortify the Los Angeles Aqueduct, upon which Los Angeles is dependent, by developing alternatives for crossing the San Andreas Fault
3. Fortify other aqueducts by creating a task force with outside entities that are responsible for the other aqueducts on which Los Angeles relies
4. Fortify water storage by maintaining the Los Angeles DWP dams at an adequate level
5. Increase local water sources through activities such as storm water capture, water conservation, water recycling, and contamination remediation projects
6. Create a seismic resilient pipeline network by using seismic resilient pipes across the city, beginning with pipes that serve essential facilities and services
7. Implement a Resilience by Design Program at DWP that will focus on both power and water systems and will maintain the institutional emphasis on seismic resilience
8. Develop a statewide seismic resilience bond measure that can be used for fortification of the water infrastructure by working with state, local, and regional partners (City of Los Angeles, California, Office of the Mayor 2014)
9. Document lessons learned from case study community applicable to other locations
47
C. Observations • Leadership: The City of Los Angeles has a strong top-down leadership structure,
where the Mayor’s office drives the planning, design, publication, and implementation of resilience initiatives.
• Characterize community: Independent, scientifically-informed risk communication was the basis for establishing credibility of city officials, leading to successful community outreach across stakeholder groups.
– The city signed a memorandum of understanding with USGS to detail Lucy Jones to the City of Los Angeles as Science Adviser for Seismic Safety.
– The major resilience initiatives being implemented in LA are based on the recommendations provided in Resilience by Design, which was finalized after months of stakeholder meetings and technical expert review. This report was spearheaded by the mayor’s office while drawing upon scientific expertise provided by Dr. Lucy Jones at USGS. Dr. Jones has been on detail from the USGS to the city of LA since 2014 and holds the position of Science Adviser for Seismic Safety. The direction, support and credibility provided by the ongoing involvement and active role of an independent scientific advisor working closely with the mayor’s office is widely considered by city officials to have been crucial for the success of the resilience measures.
– The Mayor chose to only support voluntary building vulnerability rating standards due to lack of agreement among the engineering community on a common, cohesive standard.
• Outreach: Outreach to community groups focused on discussing realistic potential earthquake scenarios. Outreach was focused on describing potential immediate and projected long-term economic losses that would be expected from these events without buildings and infrastructure risk mitigation. The scenario-based planning used expected to extreme events, but not catastrophic, in order to provide the basis for tangible discussion of policy proposal tradeoffs.
• Implementation: Code adoption for mandatory soft-story building retrofits required broad stakeholder agreement prior to Mayor’s decision to push for city council approval. The Mayor’s decision relied upon key stakeholder support (e.g., building owners, engineering groups, tenant advocacy groups), flexible compliance, and understanding consequences with and without the retrofits to various community populations (e.g., loss of low-income affordable housing).

49
6. Case Study of the City of Flagstaff
Flagstaff, Arizona, is located about 120 miles north of Phoenix and is surrounded by the 1.86-million acre Coconino National Forest, which is home not only to the largest contiguous ponderosa pine stand in the world, but also to landscapes as diverse as the Red Rocks of Sedona, flatlands, alpine tundra, and ancient volcanic peaks (U.S. Forest Service 2015). The forest surrounds the cities of Flagstaff and Sedona and borders four other national forests: the Kaibab National Forest to the west and northwest, the Prescott National Forest to the southwest, the Tonto National Forest to the south, and the Apache-Sitgreaves National Forest to the southeast (Wikipedia 2015).
Flagstaff is located at a 7,000-foot elevation, at the base of the 12,000-foot San Francisco Peaks. Wildfire is the primary threat to the greater Flagstaff community, which experiences roughly 300 ignitions per year, split nearly evenly between lightning and human causes.
A. Natural Hazard Experience Most widely known for wildfires, Flagstaff has faced multiple types of natural
disasters, including tornadoes, earthquakes, flash flooding, and drought. Since 2010, the Flagstaff area has been hit by several major fires followed by intense rains and flash flooding. The Schultz Fire in June 2010 burned 15,000 acres in Coconino National Forest and 50 homes northeast of Flagstaff, resulting in a cost of between $130 million and $140 million from the fire and following floods. Although located approximately 130 miles away from Flagstaff, the widely publicized Yarnell Hill Fire destroyed over 8,000 acres and killed 19 firefighters, making it the sixth deadliest firefighter disaster in American history. More recently, the Slide Fire in May 2014 burned over 22,000 acres with a cost of $10.1 million and cut off a main road between Flagstaff and Sedona. The impact of these devastating fires, however, has been multiplied by the following monsoon season, which begins in early July. The burnt land from the wildfires and the torrential rain combine to cause “debris flows, significant erosion, and substantial flooding … [which can cause] extensive damage to homes, property and infrastructure.” In particular, the dry and burnt ground is unable to absorb the rain, and the resulting runoff and flash flooding pile on to the areas already suffering from the previous wildfire. In addition to wildfires and flooding, Flagstaff has seen an array of natural disasters:
• On October 6, 2010, eight tornados hit Coconino County and the surrounding area, one of which was classified as an EF3 on the Enhanced Fujita (EF) scale.
50
• In December 2014, a 4.7-magnitude earthquake occurred 16 miles from Flagstaff.
• Flagstaff has been facing a long-term drought for the past 17 years.
From the perspective of Flagstaff city officials, improving community resilience means working proactively to mitigate the risk of hazards as well as the ability to bounce back from an event.
B. Resilience Policy Development The City of Flagstaff’s character and economy are intimately tied to the surrounding
forest, and so are its community resilience efforts. Proactive forest management is seen as key to protecting the community; therefore, working in partnership with the U.S. Forest Service and state and county officials to mitigate the risk of wildland fires and manage forest health is the primary focus of resilience efforts in the greater Flagstaff area.
1. Proactive Forest Management
a. Background Forest management has been practiced in and around Flagstaff for nearly 130 years.
The ponderosa pine forest ecosystem has historically been treated with low-intensity surface fires, which kept the stands in open, park-like structures. But thinning treatments have not kept pace with tree growth and fuel deposition. Decades of fire suppression treatments, in conjunction with grazing and timber management practices have resulted in overcrowded forestlands, with high levels of biomass and ground fuels. Ponderosa pine forests are understood to be well adapted to, and dependent on, frequent low-intensity fires, but highly vulnerable to high-intensity fire. Given the unnatural fuel accumulations, both the size and severity of wildfires has been increasing in recent years (Table 4). In addition to ecosystem damage, a large-scale wildfire moving into the city can cause catastrophic damage to life and property and long-term losses to the local economy.
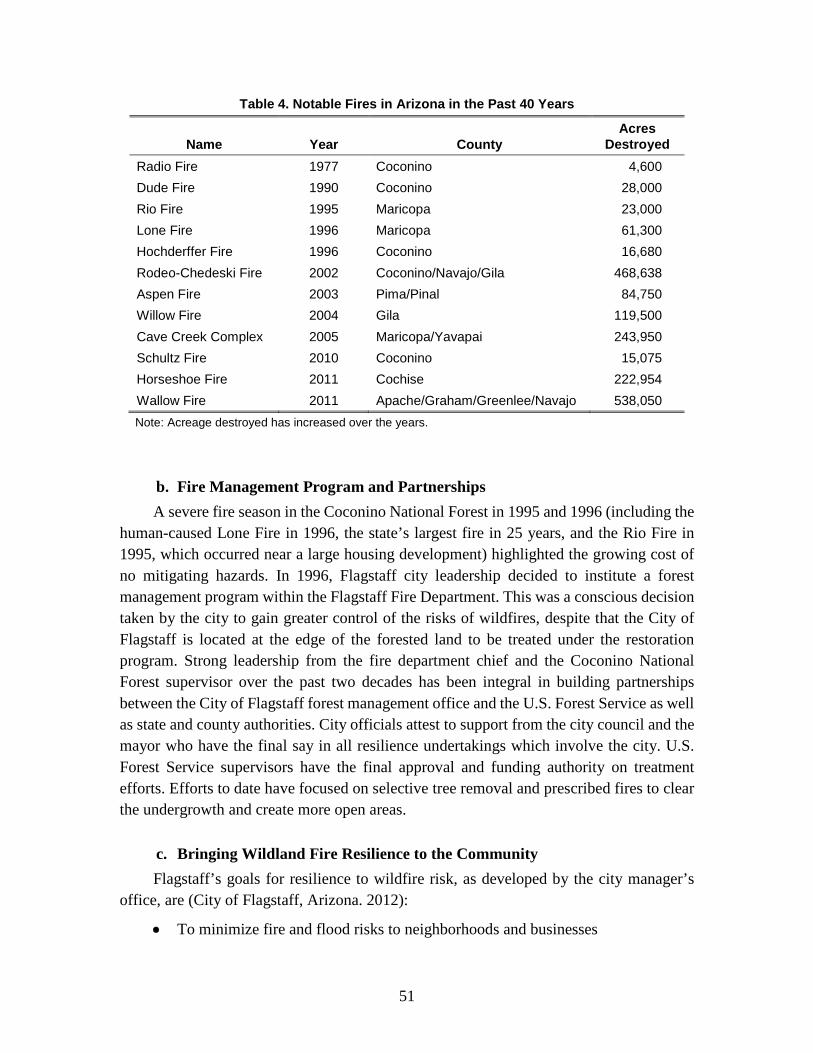
51
Table 4. Notable Fires in Arizona in the Past 40 Years
Name Year County Acres
Destroyed Radio Fire 1977 Coconino 4,600 Dude Fire 1990 Coconino 28,000 Rio Fire 1995 Maricopa 23,000 Lone Fire 1996 Maricopa 61,300 Hochderffer Fire 1996 Coconino 16,680 Rodeo-Chedeski Fire 2002 Coconino/Navajo/Gila 468,638 Aspen Fire 2003 Pima/Pinal 84,750 Willow Fire 2004 Gila 119,500 Cave Creek Complex 2005 Maricopa/Yavapai 243,950 Schultz Fire 2010 Coconino 15,075 Horseshoe Fire 2011 Cochise 222,954 Wallow Fire 2011 Apache/Graham/Greenlee/Navajo 538,050 Note: Acreage destroyed has increased over the years.
b. Fire Management Program and Partnerships A severe fire season in the Coconino National Forest in 1995 and 1996 (including the
human-caused Lone Fire in 1996, the state’s largest fire in 25 years, and the Rio Fire in 1995, which occurred near a large housing development) highlighted the growing cost of no mitigating hazards. In 1996, Flagstaff city leadership decided to institute a forest management program within the Flagstaff Fire Department. This was a conscious decision taken by the city to gain greater control of the risks of wildfires, despite that the City of Flagstaff is located at the edge of the forested land to be treated under the restoration program. Strong leadership from the fire department chief and the Coconino National Forest supervisor over the past two decades has been integral in building partnerships between the City of Flagstaff forest management office and the U.S. Forest Service as well as state and county authorities. City officials attest to support from the city council and the mayor who have the final say in all resilience undertakings which involve the city. U.S. Forest Service supervisors have the final approval and funding authority on treatment efforts. Efforts to date have focused on selective tree removal and prescribed fires to clear the undergrowth and create more open areas.
c. Bringing Wildland Fire Resilience to the Community Flagstaff’s goals for resilience to wildfire risk, as developed by the city manager’s
office, are (City of Flagstaff, Arizona. 2012):
• To minimize fire and flood risks to neighborhoods and businesses
52
• To reduce the vulnerability of Flagstaff’s municipal water supplies
• To protect public safety and economic vitality
The city addresses these goals under two focus areas: fire-adapted communities, focusing on activities within the city limits, and restoring landscapes, focusing on forest restoration efforts outside city limits. The city adopted these focus areas from the National Cohesive Wildland Fire Management Strategy (Forests and Rangelands 2105). The city’s efforts in these areas are described below.
d. Fire-Adapted Communities Over a decade of outreach and effort has gone into raising awareness and increasing
community resilience to fire risk. Some of the efforts by the Flagstaff Wildland Fire Management Program within the community follow:
• Education and outreach: Partnerships with community groups and citizens were initiated, including the city’s Community Development department, resulting in hazard mitigation activities becoming a requirement on all properties prior to development. City officials state that collaboration and public education have been the key to success in every resilience initiative. For example, to get community buy-in for the Flagstaff Watershed Protection Project, the city manager did no less than 50–60 presentations to the community to gather support for funding the project (more details later in this section). Engaging city council members and taking them on field trips to view firsthand the impact of hazards have also been instrumental in shifting the dialogue from a position-based to an issue-based discussion.
• Establishing credibility: The Wildland Fire Management Program works in collaboration with the Greater Flagstaff Forests Partnership4 and the Northern Arizona University’s Ecological Restoration Institute. To lend credibility to its work on forested lands, the fire department hired professional foresters, thus grounding their efforts in science-based ecological restoration. Additional expertise is sought from the Northern Arizona University Ecological Restoration Institute.
• Preparedness: Protecting lives and property through intervention and avoidance includes enforcement of the Wildland-Urban Interface Code (see “Adoption of the Wildland-Urban Interface [WUI] Code: Resilience Drives Land-Use Planning in Flagstaff” in the box on the next page) and building fire-adapted communities. The NFPA’s Firewise Communities Program, an important
4 This alliance of environmental, governmental, and business organizations supports research and
demonstration of approaches for ecosystem restoration in the ponderosa pine forests (Greater Flagstaff Forests Partnership 2015).
53
component of building fire-adapted communities, encourages grassroots-level fire safety by enabling homeowners to take individual responsibility for equipping their homes to deal with the risk of wildfire (Firewise Communities Program 2015). Firewise construction elements include limiting combustible siding, using closed eaves and wire mesh screens over all vents, and thinning the property.
These efforts helped shape public perception over a decade and gather support from the City of Flagstaff’s community and elected officials. This broad base of support was instrumental in the treatment of 10,000 acres of the Coconino National Forest between 1996 and 2007 and in the success of resilience-based land-use planning in the City of Flagstaff, as demonstrated by the adoption of the Wildlife-Urban Interface Code in 2008.
Adoption of the Wildland-Urban Interface (WUI) Code:
Resilience Drives Land-Use Planning in Flagstaff The Flagstaff WUI encompasses several jurisdictions and ownerships and includes substantial public land. In 2008, the city adopted the WUI Code in tandem with the 2006 International Fire Code (replacing the Uniform Fire Code) prescribing regulations targeted to fire and explosion hazards. The codes call for the use of fire-resistant building materials, give specific building specifications, such as for chimneys and flues, and provide criteria for creating a “defensible space” around structures. Adoption of the codes allowed the fire department to legally enforce the restrictions, which are then mandatory for all new construction starts. The adoption of the WUI codes occurred over a period of 18 months during which the Fire Management group did extensive outreach with Homebuilders associations, Real Estate and Insurance groups, developers, engineering firms, community leaders and others. Once the public was on board, members of the city council unanimously approved the move to the adapted code. The adoption of the WUI codes was seen as a big win for the city of Flagstaff; proposals for similar code adoption by neighboring cities, such as Hellsgate, have been unsuccessful because builders and homeowners fear that it will restrict landscaping on their properties. As in others efforts, key enablers for success in this effort were the extensive public outreach and support across a broad spectrum of stakeholders. In addition, many of the preventive measures that were introduced as modifications in the WUI code had already been in practice in the city for almost a decade. Thus, the idea was not new, although adopting the code now made it enforceable. __________ Source: Flagstaff Fire Department (2015a).
e. Restoring Forest Health Partnering with the U.S. Forest Service for proactive forest management is seen as
vital to the city’s economic resilience by city officials. Flagstaff’s location at the wildland-urban interface exposes it to such effects of fire as flooding, smoke, and so forth. For example, the Schultz fire of 2010, which did not enter the city limits, nonetheless resulted in extensive damage to infrastructure systems from post-fire flooding and runoff from the steep slopes. According to city officials, had the fire occurred on the other side of the mountain, all the impacts would have been inside the city, including significant damage to the city’s water supply. The city manager’s office sees a clear business case for the city to
54
participate in forest restoration efforts as it mitigates direct economic loss from fire and averts high suppression costs.
A second and equally important motivation is maintaining Flagstaff’s economy that is based predominantly on tourism. The Coconino National Forest receives 3.9 million visitors per year (as a point of comparison the Grand Canyon gets 4.5 million visitors annually). While the long-term economic impacts of wildfires have typically been difficult to study (Zybach, et al. 2009; Western Forestry Leadership Coalition 2010), fire impact studies were cited by city officials to demonstrate credible risk to the economy.
For example, the 2002 Rodeo-Chedeski Fire, Arizona’s second largest wildfire, burned 463,000 acres and cost $40 million to suppress. Recovery costs, including property values, local economic activity generated sales tax revenue and infrastructure costs are estimated to be between $300 and $400 million. A 2010 study by the Western Forestry Leadership Coalition shows the true cost of wildfires to be between 2 and 30 times the cost of suppression (which are the typically reported costs).5
The Slide Fire in 2014, between Flagstaff and Sedona, did not impact the city of Flagstaff directly except for hazy conditions created by the smoke from the fire (Dave, 2014). However, loss of tourism resulted in a tax loss of $200 million over the 3 months after the fire.
f. Partnering with State and Federal Officials for Forest Health Maintenance Thus, despite jurisdictional issues, local government officials in Flagstaff see
themselves as being on the frontlines of forest health management and partnering with federal and state government in ways that add value to existing forest health initiatives and increase the city’s long-term economic resilience. The city has been involved in efforts such as selective tree removal and prescribed fires that would clear debris and accumulated fuel and create more open stands. In particular, Flagstaff fire management officials have directed their efforts on areas that have not been treated in decades because of insufficient availability of federal funds, or because the forested areas are too steep or difficult to access. In these areas, the city’s involvement has accelerated the treatment of high risk parcels of land. All this is enabled by a high level of awareness in the community of both the threat and the need to prioritize forest initiatives.
For example, the Woody Fire of 2006 showed the effectiveness of thinning dense stands and using prescribed fires to treat fuel accumulation. The fire started in an untreated area of the forest, became a crown fire, and moved quickly in the direction of Flagstaff
5 Other examples include the Cerro Grande fire in New Mexico in 2000, where the cost of suppression
was 3% of the total cost of the fire, which included damage to the Los Alamos National Laboratory and equipment therein. The Hayman fire in 2002 cost $307/acre to suppress, but a Colorado State University study that an additional $1,358/acre of losses had accrued within the first year.
55
until it reached areas treated with forest thinning. The more open stands allowed firefighters to more effectively control and fight the fire, thus preventing its march towards the developed city areas (Flagstaff Fire Department 2015b).
In a similar instance, the nearly 300-acre Hardy fire of 2010 grew quickly, forcing evacuations in the city of Flagstaff. A previously treated area in the approach path of the fire served as a buffer area, allowing firefighters to burn out forest fuels. As a result, the fire dropped to the ground and lost strength (Flagstaff Fire Department 2015b).
In the case of the Schultz Fire in 2010, the fire was successfully contained at the edge of the city, but post-fire flooding swept debris up to 7 miles, destroying infrastructure and flooding homes in the city. Recognizing that an untreated watershed could cause significant damage within city limits, the city issued municipal bonds to fund watershed treatment on the Rio de Flag and Upper Lake Mary watersheds in the greater Flagstaff area. The bond, which was passed by a 73% voter approval, will finance up to $10 million for a watershed services project (the Flagstaff Watershed Protection Project) on 14,446 acres of U.S. Forest Service and state lands primarily outside Flagstaff city limits.
The City of Flagstaff has also funded accelerated treatments in underfunded, steep or hard-to-reach areas covered by the Four Forest Restoration Initiative (4FRI),6 a joint effort by four national forests in the State of Arizona and funded by the U.S. Forest Service.
2. Flagstaff Watershed Protection Project
a. Background
b. Motivation The Schultz Fire of 2010 demonstrated Flagstaff’s vulnerability to damage caused by
heavy rains following a major fire. Near-record monsoons occurred that year, in addition to forest fires in the San Francisco Peaks near Flagstaff. In June 2010, the Schultz Fire, which burned over 15,000 acres, resulted in the evacuation of over a thousand residents, but did not spread into the city of Flagstaff or cause direct infrastructure damage. Heavy rains following the fire resulted in significant debris flows and substantial flooding of the residential areas below. Watersheds in moderate- to high-severity burn areas are prone to much greater runoff, which increases hillslope and channel erosion and results in sediment-laden flood flows. In the case of the Schultz Fire, intense monsoons prior to the fire that otherwise might not have produced much runoff, resulted in severe ash-laden flooding 6 4FRI is designed to restore fire-adapted ecosystems in four national forests in the Southwestern
region—the Kaibab, the Coconino, the Apache-Sitgreaves and the Tonto. Started in 2009, the four forests are actively engaged in collaborative, landscape restoration initiatives that will cover 2.4 million acres over a 10-year period. The 4FRI is funded by the USDA’s Collaborative Forest Landscape Restoration Program.
56
several times, causing extensive damage to homes, property, and infrastructure up to 4 miles from the fire (Youberg, Koestner, and Neary 2011). In addition, one of the city’s main water lines was destroyed in the flooding, and there was a short window to repair the lines ahead of the next monsoon season. The total cost of damage from the fire was $15 million for suppression and approximately $133–140 million in post-fire impacts.
c. Initial Action and Leadership In the fall of 2010 (in the aftermath of the Schultz fire), officials from the City of
Flagstaff and the U.S. Forest Service convened under the leadership of the City Manager and the County Forest Service supervisor to discuss mitigation options for the post-fire flooding impacts. While proactive forest management has always been seen as a key component of community resilience in the region, the Schultz Fire expanded the scope of the discussion to include the economic and social impacts of post-fire floods.
d. Conveying a credible risk to the city and economy From the initial stages, the discussion was informed by risk assessment studies of fire
and subsequent flooding. While flooding from the Schultz Fire primarily affected unincorporated areas at the edge of the city of Flagstaff, projections showed that extensive, severe and repeated flooding could result from a high-intensity fire within the city limits. A cost avoidance study conducted by the Northern Arizona University’s Arizona Rural Policy Institute estimated that the flooding-related costs in such a situation could potentially amount to between $573 million and $1.2 billion (Cowan 2014). Also, erosion and debris flooding down the slopes could render the city’s water supply unusable. Loss of tourism would also have an impact.
In addition, an eco-restoration study by the researchers at the Northern Arizona Institute looking at long-term projections in runoff from forest thinning showed an increasingly worsening situation, with cumulative increases in runoff ranging from 20 to 26% over a span of 15 years.
e. Technical Expertise Sought in Developing Solutions Since 2008, the city manager has led a Sustainable Communities cabinet that brings
together the environmental, economic development, social development and U.S. Forest Service/wildfire communities to discuss issues related to sustainable solutions to forest management and climate change in the region.
This forum was used in the aftermath of the Schultz Fire to discuss a way forward on watershed protection services. Risk assessment and economic analyses were presented to stakeholders, and the U.S. Forest Service, the Grand Canyon Trust, the water commission, and the sustainability commission were among the groups who presented a case (Coconino
57
County, Arizona, 2011) for the need for watershed protection in the Rio de Flag (Dry Lake Hills) and Upper Lake Mary watershed areas surrounding Flagstaff.
The dialogue on risk management options led to a weeklong ‘Ridgeline to Rio’ summit in fall 2010, hosted by the Coconino National Forest and Coconino County (USDA, Forest Service, 2010). Over 50 technical experts, including hydrologists, soil scientists, engineers, and members of the U.S. Army Corps of Engineers and the academic community, were invited, in addition to representatives from Coconino County, U.S. Forest Service, Rocky Mountain Research Station, City of Flagstaff, Northern Arizona University, Natural Resources Conservation Service, Arizona Department of Transportation, and private engineering firms. The goal was to analyze the effects of flooding due to the Schultz Fire and determine mitigation steps, including drainage solutions and burned area restoration. Long-time area residents were invited to provide historical knowledge of typical rainfall and water flow patterns.
Participants were asked to “think outside the box” without being limited by budgets (within reason), existing policies, or untested treatment methods. The consensus among participants was that the first order of business was to understand and quantify the watershed response in the future (since the post-burn, post-flood watershed is significantly different than the pre-burn watershed), and use that as a basis for designing a comprehensive drainage system minimizing the hazard from post-fire flooding. The solution would also include input from environmental studies, policy and regulatory processes, regulatory constraints, private and public land issues, and multiple agency involvement.
f. Funding At the time these discussions were held, a proposal was made by the city manager to
issue a bond directed towards financing a watershed protection plan. According to discussion with city officials, a steering committee with representation from local, county, state, and Federal Government at all levels of leadership was convened by the city manager, and an extensive public campaign (principally driven by nonprofit organizations, such as the Grand Canyon Trust and the Friends of the Rio de Flag) was launched to garner support for the bond issuance. Public messaging was aimed at making this an issue-driven rather than position-driven dialogue, to get political leadership on board.
In November 2012, a $10 million municipal bond was approved with a 73% voter approval by the residents of Flagstaff, Arizona, to support forest restoration work within key watersheds on the Coconino National Forest and the State of Arizona lands. The approval of the city council and the mayor was the final step in the process. The Flagstaff Water Protection Project is one of a handful of examples of forest restoration work being funded by a municipality, and the only known example of such an effort being funded by municipal bonds.
58
g. Initial Implementation Steps: Approval for Proposed Treatment Plans Because of the unique funding aspects of this project and multiple jurisdictional
authorities involved, a memorandum of understanding was signed between the city of Flagstaff and the U.S. Forest Service, outlining roles and expectations for both parties, and allowing bond monies to be allocated toward the planning and implementation of the task (City of Flagstaff, Arizona, and Flagstaff Ranger District, Coconino National Forest 2012).
The full-scale implementation of the Flagstaff Watershed Protection Plan (FWPP) involves project staff from the city, the U.S. Forest Service, the State of Arizona, Coconino County, Greater Flagstaff Forest Partnership, and the Northern Arizona University’s Ecological Restoration Institute. The public works department has the lead on the re-design of the drainage system and diverting the flood waters away from the bottom of the watershed where it had pooled.
The FWPP is expected to restore to a more manageable state approximately 15,000 acres in two areas of the forest, Rio de Flag and Upper Lake Mary. Some of these areas have been approved by previous National Environmental Policy Act decisions and come under the ongoing Four Forest Restoration Initiative (4FRI); however, the difference is that the FWPP will thin out steeper, more difficult terrain, while the 4FRI is expected to cover more ground (Mindock 2013).The U.S. Forest Service has proposed four alternative treatment methods, to include mechanical thinning, helicopter logging and prescribed burns. Since affected areas included federal forest lands, a National Environmental Policy Act process—opening up the process to the public to discuss options and alternatives—was warranted as part of the overall process. A draft environmental impact statement was released for public comment in 2014, and the bulk of the forest treatment is expected to commence in fall 2015.
C. Observations • Outreach: A strong culture of community-led non-governmental organizations
advocating for forest management exists in the region; forest land management is common practice for those living in areas prone to wildfire.
− An existing culture of forest management was crucial in getting large-scale community buy-in for resilience efforts (as opposed to building from the ground up). Community buy-in was essential for the FWPP’s success, which led to eventual voter approval of bond sales to fund the program.
− Close collaboration with the state and federal forest services for proactive forest management is considered vital to the success of resilience efforts by city officials.
59
− All of Flagstaff’s resilience initiatives required collaboration across jurisdictions, and across all levels of leadership. The city partnered with the Grand Canyon Trust and other nonprofit organizations.
− Alignment of players was also important to success. Consistent engagement of city leadership in community outreach that communicates the economic and safety value of mitigation activities leads to higher likelihood of community approving financing of mitigation activities.
− Leadership from city and forest service officials is seen as crucial for initiatives to get visibility at a scale that can have an impact. A communications group led by U.S. Forest Service personnel attended every public meeting to maximize outreach efforts, and effort was taken for the messaging to be consistent, non-partisan, and based on scientific analysis.
− The ability to convey a real risk using a recent event, and support the argument with science-based analysis was a key element for building community buy-in. Convening credible technical experts with representative community stakeholder groups can reconcile diverging risk tolerance and management priorities among land managers.
• Implementation:
− City officials’ ability to identify innovative funding opportunities—re-directing an expiring municipal debt towards watershed protection—allowed the city to raise funds without increasing taxes.
− Initial funding from emergency funds was provided. A Presidential declaration following the Schultz Fire gave the Natural Resource Conservation Service access to Emergency Watershed Protection Plan funds.
− The seed funding made a small amount of repair work possible, and opened the dialogue towards Watershed Protection as a process rather than a one-time repair.
− Cost-benefit analysis of economic losses associated with large wildfires, primarily due to loss of business, natural resource damage, and loss of recreation opportunities, provided compelling reasons for resilience actions.

61
7. Case Study of the City of Norfolk
A. Natural Hazard Experience Over the past 15 to 20 years, Norfolk has regularly experienced hurricanes and floods.
In 1999, the eye of Hurricane Floyd passed directly over Norfolk with nearby Yorktown receiving over 18 inches of rain from the storm (U.S. Department of Commerce, NOAA, 2000). Four years later, Hurricane Isabel caused $76 million in damages in Norfolk (Applegate 2011) and at least three deaths in the city were attributed to the storm (Payne 2003). Nor’Ida, a Nor’easter that impacted on the city in 2009, and Hurricane Irene in 2011 caused $20 million and $9.2 million in damages in Norfolk, respectively (Applegate 2011). In addition, both events resulted in a combined tide and surge of over 7.5 feet, causing widespread flooding and flash flooding (Forster 2011). These events resulted in the State of Virginia issuing mandatory evacuation orders and the U.S. Navy moving ships to sea to avoid potential damage. Flooding from hurricanes is not the only source of concern. According to a Hampton Roads Planning District Commission (HRPDC) report, Norfolk received more than 12 inches of rain from a single storm in late September 2010 that resulted in flash flooding and the road closures (HRPDC 2011). In addition to hazard events, an increase in sea-level rise combined with local land subsidence has exacerbated the effects of flooding, with the tide height having increased over 14 inches since 1930, the fastest measured rate of sea-level rise on the East Coast (U.S. Department of Interior, USGS 2013). It is projected that by 2100, sea-level rise will increase by up to 5 feet, a significant challenge for most of the city that is at an elevation of less than 20 feet above sea level (NRDC 2011).
Over the next 30 years, the number of flood events per year in Norfolk is expected to increase from the current rate of less than nine floods per year to over 180 floods per year by 2045 (Spanger-Siegfried, Fitzpatrick, and Dahl 2014). Low lying assets, including many military installations, are expected to be directly affected, and the Organization for Economic Cooperation and Development ranks the Norfolk area in tenth place for “the value of assets exposed to increase flooding from sea-level rise” (NRDC 2011). With the increased prevalence of these hazard events, many of which were thought to occur only once in a lifetime, and the growing threat of sea-level rise, the City of Norfolk decided to take action and improve its resilience.
62
B. Resilience Policy Development Initial mitigation efforts addressed hurricanes, flood hazards and sea-level rise. These
efforts included a series of risk assessment studies on coastal flooding in 2007 and 2008, with the results being released in 2012. The findings projected a $1 billion price tag for coastal flooding mitigation efforts in Norfolk. Because of the substantial investment needed, Norfolk city leaders have explored external avenues to provide solutions to address a changing long-term hazard profile.
The City of Norfolk’s resilience efforts were initiated through participation in initiatives such as the Rockefeller Foundation’s 100 Resilient Cities Centennial Challenge (100RC) and the RE.invest Initiative. Norfolk’s resilience initiatives center on achieving coastal resilience (flood mitigation), neighborhood cohesiveness, and economic vitality as the core components of their city-wide resilience policy. Flood mitigation is a clear requirement identified in the city’s risk assessment. Neighborhood cohesiveness, focused on fortification of significant assets in a community, has been identified as a significant component and predictor of a community’s ability to “bounce back” following a disruptive event. Economic vitality addresses a lack of economic diversity and the reliance upon Federal Government support through Naval Station Norfolk.
The following sections describe key activities or actions that have led to the city’s current resilience policy approach.
1. Initial Coastal Flooding Focus
a. Analysis by Furgo Atlantic and the Timmons Group The first step in the Norfolk’s development of coastal resilience was to undertake a
risk assessment and prioritization process for hazard mitigation. In 2007 and 2008, Norfolk contracted Furgo Atlantic and the Timmons Group, two engineering consulting firms, to assess the city’s capabilities and the threat of coastal flooding and sea-level rise (Smith 2012; Spring 2013). Furgo Atlantic, which studied the city’s vulnerability to high tides and storm surges, recommended floodwalls, tide gates, elevated roads, and powerful water pumping stations at several areas at an estimated cost of $300 million. The Timmons Group, recognizing the increased frequency of extreme events and the aging storm water drain, recommended upgrading storm water pipes at a cost of up to $775 million (Fears 2012).
b. Norfolk Leadership Concurrently, a Flood Executive Committee was created by the city of Norfolk, an
inter-departmental team that met weekly and included representatives from the Departments of Finance, Intergovernmental Relations, Planning, Public Works, and
63
Utilities as well as the City Manager. Led by the Deputy City Manager, beginning in 2011 this committee developed a four-pronged approach to plan, prepare, mitigate, and communicate (Norfolk Flooding Strategy Update 2012), which was described further in the resulting 2012 Coastal Resilience Strategy. Highlighting a variety of areas in Norfolk that are in need of work, this strategy document provides an open framework for future flood mitigation and related coastal efforts (City of Norfolk, Virginia, 2015a). According to city officials, a citizen advisory committee and an expert advisory committee were also set up to support the strategy development process. Most of Norfolk’s work on coastal resilience has since primarily fallen under the purview of the Flood Executive Committee.
c. RE.invest Initiative Insufficient city funds led Norfolk city officials to seek out and apply for the
RE.invest Initiative and the 100 Resilient Cities (100RC), both Rockefeller Foundation programs. In May 2013, Norfolk was selected as one of eight cities to be part of the Rockefeller Foundation’s RE.invest Initiative. Established in the aftermath of Hurricane Sandy, the RE.invest Initiative is a 2-year program aimed to “help develop resilient urban [storm water] infrastructure systems” and to help Norfolk and the other cities “rethink the way they design, plan, implement and finance urban infrastructure.” With technical assistance from Bechtel, Akin Gump Strauss Hauer & Feld LLP, and Wall Street Without Walls, the goal is for the eight cities in the RE.invest Initiative is to promote mutually beneficial cooperation with the private sector in order to enhance sustainable storm water infrastructure.7 For example, for a broadband company looking to install underground lines (which requires construction and repaving of roads), RE.invest would work with the cities and private sector partners to better integrate the planning and implementation at both ends for improved infrastructure resilience. In the situation described, RE.invest would explore the viability of burying the power lines when the road is under repairs or construction and make sure the road is repaved with more absorbent asphalt to reduce water runoff during future storms” (Rockefeller Foundation 2013).
2. Outcomes Much of the identified work by Fugro Atlantic, the Timmons Group, and RE.invest
has not yet been initiated, as the city is focusing on raising the necessary capital from Federal Government, state government, and other sources (Vegh 2011; Montgomery 2014). Although it cannot be determined if these efforts were directly derived from previous work, the 2014 version of the Coastal Resilience Strategy (City of Norfolk, Virginia, 2015a) provides example outcomes, including a $2.4 million project in 2013 and
7 The other seven cities selected by the RE.invest Initiative were El Paso, Texas; Hoboken, New Jersey;
Honolulu, Hawaii; Miami Beach, Florida; Milwaukee, Wisconsin; New Orleans, Louisiana; and San Francisco, California.
64
2014 to raise a road to decrease flooding frequency and improve access to the nearby medical center during floods (Keifer 2012) and a 2014 building code requirement that “the lowest floor of a building to be built no lower than three feet above the predicted level that water will rise in a flood” (City of Norfolk, Virginia, 2015a).
3. Norfolk’s Expansion of Policy to Address Economic and Neighborhood Resilience
a. 100 Resilient Cities Centennial Challenge After a successful application to the Rockefeller Foundation’s RE.invest Initiative,
Norfolk applied to a second Rockefeller initiative, the 100RC program. The initial motivation from Norfolk was to supplement the coastal resilience needs, but this application expanded Norfolk’s vision to resilience outside of coastal flood mitigation. 100RC, centers around three support mechanisms for each member city: (1) a network of cities to share knowledge and best practices, foster connections, and support one another in resilience activities; (2) financial support to hire a Chief Resilience Officer (CRO) in each city that will fill the role of promoting and coordinating resilience in the city government; and (3) support to create a resilience plan for the city and the resources needed for implementation (Rodin 2013).
b. Application Process The drive to apply to the 100RC program was led by the City Manager’s office and
the Environmental Protection Programs. The Rockefeller 100RC application focused on hazard mitigation, such as coastal flooding in the case of Norfolk, and on resilience in vulnerable populations. In this, the city’s thinking is aligned with Rockefeller’s definition of resilience as “the capacity of individuals, communities, and systems to survive, adapt, and grow in the face of stress and shocks, and even transform when conditions require it” (City of Norfolk, Virginia, 2015d).
c. Evolving Resilience Focus The 100RC kickoff meeting in February 2014 was attended by the city mayor (Salkin
2014) and brought together approximately 200 local stakeholders from all sectors of the community. Working with elected officials, the stakeholders examined resilience in terms of “flooding and coastal storms,” “economic diversity and vibrancy,” and “issues arising from income inequality.” From this input, the City of Norfolk has since unified its resilience efforts into coastal, economic, and neighborhood resilience (City of Norfolk, Virginia, 2015d). In the 2016 city budget, Norfolk termed these three themes as “living in a rising water environment, ensuring economic opportunity for all residents, and supporting neighborhood vitality” (City of Norfolk, Virginia, 2015e).
65
d. First Chief Resilience Officer In line with Norfolk’s new three-part approach to resilience, the newly created
position of Chief Resilience Officer (CRO) was created and filled in June 2014 (Applegate 2014). As a member of Norfolk’s Senior Executive Team, the CRO reports directly to the city manager.8 This implementation of the CRO position allows the incumbent to develop strategy and work across departments.
Focused on the subjects of coastal, economic, and neighborhood resilience, the CRO is currently working to foster cooperation, strengthen systems and interactions, and promote resilience throughout the community. To this end, the CRO is promoting a discussion about how the city government and other stakeholders can help individuals in the community to improve their quality of life and can build resilience through neighborhoods, faith communities, and other local networks.
e. Outcomes The creation of a CRO position, as required by Rockefeller, was a significant outcome
of the 100RC application. Rockefeller also requires the creation of a resilience plan; according to city officials, this plan is in development and will tentatively be released in fall 2015.
4. Integrated Resilience Policy Proposal: Vision 2100 In addition to the 100RC resilience strategy, Norfolk’s Department of City Planning
is developing Vision 2100, which is a long-term strategy for the future of Norfolk through the year 2100. This project was initiated by the Director of the Department of City Planning with the goal of rewriting the city’s zoning ordinances, which were first adopted in 1992 (City of Norfolk, Virginia, 2015c). As Norfolk has transitioned from a suburban to an urban environment over the past 20 years, significant revisions to zoning ordinances are needed. In proposing new ordinances, one primary goal was to integrate resilience.
To integrate resilience into these ordinances, Norfolk reached out to the Rockefeller Foundation to learn about existing best practices. In the process, they found out that they were the first city to suggest integrating resilience into zoning ordinances. Tying in with similar efforts in Boulder, New Orleans, New York City, and Norfolk, the four cities discussed the integration of resilience into comprehensive plans of each city. For Norfolk, a central focus was how to incorporate resilience into zoning ordinances. With technical expertise from the American Institute of Architects, American Planning Association, and Urban Land Institute, Vision 2100 was launched.
8 The CRO and the head of Norfolk’s Emergency Management Department report directly to the city
manager. Other departments in the city government typically report to the deputy city manager.
66
a. The Vision’s Focus According to city officials, the primary idea behind Vision 2100 is for Norfolk to shift
its focus from areas of the city that would be inundated due to sea-level rise to areas of the city that have the greatest likelihood of remaining dry. A large area of high-elevation land in Norfolk termed “the corridor of opportunity” has seen social dislocation, is a poor economic performer, and has significant opportunity for redevelopment. This idea of adaptive management, or learning to live with water, is a reversal of philosophy from the mantra of mitigating or reversing sea-level encroachment.
The choice of the year 2100 was of particular importance for this vision. First, data from the Virginia Institute of Marine Science (VMIS) predicts significant sea-level rise and flooding through the year 2100 (VIMS 2014). Moreover, 2100 is far enough in the future that most current residents in the city will no longer be in the city, a potentially solution to present short-term fears, resistance, and attachments to property of the present population. Thus, the longer time frame of the plan is essential to its success. Transfer of value from the coastal areas of the city to the corridor of opportunity will be a long-term task. City officials noted that transferring development rights and creating regulation to alter development must be occur gradually and in a non-disruptive manner to prevent the market from negatively responding. In addition, realizing that much of the tax base comes from coastal property that will eventually be inundated by sea-level rise, officials believe that Norfolk will need to explore other streams of revenue.
b. Outcomes The initial idea of Vision 2100 occurred in spring 2015. As such, the vision is early
in the development process, and interviewees did not specify when the plan would be released or when specific actions would be taken.
5. Resilience Decision Making Structure Funding for resilience projects and plans are approved through the annual budget
process, which is presented by the city manager and approved by the city council. The city council membership includes the mayor and vice mayor. The CRO supports a key role of integrating the input and planning across multiple relevant municipal agencies, such as the Department of Neighborhood Development and Department of Emergency Preparedness and Response.
6. Proposed Approaches for Implementing Resilience Policy The City of Norfolk’s current resilience policy approach focuses on coastal resilience,
neighborhood cohesiveness, and economic vitality. Implementation approaches associated with these core components are discussed in the following subsections. For most of these
67
efforts, implementation measures have only recently been initiated and outcomes are not yet apparent.
a. Economic Vitality Norfolk was hit hard by the financial crisis in 2008 and, while economic growth over
the past few years has slowly improved, the slow pace of economic recovery still puts Norfolk below its historical average. In addition, there is concern within Norfolk that the local economy is too heavily dependent on Federal Government spending, which accounts for 46% of the region’s economic output (Frost 2011). A decrease in federal investment due to sequestration could also impact the local economy (O’Neal 2015). These considerations have led to a desire for economic diversification in the region. According to interviewees, economic resilience in Norfolk must focus on economic diversification. One potential idea from city officials is to establish new economies in the region, such as creating a research and development center for water infrastructure technologies, similar to a proposal by RE.invest (City of Norfolk, Virginia, 2015f). Additional opportunities for economic development center on addressing poverty and unemployment. These actions include increasing mixed-use development, fostering engagement with citizens’ efforts through the Neighbors for Neighborhoods program (City of Norfolk, Virginia, Mayor’s Commission on Poverty Reduction 2014) and promoting growth in the Vision 2100 corridor of opportunity.
b. Neighborhood Asset Mapping The Department of Neighborhood Development was established in fiscal year 2014
and acts as a liaison between the city and neighborhoods. The goals of the new department are to “[monitor] the pulse of the community… [Serve] as a facilitator to respond to neighborhood issues and concerns… [and promote] neighborhood ownership by maintaining quality standards.” In particular, the department’s mentality is “to think about neighborhoods in a new way, not as problems to be solved, but as assets to celebrate and grow” (Rogers 2014). In the spirit of this approach, one of the activities within the department relating to resilience is asset mapping. The goal is for Neighborhood Development Specialists within the department to go into each neighborhood to identify important assets and understand what elements of the neighborhood are most important to residents. Norfolk officials described core neighborhood assets as built environment components, such as community recreation centers, that foster a sense of community in the neighborhood. Once assets have been identified, city resources can be prioritized to strengthen and protect city-owned or operated assets from disruption, following the notion that these assets will enable the neighborhood to better survive and recover.
68
C. Observations • Characterize communities: “Neighborhood Asset Mapping” is a practice that
allows individuals and neighborhood members an opportunity to articulate the value of services provided by public infrastructure, including components of the built environment.
• Solutions: Focusing on economic development, including diversifying economic activity beyond the current federal government concentration, and neighborhood development are core elements of long-term resilience and will lead to broader community resilience, including resilience to natural hazards.
• Implementation: Long-term horizon for strategic resilience planning removes the hurdles posed by having to consider the limitations of established land-use patterns—existing budgetary considerations, current infrastructural weaknesses, and similar factors—and allows planners to adopt a more visionary approach to comprehensive resilience planning.
69
8. Summary and Analysis for Part 2
In this chapter, the major resilience initiatives observed in the three case study communities are summarized and examples of best practices observed in the design, planning, and implementation of these initiatives are provided. Finally, overarching findings from the study are presented.
A. Major Resilience Initiatives
B. Los Angeles Resilience by Design, a report issued by the city in December 2014, represented the
culmination of multiple years of work by the mayor’s office, the USGS, and multiple city agencies, including the Departments of Water and Power. This report defines the mayor’s strategic perspective for areas of high priority for resilience investments: structural integrity of buildings, public water infrastructure and telecommunications infrastructure reliability. In addition to establishing a strategic resilience policy, the report provides specific recommended actions in the three priority areas.
Resilience by Design recommends the adoption of two mandatory building standards for soft-story buildings and a non-ductile reinforced concrete retrofit requirement (City of Los Angeles, Office of the Mayor, 2014). These building standards were adopted by the City Council and Mayor in October 2015.
C. Flagstaff The adoption of a Wildland-Urban Interface (WUI) Code by the City of Flagstaff was
a major success in achieving resilience-driven land-use planning. The code prescribes the use of fire-resistant building materials and requires clearing defensible space around structures in the WUI. The code adopted by the city is mandatory for all new construction starts in the WUI. The adopted code built upon existing voluntary preventative measures and practices widely deployed for over a decade. Extensive community outreach to stakeholders such as homebuilders associations, real estate groups, insurance groups, engineering firms, and forest protection and environmental non-governmental organizations, formed the coalition necessary to demonstrate public support.
The Flagstaff Watershed Protection Project was motivated by the 2010 Schultz Fire, which demonstrated Flagstaff’s vulnerability to wildland fire and resulting debris flows during post-fire thunderstorms. Much of the lands posing the risk to the city are within
70
Coconino National Forest and are managed by the U.S. Forest Service. The city manager’s office led a community outreach initiative to seek public support for bond sales to fund a watershed protection program, which would employ fuels-reduction activities on city-managed and National Forest lands, via a memorandum of understanding signed with U.S. Forest Service. The resulting implementation of the Flagstaff Watershed Protection Project involves staff from the City of Flagstaff, U.S. Forest Service, State of Arizona, Coconino County, Greater Flagstaff Forest Partnership, and Northern Arizona University.
D. Norfolk The City of Norfolk’s near-term resilience efforts focus on 3 areas: coastal resilience,
neighborhood development, and economic planning. A long-term, proposed plan is to be captured in a vision, strategy document titled “Vision 2100.” This document aims to capture the goals and vision for the community’s development in the year 2100, in order to understand policy changes, including city ordinances, codes, and standards would be necessary to achieve this vision. The 100 year time horizon was selected to reduce concerns that plans could affect current property ownership and land use.
The “Neighborhood Asset Mapping”, currently being implemented, is an initiative that allows individuals and neighborhood members an opportunity to articulate the value of services provided by public infrastructure, including components of the built environment.
E. Summary of Observations Resilience policy design differs from traditional hazard mitigation policy design
processes due to long-term planning horizons and a holistic planning approach required across departments and infrastructure types. Choosing a long-term horizon for strategic resilience planning, as seen in the “Vision 2100” effort, removes the hurdles posed by having to consider the limitations of established land-use patterns, existing budgetary considerations, current infrastructural weaknesses and similar factors, and allows planners to adopt a more visionary approach to comprehensive resilience planning.
The use of technical expertise in designing solutions to resilience initiatives is instrumental in getting broad-based support from city officials and community stakeholders by moving the discussion from a position-based to an issues-based dialogue. Incorporating unbiased scientific and technical leadership into a community-based effort lends credibility to policy proposals and community outreach efforts.
Additionally, a focus on the long-term economic consequences of a hazard, years to decades after the event, can convey a powerful message about the possible consequences of inaction.
71
Consistent engagement of city leadership in outreach activities increases the likelihood of community buy-in for mitigation activities.
F. Overarching Findings Resilience-relevant policy development in the communities studied is observed to be
an outcome of specific initiatives that address each community’s risks and vulnerabilities through leadership by the local government. Case study communities have incorporated resilience as a concept that encourages interagency coordination, extensive outreach to stakeholder groups, and augments existing hazard mitigation efforts. Initiatives were staffed by individuals from various parts of the city government including the Mayor or city manager’s office, public utilities department, fire management department and others. In fact, bringing together interdepartmental and interdisciplinary teams, including individuals with roles and responsibilities not commonly associated with hazard mitigation, was an effective and necessary part of the resilience planning process.
Resilience initiatives were often observed to be driven from the highest levels of municipal leadership. Staff within agencies demonstrated interest in addressing risks posed by hazards, however the top-level strategic policy guidance from leadership was necessary to establish initiatives and actions.
Scientific and technical support, generally from an unbiased, trusted, source, is critical to maintaining credibility in discussions of policy proposals and associated trade-offs. For example, the City of Los Angeles’s partnership with the Federal Government via the USGS to provide independent, trusted, and scientifically-informed hazard and disaster information to multiple stakeholders is seen by city officials as crucial to the success of their resilience initiatives. A scientific advisor who is able to effectively communicate risk, and is trusted by a broad majority of community stakeholders, can move the dialogue from a position-based to an issue-based discussion.
Collaboration – across departments, stakeholder groups and jurisdictions – is seen as a key differentiator between traditional emergency management and long-term community-focused resilience activities. However, while regional coordination of resilience and hazard mitigation programs has worked well in some communities, in others it has run into obstacles arising from differing priorities and differing perceptions of risk.
Outreach, education, and communication were key tools that all three case study communities highlighted as critical to providing support for their leadership and decision makers’ ability to adopt resilience policies and programs. City officials interviewed for each of the case study communities described their interactions with community stakeholders as instrumental to the success of resilience initiatives. These interactions were enabled through existing relationships and established community outreach processes. However, the actual design and implementation of policy, where it has taken place, was
72
solely a governmental function. With the exception of the Rockefeller Foundation, city officials did not consider NGOs and private sector entities to be partners within their policy making process.
Long-term economic impacts of disasters, beyond the loss of life and property, combined with community priorities for economic redevelopment were cited as major motivating factors for resilience and hazard mitigation policy development.
Resilience policy design differs from traditional hazard mitigation policy design processes due to long-term planning horizons and a holistic planning approach required across departments and infrastructure types.
Design and implementation of resilience initiatives are influenced by external factors. Successful implementation is dependent upon leadership recognizing the need to influence multiple factors, stakeholder groups to achieve expressed public support, and identification of windows of opportunity to push for implementation (e.g., recent disaster events, unexpected availability of funding).
A-1
Appendix A. National-Level Data on Community
Characteristics and Resilience Indicators
Table A-1 lists all social and economic indicators for which data could be found along with sources.
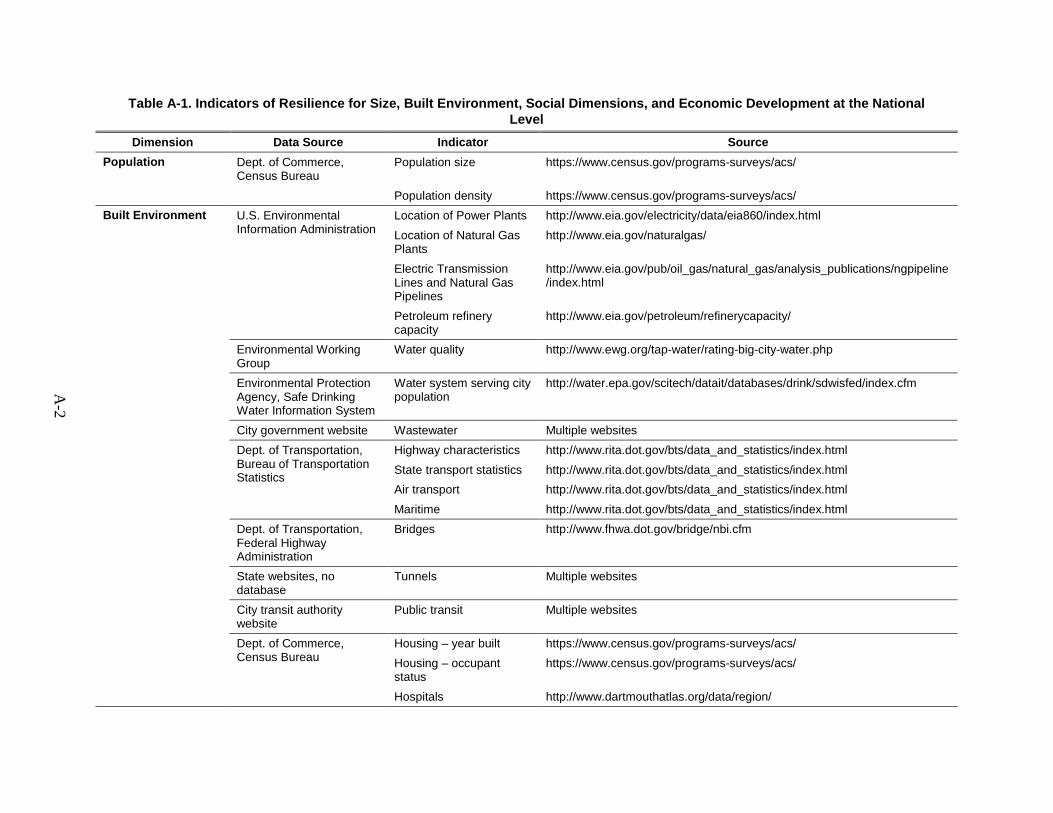
A-2
Table A-1. Indicators of Resilience for Size, Built Environment, Social Dimensions, and Economic Development at the National Level
Dimension Data Source Indicator Source Population Dept. of Commerce,
Census Bureau Population size https://www.census.gov/programs-surveys/acs/
Population density https://www.census.gov/programs-surveys/acs/ Built Environment U.S. Environmental
Information Administration Location of Power Plants http://www.eia.gov/electricity/data/eia860/index.html Location of Natural Gas Plants
http://www.eia.gov/naturalgas/
Electric Transmission Lines and Natural Gas Pipelines
http://www.eia.gov/pub/oil_gas/natural_gas/analysis_publications/ngpipeline/index.html
Petroleum refinery capacity
http://www.eia.gov/petroleum/refinerycapacity/
Environmental Working Group
Water quality http://www.ewg.org/tap-water/rating-big-city-water.php
Environmental Protection Agency, Safe Drinking Water Information System
Water system serving city population
http://water.epa.gov/scitech/datait/databases/drink/sdwisfed/index.cfm
City government website Wastewater Multiple websites Dept. of Transportation, Bureau of Transportation Statistics
Highway characteristics http://www.rita.dot.gov/bts/data_and_statistics/index.html State transport statistics http://www.rita.dot.gov/bts/data_and_statistics/index.html Air transport http://www.rita.dot.gov/bts/data_and_statistics/index.html Maritime http://www.rita.dot.gov/bts/data_and_statistics/index.html
Dept. of Transportation, Federal Highway Administration
Bridges http://www.fhwa.dot.gov/bridge/nbi.cfm
State websites, no database
Tunnels Multiple websites
City transit authority website
Public transit Multiple websites
Dept. of Commerce, Census Bureau
Housing – year built https://www.census.gov/programs-surveys/acs/ Housing – occupant status
https://www.census.gov/programs-surveys/acs/
Hospitals http://www.dartmouthatlas.org/data/region/
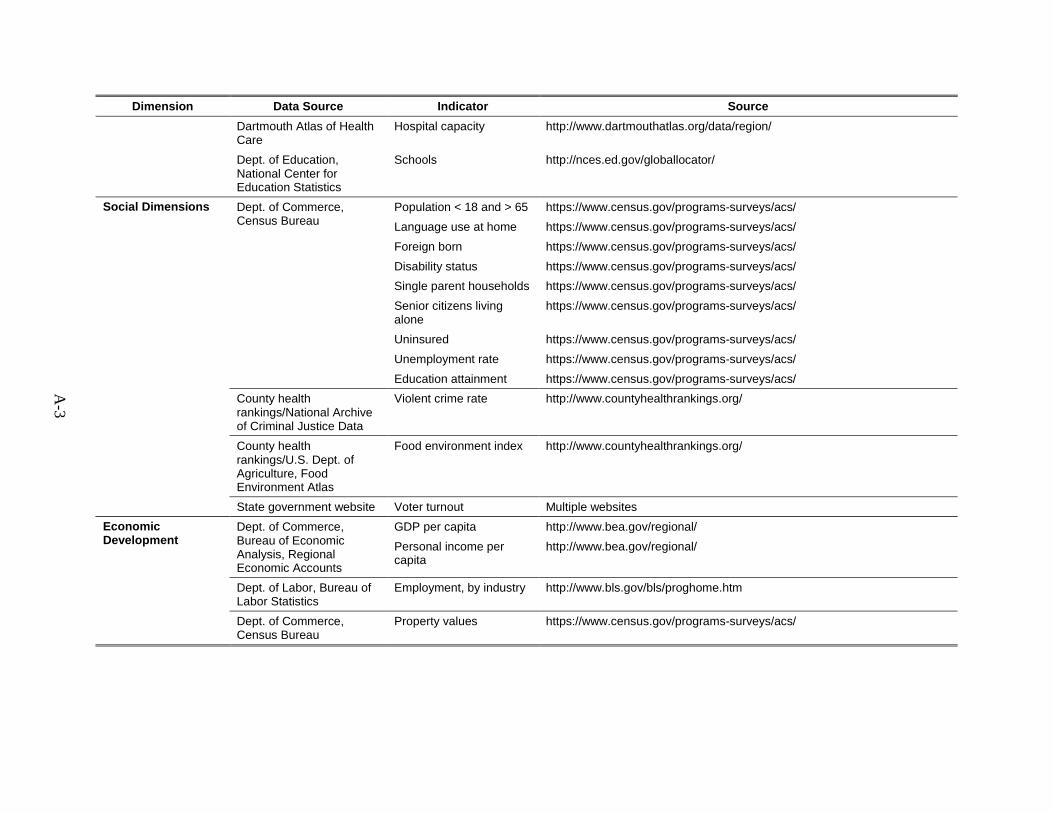
A-3
Dimension Data Source Indicator Source Dartmouth Atlas of Health Care
Hospital capacity http://www.dartmouthatlas.org/data/region/
Dept. of Education, National Center for Education Statistics
Schools http://nces.ed.gov/globallocator/
Social Dimensions Dept. of Commerce, Census Bureau
Population < 18 and > 65 https://www.census.gov/programs-surveys/acs/ Language use at home https://www.census.gov/programs-surveys/acs/ Foreign born https://www.census.gov/programs-surveys/acs/ Disability status https://www.census.gov/programs-surveys/acs/ Single parent households https://www.census.gov/programs-surveys/acs/ Senior citizens living alone
https://www.census.gov/programs-surveys/acs/
Uninsured https://www.census.gov/programs-surveys/acs/ Unemployment rate https://www.census.gov/programs-surveys/acs/ Education attainment https://www.census.gov/programs-surveys/acs/
County health rankings/National Archive of Criminal Justice Data
Violent crime rate http://www.countyhealthrankings.org/
County health rankings/U.S. Dept. of Agriculture, Food Environment Atlas
Food environment index http://www.countyhealthrankings.org/
State government website Voter turnout Multiple websites Economic Development
Dept. of Commerce, Bureau of Economic Analysis, Regional Economic Accounts
GDP per capita http://www.bea.gov/regional/ Personal income per capita
http://www.bea.gov/regional/
Dept. of Labor, Bureau of Labor Statistics
Employment, by industry http://www.bls.gov/bls/proghome.htm
Dept. of Commerce, Census Bureau
Property values https://www.census.gov/programs-surveys/acs/
B-1
Appendix B. Collection and Processing of Hazards Data and
MSAs within Regional Hazard Zones
Coastal Flooding, Riverine Flooding, Tornadoes, and Tropical Cyclones Data
The full data set for coastal flooding, riverine flooding, tornadoes, and tropical cyclones over the time period of 1992 to 2014 was downloaded on 11/20/2014 from NOAA’s National Climatic Data Center (NCDC) Storm Events Database (NOAA NCDC 2015). For the years 1992 to 2010, the data was version 1.0 and last updated on 8/24/2014. For the years 2011 and 2012, the data was version 1.0 and last updated on 9/30/2014. For the years 2013 and 2014, the data was version 1.0 and last updated on 10/22/2014. The most recent disaster event in the data set occurred on 7/31/2014. Evaluation of the data set revealed that a single event, such as Hurricane Katrina, was listed multiple times for different days and times, locations, and event types.
From the data set, the following fields were selected and used in the analysis: state_fips, year, event_type, cz_fips, injuries_direct, injuries_indirect, deaths_direct, deaths_indirect, damage_property, and damage_crops.9 The FIPS number for the event was calculated by merging the state and county FIPS values (state_fips and cz_fips). The event types coastal flooding, riverine flooding, tornadoes, and tropical cyclones were classified by merging several listed event types (event_type): coastal flooding consists of coastal flood and storm surge/tide; riverine flooding consists of flash flood, flood, and lakeshore flood; tornadoes consists of tornado and tornadoes/thunderstorms/hail; and tropical cyclones consists of hurricane, hurricane (typhoon), tropical depression, and tropical storm. To remove the not damaging events, all disaster events were categorized as either damaging or not damaging, with the definition of a damaging event having a non-zero death count, injury count, or cost to property or crops (injuries_direct, injuries_indirect, deaths_direct, deaths_indirect, damage_property, and damage_crops). As such, a not damaging event had a value of zero for all six categories.
After down-selection to only damaging events, a chart was made for each year comparing the FIPS code with the event type. The data from each year was merged to calculate the total number of damaging events by type over the time period of 1992 to 2014
9 Field definitions are available online from NOAA NCDC at
ftp://ftp.ncdc.noaa.gov/pub/data/swdi/stormevents/csvfiles/Storm-Data-Export-Format.docx.
B-2
for each FIPS code.10 From this, the data was arrayed largest to smallest for each event type. The corresponding top 50 FIPS codes were recorded for each event type along with the total number of events. For FIPS codes that had the same number of events in this listing of the top 50, the FIPS codes were arranged largest to smallest values by numerical value.
Earthquake Data The data set for earthquakes was downloaded on 12/2/2014 from the USGS
Earthquakes Archive (USGS 2015b). The criteria used in the selection of the data set was the following: start date and time (UTC) of 01/01/1992 00:00:00; end date and time (UTC) of 07/31/2014 23:59:59; minimum magnitude of 5; maximum magnitude of 10; and within a geographic region circle centered on 44.966667, – 103.76666711 with a radius of 4,700 km.
From the data set, the following fields were selected and used in the analysis: time, latitude, and longitude. The year was extracted from the time field by isolating the first four characters in the field. The longitude and latitude fields were converted into FIPS codes using the Federal Communications Commission (FCC) Census Block Conversions API (FCC 2015). If the longitude and latitude for an earthquake did not convert to a FIPS code, the earthquake event was removed from the data set, which eliminates all earthquakes with epicenters in the ocean or foreign territories. The data set was limited to earthquakes with a magnitude of five or greater, and since no estimates of death count, injury count, or cost to property or crops were listed in the data set, all events were classified as damaging.
A chart was made comparing the FIPS codes with the number of earthquakes events over the time period of 1992 to 2014. From this, the data was arrayed largest to smallest and the corresponding top 50 FIPS codes were recorded along with the total number of events. For FIPS codes that had the same number of events in this listing of the top 50, the FIPS codes were arranged largest to smallest values by numerical value.
Wildfires Data The full data set for wildfires was downloaded on 12/4/2014 from the USDA Forest
Service Data Catalog, product RDS-2013-0009.2 (Short 2013). The data was version 2.0 and last updated on 4/28/2014. The data set covers wildfires over the time period of 1992 to 2012.
10 The 1999 data was unusable in the downloaded form, as the data were not properly organized and could
not be readily fixed. 11 This latitude and longitude corresponds to the approximate geographic center of the United States,
which is located 32 km north of Belle Fourche, South Dakota (Center for Land Use Interpretation 2015).
B-3
From the data set, the following fields were selected and used in the analysis: fire_year, fire_size_class, latitude, and longitude. The longitude and latitude fields were converted into FIPS codes using the FCC Census Block Conversions API. Since no estimates of death count, injury count, or cost to property or crops were listed in the data set, all events categorized as class D, E, F, or G in the fire_size_class field were designated as damaging. For reference, class D wildfires have a final perimeter size between 100 and 299 acres, class E between 300 and 999 acres, class F between 1,000 and 4,999 acres, and class G of 5,000 or more acres.12
After down-selection to only damaging events, a chart was made comparing the FIPS codes with the number of earthquakes events over the time period of 1992 to 2012. From this, the data was arrayed largest to smallest and the corresponding top 50 FIPS codes were recorded along with the total number of events. For FIPS codes that had the same number of events in this listing of the top 50, the FIPS codes were arranged largest to smallest values by numerical value.
12 Field definitions are available from the U.S. Forest Service (Short 2013).
C-1
Appendix C. Indicator Data for Seven Case Study
Community Candidates
This appendix provides summary-level indicators across three dimensions for the seven candidate case study communities (Tables C-1 through C-7). Social Vulnerability Index (SVI) flags for the communities are also explained (Table C-8).
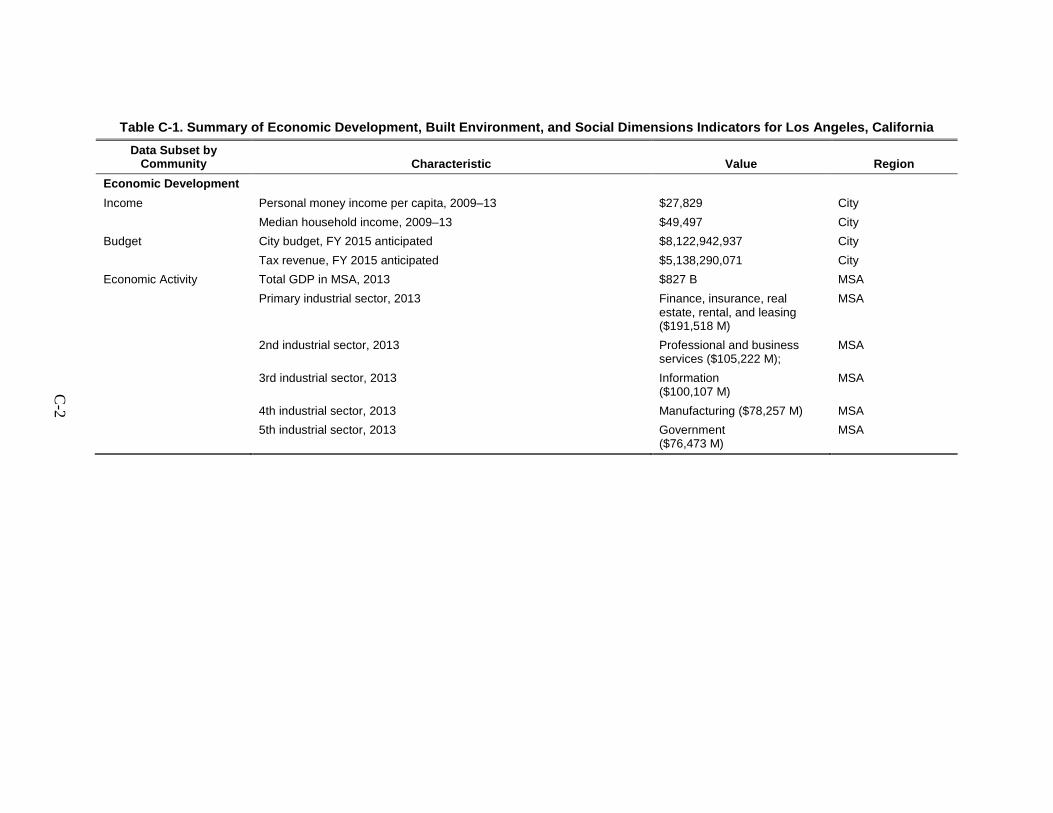
C-2
Table C-1. Summary of Economic Development, Built Environment, and Social Dimensions Indicators for Los Angeles, California Data Subset by
Community Characteristic Value Region Economic Development Income Personal money income per capita, 2009–13 $27,829 City Median household income, 2009–13 $49,497 City Budget City budget, FY 2015 anticipated $8,122,942,937 City Tax revenue, FY 2015 anticipated $5,138,290,071 City Economic Activity Total GDP in MSA, 2013 $827 B MSA Primary industrial sector, 2013 Finance, insurance, real
estate, rental, and leasing ($191,518 M)
MSA
2nd industrial sector, 2013 Professional and business services ($105,222 M);
MSA
3rd industrial sector, 2013 Information ($100,107 M)
MSA
4th industrial sector, 2013 Manufacturing ($78,257 M) MSA 5th industrial sector, 2013 Government
($76,473 M) MSA
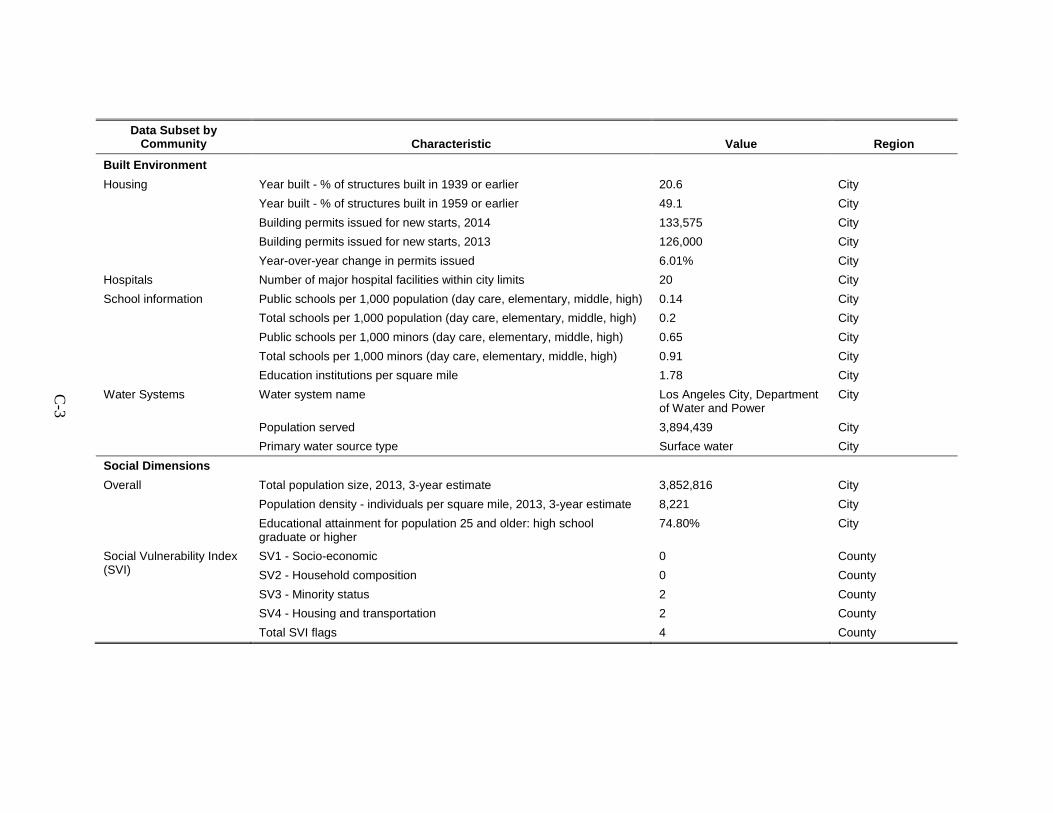
C-3
Data Subset by Community Characteristic Value Region
Built Environment Housing Year built - % of structures built in 1939 or earlier 20.6 City Year built - % of structures built in 1959 or earlier 49.1 City Building permits issued for new starts, 2014 133,575 City Building permits issued for new starts, 2013 126,000 City Year-over-year change in permits issued 6.01% City Hospitals Number of major hospital facilities within city limits 20 City School information Public schools per 1,000 population (day care, elementary, middle, high) 0.14 City Total schools per 1,000 population (day care, elementary, middle, high) 0.2 City Public schools per 1,000 minors (day care, elementary, middle, high) 0.65 City Total schools per 1,000 minors (day care, elementary, middle, high) 0.91 City Education institutions per square mile 1.78 City Water Systems Water system name Los Angeles City, Department
of Water and Power City
Population served 3,894,439 City Primary water source type Surface water City Social Dimensions Overall Total population size, 2013, 3-year estimate 3,852,816 City Population density - individuals per square mile, 2013, 3-year estimate 8,221 City Educational attainment for population 25 and older: high school
graduate or higher 74.80% City
Social Vulnerability Index (SVI)
SV1 - Socio-economic 0 County SV2 - Household composition 0 County SV3 - Minority status 2 County
SV4 - Housing and transportation 2 County Total SVI flags 4 County
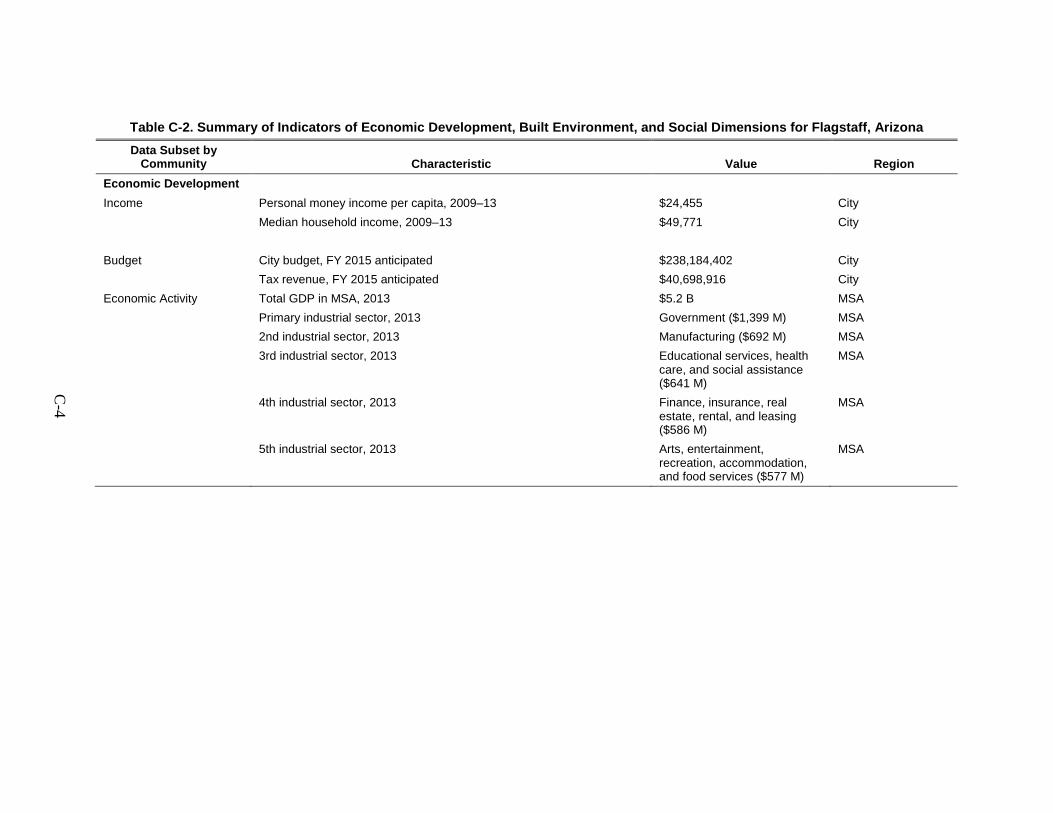
C-4
Table C-2. Summary of Indicators of Economic Development, Built Environment, and Social Dimensions for Flagstaff, Arizona Data Subset by
Community Characteristic Value Region Economic Development Income Personal money income per capita, 2009–13 $24,455 City Median household income, 2009–13 $49,771 City Budget City budget, FY 2015 anticipated $238,184,402 City Tax revenue, FY 2015 anticipated $40,698,916 City Economic Activity Total GDP in MSA, 2013 $5.2 B MSA Primary industrial sector, 2013 Government ($1,399 M) MSA 2nd industrial sector, 2013 Manufacturing ($692 M) MSA 3rd industrial sector, 2013 Educational services, health
care, and social assistance ($641 M)
MSA
4th industrial sector, 2013 Finance, insurance, real estate, rental, and leasing ($586 M)
MSA
5th industrial sector, 2013 Arts, entertainment, recreation, accommodation, and food services ($577 M)
MSA
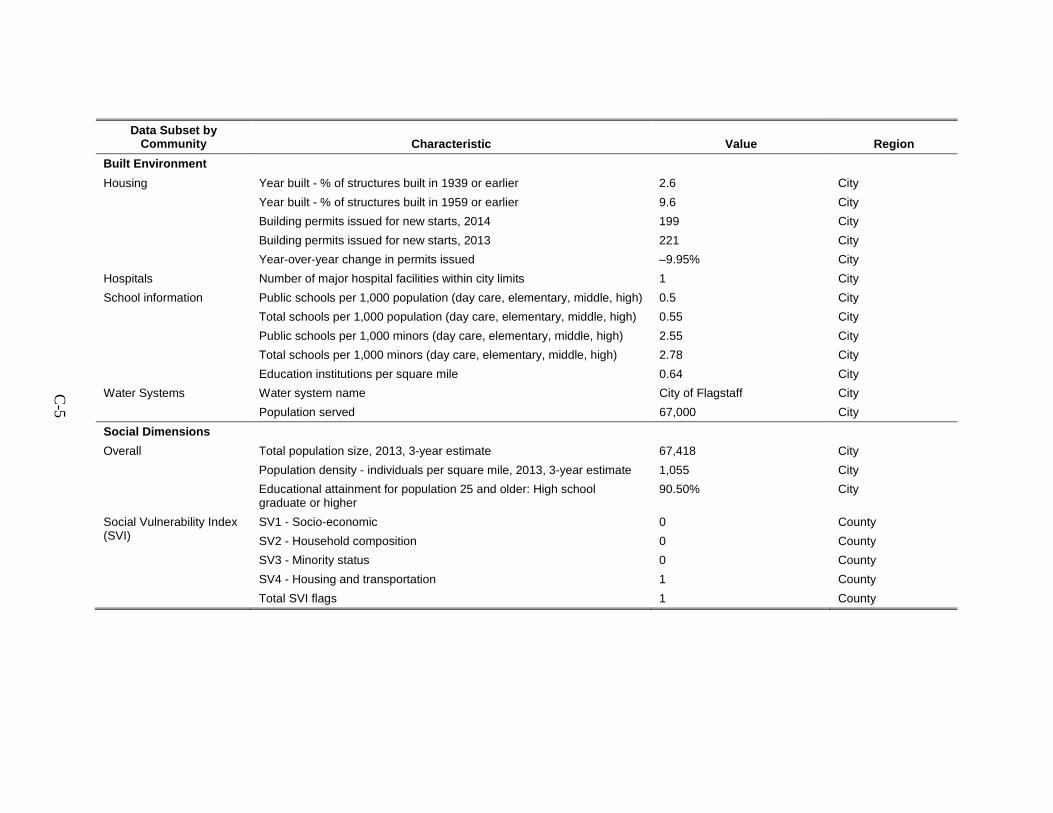
C-5
Data Subset by Community Characteristic Value Region
Built Environment Housing Year built - % of structures built in 1939 or earlier 2.6 City Year built - % of structures built in 1959 or earlier 9.6 City Building permits issued for new starts, 2014 199 City Building permits issued for new starts, 2013 221 City Year-over-year change in permits issued –9.95% City Hospitals Number of major hospital facilities within city limits 1 City School information Public schools per 1,000 population (day care, elementary, middle, high) 0.5 City Total schools per 1,000 population (day care, elementary, middle, high) 0.55 City Public schools per 1,000 minors (day care, elementary, middle, high) 2.55 City Total schools per 1,000 minors (day care, elementary, middle, high) 2.78 City Education institutions per square mile 0.64 City Water Systems Water system name City of Flagstaff City Population served 67,000 City Social Dimensions Overall Total population size, 2013, 3-year estimate 67,418 City Population density - individuals per square mile, 2013, 3-year estimate 1,055 City Educational attainment for population 25 and older: High school
graduate or higher 90.50% City
Social Vulnerability Index (SVI)
SV1 - Socio-economic 0 County SV2 - Household composition 0 County SV3 - Minority status 0 County
SV4 - Housing and transportation 1 County Total SVI flags 1 County
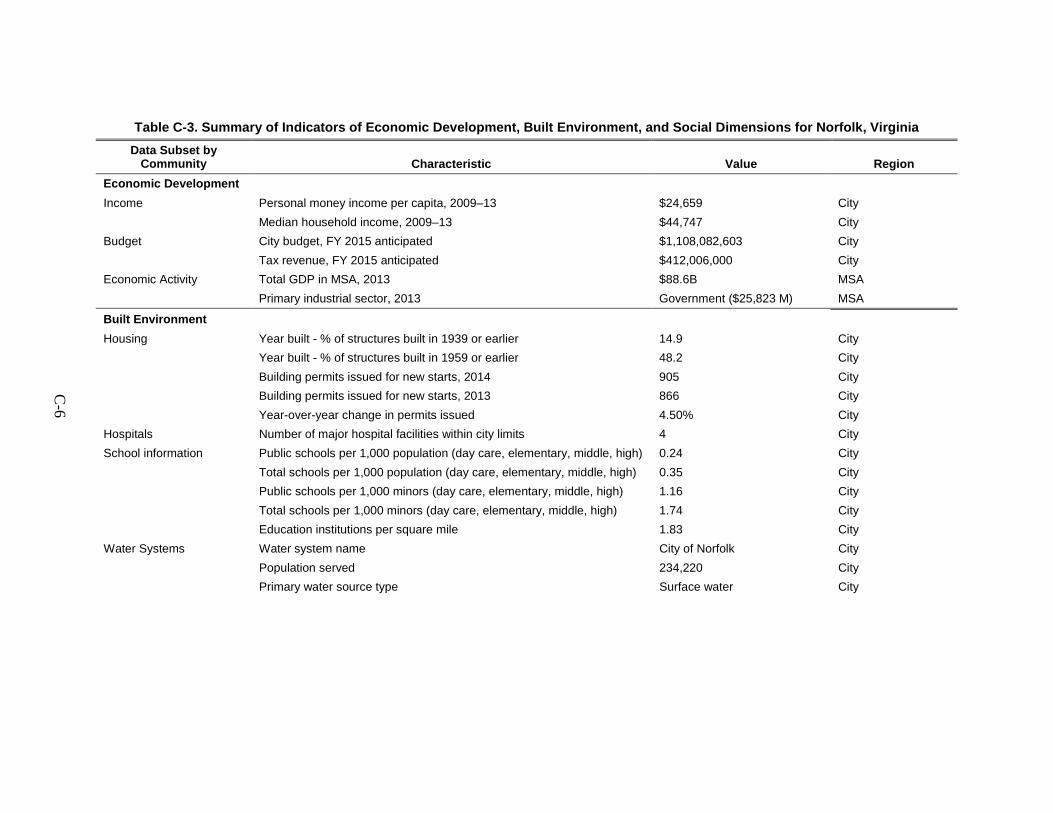
C-6
Table C-3. Summary of Indicators of Economic Development, Built Environment, and Social Dimensions for Norfolk, Virginia Data Subset by
Community Characteristic Value Region Economic Development Income Personal money income per capita, 2009–13 $24,659 City Median household income, 2009–13 $44,747 City Budget City budget, FY 2015 anticipated $1,108,082,603 City Tax revenue, FY 2015 anticipated $412,006,000 City Economic Activity Total GDP in MSA, 2013 $88.6B MSA Primary industrial sector, 2013 Government ($25,823 M) MSA
Built Environment Housing Year built - % of structures built in 1939 or earlier 14.9 City Year built - % of structures built in 1959 or earlier 48.2 City Building permits issued for new starts, 2014 905 City Building permits issued for new starts, 2013 866 City Year-over-year change in permits issued 4.50% City Hospitals Number of major hospital facilities within city limits 4 City School information Public schools per 1,000 population (day care, elementary, middle, high) 0.24 City Total schools per 1,000 population (day care, elementary, middle, high) 0.35 City Public schools per 1,000 minors (day care, elementary, middle, high) 1.16 City Total schools per 1,000 minors (day care, elementary, middle, high) 1.74 City Education institutions per square mile 1.83 City Water Systems Water system name City of Norfolk City Population served 234,220 City Primary water source type Surface water City
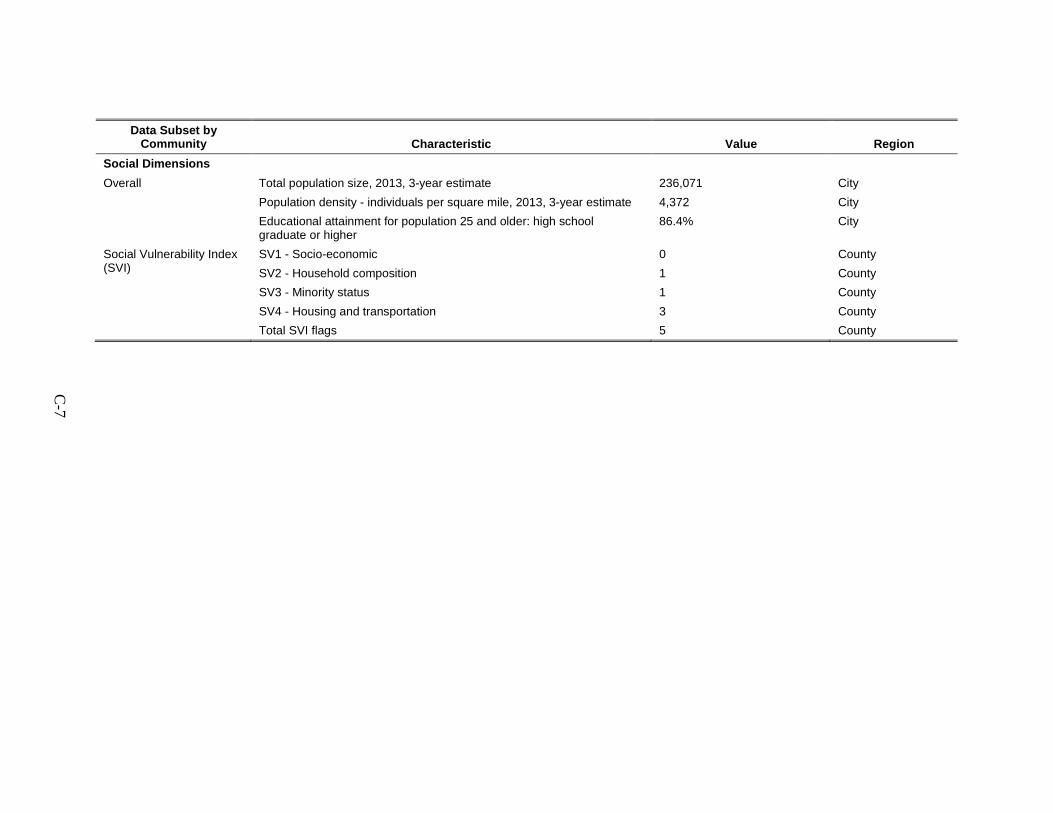
C-7
Data Subset by Community Characteristic Value Region
Social Dimensions Overall Total population size, 2013, 3-year estimate 236,071 City Population density - individuals per square mile, 2013, 3-year estimate 4,372 City Educational attainment for population 25 and older: high school
graduate or higher 86.4% City
Social Vulnerability Index (SVI)
SV1 - Socio-economic 0 County SV2 - Household composition 1 County SV3 - Minority status 1 County
SV4 - Housing and transportation 3 County Total SVI flags 5 County
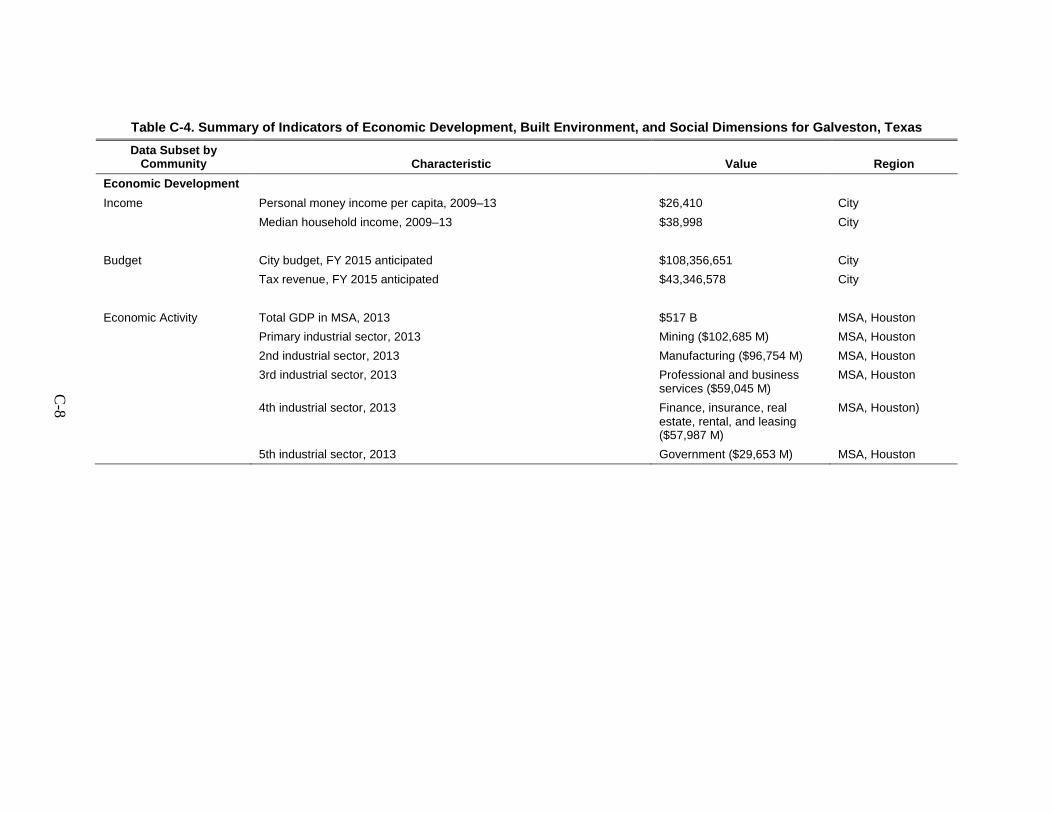
C-8
Table C-4. Summary of Indicators of Economic Development, Built Environment, and Social Dimensions for Galveston, Texas Data Subset by
Community Characteristic Value Region Economic Development Income Personal money income per capita, 2009–13 $26,410 City Median household income, 2009–13 $38,998 City Budget City budget, FY 2015 anticipated $108,356,651 City Tax revenue, FY 2015 anticipated $43,346,578 City Economic Activity Total GDP in MSA, 2013 $517 B MSA, Houston Primary industrial sector, 2013 Mining ($102,685 M) MSA, Houston 2nd industrial sector, 2013 Manufacturing ($96,754 M) MSA, Houston 3rd industrial sector, 2013 Professional and business
services ($59,045 M) MSA, Houston
4th industrial sector, 2013 Finance, insurance, real estate, rental, and leasing ($57,987 M)
MSA, Houston)
5th industrial sector, 2013 Government ($29,653 M) MSA, Houston

C-9
Data Subset by Community Characteristic Value Region
Built Environment Housing Year built - % of structures built in 1939 or earlier 19.4 City Year built - % of structures built in 1959 or earlier 34.6 City Building permits issued for new starts, 2014 N/R City Building permits issued for new starts, 2013 N/R City Year-over-year change in permits issued N/R City Hospitals Number of major hospital facilities within city limits 1 City School information Public schools per 1,000 population (day care, elementary, middle, high) 0.39 City Total schools per 1,000 population (day care, elementary, middle, high) 0.48 City Public schools per 1,000 minors (day care, elementary, middle, high) 2.05 City Total schools per 1,000 minors (day care, elementary, middle, high) 2.48 City Education institutions per square mile 0.63 City Water Systems Water System Name City of Galveston City Population Served 56,200 City Primary Water Source Type Surface water purchased City Social Dimensions Overall Total population size 48,237 City Population density - individuals per square mile 1,046 City Educational attainment for population 25 and older: high school
graduate or higher 82.3% City
Social Vulnerability Index (SVI)
SV1 - Socio-economic 0 County SV2 - Household composition 0 County SV3 - Minority status 0 County
SV4 - Housing and transportation 1 County Total SVI flags 1 County
N/R = No response received from city officials as of 2/12/15.
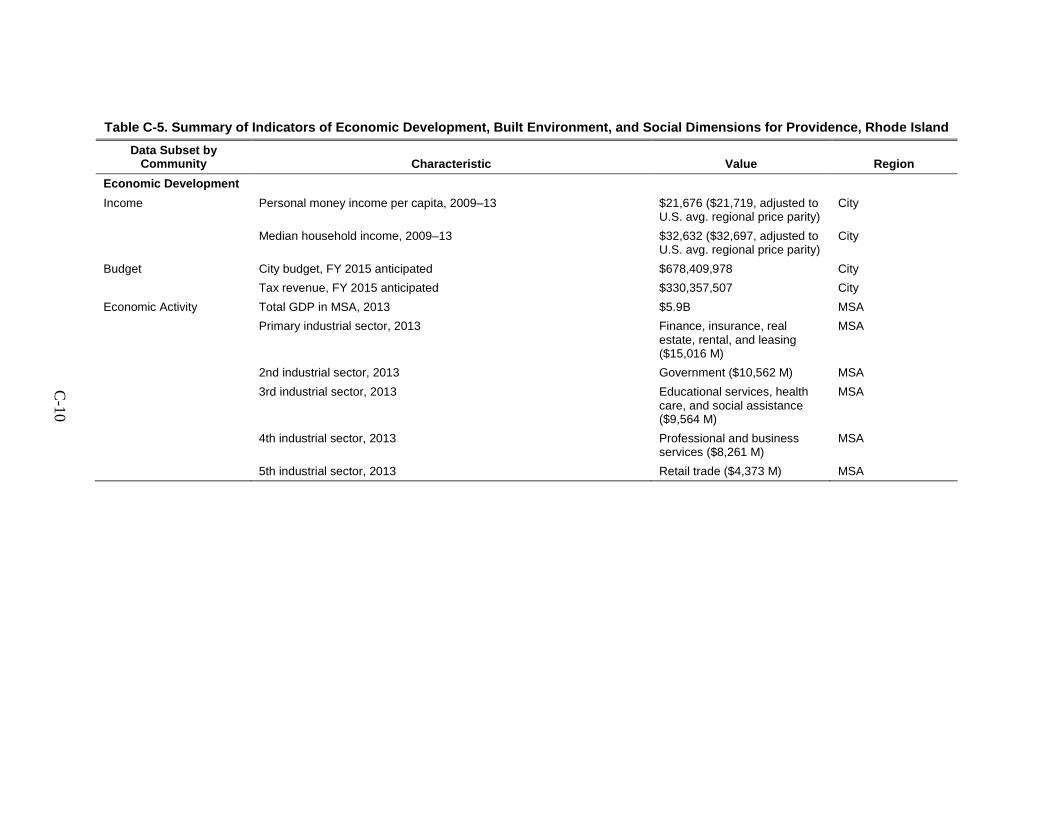
C-10
Table C-5. Summary of Indicators of Economic Development, Built Environment, and Social Dimensions for Providence, Rhode Island Data Subset by
Community Characteristic Value Region Economic Development Income Personal money income per capita, 2009–13 $21,676 ($21,719, adjusted to
U.S. avg. regional price parity) City
Median household income, 2009–13 $32,632 ($32,697, adjusted to U.S. avg. regional price parity)
City
Budget City budget, FY 2015 anticipated $678,409,978 City Tax revenue, FY 2015 anticipated $330,357,507 City Economic Activity Total GDP in MSA, 2013 $5.9B MSA Primary industrial sector, 2013 Finance, insurance, real
estate, rental, and leasing ($15,016 M)
MSA
2nd industrial sector, 2013 Government ($10,562 M) MSA 3rd industrial sector, 2013 Educational services, health
care, and social assistance ($9,564 M)
MSA
4th industrial sector, 2013 Professional and business services ($8,261 M)
MSA
5th industrial sector, 2013 Retail trade ($4,373 M) MSA
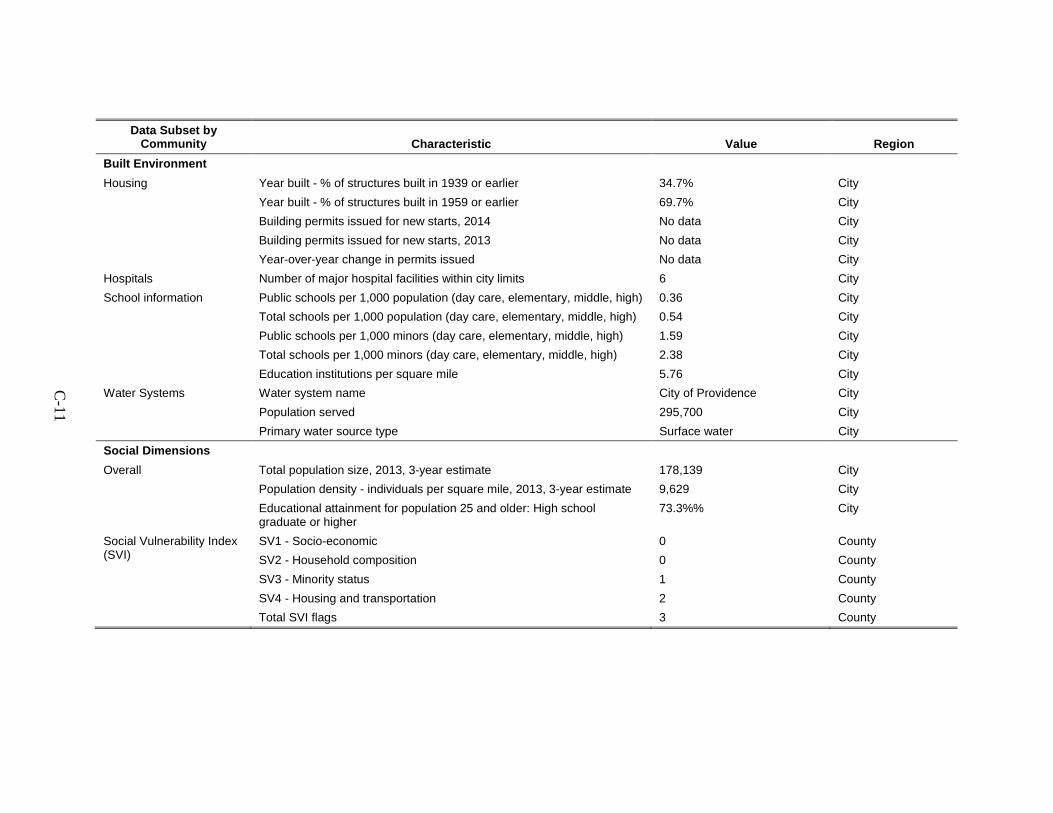
C-11
Data Subset by Community Characteristic Value Region
Built Environment Housing Year built - % of structures built in 1939 or earlier 34.7% City Year built - % of structures built in 1959 or earlier 69.7% City Building permits issued for new starts, 2014 No data City Building permits issued for new starts, 2013 No data City Year-over-year change in permits issued No data City Hospitals Number of major hospital facilities within city limits 6 City School information Public schools per 1,000 population (day care, elementary, middle, high) 0.36 City Total schools per 1,000 population (day care, elementary, middle, high) 0.54 City Public schools per 1,000 minors (day care, elementary, middle, high) 1.59 City Total schools per 1,000 minors (day care, elementary, middle, high) 2.38 City Education institutions per square mile 5.76 City Water Systems Water system name City of Providence City Population served 295,700 City Primary water source type Surface water City Social Dimensions Overall Total population size, 2013, 3-year estimate 178,139 City Population density - individuals per square mile, 2013, 3-year estimate 9,629 City Educational attainment for population 25 and older: High school
graduate or higher 73.3%% City
Social Vulnerability Index (SVI)
SV1 - Socio-economic 0 County SV2 - Household composition 0 County SV3 - Minority status 1 County
SV4 - Housing and transportation 2 County Total SVI flags 3 County
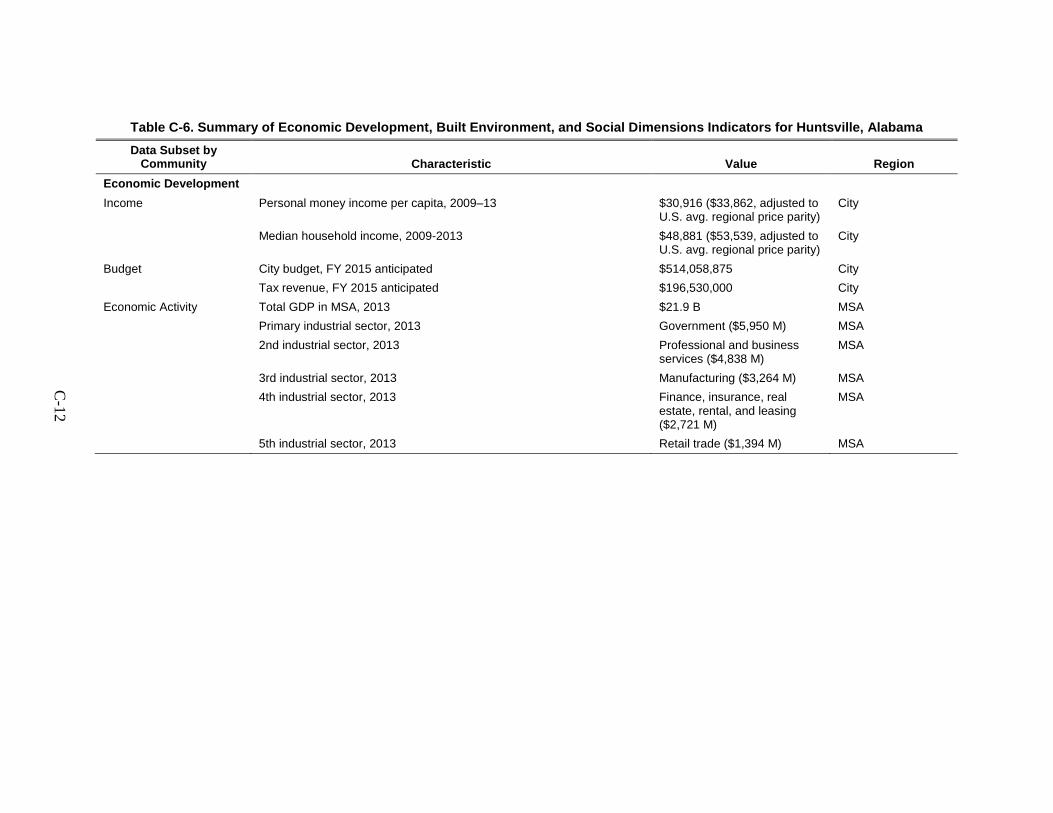
C-12
Table C-6. Summary of Economic Development, Built Environment, and Social Dimensions Indicators for Huntsville, Alabama Data Subset by
Community Characteristic Value Region Economic Development Income Personal money income per capita, 2009–13 $30,916 ($33,862, adjusted to
U.S. avg. regional price parity) City
Median household income, 2009-2013 $48,881 ($53,539, adjusted to U.S. avg. regional price parity)
City
Budget City budget, FY 2015 anticipated $514,058,875 City Tax revenue, FY 2015 anticipated $196,530,000 City Economic Activity Total GDP in MSA, 2013 $21.9 B MSA Primary industrial sector, 2013 Government ($5,950 M) MSA 2nd industrial sector, 2013 Professional and business
services ($4,838 M) MSA
3rd industrial sector, 2013 Manufacturing ($3,264 M) MSA 4th industrial sector, 2013 Finance, insurance, real
estate, rental, and leasing ($2,721 M)
MSA
5th industrial sector, 2013 Retail trade ($1,394 M) MSA
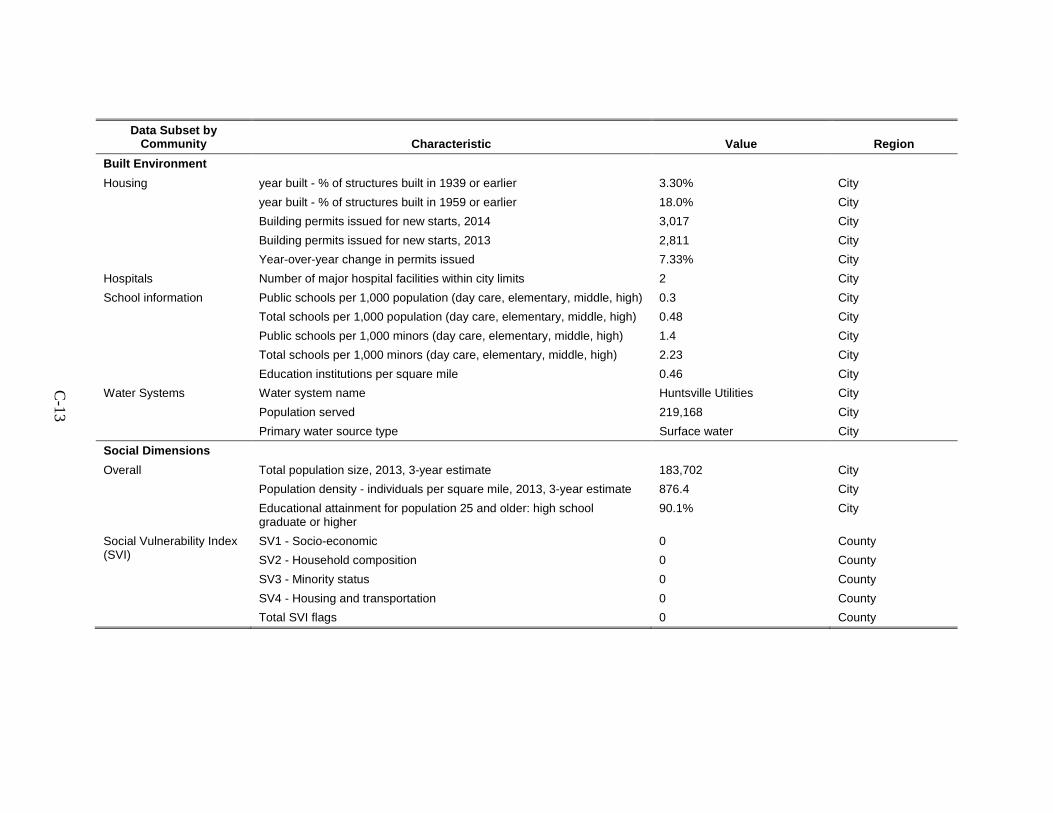
C-13
Data Subset by Community Characteristic Value Region
Built Environment Housing year built - % of structures built in 1939 or earlier 3.30% City year built - % of structures built in 1959 or earlier 18.0% City Building permits issued for new starts, 2014 3,017 City Building permits issued for new starts, 2013 2,811 City Year-over-year change in permits issued 7.33% City Hospitals Number of major hospital facilities within city limits 2 City School information Public schools per 1,000 population (day care, elementary, middle, high) 0.3 City Total schools per 1,000 population (day care, elementary, middle, high) 0.48 City Public schools per 1,000 minors (day care, elementary, middle, high) 1.4 City Total schools per 1,000 minors (day care, elementary, middle, high) 2.23 City Education institutions per square mile 0.46 City Water Systems Water system name Huntsville Utilities City Population served 219,168 City Primary water source type Surface water City Social Dimensions Overall Total population size, 2013, 3-year estimate 183,702 City Population density - individuals per square mile, 2013, 3-year estimate 876.4 City Educational attainment for population 25 and older: high school
graduate or higher 90.1% City
Social Vulnerability Index (SVI)
SV1 - Socio-economic 0 County SV2 - Household composition 0 County SV3 - Minority status 0 County
SV4 - Housing and transportation 0 County Total SVI flags 0 County
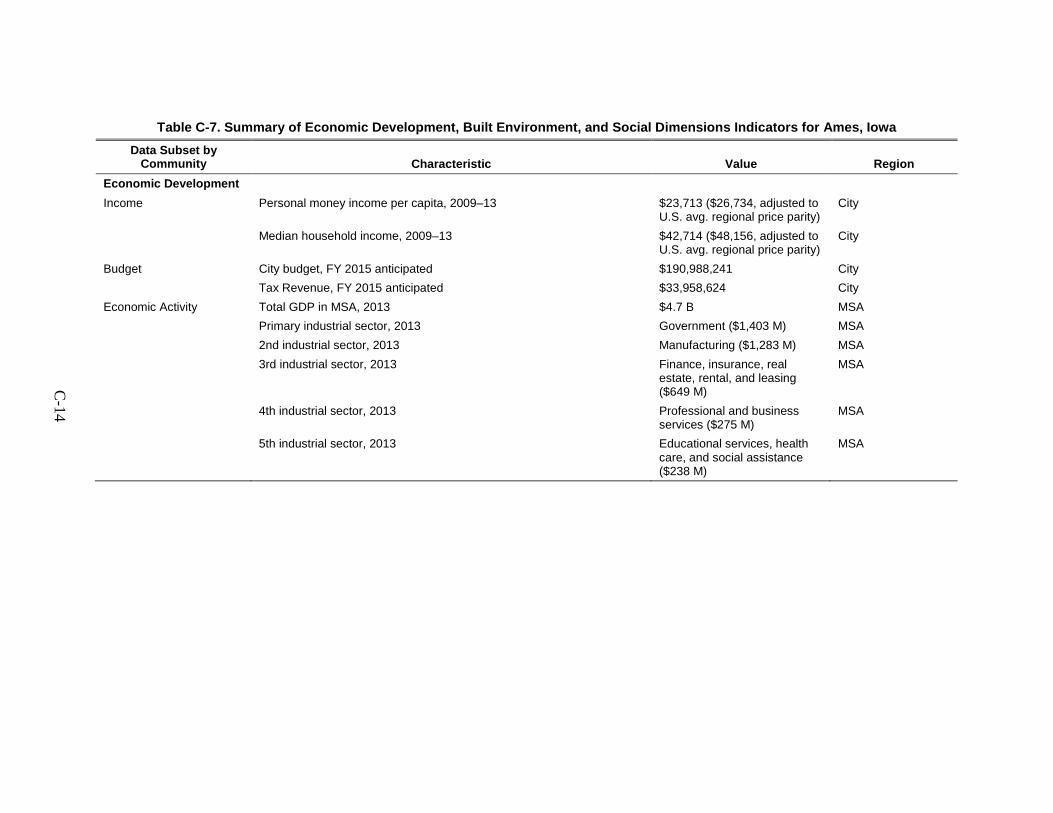
C-14
Table C-7. Summary of Economic Development, Built Environment, and Social Dimensions Indicators for Ames, Iowa Data Subset by
Community Characteristic Value Region Economic Development Income Personal money income per capita, 2009–13 $23,713 ($26,734, adjusted to
U.S. avg. regional price parity) City
Median household income, 2009–13 $42,714 ($48,156, adjusted to U.S. avg. regional price parity)
City
Budget City budget, FY 2015 anticipated $190,988,241 City Tax Revenue, FY 2015 anticipated $33,958,624 City Economic Activity Total GDP in MSA, 2013 $4.7 B MSA Primary industrial sector, 2013 Government ($1,403 M) MSA 2nd industrial sector, 2013 Manufacturing ($1,283 M) MSA 3rd industrial sector, 2013 Finance, insurance, real
estate, rental, and leasing ($649 M)
MSA
4th industrial sector, 2013 Professional and business services ($275 M)
MSA
5th industrial sector, 2013 Educational services, health care, and social assistance ($238 M)
MSA
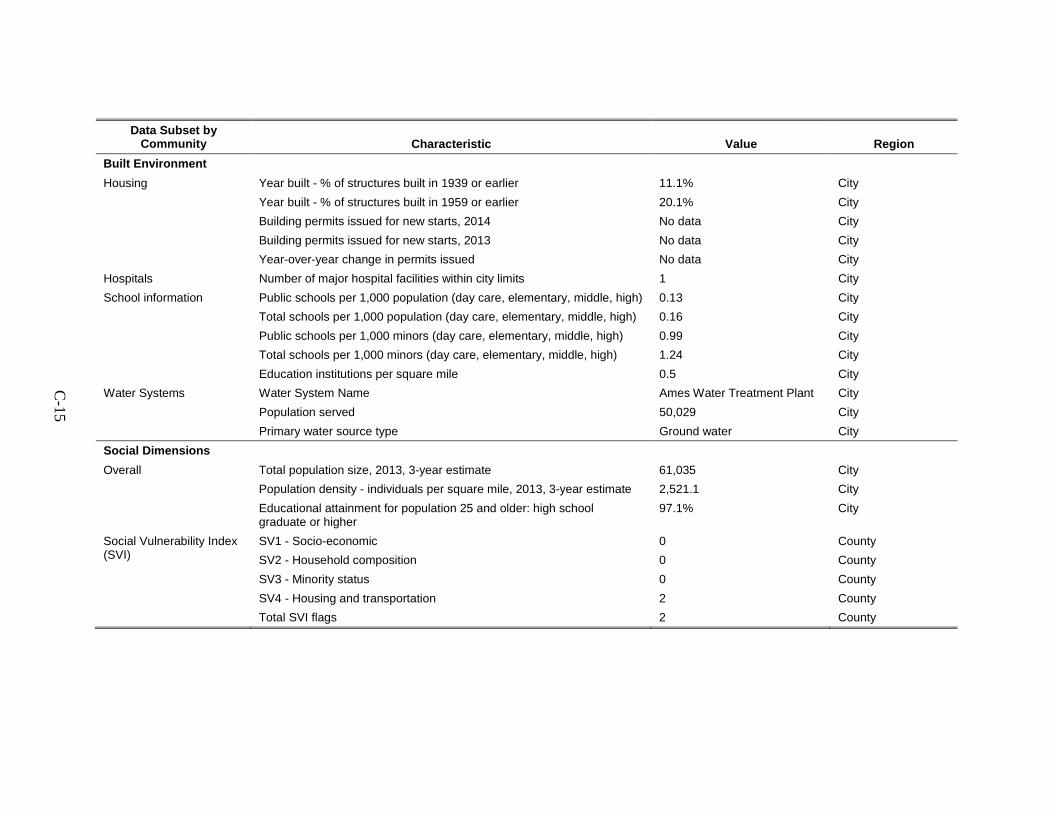
C-15
Data Subset by Community Characteristic Value Region
Built Environment Housing Year built - % of structures built in 1939 or earlier 11.1% City Year built - % of structures built in 1959 or earlier 20.1% City Building permits issued for new starts, 2014 No data City Building permits issued for new starts, 2013 No data City Year-over-year change in permits issued No data City Hospitals Number of major hospital facilities within city limits 1 City School information Public schools per 1,000 population (day care, elementary, middle, high) 0.13 City Total schools per 1,000 population (day care, elementary, middle, high) 0.16 City Public schools per 1,000 minors (day care, elementary, middle, high) 0.99 City Total schools per 1,000 minors (day care, elementary, middle, high) 1.24 City Education institutions per square mile 0.5 City Water Systems Water System Name Ames Water Treatment Plant City Population served 50,029 City Primary water source type Ground water City Social Dimensions Overall Total population size, 2013, 3-year estimate 61,035 City Population density - individuals per square mile, 2013, 3-year estimate 2,521.1 City Educational attainment for population 25 and older: high school
graduate or higher 97.1% City
Social Vulnerability Index (SVI)
SV1 - Socio-economic 0 County SV2 - Household composition 0 County SV3 - Minority status 0 County
SV4 - Housing and transportation 2 County Total SVI flags 2 County
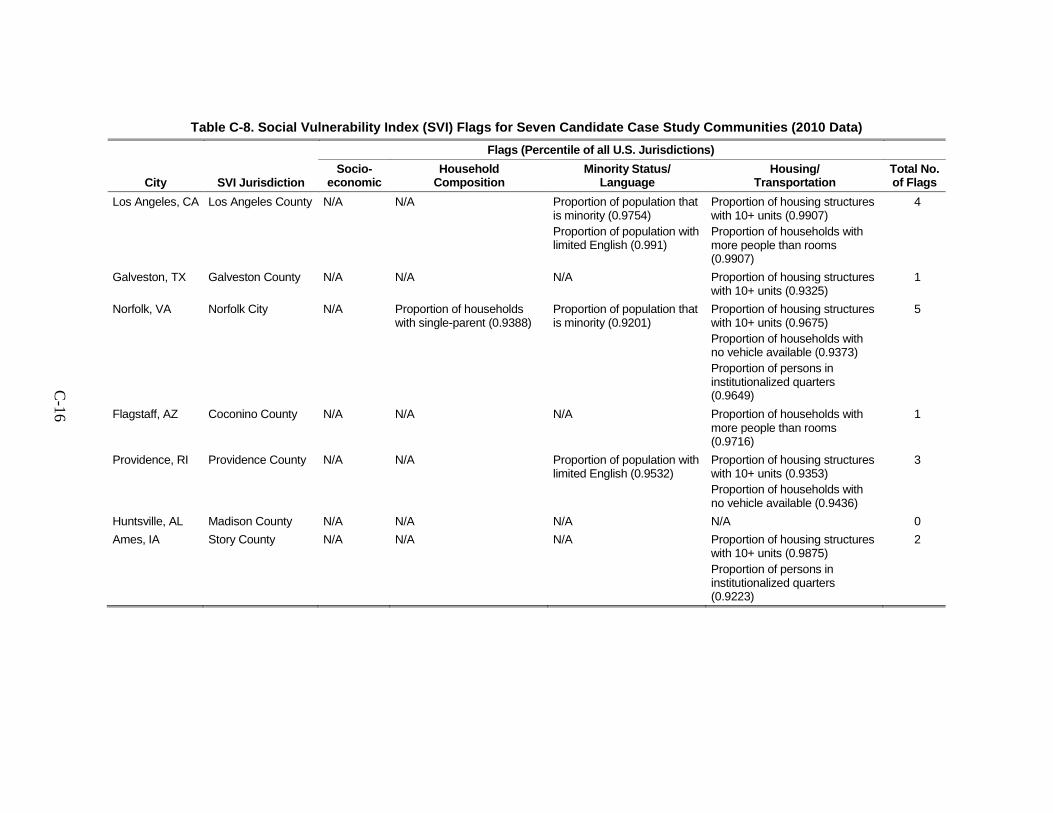
C-16
Table C-8. Social Vulnerability Index (SVI) Flags for Seven Candidate Case Study Communities (2010 Data) Flags (Percentile of all U.S. Jurisdictions)
City SVI Jurisdiction Socio-
economic Household
Composition Minority Status/
Language Housing/
Transportation Total No. of Flags
Los Angeles, CA Los Angeles County N/A N/A Proportion of population that is minority (0.9754) Proportion of population with limited English (0.991)
Proportion of housing structures with 10+ units (0.9907) Proportion of households with more people than rooms (0.9907)
4
Galveston, TX Galveston County N/A N/A N/A Proportion of housing structures with 10+ units (0.9325)
1
Norfolk, VA Norfolk City N/A Proportion of households with single-parent (0.9388)
Proportion of population that is minority (0.9201)
Proportion of housing structures with 10+ units (0.9675) Proportion of households with no vehicle available (0.9373) Proportion of persons in institutionalized quarters (0.9649)
5
Flagstaff, AZ Coconino County N/A N/A N/A Proportion of households with more people than rooms (0.9716)
1
Providence, RI Providence County N/A N/A Proportion of population with limited English (0.9532)
Proportion of housing structures with 10+ units (0.9353) Proportion of households with no vehicle available (0.9436)
3
Huntsville, AL Madison County N/A N/A N/A N/A 0 Ames, IA Story County N/A N/A N/A Proportion of housing structures
with 10+ units (0.9875) Proportion of persons in institutionalized quarters (0.9223)
2
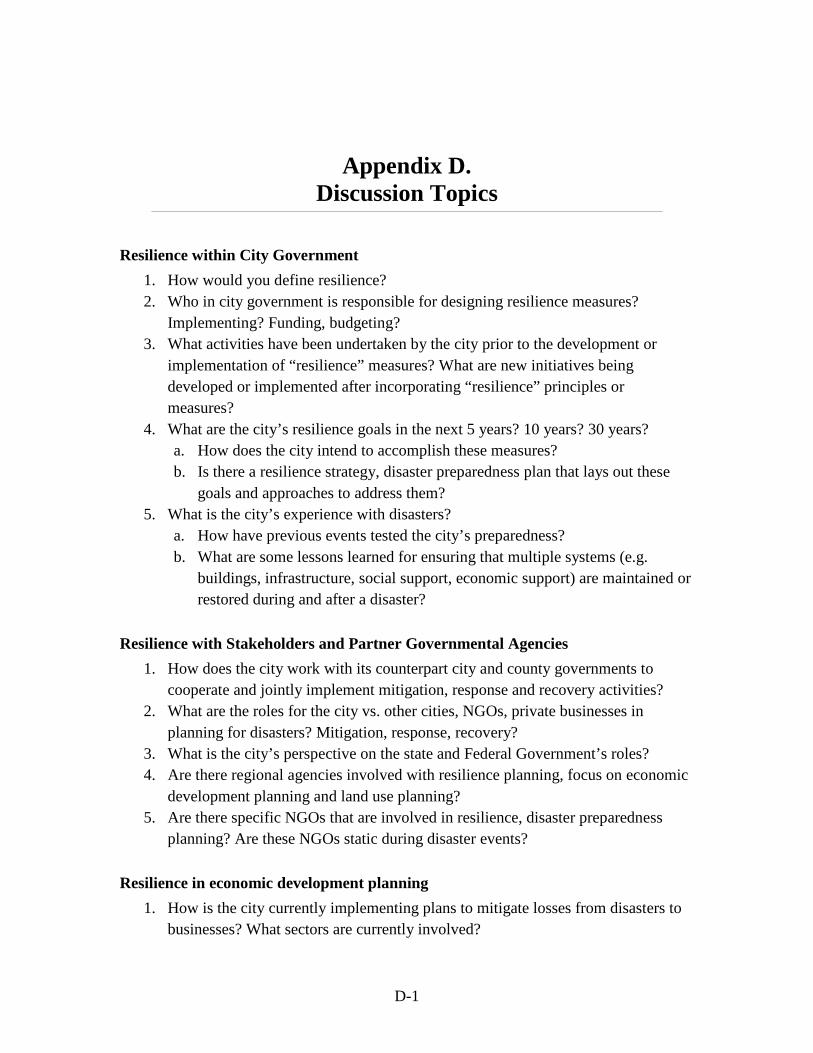
D-1
Appendix D. Discussion Topics
Resilience within City Government 1. How would you define resilience? 2. Who in city government is responsible for designing resilience measures?
Implementing? Funding, budgeting? 3. What activities have been undertaken by the city prior to the development or
implementation of “resilience” measures? What are new initiatives being developed or implemented after incorporating “resilience” principles or measures?
4. What are the city’s resilience goals in the next 5 years? 10 years? 30 years? a. How does the city intend to accomplish these measures? b. Is there a resilience strategy, disaster preparedness plan that lays out these
goals and approaches to address them? 5. What is the city’s experience with disasters?
a. How have previous events tested the city’s preparedness? b. What are some lessons learned for ensuring that multiple systems (e.g.
buildings, infrastructure, social support, economic support) are maintained or restored during and after a disaster?
Resilience with Stakeholders and Partner Governmental Agencies 1. How does the city work with its counterpart city and county governments to
cooperate and jointly implement mitigation, response and recovery activities? 2. What are the roles for the city vs. other cities, NGOs, private businesses in
planning for disasters? Mitigation, response, recovery? 3. What is the city’s perspective on the state and Federal Government’s roles? 4. Are there regional agencies involved with resilience planning, focus on economic
development planning and land use planning? 5. Are there specific NGOs that are involved in resilience, disaster preparedness
planning? Are these NGOs static during disaster events?
Resilience in economic development planning 1. How is the city currently implementing plans to mitigate losses from disasters to
businesses? What sectors are currently involved?
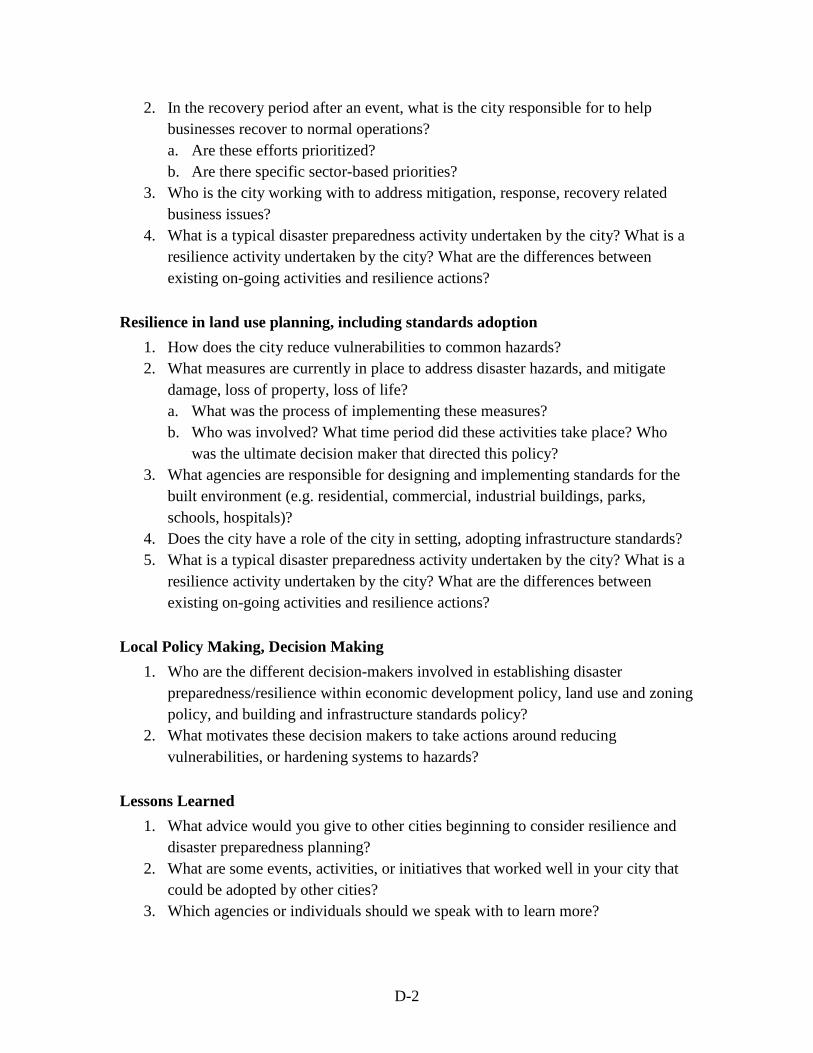
D-2
2. In the recovery period after an event, what is the city responsible for to help businesses recover to normal operations? a. Are these efforts prioritized? b. Are there specific sector-based priorities?
3. Who is the city working with to address mitigation, response, recovery related business issues?
4. What is a typical disaster preparedness activity undertaken by the city? What is a resilience activity undertaken by the city? What are the differences between existing on-going activities and resilience actions?
Resilience in land use planning, including standards adoption 1. How does the city reduce vulnerabilities to common hazards? 2. What measures are currently in place to address disaster hazards, and mitigate
damage, loss of property, loss of life? a. What was the process of implementing these measures? b. Who was involved? What time period did these activities take place? Who
was the ultimate decision maker that directed this policy? 3. What agencies are responsible for designing and implementing standards for the
built environment (e.g. residential, commercial, industrial buildings, parks, schools, hospitals)?
4. Does the city have a role of the city in setting, adopting infrastructure standards? 5. What is a typical disaster preparedness activity undertaken by the city? What is a
resilience activity undertaken by the city? What are the differences between existing on-going activities and resilience actions?
Local Policy Making, Decision Making 1. Who are the different decision-makers involved in establishing disaster
preparedness/resilience within economic development policy, land use and zoning policy, and building and infrastructure standards policy?
2. What motivates these decision makers to take actions around reducing vulnerabilities, or hardening systems to hazards?
Lessons Learned 1. What advice would you give to other cities beginning to consider resilience and
disaster preparedness planning? 2. What are some events, activities, or initiatives that worked well in your city that
could be adopted by other cities? 3. Which agencies or individuals should we speak with to learn more?
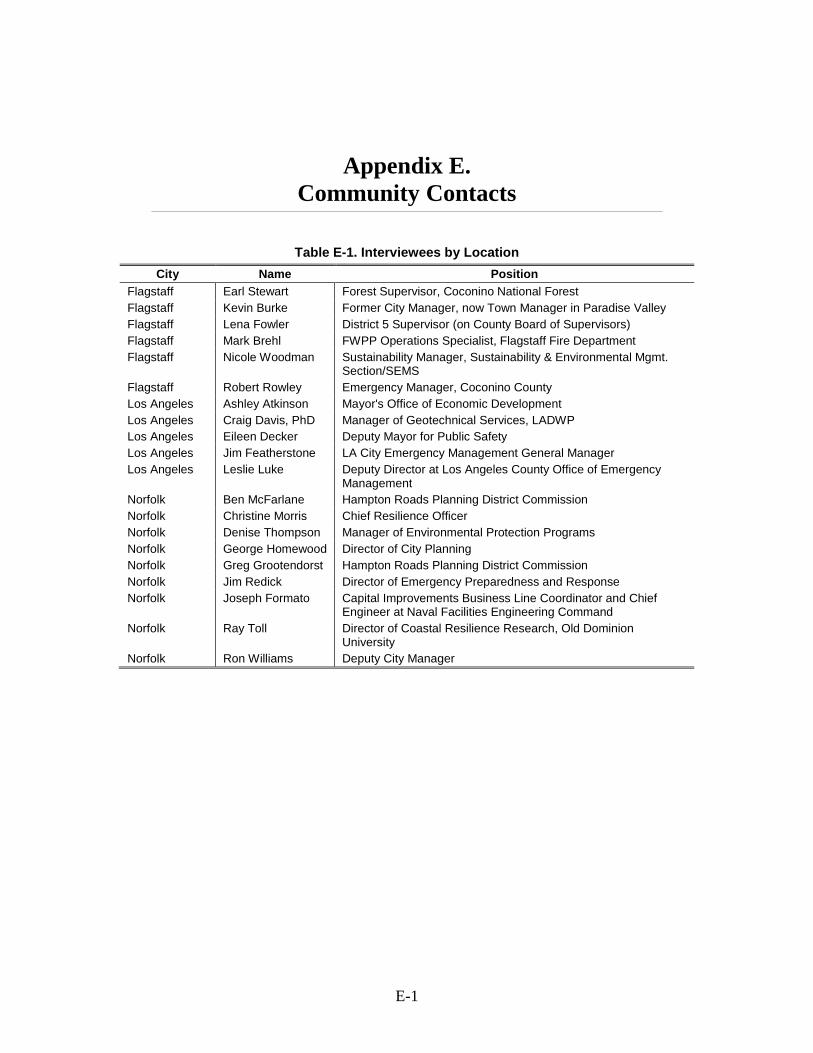
E-1
Appendix E. Community Contacts
Table E-1. Interviewees by Location City Name Position
Flagstaff Earl Stewart Forest Supervisor, Coconino National Forest Flagstaff Kevin Burke Former City Manager, now Town Manager in Paradise Valley Flagstaff Lena Fowler District 5 Supervisor (on County Board of Supervisors) Flagstaff Mark Brehl FWPP Operations Specialist, Flagstaff Fire Department Flagstaff Nicole Woodman Sustainability Manager, Sustainability & Environmental Mgmt.
Section/SEMS Flagstaff Robert Rowley Emergency Manager, Coconino County Los Angeles Ashley Atkinson Mayor's Office of Economic Development Los Angeles Craig Davis, PhD Manager of Geotechnical Services, LADWP Los Angeles Eileen Decker Deputy Mayor for Public Safety Los Angeles Jim Featherstone LA City Emergency Management General Manager Los Angeles Leslie Luke Deputy Director at Los Angeles County Office of Emergency
Management Norfolk Ben McFarlane Hampton Roads Planning District Commission Norfolk Christine Morris Chief Resilience Officer Norfolk Denise Thompson Manager of Environmental Protection Programs Norfolk George Homewood Director of City Planning Norfolk Greg Grootendorst Hampton Roads Planning District Commission Norfolk Jim Redick Director of Emergency Preparedness and Response Norfolk Joseph Formato Capital Improvements Business Line Coordinator and Chief
Engineer at Naval Facilities Engineering Command Norfolk Ray Toll Director of Coastal Resilience Research, Old Dominion
University Norfolk Ron Williams Deputy City Manager
F-1
References
Agency for Toxic Substances and Disease Registry. 2015. “Social Vulnerability Index (SVI).” http://svi.cdc.gov/.
American Planning Association. 2010. “Hazard Mitigation: Integrating Best Practices into Planning.” Edited by James C. Schwab. https://www.fema.gov/media-library/assets/documents/19261.
Anderson, C. J. 2011. Iowa Climate Change Adaptation and Resilience: Applying Climate Data to Plans and Ordinances. Presented at Integrating Hazard Planning into Comprehensive Plans, September 2, Des Moines, Iowa. http://planiowa.com/downloads/training_11-11/Applying_Climate_Data_to_Hazard_Mitigation_Planning-Chris_Anderson.pdf.
Applegate, A. 2011. “Irene Cost $7.2B Nationwide, $28.3M in South Hampton Roads.” Virginian-Pilot, September 1. http://hamptonroads.com/2011/09/irene-cost-72b-nationwide-283m-south-hampton-roads.
Applegate, A. 2014. “Norfolk Hires Chief Officer for ‘Catastrophic Events’.” Virginian-Pilot, June 28. http://hamptonroads.com/2014/06/norfolk-hires-chief-officer-catastrophic-events.
California Office of Emergency Services. Undated. “California Disasters Since 1950.” http://lacoa.org/PDF/LADisasters.pdf.
Center for Land Use Interpretation, 2015. “Geographic Center of the 50 United States of America.” http://clui.org/ludb/site/geographic-center-50-united-states-america.
Chandra, A., J. Acosta, S. Howard, L. Uscher-Pines, M. Williams, D. Yeung, J. Garnett, and L. S. Meredith. 2011. Building Community Resilience to Disasters: A Way Forward to Enhance National Health Security. Santa Monica, CA: RAND Corporation. http://www.rand.org/pubs/technical_reports/TR915 .
City of Ames, Iowa. 2014a. Flood Mitigation Regulatory Options. Attachment to “City Council Workshop—February 18, 2014.” Memorandum from B. Kindred to Ames, Iowa, Mayor and City Council. http://www.cityofames.org/modules/showdocument.aspx?documentid=15735.
City of Ames, Iowa. 2014b. Ames Flood Mitigation Study. http://www.cityofames.org/modules/showdocument.aspx?documentid=18861.
City of Flagstaff, Arizona. 2012. The Cohesive Strategy in Action. Presentation provided to study team. Flagstaff Watershed Protection Project.
City of Flagstaff, Arizona. 2012. City of Flagstaff Resiliency and Preparedness Study. http://www.flagstaff.az.gov/DocumentCenter/Home/View/38841.
F-2
City of Flagstaff, Arizona, and Flagstaff Ranger District, Coconino National Forest. 2012. Flagstaff Watershed Protection Project Executive Summary & Implementation Plan. http://www.flagstaff.az.gov/DocumentCenter/View/41236.
City of Huntsville, Alabama. 2015. “Flood Mitigation.” http://www.huntsvilleal.gov/engineering/floodmitigation.php.
City of Los Angeles, California, Office of the Mayor. 2014. Resilience by Design. http://www.seaonc.org/sites/default/files/article/resilience_by_design.pdf.
City of Norfolk, Virginia. 2015a. Coastal Resilience Strategy. http://www.norfolk.gov/DocumentCenter/View/16292.
City of Norfolk, Virginia. 2015b. “Flooding Awareness and Mitigation: What the City Is Doing.” http://www.norfolk.gov/index.aspx?NID=1060.
City of Norfolk, Virginia. 2015c. “Help Us Write a Zoning Ordinance for the 21st Century.” http://www.norfolk.gov/CivicAlerts.aspx?AID=1678&ARC=2759.
City of Norfolk, Virginia. 2015d. Norfolk’s 100 Resilient Cities Grant. http://www.norfolk.gov/AgendaCenter/ViewFile/Item/1333?fileID=1609.
City of Norfolk, Virginia. 2015e. Proposed FY 2016 Budget in Brief. http://www.norfolk.gov/DocumentCenter/View/21140.
City of Norfolk, Virginia. 2015f. City Report 2015: Norfolk. http://www.reinvestinitiative.org/reports/RE.invest_Norfolk-City-Report.pdf.
City of Norfolk, Virginia, Mayor’s Commission on Poverty Reduction. 2014. Norfolk Plan to Reduce Poverty. Prepared by Communitas Consulting, June. http://www.norfolk.gov/DocumentCenter/View/16632.
City of Providence, Rhode Island. 2015a. “Fox Point Hurricane Barrier Facts.” https://www.providenceri.com/efile/705.
City of Providence, Rhode Island. 2015b. “Rhode Island Business Alliance.” http://www.providenceri.com/PEMA/pema-for-businesses.
Coconino County, Arizona. 2013. “Schultz Fire, Coconino National Forest Recovery.” http://www.coconino.az.gov/DocumentCenter/View/3710.
County of Los Angeles Hazards and Threats. 2012. “History of Floods, Mudslides, Debris Flows, Landslides in Los Angeles County Operational Area.” http://lacoa.org/PDF/HazardsandThreats/Landslides/HAZARDS%20AND%20THREAT%20FLOODS%20-%20MUDSLIDES%20-%20LANDSLIDES%20HISTORY.pdf.
Cowan, E. 2014. “Making a (Better” Case for Forest Restoration.” Arizona Daily Sun, November 9. http://azdailysun.com/news/making-a-better-case-for-forest-restoration/article_82bbc446-359a-5665-b21f-f152860f3178.html.
Cutter, S. L., L. Barnes, M. Berry, C. Burton, E. Evans, E. Tate, and J. Webb. 2008. “A Place-Based Model for Understanding Community Resilience to Natural Disasters.” Global Environmental Change 18: 598–606. http://people.oregonstate.edu/~hammerr/SVI/Cutter_etal_GEC_2008.pdf.
F-3
Daniell, J. E., B. Khazai, F. Wenzel, and A. Vervaeck. 2012. “The Worldwide Economic Impact of Historic Earthquakes.” 15th WCEE.
Dave, P. 2014. “4,500 Acres Burn in Arizona’s Slide Fire between Sedona, Flagstaff,” Los Angeles Times, May 21. http://www.latimes.com/nation/la-na-nn-slide-fire-sedona-20140521-story.html.
Davis, C. A., and T. D. O’Rourke. 2011. “ShakeOut Scenario: Water System Impacts from A M7.8 San Andreas Earthquake.” EERI Spectra 27 (2).
Eggleston, J., and J. Pope. 2013. Land Subsidence and Relative Sea-level Rise in the Southern Chesapeake Bay Region. U.S. Department of the Interior, U.S. Geological Survey. Circular 1392. doi: 10.3133/cir1392.
Eisenman, D., A. Chandra, S. Fogleman, A. Magana, A. Hendricks, K. Wells, M. Williams, J. Tank, and A. Piough. 2014. “The Los Angeles County Community Disaster Resilience Project—A Community-Level, Public Health Initiative to Build Community Disaster Resilience.” International Journal of Environmental Research and Public Health 11 (8): 8475–90.
Fears, D. 2012. “Built on Sinking Ground, Norfolk Tries to Hold Back Tide Amid Sea-Level Rise.” Washington Post, June 17. http://www.washingtonpost.com/national/health-science/built-on-sinking-ground-norfolk-tries-to- hold-back-tide-amid-sea-level-rise/2012/06/17/gJQADUsxjV_story.html.
Federal Communications Commission. 2015. “Census Block Conversions API.” http://www.fcc.gov/developers/census-block-conversions-api.
Federal Emergency Management Agency (FEMA). 2009. “Unreinforced Masonry Buildings and Earthquakes: Developing Successful Risk Reduction Programs: Developing Successful Risk Reduction Programs.” FEMA P-774. http://www.fema.gov/media-library-data/20130726-1728-25045-2959/femap774.pdf.
Firewise Communities Program. 2015. “About Firewise.” http://www.firewise.org/about.aspx.
Flagstaff Fire Department. 2015a. Flagstaff Wildland Urban Interface Code, http://flagstaff.az.gov/DocumentCenter/Home/View/15335.
Flagstaff Fire Department. 2015b. It Works! http://flagstaff.az.gov/DocumentCenter/Home/View/15400.
Forests and Rangelands. 2015. “National Cohesive Wildland Fire Management Strategy.” http://www.forestsandrangelands.gov/strategy/.
Forster, D. 2011. “Storm Surge from Hurricane Irene Falls Short of Predictions.” Virginian-Pilot, August 28. http://hamptonroads.com/2011/08/storm-surge-hurricane-irene-falls-short-predictions.
Frost, P. 2011. “State of the Region Report: Hampton Roads Economy Faces a Decade of ‘Shared Sacrifice’.” Daily Press, October 4. http://articles.dailypress.com/2011-10-
F-4
04/business/dp-nws-state-of-the-region20111004_1_defense-budget-defense-spending-economic-recovery.
Greater Flagstaff Forests Partnership and Ponderosa Fire Advisory Council. 2005. Community Wildfire Protection Plan. January. http://gffp.org/wp-content/uploads/2013/09/About-CWPP_full-_Report_2006.pdf.
Greater Flagstaff Forests Partnership. 2015. “About the GFFP.” http://gffp.org/about/.
Haas, S. 2010. “Effects of 2010 Ames Flood Linger.” Iowa State Daily (October 18). http://www.iowastatedaily.com/news/article_8c1d9ce8-daec-11df-874c-001cc4c002e0.html.
Hampton Roads Planning District Commission (HRPDC). 2011. Southside Hampton Roads Hazard Mitigation Plan. August Draft. http://www.hrpdcva.gov/uploads/docs/2011%20Southside%20HR%20Hazard%20Mitigation%20Plan.pdf.
Hazards and Vulnerability Research Institute. 2015. “Social Vulnerability Index for the United States—2006–2010.” http://webra.cas.sc.edu/hvri/products/sovi.aspx.
Hufty, M. 2011. “Investigating Policy Processes: The Governance Analytical Framework (GAF).” In Research for Sustainable Development: Foundations, Experiences, and Perspectives, edited by U. Wiesmann and H. Hurni, 403–424 Bern, Switzerland: Geographica Bernensia. http://ssrn.com/abstract=2019005.
International Federation of Red Cross and Red Crescent Societies. 2012. World Disasters Report 2004 – From Risk to Resilience – Helping Communities Cope with Crisis. http://www.ifrc.org/publications-and-reports/world-disasters-report/wdr2004/.
Islam, T., I. W. Merrell, and W. Seitz. 2010. “Galveston Futures: Developing a Disaster Resilient Community.” Journal of Geography and Regional Planning 3 (1, 2010): 001–007.
Joukowsky Institute for Archaeology and the Ancient World (JIAAW). 2015. “Architecture and Memory, Remembering Providence’s Hurricanes.” http://proteus.brown.edu/architectureandmemory/8084 (password required).
Keifer, J. M. 2012. “Brambleton and Colley Avenues Intersection, Brambleton Ave and 2nd St Intersection, Fort Norfolk Improvement Projects.” Public Information Meeting, Department of Public Works, October 24. 2012http://www.norfolk.gov/DocumentCenter/view/63.
Los Angeles County Community Disaster Resilience. 2015. “What Is Community Resilience.” http://www.laresilience.org/.
Los Angeles Department of Water and Power (LADWP). 2014. Water System Seismic Resilience and Sustainability Program, September 26.
Madison County Emergency Management Agency. 2015. “Madison County’s Hazards.” http://www.madisoncountyema.com/Hazards.htm.
McMilla, P. 1991. “Seismic Law Compliance Reaches 85%: Housing: The City Pushes Owners to Complete Work on Remaining Unreinforced Masonry Buildings by 1992
F-5
Deadline,” Los Angeles Times, May 18. http://articles.latimes.com/1991-03-18/local/me-353_1_unreinforced-masonry-buildings.
Mindock, C. 2013. “Flagstaff Moves Forward on the Watershed Protection Project.” Arizona Daily Sun, April 30. http://azdailysun.com/news/local/flagstaff-moves-forward-on-the-watershed-protection-project/article_80695e24-b1c6-11e2-b3e9-001a4bcf887a.html.
Montgomery, L. 2014. “In Norfolk, Evidence of Climate Change Is in the Streets at High Tide.” Washington Post, May 31. http://www.washingtonpost.com/business/economy/in-norfolk-evidence-of-climate-change-is-in-the-streets-at-high-tide/2014/05/31/fe3ae860-e71f-11e3-8f90-73e071f3d637_story.html.
National Fire Protection Association (NFPA). 2015. “Document Information Pages (List of NFPA Codes & Standards).” http://www.nfpa.org/codes-and-standards/document-information-pages.
National Institute of Standards and Technology (NIST). 2015. “Community Resilience Planning Guide: Draft Guide for Public Comment.” U.S. Department of Commerce. http://www.nist.gov/el/building_materials/resilience/guide.cfm.
National Oceanic and Atmospheric Administration (NOAA) National Climatic Data Center (NCDC). 2015. “Storm Events Database.” http://www.ncdc.noaa.gov/stormevents/ftp.jsp.
National Oceanic and Atmospheric Administration (NOAA) National Ocean Service. 2015. “The Galveston Hurricane of 1900.” http://oceanservice.noaa.gov/news/features/sep13/galveston.html.
National Oceanic and Atmospheric Administration (NOAA) National Weather Service (NWS) Storm Prediction Center. 2015. “Annual U.S. Killer Tornado Statistics.” http://www.spc.noaa.gov/climo/torn/fatalmap.php?yr=2011.
National Research Council (NRC). 2012. Disaster Resilience: A National Imperative Washington, DC: National Academies Press. http://www.nap.edu/catalog/13457/disaster-resilience-a-national-imperative.
National Research Council (NRC). 2014. An All-of-Government Approach to Increase Resilience for International Chemical, Biological, Radiological, Nuclear, and Explosive (CBRNE) Events Workshop Summary. Washington, DC: National Academies Press, http://www.nap.edu/catalog/18814/an-all-of-government-approach-to-increase-resilience-for-international-chemical-biological-radiological-nuclear-and-explosive-cbrne-events.
Natural Resources Defense Council (NRDC). 2011. “Norfolk, Virginia: Identifying and Becoming More Resilient to Impacts of Climate Change.” Water Facts. https://www.nrdc.org/water/files/ClimateWaterFS_NorfolkVA.pdf.
Norfolk Flooding Strategy Update. 2012. Presentation to Norfolk City Council, March 27. http://va-norfolk.civicplus.com/documentcenter/view/1751.
F-6
Norris, F. H., S. P. Stevens, B. Pfefferbaum, K. F. Wyche, and R. L. Pfefferbaum. 2008. “Community Resilience as a Metaphor, Theory, Set of Capacities, and Strategy for Disaster Readiness.” American Journal of Community Psychology 41(1–2):127–50. http://www.ncbi.nlm.nih.gov/pubmed/18157631.
O’Neal, J. E. 2015. “Hampton Roads Economy Set to Improve in 2015.” Daily Press, January 29. http://www.dailypress.com/business/dp-nws-economic-outlook-0123-20150123-story.html.
Office of Statewide Health Planning and Development. 2005. California’s Hospital Seismic Safety Law: Its History, Implementation, and Progress. http://www.oshpd.ca.gov/fdd/seismic_compliance/SB1953/SeismicReport.pdf.
Payne, K. 2003. “More Than 30 State Deaths Linked To Isabel, Says Medical Examiner.” Daily Press, November 2. http://articles.dailypress.com/2003-11-02/news/0311020018_1_monoxide-hurricane-isabel-isabel-s-victims.
Resilient Rhode Island Act of 2014. 2015. Section 1, Title 42 of the General Laws. Chapter 6.2, H 7904. http://webserver.rilin.state.ri.us/BillText/BillText14/HouseText14/H7904A.pdf.
Robertson, R. L. 2011. Resilience of Our Critical Infrastructure and Cyber Security Summit—Lessons Learned after the Disaster. Presented at the summit, June 28, 2011. http://huntsvilleal.gov/cyber/RodneysSummitBriefingonNewBackground28June20011.pdf.
Rockefeller Foundation 2013. “RE.invest Initiative Announces Partnership with Eight Cities to Build More Resilient Stormwater Systems.” Press Release, May 22. https://www.rockefellerfoundation.org/about-us/news-media/re-invest-initiative-announces/.
Rodin, J. 2013. 100 Resilient Cities (Blog). Rockefeller Foundation, August 5. http://www.rockefellerfoundation.org/blog/100-resilient-cities/.
Rogers, J. 2014. Norfolk’s Neighborhood Engagement Plans. YouTube video of a presentation on December 9, posted by NorfolkTV on January 21, 2015. https://www.youtube.com/watch?v=BNThRjA2_Ss.
Salkin, A. 2014. Norfolk Is a Rockefeller Resilient City. YouTube video of a presentation on February 26, posted by NorfolkTV on February 27, 2014. https://www.youtube.com/watch?v=XH8piQc-otY.
Sallenger, A. H., Jr., K. S. Doran, and P. A. Howd. 2012. “Hotspot of Accelerated Sea-Level Rise on the Atlantic Coast of North America.” Nature Climate Change 2 (12): 884–888. http://www.nature.com/nclimate/journal/v2/n12/full/nclimate1597.html.
Schneider, E., R. A. Hajjeh, R. A. Spiegel, R. W. Jibson, E. L. Harp, G. A. Marshall, R. A. Gunn, M. M. McNeil, R. W. Pinner, R. C. Baron, R. C. Burger, L. C. Hutwagner, C. Crump, L. Kaufman, S. E. Reef, G. M. Feldman, D. Pappagianis, and S. B. Werner. 1997. “A Coccidioidomycosis Outbreak Following the Northridge, California Earthquake.” Journal of the American Medical Association 277 (11): 904–908.
F-7
Short, K. C. 2013. Spatial Wildfire Occurrence Data for the United States, 1992–2013. 3rd Edition. Fort Collins, CO: Forest Service Research Data Archive. doi: 10.2737/RDS-2013-0009.3.
Smith, K. 2012. City of Norfolk City-Wide Coastal Flooding Study Presentation to Storm Water Working Group. Fugro Atlantic. http://va-norfolk.civicplus.com/documentcenter/view/1752.
Spanger-Siegfried, E., M. Fitzpatrick, and K. Dahl. 2014. Encroaching Tides: How Sea Level Rise and Tidal Flooding Threaten U.S. East and Gulf Coast Communities over the Next 30 Years. Cambridge, Massachusetts: Union of Concerned Scientists, October. http://www.ucsusa.org/sites/default/files/attach/2014/10/encroaching-tides-full-report.pdf.
Spring, J. 2013. “Norfolk: A Sinking City.” Outside Magazine, July 7. http://www.outsideonline.com/1917386/norfolk-sinking-city.
State of California, Seismic Safety Commission. 2004. “Status of the Unreinforced Masonry Building Law.” http://www.seismic.ca.gov/pub/CSSC%202006%20URM%20Report%20Final.pdf.
Talley, E., D. Newman, D. Mimno, B. W. Herr, H. M. Wallach, G. A. P. C. Burns, A. G. Miriam Leenders, and A. McCallum. “Database of NIH Grants Using Machine-Learned Categories and Graphical Clustering.” Nature Methods 8 (6, 2011): 443–444. http://ciir-publications.cs.umass.edu/getpdf.php?id=1015.
U. S. Census Bureau. 2013. “Selected Social Characteristics in the United States, 2011–2013 American Community Survey 3-Year Estimates,” American FactFinder. http://factfinder.census.gov/faces/tableservices/jsf/pages/productview.xhtml?pid=ACS_13_3YR_DP02&prodType=table.
U. S. Census Bureau. 2014. “Table 2. The 15 Most Populous Cities: July 1, 2013,” https://www.census.gov/newsroom/releases/pdf/cb14-89_pop_table2.pdf.
U.S. Bureau of Economic Analysis (BEA). 2014. “Economic Growth Widespread across Metropolitan Areas in 2013.” News release. http://bea.gov/newsreleases/regional/gdp_metro/2014/pdf/gdp_metro0914.pdf.
U.S. Department of Agriculture (USDA), Forest Service. 2010. “County/Forest Service Host Summit.” News Release, September 24. http://www.fs.usda.gov/detail/coconino/news-events/?cid=STELPRDB5342184.
U.S. Department of Commerce, National Oceanic and Atmospheric Administration (NOAA). 2000. “Hurricane Floyd Floods of September 1991.” http://www.nws.noaa.gov/os/assessments/pdfs/floyd.pdf.
U.S. Department of the Interior, U.S. Geological Survey (USGS). 2013. Land Subsidence and Relative Sea-Level Rise in the Southern Chesapeake Bay Region. Circular 1392. http://pubs.usgs.gov/circ/1392/pdf/circ1392.pdf.
U.S. Department of the Interior. Land Subsidence and Relative Sea-Level Rise in the Southern Chesapeake Bay Region. 2013. http://pubs.usgs.gov/circ/1392/pdf/circ1392.pdf.
F-8
U.S. Forest Service. 2015. “Welcome to Coconino National Forest.” http://www.fs.usda.gov/coconino/.
U.S. Geological Survey (USGS). 2015a. “Historic Earthquakes: Northridge, California.” http://earthquake.usgs.gov/earthquakes/states/events/1994_01_17.php.
U.S. Geological Survey (USGS). 2015b. “Search Earthquake Archives.” http://earthquake.usgs.gov/earthquakes/search/.
U.S. Office of Personnel Management. 2015. “FedScope.” http://www.fedscope.opm.gov/employment.asp.
United Nations Environment Program (UNEP), Financial Initiative website. 2015 “Principles for Sustainable Insurance.” http://www.unepfi.org/psi/.
Vegh, S. G. 2011. “Norfolk Told Holding Back the Tide Won’t Come Cheap.” Virginian-Pilot, May 25. http://hamptonroads.com/2011/05/norfolk-told-holding-back-tide-wont-come-cheap.
Virginia Institute of Marine Science (VIMS). 2013. Recurrent Flooding Study for Tidewater Virginia. Submitted to Virginia General Assembly, January. http://ccrm.vims.edu/recurrent_flooding/Recurrent_Flooding_Study_web.pdf.
Vock, Daniel. 2014. “Flagstaff Funds Wildfire Prevention with Bonds.” Emergency Management. http://www.emergencymgmt.com/disaster/Flagstaff-Funds-Wildfire-Prevention-Bonds.html.
Western Forestry Leadership Coalition. 2010. The True Cost of Wildfire in the Western U.S., http://www.blm.gov/or/districts/roseburg/plans/collab_forestry/files/TrueCostOfWilfire.pdf.
Wikipedia. 2015. “Coconino National Forest.” http://en.wikipedia.org/wiki/Coconino_National_Forest.
Wiley, K. 2000. “Living Where the Earth Shakes: A History of the California Seismic Safety Commission.” State of California, Seismic Safety Commission.
Youberg, A., K. Koestner, and D. Neary. 2011. “Wildfire, Rain and Floods: A Case Study of the June 2010 Schultz Wildfire, Flagstaff, Arizona.” Arizona Geology. Tucson, Arizona: Arizona Geological Survey. http://www.azgs.az.gov/arizona_geology/winter10/article_feature_print.html.
Zane, D. F., T. M. Bayleyegn, J. Hellsten, R. Beal, C. Beasley, T. Haywood, D. Wiltz-Beckham, and A. F. Wolkin. 2011. “Tracking Deaths Related to Hurricane Ike, Texas, 2008.” [In eng]. Disaster Medicine and Public Health Preparedness 5 (1, March): 23–8.
Zybach, B., M. Dubrasich, G. Brenner, and J. Marker. 2009. “U.S. Wildfire Cost-Plus-Loss Economics Project: The ‘One Pager’ Checklist,” Advances in Fire Practice, http://www.iawfonline.org/FIRE%20COSTS%20REPORT.pdf.
G-1
Abbreviations
100RC 100 Resilient Cities 4FRI Four Forest Restoration Initiative ACS American Community Survey BEA Bureau of Economic Analysis CEA California Earthquake Authority CDC Centers for Disease Control and Prevention CRO Chief Resilience Officer DROP Disaster Resilience of Place EF Enhanced Fujita FEMA Federal Emergency Management Agency GDP gross domestic product HRPDC Hampton Roads Planning District Commission IDA Institute for Defense Analyses MSA metropolitan statistical area NCDC National Climatic Data Center NFPA National Fire Protection Association NOAA National Oceanic and Atmospheric Administration NIST National Institute of Standards and Technology STPI Science and Technology Policy Institute SVI Social Vulnerability Index USDA United States Department of Agriculture USGS United States Geological Survey WUI Wildland-Urban Interface