Embed Size (px)
Citation preview
Cassava in Asia: Exposing the drivers and trajectories of the hidden ingredient in global supply chains
Dr Jonathan Newby CIAT Asia, Hanoi
World Congress on Roots and Tubers 18th – 22nd January 2016 Nanning, China
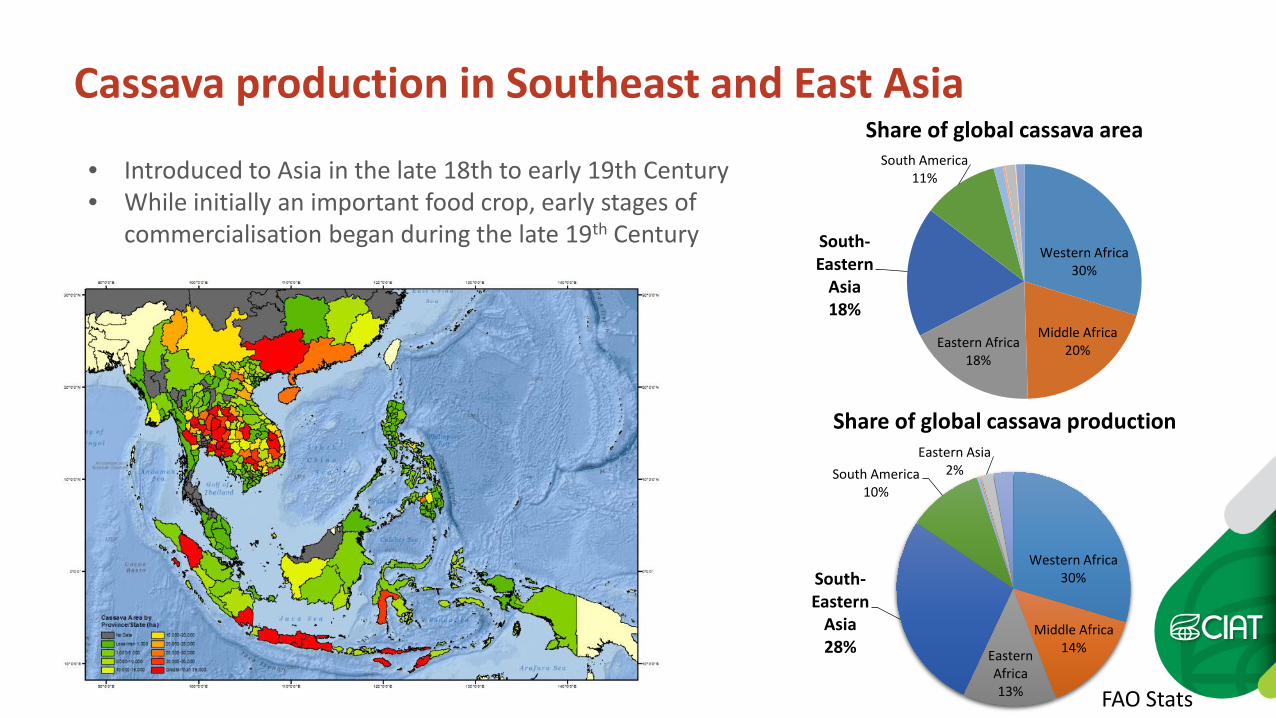
Cassava production in Southeast and East Asia
Western Africa 30%
Middle Africa 14% Eastern
Africa 13%
South-Eastern
Asia 28%
South America 10%
Eastern Asia 2%
Western Africa 30%
Middle Africa 20% Eastern Africa
18%
South-Eastern
Asia 18%
South America 11%
Share of global cassava area
Share of global cassava production
• Introduced to Asia in the late 18th to early 19th Century • While initially an important food crop, early stages of
commercialisation began during the late 19th Century
FAO Stats
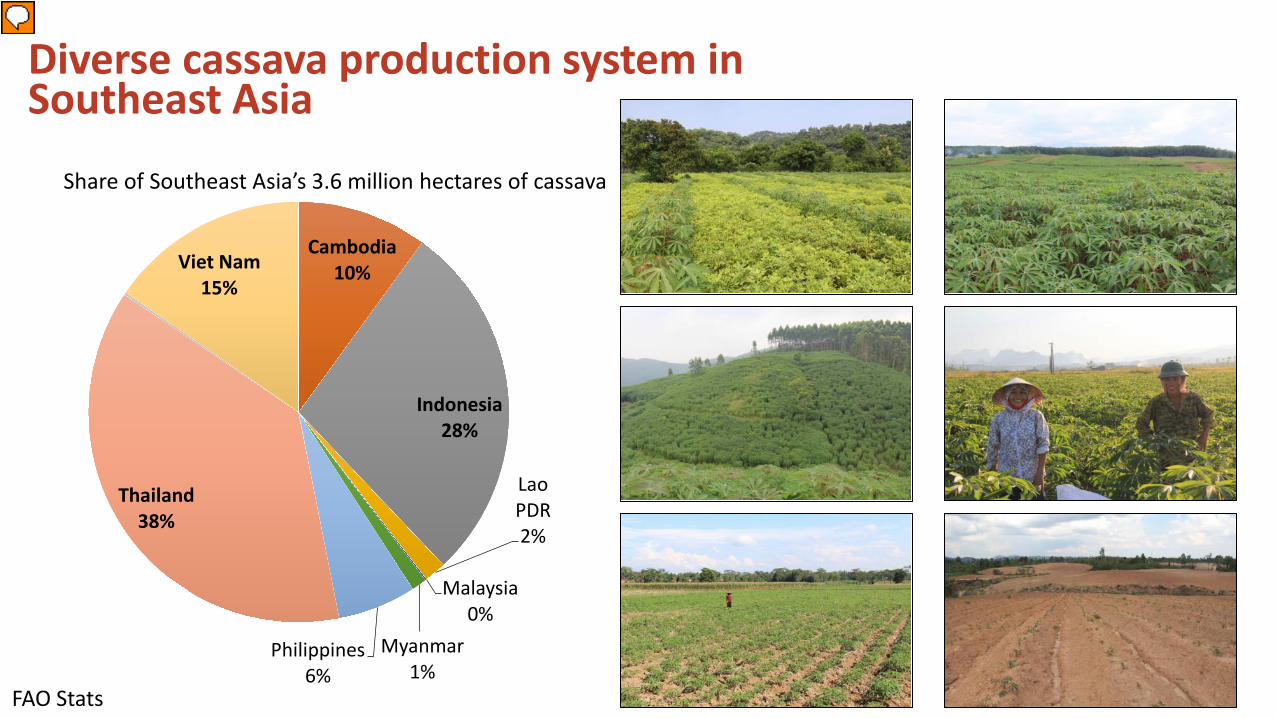
Diverse cassava production system in Southeast Asia
Cambodia 10%
Indonesia 28%
Lao PDR 2%
Malaysia 0%
Myanmar 1%
Philippines 6%
Thailand 38%
Viet Nam 15%
Share of Southeast Asia’s 3.6 million hectares of cassava
FAO Stats
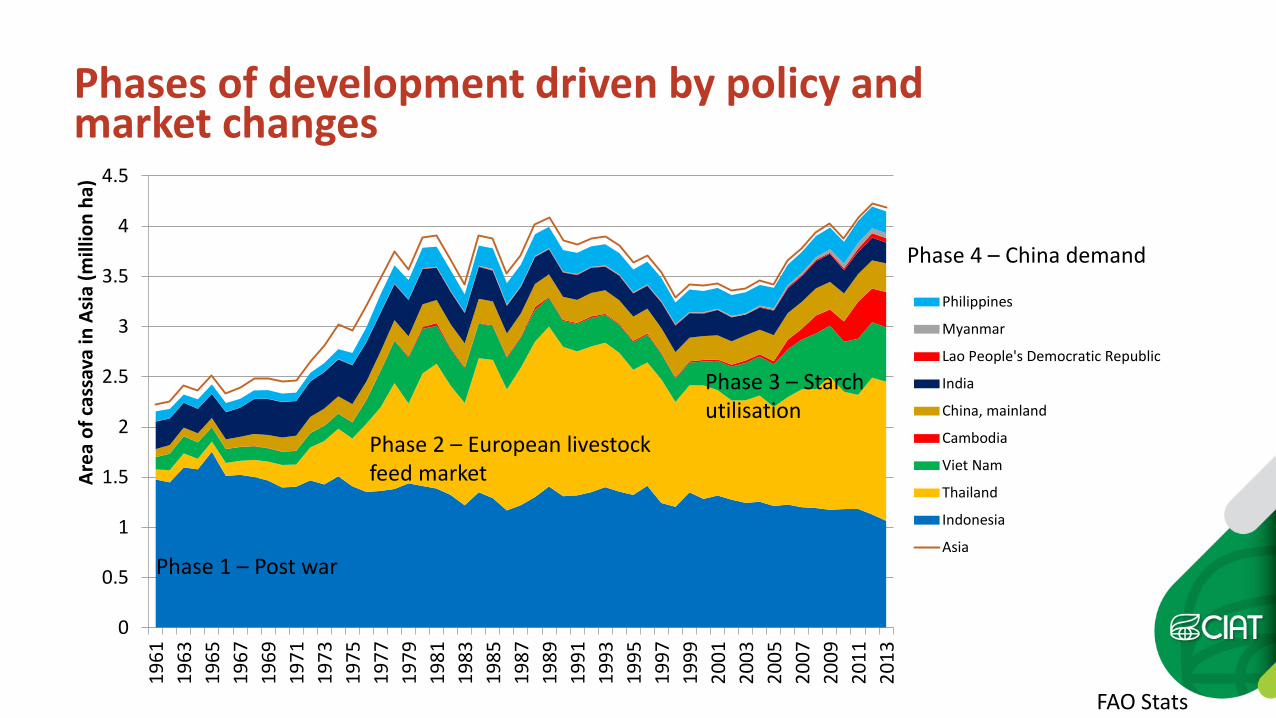
Phases of development driven by policy and market changes
0
0.5
1
1.5
2
2.5
3
3.5
4
4.519
6119
6319
6519
6719
6919
7119
7319
7519
7719
7919
8119
8319
8519
8719
8919
9119
9319
9519
9719
9920
0120
0320
0520
0720
0920
1120
13
Area
of c
assa
va in
Asi
a (m
illio
n ha
)
Philippines
Myanmar
Lao People's Democratic Republic
India
China, mainland
Cambodia
Viet Nam
Thailand
Indonesia
AsiaPhase 1 – Post war
Phase 2 – European livestock feed market
Phase 3 – Starch utilisation
Phase 4 – China demand
FAO Stats
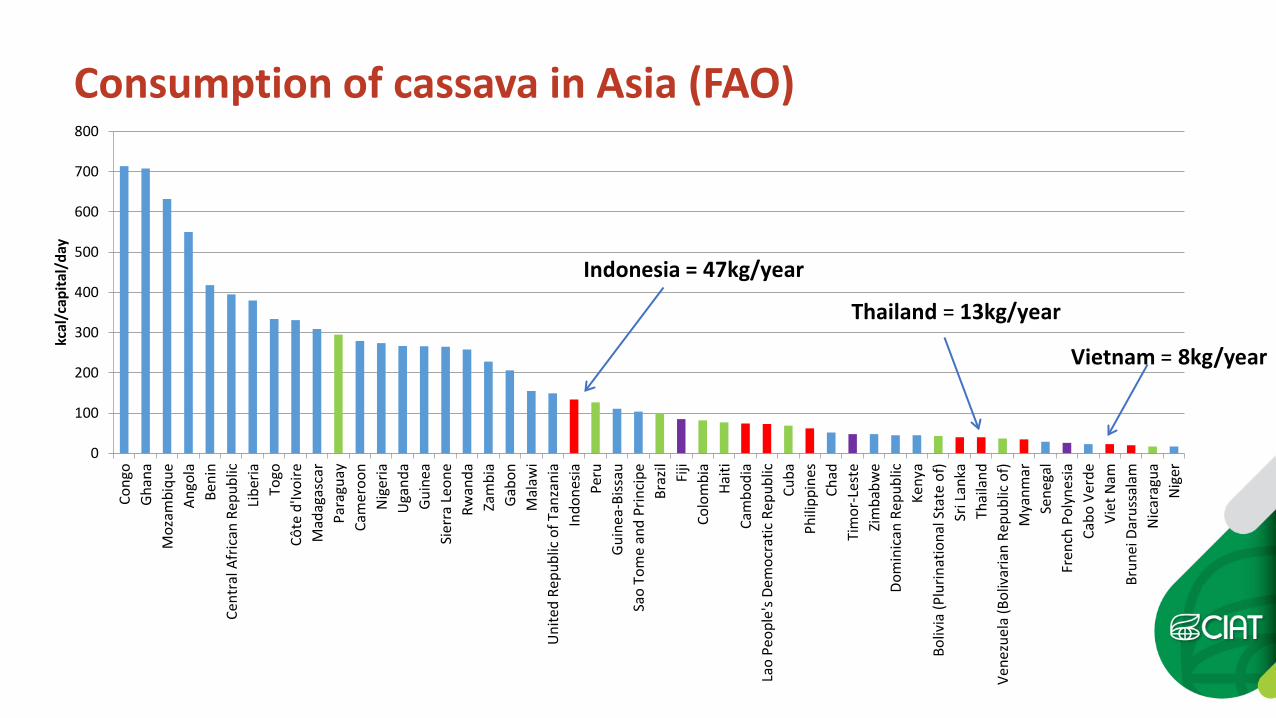
Consumption of cassava in Asia (FAO)
0
100
200
300
400
500
600
700
800Co
ngo
Ghan
aM
ozam
biqu
eAn
gola
Beni
nCe
ntra
l Afr
ican
Rep
ublic
Libe
riaTo
goCô
te d
'Ivoi
reM
adag
asca
rPa
ragu
ayCa
mer
oon
Nig
eria
Uga
nda
Guin
eaSi
erra
Leo
neRw
anda
Zam
bia
Gabo
nM
alaw
iU
nite
d Re
publ
ic o
f Tan
zani
aIn
done
siaPe
ruGu
inea
-Biss
auSa
o To
me
and
Prin
cipe
Braz
ilFi
jiCo
lom
bia
Haiti
Cam
bodi
aLa
o Pe
ople
's De
moc
ratic
Rep
ublic
Cuba
Phili
ppin
esCh
adTi
mor
-Les
teZi
mba
bwe
Dom
inic
an R
epub
licKe
nya
Boliv
ia (P
lurin
atio
nal S
tate
of)
Sri L
anka
Thai
land
Vene
zuel
a (B
oliv
aria
n Re
publ
ic o
f)M
yanm
arSe
nega
lFr
ench
Pol
ynes
iaCa
bo V
erde
Viet
Nam
Brun
ei D
arus
sala
mN
icar
agua
Nig
er
kcal
/cap
ital/
day
Indonesia = 47kg/year
Thailand = 13kg/year
Vietnam = 8kg/year
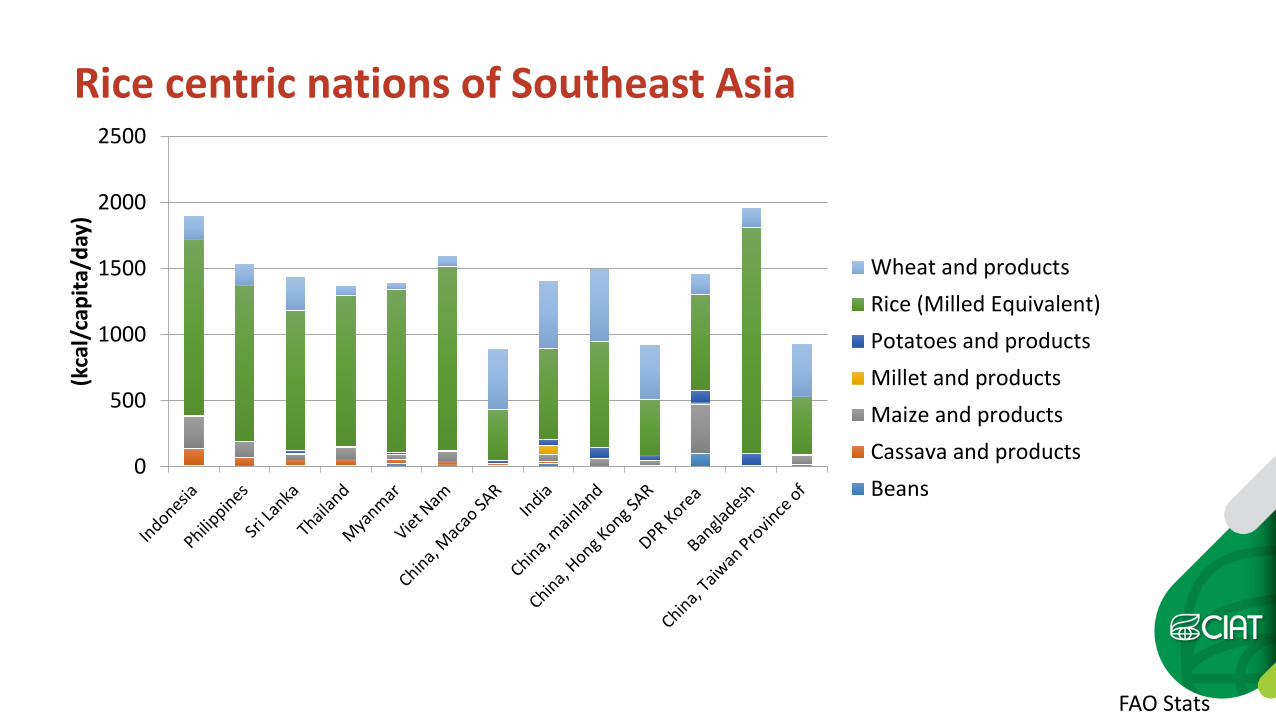
Rice centric nations of Southeast Asia
0
500
1000
1500
2000
2500
(kca
l/ca
pita
/day
)
Wheat and productsRice (Milled Equivalent)Potatoes and productsMillet and productsMaize and productsCassava and productsBeans
FAO Stats
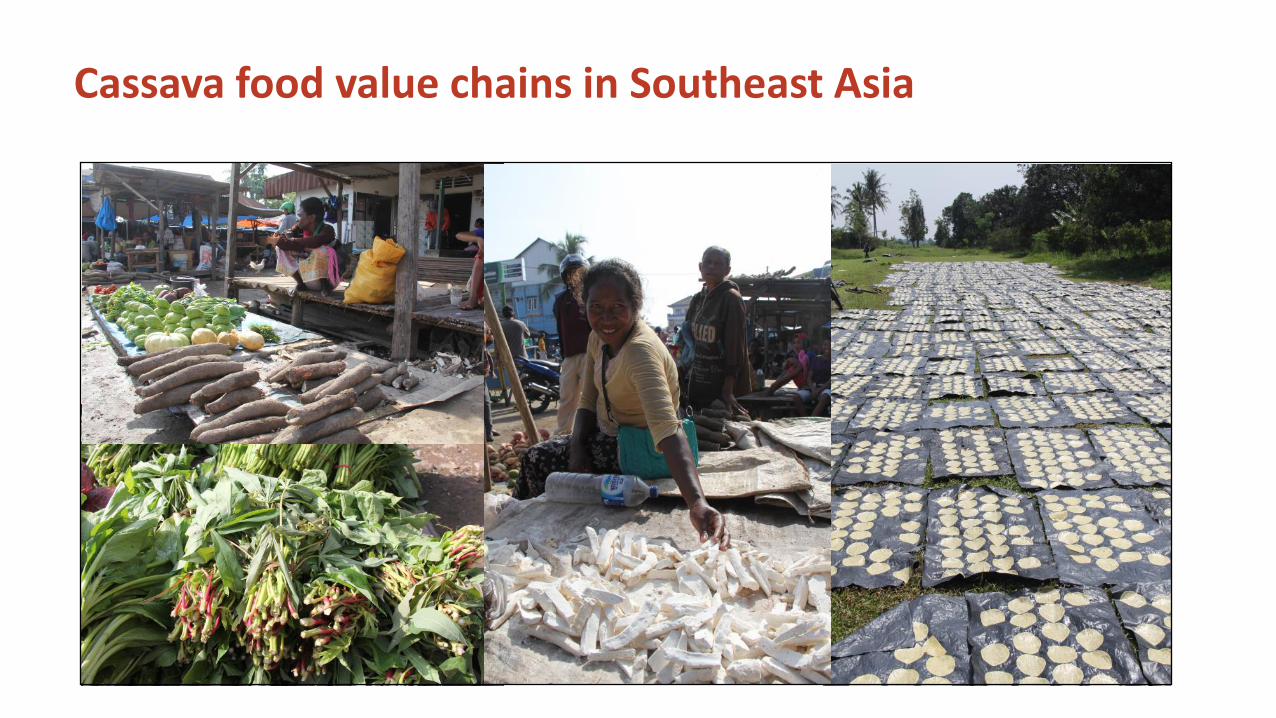
Cassava food value chains in Southeast Asia
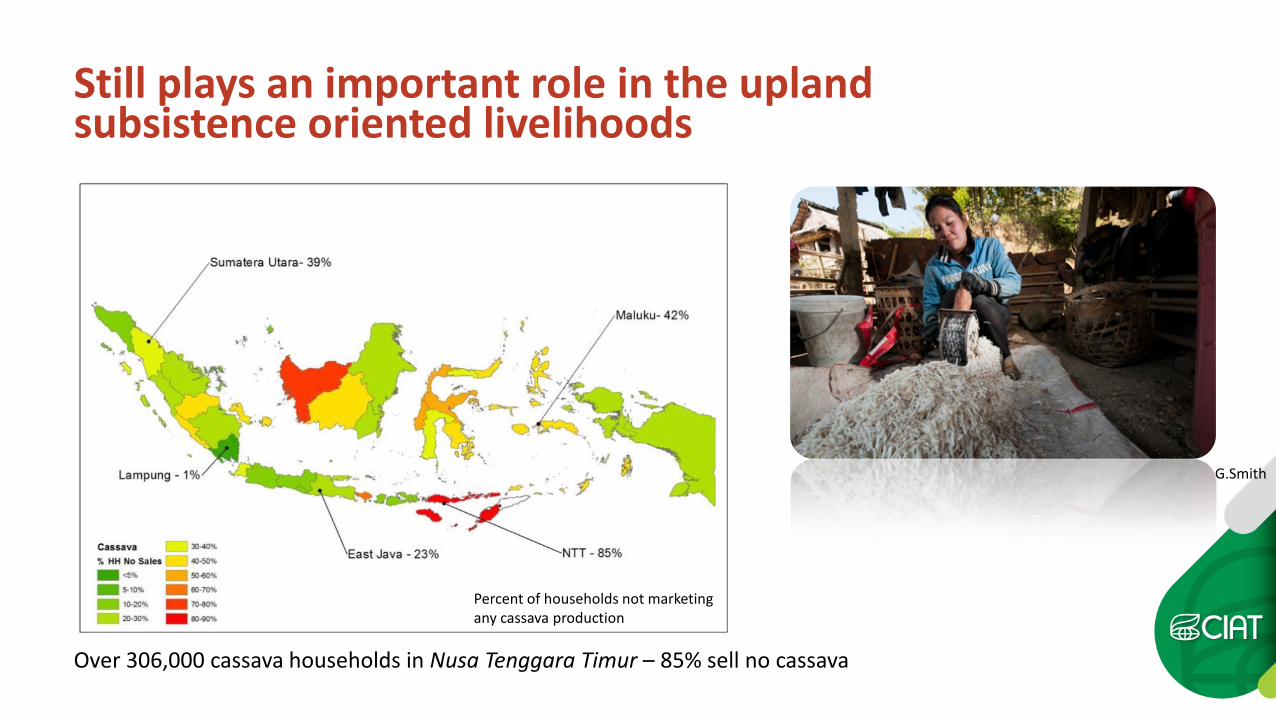
Over 306,000 cassava households in Nusa Tenggara Timur – 85% sell no cassava
Still plays an important role in the upland subsistence oriented livelihoods
Percent of households not marketing any cassava production
G.Smith
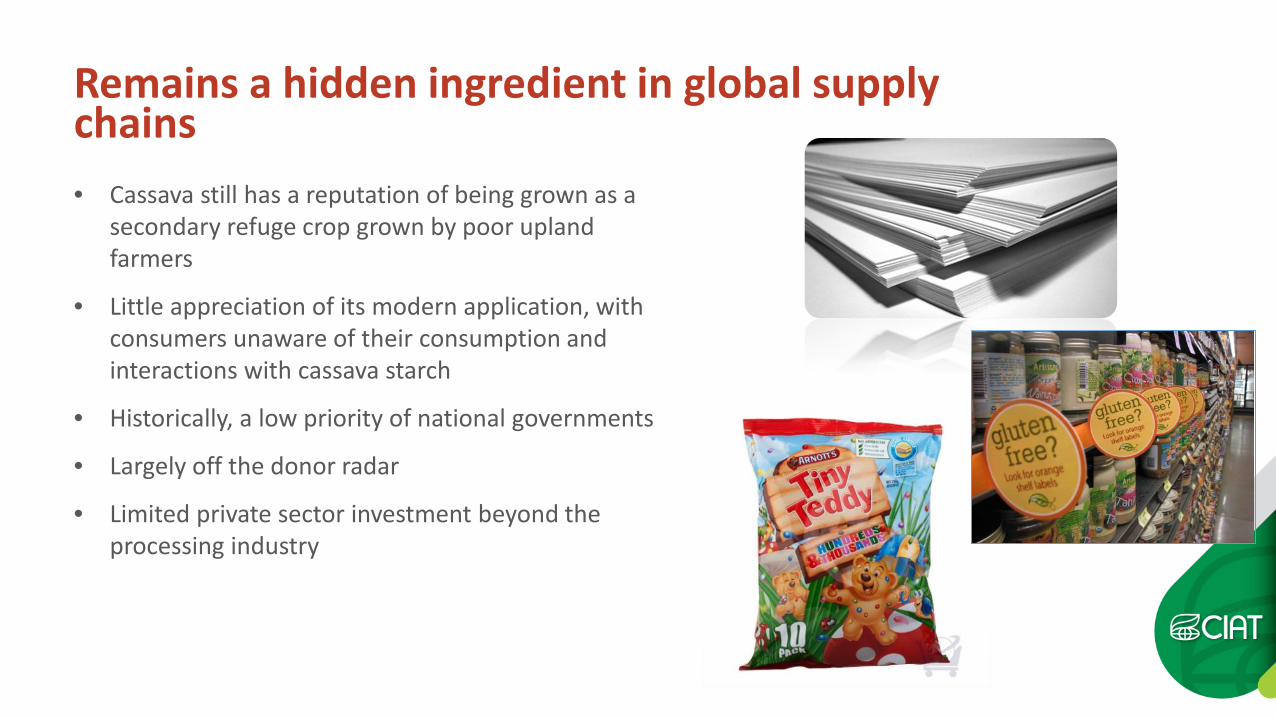
Remains a hidden ingredient in global supply chains • Cassava still has a reputation of being grown as a
secondary refuge crop grown by poor upland farmers
• Little appreciation of its modern application, with consumers unaware of their consumption and interactions with cassava starch
• Historically, a low priority of national governments
• Largely off the donor radar
• Limited private sector investment beyond the processing industry
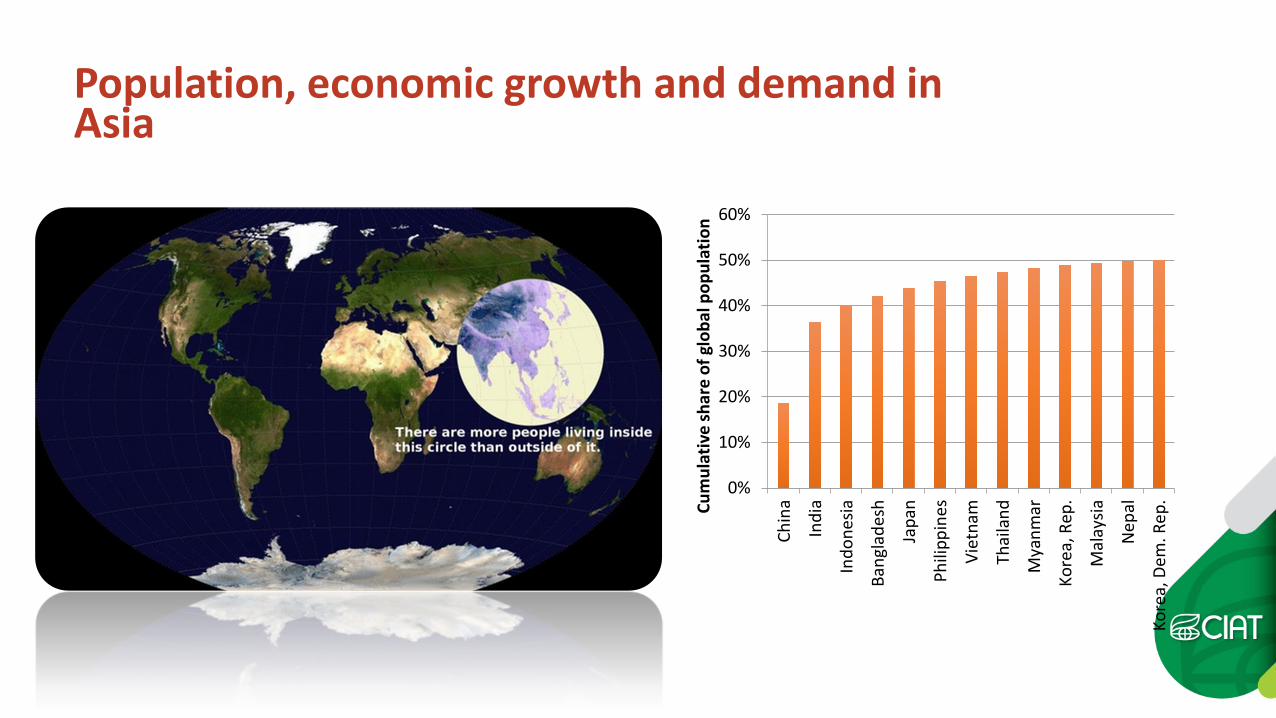
Population, economic growth and demand in Asia
0%
10%
20%
30%
40%
50%
60%
Chin
a
Indi
a
Indo
nesia
Bang
lade
sh
Japa
n
Phili
ppin
es
Viet
nam
Thai
land
Mya
nmar
Kore
a, R
ep.
Mal
aysia
Nep
al
Kore
a, D
em. R
ep.Cu
mul
ativ
e sh
are
of g
loba
l pop
ulat
ion
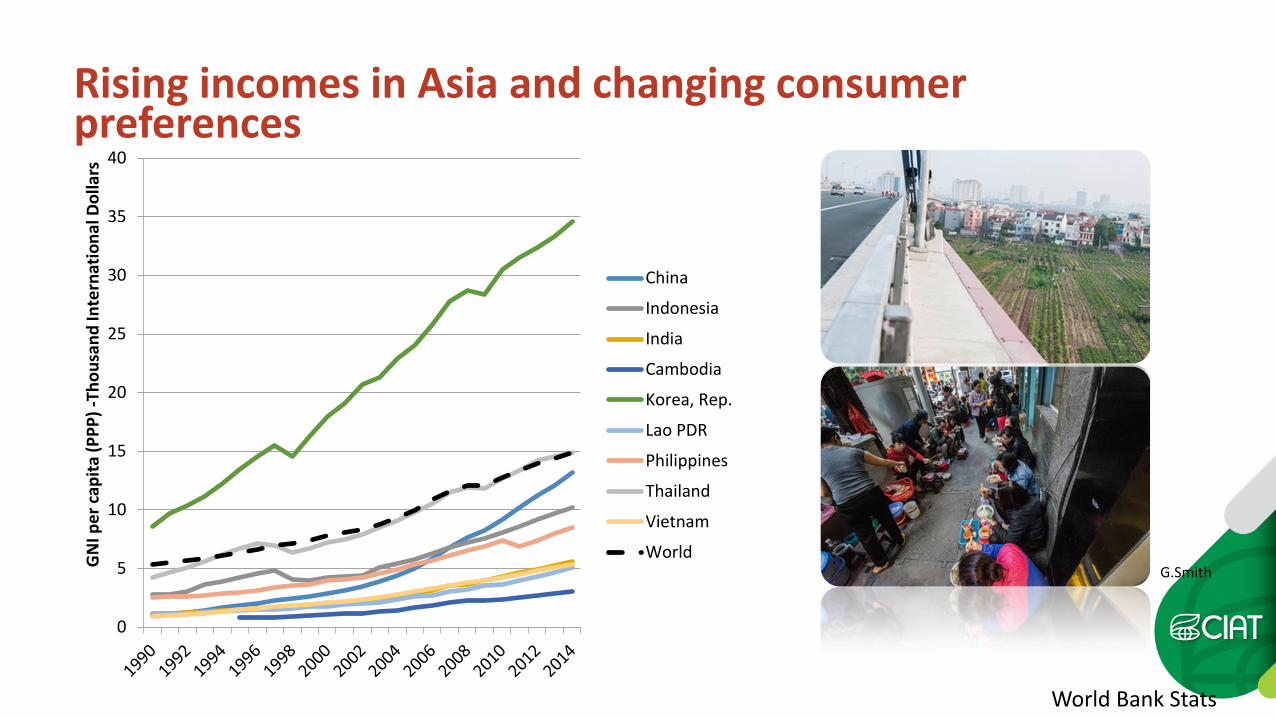
Rising incomes in Asia and changing consumer preferences
0
5
10
15
20
25
30
35
40
GN
I per
capi
ta (P
PP) -
Thou
sand
Inte
rnat
iona
l Dol
lars
China
Indonesia
India
Cambodia
Korea, Rep.
Lao PDR
Philippines
Thailand
Vietnam
World
World Bank Stats
G.Smith
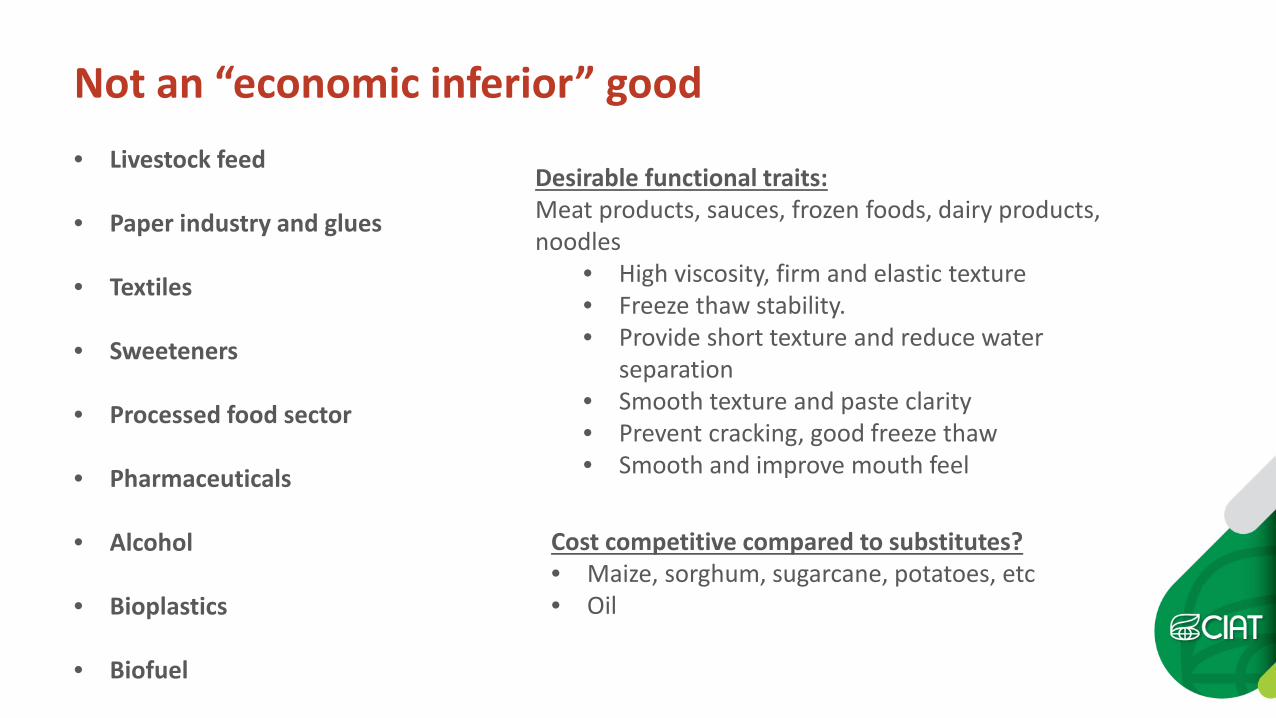
Not an “economic inferior” good • Livestock feed
• Paper industry and glues
• Textiles
• Sweeteners
• Processed food sector
• Pharmaceuticals
• Alcohol
• Bioplastics
• Biofuel
Desirable functional traits: Meat products, sauces, frozen foods, dairy products, noodles
• High viscosity, firm and elastic texture • Freeze thaw stability. • Provide short texture and reduce water
separation • Smooth texture and paste clarity • Prevent cracking, good freeze thaw • Smooth and improve mouth feel
Cost competitive compared to substitutes? • Maize, sorghum, sugarcane, potatoes, etc • Oil
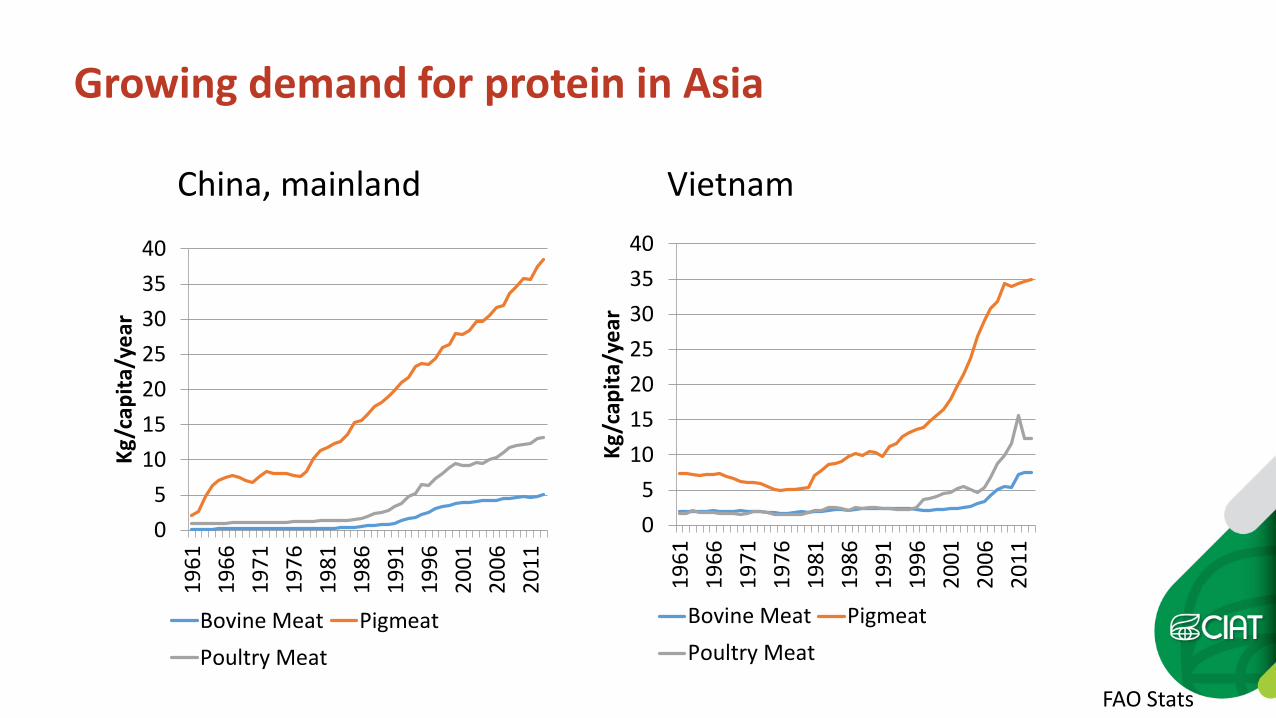
Growing demand for protein in Asia
China, mainland
05
10152025303540
1961
1966
1971
1976
1981
1986
1991
1996
2001
2006
2011
Kg/c
apita
/yea
r
Bovine Meat PigmeatPoultry Meat
Vietnam
05
10152025303540
1961
1966
1971
1976
1981
1986
1991
1996
2001
2006
2011
Kg/c
apita
/yea
r Bovine Meat PigmeatPoultry Meat
FAO Stats
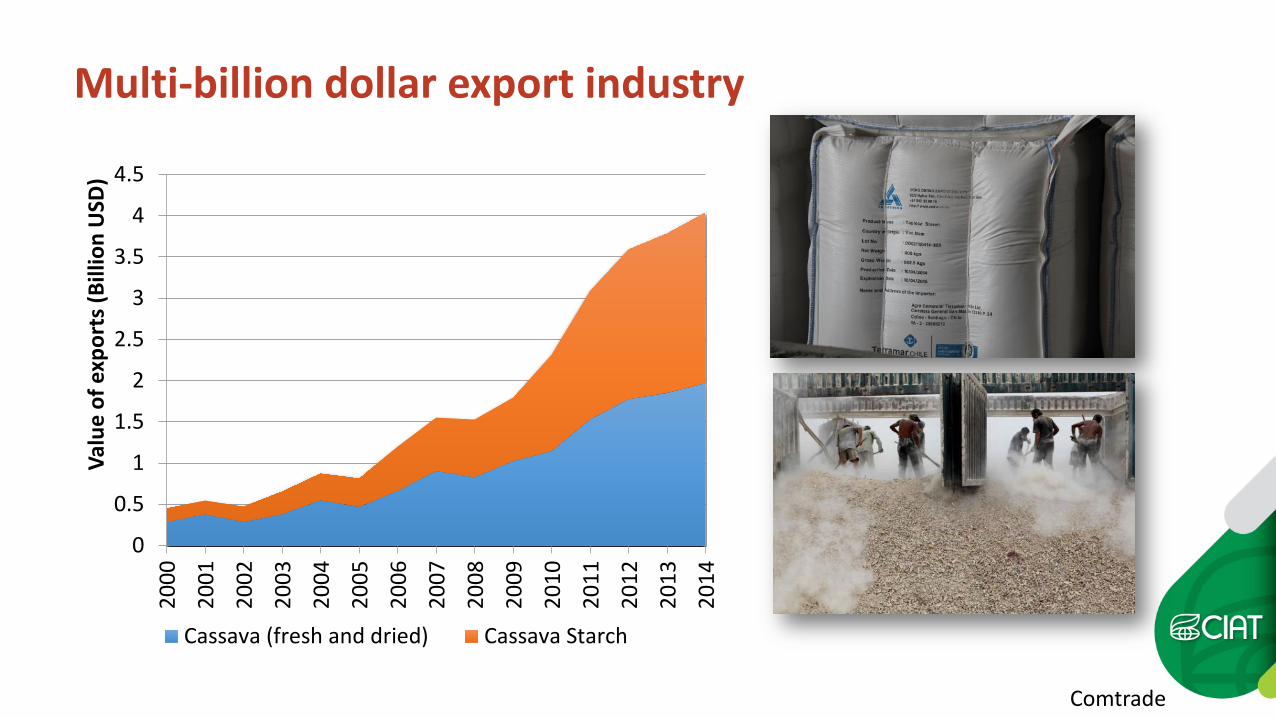
0
0.5
1
1.5
2
2.5
3
3.5
4
4.520
00
2001
2002
2003
2004
2005
2006
2007
2008
2009
2010
2011
2012
2013
2014
Valu
e of
exp
orts
(Bill
ion
USD
)
Cassava (fresh and dried) Cassava Starch
Multi-billion dollar export industry
Comtrade
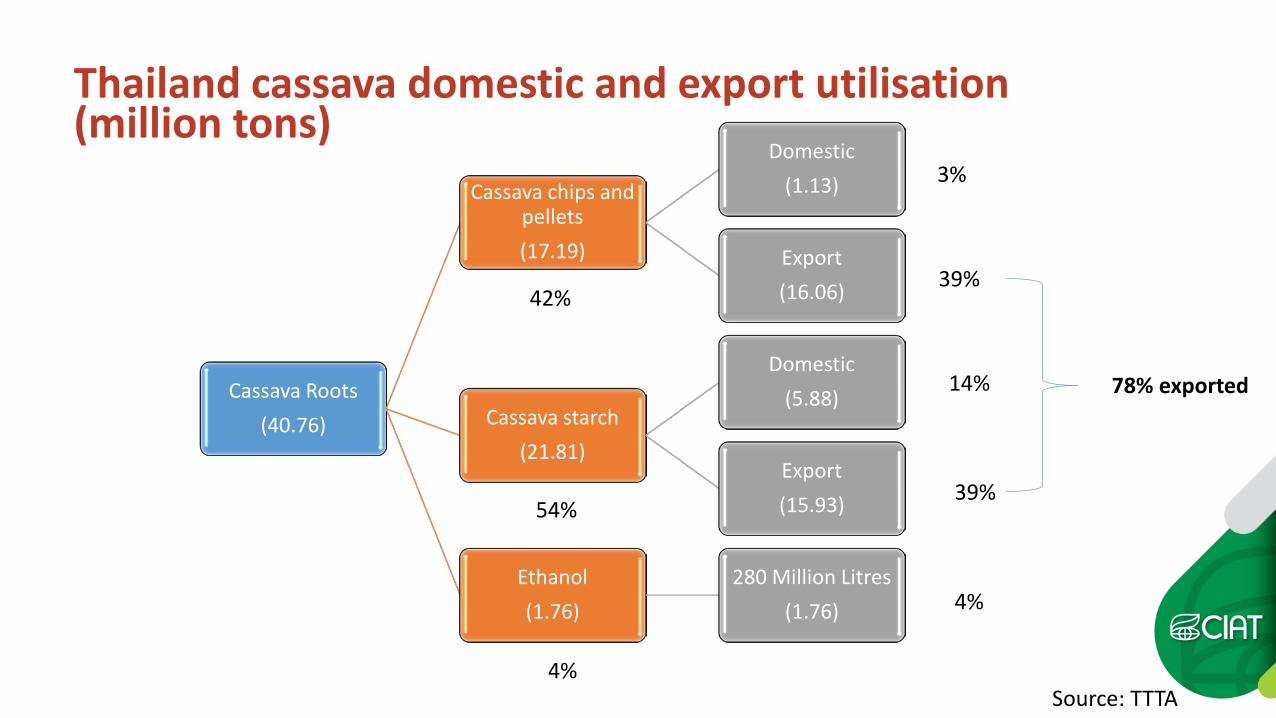
Cassava Roots (40.76)
Cassava chips and pellets (17.19)
Domestic (1.13)
Export (16.06)
Cassava starch (21.81)
Domestic (5.88)
Export (15.93)
Ethanol (1.76)
280 Million Litres (1.76)
42%
54%
4%
3%
39%
39%
4%
14%
Thailand cassava domestic and export utilisation (million tons)
78% exported
Source: TTTA
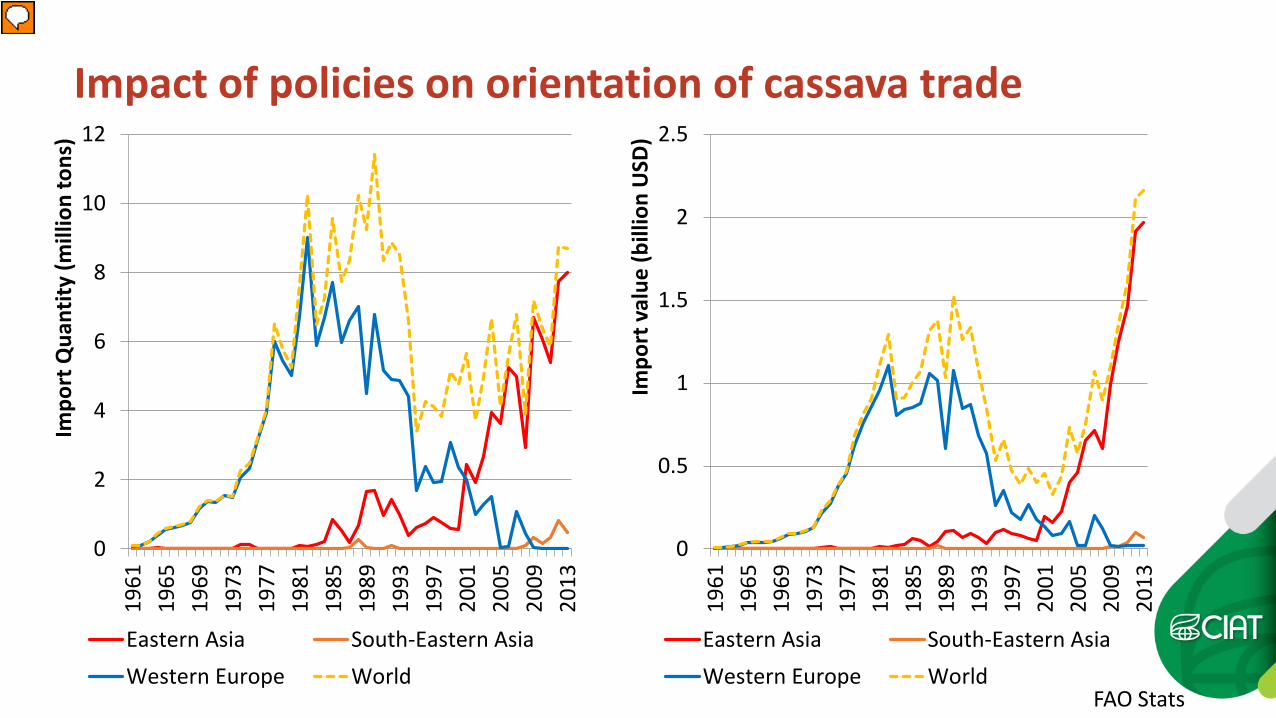
0
2
4
6
8
10
1219
6119
6519
6919
7319
7719
8119
8519
8919
9319
9720
0120
0520
0920
13
Impo
rt Q
uant
ity (m
illio
n to
ns)
Eastern Asia South-Eastern AsiaWestern Europe World
0
0.5
1
1.5
2
2.5
1961
1965
1969
1973
1977
1981
1985
1989
1993
1997
2001
2005
2009
2013
Impo
rt v
alue
(bill
ion
USD
) Eastern Asia South-Eastern AsiaWestern Europe World
Impact of policies on orientation of cassava trade
FAO Stats
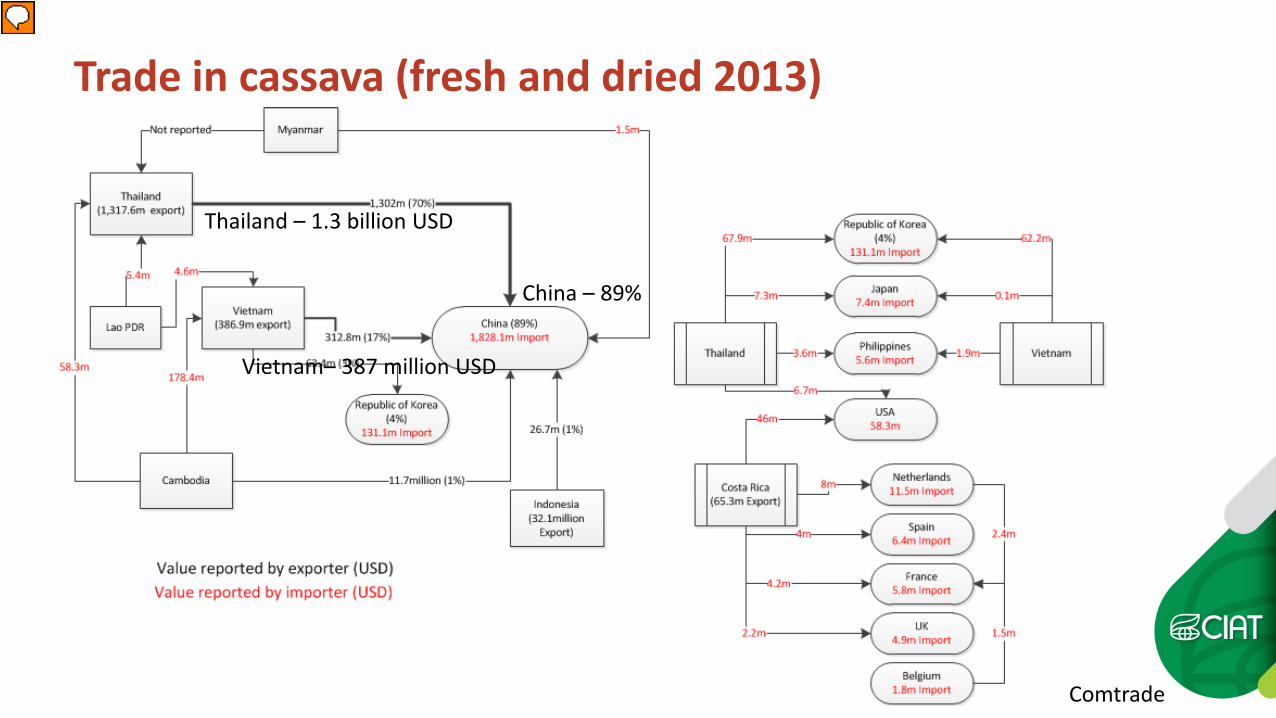
Trade in cassava (fresh and dried 2013)
Comtrade
China – 89%
Thailand – 1.3 billion USD
Vietnam– 387 million USD
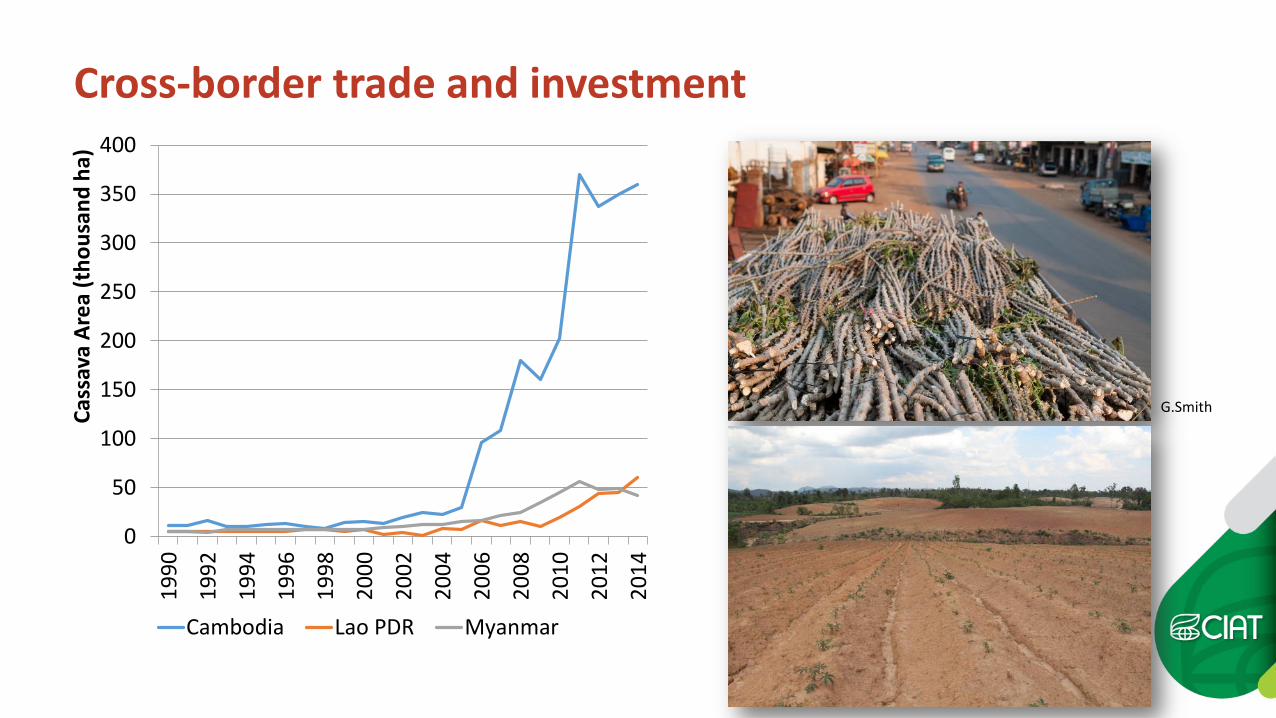
0
50
100
150
200
250
300
350
40019
90
1992
1994
1996
1998
2000
2002
2004
2006
2008
2010
2012
2014
Cass
ava
Area
(tho
usan
d ha
)
Cambodia Lao PDR Myanmar
Cross-border trade and investment
G.Smith
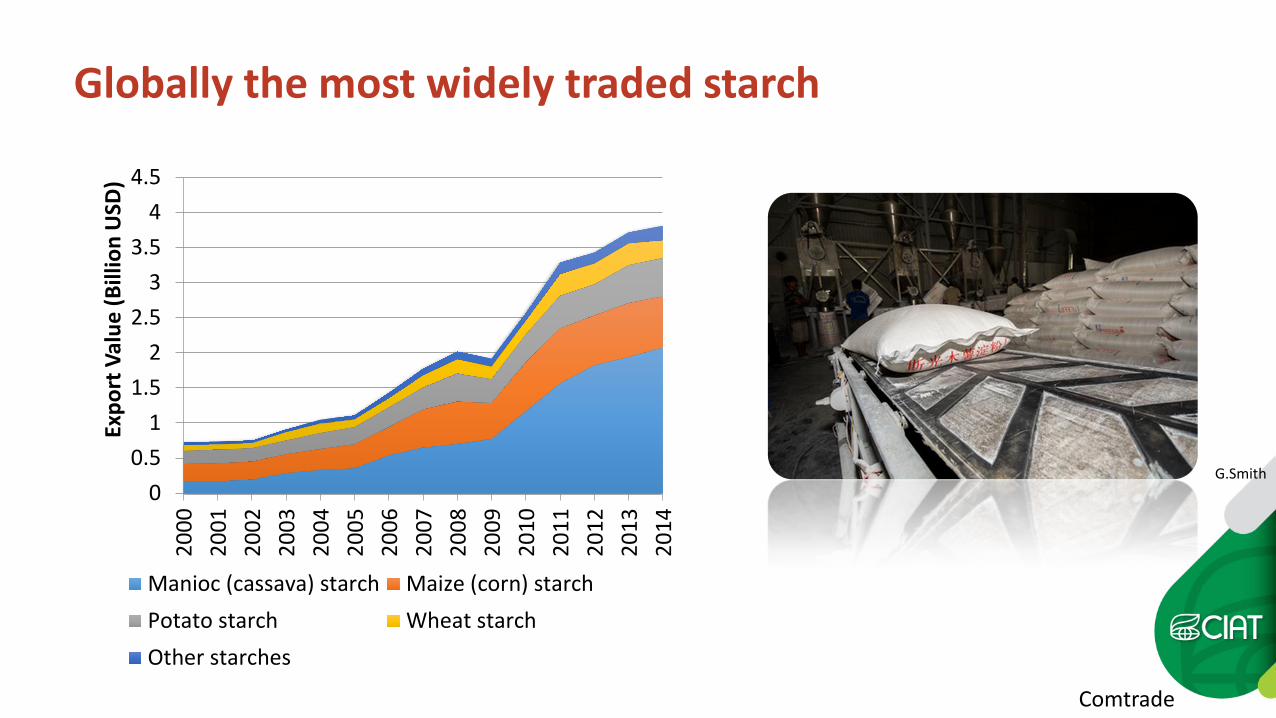
00.5
11.5
22.5
33.5
44.5
2000
2001
2002
2003
2004
2005
2006
2007
2008
2009
2010
2011
2012
2013
2014
Expo
rt V
alue
(Bill
ion
USD
)
Manioc (cassava) starch Maize (corn) starchPotato starch Wheat starchOther starches
Globally the most widely traded starch
Comtrade
G.Smith
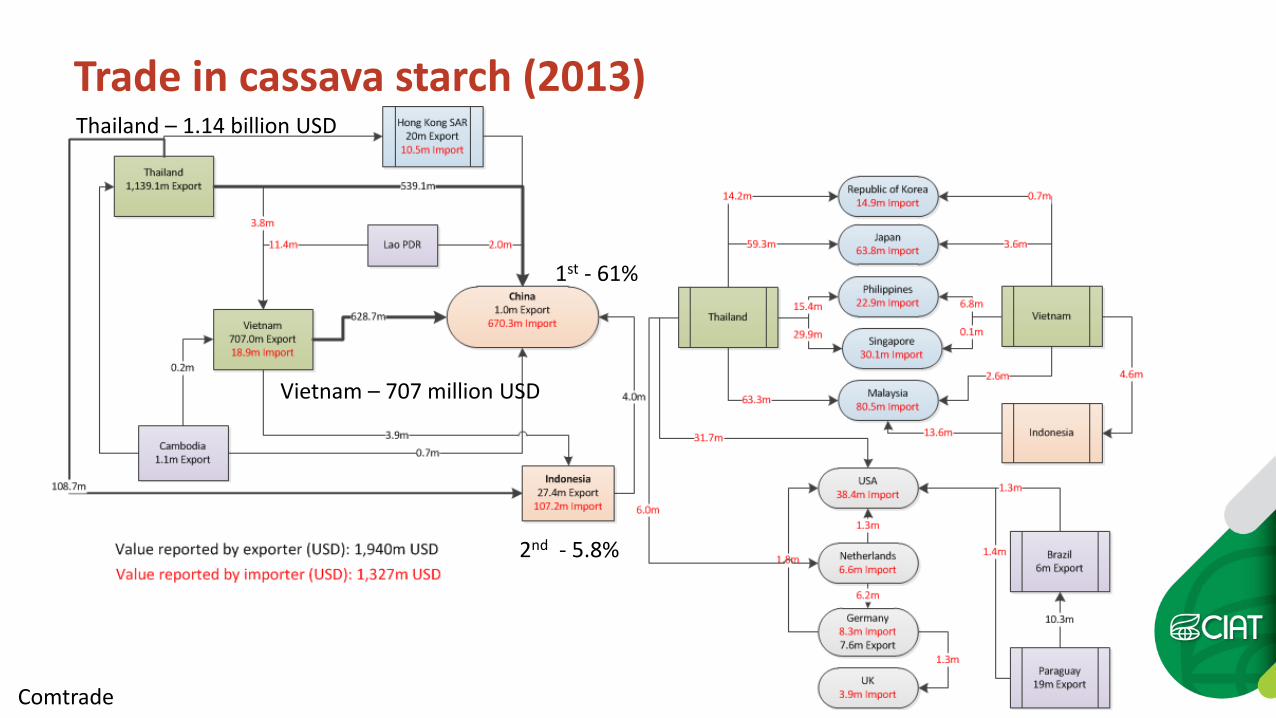
Trade in cassava starch (2013)
1st - 61%
2nd - 5.8%
Comtrade
Vietnam – 707 million USD
Thailand – 1.14 billion USD
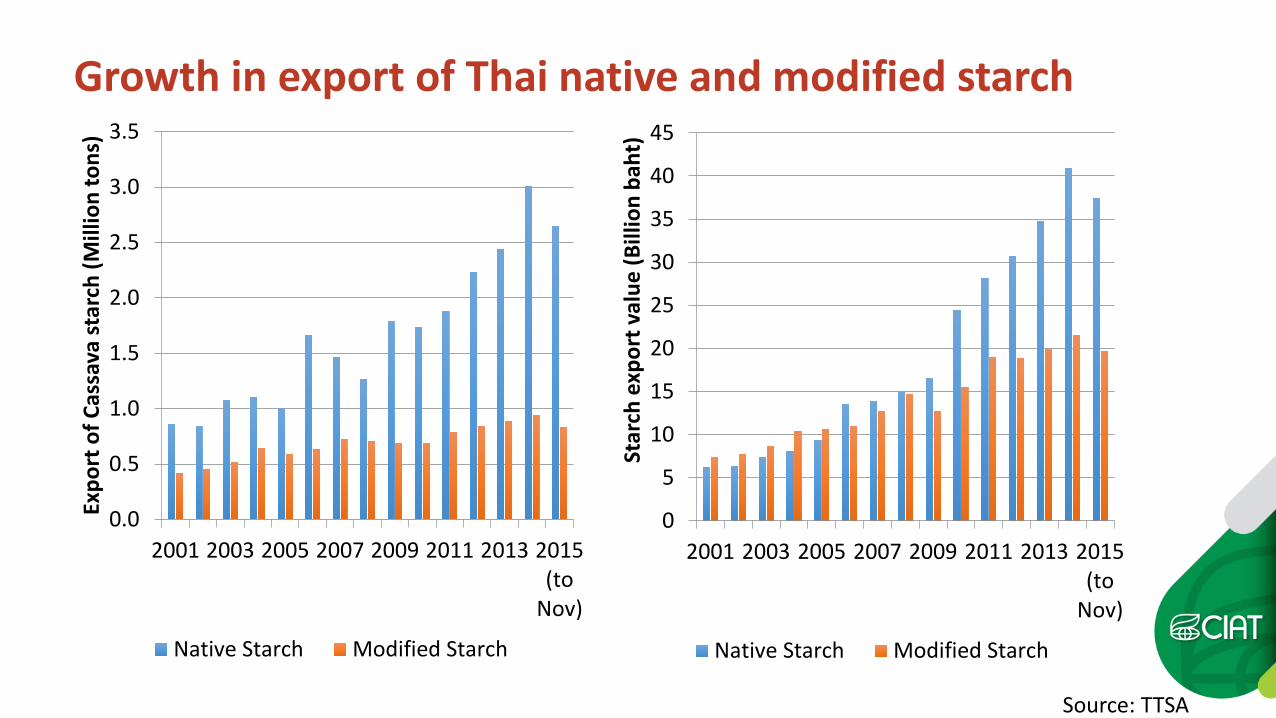
0.0
0.5
1.0
1.5
2.0
2.5
3.0
3.5
2001 2003 2005 2007 2009 2011 2013 2015(to
Nov)
Expo
rt o
f Cas
sava
star
ch (M
illio
n to
ns)
Native Starch Modified Starch
0
5
10
15
20
25
30
35
40
45
2001 2003 2005 2007 2009 2011 2013 2015(to
Nov)St
arch
exp
ort v
alue
(Bill
ion
baht
) Native Starch Modified Starch
Growth in export of Thai native and modified starch
Source: TTSA
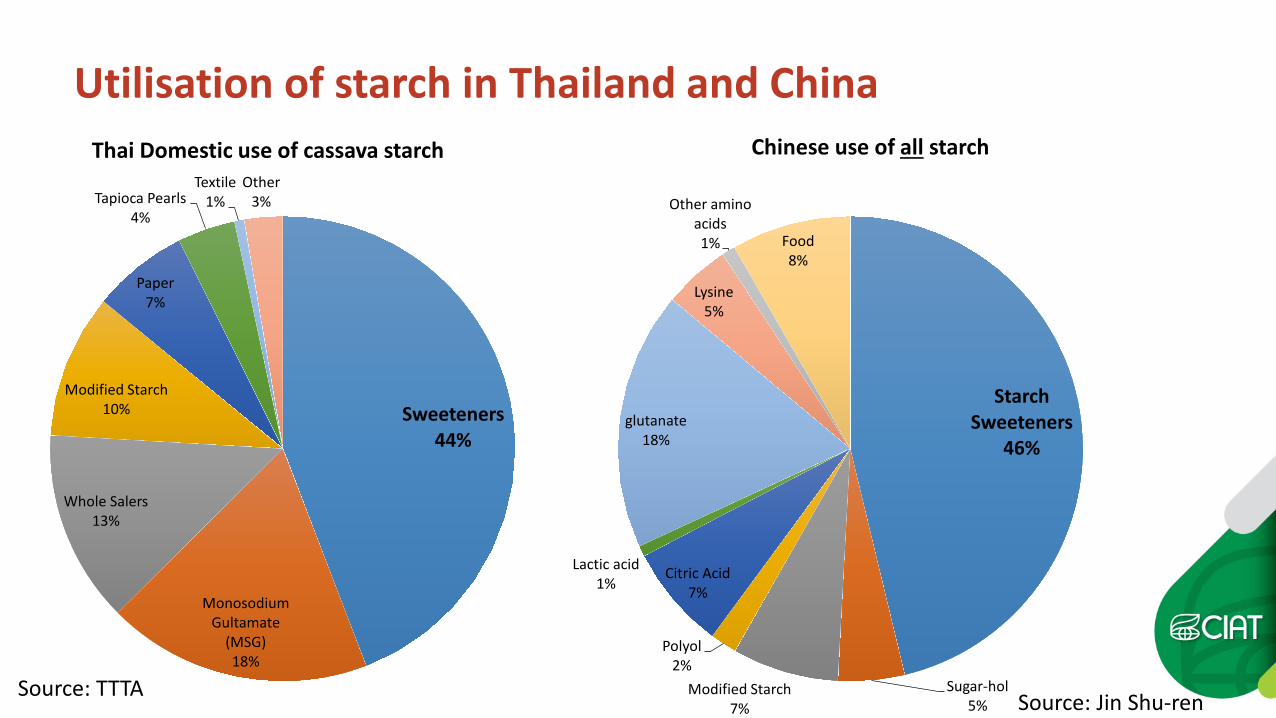
Sweeteners 44%
Monosodium Gultamate
(MSG) 18%
Whole Salers 13%
Modified Starch 10%
Paper 7%
Tapioca Pearls 4%
Textile 1%
Other 3%
Starch Sweeteners
46%
Sugar-hol 5%
Modified Starch 7%
Polyol 2%
Citric Acid 7%
Lactic acid 1%
glutanate 18%
Lysine 5%
Other amino acids 1% Food
8%
Utilisation of starch in Thailand and China Thai Domestic use of cassava starch Chinese use of all starch
Source: TTTA Source: Jin Shu-ren
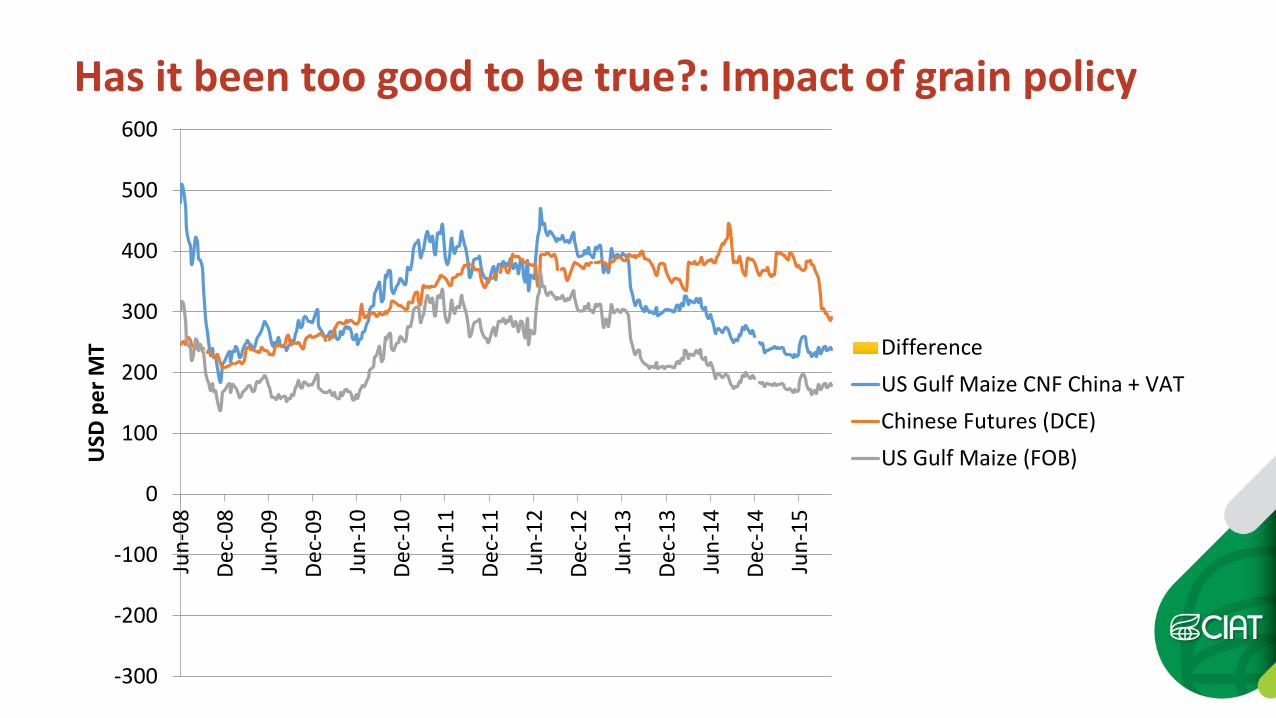
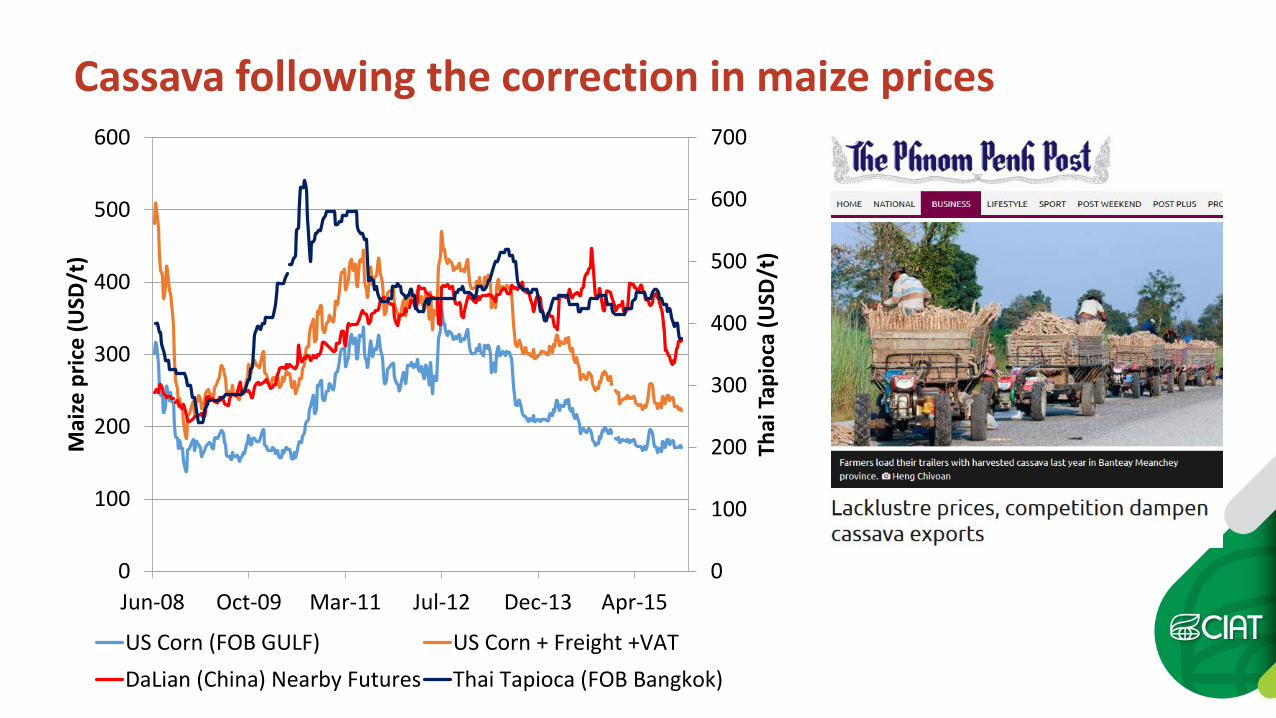
-300
-200
-100
0
100
200
300
400
500
600
Jun-
08
Dec-
08
Jun-
09
Dec-
09
Jun-
10
Dec-
10
Jun-
11
Dec-
11
Jun-
12
Dec-
12
Jun-
13
Dec-
13
Jun-
14
Dec-
14
Jun-
15
USD
per
MT Difference
US Gulf Maize CNF China + VATChinese Futures (DCE)US Gulf Maize (FOB)
Has it been too good to be true?: Impact of grain policy
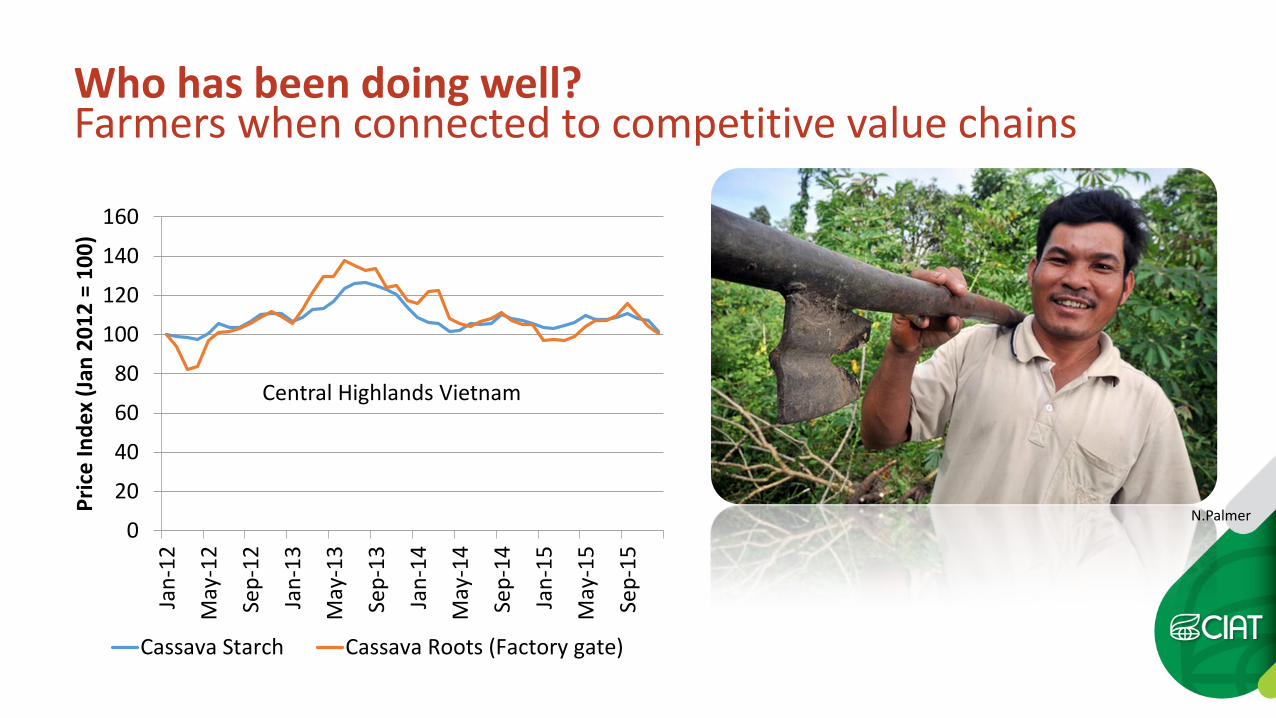
Who has been doing well? Farmers when connected to competitive value chains
0
20
40
60
80
100
120
140
160
Jan-
12
May
-12
Sep-
12
Jan-
13
May
-13
Sep-
13
Jan-
14
May
-14
Sep-
14
Jan-
15
May
-15
Sep-
15
Pric
e In
dex
(Jan
201
2 =
100)
Cassava Starch Cassava Roots (Factory gate)
Central Highlands Vietnam
N.Palmer
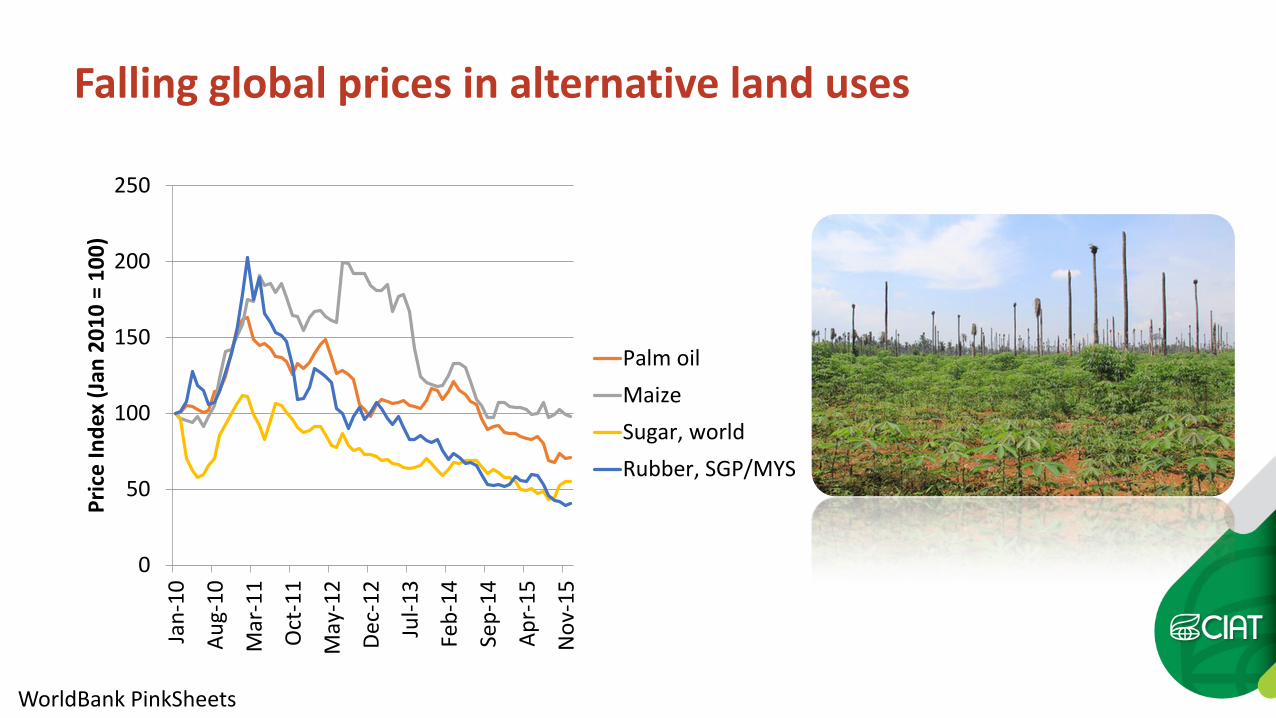
Falling global prices in alternative land uses
0
50
100
150
200
250Ja
n-10
Aug-
10
Mar
-11
Oct
-11
May
-12
Dec-
12
Jul-1
3
Feb-
14
Sep-
14
Apr-
15
Nov
-15
Pric
e In
dex
(Jan
201
0 =
100)
Palm oilMaizeSugar, worldRubber, SGP/MYS
WorldBank PinkSheets
0
100
200
300
400
500
600
700
0
100
200
300
400
500
600
Jun-08 Oct-09 Mar-11 Jul-12 Dec-13 Apr-15
Thai
Tap
ioca
(USD
/t)
Mai
ze p
rice
(USD
/t)
US Corn (FOB GULF) US Corn + Freight +VATDaLian (China) Nearby Futures Thai Tapioca (FOB Bangkok)
Cassava following the correction in maize prices
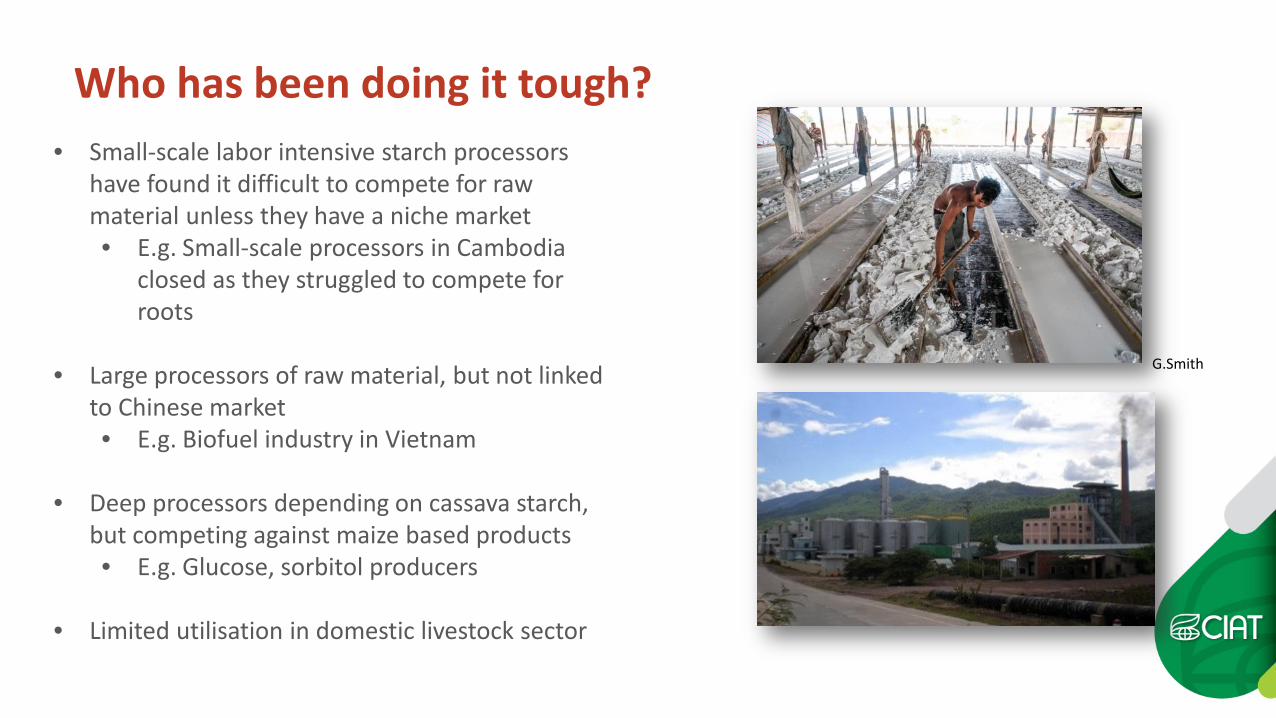
• Small-scale labor intensive starch processors have found it difficult to compete for raw material unless they have a niche market • E.g. Small-scale processors in Cambodia
closed as they struggled to compete for roots
• Large processors of raw material, but not linked to Chinese market • E.g. Biofuel industry in Vietnam
• Deep processors depending on cassava starch,
but competing against maize based products • E.g. Glucose, sorbitol producers
• Limited utilisation in domestic livestock sector
Who has been doing it tough?
G.Smith
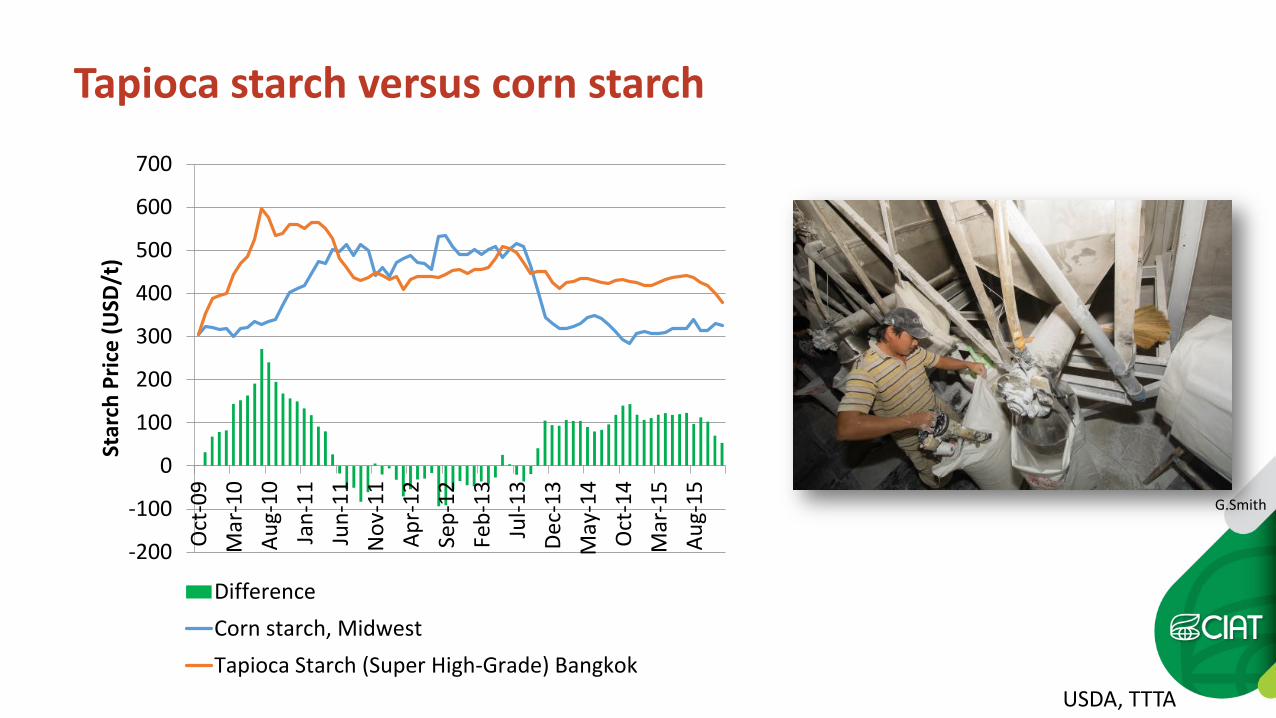
-200
-100
0
100
200
300
400
500
600
700O
ct-0
9M
ar-1
0Au
g-10
Jan-
11Ju
n-11
Nov
-11
Apr-
12Se
p-12
Feb-
13Ju
l-13
Dec-
13M
ay-1
4O
ct-1
4M
ar-1
5Au
g-15
Star
ch P
rice
(USD
/t)
DifferenceCorn starch, MidwestTapioca Starch (Super High-Grade) Bangkok
Tapioca starch versus corn starch
USDA, TTTA
G.Smith
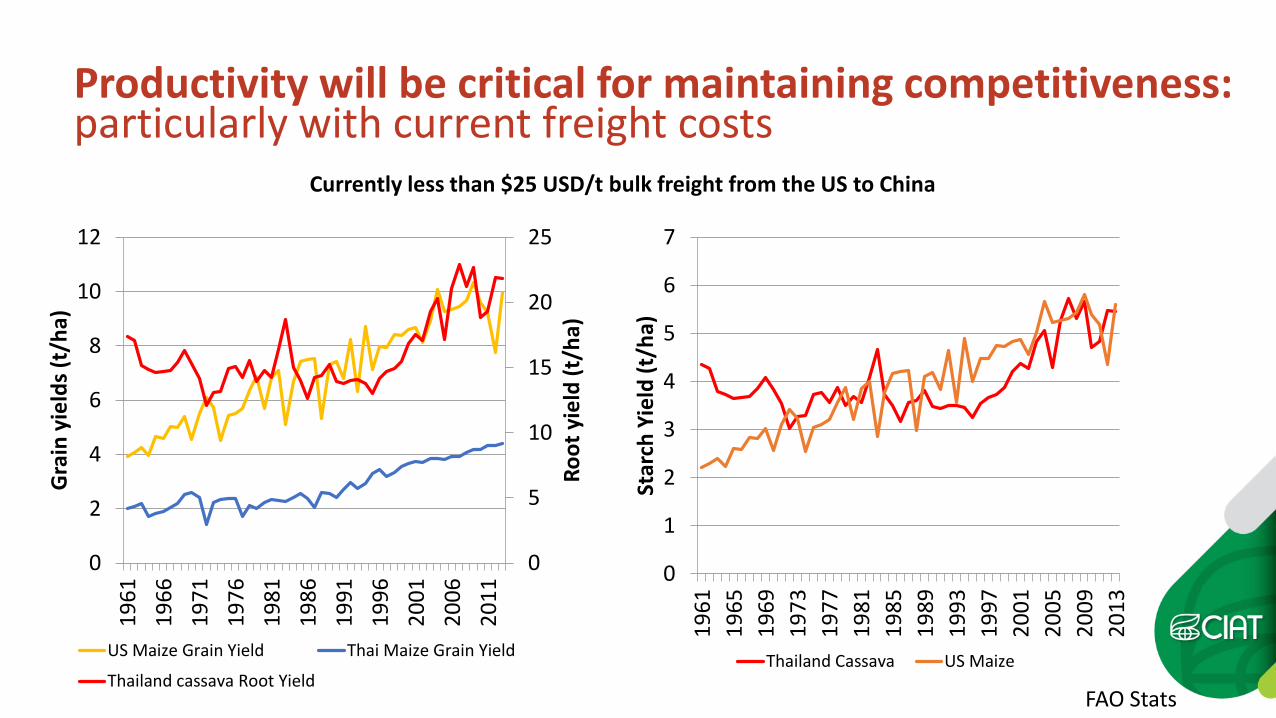
Productivity will be critical for maintaining competitiveness: particularly with current freight costs
0
5
10
15
20
25
0
2
4
6
8
10
12
1961
1966
1971
1976
1981
1986
1991
1996
2001
2006
2011
Root
yie
ld (t
/ha)
Gra
in y
ield
s (t/
ha)
US Maize Grain Yield Thai Maize Grain Yield
Thailand cassava Root Yield
0
1
2
3
4
5
6
7
1961
1965
1969
1973
1977
1981
1985
1989
1993
1997
2001
2005
2009
2013
Star
ch Y
ield
(t/h
a)
Thailand Cassava US Maize
Currently less than $25 USD/t bulk freight from the US to China
FAO Stats
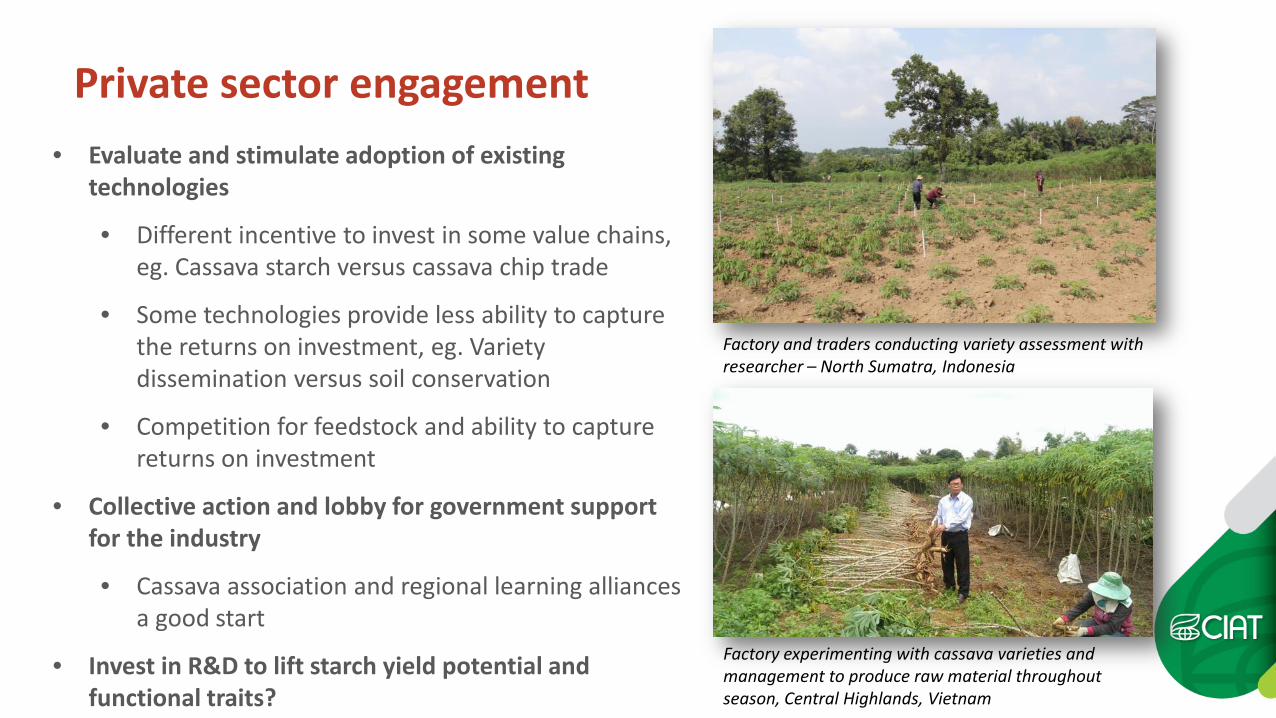
Private sector engagement
• Evaluate and stimulate adoption of existing technologies
• Different incentive to invest in some value chains, eg. Cassava starch versus cassava chip trade
• Some technologies provide less ability to capture the returns on investment, eg. Variety dissemination versus soil conservation
• Competition for feedstock and ability to capture returns on investment
• Collective action and lobby for government support for the industry
• Cassava association and regional learning alliances a good start
• Invest in R&D to lift starch yield potential and functional traits?
Factory and traders conducting variety assessment with researcher – North Sumatra, Indonesia
Factory experimenting with cassava varieties and management to produce raw material throughout season, Central Highlands, Vietnam
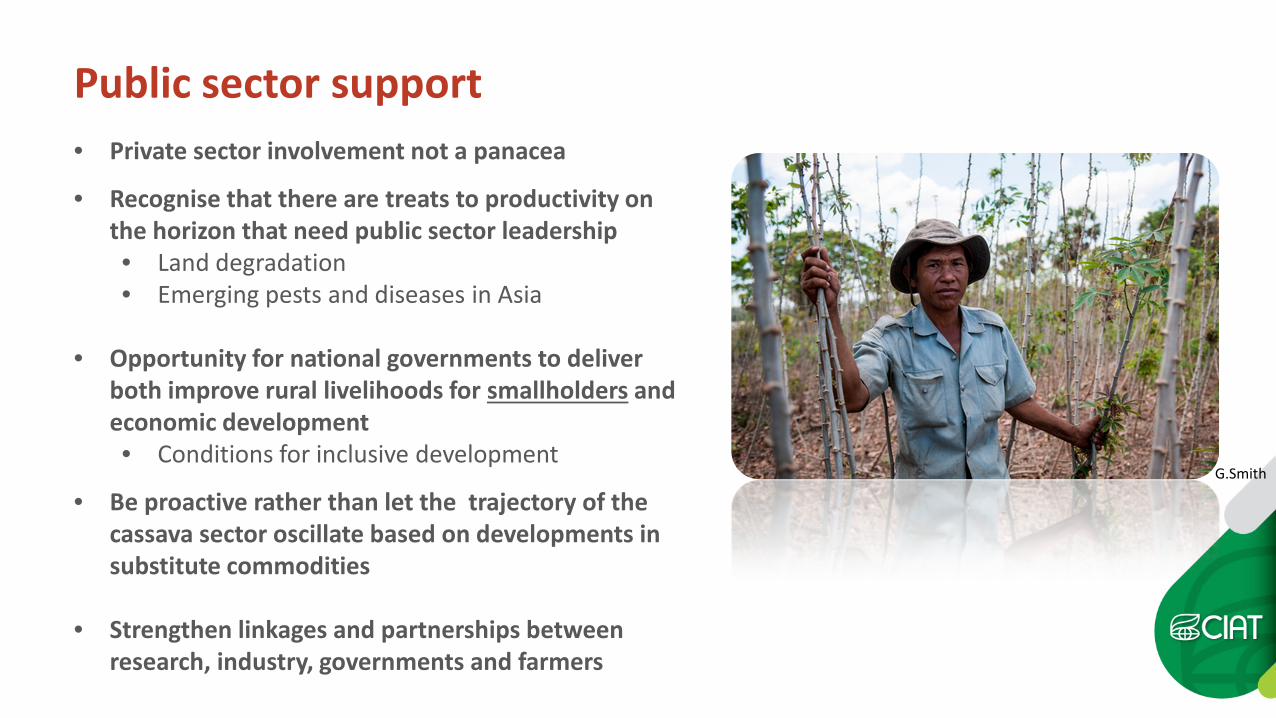
Public sector support • Private sector involvement not a panacea
• Recognise that there are treats to productivity on the horizon that need public sector leadership • Land degradation • Emerging pests and diseases in Asia
• Opportunity for national governments to deliver
both improve rural livelihoods for smallholders and economic development • Conditions for inclusive development
• Be proactive rather than let the trajectory of the cassava sector oscillate based on developments in substitute commodities
• Strengthen linkages and partnerships between research, industry, governments and farmers
G.Smith


![CraftConf [Preview] "Empathy - The Hidden Ingredient of Good Software Development"](https://img.pdfslide.net/doc/110x75/58efd73c1a28abd22a8b45fd/craftconf-preview-empathy-the-hidden-ingredient-of-good-software-development.jpg)