Embed Size (px)
Citation preview
OL-8552-08
A
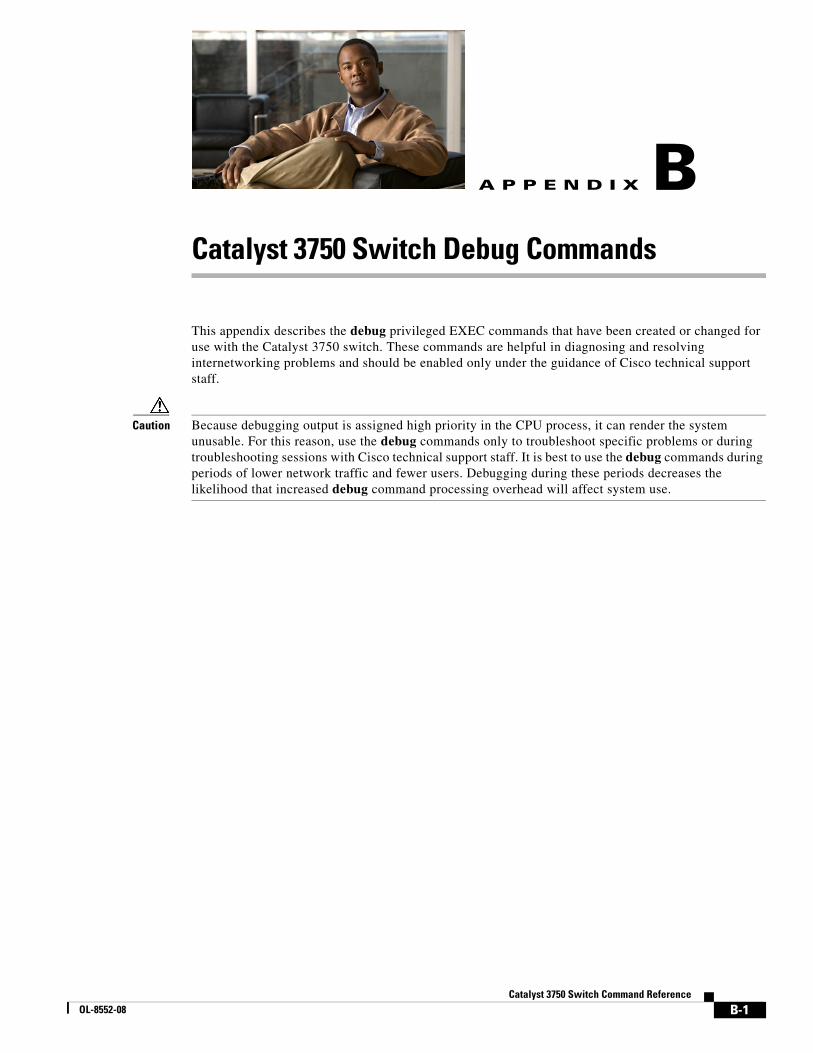
P P E N D I X B Catalyst 3750 Switch Debug CommandsThis appendix describes the debug privileged EXEC commands that have been created or changed for use with the Catalyst 3750 switch. These commands are helpful in diagnosing and resolving internetworking problems and should be enabled only under the guidance of Cisco technical support staff.
Caution Because debugging output is assigned high priority in the CPU process, it can render the system unusable. For this reason, use the debug commands only to troubleshoot specific problems or during troubleshooting sessions with Cisco technical support staff. It is best to use the debug commands during periods of lower network traffic and fewer users. Debugging during these periods decreases the likelihood that increased debug command processing overhead will affect system use.
B-1Catalyst 3750 Switch Command Reference
Appendix B Catalyst 3750 Switch Debug Commandsdebug authentication
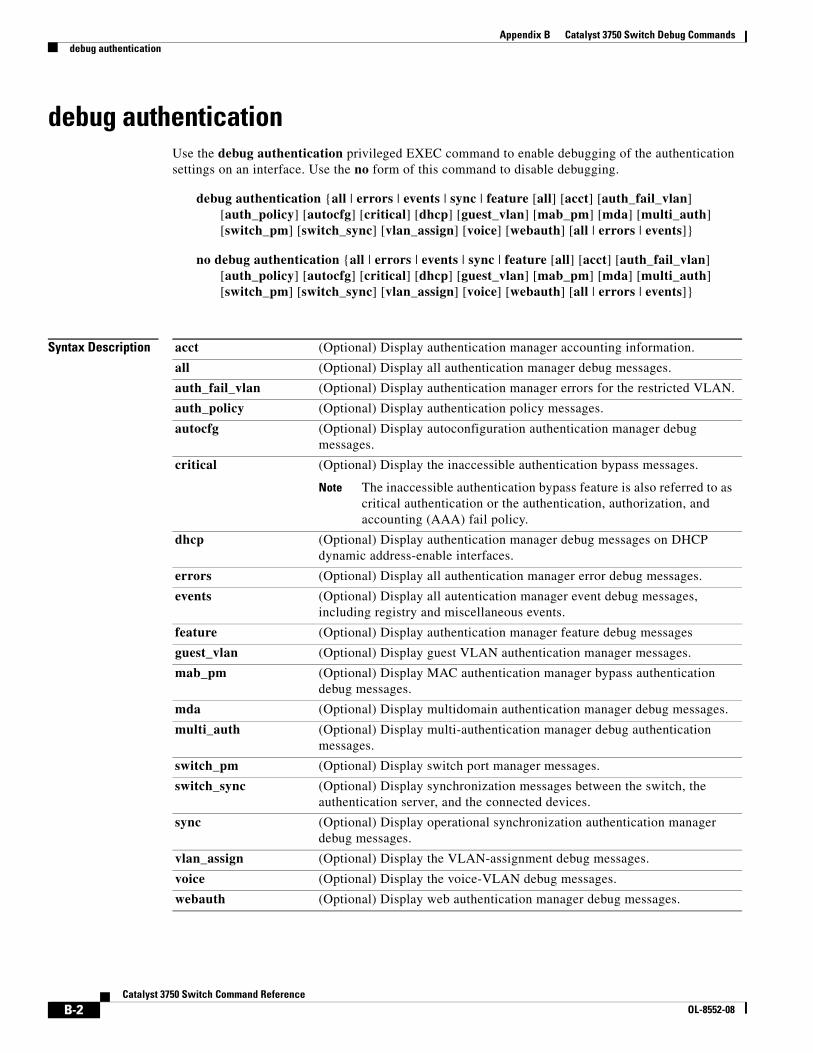
debug authenticationUse the debug authentication privileged EXEC command to enable debugging of the authentication settings on an interface. Use the no form of this command to disable debugging.
debug authentication {all | errors | events | sync | feature [all] [acct] [auth_fail_vlan] [auth_policy] [autocfg] [critical] [dhcp] [guest_vlan] [mab_pm] [mda] [multi_auth] [switch_pm] [switch_sync] [vlan_assign] [voice] [webauth] [all | errors | events]}
no debug authentication {all | errors | events | sync | feature [all] [acct] [auth_fail_vlan] [auth_policy] [autocfg] [critical] [dhcp] [guest_vlan] [mab_pm] [mda] [multi_auth] [switch_pm] [switch_sync] [vlan_assign] [voice] [webauth] [all | errors | events]}
Syntax Description acct (Optional) Display authentication manager accounting information.
all (Optional) Display all authentication manager debug messages.
auth_fail_vlan (Optional) Display authentication manager errors for the restricted VLAN.
auth_policy (Optional) Display authentication policy messages.
autocfg (Optional) Display autoconfiguration authentication manager debug messages.
critical (Optional) Display the inaccessible authentication bypass messages.
Note The inaccessible authentication bypass feature is also referred to as critical authentication or the authentication, authorization, and accounting (AAA) fail policy.
dhcp (Optional) Display authentication manager debug messages on DHCP dynamic address-enable interfaces.
errors (Optional) Display all authentication manager error debug messages.
events (Optional) Display all autentication manager event debug messages, including registry and miscellaneous events.
feature (Optional) Display authentication manager feature debug messages
guest_vlan (Optional) Display guest VLAN authentication manager messages.
mab_pm (Optional) Display MAC authentication manager bypass authentication debug messages.
mda (Optional) Display multidomain authentication manager debug messages.
multi_auth (Optional) Display multi-authentication manager debug authentication messages.
switch_pm (Optional) Display switch port manager messages.
switch_sync (Optional) Display synchronization messages between the switch, the authentication server, and the connected devices.
sync (Optional) Display operational synchronization authentication manager debug messages.
vlan_assign (Optional) Display the VLAN-assignment debug messages.
voice (Optional) Display the voice-VLAN debug messages.
webauth (Optional) Display web authentication manager debug messages.
B-2Catalyst 3750 Switch Command Reference
OL-8552-08
Appendix B Catalyst 3750 Switch Debug Commandsdebug authentication
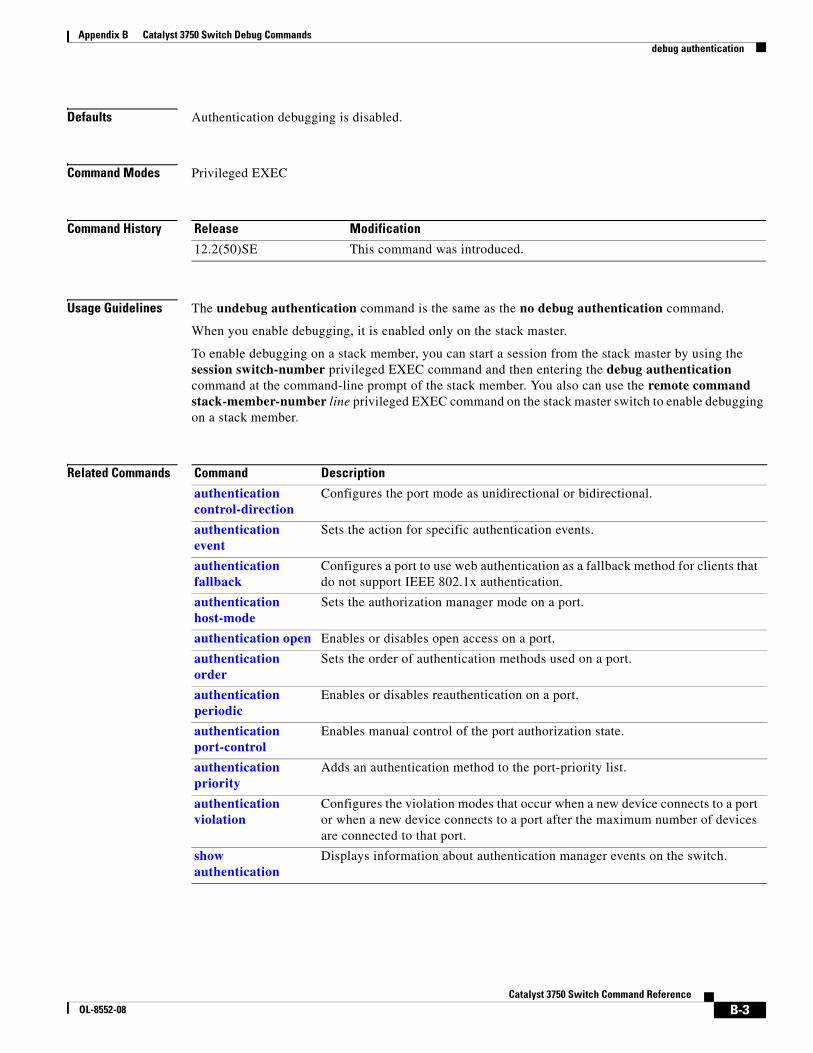
Defaults Authentication debugging is disabled.
Command Modes Privileged EXEC
Command History
Usage Guidelines The undebug authentication command is the same as the no debug authentication command.
When you enable debugging, it is enabled only on the stack master.
To enable debugging on a stack member, you can start a session from the stack master by using the session switch-number privileged EXEC command and then entering the debug authentication command at the command-line prompt of the stack member. You also can use the remote command stack-member-number line privileged EXEC command on the stack master switch to enable debugging on a stack member.
Related Commands
Release Modification
12.2(50)SE This command was introduced.
Command Description
authentication control-direction
Configures the port mode as unidirectional or bidirectional.
authentication event
Sets the action for specific authentication events.
authentication fallback
Configures a port to use web authentication as a fallback method for clients that do not support IEEE 802.1x authentication.
authentication host-mode
Sets the authorization manager mode on a port.
authentication open Enables or disables open access on a port.
authentication order
Sets the order of authentication methods used on a port.
authentication periodic
Enables or disables reauthentication on a port.
authentication port-control
Enables manual control of the port authorization state.
authentication priority
Adds an authentication method to the port-priority list.
authentication violation
Configures the violation modes that occur when a new device connects to a port or when a new device connects to a port after the maximum number of devices are connected to that port.
show authentication
Displays information about authentication manager events on the switch.
B-3Catalyst 3750 Switch Command Reference
OL-8552-08
Appendix B Catalyst 3750 Switch Debug Commandsdebug auto qos
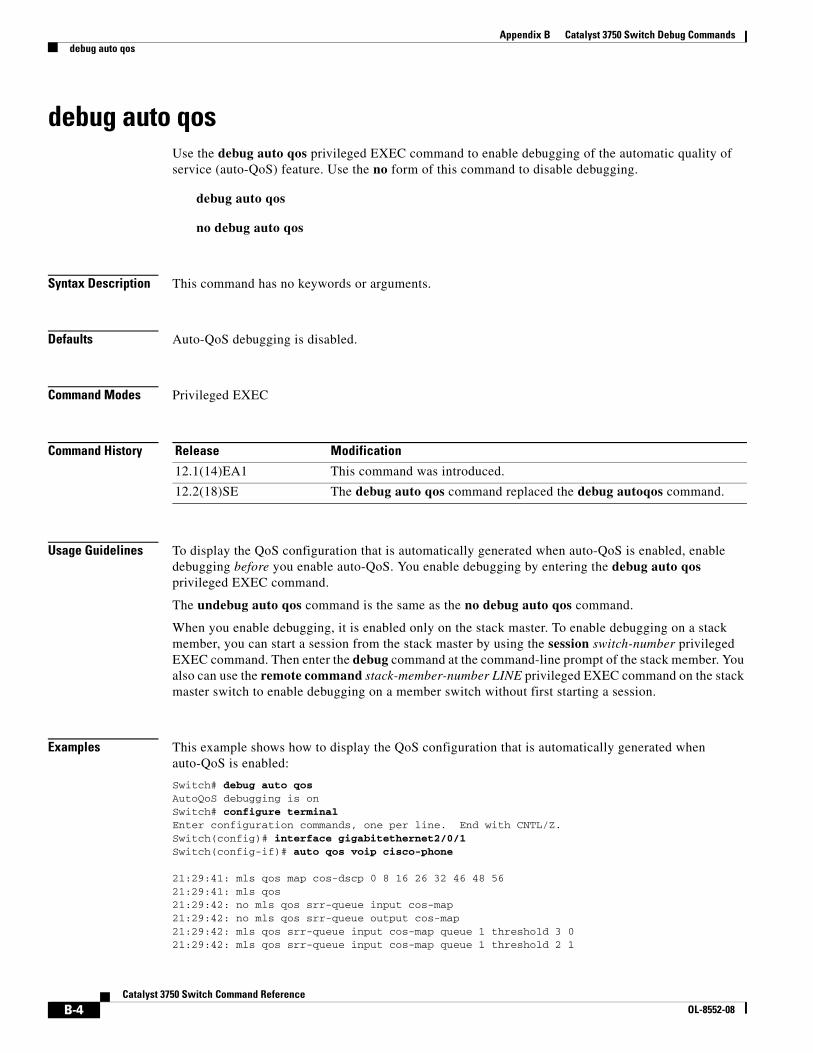
debug auto qosUse the debug auto qos privileged EXEC command to enable debugging of the automatic quality of service (auto-QoS) feature. Use the no form of this command to disable debugging.
debug auto qos
no debug auto qos
Syntax Description This command has no keywords or arguments.
Defaults Auto-QoS debugging is disabled.
Command Modes Privileged EXEC
Command History
Usage Guidelines To display the QoS configuration that is automatically generated when auto-QoS is enabled, enable debugging before you enable auto-QoS. You enable debugging by entering the debug auto qos privileged EXEC command.
The undebug auto qos command is the same as the no debug auto qos command.
When you enable debugging, it is enabled only on the stack master. To enable debugging on a stack member, you can start a session from the stack master by using the session switch-number privileged EXEC command. Then enter the debug command at the command-line prompt of the stack member. You also can use the remote command stack-member-number LINE privileged EXEC command on the stack master switch to enable debugging on a member switch without first starting a session.
Examples This example shows how to display the QoS configuration that is automatically generated when auto-QoS is enabled:
Switch# debug auto qosAutoQoS debugging is onSwitch# configure terminalEnter configuration commands, one per line. End with CNTL/Z.Switch(config)# interface gigabitethernet2/0/1Switch(config-if)# auto qos voip cisco-phone
21:29:41: mls qos map cos-dscp 0 8 16 26 32 46 48 5621:29:41: mls qos21:29:42: no mls qos srr-queue input cos-map21:29:42: no mls qos srr-queue output cos-map21:29:42: mls qos srr-queue input cos-map queue 1 threshold 3 021:29:42: mls qos srr-queue input cos-map queue 1 threshold 2 1
Release Modification
12.1(14)EA1 This command was introduced.
12.2(18)SE The debug auto qos command replaced the debug autoqos command.
B-4Catalyst 3750 Switch Command Reference
OL-8552-08
Appendix B Catalyst 3750 Switch Debug Commandsdebug auto qos
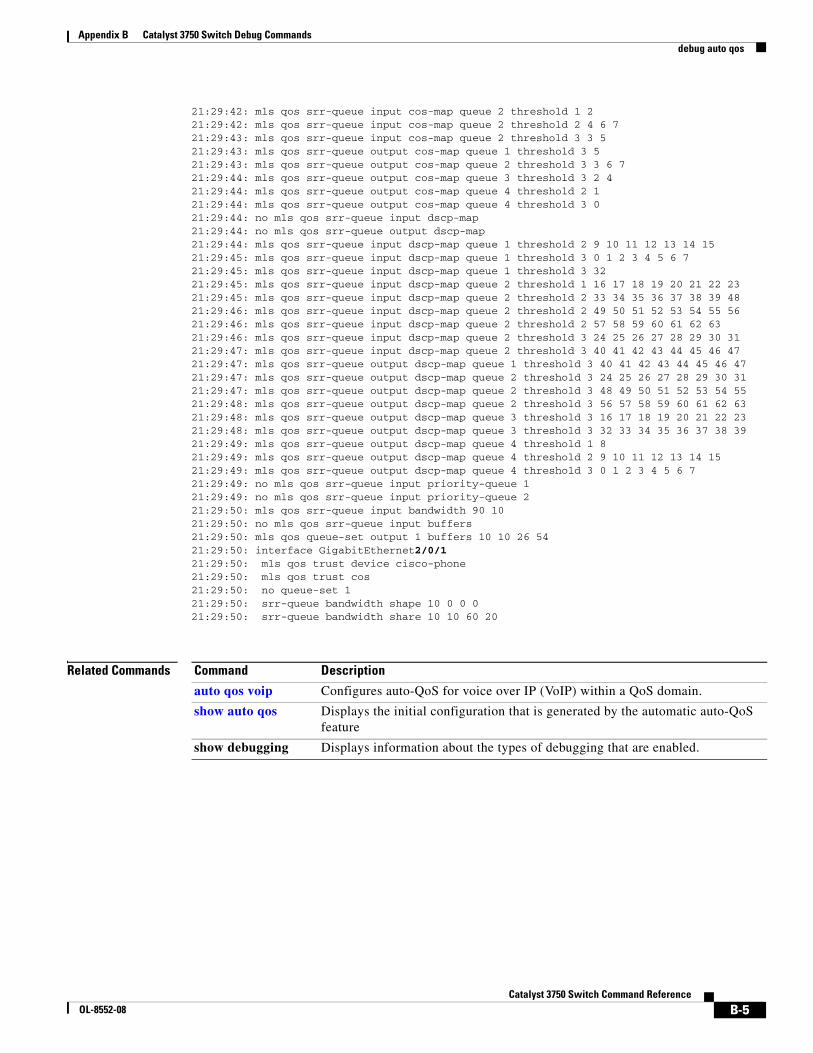
21:29:42: mls qos srr-queue input cos-map queue 2 threshold 1 221:29:42: mls qos srr-queue input cos-map queue 2 threshold 2 4 6 721:29:43: mls qos srr-queue input cos-map queue 2 threshold 3 3 521:29:43: mls qos srr-queue output cos-map queue 1 threshold 3 521:29:43: mls qos srr-queue output cos-map queue 2 threshold 3 3 6 721:29:44: mls qos srr-queue output cos-map queue 3 threshold 3 2 421:29:44: mls qos srr-queue output cos-map queue 4 threshold 2 121:29:44: mls qos srr-queue output cos-map queue 4 threshold 3 021:29:44: no mls qos srr-queue input dscp-map21:29:44: no mls qos srr-queue output dscp-map21:29:44: mls qos srr-queue input dscp-map queue 1 threshold 2 9 10 11 12 13 14 1521:29:45: mls qos srr-queue input dscp-map queue 1 threshold 3 0 1 2 3 4 5 6 721:29:45: mls qos srr-queue input dscp-map queue 1 threshold 3 3221:29:45: mls qos srr-queue input dscp-map queue 2 threshold 1 16 17 18 19 20 21 22 2321:29:45: mls qos srr-queue input dscp-map queue 2 threshold 2 33 34 35 36 37 38 39 4821:29:46: mls qos srr-queue input dscp-map queue 2 threshold 2 49 50 51 52 53 54 55 5621:29:46: mls qos srr-queue input dscp-map queue 2 threshold 2 57 58 59 60 61 62 6321:29:46: mls qos srr-queue input dscp-map queue 2 threshold 3 24 25 26 27 28 29 30 31 21:29:47: mls qos srr-queue input dscp-map queue 2 threshold 3 40 41 42 43 44 45 46 4721:29:47: mls qos srr-queue output dscp-map queue 1 threshold 3 40 41 42 43 44 45 46 4721:29:47: mls qos srr-queue output dscp-map queue 2 threshold 3 24 25 26 27 28 29 30 3121:29:47: mls qos srr-queue output dscp-map queue 2 threshold 3 48 49 50 51 52 53 54 5521:29:48: mls qos srr-queue output dscp-map queue 2 threshold 3 56 57 58 59 60 61 62 6321:29:48: mls qos srr-queue output dscp-map queue 3 threshold 3 16 17 18 19 20 21 22 2321:29:48: mls qos srr-queue output dscp-map queue 3 threshold 3 32 33 34 35 36 37 38 3921:29:49: mls qos srr-queue output dscp-map queue 4 threshold 1 821:29:49: mls qos srr-queue output dscp-map queue 4 threshold 2 9 10 11 12 13 14 1521:29:49: mls qos srr-queue output dscp-map queue 4 threshold 3 0 1 2 3 4 5 6 721:29:49: no mls qos srr-queue input priority-queue 121:29:49: no mls qos srr-queue input priority-queue 221:29:50: mls qos srr-queue input bandwidth 90 1021:29:50: no mls qos srr-queue input buffers21:29:50: mls qos queue-set output 1 buffers 10 10 26 5421:29:50: interface GigabitEthernet2/0/121:29:50: mls qos trust device cisco-phone21:29:50: mls qos trust cos21:29:50: no queue-set 121:29:50: srr-queue bandwidth shape 10 0 0 021:29:50: srr-queue bandwidth share 10 10 60 20
Related Commands Command Description
auto qos voip Configures auto-QoS for voice over IP (VoIP) within a QoS domain.
show auto qos Displays the initial configuration that is generated by the automatic auto-QoS feature
show debugging Displays information about the types of debugging that are enabled.
B-5Catalyst 3750 Switch Command Reference
OL-8552-08
Appendix B Catalyst 3750 Switch Debug Commandsdebug backup
debug backupUse the debug backup privileged EXEC command to enable debugging of the Flex Links backup interface. Use the no form of this command to disable debugging.
debug backup {all | errors | events | vlan-load-balancing}
no debug backup {all | errors | events | vlan-load-balancing}
Syntax Description
Defaults Backup interface debugging is disabled.
Command Modes Privileged EXEC
Command History
Usage Guidelines The undebug backup command is the same as the no debug backup command.
When you enable debugging, it is enabled only on the stack master. To enable debugging on a stack member, you can start a session from the stack master by using the session switch-number privileged EXEC command. Then enter the debug command at the command-line prompt of the stack member. You also can use the remote command stack-member-number LINE privileged EXEC command on the stack master switch to enable debugging on a member switch without first starting a session.
Related Commands
all Display all backup interface debug messages.
errors Display backup interface error or exception debug messages.
events Display backup interface event debug messages.
vlan-load-balancing
Display backup interface VLAN load balancing.
Release Modification
12.2(20)SE This command was introduced.
12.2(37)SE Added vlan-load-balancing keyword.
Command Description
show debugging Displays information about the types of debugging that are enabled.
B-6Catalyst 3750 Switch Command Reference
OL-8552-08
Appendix B Catalyst 3750 Switch Debug Commandsdebug cisp
debug cisp Use the debug cisp global configuration command to enable debugging message exchanges and events on a Client Information Signalling Protocol (CISP)-enabled interface.Use the no form of this command to disable debugging.
debug cisp [all | errors | events | packets | sync]
no debug cisp [initialization | interface-configuration | rpc]
Syntax Description
Defaults Debugging is disabled.
Command Modes Privileged EXEC
Command History
Usage Guidelines The undebug cisp command is the same as the no debug cisp command.
When you enable debugging, it is enabled only on the stack master. To enable debugging on a stack member, you can start a session from the stack master by using the session switch-number privileged EXEC command. Then enter the debug command at the command-line prompt of the stack member. You also can use the remote command stack-member-number LINE privileged EXEC command on the stack master switch to enable debugging on a member switch without first starting a session.
Related Commands
all Display all CISP debug messages.
errors Display CISP debug messages.
events Display CISP event debug messages.
packets Display CISP packet debug messages.
sync Display CISP operational synchronization debug messages.
Release Modification
12.2(50)SE This command was introduced.
Command Description
cisp enable Enables Client Information Signalling Protocol (CISP)
dot1x credentials (global configuration) profile
Configures a profile on a supplicant switch.
show cisp Displays CISP information for a specified interface.
B-7Catalyst 3750 Switch Command Reference
OL-8552-08
Appendix B Catalyst 3750 Switch Debug Commandsdebug cluster
debug clusterUse the debug cluster privileged EXEC command to enable debugging of cluster-specific events. Use the no form of this command to disable debugging.
debug cluster {discovery | events | extended | hsrp | http | ip [packet] | members | nat | neighbors | platform | snmp | vqpxy}
no debug cluster {discovery | events | extended | hsrp | http | ip [packet] | members | nat | neighbors | platform | snmp | vqpxy}
Syntax Description
Defaults Debugging is disabled.
Command Modes Privileged EXEC
Command History
Usage Guidelines This command is available only on the cluster command switch stack or cluster command switch.
The undebug cluster command is the same as the no debug cluster command.
When you enable debugging, it is enabled only on the stack master. To enable debugging on a stack member, you can start a session from the stack master by using the session switch-number privileged EXEC command. Then enter the debug command at the command-line prompt of the stack member. You also can use the remote command stack-member-number LINE privileged EXEC command on the stack master switch to enable debugging on a member switch without first starting a session.
discovery Display cluster discovery debug messages.
events Display cluster event debug messages.
extended Display extended discovery debug messages.
hsrp Display the Hot Standby Router Protocol (HSRP) debug messages.
http Display Hypertext Transfer Protocol (HTTP) debug messages.
ip [packet] Display IP or transport packet debug messages.
members Display cluster member debug messages.
nat Display Network Address Translation (NAT) debug messages.
neighbors Display cluster neighbor debug messages.
platform Display platform-specific cluster debug messages.
snmp Display Simple Network Management Protocol (SNMP) debug messages.
vqpxy Display VLAN Query Protocol (VQP) proxy debug messages.
Release Modification
12.1(11)AX This command was introduced.
B-8Catalyst 3750 Switch Command Reference
OL-8552-08
Appendix B Catalyst 3750 Switch Debug Commandsdebug cluster
Related Commands Command Description
show debugging Displays information about the types of debugging that are enabled.
show cluster Displays the cluster status and a summary of the cluster to which the switch belongs.
show cluster candidates Displays a list of candidate switches when entered on the command switch.
show cluster members Displays information about cluster members when executed on the command switch.
B-9Catalyst 3750 Switch Command Reference
OL-8552-08
Appendix B Catalyst 3750 Switch Debug Commandsdebug dot1x
debug dot1xUse the debug dot1x privileged EXEC command to enable debugging of the IEEE 802.1x authentication feature. Use the no form of this command to disable debugging.
debug dot1x {all | errors | events | feature | packets | registry | state-machine}
no debug dot1x {all | errors | events | feature | packets | registry | state-machine}
Syntax Description
Note Though visible in the command-line help strings, the redundancy keyword is not supported.
Defaults Debugging is disabled.
Command Modes Privileged EXEC
Command History
Usage Guidelines The undebug dot1x command is the same as the no debug dot1x command.
When you enable debugging, it is enabled only on the stack master. To enable debugging on a stack member, you can start a session from the stack master by using the session switch-number privileged EXEC command. Then enter the debug command at the command-line prompt of the stack member. You also can use the remote command stack-member-number LINE privileged EXEC command on the stack master switch to enable debugging on a member switch without first starting a session.
all Display all IEEE 802.1x authentication debug messages.
errors Display IEEE 802.1x error debug messages.
events Display IEEE 802.1x event debug messages.
feature Display IEEE 802.1x feature debug messages.
packets Display IEEE 802.1x packet debug messages.
registry Display IEEE 802.1x registry invocation debug messages.
state-machine Display state-machine related-events debug messages.
Release Modification
12.1(11)AX This command was introduced.
12.1(14)EA1 The authsm, backend, besm, core, and reauthsm keywords were removed. The errors, events, packets registry, and state-machine keywords were added.
12.2(25)SEE The feature keyword was added.
B-10Catalyst 3750 Switch Command Reference
OL-8552-08
Appendix B Catalyst 3750 Switch Debug Commandsdebug dot1x
Related Commands Command Description
show debugging Displays information about the types of debugging that are enabled.
show dot1x Displays IEEE 802.1xstatistics, administrative status, and operational status for the switch or for the specified port.
B-11Catalyst 3750 Switch Command Reference
OL-8552-08
Appendix B Catalyst 3750 Switch Debug Commandsdebug dtp
debug dtpUse the debug dtp privileged EXEC command to enable debugging of the Dynamic Trunking Protocol (DTP) activity. Use the no form of this command to disable debugging.
debug dtp {aggregation | all | decision | events | oserrs | packets | queue | states | timers}
no debug dtp {aggregation | all | decision | events | oserrs | packets | queue | states | timers}
Syntax Description
Defaults Debugging is disabled.
Command Modes Privileged EXEC
Command History
Usage Guidelines The undebug dtp command is the same as the no debug dtp command.
When you enable debugging, it is enabled only on the stack master. To enable debugging on a stack member, you can start a session from the stack master by using the session switch-number privileged EXEC command. Then enter the debug command at the command-line prompt of the stack member. You also can use the remote command stack-member-number LINE privileged EXEC command on the stack master switch to enable debugging on a member switch without first starting a session.
Related Commands
aggregation Display DTP user-message aggregation debug messages.
all Display all DTP debug messages.
decision Display the DTP decision-table debug messages.
events Display the DTP event debug messages.
oserrs Display DTP operating system-related error debug messages.
packets Display DTP packet-processing debug messages.
queue Display DTP packet-queueing debug messages.
states Display DTP state-transition debug messages.
timers Display DTP timer-event debug messages.
Release Modification
12.1(11)AX This command was introduced.
Command Description
show debugging Displays information about the types of debugging that are enabled.
show dtp Displays DTP information for the switch or for a specified interface.
B-12Catalyst 3750 Switch Command Reference
OL-8552-08
Appendix B Catalyst 3750 Switch Debug Commandsdebug eap
debug eapUse the debug eap privileged EXEC command to enable debugging of the Extensible Authentication Protocol (EAP) activity. Use the no form of this command to disable debugging.
debug dot1x {all | authenticator | errors | events | md5 | packets | peer | sm}
no debug dot1x {all | authenticator | errors | events | md5 | packets | peer | sm}
Syntax Description
Defaults Debugging is disabled.
Command Modes Privileged EXEC
Command History
Usage Guidelines The undebug dot1x command is the same as the no debug dot1x command.
When you enable debugging, it is enabled only on the stack master. To enable debugging on a stack member, you can start a session from the stack master by using the session switch-number privileged EXEC command. Then enter the debug command at the command-line prompt of the stack member. You also can use the remote command stack-member-number LINE privileged EXEC command on the stack master switch to enable debugging on a member switch without first starting a session.
Related Commands
all Display all EAP debug messages.
authenticator Display authenticator debug messages.
errors Display EAP error debug messages.
events Display EAP event debug messages.
md5 Display EAP-MD5 debug messages.
packets Display EAP packet debug messages.
peer Display EAP peer debug messages.
sm Display EAP state-machine related-events debug messages.
Release Modification
12.2(25)SEE This command was introduced.
Command Description
show debugging Displays information about the types of debugging that are enabled.
show eap Displays EAP registration and session information for the switch or for the specified port.
B-13Catalyst 3750 Switch Command Reference
OL-8552-08
Appendix B Catalyst 3750 Switch Debug Commandsdebug etherchannel
debug etherchannelUse the debug etherchannel privileged EXEC command to enable debugging of the EtherChannel/PAgP shim. This shim is the software module that is the interface between the Port Aggregation Protocol (PAgP) software module and the port manager software module. Use the no form of this command to disable debugging.
debug etherchannel [all | detail | error | event | idb]
no debug etherchannel [all | detail | error | event | idb]
Syntax Description
Note Though visible in the command-line help strings, the linecard keyword is not supported.
Defaults Debugging is disabled.
Command Modes Privileged EXEC
Command History
Usage Guidelines If you do not specify a keyword, all debug messages appear.
The undebug etherchannel command is the same as the no debug etherchannel command.
When you enable debugging, it is enabled only on the stack master. To enable debugging on a stack member, you can start a session from the stack master by using the session switch-number privileged EXEC command. Then enter the debug command at the command-line prompt of the stack member. You also can use the remote command stack-member-number LINE privileged EXEC command on the stack master switch to enable debugging on a member switch without first starting a session.
Related Commands
all (Optional) Display all EtherChannel debug messages.
detail (Optional) Display detailed EtherChannel debug messages.
error (Optional) Display EtherChannel error debug messages.
event (Optional) Debug major EtherChannel event messages.
idb (Optional) Display PAgP interface descriptor block debug messages.
Release Modification
12.1(11)AX This command was introduced.
Command Description
show debugging Displays information about the types of debugging that are enabled.
show etherchannel Displays EtherChannel information for the channel.
B-14Catalyst 3750 Switch Command Reference
OL-8552-08
Appendix B Catalyst 3750 Switch Debug Commandsdebug ilpower
debug ilpowerUse the debug ilpower privileged EXEC command to enable debugging of the power controller and Power over Ethernet (PoE) system. Use the no form of this command to disable debugging.
debug ilpower {cdp | controller | event | ha | port | powerman | registries}
no debug ilpower {cdp | controller | event | ha | port | powerman | registries}
Syntax Description
Defaults Debugging is disabled.
Command Modes Privileged EXEC
Command History
Usage Guidelines This command is supported only on PoE-capable switches.
When you enable debugging, it is enabled only on the stack master. To enable debugging on a stack member, you can start a session from the stack master by using the session switch-number privileged EXEC command. Then enter the debug command at the command-line prompt of the stack member. You also can use the remote command stack-member-number LINE privileged EXEC command on the stack master switch to enable debugging on a member switch without first starting a session.
Related Commands
cdp Display PoE Cisco Discovery Protocol (CDP) debug messages.
controller Display PoE controller debug messages.
event Display PoE event debug messages.
ha Display PoE high-availability messages.
port Display PoE port manager debug messages.
powerman Display PoE power management debug messages.
registries Display PoE registries debug messages.
Release Modification
12.1(19)EA1 This command was introduced.
12.2(25)SE The cdp, ha, and powerman keywords were added.
Command Description
show controllers power inline Displays the values in the registers of the specified PoE controller.
show power inline Displays the power status for the specified PoE port or for all PoE ports.
B-15Catalyst 3750 Switch Command Reference
OL-8552-08
Appendix B Catalyst 3750 Switch Debug Commandsdebug interface
debug interfaceUse the debug interface privileged EXEC command to enable debugging of interface-related activities. Use the no form of this command to disable debugging.
debug interface {interface-id | null interface-number | port-channel port-channel-number | vlan vlan-id}
no debug interface {interface-id | null interface-number | port-channel port-channel-number | vlan vlan-id}
Syntax Description
Defaults Debugging is disabled.
Command Modes Privileged EXEC
Command History
Usage Guidelines If you do not specify a keyword, all debug messages appear.
The undebug interface command is the same as the no debug interface command.
When you enable debugging, it is enabled only on the stack master. To enable debugging on a stack member, you can start a session from the stack master by using the session switch-number privileged EXEC command. Then enter the debug command at the command-line prompt of the stack member. You also can use the remote command stack-member-number LINE privileged EXEC command on the stack master switch to enable debugging on a member switch without first starting a session.
Related Commands
interface-id Display debug messages for the specified physical port, identified by type switch number/module number/ port, for example gigabitethernet 1/0/2.
null interface-number Display debug messages for null interfaces. The interface-number is always 0.
port-channel port-channel-number
Display debug messages for the specified EtherChannel port-channel interface. The port-channel-number range is 1 to 48.
vlan vlan-id Display debug messages for the specified VLAN. The vlan-id range is 1 to 4094.
Release Modification
12.1(11)AX This command was introduced.
Command Description
show debugging Displays information about the types of debugging that are enabled.
show etherchannel Displays EtherChannel information for the channel.
B-16Catalyst 3750 Switch Command Reference
OL-8552-08
Appendix B Catalyst 3750 Switch Debug Commandsdebug ip dhcp snooping
debug ip dhcp snoopingUse the debug ip dhcp snooping privileged EXEC command to enable debugging of DHCP snooping. Use the no form of this command to disable debugging.
debug ip dhcp snooping {mac-address | agent | event | packet}
no debug ip dhcp snooping {mac-address | agent | event | packet}
Syntax Description
Defaults Debugging is disabled.
Command Modes Privileged EXEC
Command History
Usage Guidelines The undebug ip dhcp snooping command is the same as the no debug ip dhcp snooping command.
When you enable debugging, it is enabled only on the stack master. To enable debugging on a stack member, you can start a session from the stack master by using the session switch-number privileged EXEC command. Then enter the debug command at the command-line prompt of the stack member. You also can use the remote command stack-member-number LINE privileged EXEC command on the stack master switch to enable debugging on a member switch without first starting a session.
Related Commands
mac-address Display debug messages for a DHCP packet with the specified MAC address.
agent Display debug messages for DHCP snooping agents.
event Display debug messages for DHCP snooping events.
packet Display debug messages for DHCP snooping.
Release Modification
12.2(20)SE This command was introduced.
Command Description
show debugging Displays information about the types of debugging that are enabled.
B-17Catalyst 3750 Switch Command Reference
OL-8552-08
Appendix B Catalyst 3750 Switch Debug Commandsdebug ip verify source packet
debug ip verify source packet Use the debug ip verify source packet privileged EXEC command to enable debugging of IP source guard. Use the no form of this command to disable debugging.
debug ip verify source packet
no debug ip verify source packet
Syntax Description This command has no arguments or keywords.
Defaults Debugging is disabled.
Command Modes Privileged EXEC
Command History
Usage Guidelines The undebug ip verify source packet command is the same as the no debug ip verify source packet command.
When you enable debugging, it is enabled only on the stack master. To enable debugging on a stack member, you can start a session from the stack master by using the session switch-number privileged EXEC command. Then enter the debug command at the command-line prompt of the stack member. You also can use the remote command stack-member-number LINE privileged EXEC command on the stack master switch to enable debugging on a member switch without first starting a session.
Related Commands
Release Modification
12.2(20)SE This command was introduced.
Command Description
show debugging Displays information about the types of debugging that are enabled.
B-18Catalyst 3750 Switch Command Reference
OL-8552-08
Appendix B Catalyst 3750 Switch Debug Commandsdebug ip igmp filter
debug ip igmp filterUse the debug ip igmp filter privileged EXEC command to enable debugging of Internet Group Management Protocol (IGMP) filter events. Use the no form of this command to disable debugging.
debug ip igmp filter
no debug ip igmp filter
Syntax Description This command has no arguments or keywords.
Defaults Debugging is disabled.
Command Modes Privileged EXEC
Command History
Usage Guidelines The undebug ip igmp filter command is the same as the no debug ip igmp filter command.
When you enable debugging, it is enabled only on the stack master. To enable debugging on a stack member, you can start a session from the stack master by using the session switch-number privileged EXEC command. Then enter the debug command at the command-line prompt of the stack member. You also can use the remote command stack-member-number LINE privileged EXEC command on the stack master switch to enable debugging on a member switch without first starting a session.
Related Commands
Release Modification
12.1(11)AX This command was introduced.
Command Description
show debugging Displays information about the types of debugging that are enabled.
B-19Catalyst 3750 Switch Command Reference
OL-8552-08
Appendix B Catalyst 3750 Switch Debug Commandsdebug ip igmp max-groups
debug ip igmp max-groupsUse the debug ip igmp max-groups privileged EXEC command to enable debugging of Internet Group Management Protocol (IGMP) maximum groups events. Use the no form of this command to disable debugging.
debug ip igmp max-groups
no debug ip igmp max-groups
Syntax Description This command has no arguments or keywords.
Defaults Debugging is disabled.
Command Modes Privileged EXEC
Command History
Usage Guidelines The undebug ip igmp max-groups command is the same as the no debug ip igmp max-groups command.
When you enable debugging, it is enabled only on the stack master. To enable debugging on a stack member, you can start a session from the stack master by using the session switch-number privileged EXEC command. Then enter the debug command at the command-line prompt of the stack member. You also can use the remote command stack-member-number LINE privileged EXEC command on the stack master switch to enable debugging on a member switch without first starting a session.
Related Commands
Release Modification
12.1(11)AX This command was introduced.
Command Description
show debugging Displays information about the types of debugging that are enabled.
B-20Catalyst 3750 Switch Command Reference
OL-8552-08
Appendix B Catalyst 3750 Switch Debug Commandsdebug ip igmp snooping
debug ip igmp snoopingUse the debug igmp snooping privileged EXEC command to enable debugging of Internet Group Management Protocol (IGMP) snooping activity. Use the no form of this command to disable debugging.
debug ip igmp snooping [group | management | querier | router | timer]
no debug ip igmp snooping [group | management | querier | router | timer]
Syntax Description
Defaults Debugging is disabled.
Command Modes Privileged EXEC
Command History
Usage Guidelines The undebug ip igmp snooping command is the same as the no debug ip igmp snooping command.
When you enable debugging, it is enabled only on the stack master. To enable debugging on a stack member, you can start a session from the stack master by using the session switch-number privileged EXEC command. Then enter the debug command at the command-line prompt of the stack member. You also can use the remote command stack-member-number LINE privileged EXEC command on the stack master switch to enable debugging on a member switch without first starting a session.
Related Commands
group (Optional) Display IGMP snooping group activity debug messages.
management (Optional) Display IGMP snooping management activity debug messages.
querier (Optional) Display IGMP snooping querier debug messages.
router (Optional) Display IGMP snooping router activity debug messages.
timer (Optional) Display IGMP snooping timer event debug messages.
Release Modification
12.1(11)AX This command was introduced.
12.2(25)SEA The querier keyword was added.
Command Description
debug platform ip igmp snooping
Displays information about platform-dependent IGMP snooping activity.
show debugging Displays information about the types of debugging that are enabled.
B-21Catalyst 3750 Switch Command Reference
OL-8552-08
Appendix B Catalyst 3750 Switch Debug Commandsdebug lacp
debug lacp Use the debug lacp privileged EXEC command to enable debugging of Link Aggregation Control Protocol (LACP) activity. Use the no form of this command to disable debugging.
debug lacp [all | event | fsm | misc | packet]
no debug lacp [all | event | fsm | misc | packet]
Syntax Description
Defaults Debugging is disabled.
Command Modes Privileged EXEC
Command History
Usage Guidelines The undebug lacp command is the same as the no debug lacp command.
When you enable debugging, it is enabled only on the stack master. To enable debugging on a stack member, you can start a session from the stack master by using the session switch-number privileged EXEC command. Then enter the debug command at the command-line prompt of the stack member. You also can use the remote command stack-member-number LINE privileged EXEC command on the stack master switch to enable debugging on a member switch without first starting a session.
Related Commands
all (Optional) Display all LACP debug messages.
event (Optional) Display LACP event debug messages.
fsm (Optional) Display LACP finite state-machine debug messages.
misc (Optional) Display miscellaneous LACP debug messages.
packet (Optional) Display LACP packet debug messages.
Release Modification
12.1(14)EA1 This command was introduced.
Command Description
show debugging Displays information about the types of debugging that are enabled.
show lacp Displays LACP channel-group information.
B-22Catalyst 3750 Switch Command Reference
OL-8552-08

Appendix B Catalyst 3750 Switch Debug Commandsdebug lldp packets
debug lldp packetsUse the debug lldp packets privileged EXEC command to enable debugging of Link Layer Discovery Protocol (LLDP) packets. Use the no form of this command to disable debugging.
debug lldp packets
no debug lldp packets
Syntax Description This command has no arguments or keywords.
Defaults Debugging is disabled.
Command Modes Privileged EXEC
Command History
Usage Guidelines The undebug lldp packets command is the same as the no debug lldp packets command.
When you enable debugging, it is enabled only on the stack master. To enable debugging on a stack member, you can start a session from the stack master by using the session switch-number privileged EXEC command. Then enter the debug command at the command-line prompt of the stack member. You also can use the remote command stack-member-number LINE privileged EXEC command on the stack master switch to enable debugging on a member switch without first starting a session.
Related Commands
Release Modification
12.2(50)SE This command was introduced.
Command Description
show debugging Displays information about the types of debugging that are enabled.
B-23Catalyst 3750 Switch Command Reference
OL-8552-08
Appendix B Catalyst 3750 Switch Debug Commandsdebug mac-notification
debug mac-notificationUse the debug mac-notification privileged EXEC command to enable debugging of MAC notification events. Use the no form of this command to disable debugging.
debug mac-notification
no debug mac-notification
Syntax Description This command has no arguments or keywords.
Defaults Debugging is disabled.
Command Modes Privileged EXEC
Command History
Usage Guidelines The undebug mac-notification command is the same as the no debug mac-notification command.
When you enable debugging, it is enabled only on the stack master. To enable debugging on a stack member, you can start a session from the stack master by using the session switch-number privileged EXEC command. Then enter the debug command at the command-line prompt of the stack member. You also can use the remote command stack-member-number LINE privileged EXEC command on the stack master switch to enable debugging on a member switch without first starting a session.
Related Commands
Release Modification
12.1(11)AX This command was introduced.
Command Description
show debugging Displays information about the types of debugging that are enabled.
show mac address-table notification
Displays the MAC address notification information for all interfaces or the specified interface.
B-24Catalyst 3750 Switch Command Reference
OL-8552-08
Appendix B Catalyst 3750 Switch Debug Commandsdebug macro
debug macroUse the debug macro privileged EXEC command to enable debugging of the Auto Smartports macro activity. Use the no form of this command to disable debugging.
debug macro {action | all | api | common | detector | policydir | server | xml}
no debug macro {action | all | api | common | detector | policydir | server | xml}
Syntax Description
Defaults Debugging is disabled.
Command Modes Privileged EXEC
Command History
Usage Guidelines The undebug macro command is the same as the no debug macro command.
When you enable debugging, it is enabled only on the stack master. To enable debugging on a stack member, you can start a session from the stack master by using the session switch-number privileged EXEC command. Then enter the debug command at the command-line prompt of the stack member. You also can use the remote command stack-member-number LINE privileged EXEC command on the stack master switch to enable debugging on a member switch without first starting a session.
Related Commands
action Display all action debug messages.
all Display all debug messages.
api Display all API debug messages.
common Display common debug messages.
detector Display detector error debug messages.
policydir Display policy director debug messages.
server Display server debug messages.
xml Display XML debug messages.
Release Modification
12.2(52)SE This command was introduced.
Command Description
show debugging Displays information about the types of debugging that are enabled.
B-25Catalyst 3750 Switch Command Reference
OL-8552-08
Appendix B Catalyst 3750 Switch Debug Commandsdebug matm
debug matmUse the debug matm privileged EXEC command to enable debugging of platform-independent MAC address management. Use the no form of this command to disable debugging.
debug matm
no debug matm
Syntax Description This command has no arguments or keywords.
Defaults Debugging is disabled.
Command Modes Privileged EXEC
Command History
Usage Guidelines The undebug matm command is the same as the no debug matm command.
When you enable debugging, it is enabled only on the stack master. To enable debugging on a stack member, you can start a session from the stack master by using the session switch-number privileged EXEC command. Then enter the debug command at the command-line prompt of the stack member. You also can use the remote command stack-member-number LINE privileged EXEC command on the stack master switch to enable debugging on a member switch without first starting a session.
Related Commands
Release Modification
12.1(11)AX This command was introduced.
Command Description
debug platform matm Displays information about platform-dependent MAC address management.
show debugging Displays information about the types of debugging that are enabled.
B-26Catalyst 3750 Switch Command Reference
OL-8552-08
Appendix B Catalyst 3750 Switch Debug Commandsdebug matm move update
debug matm move updateUse the debug matm move update privileged EXEC command to enable debugging of MAC address-table move update message processing.
debug matm move update
no debug matm move update
Syntax Description This command has no arguments or keywords.
Defaults Debugging is disabled.
Command Modes Privileged EXEC
Command History
Usage Guidelines The undebug matm move update command is the same as the no debug matm move update command.
When you enable debugging, it is enabled only on the stack master. To enable debugging on a stack member, you can start a session from the stack master by using the session switch-number privileged EXEC command. Then enter the debug command at the command-line prompt of the stack member. You canalso use the remote command stack-member-number LINE privileged EXEC command on the stack master switch to enable debugging on a member switch without first starting a session.
Related Commands
Release Modification
12.2(25)SED This command was introduced.
Command Description
mac address-table move update {receive | transmit}
Configures MAC address-table move update feature on the switch.
show debugging Displays information about the types of debugging that are enabled.
show mac address-table move update
Displays the MAC address-table move update information on the switch.
B-27Catalyst 3750 Switch Command Reference
OL-8552-08
Appendix B Catalyst 3750 Switch Debug Commandsdebug monitor
debug monitorUse the debug monitor privileged EXEC command to enable debugging of the Switched Port Analyzer (SPAN) feature. Use the no form of this command to disable debugging.
debug monitor {all | errors | idb-update | info | list | notifications | platform | requests | snmp}
no debug monitor {all | errors | idb-update | info | list | notifications | platform | requests | snmp}
Syntax Description
Defaults Debugging is disabled.
Command Modes Privileged EXEC
Command History
Usage Guidelines The undebug monitor command is the same as the no debug monitor command.
When you enable debugging, it is enabled only on the stack master. To enable debugging on a stack member, you can start a session from the stack master by using the session switch-number privileged EXEC command. Then enter the debug command at the command-line prompt of the stack member. You also can use the remote command stack-member-number LINE privileged EXEC command on the stack master switch to enable debugging on a member switch without first starting a session.
all Display all SPAN debug messages.
errors Display detailed SPAN error debug messages.
idb-update Display SPAN interface description block (IDB) update-trace debug messages.
info Display SPAN informational-tracing debug messages.
list Display SPAN port and VLAN-list tracing debug messages.
notifications Display SPAN notification debug messages.
platform Display SPAN platform-tracing debug messages.
requests Display SPAN request debug messages.
snmp Display SPAN and Simple Network Management Protocol (SNMP) tracing debug messages.
Release Modification
12.1(11)AX This command was introduced.
B-28Catalyst 3750 Switch Command Reference
OL-8552-08
Appendix B Catalyst 3750 Switch Debug Commandsdebug monitor
Related Commands Command Description
show debugging Displays information about the types of debugging that are enabled.
show monitor Displays information about all SPAN and remote SPAN (RSPAN) sessions on the switch.
B-29Catalyst 3750 Switch Command Reference
OL-8552-08
Appendix B Catalyst 3750 Switch Debug Commandsdebug mvrdbg
debug mvrdbgUse the debug mvrdbg privileged EXEC command to enable debugging of Multicast VLAN Registration (MVR). Use the no form of this command to disable debugging.
debug mvrdbg {all | events | igmpsn | management | ports}
no debug mvrdbg {all | events | igmpsn | management | ports}
Syntax Description
Defaults Debugging is disabled.
Command Modes Privileged EXEC
Command History
Usage Guidelines The undebug mvrdbg command is the same as the no debug mvrdbg command.
When you enable debugging, it is enabled only on the stack master. To enable debugging on a stack member, you can start a session from the stack master by using the session switch-number privileged EXEC command. Then enter the debug command at the command-line prompt of the stack member. You also can use the remote command stack-member-number LINE privileged EXEC command on the stack master switch to enable debugging on a member switch without first starting a session.
Related Commands
all Display all MVR activity debug messages.
events Display MVR event-handling debug messages.
igmpsn Display MVR Internet Group Management Protocol (IGMP) snooping-activity debug messages.
management Display MVR management-activity debug messages.
ports Display MVR port debug messages.
Release Modification
12.1(11)AX This command was introduced.
Command Description
show debugging Displays information about the types of debugging that are enabled.
show mvr Displays the current MVR configuration.
B-30Catalyst 3750 Switch Command Reference
OL-8552-08
Appendix B Catalyst 3750 Switch Debug Commandsdebug nmsp
debug nmspUse the debug nmsp privileged EXEC command to the enable debugging of the Network Mobility Services Protocol (NMSP) on the switch. This command is available only when your switch is running the cryptographic (encrypted) software image. Use the no form of this command to disable debugging.
debug nmsp {all | connection | error | event | packet | rx | tx}
no debug nmsp
Syntax Description This command has no arguments or keywords.
Defaults Debugging is disabled.
Command Modes Privileged EXEC
Command History
Usage Guidelines The undebug nmsp command is the same as the no debug nmsp command.
When you enable debugging, it is enabled only on the stack master. To enable debugging on a stack member, you can start a session from the stack master by using the session switch-number privileged EXEC command. Then enter the debug command at the command-line prompt of the stack member. You also can use the remote command stack-member-number LINE privileged EXEC command on the stack master switch to enable debugging on a member switch without first starting a session.
Related Commands
Release Modification
12.2(50)SE This command was introduced.
Command Description
show debugging Displays information about the types of debugging that are enabled.
show nmsp Displays the NMSP information.
B-31Catalyst 3750 Switch Command Reference
OL-8552-08
Appendix B Catalyst 3750 Switch Debug Commandsdebug nvram
debug nvramUse the debug nvram privileged EXEC command to enable debugging of NVRAM activity. Use the no form of this command to disable debugging.
debug nvram
no debug nvram
Syntax Description This command has no arguments or keywords.
Defaults Debugging is disabled.
Command Modes Privileged EXEC
Command History
Usage Guidelines The undebug nvram command is the same as the no debug nvram command.
When you enable debugging, it is enabled only on the stack master. To enable debugging on a stack member, you can start a session from the stack master by using the session switch-number privileged EXEC command. Then enter the debug command at the command-line prompt of the stack member. You also can use the remote command stack-member-number LINE privileged EXEC command on the stack master switch to enable debugging on a member switch without first starting a session.
Related Commands
Release Modification
12.1(11)AX This command was introduced.
Command Description
show debugging Displays information about the types of debugging that are enabled.
B-32Catalyst 3750 Switch Command Reference
OL-8552-08
Appendix B Catalyst 3750 Switch Debug Commandsdebug pagp
debug pagpUse the debug pagp privileged EXEC command to enable debugging of Port Aggregation Protocol (PAgP) activity. Use the no form of this command to disable debugging.
debug pagp [all | dual-active | event | fsm | misc | packet]
no debug pagp [all | dual-active | event | fsm | misc | packet]
Syntax Description
Defaults Debugging is disabled.
Command Modes Privileged EXEC
Command History
Usage Guidelines The undebug pagp command is the same as the no debug pagp command.
When you enable debugging, it is enabled only on the stack master. To enable debugging on a stack member, you can start a session from the stack master by using the session switch-number privileged EXEC command. Then enter the debug command at the command-line prompt of the stack member. You also can use the remote command stack-member-number LINE privileged EXEC command on the stack master switch to enable debugging on a member switch without first starting a session.
Related Commands
all (Optional) Display all PAgP debug messages.
dual-active (Optional) Display dual-active detection messages.
event (Optional) Display PAgP event debug messages.
fsm (Optional) Display PAgP finite state-machine debug messages.
misc (Optional) Display miscellaneous PAgP debug messages.
packet (Optional) Display PAgP packet debug messages.
Release Modification
12.1(11)AX This command was introduced.
12.2(46)SE The dual-active keyword was added.
Command Description
show debugging Displays information about the types of debugging that are enabled.
show pagp Displays PAgP channel-group information.
B-33Catalyst 3750 Switch Command Reference
OL-8552-08
Appendix B Catalyst 3750 Switch Debug Commandsdebug platform acl
debug platform aclUse the debug platform acl privileged EXEC command to enable debugging of the access control list (ACL) manager. Use the no form of this command to disable debugging.
debug platform acl {all | exit | label | main | racl | stack | vacl | vlmap | warn}
no debug platform acl {all | exit | label | main | racl | stack | vacl | vlmap | warn}
Syntax Description
Defaults Debugging is disabled.
Command Modes Privileged EXEC
Command History
Usage Guidelines The undebug platform acl command is the same as the no debug platform acl command.
When you enable debugging, it is enabled only on the stack master. To enable debugging on a stack member, you can start a session from the stack master by using the session switch-number privileged EXEC command. Then enter the debug command at the command-line prompt of the stack member. You also can use the remote command stack-member-number LINE privileged EXEC command on the stack master switch to enable debugging on a member switch without first starting a session.
Related Commands
all Display all ACL manager debug messages.
exit Display ACL exit-related debug messages.
label Display ACL label-related debug messages.
main Display the main or important ACL debug messages.
racl Display router ACL related debug messages.
stack Display ACL stack-related debug messages.
vacl Display VLAN ACL-related debug messages.
vlmap Display ACL VLAN-map-related debug messages.
warn Display ACL warning-related debug messages.
Release Modification
12.1(11)AX This command was introduced.
Command Description
show debugging Displays information about the types of debugging that are enabled.
B-34Catalyst 3750 Switch Command Reference
OL-8552-08
Appendix B Catalyst 3750 Switch Debug Commandsdebug platform backup interface
debug platform backup interfaceUse the debug platform backup interface privileged EXEC command to enable debugging of the Flex Links platform backup interface. Use the no form of this command to disable debugging.
debug platform backup interface
no debug platform backup interface
Syntax Description This command has no arguments or keywords.
Defaults Platform backup interface debugging is disabled.
Command Modes Privileged EXEC
Command History
Usage Guidelines The undebug platform backup interface command is the same as the no debug platform backup interface command.
When you enable debugging, it is enabled only on the stack master. To enable debugging on a stack member, you can start a session from the stack master by using the session switch-number privileged EXEC command. Then enter the debug command at the command-line prompt of the stack member. You also can use the remote command stack-member-number LINE privileged EXEC command on the stack master switch to enable debugging on a member switch without first starting a session.
Related Commands
Release Modification
12.2(20)SE This command was introduced.
Command Description
show debugging Displays information about the types of debugging that are enabled.
B-35Catalyst 3750 Switch Command Reference
OL-8552-08
Appendix B Catalyst 3750 Switch Debug Commandsdebug platform cisp
debug platform cisp Use the debug platform cisp global configuration command to enable platform-level debugging of a switch that has one or more Client Information Signalling Protocol (CISP)-enabled interfaces. Use the no form of this command to disable debugging.
debug platform cisp [initialization | interface-configuration | rpc]
no debug platform cisp [initialization | interface-configuration | rpc]
Syntax Description
Defaults Debugging is disabled.
Command Modes Privileged EXEC
Command History
Usage Guidelines The undebug platform cisp command is the same as the no debug platform cisp command.
When you enable debugging, it is enabled only on the stack master. To enable debugging on a stack member, start a session from the stack master by using the session switch-number privileged EXEC command and enter enter the debug command at the command-line prompt of the stack member. You also can use the remote command stack-member-number <line> privileged EXEC command on the stack master switch to enable debugging on a member switch without first starting a session.
Related Commands
initialization Enable debugging of the CISP initialization sequence.
interface-configuration Enable debugging of the CISP configuration.
rpc Enable debugging of the CISP RPC requests.
Release Modification
12.2(50)SE This command was introduced.
Command Description
cisp enable Enables Client Information Signalling Protocol (CISP)
dot1x credentials (global configuration)profile Configures a profile on a supplicant switch.
show cisp Displays CISP information for a specified interface.
B-36Catalyst 3750 Switch Command Reference
OL-8552-08
Appendix B Catalyst 3750 Switch Debug Commandsdebug platform cli-redirection main
debug platform cli-redirection mainUse the debug platform cli-redirection main privileged EXEC command to enable debugging of the main (important) command-line interface (CLI) redirection events. Use the no form of this command to disable debugging.
debug platform cli-redirection main
no debug platform cli-redirection main
Syntax Description This command has no arguments or keywords.
Defaults Debugging is disabled.
Command Modes Privileged EXEC
Command History
Usage Guidelines The undebug platform cli-redirection main command is the same as the no debug platform cli-redirection main command.
When you enable debugging, it is enabled only on the stack master. To enable debugging on a stack member, you can start a session from the stack master by using the session switch-number privileged EXEC command. Then enter the debug command at the command-line prompt of the stack member. You also can use the remote command stack-member-number LINE privileged EXEC command on the stack master switch to enable debugging on a member switch without first starting a session.
Related Commands
Release Modification
12.1(11)AX This command was introduced.
Command Description
show debugging Displays information about the types of debugging that are enabled.
B-37Catalyst 3750 Switch Command Reference
OL-8552-08
Appendix B Catalyst 3750 Switch Debug Commandsdebug platform configuration
debug platform configurationUse the debug platform configuration privileged EXEC command to enable debugging of configuration file activity across the stack. Use the no form of this command to disable debugging.
debug platform configuration {all | reception | transmission}
no debug platform configuration {all | reception | transmission}
Syntax Description
Defaults Debugging is disabled.
Command Modes Privileged EXEC
Command History
Usage Guidelines The undebug platform configuration command is the same as the no debug platform configuration command.
When you enable debugging, it is enabled only on the stack master. To enable debugging on a stack member, you can start a session from the stack master by using the session switch-number privileged EXEC command. Then enter the debug command at the command-line prompt of the stack member. You also can use the remote command stack-member-number LINE privileged EXEC command on the stack master switch to enable debugging on a member switch without first starting a session.
Related Commands
all Display debug messages for all configuration file transmission and reception events throughout the stack.
reception Display debug messages for configuration file reception from other stack members.
transmission Display debug messages for configuration file transmission to other stack members.
Release Modification
12.1(11)AX This command was introduced.
Command Description
show debugging Displays information about the types of debugging that are enabled.
B-38Catalyst 3750 Switch Command Reference
OL-8552-08
Appendix B Catalyst 3750 Switch Debug Commandsdebug platform cpu-queues
debug platform cpu-queuesUse the debug platform cpu-queues privileged EXEC command to enable debugging of platform central processing unit (CPU) receive queues. Use the no form of this command to disable debugging.
debug platform cpu-queues {broadcast-q | cbt-to-spt-q | cpuhub-q | host-q | icmp-q | igmp-snooping-q | layer2-protocol-q | logging-q | remote-console-q | routing-protocol-q | rpffail-q | software-fwd-q | stp-q}
no debug platform cpu-queues {broadcast-q | cbt-to-spt-q | cpuhub-q | host-q | icmp-q | igmp-snooping-q | layer2-protocol-q | logging-q | remote-console-q | routing-protocol-q | rpffail-q | software-fwd-q | stp-q}
Syntax Description
Defaults Debugging is disabled.
Command Modes Privileged EXEC
Command History
broadcast-q Display debug messages about packets received by the broadcast queue.
cbt-to-spt-q Display debug messages about packets received by the core-based tree to shortest-path tree (cbt-to-spt) queue.
cpuhub-q Display debug messages about packets received by the CPU heartbeat queue.
host-q Display debug messages about packets received by the host queue.
icmp-q Display debug messages about packets received by the Internet Control Message Protocol (ICMP) queue.
igmp-snooping-q Display debug messages about packets received by the Internet Group Management Protocol (IGMP)-snooping queue.
layer2-protocol-q Display debug messages about packets received by the Layer 2 protocol queue.
logging-q Display debug messages about packets received by the logging queue.
remote-console-q Display debug messages about packets received by the remote console queue.
routing-protocol-q Display debug messages about packets received by the routing protocol queue.
rpffail-q Display debug messages about packets received by the reverse path forwarding (RFP) failure queue.
software-fwd-q Debug packets received by the software forwarding queue.
stp-q Debug packets received by the Spanning Tree Protocol (STP) queue.
Release Modification
12.1(11)AX This command was introduced.
B-39Catalyst 3750 Switch Command Reference
OL-8552-08

Appendix B Catalyst 3750 Switch Debug Commandsdebug platform cpu-queues
Usage Guidelines The undebug platform cpu-queues command is the same as the no debug platform cpu-queues command.
When you enable debugging, it is enabled only on the stack master. To enable debugging on a stack member, you can start a session from the stack master by using the session switch-number privileged EXEC command. Then enter the debug command at the command-line prompt of the stack member. You also can use the remote command stack-member-number LINE privileged EXEC command on the stack master switch to enable debugging on a member switch without first starting a session.
Related Commands Command Description
show debugging Displays information about the types of debugging that are enabled.
B-40Catalyst 3750 Switch Command Reference
OL-8552-08
Appendix B Catalyst 3750 Switch Debug Commandsdebug platform device-manager
debug platform device-managerUse the debug platform device-manager privileged EXEC command to enable debugging of the platform-dependent device manager. Use the no form of this command to disable debugging.
debug platform device-manager {all | device-info | poll | port-download | trace}
no debug platform device-manager {all | device-info | poll | port-download | trace}
Syntax Description
Defaults Debugging is disabled.
Command Modes Privileged EXEC
Command History
Usage Guidelines The undebug platform device-manager command is the same as the no debug platform device-manager command.
When you enable debugging, it is enabled only on the stack master. To enable debugging on a stack member, you can start a session from the stack master by using the session switch-number privileged EXEC command. Then enter the debug command at the command-line prompt of the stack member. You also can use the remote command stack-member-number LINE privileged EXEC command on the stack master switch to enable debugging on a member switch without first starting a session.
Related Commands
all Display all platform device manager debug messages.
device-info Display platform device manager device structure debug messages.
poll Display platform device manager 1-second poll debug messages.
port-download Display platform device manager remote procedure call (RPC) usage debug messages.
trace Trace platform device manager function entry and exit debug messages.
Release Modification
12.1(11)AX This command was introduced.
Command Description
show debugging Displays information about the types of debugging that are enabled.
B-41Catalyst 3750 Switch Command Reference
OL-8552-08
Appendix B Catalyst 3750 Switch Debug Commandsdebug platform dot1x
debug platform dot1xUse the debug platform dot1x privileged EXEC command to enable debugging of stack-related IEEE 802.1x events. Use the no form of this command to disable debugging.
debug platform dot1x {initialization | interface-configuration | rpc}
no debug platform dot1x {initialization | interface-configuration | rpc}
Syntax Description
Defaults Debugging is disabled.
Command Modes Privileged EXEC
Command History
Usage Guidelines The undebug platform dot1x command is the same as the no debug platform dot1x command.
When you enable debugging, it is enabled only on the stack master. To enable debugging on a stack member, you can start a session from the stack master by using the session switch-number privileged EXEC command. Then enter the debug command at the command-line prompt of the stack member. You also can use the remote command stack-member-number LINE privileged EXEC command on the stack master switch to enable debugging on a member switch without first starting a session.
Related Commands
initialization Display IEEE 802.1x-authentication initialization sequence debug messages.
interface-configuration Display IEEE 802.1x interface configuration-related debug messages.
rpc Display IEEE 802.1x remote procedure call (RPC) request debug messages.
Release Modification
12.1(11)AX This command was introduced.
Command Description
show debugging Displays information about the types of debugging that are enabled.
B-42Catalyst 3750 Switch Command Reference
OL-8552-08
Appendix B Catalyst 3750 Switch Debug Commandsdebug platform etherchannel
debug platform etherchannelUse the debug platform etherchannel privileged EXEC command to enable debugging of platform-dependent EtherChannel events. Use the no form of this command to disable debugging.
debug platform etherchannel {init | link-up | rpc | warnings}
no debug platform etherchannel {init | link-up | rpc | warnings}
Syntax Description
Defaults Debugging is disabled.
Command Modes Privileged EXEC
Command History
Usage Guidelines The undebug platform etherchannel command is the same as the no debug platform etherchannel command.
When you enable debugging, it is enabled only on the stack master. To enable debugging on a stack member, you can start a session from the stack master by using the session switch-number privileged EXEC command. Then enter the debug command at the command-line prompt of the stack member. You also can use the remote command stack-member-number LINE privileged EXEC command on the stack master switch to enable debugging on a member switch without first starting a session.
Related Commands
init Display EtherChannel module initialization debug messages.
link-up Display EtherChannel link-up and link-down related debug messages.
rpc Display EtherChannel remote procedure call (RPC) debug messages.
warnings Display EtherChannel warning debug messages.
Release Modification
12.1(11)AX This command was introduced.
Command Description
show debugging Displays information about the types of debugging that are enabled.
B-43Catalyst 3750 Switch Command Reference
OL-8552-08
Appendix B Catalyst 3750 Switch Debug Commandsdebug platform fallback-bridging
debug platform fallback-bridgingUse the debug platform fallback-bridging privileged EXEC command to enable debugging of the platform-dependent fallback bridging manager. Use the no form of this command to disable debugging.
debug platform fallback-bridging [error | retry | rpc {events | messages}]
no debug platform fallback-bridging [error | retry | rpc {events | messages}]
Syntax Description
Defaults Debugging is disabled.
Command Modes Privileged EXEC
Command History
Usage Guidelines If you do not specify a keyword, all fallback bridging manager debug messages appear.
The undebug platform fallback-bridging command is the same as the no debug platform fallback-bridging command.
When you enable debugging, it is enabled only on the stack master. To enable debugging on a stack member, you can start a session from the stack master by using the session switch-number privileged EXEC command. Then enter the debug command at the command-line prompt of the stack member. You also can use the remote command stack-member-number LINE privileged EXEC command on the stack master switch to enable debugging on a member switch without first starting a session.
Related Commands
error (Optional) Display fallback bridging manager error condition messages.
retry (Optional) Display fallback bridging manager retry messages.
rpc {events | messages} (Optional) Display fallback bridging debugging information. The keywords have these meanings:
• events—Display remote procedure call (RPC) events.
• messages—Display RPC messages.
Release Modification
12.1(11)AX This command was introduced.
Command Description
show debugging Displays information about the types of debugging that are enabled.
B-44Catalyst 3750 Switch Command Reference
OL-8552-08
Appendix B Catalyst 3750 Switch Debug Commandsdebug platform forw-tcam
debug platform forw-tcamUse the debug platform forw-tcam privileged EXEC command to enable debugging of the forwarding ternary content addressable memory (TCAM) manager. Use the no form of this command to disable debugging.
debug platform forw-tcam [adjustment | allocate | audit | error | move | read | write]
no debug platform forw-tcam [adjustment | allocate | audit | error | move | read | write]
Syntax Description
Defaults Debugging is disabled.
Command Modes Privileged EXEC
Command History
Usage Guidelines If you do not specify a keyword, all forwarding TCAM manager debug messages appear.
The undebug platform forw-tcam command is the same as the no debug platform forw-tcam command.
When you enable debugging, it is enabled only on the stack master. To enable debugging on a stack member, you can start a session from the stack master by using the session switch-number privileged EXEC command. Then enter the debug command at the command-line prompt of the stack member. You also can use the remote command stack-member-number LINE privileged EXEC command on the stack master switch to enable debugging on a member switch without first starting a session.
Related Commands
adjustment (Optional) Display TCAM manager adjustment debug messages.
allocate (Optional) Display TCAM manager allocation debug messages.
audit (Optional) Display TCAM manager audit messages.
error (Optional) Display TCAM manager error messages.
move (Optional) Display TCAM manager move messages.
read (Optional) Display TCAM manager read messages.
write (Optional) Display TCAM manager write messages.
Release Modification
12.1(11)AX This command was introduced.
Command Description
show debugging Displays information about the types of debugging that are enabled.
B-45Catalyst 3750 Switch Command Reference
OL-8552-08
Appendix B Catalyst 3750 Switch Debug Commandsdebug platform frontend-controller
debug platform frontend-controllerUse the debug platform frontend-controller privileged EXEC command to enable debugging of front-end controller activity. Use the no form of this command to disable debugging.
debug platform frontend-controller {all | image | led | manager | poe | register | thermal}
no debug platform frontend-controller {all | image | led | manager | poe | register | thermal}
Syntax Description
Defaults Debugging is disabled.
Command Modes Privileged EXEC
Command History
Usage Guidelines This command is only supported on Power over Ethernet switches.
The undebug platform frontend-controller command is the same as the no debug platform frontend-controller command.
When you enable debugging, it is enabled only on the stack master. To enable debugging on a stack member, start a session from the stack master by using the session switch-number privileged EXEC command. Then enter the debug command at the command-line prompt of the stack member. You can also use the remote command stack-member-number LINE privileged EXEC command on the stack master switch to enable debugging on a member switch without first starting a session.
Related Commands
all Display all the debug messages for front-end controller.
image Display Image Manager debug messages.
led Display LED debug messages.
manager Display front-end-controller manager debug messages.
poe Display Power over Ethernet (PoE) debug messages.
register Display Register Access debug messages.
thermal Display thermal debug messages.
Release Modification
12.2(20)SE3 This command was introduced.
Command Description
show platform frontend-controller
Displays counter and status information for the front-end controller manager and subordinate applications, and displays the hardware and software information for the front-end controller.
show debugging Displays information about the types of debugging that are enabled.
B-46Catalyst 3750 Switch Command Reference
OL-8552-08
Appendix B Catalyst 3750 Switch Debug Commandsdebug platform ip arp inspection
debug platform ip arp inspectionUse the debug platform ip arp inspection privileged EXEC command to debug dynamic Address Resolution Protocol (ARP) inspection events. Use the no form of this command to disable debugging.
debug platform ip arp inspection {all | error | event | packet | rpc}
no debug platform ip arp inspection {all | error | event | packet | rpc}
Syntax Description
Defaults Debugging is disabled.
Command Modes Privileged EXEC
Command History
Usage Guidelines The undebug platform ip arp inspection command is the same as the no debug platform ip arp inspection command.
When you enable debugging, it is enabled only on the stack master. To enable debugging on a stack member, you can start a session from the stack master by using the session switch-number privileged EXEC command. Then enter the debug command at the command-line prompt of the stack member. You also can use the remote command stack-member-number LINE privileged EXEC command on the stack master switch to enable debugging on a member switch without first starting a session.
Related Commands
all Display all dynamic ARP inspection debug messages.
error Display dynamic ARP inspection error debug messages.
event Display dynamic ARP inspection event debug messages.
packet Display dynamic ARP inspection packet-related debug messages.
rpc Display dynamic ARP inspection remote procedure call (RPC) request debug messages.
Release Modification
12.2(20)SE This command was introduced.
Command Description
show inventory Displays the dynamic ARP inspection configuration and operating state.
show debugging Displays information about the types of debugging that are enabled.
B-47Catalyst 3750 Switch Command Reference
OL-8552-08
Appendix B Catalyst 3750 Switch Debug Commandsdebug platform ip dhcp
debug platform ip dhcpUse the debug platform ip dhcp privileged EXEC command to debug DHCP events. Use the no form of this command to disable debugging.
debug platform ip dhcp [all | error | event | packet | rpc]
no debug platform ip dhcp [all | error | event | packet | rpc]
Syntax Description
Defaults Debugging is disabled.
Command Modes Privileged EXEC
Command History
Usage Guidelines The undebug platform ip dhcp command is the same as the no debug platform ip dhcp command.
When you enable debugging, it is enabled only on the stack master. To enable debugging on a stack member, you can start a session from the stack master by using the session switch-number privileged EXEC command. Then enter the debug command at the command-line prompt of the stack member. You also can use the remote command stack-member-number LINE privileged EXEC command on the stack master switch to enable debugging on a member switch without first starting a session.
Related Commands
all (Optional) Display all DHCP debug messages.
error (Optional) Display DHCP error debug messages.
event (Optional) Display DHCP event debug messages.
packet (Optional) Display DHCP packet-related debug messages.
rpc (Optional) Display DHCP remote procedure call (RPC) request debug messages.
Release Modification
12.1(19)EA1 This command was introduced.
Command Description
show ip dhcp snooping Displays the DHCP snooping configuration.
show ip dhcp snooping binding
Displays the DHCP snooping binding information.
show debugging Displays information about the types of debugging that are enabled.
B-48Catalyst 3750 Switch Command Reference
OL-8552-08
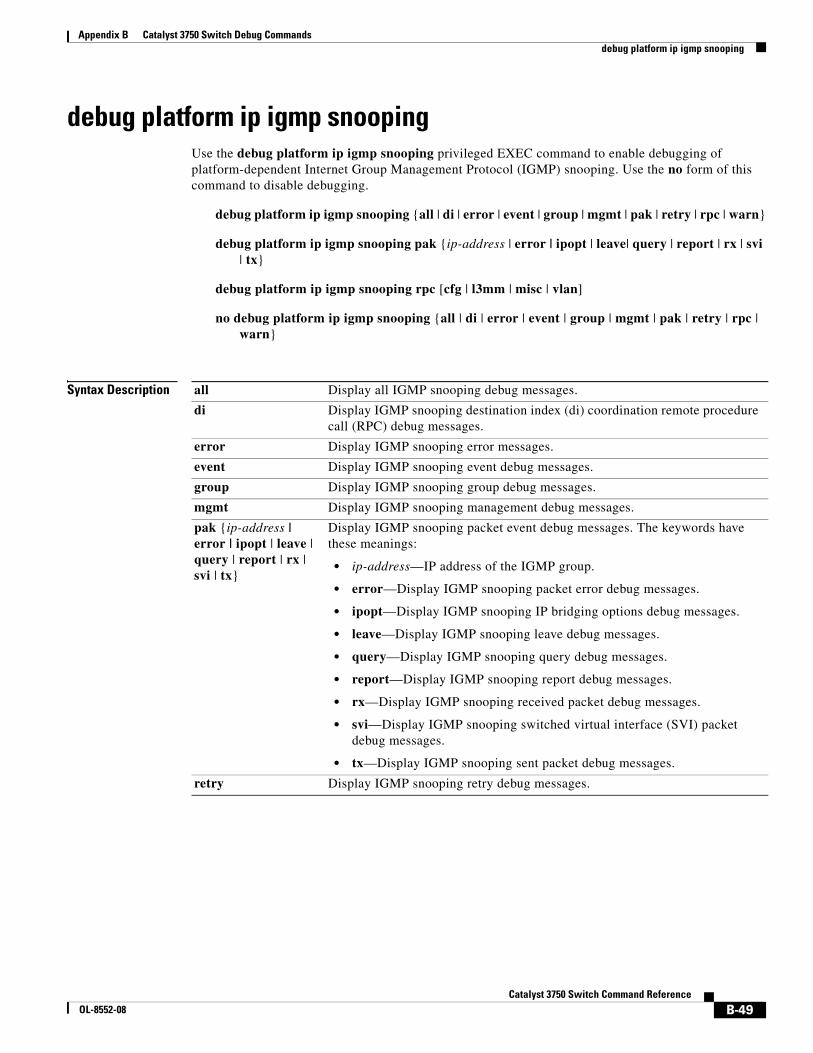
Appendix B Catalyst 3750 Switch Debug Commandsdebug platform ip igmp snooping
debug platform ip igmp snoopingUse the debug platform ip igmp snooping privileged EXEC command to enable debugging of platform-dependent Internet Group Management Protocol (IGMP) snooping. Use the no form of this command to disable debugging.
debug platform ip igmp snooping {all | di | error | event | group | mgmt | pak | retry | rpc | warn}
debug platform ip igmp snooping pak {ip-address | error | ipopt | leave| query | report | rx | svi | tx}
debug platform ip igmp snooping rpc [cfg | l3mm | misc | vlan]
no debug platform ip igmp snooping {all | di | error | event | group | mgmt | pak | retry | rpc | warn}
Syntax Description all Display all IGMP snooping debug messages.
di Display IGMP snooping destination index (di) coordination remote procedure call (RPC) debug messages.
error Display IGMP snooping error messages.
event Display IGMP snooping event debug messages.
group Display IGMP snooping group debug messages.
mgmt Display IGMP snooping management debug messages.
pak {ip-address | error | ipopt | leave | query | report | rx | svi | tx}
Display IGMP snooping packet event debug messages. The keywords have these meanings:
• ip-address—IP address of the IGMP group.
• error—Display IGMP snooping packet error debug messages.
• ipopt—Display IGMP snooping IP bridging options debug messages.
• leave—Display IGMP snooping leave debug messages.
• query—Display IGMP snooping query debug messages.
• report—Display IGMP snooping report debug messages.
• rx—Display IGMP snooping received packet debug messages.
• svi—Display IGMP snooping switched virtual interface (SVI) packet debug messages.
• tx—Display IGMP snooping sent packet debug messages.
retry Display IGMP snooping retry debug messages.
B-49Catalyst 3750 Switch Command Reference
OL-8552-08
Appendix B Catalyst 3750 Switch Debug Commandsdebug platform ip igmp snooping
Defaults Debugging is disabled.
Command Modes Privileged EXEC
Command History
Usage Guidelines The undebug platform ip igmp snooping command is the same as the no debug platform ip igmp snooping command.
When you enable debugging, it is enabled only on the stack master. To enable debugging on a stack member, you can start a session from the stack master by using the session switch-number privileged EXEC command. Then enter the debug command at the command-line prompt of the stack member. You also can use the remote command stack-member-number LINE privileged EXEC command on the stack master switch to enable debugging on a member switch without first starting a session.
Related Commands
rpc [cfg | l3mm | misc | vlan]
Display IGMP snooping remote procedure call (RPC) event debug messages. The keywords have these meanings:
• cfg—(Optional) Display IGMP snooping RPC debug messages.
• l3mm—(Optional) IGMP snooping Layer 3 multicast router group RPC debug messages.
• misc—(Optional) IGMP snooping miscellaneous RPC debug messages.
• vlan—(Optional) IGMP snooping VLAN assert RPC debug messages.
warn Display IGMP snooping warning messages.
Release Modification
12.1(11)AX This command was introduced.
Command Description
debug ip igmp snooping
Displays information about platform-independent IGMP snooping activity.
show debugging Displays information about the types of debugging that are enabled.
B-50Catalyst 3750 Switch Command Reference
OL-8552-08
Appendix B Catalyst 3750 Switch Debug Commandsdebug platform ip multicast
debug platform ip multicastUse the debug platform ip multicast privileged EXEC command to enable debugging of IP multicast routing. Use the no form of this command to disable debugging.
debug platform ip multicast {all | mdb | mdfs-rp-retry | midb | mroute-rp | resources | retry | rpf-throttle | snoop-events | software-forward | swidb-events | vlan-locks}
no debug platform ip multicast {all | mdb | mdfs-rp-retry | midb | mroute-rp | resources | retry | rpf-throttle | snoop-events | software-forward | swidb-events | vlan-locks}
Syntax Description
Defaults Debugging is disabled.
Command Modes Privileged EXEC
Command History
all Display all platform IP-multicast event debug messages.
Note Using this command can degrade the performance of the switch.
mdb Display IP-multicast debug messages for multicast distributed fast switching (MDFS) multicast descriptor block (mdb) events.
mdfs-rp-retry Display IP-multicast MDFS rendezvous point (RP) retry event debug messages.
midb Display IP-multicast MDFS multicast interface descriptor block (MIDB) debug messages.
mroute-rp Display IP-multicast RP event debug messages.
resources Display IP-multicast hardware resource debug messages.
retry Display IP-multicast retry processing event debug messages.
rpf-throttle Display IP-multicast reverse path forwarding (RPF) throttle event debug messages.
snoop-events Display IP-multicast IGMP snooping event debug messages.
software-forward Display IP-multicast software forwarding event debug messages.
swidb-events Display IP-multicast MDFS software interface descriptor block (swidb) or global event debug messages.
vlan-locks Display IP-multicast VLAN lock and unlock event debug messages.
Release Modification
12.1(11)AX This command was introduced.
B-51Catalyst 3750 Switch Command Reference
OL-8552-08
Appendix B Catalyst 3750 Switch Debug Commandsdebug platform ip multicast
Usage Guidelines The undebug platform ip multicast command is the same as the no debug platform ip multicast command.
When you enable debugging, it is enabled only on the stack master. To enable debugging on a stack member, you can start a session from the stack master by using the session switch-number privileged EXEC command. Then enter the debug command at the command-line prompt of the stack member. You also can use the remote command stack-member-number LINE privileged EXEC command on the stack master switch to enable debugging on a member switch without first starting a session.
Related Commands Command Description
show debugging Displays information about the types of debugging that are enabled.
B-52Catalyst 3750 Switch Command Reference
OL-8552-08
Appendix B Catalyst 3750 Switch Debug Commandsdebug platform ip source-guard
debug platform ip source-guardUse the debug platform ip source-guard privileged EXEC command to debug IP source guard events. Use the no form of this command to disable debugging.
debug platform ip source-guard {all | error | event}
no debug platform ip source-guard {all | error | event }
Syntax Description
Defaults Debugging is disabled.
Command Modes Privileged EXEC
Command History
Usage Guidelines The undebug platform ip source-guard command is the same as the no debug platform ip source-guard command.
Related Commands
all Display all IP source-guard platform debug messages.
error Display IP source-guard platform error debug messages.
event Display IP source-guard platform event debug messages.
Release Modification
12.2(50)SE This command was introduced.
Command Description
show ip verify source Displays the IP source guard configuration.
show debugging Displays information about the types of debugging that are enabled.
B-53Catalyst 3750 Switch Command Reference
OL-8552-08
Appendix B Catalyst 3750 Switch Debug Commandsdebug platform ip unicast
debug platform ip unicastUse the debug platform ip unicast privileged EXEC command to enable debugging of platform-dependent IP unicast routing. Use the no form of this command to disable debugging.
debug platform ip unicast {adjacency | all | arp | dhcp | errors | events | interface | mpath | registries | retry | route | rpc | standby | statistics}
no debug platform ip unicast {adjacency | all | arp | dhcp | errors | events | interface | mpath | registries | retry | route | rpc | standby | statistics}
Syntax Description
Defaults Debugging is disabled.
Command Modes Privileged EXEC
Command History
adjacency Display IP unicast routing adjacency programming event debug messages.
all Display all platform IP unicast routing debug messages.
Note Using this command can degrade the performance of the switch.
arp Display IP unicast routing Address Resolution Protocol (ARP) and ARP throttling debug messages.
dhcp Display IP unicast routing DHCP dynamic address-related event debug messages.
errors Display all IP unicast routing error debug messages, including resource allocation failures.
events Display all IP unicast routing event debug messages, including registry and miscellaneous events.
interface Display IP unicast routing interface event debug messages.
mpath Display IP unicast routing multi-path adjacency programming event debug messages (present when performing equal or unequal cost routing).
registries Display IP unicast routing forwarding information database (FIB), adjacency add, update, and delete registry event debug messages.
retry Display IP unicast routing reprogram FIBs with ternary content addressable memory (TCAM) allocation failure debug messages.
route Display IP unicast routing FIB TCAM programming event debug messages.
rpc Display IP unicast routing Layer 3 unicast remote procedure call (RPC) interaction debug messages.
standby Display IP unicast routing standby event debug messages, helpful in troubleshooting Hot Standby Routing Protocol (HSRP) issues.
statistics Display IP unicast routing statistics gathering-related event debug messages.
Release Modification
12.1(11)AX This command was introduced.
B-54Catalyst 3750 Switch Command Reference
OL-8552-08
Appendix B Catalyst 3750 Switch Debug Commandsdebug platform ip unicast
Usage Guidelines The undebug platform ip unicast command is the same as the no debug platform ip unicast command.
When you enable debugging, it is enabled only on the stack master. To enable debugging on a stack member, you can start a session from the stack master by using the session switch-number privileged EXEC command. Then enter the debug command at the command-line prompt of the stack member. You also can use the remote command stack-member-number LINE privileged EXEC command on the stack master switch to enable debugging on a member switch without first starting a session.
Related Commands Command Description
show debugging Displays information about the types of debugging that are enabled.
B-55Catalyst 3750 Switch Command Reference
OL-8552-08
Appendix B Catalyst 3750 Switch Debug Commandsdebug platform ip wccp
debug platform ip wccpUse the debug platform ip wccp privileged EXEC command to enable debugging of Web Cache Communication Protocol (WCCP). Use the no form of this command to disable debugging.
debug platform ip wccp {acl | event | odm | trace}
no debug platform ip wccp {acl | event | odm | trace}
Note This command is available only if your switch is running the IP services image.
Syntax Description
Defaults Debugging is disabled.
Command Modes Privileged EXEC
Command History
Usage Guidelines The undebug platform ip wccp command is the same as the no debug platform ip wccp command.
When you enable debugging, it is enabled only on the stack master. To enable debugging on a stack member, you can start a session from the stack master by using the session switch-number privileged EXEC command. Then enter the debug command at the command-line prompt of the stack member. You also can use the remote command stack-member-number LINE privileged EXEC command on the stack master switch to enable debugging on a member switch without first starting a session.
Related Commands
acl Display WCCP access control lists (ACLs).
event Display WCCP event debug messages.
odm Display WCCP OD merge VMRs.
trace Trace WCCP execution.
Release Modification
12.2(37)SE This command was introduced.
Command Description
show debugging Displays information about the types of debugging that are enabled.
B-56Catalyst 3750 Switch Command Reference
OL-8552-08
Appendix B Catalyst 3750 Switch Debug Commandsdebug platform ipc
debug platform ipcUse the debug platform ipc privileged EXEC command to enable debugging of the platform-dependent Interprocess Communication (IPC) Protocol. Use the no form of this command to disable debugging.
debug platform ipc {all | init | receive | send | trace}
no debug platform {all | init | receive | send | trace}
Syntax Description
Defaults Debugging is disabled.
Command Modes Privileged EXEC
Command History
Usage Guidelines The undebug platform ipc command is the same as the no debug platform ipc.
When you enable debugging, it is enabled only on the stack master. To enable debugging on a stack member, you can start a session from the stack master by using the session switch-number privileged EXEC command. Then enter the debug command at the command-line prompt of the stack member. You also can use the remote command stack-member-number LINE privileged EXEC command on the stack master switch to enable debugging on a member switch without first starting a session.
Related Commands
all Display all platform IPC debug messages.
Note Using this command can degrade the performance of the switch.
init Display debug messages related to IPC initialization.
receive Display IPC traces each time an IPC packet is received by the switch.
send Display IPC traces each time an IPC packet is sent by the switch.
trace Display IPC trace debug messages, tracing the code path as the IPC functions are executed.
Release Modification
12.1(11)AX This command was introduced.
Command Description
show debugging Displays information about the types of debugging that are enabled.
B-57Catalyst 3750 Switch Command Reference
OL-8552-08
Appendix B Catalyst 3750 Switch Debug Commandsdebug platform led
debug platform ledUse the debug platform led privileged EXEC command to enable debugging of light-emitting diode (LED) actions. Use the no form of this command to disable debugging.
debug platform led {generic | signal | stack}
no debug platform led {generic | signal | stack}
Syntax Description
Defaults Debugging is disabled.
Command Modes Privileged EXEC
Command History
Usage Guidelines The undebug platform led command is the same as the no debug platform led command.
When you enable debugging, it is enabled only on the stack master. To enable debugging on a stack member, you can start a session from the stack master by using the session switch-number privileged EXEC command. Then enter the debug command at the command-line prompt of the stack member. You also can use the remote command stack-member-number LINE privileged EXEC command on the stack master switch to enable debugging on a member switch without first starting a session.
Related Commands
generic Display LED generic action debug messages.
signal Display LED signal bit map debug messages.
stack Display LED stack action debug messages.
Release Modification
12.1(11)AX This command was introduced.
Command Description
show debugging Displays information about the types of debugging that are enabled.
B-58Catalyst 3750 Switch Command Reference
OL-8552-08
Appendix B Catalyst 3750 Switch Debug Commandsdebug platform matm
debug platform matmUse the debug platform matm privileged EXEC command to enable debugging of platform-dependent MAC address management. Use the no form of this command to disable debugging.
debug platform matm {aging | all | ec-aging | errors | learning | rpc | secure-address | warnings}
no debug platform matm {aging | all | ec-aging | errors | learning | rpc | secure-address | warnings}
Syntax Description
Defaults Debugging is disabled.
Command Modes Privileged EXEC
Command History
Usage Guidelines The undebug platform matm command is the same as the no debug platform matm command.
When you enable debugging, it is enabled only on the stack master. To enable debugging on a stack member, you can start a session from the stack master by using the session switch-number privileged EXEC command. Then enter the debug command at the command-line prompt of the stack member. You also can use the remote command stack-member-number LINE privileged EXEC command on the stack master switch to enable debugging on a member switch without first starting a session.
Related Commands
aging Display MAC address aging debug messages.
all Display all platform MAC address management event debug messages.
ec-aging Display EtherChannel address aging-related debug messages.
errors Display MAC address management error messages.
learning Display MAC address management address-learning debug messages.
rpc Display MAC address management remote procedure call (RPC) related debug messages.
secure-address Display MAC address management secure address learning debug messages.
warning Display MAC address management warning messages.
Release Modification
12.1(11)AX This command was introduced.
Command Description
debug matm Displays information about platform-independent MAC address management.
show debugging Displays information about the types of debugging that are enabled.
B-59Catalyst 3750 Switch Command Reference
OL-8552-08
Appendix B Catalyst 3750 Switch Debug Commandsdebug platform messaging application
debug platform messaging applicationUse the debug platform messaging application privileged EXEC command to enable debugging of application messaging activity. Use the no form of this command to disable debugging.
debug platform messaging application {all | badpak | cleanup | events | memerr | messages | stackchg | usererr}
no debug platform messaging application {all | badpak | cleanup | events | memerr | messages | stackchg | usererr}
Syntax Description
Defaults Debugging is disabled.
Command Modes Privileged EXEC
Command History
Usage Guidelines The undebug platform messaging application command is the same as the no debug platform messaging application command.
When you enable debugging, it is enabled only on the stack master. To enable debugging on a stack member, you can start a session from the stack master by using the session switch-number privileged EXEC command. Then enter the debug command at the command-line prompt of the stack member. You also can use the remote command stack-member-number LINE privileged EXEC command on the stack master switch to enable debugging on a member switch without first starting a session.
Related Commands
all Display all application-messaging debug messages.
badpak Display bad-packet debug messages.
cleanup Display clean-up debug messages.
events Display event debug messages.
memerr Display memory-error debug messages.
messages Display application-messaging debug messages.
stackchg Display stack-change debug messages.
usererr Display user-error debug messages.
Release Modification
12.1(11)AX This command was introduced.
Command Description
show debugging Displays information about the types of debugging that are enabled.
B-60Catalyst 3750 Switch Command Reference
OL-8552-08
Appendix B Catalyst 3750 Switch Debug Commandsdebug platform phy
debug platform phyUse the debug platform phy privileged EXEC command to enable debugging of PHY driver information. Use the no form of this command to disable debugging.
debug platform phy {automdix | cablediag | dual-purpose | flcd {configure | ipc | iter | trace} | flowcontrol | forced | init-seq | link-status | read | sfp | show-controller | speed | write | xenpak}
no debug platform phy {automdix | cablediag | dual-purpose | flcd {configure | ipc | iter | trace} | flowcontrol | forced | init-seq | link-status | read | sfp | show-controller | speed | write | xenpak}
Syntax Description
Defaults Debugging is disabled.
Command Modes Privileged EXEC
Command History
automdix Display PHY automatic medium-dependent interface crossover (auto-MDIX) debug messages.
cablediag Display PHY cable-diagnostic debug messages.
dual-purpose Display PHY dual-purpose event debug messages.
flcd {configure | ipc | iter | trace}
Display PHY FLCD debug messages. The keywords have these meanings:
• configure—Display PHY configure debug messages.
• ipc—Display Interprocess Communication Protocol (IPC) debug messages.
• iter—Display iter debug messages.
• trace—Display trace debug messages.
flowcontrol Display PHY flowcontrol debug messages.
forced Display PHY forced-mode debug messages.
init-seq Display PHY initialization-sequence debug messages.
link-status Display PHY link-status debug messages.
read Display PHY-read debug messages.
sfp Display PHY small form-factor pluggable (SFP) modules debug messages.
show-controller Display PHY show-controller debug messages.
speed Display PHY speed-change debug messages.
write Display PHY-write debug messages.
xenpak Display PHY XENPAK debug messages
Release Modification
12.1(11)AX This command was introduced.
12.1(14)EA1 The automdix keyword was added.
B-61Catalyst 3750 Switch Command Reference
OL-8552-08
Appendix B Catalyst 3750 Switch Debug Commandsdebug platform phy
Usage Guidelines The undebug platform phy command is the same as the no debug platform phy command.
When you enable debugging, it is enabled only on the stack master. To enable debugging on a stack member, you can start a session from the stack master by using the session switch-number privileged EXEC command. Then enter the debug command at the command-line prompt of the stack member. You also can use the remote command stack-member-number LINE privileged EXEC command on the stack master switch to enable debugging on a member switch without first starting a session.
Related Commands Command Description
show debugging Displays information about the types of debugging that are enabled.
B-62Catalyst 3750 Switch Command Reference
OL-8552-08
Appendix B Catalyst 3750 Switch Debug Commandsdebug platform pm
debug platform pmUse the debug platform pm privileged EXEC command to enable debugging of the platform-dependent port manager software module. Use the no form of this command to disable debugging.
debug platform pm {all | counters | errdisable | etherchnl | exceptions | hpm-events | idb-events | if-numbers | ios-events | link-status | platform | pm-events | pm-span | pm-vectors [detail] | rpc [general | oper-info | state | vectors | vp-events] | soutput-vectors | stack-manager | sync | vlans}
no debug platform pm {all | counters | errdisable | etherchnl | exceptions | hpm-events | idb-events | if-numbers | ios-events | link-status | platform | pm-events | pm-span | pm-vectors [detail] | rpc [general | oper-info | state | vectors | vp-events] | soutput-vectors | stack-manager | sync | vlans}
Syntax Description all Display all port-manager debug messages.
counters Display counters for remote procedure call (RPC) debug messages.
errdisable Display error-disabled related-events debug messages.
etherchnl Display EtherChannel related-events debug messages.
exceptions Display system exception debug messages.
hpm-events Display platform port-manager event debug messages.
idb-events Display interface descriptor block (IDB) related-events debug messages.
if-numbers Display interface-number translation-event debug messages.
ios-events Display Cisco IOS event debug messages.
link-status Display interface link-detection event debug messages.
platform Display port-manager function-event debug messages.
pm-events Display port manager event debug messages.
pm-span Display port manager Switched Port Analyzer (SPAN) event debug messages.
pm-vectors [detail] Display port-manager vector-related-event debug messages. The keyword has this meaning:
• detail—Display vector-function details.
rpc [general | oper-info | state | vectors | vp-events]
Display RPC related-event debug messages. The keywords have these meanings:
• general—(Optional) Display RPC general events.
• oper-info—(Optional) Display operational- and informational-related RPC messages.
• state—(Optional) Display administrative- and operational-related RPC messages.
• vectors—(Optional) Display vector-related RPC messages.
• vp-events—(Optional) Display virtual ports related-events RP messages.
soutput-vectors Display IDB output vector event debug messages.
stack-manager Display stack-manager related-events debug messages.
B-63Catalyst 3750 Switch Command Reference
OL-8552-08
Appendix B Catalyst 3750 Switch Debug Commandsdebug platform pm
Defaults Debugging is disabled.
Command Modes Privileged EXEC
Command History
Usage Guidelines The undebug platform pm command is the same as the no debug platform pm command.
When you enable debugging, it is enabled only on the stack master. To enable debugging on a stack member, you can start a session from the stack master by using the session switch-number privileged EXEC command. Then enter the debug command at the command-line prompt of the stack member. You also can use the remote command stack-member-number LINE privileged EXEC command on the stack master switch to enable debugging on a member switch without first starting a session.
Related Commands
sync Display operational synchronization and VLAN line-state event debug messages.
vlans Display VLAN creation and deletion event debug messages.
Release Modification
12.1(11)AX This command was introduced.
Command Description
show debugging Displays information about the types of debugging that are enabled.
B-64Catalyst 3750 Switch Command Reference
OL-8552-08
Appendix B Catalyst 3750 Switch Debug Commandsdebug platform port-asic
debug platform port-asicUse the debug platform port-asic privileged EXEC command to enable debugging of the port application-specific integrated circuit (ASIC) driver. Use the no form of this command to disable debugging.
debug platform port-asic {interrupt | periodic | read | stack | write}
no debug platform port-asic {interrupt | periodic | read | stack | write}
Syntax Description
Defaults Debugging is disabled.
Command Modes Privileged EXEC
Command History
Usage Guidelines The undebug platform port-asic command is the same as the no debug platform port-asic command.
When you enable debugging, it is enabled only on the stack master. To enable debugging on a stack member, you can start a session from the stack master by using the session switch-number privileged EXEC command. Then enter the debug command at the command-line prompt of the stack member. You also can use the remote command stack-member-number LINE privileged EXEC command on the stack master switch to enable debugging on a member switch without first starting a session.
Related Commands
interrupt Display port-ASIC interrupt-related function debug messages.
periodic Display port-ASIC periodic-function-call debug messages.
read Display port-ASIC read debug messages.
stack Display stacking-related function debug messages.
write Display port-ASIC write debug messages.
Release Modification
12.1(11)AX This command was introduced.
Command Description
show debugging Displays information about the types of debugging that are enabled.
B-65Catalyst 3750 Switch Command Reference
OL-8552-08
Appendix B Catalyst 3750 Switch Debug Commandsdebug platform port-security
debug platform port-securityUse the debug platform port-security privileged EXEC command to enable debugging of platform-dependent port-security information. Use the no form of this command to disable debugging.
debug platform port-security {add | aging | all | delete | errors | rpc | warnings}
no debug platform port-security {add | aging | all | delete | errors | rpc | warnings}
Syntax Description
Defaults Debugging is disabled.
Command Modes Privileged EXEC
Command History
Usage Guidelines The undebug platform port-security command is the same as the no debug platform port-security command.
When you enable debugging, it is enabled only on the stack master. To enable debugging on a stack member, you can start a session from the stack master by using the session switch-number privileged EXEC command. Then enter the debug command at the command-line prompt of the stack member. You also can use the remote command stack-member-number LINE privileged EXEC command on the stack master switch to enable debugging on a member switch without first starting a session.
Related Commands
add Display secure address addition debug messages.
aging Display secure address aging debug messages.
all Display all port-security debug messages.
delete Display secure address deletion debug messages.
errors Display port-security error debug messages.
rpc Display remote procedure call (RPC) debug messages.
warnings Display warning debug messages.
Release Modification
12.1(11)AX This command was introduced.
Command Description
show debugging Displays information about the types of debugging that are enabled.
B-66Catalyst 3750 Switch Command Reference
OL-8552-08
Appendix B Catalyst 3750 Switch Debug Commandsdebug platform qos-acl-tcam
debug platform qos-acl-tcamUse the debug platform qos-acl-tcam privileged EXEC command to enable debugging of the quality of service (QoS) and access control list (ACL) ternary content addressable memory (TCAM) manager software. Use the no form of this command to disable debugging.
debug platform qos-acl-tcam {all | ctcam | errors | labels | mask | rpc | tcam}
no debug platform qos-acl-tcam {all | ctcam | errors | labels | mask | rpc | tcam}
Syntax Description
Defaults Debugging is disabled.
Command Modes Privileged EXEC
Command History
Usage Guidelines The undebug platform qos-acl-tcam command is the same as the no debug platform qos-acl-tcam command.
When you enable debugging, it is enabled only on the stack master. To enable debugging on a stack member, you can start a session from the stack master by using the session switch-number privileged EXEC command. Then enter the debug command at the command-line prompt of the stack member. You also can use the remote command stack-member-number LINE privileged EXEC command on the stack master switch to enable debugging on a member switch without first starting a session.
Related Commands
all Display all QoS and ACL TCAM (QATM) manager debug messages.
ctcam Display Cisco TCAM (CTCAM) related-events debug messages.
errors Display QATM error-related-events debug messages.
labels Display QATM label-related-events debug messages.
mask Display QATM mask-related-events debug messages.
rpc Display QATM remote procedure call (RPC) related-events debug messages.
tcam Display QATM TCAM-related events debug messages.
Release Modification
12.1(11)AX This command was introduced.
Command Description
show debugging Displays information about the types of debugging that are enabled.
B-67Catalyst 3750 Switch Command Reference
OL-8552-08
Appendix B Catalyst 3750 Switch Debug Commandsdebug platform remote-commands
debug platform remote-commandsUse the debug platform remote-commands privileged EXEC command to enable debugging of remote commands. Use the no form of this command to disable debugging.
debug platform remote-commands
no debug platform remote-commands
Syntax Description This command has no arguments or keywords.
Defaults Debugging is disabled.
Command Modes Privileged EXEC
Command History
Usage Guidelines The undebug platform remote-commands command is the same as the no debug platform remote-commands command.
When you enable debugging, it is enabled only on the stack master. To enable debugging on a stack member, you can start a session from the stack master by using the session switch-number privileged EXEC command. Then enter the debug command at the command-line prompt of the stack member. You also can use the remote command stack-member-number LINE privileged EXEC command on the stack master switch to enable debugging on a member switch without first starting a session.
Related Commands
Release Modification
12.1(11)AX This command was introduced.
Command Description
show debugging Displays information about the types of debugging that are enabled.
B-68Catalyst 3750 Switch Command Reference
OL-8552-08
Appendix B Catalyst 3750 Switch Debug Commandsdebug platform resource-manager
debug platform resource-managerUse the debug platform resource-manager privileged EXEC command to enable debugging of the resource manager software. Use the no form of this command to disable debugging.
debug platform resource-manager {all | dm | erd | errors | madmed | sd | stats | vld}
no debug platform resource-manager {all | dm | erd | errors | madmed | sd | stats | vld}
Syntax Description
Defaults Debugging is disabled.
Command Modes Privileged EXEC
Command History
Usage Guidelines The undebug platform resource-manager command is the same as the no debug platform resource-manager command.
When you enable debugging, it is enabled only on the stack master. To enable debugging on a stack member, you can start a session from the stack master by using the session switch-number privileged EXEC command. Then enter the debug command at the command-line prompt of the stack member. You also can use the remote command stack-member-number LINE privileged EXEC command on the stack master switch to enable debugging on a member switch without first starting a session.
Related Commands
all Display all resource manager debug messages.
dm Display destination-map debug messages.
erd Display equal-cost-route descriptor-table debug messages.
errors Display error debug messages.
madmed Display the MAC address descriptor table and multi-expansion descriptor table debug messages.
sd Display the station descriptor table debug messages.
stats Display statistics debug messages.
vld Display the VLAN-list descriptor debug messages.
Release Modification
12.1(11)AX This command was introduced.
Command Description
show debugging Displays information about the types of debugging that are enabled.
B-69Catalyst 3750 Switch Command Reference
OL-8552-08
Appendix B Catalyst 3750 Switch Debug Commandsdebug platform snmp
debug platform snmpUse the debug platform snmp privileged EXEC command to enable debugging of the platform-dependent Simple Network Management Protocol (SNMP) software. Use the no form of this command to disable debugging.
debug platform snmp
no debug platform snmp
Syntax Description This command has no arguments or keywords.
Defaults Debugging is disabled.
Command Modes Privileged EXEC
Command History
Usage Guidelines The undebug platform snmp command is the same as the no debug platform snmp command.
When you enable debugging, it is enabled only on the stack master. To enable debugging on a stack member, you can start a session from the stack master by using the session switch-number privileged EXEC command. Then enter the debug command at the command-line prompt of the stack member. You also can use the remote command stack-member-number LINE privileged EXEC command on the stack master switch to enable debugging on a member switch without first starting a session.
Related Commands
Release Modification
12.1(11)AX This command was introduced.
Command Description
show debugging Displays information about the types of debugging that are enabled.
B-70Catalyst 3750 Switch Command Reference
OL-8552-08
Appendix B Catalyst 3750 Switch Debug Commandsdebug platform span
debug platform spanUse the debug platform span privileged EXEC command to enable debugging of the platform-dependent Switched Port Analyzer (SPAN) software. Use the no form of this command to disable debugging.
debug platform span
no debug platform span
Syntax Description This command has no arguments or keywords.
Defaults Debugging is disabled.
Command Modes Privileged EXEC
Command History
Usage Guidelines The undebug platform span command is the same as the no debug platform span command.
When you enable debugging, it is enabled only on the stack master. To enable debugging on a stack member, you can start a session from the stack master by using the session switch-number privileged EXEC command. Then enter the debug command at the command-line prompt of the stack member. You also can use the remote command stack-member-number LINE privileged EXEC command on the stack master switch to enable debugging on a member switch without first starting a session.
Related Commands
Release Modification
12.1(11)AX This command was introduced.
Command Description
show debugging Displays information about the types of debugging that are enabled.
B-71Catalyst 3750 Switch Command Reference
OL-8552-08
Appendix B Catalyst 3750 Switch Debug Commandsdebug platform stack-manager
debug platform stack-managerUse the debug platform stack-manager privileged EXEC command to enable debugging of the stack manager software. Use the no form of this command to disable debugging.
debug platform stack-manager {all | rpc | sdp | sim | ssm | trace}
no debug platform stack-manager {all | rpc | sdp | sim | ssm | trace}
Syntax Description
Defaults Debugging is disabled.
Command Modes Privileged EXEC
Command History
Usage Guidelines The undebug platform stack-manager command is the same as the no debug platform stack-manager command.
When you enable debugging, it is enabled only on the stack master. To enable debugging on a stack member, you can start a session from the stack master by using the session switch-number privileged EXEC command. Then enter the debug command at the command-line prompt of the stack member. You also can use the remote command stack-member-number LINE privileged EXEC command on the stack master switch to enable debugging on a member switch without first starting a session.
Related Commands
all Display all stack manager debug messages.
rpc Display stack manager remote procedure call (RPC) usage debug messages.
sdp Display the Stack Discovery Protocol (SDP) debug messages.
sim Display the stack information module debug messages.
ssm Display the stack state-machine debug messages.
trace Trace the stack manager entry and exit debug messages.
Release Modification
12.1(11)AX This command was introduced.
Command Description
show debugging Displays information about the types of debugging that are enabled.
B-72Catalyst 3750 Switch Command Reference
OL-8552-08
Appendix B Catalyst 3750 Switch Debug Commandsdebug platform supervisor-asic
debug platform supervisor-asicUse the debug platform supervisor-asic privileged EXEC command to enable debugging of the supervisor application-specific integrated circuit (ASIC). Use the no form of this command to disable debugging.
debug platform supervisor-asic {all | errors | receive | send}
no debug platform supervisor-asic {all | errors | receive | send}
Syntax Description
Defaults Debugging is disabled.
Command Modes Privileged EXEC
Command History
Usage Guidelines The undebug platform supervisor-asic command is the same as the no debug platform supervisor-asic command.
When you enable debugging, it is enabled only on the stack master. To enable debugging on a stack member, you can start a session from the stack master by using the session switch-number privileged EXEC command. Then enter the debug command at the command-line prompt of the stack member. You also can use the remote command stack-member-number LINE privileged EXEC command on the stack master switch to enable debugging on a member switch without first starting a session.
Related Commands
all Display all supervisor-ASIC event debug messages.
errors Display the supervisor-ASIC error debug messages.
receive Display the supervisor-ASIC receive debug messages.
send Display the supervisor-ASIC send debug messages.
Release Modification
12.1(11)AX This command was introduced.
Command Description
show debugging Displays information about the types of debugging that are enabled.
B-73Catalyst 3750 Switch Command Reference
OL-8552-08
Appendix B Catalyst 3750 Switch Debug Commandsdebug platform sw-bridge
debug platform sw-bridgeUse the debug platform sw-bridge privileged EXEC command to enable debugging of the software bridging function. Use the no form of this command to disable debugging.
debug platform sw-bridge {broadcast | control | multicast | packet | unicast}
no debug platform sw-bridge {broadcast | control | multicast | packet | unicast}
Syntax Description
Defaults Debugging is disabled.
Command Modes Privileged EXEC
Command History
Usage Guidelines The undebug platform sw-bridge command is the same as the no debug platform sw-bridge command.
When you enable debugging, it is enabled only on the stack master. To enable debugging on a stack member, you can start a session from the stack master by using the session switch-number privileged EXEC command. Then enter the debug command at the command-line prompt of the stack member. You also can use the remote command stack-member-number LINE privileged EXEC command on the stack master switch to enable debugging on a member switch without first starting a session.
Related Commands
broadcast Display broadcast-data debug messages.
control Display protocol-packet debug messages.
multicast Display multicast-data debug messages.
packet Display sent and received data debug messages.
unicast Display unicast-data debug messages.
Release Modification
12.1(11)AX This command was introduced.
Command Description
show debugging Displays information about the types of debugging that are enabled.
B-74Catalyst 3750 Switch Command Reference
OL-8552-08
Appendix B Catalyst 3750 Switch Debug Commandsdebug platform tcam
debug platform tcam Use the debug platform tcam privileged EXEC command to enable debugging of ternary content addressable memory (TCAM) access and lookups. Use the no form of this command to disable debugging.
debug platform tcam {log | read | search | write}
debug platform tcam log l2 {acl {input | output} | local | qos}
debug platform tcam log l3 {acl {input | output} | ipv6 {acl {input | output} | local | qos | secondary} | local | qos | secondary}
debug platform tcam read {reg | ssram | tcam}
debug platform tcam search
debug platform tcam write {forw-ram | reg | tcam}
no debug platform tcam {log | read | search | write}
no debug platform tcam log l2 {acl {input | output} | local | qos}
no debug platform tcam log l3 {acl {input | output} | ipv6 {acl {input | output} | local | qos | secondary} | local | qos | secondary}
no debug platform tcam read {reg | ssram | tcam}
no debug platform tcam search
no debug platform tcam write {forw-ram | reg | tcam}
Syntax Description log l2 {acl {input | output} | local | qos}
Display Layer 2 field-based CAM look-up type debug messages. The keywords have these meanings:
• acl {input | output}—Display input or output ACL look-up debug messages.
• local—Display local forwarding look-up debug messages.
• qos—Display classification and quality of service (QoS) look-up debug messages.
B-75Catalyst 3750 Switch Command Reference
OL-8552-08
Appendix B Catalyst 3750 Switch Debug Commandsdebug platform tcam
Defaults Debugging is disabled.
Command Modes Privileged EXEC
Command History
Usage Guidelines The undebug platform tcam command is the same as the no debug platform tcam command.
When you enable debugging, it is enabled only on the stack master. To enable debugging on a stack member, you can start a session from the stack master by using the session switch-number privileged EXEC command. Then enter the debug command at the command-line prompt of the stack member. You also can use the remote command stack-member-number LINE privileged EXEC command on the stack master switch to enable debugging on a member switch without first starting a session.
l3 {acl {input | output} | ipv6 {acl {input | output} | local | qos | secondary} | local | qos | secondary}
Display Layer 3 field-based CAM look-up type debug messages. The keywords have these meanings:
• acl {input | output}—Display input or output ACL look-up debug messages.
• ipv6 {acl {input | output} | local | qos | secondary}—Display IPv6-based look-up debug messages. Options include displaying input or output ACL look-up, local forwarding look-up, classification and QoS look-up, or secondary forwarding look-up debug messages.
• local—Display local forwarding look-up debug messages.
• qos—Display classification and quality of service (QoS) look-up debug messages.
• secondary—Display secondary forwarding look-up debug messages.
read {reg | ssram | tcam} Display TCAM-read debug messages. The keywords have these meanings:
• reg—Display TCAM-register read debug messages.
• ssram—Display synchronous static RAM (SSRAM)-read debug messages.
• tcam—Display TCAM-read debug messages.
search Display supervisor-initiated TCAM-search results debug messages.
write {forw-ram | reg | tcam}
Display TCAM-write debug messages. The keywords have these meanings:
forw-ram—Display forwarding-RAM write debug messages.
reg—Display TCAM-register write debug messages.
tcam—Display TCAM-write debug messages.
Release Modification
12.1(11)AX This command was introduced.
B-76Catalyst 3750 Switch Command Reference
OL-8552-08
Appendix B Catalyst 3750 Switch Debug Commandsdebug platform tcam
Related Commands Command Description
show debugging Displays information about the types of debugging that are enabled.
B-77Catalyst 3750 Switch Command Reference
OL-8552-08
Appendix B Catalyst 3750 Switch Debug Commandsdebug platform udld
debug platform udldUse the debug platform udld privileged EXEC command to enable debugging of the platform-dependent UniDirectional Link Detection (UDLD) software. Use the no form of this command to disable debugging.
debug platform udld [all | error | rpc {events | messages}]
no debug platform udld [all | error | rpc {events | messages}]
Syntax Description
Defaults Debugging is disabled.
Command Modes Privileged EXEC
Command History
Usage Guidelines The undebug platform udld command is the same as the no debug platform udld command.
When you enable debugging, it is enabled only on the stack master. To enable debugging on a stack member, you can start a session from the stack master by using the session switch-number privileged EXEC command. Then enter the debug command at the command-line prompt of the stack member. You also can use the remote command stack-member-number LINE privileged EXEC command on the stack master switch to enable debugging on a member switch without first starting a session.
Related Commands
all (Optional) Display all UDLD debug messages.
error (Optional) Display error condition debug messages.
rpc {events | messages} (Optional) Display UDLD remote procedure call (RPC) debug messages. The keywords have these meanings:
• events—Display UDLD RPC events.
• messages—Display UDLD RPC messages.
Release Modification
12.1(11)AX This command was introduced.
Command Description
show debugging Displays information about the types of debugging that are enabled.
B-78Catalyst 3750 Switch Command Reference
OL-8552-08
Appendix B Catalyst 3750 Switch Debug Commandsdebug platform vlan
debug platform vlanUse the debug platform vlan privileged EXEC command to enable debugging of the VLAN manager software. Use the no form of this command to disable debugging.
debug platform vlan {errors | mvid | rpc}
no debug platform vlan {errors | mvid | rpc}
Syntax Description
Defaults Debugging is disabled.
Command Modes Privileged EXEC
Command History
Usage Guidelines The undebug platform vlan command is the same as the no debug platform vlan command.
When you enable debugging, it is enabled only on the stack master. To enable debugging on a stack member, you can start a session from the stack master by using the session switch-number privileged EXEC command. Then enter the debug command at the command-line prompt of the stack member. You also can use the remote command stack-member-number LINE privileged EXEC command on the stack master switch to enable debugging on a member switch without first starting a session.
Related Commands
errors Display VLAN error debug messages.
mvid Display mapped VLAN ID allocations and free debug messages.
rpc Display remote procedure call (RPC) debug messages.
Release Modification
12.1(11)AX This command was introduced.
Command Description
show debugging Displays information about the types of debugging that are enabled.
B-79Catalyst 3750 Switch Command Reference
OL-8552-08
Appendix B Catalyst 3750 Switch Debug Commandsdebug pm
debug pmUse the debug pm privileged EXEC command to enable debugging of port manager (PM) activity. The port manager is a state machine that controls all the logical and physical interfaces. All features, such as VLANs, UniDirectional Link Detection (UDLD), and so forth, work with the port manager to provide switch functions. Use the no form of this command to disable debugging.
debug pm {all | assert | card | etherchnl | hatable | messages | port | redundancy | registry | sm | span | split | vlan | vp}
no debug pm {all | assert | card | etherchnl | hatable | messages | port | redundancy | registry | sm | span | split | vlan | vp}
Syntax Description
Note Though visible in the command-line help strings, the scp and pvlan keywords are not supported.
Defaults Debugging is disabled.
Command Modes Privileged EXEC
Command History
all Display all PM debug messages.
assert Display assert debug messages.
card Display line-card related-events debug messages.
etherchnl Display EtherChannel related-events debug messages.
hatable Display Host Access Table events debug messages.
messages Display PM debug messages.
port Display port related-events debug messages.
redundancy Display redundancy debug messages.
registry Display PM registry invocation debug messages.
sm Display state-machine related-events debug messages.
span Display spanning-tree related-events debug messages.
split Display split-processor debug messages.
vlan Display VLAN related-events debug messages.
vp Display virtual port related-events debug messages.
Release Modification
12.1(11)AX This command was introduced.
12.1(14)EA1 The hatable keyword was added.
B-80Catalyst 3750 Switch Command Reference
OL-8552-08
Appendix B Catalyst 3750 Switch Debug Commandsdebug pm
Usage Guidelines The undebug pm command is the same as the no debug pm command.
When you enable debugging, it is enabled only on the stack master. To enable debugging on a stack member, you can start a session from the stack master by using the session switch-number privileged EXEC command. Then enter the debug command at the command-line prompt of the stack member. You also can use the remote command stack-member-number LINE privileged EXEC command on the stack master switch to enable debugging on a member switch without first starting a session.
Related Commands Command Description
show debugging Displays information about the types of debugging that are enabled.
B-81Catalyst 3750 Switch Command Reference
OL-8552-08
Appendix B Catalyst 3750 Switch Debug Commandsdebug port-security
debug port-securityUse the debug port-security privileged EXEC command to enable debugging of the allocation and states of the port security subsystem. Use the no form of this command to disable debugging.
debug port-security
no debug port-security
Syntax Description This command has no arguments or keywords.
Defaults Debugging is disabled.
Command Modes Privileged EXEC
Command History
Usage Guidelines The undebug port-security command is the same as the no debug port-security command.
When you enable debugging, it is enabled only on the stack master. To enable debugging on a stack member, you can start a session from the stack master by using the session switch-number privileged EXEC command. Then enter the debug command at the command-line prompt of the stack member. You also can use the remote command stack-member-number LINE privileged EXEC command on the stack master switch to enable debugging on a member switch without first starting a session.
Related Commands
Release Modification
12.1(11)AX This command was introduced.
Command Description
show debugging Displays information about the types of debugging that are enabled.
show port-security Displays port-security settings for an interface or for the switch.
B-82Catalyst 3750 Switch Command Reference
OL-8552-08
Appendix B Catalyst 3750 Switch Debug Commandsdebug qos-manager
debug qos-managerUse the debug qos-manager privileged EXEC command to enable debugging of the quality of service (QoS) manager software. Use the no form of this command to disable debugging.
debug qos-manager {all | event | verbose}
no debug qos-manager {all | event | verbose}
Syntax Description
Defaults Debugging is disabled.
Command Modes Privileged EXEC
Command History
Usage Guidelines The undebug qos-manager command is the same as the no debug qos-manager command.
When you enable debugging, it is enabled only on the stack master. To enable debugging on a stack member, you can start a session from the stack master by using the session switch-number privileged EXEC command. Then enter the debug command at the command-line prompt of the stack member. You also can use the remote command stack-member-number LINE privileged EXEC command on the stack master switch to enable debugging on a member switch without first starting a session.
Related Commands
all Display all QoS-manager debug messages.
event Display QoS-manager related-event debug messages.
verbose Display QoS-manager detailed debug messages.
Release Modification
12.1(11)AX This command was introduced.
Command Description
show debugging Displays information about the types of debugging that are enabled.
B-83Catalyst 3750 Switch Command Reference
OL-8552-08
Appendix B Catalyst 3750 Switch Debug Commandsdebug spanning-tree
debug spanning-tree Use the debug spanning-tree privileged EXEC command to enable debugging of spanning-tree activities. Use the no form of this command to disable debugging.
debug spanning-tree {all | backbonefast | bpdu | bpdu-opt | config | csuf/csrt | etherchannel | events | exceptions | general | mstp | pvst+ | root | snmp | switch | synchronization | uplinkfast}
no debug spanning-tree {all | backbonefast | bpdu | bpdu-opt | config | csuf/csrt | etherchannel | events | exceptions | general | mstp | pvst+ | root | snmp | switch | synchronization | uplinkfast}
Syntax Description
Defaults Debugging is disabled.
Command Modes Privileged EXEC
all Display all spanning-tree debug messages.
backbonefast Display BackboneFast-event debug messages.
bpdu Display spanning-tree bridge protocol data unit (BPDU) debug messages.
bpdu-opt Display optimized BPDU handling debug messages.
config Display spanning-tree configuration change debug messages.
csuf/csrt Display cross-stack UplinkFast and cross-stack rapid transition activity debug messages.
etherchannel Display EtherChannel-support debug messages.
events Display spanning-tree topology event debug messages.
exceptions Display spanning-tree exception debug messages.
general Display general spanning-tree activity debug messages.
mstp Debug Multiple Spanning Tree Protocol events.
pvst+ Display per-VLAN spanning-tree plus (PVST+) event debug messages.
root Display spanning-tree root-event debug messages.
snmp Display spanning-tree Simple Network Management Protocol (SNMP) handling debug messages.
synchronization Display the spanning-tree synchronization event debug messages.
switch Display switch shim command debug messages. This shim is the software module that is the interface between the generic Spanning Tree Protocol (STP) code and the platform-specific code of various switch platforms.
uplinkfast Display UplinkFast-event debug messages.
B-84Catalyst 3750 Switch Command Reference
OL-8552-08
Appendix B Catalyst 3750 Switch Debug Commandsdebug spanning-tree
Command History
Usage Guidelines The undebug spanning-tree command is the same as the no debug spanning-tree command.
When you enable debugging, it is enabled only on the stack master. To enable debugging on a stack member, you can start a session from the stack master by using the session switch-number privileged EXEC command. Then enter the debug command at the command-line prompt of the stack member. You also can use the remote command stack-member-number LINE privileged EXEC command on the stack master switch to enable debugging on a member switch without first starting a session.
Related Commands
Release Modification
12.1(11)AX This command was introduced.
12.1(14)EA1 The mstp and csuf/csrt keywords were added.
Command Description
show debugging Displays information about the types of debugging that are enabled.
show spanning-tree Displays spanning-tree state information.
B-85Catalyst 3750 Switch Command Reference
OL-8552-08
Appendix B Catalyst 3750 Switch Debug Commandsdebug spanning-tree backbonefast
debug spanning-tree backbonefastUse the debug spanning-tree backbonefast privileged EXEC command to enable debugging of spanning-tree BackboneFast events. Use the no form of this command to disable debugging.
debug spanning-tree backbonefast [detail | exceptions]
no debug spanning-tree backbonefast [detail | exceptions]
Syntax Description
Defaults Debugging is disabled.
Command Modes Privileged EXEC
Command History
Usage Guidelines The undebug spanning-tree backbonefast command is the same as the no debug spanning-tree backbonefast command.
When you enable debugging, it is enabled only on the stack master. To enable debugging on a stack member, you can start a session from the stack master by using the session switch-number privileged EXEC command. Then enter the debug command at the command-line prompt of the stack member. You also can use the remote command stack-member-number LINE privileged EXEC command on the stack master switch to enable debugging on a member switch without first starting a session.
Related Commands
detail (Optional) Display detailed BackboneFast debug messages.
exceptions (Optional) Display spanning-tree BackboneFast-exception debug messages.
Release Modification
12.1(11)AX This command was introduced.
Command Description
show debugging Displays information about the types of debugging that are enabled.
show spanning-tree Displays spanning-tree state information.
B-86Catalyst 3750 Switch Command Reference
OL-8552-08
Appendix B Catalyst 3750 Switch Debug Commandsdebug spanning-tree bpdu
debug spanning-tree bpduUse the debug spanning-tree bpdu privileged EXEC command to enable debugging of sent and received spanning-tree bridge protocol data units (BPDUs). Use the no form of this command to disable debugging.
debug spanning-tree bpdu [receive | transmit]
no debug spanning-tree bpdu [receive | transmit]
Syntax Description
Defaults Debugging is disabled.
Command Modes Privileged EXEC
Command History
Usage Guidelines The undebug spanning-tree bpdu command is the same as the no debug spanning-tree bpdu command.
When you enable debugging, it is enabled only on the stack master. To enable debugging on a stack member, you can start a session from the stack master by using the session switch-number privileged EXEC command. Then enter the debug command at the command-line prompt of the stack member. You also can use the remote command stack-member-number LINE privileged EXEC command on the stack master switch to enable debugging on a member switch without first starting a session.
Related Commands
receive (Optional) Display the nonoptimized path for received BPDU debug messages.
transmit (Optional) Display the nonoptimized path for sent BPDU debug messages.
Release Modification
12.1(11)AX This command was introduced.
Command Description
show debugging Displays information about the types of debugging that are enabled.
show spanning-tree Displays spanning-tree state information.
B-87Catalyst 3750 Switch Command Reference
OL-8552-08
Appendix B Catalyst 3750 Switch Debug Commandsdebug spanning-tree bpdu-opt
debug spanning-tree bpdu-optUse the debug spanning-tree bpdu-opt privileged EXEC command to enable debugging of optimized spanning-tree bridge protocol data units (BPDUs) handling. Use the no form of this command to disable debugging.
debug spanning-tree bpdu-opt [detail | packet]
no debug spanning-tree bpdu-opt [detail | packet]
Syntax Description
Defaults Debugging is disabled.
Command Modes Privileged EXEC
Command History
Usage Guidelines The undebug spanning-tree bpdu-opt command is the same as the no debug spanning-tree bpdu-opt command.
When you enable debugging, it is enabled only on the stack master. To enable debugging on a stack member, you can start a session from the stack master by using the session switch-number privileged EXEC command. Then enter the debug command at the command-line prompt of the stack member. You also can use the remote command stack-member-number LINE privileged EXEC command on the stack master switch to enable debugging on a member switch without first starting a session.
Related Commands
detail (Optional) Display detailed optimized BPDU-handling debug messages.
packet (Optional) Display packet-level optimized BPDU-handling debug messages.
Release Modification
12.1(11)AX This command was introduced.
Command Description
show debugging Displays information about the types of debugging that are enabled.
show spanning-tree Displays spanning-tree state information.
B-88Catalyst 3750 Switch Command Reference
OL-8552-08
Appendix B Catalyst 3750 Switch Debug Commandsdebug spanning-tree mstp
debug spanning-tree mstp Use the debug spanning-tree mstp privileged EXEC command to enable debugging of the Multiple Spanning Tree Protocol (MSTP) software. Use the no form of this command to disable debugging.
debug spanning-tree mstp {all | boundary | bpdu-rx | bpdu-tx | errors | flush | init | migration | pm | proposals | region | roles | sanity_check | sync | tc | timers}
no debug spanning-tree mstp {all | boundary | bpdu-rx | bpdu-tx | errors | flush | init | migration | pm | proposals | region | roles | sanity_check | sync | tc | timers}
Syntax Description
Defaults Debugging is disabled.
Command Modes Privileged EXEC
Command History
all Enable all the debugging messages.
boundary Debug flag changes at these boundaries:
• An multiple spanning-tree (MST) region and a single spanning-tree region running Rapid Spanning Tree Protocol (RSTP)
• An MST region and a single spanning-tree region running 802.1D
• An MST region and another MST region with a different configuration
bpdu-rx Debug the received MST bridge protocol data units (BPDUs).
bpdu-tx Debug the sent MST BPDUs.
errors Debug MSTP errors.
flush Debug the port flushing mechanism.
init Debug the initialization of the MSTP data structures.
migration Debug the protocol migration state machine.
pm Debug MSTP port manager events.
proposals Debug handshake messages between the designated switch and the root switch.
region Debug the region synchronization between the switch processor (SP) and the route processor (RP).
roles Debug MSTP roles.
sanity_check Debug the received BPDU sanity check messages.
sync Debug the port synchronization events.
tc Debug topology change notification events.
timers Debug the MSTP timers for start, stop, and expire events.
Release Modification
12.1(14)EA1 This command was introduced.
B-89Catalyst 3750 Switch Command Reference
OL-8552-08
Appendix B Catalyst 3750 Switch Debug Commandsdebug spanning-tree mstp
Usage Guidelines The undebug spanning-tree mstp command is the same as the no debug spanning-tree mstp command.
When you enable debugging, it is enabled only on the stack master. To enable debugging on a stack member, you can start a session from the stack master by using the session switch-number privileged EXEC command. Then enter the debug command at the command-line prompt of the stack member. You also can use the remote command stack-member-number LINE privileged EXEC command on the stack master switch to enable debugging on a member switch without first starting a session.
Related Commands Command Description
show debugging Displays information about the types of debugging that are enabled.
show spanning-tree Displays spanning-tree state information.
B-90Catalyst 3750 Switch Command Reference
OL-8552-08
Appendix B Catalyst 3750 Switch Debug Commandsdebug spanning-tree switch
debug spanning-tree switchUse the debug spanning-tree switch privileged EXEC command to enable debugging of the software interface between the Spanning Tree Protocol (STP) software module and the port manager software module. Use the no form of this command to disable debugging.
debug spanning-tree switch {all | errors | flush | general | helper | pm | rx {decode | errors | interrupt | process} | state | tx [decode] | uplinkfast}
no debug spanning-tree switch {all | errors | flush | general | helper | pm | rx {decode | errors | interrupt | process} | state | tx [decode] | uplinkfast}
Syntax Description
Defaults Debugging is disabled.
Command Modes Privileged EXEC
Command History
all Display all spanning-tree switch debug messages.
errors Display debug messages for the interface between the spanning-tree software module and the port manager software module.
flush Display debug messages for the shim flush operation.
general Display general event debug messages.
helper Display spanning-tree helper-task debug messages. Helper tasks handle bulk spanning-tree updates.
pm Display port-manager event debug messages.
rx Display received bridge protocol data unit (BPDU) handling debug messages. The keywords have these meanings:
• decode—Display decoded received packets.
• errors—Display receive error debug messages.
• interrupt—Display interrupt service request (ISR) debug messages.
• process—Display process receive BPDU debug messages.
state Display spanning-tree port state change debug messages;
tx [decode] Display sent BPDU handling debug messages. The keyword has this meaning:
• decode—(Optional) Display decoded sent packets.
uplinkfast Display uplinkfast packet transmission debug messages.
Release Modification
12.1(11)AX This command was introduced.
12.1(14)EA1 The flush and uplinkfast keywords were added.
B-91Catalyst 3750 Switch Command Reference
OL-8552-08
Appendix B Catalyst 3750 Switch Debug Commandsdebug spanning-tree switch
Usage Guidelines The undebug spanning-tree switch command is the same as the no debug spanning-tree switch command.
When you enable debugging, it is enabled only on the stack master. To enable debugging on a stack member, you can start a session from the stack master by using the session switch-number privileged EXEC command. Then enter the debug command at the command-line prompt of the stack member. You also can use the remote command stack-member-number LINE privileged EXEC command on the stack master switch to enable debugging on a member switch without first starting a session.
Related Commands Command Description
show debugging Displays information about the types of debugging that are enabled.
show spanning-tree Displays spanning-tree state information.
B-92Catalyst 3750 Switch Command Reference
OL-8552-08
Appendix B Catalyst 3750 Switch Debug Commandsdebug spanning-tree uplinkfast
debug spanning-tree uplinkfastUse the debug spanning-tree uplinkfast privileged EXEC command to enable debugging of spanning-tree UplinkFast events. Use the no form of this command to disable debugging.
debug spanning-tree uplinkfast [exceptions]
no debug spanning-tree uplinkfast [exceptions]
Syntax Description
Defaults Debugging is disabled.
Command Modes Privileged EXEC
Command History
Usage Guidelines The undebug spanning-tree uplinkfast command is the same as the no debug spanning-tree uplinkfast command.
When you enable debugging, it is enabled only on the stack master. To enable debugging on a stack member, you can start a session from the stack master by using the session switch-number privileged EXEC command. Then enter the debug command at the command-line prompt of the stack member. You also can use the remote command stack-member-number LINE privileged EXEC command on the stack master switch to enable debugging on a member switch without first starting a session.
Related Commands
exceptions (Optional) Display spanning-tree UplinkFast-exception debug messages.
Release Modification
12.1(11)AX This command was introduced.
Command Description
show debugging Displays information about the types of debugging that are enabled.
show spanning-tree Displays spanning-tree state information.
B-93Catalyst 3750 Switch Command Reference
OL-8552-08
Appendix B Catalyst 3750 Switch Debug Commandsdebug sw-vlan
debug sw-vlanUse the debug sw-vlan privileged EXEC command to enable debugging of VLAN manager activities. Use the no form of this command to disable debugging.
debug sw-vlan {badpmcookies | cfg-vlan {bootup | cli} | events | ifs | management | mapping | notification | packets | redundancy | registries | vtp}
no debug sw-vlan {badpmcookies | cfg-vlan {bootup | cli} | events | ifs | management | mapping | notification | packets | redundancy | registries | vtp}
Syntax Description
Defaults Debugging is disabled.
Command Modes Privileged EXEC
Command History
Usage Guidelines The undebug sw-vlan command is the same as the no debug sw-vlan command.
When you enable debugging, it is enabled only on the stack master. To enable debugging on a stack member, you can start a session from the stack master by using the session switch-number privileged EXEC command. Then enter the debug command at the command-line prompt of the stack member. You also can use the remote command stack-member-number LINE privileged EXEC command on the stack master switch to enable debugging on a member switch without first starting a session.
badpmcookies Display debug messages for VLAN manager incidents of bad port manager cookies.
cfg-vlan {bootup | cli} Display config-vlan debug messages. The keywords have these meanings:
• bootup—Display messages when the switch is booting up.
• cli—Display messages when the command-line interface (CLI) is in config-vlan mode.
events Display debug messages for VLAN manager events.
ifs See the debug sw-vlan ifs command.
management Display debug messages for VLAN manager management of internal VLANs.
mapping Display debug messages for VLAN mapping.
notification See the debug sw-vlan notification command.
packets Display debug messages for packet handling and encapsulation processes.
redundancy Display debug messages for VTP VLAN redundancy.
registries Display debug messages for VLAN manager registries.
vtp See the debug sw-vlan vtp command.
Release Modification
12.1(11)AX This command was introduced.
B-94Catalyst 3750 Switch Command Reference
OL-8552-08
Appendix B Catalyst 3750 Switch Debug Commandsdebug sw-vlan
Related Commands Command Description
show debugging Displays information about the types of debugging that are enabled.
show vlan Displays the parameters for all configured VLANs or one VLAN (if the VLAN name or ID is specified) in the administrative domain.
show vtp Displays general information about VTP management domain, status, and counters.
B-95Catalyst 3750 Switch Command Reference
OL-8552-08
Appendix B Catalyst 3750 Switch Debug Commandsdebug sw-vlan ifs
debug sw-vlan ifsUse the debug sw-vlan ifs privileged EXEC command to enable debugging of the VLAN manager IOS file system (IFS) error tests. Use the no form of this command to disable debugging.
debug sw-vlan ifs {open {read | write} | read {1 | 2 | 3 | 4} | write}
no debug sw-vlan ifs {open {read | write} | read {1 | 2 | 3 | 4} | write}
Syntax Description
Defaults Debugging is disabled.
Command Modes Privileged EXEC
Command History
Usage Guidelines The undebug sw-vlan ifs command is the same as the no debug sw-vlan ifs command.
When you enable debugging, it is enabled only on the stack master. To enable debugging on a stack member, you can start a session from the stack master by using the session switch-number privileged EXEC command. Then enter the debug command at the command-line prompt of the stack member. You also can use the remote command stack-member-number LINE privileged EXEC command on the stack master switch to enable debugging on a member switch without first starting a session.
When selecting the file read operation, Operation 1 reads the file header, which contains the header verification word and the file version number. Operation 2 reads the main body of the file, which contains most of the domain and VLAN information. Operation 3 reads type length version (TLV) descriptor structures. Operation 4 reads TLV data.
Related Commands
open {read | write} Display VLAN manager IFS file-open operation debug messages. The keywords have these meanings:
• read—Display VLAN manager IFS file-read operation debug messages.
• write—Display VLAN manager IFS file-write operation debug messages.
read {1 | 2 | 3 | 4} Display file-read operation debug messages for the specified error test (1, 2, 3, or 4).
write Display file-write operation debug messages.
Release Modification
12.1(11)AX This command was introduced.
Command Description
show debugging Displays information about the types of debugging that are enabled.
show vlan Displays the parameters for all configured VLANs or one VLAN (if the VLAN name or ID is specified) in the administrative domain.
B-96Catalyst 3750 Switch Command Reference
OL-8552-08
Appendix B Catalyst 3750 Switch Debug Commandsdebug sw-vlan notification
debug sw-vlan notificationUse the debug sw-vlan notification privileged EXEC command to enable debugging of the activation and deactivation of Inter-Link Switch (ISL) VLAN IDs. Use the no form of this command to disable debugging.
debug sw-vlan notification {accfwdchange | allowedvlancfgchange | fwdchange | linkchange | modechange | pruningcfgchange | statechange}
no debug sw-vlan notification {accfwdchange | allowedvlancfgchange | fwdchange | linkchange | modechange | pruningcfgchange | statechange}
Syntax Description
Defaults Debugging is disabled.
Command Modes Privileged EXEC
Command History
Usage Guidelines The undebug sw-vlan notification command is the same as the no debug sw-vlan notification command.
When you enable debugging, it is enabled only on the stack master. To enable debugging on a stack member, you can start a session from the stack master by using the session switch-number privileged EXEC command. Then enter the debug command at the command-line prompt of the stack member. You also can use the remote command stack-member-number LINE privileged EXEC command on the stack master switch to enable debugging on a member switch without first starting a session.
accfwdchange Display debug messages for VLAN manager notification of aggregated access interface spanning-tree forward changes.
allowedvlancfgchange Display debug messages for VLAN manager notification of changes to the allowed VLAN configuration.
fwdchange Display debug messages for VLAN manager notification of spanning-tree forwarding changes.
linkchange Display debug messages for VLAN manager notification of interface link-state changes.
modechange Display debug messages for VLAN manager notification of interface mode changes.
pruningcfgchange Display debug messages for VLAN manager notification of changes to the pruning configuration.
statechange Display debug messages for VLAN manager notification of interface state changes.
Release Modification
12.1(11)AX This command was introduced.
B-97Catalyst 3750 Switch Command Reference
OL-8552-08
Appendix B Catalyst 3750 Switch Debug Commandsdebug sw-vlan notification
Related Commands Command Description
show debugging Displays information about the types of debugging that are enabled.
show vlan Displays the parameters for all configured VLANs or one VLAN (if the VLAN name or ID is specified) in the administrative domain.
B-98Catalyst 3750 Switch Command Reference
OL-8552-08
Appendix B Catalyst 3750 Switch Debug Commandsdebug sw-vlan vtp
debug sw-vlan vtpUse the debug sw-vlan vtp privileged EXEC command to enable debugging of the VLAN Trunking Protocol (VTP) code. Use the no form of this command to disable debugging.
debug sw-vlan vtp {events | packets | pruning [packets | xmit] | redundancy | xmit}
no debug sw-vlan vtp {events | packets | pruning | redundancy | xmit}
Syntax Description
Defaults Debugging is disabled.
Command Modes Privileged EXEC
Command History
Usage Guidelines The undebug sw-vlan vtp command is the same as the no debug sw-vlan vtp command.
When you enable debugging, it is enabled only on the stack master. To enable debugging on a stack member, you can start a session from the stack master by using the session switch-number privileged EXEC command. Then enter the debug command at the command-line prompt of the stack member. You also can use the remote command stack-member-number LINE privileged EXEC command on the stack master switch to enable debugging on a member switch without first starting a session.
events Display debug messages for general-purpose logic flow and detailed VTP messages generated by the VTP_LOG_RUNTIME macro in the VTP code.
packets Display debug messages for the contents of all incoming VTP packets that have been passed into the VTP code from the IOS VTP platform-dependent layer, except for pruning packets.
pruning [packets | xmit] Display debug messages generated by the pruning segment of the VTP code. The keywords have these meanings:
• packets—(Optional) Display debug messages for the contents of all incoming VTP pruning packets that have been passed into the VTP code from the IOS VTP platform-dependent layer.
• xmit—(Optional) Display debug messages for the contents of all outgoing VTP packets that the VTP code requests the IOS VTP platform-dependent layer to send.
redundancy Display debug messages for VTP redundancy.
xmit Display debug messages for the contents of all outgoing VTP packets that the VTP code requests the IOS VTP platform-dependent layer to send, except for pruning packets.
Release Modification
12.1(11)AX This command was introduced.
B-99Catalyst 3750 Switch Command Reference
OL-8552-08
Appendix B Catalyst 3750 Switch Debug Commandsdebug sw-vlan vtp
If no further parameters are entered after the pruning keyword, VTP pruning debugging messages appear. They are generated by the VTP_PRUNING_LOG_NOTICE, VTP_PRUNING_LOG_INFO, VTP_PRUNING_LOG_DEBUG, VTP_PRUNING_LOG_ALERT, and VTP_PRUNING_LOG_WARNING macros in the VTP pruning code.
Related Commands Command Description
show debugging Displays information about the types of debugging that are enabled.
show vtp Displays general information about VTP management domain, status, and counters.
B-100Catalyst 3750 Switch Command Reference
OL-8552-08
Appendix B Catalyst 3750 Switch Debug Commandsdebug udld
debug udldUse the debug udld privileged EXEC command to enable debugging of the UniDirectional Link Detection (UDLD) feature. Use the no form of this command to disable UDLD debugging.
debug udld {events | packets | registries}
no debug udld {events | packets | registries}
Syntax Description
Defaults Debugging is disabled.
Command Modes Privileged EXEC
Command History
Usage Guidelines The undebug udld command is the same as the no debug udld command.
When you enable debugging, it is enabled only on the stack master. To enable debugging on a stack member, you can start a session from the stack master by using the session switch-number privileged EXEC command. Then enter the debug command at the command-line prompt of the stack member. You also can use the remote command stack-member-number LINE privileged EXEC command on the stack master switch to enable debugging on a member switch without first starting a session.
For debug udld events, these debugging messages appear:
• General UDLD program logic flow
• State machine state changes
• Program actions for the set and clear ErrDisable state
• Neighbor cache additions and deletions
• Processing of configuration commands
• Processing of link-up and link-down indications
events Display debug messages for UDLD process events as they occur.
packets Display debug messages for the UDLD process as it receives packets from the packet queue and tries to send them at the request of the UDLD protocol code.
registries Display debug messages for the UDLD process as it processes registry calls from the UDLD process-dependent module and other feature modules.
Release Modification
12.1(11)AX This command was introduced.
B-101Catalyst 3750 Switch Command Reference
OL-8552-08
Appendix B Catalyst 3750 Switch Debug Commandsdebug udld
For debug udld packets, these debugging messages appear:
• General packet processing program flow on receipt of an incoming packet
• Indications of the contents of the various pieces of packets received (such as type length versions [TLVs]) as they are examined by the packet reception code
• Packet transmission attempts and the outcome
For debug udld registries, these categories of debugging messages appear:
• Sub-block creation
• Fiber-port status changes
• State change indications from the port manager software
• MAC address registry calls
Related Commands Command Description
show debugging Displays information about the types of debugging that are enabled.
show udld Displays UDLD administrative and operational status for all ports or the specified port.
B-102Catalyst 3750 Switch Command Reference
OL-8552-08
Appendix B Catalyst 3750 Switch Debug Commandsdebug vqpc
debug vqpcUse the debug vqpc privileged EXEC command to enable debugging of the VLAN Query Protocol (VQP) client. Use the no form of this command to disable debugging.
debug vqpc [all | cli | events | learn | packet]
no debug vqpc [all | cli | events | learn | packet]
Syntax Description
Defaults Debugging is disabled.
Command Modes Privileged EXEC
Command History
Usage Guidelines The undebug vqpc command is the same as the no debug vqpc command.
When you enable debugging, it is enabled only on the stack master. To enable debugging on a stack member, you can start a session from the stack master by using the session switch-number privileged EXEC command. Then enter the debug command at the command-line prompt of the stack member. You also can use the remote command stack-member-number LINE privileged EXEC command on the stack master switch to enable debugging on a member switch without first starting a session.
Related Commands
all (Optional) Display all VQP client debug messages.
cli (Optional) Display the VQP client command-line interface (CLI) debug messages.
events (Optional) Display VQP client event debug messages.
learn (Optional) Display VQP client address learning debug messages.
packet (Optional) Display VQP client packet information debug messages.
Release Modification
12.1(11)AX This command was introduced.
Command Description
show debugging Displays information about the types of debugging that are enabled.
B-103Catalyst 3750 Switch Command Reference
OL-8552-08
Appendix B Catalyst 3750 Switch Debug Commandsdebug platform wireless-controller
debug platform wireless-controllerUse the debug platform wireless-controller privileged EXEC command to enable debugging of the internal wireless LAN controller on a Catalyst 3750G Integrated Wireless LAN Controller Switch. Use the no form of this command to disable debugging.
debug platform wireless-controller {all | packets | session | sm | wcp}
no debug platform wireless-controller {all | packets | session | sm | wcp}
Syntax Description
Defaults Debugging is disabled.
Command Modes Privileged EXEC
Command History
Usage Guidelines The undebug platform wireless-controller command is the same as the no debug platform wireless-controller command.
This command applies only to the Catalyst 3750G Wireless LAN Controller Switch.
When you enable debugging, it is enabled only on the stack master. To enable debugging on a stack member, you can start a session from the stack master by using the session switch-number privileged EXEC command. Then enter the debug command at the command-line prompt of the stack member. You also can use the remote command stack-member-number LINE privileged EXEC command on the stack master switch to enable debugging on a member switch without first starting a session.
Related Commands
all Display all wireless controller debug messages.
packets Display Wireless LAN Control Protocol (WCP) packet debug messages.
session Display wireless controller session debug messages.
sm Display wireless controller state machine debug messages.
wcp Display all WCP debug messages.
Release Modification
12.2(25)FZ This command was introduced.
Command Description
show debugging Displays information about the types of debugging that are enabled.
show platform wireless-controller
Displays information about the internal wireless controller.
B-104Catalyst 3750 Switch Command Reference
OL-8552-08


![[CANCERRESEARCH58.3743-3750,August15.1998 ... · [CANCERRESEARCH58.3743-3750,August15.1998] RemodelingofCollagenMatrixbyHumanTumorCellsRequiresActivationand CellSurfaceAssociationofMatrixMetalloproteinase-21](https://img.pdfslide.net/doc/110x75/5f8791d6bc201157b44247fc/cancerresearch583743-3750august151998-cancerresearch583743-3750august151998.jpg)