Embed Size (px)
Citation preview
Catastrophic Health Expenditure and Household Well-Being
Ramses H. Abul Naga and Karine Lamiraud
No. 3/09
BATH ECONOMICS RESEARCH PAPERS
Department of Economics and International Development
Catastrophic Health Expenditureand
Household Well-Being
Ramses H. Abul Naga � and Karine Lamiraud y,z
November 7, 2008
Abstract
According to the catastrophic health expenditure methodology a house-hold is in catastrophe if its health out-of-pocket budget share exceeds acritical threshold. We develop a conceptual framework for addressing threequestions in relation to this methodology, namely: 1. Can a budget sharebe informative about the sign of a change in welfare? 2. Is there a positiveassociation between a household�s poverty shortfall and its health out-of-pocket budget share? 3. Does an increase in population coverage of ahealth insurance scheme always result in a reduction of the prevalence ofcatastrophic expenditures?Keywords: Catastrophic health expenditure, welfare change, poverty,
performance of health insurance schemes.JEL codes: I1; I3:
�Department of Economics and International Development (University of Bath).yFaculty of Business and Economics, and Institute for Health Economics and Management
(Université de Lausanne).zWe wish to thank Frank Cowell, Owen O�Donnell and Eddy van Doorslaer for discussions.
We also wish to thank participants of the 6th congress of the International Health EconomicsAssociation, Copenhagen, July 2007, for useful feedback.
1. Introduction
Risk averse individuals will appeal to insurance mechanisms as a means of diversi-fying their risks. This diversi�cation of risk is important and takes on many forms,institutional and informal. In developing countries such as India, Townsend (1995)�nds that via informal mechanisms individuals are able to absorb some health re-lated risks. However, for more serious and chronic illnesses, Gertler and Gruber(2002) �nd that health shocks can have a major impact on consumption and canseverely disrupt household welfare. There is similar evidence about the e¤ect ofhealth shocks in relation to developed countries such as the United States wherehealth insurance is not mandatory. There, it has been documented (cf. Feen-berg and Skinner, 1994; Waters et al., 2004) that illness can cause householdsto reallocate substantial shares of their spending to out-of-pocket (OOP) healthexpenditures.Thus it has been proposed to ascribe to a situation where health OOP expendi-
tures exceed a critical share of the household�s total outlay the state of catastrophichealth expenditure (Xu et al 2003; Wagsta¤ and van Doorslaer 2003). There isno exact consensus about the critical threshold level. Some studies choose valuesof 5% (Berki, 1986), 10% (Waters et al., 2004) and up to 40% of non-subsistencespending (Xu et al., 2003).In this growing literature, the measurement of catastrophic health care pay-
ments appears to serve three main objectives surveyed below: (i) to identifychanges in levels of well-being, (ii) to assess the extent of poverty / low levelsof living at the household level and (iii) to assess the performance of existinghealth insurance schemes. There is empirical evidence regarding each of these is-sues, though an economic conceptual framework appears to be missing. Our aimis to try to �ll this gap in the literature, by attempting to provide satisfactoryanswers to the following three questions:1. Can a budget share be informative about the sign of a change in welfare?2. Is there a positive association between a household�s poverty shortfall and
its health out-of-pocket budget share?3. Does an increase in population coverage of a health insurance scheme always
result in a reduction of the prevalence of catastrophic expenditures?The plan of the paper is the following. Section 2 surveys the literature in
relation to the three questions stated above. The following three sections deal witheach of questions 1 to 3. The �nal section contains a summary and concludingcomments.
2
2. What does catastrophic expenditure aim to measure?
To date, we can distinguish three major purposes in relation to the measure-ment of catastrophic health expenditure. First, interest in the measurement ofcatastrophic health payments stems from the fact that in the absence of healthinsurance, high expenditures on health care can severely disrupt household livingstandards. For instance Berki (1986) states that �An expenditure for medical carebecomes �nancially catastrophic when it endangers the family�s ability to main-tain its customary standard of living�. Ideally, this change in welfare would beassessed with longitudinal data through examination of how health shocks disruptconsumption paths (Gertler and Gruber, 2002; Wagsta¤, 2007). In the absenceof longitudinal data, OOP health payments in excess of a threshold budget sharehave been used as a proxy for severe disruptions to household living standards.Regarding this point, Van Doorslaer et al. (2007) write �We focus on paymentsthat are catastrophic in the sense of severely disrupting household living stan-dards, and approximate such payments by those absorbing a large fraction ofhousehold resources�. Thus it may be argued that a catastrophic situation maybe used to capture a change in household welfare.Second, our reading of the literature suggests an implicit association between
the state of poverty and the state of health catastrophic expenditure. In the eco-nomic literature on poverty, one distinguishes an ethical approach from a levelsof living approach (Atkinson, 1987). In the former, an ethical position is usedto argue that every member of society should be entitled to a minimum level ofresources. In the levels of living approach, poverty is associated with insu¢ cientconsumption resulting in a low level of welfare. We �nd parallels to these twoapproaches in the health payments literature. In presenting the methodology onthe measurement of catastrophic expenditure, Wagsta¤ and Van Doorslaer (2003)write �The ethical position is that no one ought to spend more than a givenfraction of income on health care� 1. There are also authors who suggest thatcatastrophic health expenditures are associated with low levels of living. Refer-ring to the costs of health services, Xu et al (2003) write �However accessing theseservices can lead to individuals having to pay catastrophic proportions of theiravailable income and push many households into poverty. �More explicitly, in
1The authors also propose measures of catastrophic expenditure drawing on similar tools asin the poverty literature. This leads to �By analogy with the poverty literature, one could de�nenot just a catastrophic payment headcount but also a measure analogous to the poverty gap,which we call the catastrophic payment gap�.
3
de�ning the medical poverty trap, Whitehead et al. (2001) state that �Rises inOOP costs for public and private health-care services are driving many familiesinto poverty, and are increasing the poverty of those who are already poor.�Finally,Flores et al. (2008) examine how households �nance OOP payments (the problemof coping with health care costs) and the implications of coping strategies for themeasurement of poverty. Clearly, in order to understand the overall relation be-tween the incidence of poverty and catastrophic expenditure one needs to explore,at the micro-level, the relation between the budget share Engel curve for healthOOPs and the poverty shortfall. This is what we set out to do in Section 4 below.Catastrophic health care payments are also used to measure the performance
of prevailing health insurance schemes. The understanding is that a large fractionof individuals experiencing catastrophic health payments is associated with an in-su¢ cient coverage in relation to health insurance contracts. According to Waterset al. (2004), �One rationale for health insurance coverage is to provide �nancialprotection against catastrophic health expenditures.�By insu¢ cient coverage re-searchers most often refer to the small percentage of the population in bene�t ofany health insurance scheme (Scheil-Adlung et al., 2006). But it may also refer tothe lack of generosity of the health insurance scheme, with respect to copaymentsand the levels at which bene�ts are capped. A Mexican study (Knaul et al. 2006)concludes that the prevalence of health catastrophic expenditure is reduced by anincreased coverage of the population by health insurance schemes. Likewise a jointILO, WHO and OECD study covering three developing countries (Scheil-Adlunget al., 2006) �nds that membership in health insurance schemes contributes toreducing the probability of incurring catastrophic health expenditures. Nonethe-less this study shows that the protective e¤ect of being insured is not general: inSouth Africa it only concerns the richest quintile of the population who is ableto a¤ord more comprehensive packages (Lamiraud et al., 2005). The study ofWaters et al. (2004) also reveals that low income and the occurrence of multiplechronic conditions, alongside the lack of health insurance, increase the probabilityof catastrophic health payments. These �ndings are to be contrasted with thoseof Wagsta¤ and Lindelow (2008) who conclude that in three Chinese provinceshealth insurance increases the risk of catastrophic spending.In the sections below we develop an economic framework for addressing the
questions stated in the Introduction in relation to this literature. We begin withasking to what extent a budget share can be informative about a change in welfare.
4
3. Catastrophic expenditure: a measure of change in wel-fare?
When panel data on a household�s consumption are not available, it has beensuggested to proxy disruptions in household welfare via the use of the level ofthe budget share of health OOP expenditure. Our �rst question, formulated ingeneral terms therefore is: can a budget share be informative about the directionof a change in household welfare?We consider the following problem: by choice of quantities q1 and q2 of two
goods, a household maximizes its utility u(q1; q2)2 subject to a budget constraintp1q1 + p2q2 = m: We let � denote the Lagrange multiplier, p :
= [p1; p2]; andwe denote the consumer�s indirect utility function by v(m; p): In this conceptualframework, a change in welfare arises from either a change in household incomem; a change in one or more prices, or �nally a change in prices and income. Theliterature most often focuses on income shocks as a source of welfare disruptions,since these are household speci�c, whereas changes in prices are often perceivedto a¤ect all individuals alike.Let m0 denote the household�s base period income, and let m1 denote the
household�s current period income. Consider then an income change �m := m0�
m1 (which need not be a negative quantity). Approximating the resulting changein welfare using a �rst-order Taylor approximation, we have:
v(m0; p) ' v(m1; p) +@v
@m(m1; p) [m0 �m1] (3.1)
From the envelope theorem we have that @v@m(m1; p) = � > 0; since the marginal
utility of income is always positive. Letting �v := v(m0; p) � v(m1; p); we can
write (3.1) in a more compact fashion as
�v = ��m (3.2)
Since the marginal utility of income � is a positive quantity, we can state thefollowing preliminary result:
Lemma The change in welfare �v is always of the same sign as the changein income �m:
Let wi:= piqi=m1 denote the budget share for good i in the current period.
Our next purpose is to write (3.1) in terms of wi: We �rst use Roy�s identity towrite the marginal utility of income as :
2The results below easily generalize in the context of n > 2 goods.
5
� = �@v=@piqi
(3.3)
and since qi = wim1=pi; we have that
� = �pi@v=@piwim1
(3.4)
Replacing (3.4) in (3.2) we have that
�v = �pi@v=@piwim1
�m (3.5)
Observe that @v=@pi < 0 (the indirect utility function is decreasing in prices), sothat, as stated in the Lemma, �v > 0 if and only if �m > 0: Finally, rearrangingterms, we obtain the desired relation between the budget share wi and the welfarechange �v :
wi = �pi@v=@pim1
�m
�v(3.6)
Because �v has the same sign as �m, a high level of the budget share wi isequally compatible with a scenario where �v � 0 (for which �m � 0) and witha situation such that �v > 0 (corresponding to a �m > 0). Accordingly, theanswer to our �rst question is the following:
Proposition 1 Without additional information about the sign of the incomechange, the level of a budget share cannot be informative about the sign of thechange in welfare:
The scope therefore for identifying households who experience a severe declinein their levels of living using a budget share is limited, unless the data analyst issure that the household has experienced an income drop. Such information aboutchanges in income is however not always available in cross-section type householdsurveys. The main problem is that it is hoped to identify a change in a variable(household welfare) by means of another variable (a budget share) measured inlevels.
4. Catastrophic expenditure and poverty
We now turn to our second question, where we investigate the household levelrelation between the poverty shortfall and the budget share for health OOPs. Our
6
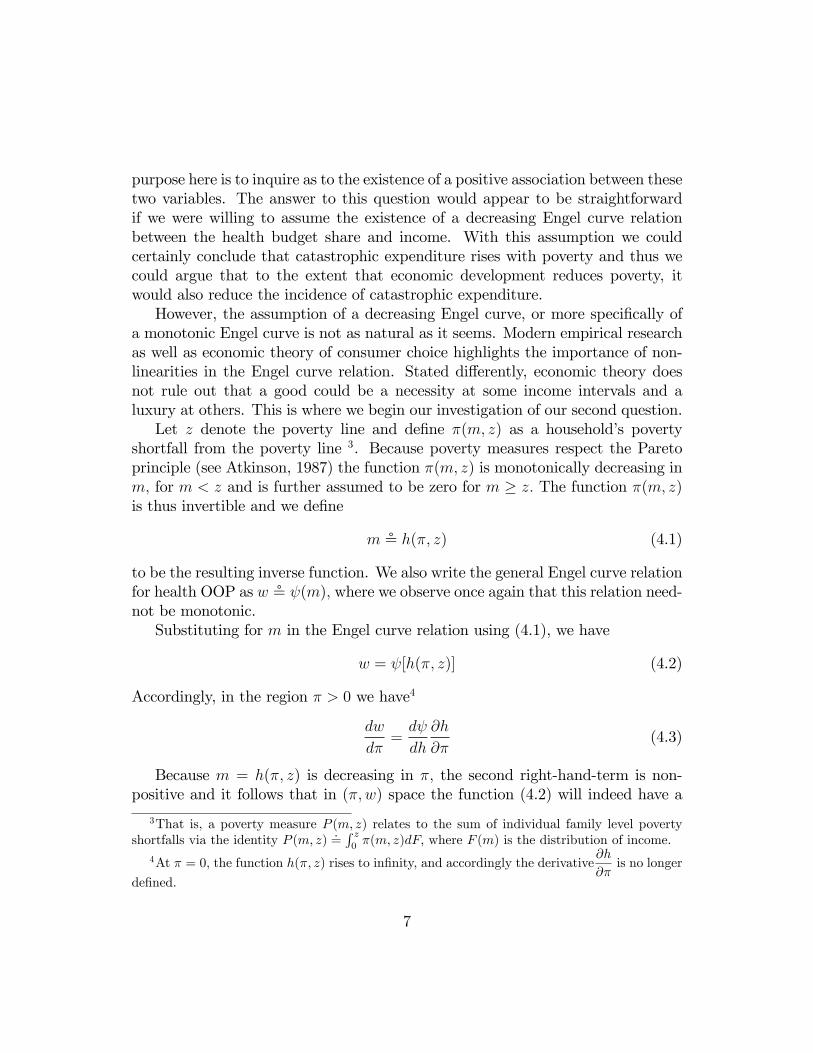
purpose here is to inquire as to the existence of a positive association between thesetwo variables. The answer to this question would appear to be straightforwardif we were willing to assume the existence of a decreasing Engel curve relationbetween the health budget share and income. With this assumption we couldcertainly conclude that catastrophic expenditure rises with poverty and thus wecould argue that to the extent that economic development reduces poverty, itwould also reduce the incidence of catastrophic expenditure.However, the assumption of a decreasing Engel curve, or more speci�cally of
a monotonic Engel curve is not as natural as it seems. Modern empirical researchas well as economic theory of consumer choice highlights the importance of non-linearities in the Engel curve relation. Stated di¤erently, economic theory doesnot rule out that a good could be a necessity at some income intervals and aluxury at others. This is where we begin our investigation of our second question.Let z denote the poverty line and de�ne �(m; z) as a household�s poverty
shortfall from the poverty line 3. Because poverty measures respect the Paretoprinciple (see Atkinson, 1987) the function �(m; z) is monotonically decreasing inm; for m < z and is further assumed to be zero for m � z: The function �(m; z)is thus invertible and we de�ne
m $ h(�; z) (4.1)
to be the resulting inverse function. We also write the general Engel curve relationfor health OOP as w $ (m); where we observe once again that this relation need-not be monotonic.Substituting for m in the Engel curve relation using (4.1), we have
w = [h(�; z)] (4.2)
Accordingly, in the region � > 0 we have4
dw
d�=d
dh
@h
@�(4.3)
Because m = h(�; z) is decreasing in �; the second right-hand-term is non-positive and it follows that in (�;w) space the function (4.2) will indeed have a
3That is, a poverty measure P (m; z) relates to the sum of individual family level povertyshortfalls via the identity P (m; z) :=
R z0�(m; z)dF; where F (m) is the distribution of income.
4At � = 0; the function h(�; z) rises to in�nity, and accordingly the derivative@h
@�is no longer
de�ned.
7
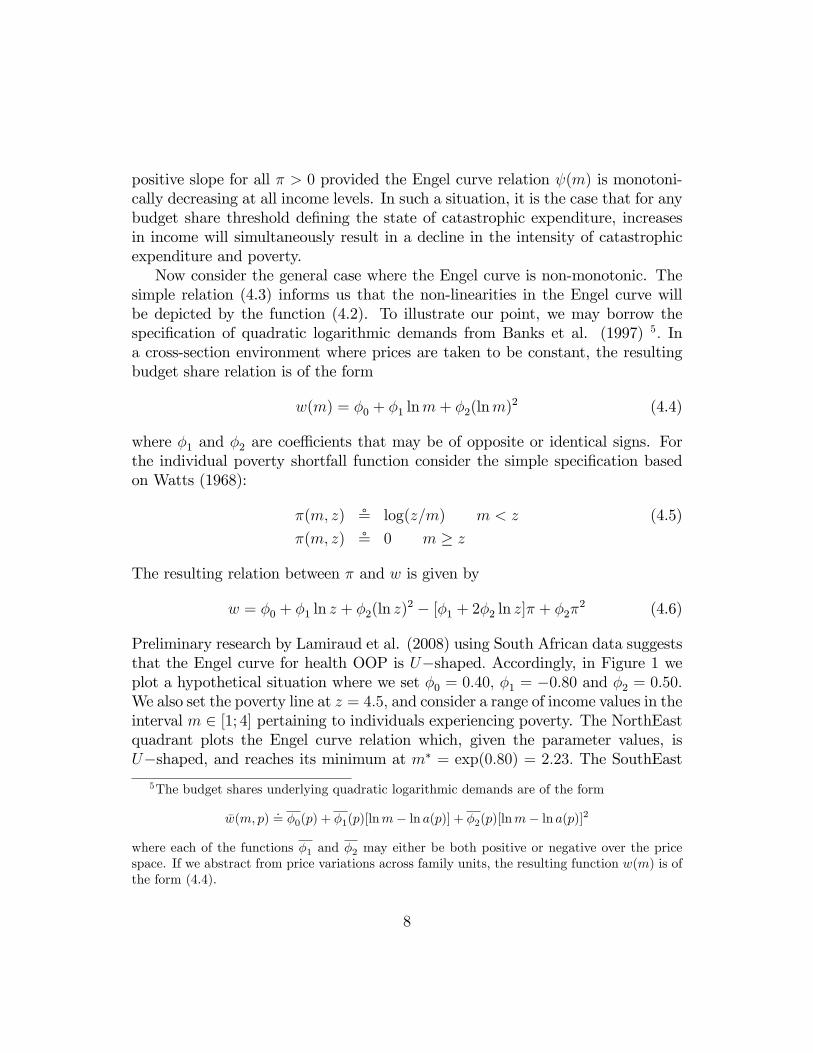
positive slope for all � > 0 provided the Engel curve relation (m) is monotoni-cally decreasing at all income levels. In such a situation, it is the case that for anybudget share threshold de�ning the state of catastrophic expenditure, increasesin income will simultaneously result in a decline in the intensity of catastrophicexpenditure and poverty.Now consider the general case where the Engel curve is non-monotonic. The
simple relation (4.3) informs us that the non-linearities in the Engel curve willbe depicted by the function (4.2). To illustrate our point, we may borrow thespeci�cation of quadratic logarithmic demands from Banks et al. (1997) 5: Ina cross-section environment where prices are taken to be constant, the resultingbudget share relation is of the form
w(m) = �0 + �1 lnm+ �2(lnm)2 (4.4)
where �1 and �2 are coe¢ cients that may be of opposite or identical signs. Forthe individual poverty shortfall function consider the simple speci�cation basedon Watts (1968):
�(m; z) $ log(z=m) m < z (4.5)
�(m; z) $ 0 m � z
The resulting relation between � and w is given by
w = �0 + �1 ln z + �2(ln z)2 � [�1 + 2�2 ln z]� + �2�
2 (4.6)
Preliminary research by Lamiraud et al. (2008) using South African data suggeststhat the Engel curve for health OOP is U�shaped: Accordingly, in Figure 1 weplot a hypothetical situation where we set �0 = 0:40; �1 = �0:80 and �2 = 0:50:We also set the poverty line at z = 4:5; and consider a range of income values in theinterval m 2 [1; 4] pertaining to individuals experiencing poverty. The NorthEastquadrant plots the Engel curve relation which, given the parameter values, isU�shaped, and reaches its minimum at m� = exp(0:80) = 2:23: The SouthEast
5The budget shares underlying quadratic logarithmic demands are of the form
�w(m; p):= �0(p) + �1(p)[lnm� ln a(p)] + �2(p)[lnm� ln a(p)]2
where each of the functions �1 and �2 may either be both positive or negative over the pricespace. If we abstract from price variations across family units, the resulting function w(m) is ofthe form (4.4).
8
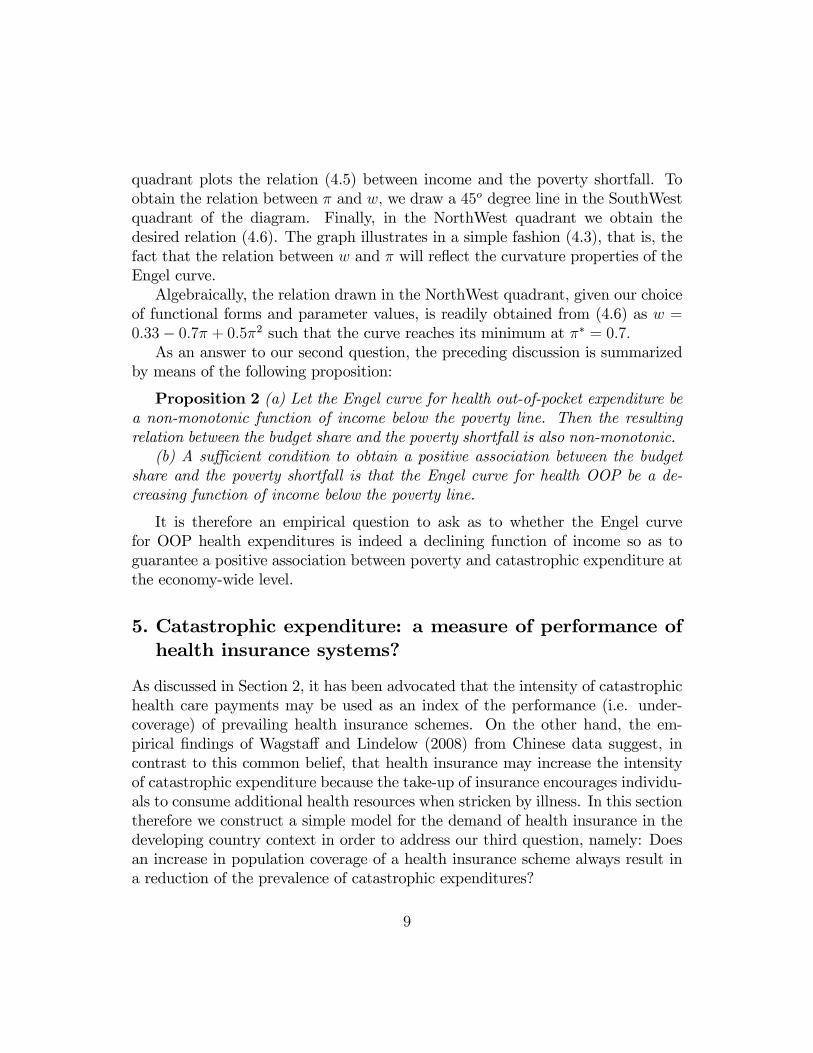
quadrant plots the relation (4.5) between income and the poverty shortfall. Toobtain the relation between � and w; we draw a 45o degree line in the SouthWestquadrant of the diagram. Finally, in the NorthWest quadrant we obtain thedesired relation (4.6). The graph illustrates in a simple fashion (4.3), that is, thefact that the relation between w and � will re�ect the curvature properties of theEngel curve.Algebraically, the relation drawn in the NorthWest quadrant, given our choice
of functional forms and parameter values, is readily obtained from (4.6) as w =0:33� 0:7� + 0:5�2 such that the curve reaches its minimum at �� = 0:7:As an answer to our second question, the preceding discussion is summarized
by means of the following proposition:
Proposition 2 (a) Let the Engel curve for health out-of-pocket expenditure bea non-monotonic function of income below the poverty line. Then the resultingrelation between the budget share and the poverty shortfall is also non-monotonic.(b) A su¢ cient condition to obtain a positive association between the budget
share and the poverty shortfall is that the Engel curve for health OOP be a de-creasing function of income below the poverty line.
It is therefore an empirical question to ask as to whether the Engel curvefor OOP health expenditures is indeed a declining function of income so as toguarantee a positive association between poverty and catastrophic expenditure atthe economy-wide level.
5. Catastrophic expenditure: a measure of performance ofhealth insurance systems?
As discussed in Section 2, it has been advocated that the intensity of catastrophichealth care payments may be used as an index of the performance (i.e. under-coverage) of prevailing health insurance schemes. On the other hand, the em-pirical �ndings of Wagsta¤ and Lindelow (2008) from Chinese data suggest, incontrast to this common belief, that health insurance may increase the intensityof catastrophic expenditure because the take-up of insurance encourages individu-als to consume additional health resources when stricken by illness. In this sectiontherefore we construct a simple model for the demand of health insurance in thedeveloping country context in order to address our third question, namely: Doesan increase in population coverage of a health insurance scheme always result ina reduction of the prevalence of catastrophic expenditures?
9
Let � be a random variable in relation to the health state of an individual.The variable � takes the value 1 with probability � when the individual falls ill,and takes the value 2 in case the individual does not fall ill. Below, we mod-ify the classic treatment of health insurance (Culyer, 1989) to take into accountseveral features of the decision to purchase health insurance in the developingcountry context. We �rstly de�ne the individual�s preferences over two goods; aconsumption aggregate denoted C and a health care aggregate good denoted H:Conditional on being in the health state �; the individual�s utility function has aquasi-linear form
u(C;H; �) = � lnC +H(2� �) (5.1)
such that health consumption is assumed to provide zero utility if the person is ingood health. Also, given the parameter > 0 the marginal utility of consumptionbecomes in�nite when C approaches zero.The speci�cation is relevant in the developing country context, since (5.1)
entails that individuals initially allocate their spending to the consumption good,and upon reaching a certain threshold, start consuming the health good. To bemore speci�c, the consumer maximizes their ex-ante expected utility
Eu(C;H; �) = �[ lnC +H] + (1� �)2 lnC
= (2� �) lnC + �H (5.2)
whereH � 0 (5.3)
The individual may subscribe to a simpli�ed health insurance scheme character-ized by a premium � and a coverage d: That is, we assume that the scheme o¤ersa capped reimbursement, in other words a 100% coverage rate for expenditurelevels up to d. Additional health expenditures above this level are however totallypaid out-of-pocket by the enrollee 6. Normalize the price of the health care good
6Note that in the context of many developing countries this assumption is quite realistic (e.g.Gertler, 1998). In South Africa for instance, in parallel with the public heath care sector thereexists a private health sector, which users access mainly via their own funds or through privatemedical insurance packages known as medical schemes. While there is a list of services thatany contract must cover, known as the Prescribed Minimum Bene�ts [PMB], medical schemesstill have di¤ering degrees of coverage on other services not covered by PMBs. For this reason,low cost options (mainly chosen by low income bene�ciaries) will not insure bene�ciaries fromcatastrophic health expenditures, to the extent made possible by more costly options. Hence,three quarters of low-cost options o¤ered by medical schemes to people with lower levels ofincome rely on monetary limits, levies and co-payments to curb the use of top-up hospitalbene�ts (Doherty and McLeod, 2002).
10
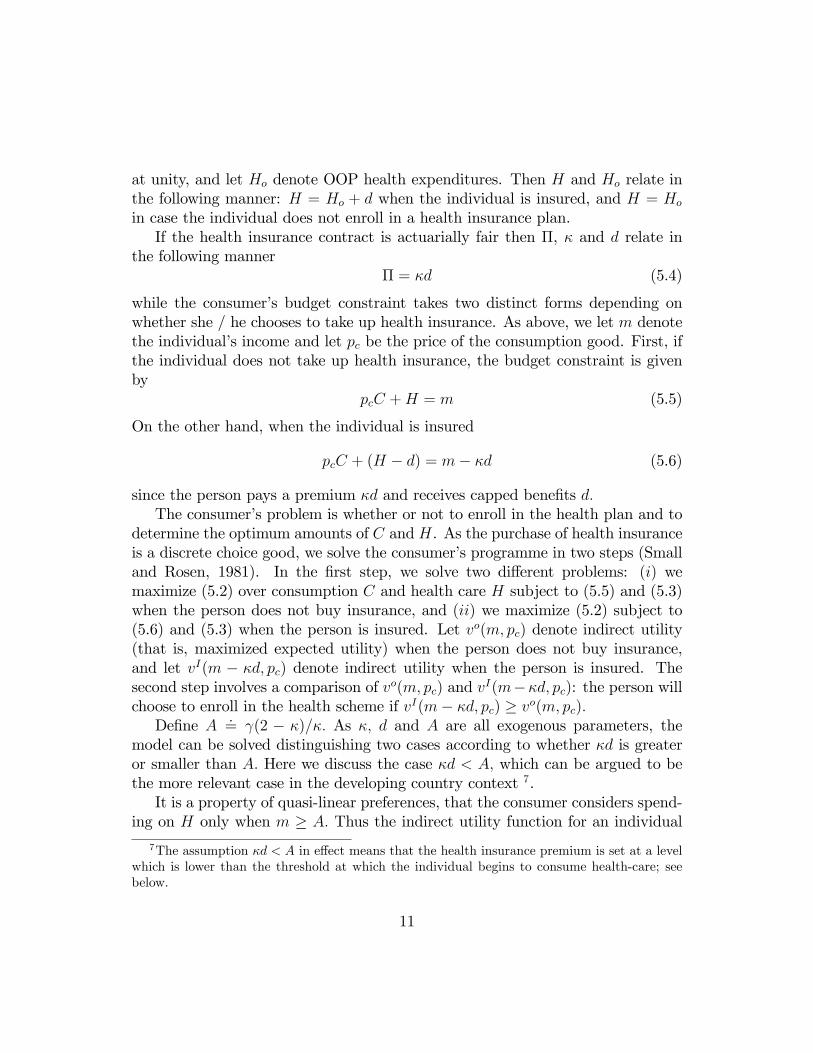
at unity, and let Ho denote OOP health expenditures. Then H and Ho relate inthe following manner: H = Ho + d when the individual is insured, and H = Ho
in case the individual does not enroll in a health insurance plan.If the health insurance contract is actuarially fair then �, � and d relate in
the following manner� = �d (5.4)
while the consumer�s budget constraint takes two distinct forms depending onwhether she / he chooses to take up health insurance. As above, we let m denotethe individual�s income and let pc be the price of the consumption good. First, ifthe individual does not take up health insurance, the budget constraint is givenby
pcC +H = m (5.5)
On the other hand, when the individual is insured
pcC + (H � d) = m� �d (5.6)
since the person pays a premium �d and receives capped bene�ts d:The consumer�s problem is whether or not to enroll in the health plan and to
determine the optimum amounts of C and H. As the purchase of health insuranceis a discrete choice good, we solve the consumer�s programme in two steps (Smalland Rosen, 1981). In the �rst step, we solve two di¤erent problems: (i) wemaximize (5.2) over consumption C and health care H subject to (5.5) and (5.3)when the person does not buy insurance, and (ii) we maximize (5.2) subject to(5.6) and (5.3) when the person is insured. Let vo(m; pc) denote indirect utility(that is, maximized expected utility) when the person does not buy insurance,and let vI(m � �d; pc) denote indirect utility when the person is insured. Thesecond step involves a comparison of vo(m; pc) and vI(m��d; pc): the person willchoose to enroll in the health scheme if vI(m� �d; pc) � vo(m; pc):De�ne A :
= (2 � �)=�: As �; d and A are all exogenous parameters, themodel can be solved distinguishing two cases according to whether �d is greateror smaller than A: Here we discuss the case �d < A; which can be argued to bethe more relevant case in the developing country context 7.It is a property of quasi-linear preferences, that the consumer considers spend-
ing on H only when m � A: Thus the indirect utility function for an individual
7The assumption �d < A in e¤ect means that the health insurance premium is set at a levelwhich is lower than the threshold at which the individual begins to consume health-care; seebelow.
11
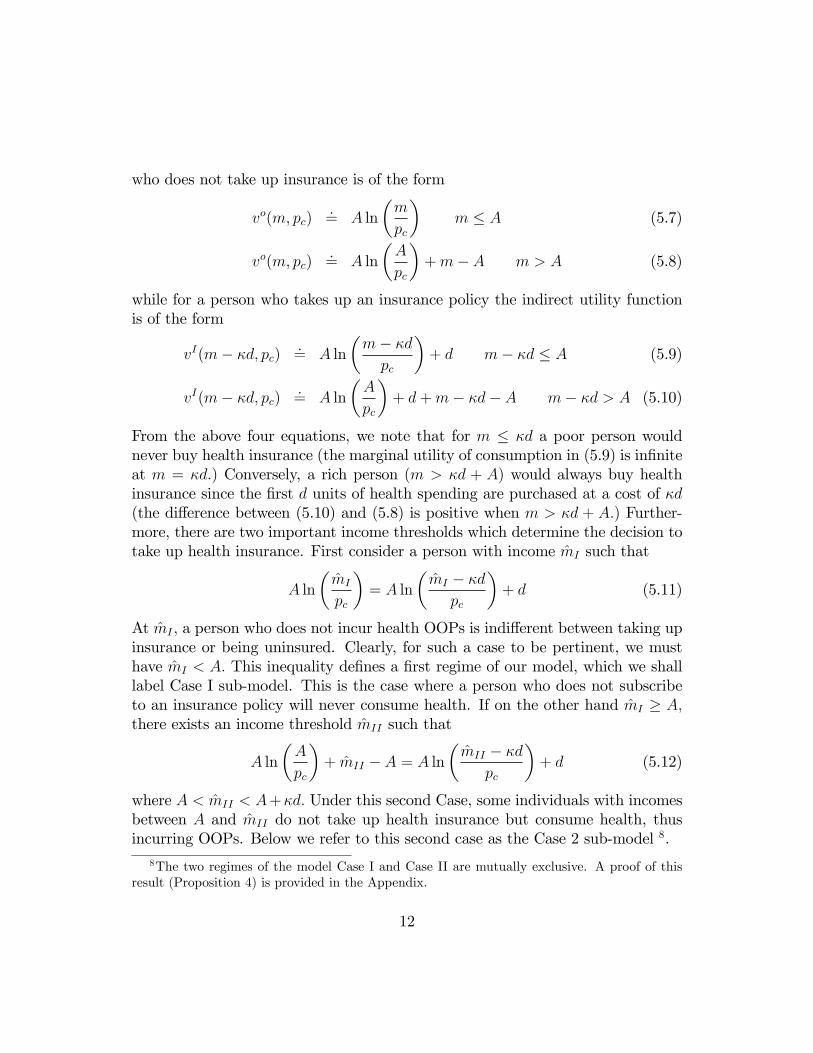
who does not take up insurance is of the form
vo(m; pc):= A ln
�m
pc
�m � A (5.7)
vo(m; pc):= A ln
�A
pc
�+m� A m > A (5.8)
while for a person who takes up an insurance policy the indirect utility functionis of the form
vI(m� �d; pc):= A ln
�m� �d
pc
�+ d m� �d � A (5.9)
vI(m� �d; pc):= A ln
�A
pc
�+ d+m� �d� A m� �d > A (5.10)
From the above four equations, we note that for m � �d a poor person wouldnever buy health insurance (the marginal utility of consumption in (5.9) is in�niteat m = �d:) Conversely, a rich person (m > �d + A) would always buy healthinsurance since the �rst d units of health spending are purchased at a cost of �d(the di¤erence between (5.10) and (5.8) is positive when m > �d + A:) Further-more, there are two important income thresholds which determine the decision totake up health insurance. First consider a person with income m̂I such that
A ln
�m̂I
pc
�= A ln
�m̂I � �d
pc
�+ d (5.11)
At m̂I ; a person who does not incur health OOPs is indi¤erent between taking upinsurance or being uninsured. Clearly, for such a case to be pertinent, we musthave m̂I < A: This inequality de�nes a �rst regime of our model, which we shalllabel Case I sub-model. This is the case where a person who does not subscribeto an insurance policy will never consume health. If on the other hand m̂I � A;there exists an income threshold m̂II such that
A ln
�A
pc
�+ m̂II � A = A ln
�m̂II � �d
pc
�+ d (5.12)
where A < m̂II < A+�d: Under this second Case, some individuals with incomesbetween A and m̂II do not take up health insurance but consume health, thusincurring OOPs. Below we refer to this second case as the Case 2 sub-model 8.
8The two regimes of the model Case I and Case II are mutually exclusive. A proof of thisresult (Proposition 4) is provided in the Appendix.
12
5.1. Case 1 sub-model
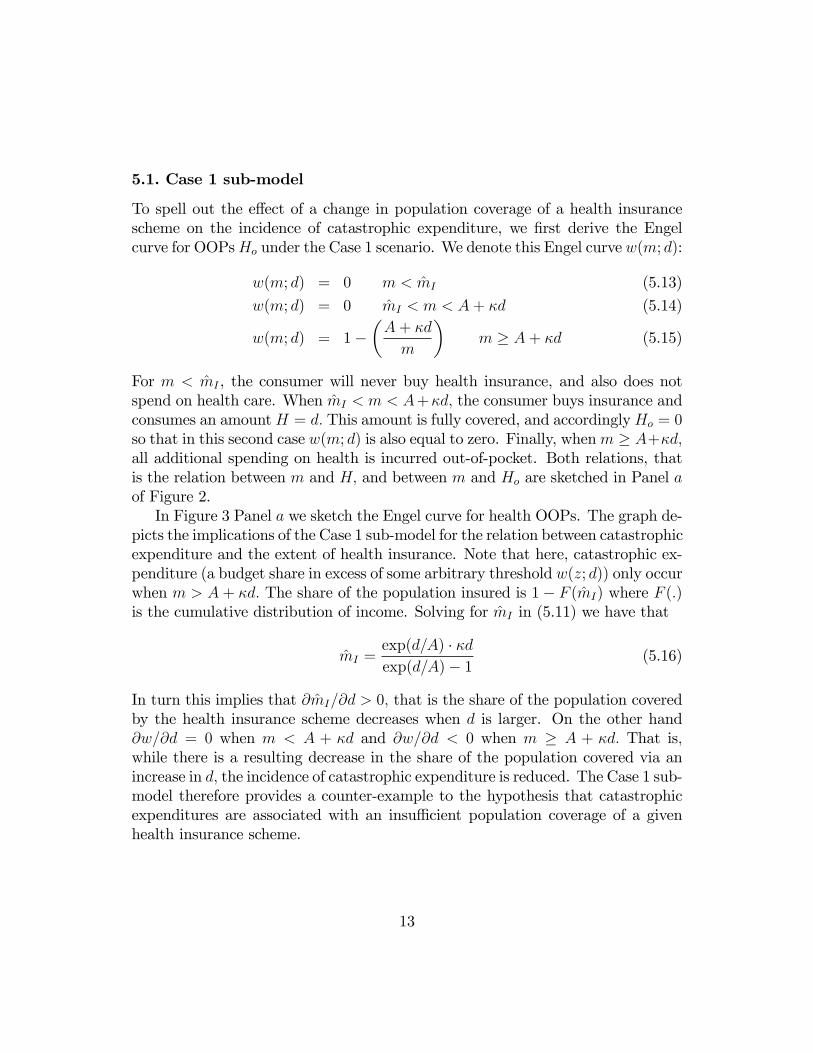
To spell out the e¤ect of a change in population coverage of a health insurancescheme on the incidence of catastrophic expenditure, we �rst derive the Engelcurve for OOPsHo under the Case 1 scenario. We denote this Engel curve w(m; d):
w(m; d) = 0 m < m̂I (5.13)
w(m; d) = 0 m̂I < m < A+ �d (5.14)
w(m; d) = 1��A+ �d
m
�m � A+ �d (5.15)
For m < m̂I , the consumer will never buy health insurance, and also does notspend on health care. When m̂I < m < A+�d; the consumer buys insurance andconsumes an amountH = d: This amount is fully covered, and accordinglyHo = 0so that in this second case w(m; d) is also equal to zero. Finally, whenm � A+�d;all additional spending on health is incurred out-of-pocket. Both relations, thatis the relation between m and H; and between m and Ho are sketched in Panel aof Figure 2.In Figure 3 Panel a we sketch the Engel curve for health OOPs. The graph de-
picts the implications of the Case 1 sub-model for the relation between catastrophicexpenditure and the extent of health insurance. Note that here, catastrophic ex-penditure (a budget share in excess of some arbitrary threshold w(z; d)) only occurwhen m > A+ �d: The share of the population insured is 1� F (m̂I) where F (:)is the cumulative distribution of income. Solving for m̂I in (5.11) we have that
m̂I =exp(d=A) � �dexp(d=A)� 1 (5.16)
In turn this implies that @m̂I=@d > 0; that is the share of the population coveredby the health insurance scheme decreases when d is larger. On the other hand@w=@d = 0 when m < A + �d and @w=@d < 0 when m � A + �d: That is;while there is a resulting decrease in the share of the population covered via anincrease in d; the incidence of catastrophic expenditure is reduced. The Case 1 sub-model therefore provides a counter-example to the hypothesis that catastrophicexpenditures are associated with an insu¢ cient population coverage of a givenhealth insurance scheme.
13
5.2. Case 2 sub-model
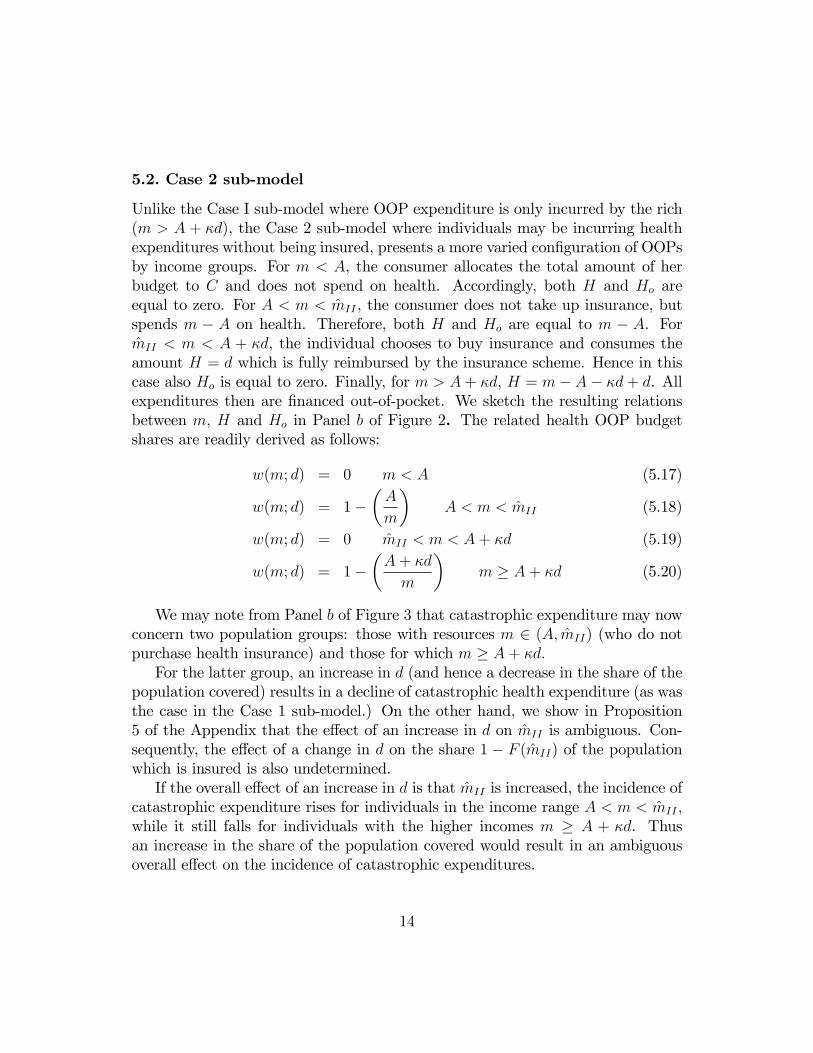
Unlike the Case I sub-model where OOP expenditure is only incurred by the rich(m > A + �d), the Case 2 sub-model where individuals may be incurring healthexpenditures without being insured, presents a more varied con�guration of OOPsby income groups. For m < A, the consumer allocates the total amount of herbudget to C and does not spend on health. Accordingly, both H and Ho areequal to zero. For A < m < m̂II , the consumer does not take up insurance, butspends m � A on health. Therefore, both H and Ho are equal to m � A. Form̂II < m < A + �d, the individual chooses to buy insurance and consumes theamount H = d which is fully reimbursed by the insurance scheme. Hence in thiscase also Ho is equal to zero. Finally, for m > A+ �d, H = m� A� �d+ d. Allexpenditures then are �nanced out-of-pocket. We sketch the resulting relationsbetween m; H and Ho in Panel b of Figure 2. The related health OOP budgetshares are readily derived as follows:
w(m; d) = 0 m < A (5.17)
w(m; d) = 1��A
m
�A < m < m̂II (5.18)
w(m; d) = 0 m̂II < m < A+ �d (5.19)
w(m; d) = 1��A+ �d
m
�m � A+ �d (5.20)
We may note from Panel b of Figure 3 that catastrophic expenditure may nowconcern two population groups: those with resources m 2 (A; m̂II) (who do notpurchase health insurance) and those for which m � A+ �d:For the latter group, an increase in d (and hence a decrease in the share of the
population covered) results in a decline of catastrophic health expenditure (as wasthe case in the Case 1 sub-model.) On the other hand, we show in Proposition5 of the Appendix that the e¤ect of an increase in d on m̂II is ambiguous. Con-sequently, the e¤ect of a change in d on the share 1 � F (m̂II) of the populationwhich is insured is also undetermined.If the overall e¤ect of an increase in d is that m̂II is increased, the incidence of
catastrophic expenditure rises for individuals in the income range A < m < m̂II ;while it still falls for individuals with the higher incomes m � A + �d. Thusan increase in the share of the population covered would result in an ambiguousoverall e¤ect on the incidence of catastrophic expenditures.
14
5.3. Change in population coverage: overall e¤ect
The Case I sub-model entails that the incidence of catastrophic expenditure isreduced when population coverage of the heath insurance scheme declines, andconversely that increased coverage increases the incidence of catastrophic expen-diture. The Case II sub-model generates catastrophic expenditures for both theinsured and uninsured populations. For this reason, there the overall e¤ect of achange in population coverage on the incidence of catastrophic expenditure is am-biguous. We may summarize our above discussion with the following Proposition:
Proposition 3 (a) Under the case I sub-model (m̂I < A), a reduction in theshare of the population insured results in a decline in the incidence of catastrophicexpenditure.(b) Under the case II sub-model (m̂I > A), a reduction in the share of the
population insured has an undetermined e¤ect on the incidence of catastrophicexpenditure.
6. Concluding comments
We may summarize our answers to the three questions raised in the paper asfollows:
1. An observed budget share level for a given good is compatible with botha drop or a rise in levels of living. Thus, without additional information aboutthe direction of income change, the level of a budget share cannot be informativeabout the sign of the change in welfare.
2. In the general case where below the poverty line the Engel curve for OOPsis a non-monotonic function of income, the resulting relation between the budgetshare and the poverty shortfall is also non-monotonic. However, if below thepoverty line the income elasticity for OOPs is smaller than one (i.e. the Engelcurve is decreasing), this will indeed entail a positive association between thepoverty shortfall and the budget share for health OOPs.
3. An increase in population coverage of a health insurance scheme need notalways result in a reduction of the prevalence of catastrophic expenditures.
In relation to our �rst question, we may conclude therefore that the scope forusing cross-section data to identify households who experience a severe declinein their levels of living using a budget share is considerably limited, unless thedata analyst is sure that the household has experienced an income drop. Such
15
information about changes in income is readily available from panel data, but israrely encountered in cross-section type household surveys.We note from our discussion in relation to the second question that we have
addressed in the paper, that it does not follow that catastrophic health expendi-ture increases with poverty. Empirical work is therefore needed in order to furtherexplore the curvature properties of the Engel curve for health care spending.Finally, with the help of a simple model, we have shown that catastrophic
expenditure could well decline when the share of the population covered by ahealth insurance scheme also falls. Thus, more work is needed in order to betterunderstand how the overall performance of a health insurance scheme relates tothe incidence of catastrophic expenditures.
7. Appendix
This appendix gathers proofs of two results stated in the paper.
Proposition 4 There exists m̂II 2 [A; A + �d] such that for any m � m̂II
the consumer always chooses to buy insurance.
Proof : De�ne m̂I by the equality
A ln
�m̂I
pc
�= A ln
�m̂I � �d
pc
�+ d
This yields m̂I =exp(d=A) � �dexp(d=A)� 1 : Now, if m̂I < A, the consumer switches to
insurance at an income level m in the interval [�d ; A], and m̂II = A. If m̂I > A,then at m = A,
A ln
�m
pc
�+m� A > A ln
�m� �d
pc
�+ d
i.e. vo (m; pc) > vI (m� �d; pc). Also, atm = �d+A, vI (m� �d; pc)�vo (m; pc) =d� �d > 0.Since the indirect utility function is continuous in m, there must exist an m̂II
in the interval [A;A+ �d] such that vo (m̂II ; pc) = vI (m̂II � �d; pc).
Proposition 5 The e¤ect of a change in d on m̂II is undetermined.
De�ne G (m̂II ; d) = A lnA + m̂II �A � A ln (m̂II � �d) � d. By de�nition,G (m̂II ; d) = 0. Let �� x denote an in�nitesimal change in x. It follows from the
16
implicit function theorem that
��m̂II
��d=
@G=@d
�@G=@m̂II
=�d+ �A� m̂II
�d+ A� m̂II
The denominator of this last ratio is positive in virtue of Proposition 5. Howeverthe numerator of the ratio has an undetermined sign. Thus, the sign of ��m̂II= ��dis undetermined.
8. References
Atkinson, A.,1987. On the Measurement of Poverty. Econometrica 55, 749-764.Banks, J., Blundell, R., Lewbel, A., 1997. Quadratic Engel Curves and Con-
sumer Demand. Review of Economics and Statistics 79, 527-539.Berki, S.E., 1986. A look at catastrophic medical expenses and the poor.
Health A¤airs 5, 139-45.Culyer A (1989): �The Normative Economics of Health Care Finance and
Provision�, Oxford Review of Economic Policy 5, 34-58.Doherty, J. & McLeod, H., 2002. Medical Schemes. South African Health
Review. Durban: Health Systems Trust.Feenberg, D., Skinner, J., 1994. The risk and duration of catastrophic health
care expenditures. The Review of Economics and Statistics 76(4), 633- 647Flores, G., Krishnakumar, J., O�Donnell O., Van Doorslaer, E., 2008. Cop-
ing with Health Care Costs: Implications for the Measurement of CatastrophicExpenditures and Poverty. Health Economics (forthcoming)Gertler, P., 1998. On the Road to Social Health Insurance: The Asian Expe-
rience. World Development 26 (4), 717-32.Gertler, P., Gruber, J., 2002. Insuring consumption against illness. American
Economic Review 92(1), 51-70.Knaul, F., Arreola-Ornelas, H., Méndez-Carniado, O., Bryson-Cahn, C., Barof-
sky, J., Maguire, R., Miranda, M., Sesma, S., 2006. Evidence is good for yourhealth system: policy reform to remedy catastrophic and impoverishing healthspending in Mexico. The Lancet 368 (9549), 1828-1841.Lamiraud, K., Booysen, F., Scheil-Adlung, X., 2005. The Impact of Social
Health Protection on Access to Health Care, Health Expenditure and Impover-ishment: A Case Study of South Africa. International Labour O¢ ce, Departmentof Social Security, Extension of Social Security No. 23.
17
Lamiraud K., R. Lalive and R. Abul Naga (2008): �Semi-parametric esti-mation of the Engel Curve for out-of-pocket Health Expenditures�, manuscript,Université de Lausanne.Scheil-Adlung, X., Lamiraud, K., Asfaw, A., Booysen, F., Reynaud, E., Juet-
ting, J., Xu, K., Carrin, G., Chatterji, S., Evans, D., James, C., Muchiri, S.,(2006): �What is the impact of social health protection on access to health care,health expenditure and impoverishment ? A comparative analysis of three Africancountries�, World Health Organization EIP/HSP/DP.06.2.Small, KA., Rosen, HS., 1981. AppliedWelfare Analysis under Discrete Choice
Models. Econometrica 49 (1), 105-130.Townsend, R.M., 1995. Consumption Insurance: an evaluation of risk-bearing
systems in low income economies.Journal of Economic Perspectives 9 (3), 83 102.Van Doorslaer, E., O�Donnell, et al., 2007. Catastrophic payments for health
care in Asia. Health Economics 16(11), 1159�1184.Wagsta¤ A., M. Lindelow, 2008. Can insurance increase �nancial risk? The
curious case of health insurance in China. Journal of Health Economics 27 990�1005.Wagsta¤, A., van Doorslaer E., 2003. Catastrophe and Impoverishment in
Paying for Health Care: With Applications Vietnam 1993-1998. Health Economics12, 921-934.Wagsta¤, A., 2007. The economic consequences of health shocks: Evidence
from Vietnam. Journal of Health Economics 26(1), 82-100.Waters, H., Anderson, G., Mays, J., 2004. Measuring �nancial protection in
health in the United States. Health Policy 69 (3), 339-349.Watts (1968): �An Economic De�nition of Poverty�, in D. Moynehan ed. On
Understanding Poverty, New York, Basic Books.Whitehead, M., Dahlgreen, G., Evans, T., 2001. Equity and heath sector
reforms: can low-income countries escape the medical poverty trap? Lancet 358(9284), 833-836.Xu, K., Evans, D.B., Kawabata, K., Zeramdini, R., Klavus, J., Murray, C.,
2003. Household Catastrophic Health Expenditure: a Multicountry Analysis.Lancet 362, 111-117.
18
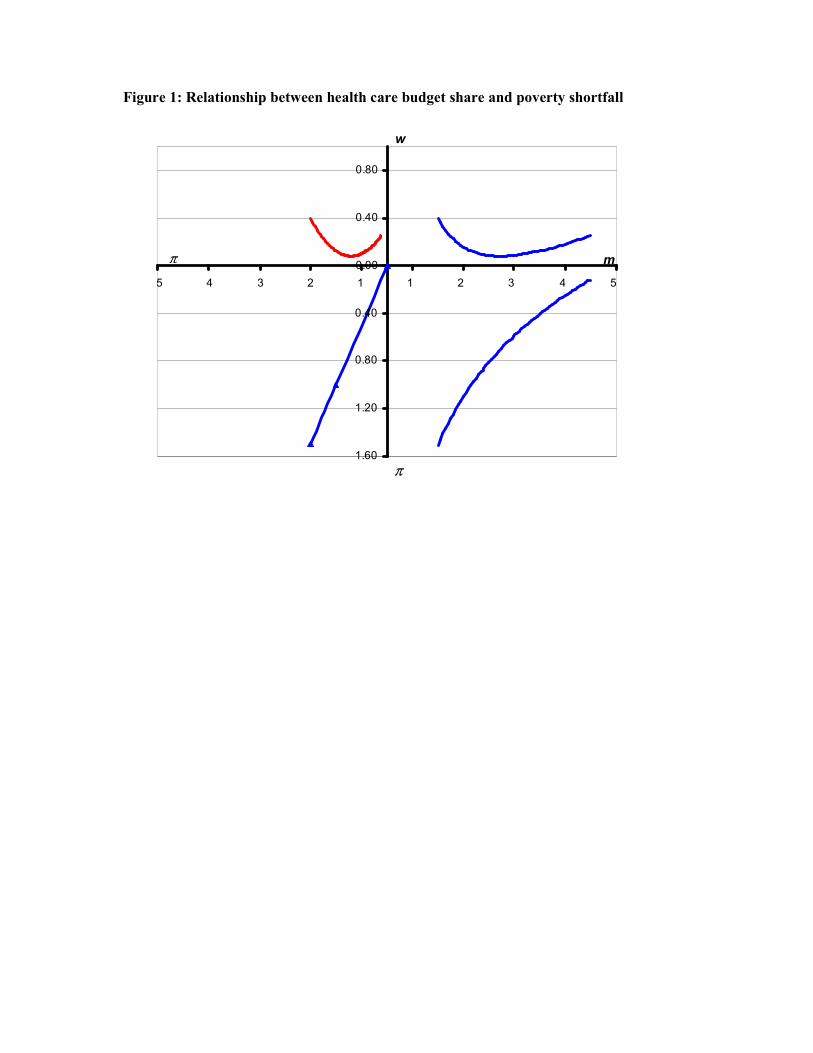
Figure 1: Relationship between health care budget share and poverty shortfall
1.60
1.20
0.80
0.40
0.00
0.40
0.80
5 4 3 2 1 1 2 3 4 5
m
w
π
π
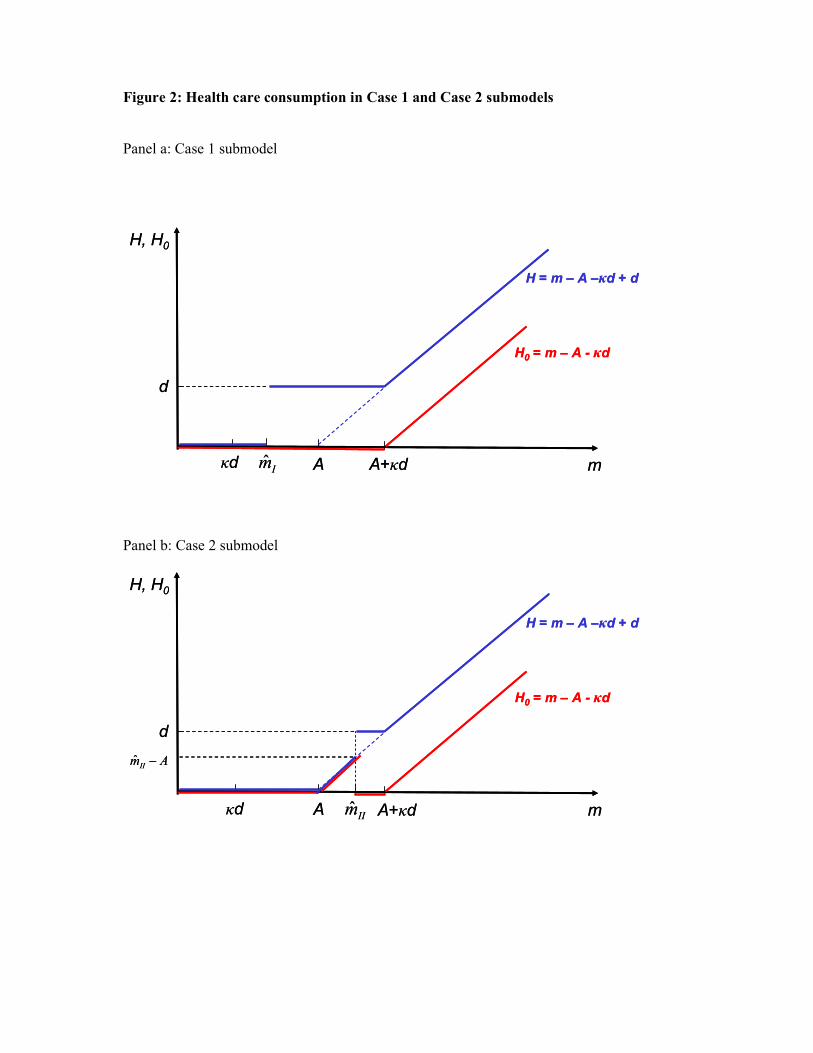
Figure 2: Health care consumption in Case 1 and Case 2 submodels
Panel a: Case 1 submodel
Panel b: Case 2 submodel
H, H0
H = m – A –κd + d
H0 = m – A - κd
A mκd A+κdIm̂
d
H, H0
H = m – A –κd + d
H0 = m – A - κd
A mκd A+κdIm̂
d
H, H0
H = m – A –κd + d
H0 = m – A - κd
A mκd A+κdIIm̂
d
AmII−ˆ
H, H0
H = m – A –κd + d
H0 = m – A - κd
A mκd A+κdIIm̂
d
AmII−ˆ
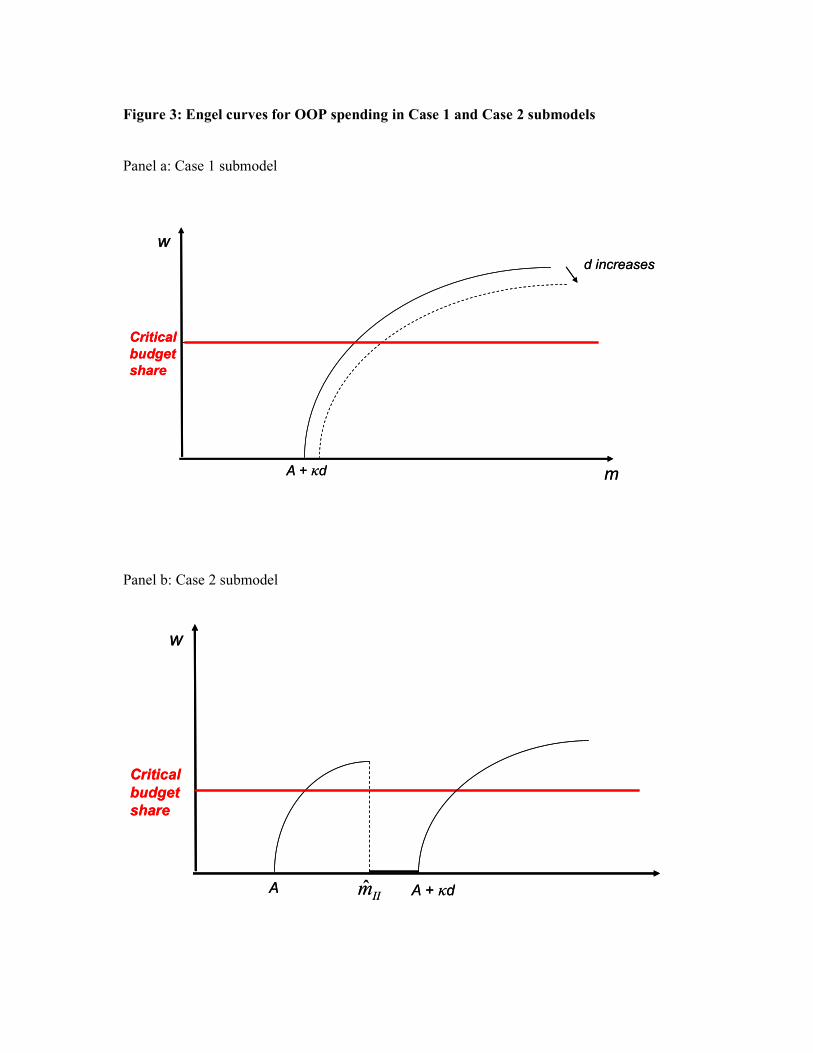
Figure 3: Engel curves for OOP spending in Case 1 and Case 2 submodels
Panel a: Case 1 submodel
Panel b: Case 2 submodel
w
mA + κd
d increases
Critical
budget
share
w
mA + κd
d increases
Critical
budget
share
w
A
Critical
budget
share
IIm̂ A + κd
w
A
Critical
budget
share
IIm̂ A + κd