Embed Size (px)
Citation preview
Ca om history and history from cats A Yd
make-up of domestic cat populations is not only a fascinating study in itself but can movements of human populations. There is a good correlation between the cat overseas cities and those of the European centres from which the original settlers
afe ktx&$ji$ Iif+ come. Thus the cat population of Mindelo, established as a major Atlantic coaling s&ion hi I& @%)s, is clearly related to the south Wales mining towns from which the steam coal came. This c&&#&on r&es the possibility of deducing the origin of settlements where the normal historical record is l&ing.
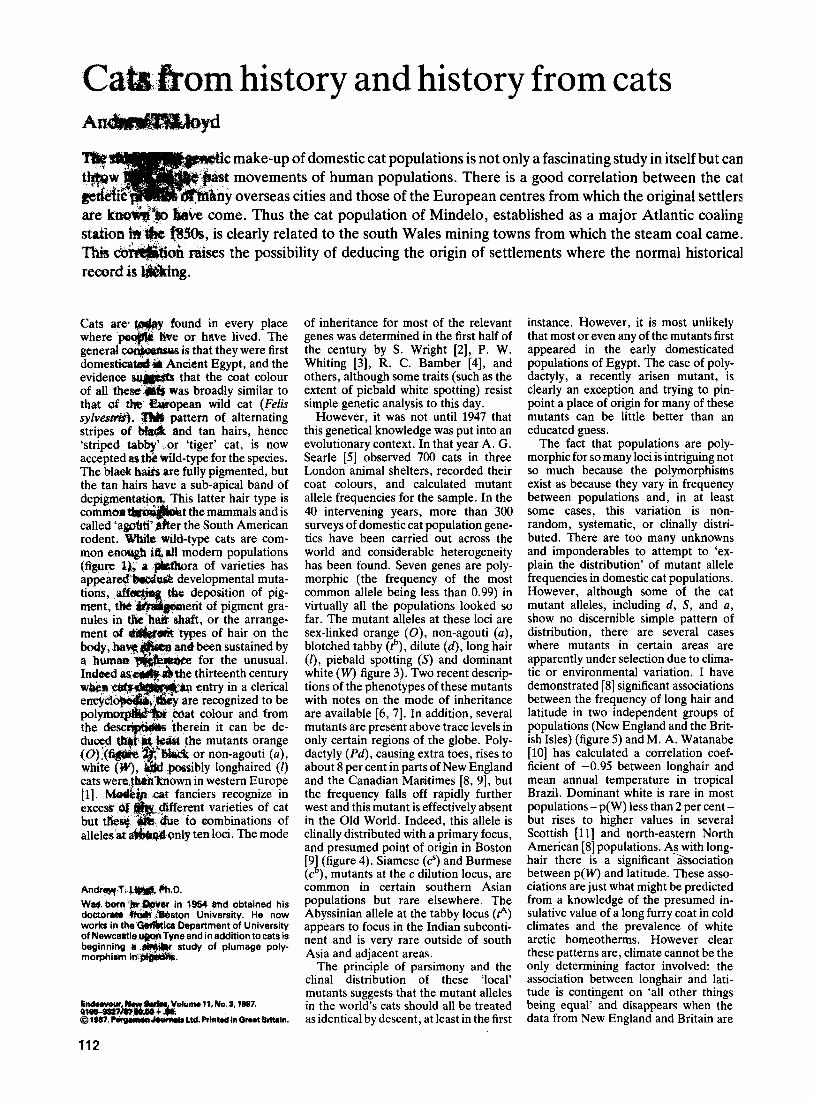
Cats are* @r&y found in every place where peo& I&e or have lived. The general con&&s~ is that they were first domestica&,ii Ancient Egypt, and the evidence su&&ts that the coat colour of all these#f$ was broadly similar to that of the’ &ropean wild cat (Fe6 sylvesuis). 8& pattern of alternating stripes of t&&r .and tan hairs, hence ‘striped tabby’ or ‘tiger’ cat, is now accepted as the wild-type for the species. The black ha& are fully pigmented, but the tan hairs have a sub-apical band of depigmentation, This latter hair type is commoat&c$&o& the mammals and is called ‘agc$ttY&er the South American rodent. While wild-type cats are com- mon enough i&all modern populations (figure 1& a &&ora of varieties has appeare@ba&u& developmental muta- tions, position of pig- ment, of pigment gra- nules i or the arrange- ment of di&#& types of hair on the body, haw;~ and been sustained by a humea@&&e for the unusual. Indeed as,e#&s&re thirteenth century
colour and from
t fanciers recognize in t varieties of cat
ten loci. The mode
4ndrqq.T. LsyVa Ilh.0.
works in the G&tics Department of University of Newcastle u@onTvne and in addition to cats is beginning I a&i study of plumage poly- morphism it%#@&lk
of inheritance for most of the relevant genes was determined in the first half of the century by S. Wright [2], P. W. Whiting [3], R. C. Bamber [4], and others, although some traits (such as the extent of piebald white spotting) resist simple genetic analysis to this day.
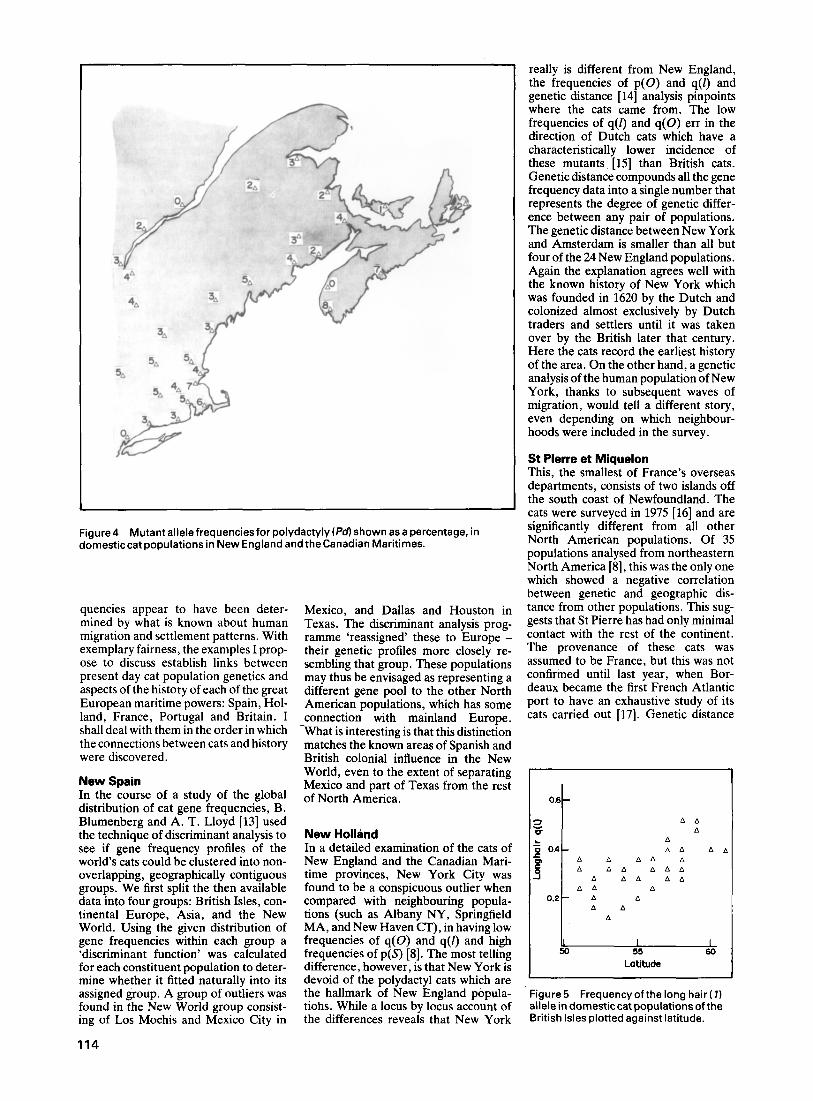
However, it was not until 1947 that this genetical knowledge was put into an evolutionary context. In that year A. G. Searle [5] observed 700 cats in three London animal shelters, recorded their coat colours, and calculated mutant allele frequencies for the sample. In the 40 intervening years, more than 300 surveys of domestic cat population gene- tics have been carried out across the world and considerable heterogeneity has been found. Seven genes are poly- morphic (the frequency of the most common allele being less than 0.99) in virtually all the populations looked so far. The mutant alleles at these loci are sex-linked orange (0)) non-agouti (a), blotched tabby (tb), dilute (d), long hair (I), piebald spotting (S) and dominant white (W) figure 3). Two recent descrip- tions of the phenotypes of these mutants with notes on the mode of inheritance are available [6, 71. In addition, several mutants are present above trace levels in only certain regions of the globe. Poly- dactyly (Pd), causing extra toes, rises to about 8 per cent in parts of New England and the Canadian Ma× [8, 91, but the frequency falls off rapidly further west and this mutant is effectively absent in the Old World. Indeed, this allele is clinally distributed with a primary focus, and presumed point of origin in Boston [91 (figure 4). Siamese (c”) and Burmese (c ), mutants at the c dilution locus, are common in certain southern Asian populations but rare elsewhere. The Abyssinian allele at the tabby locus (PA) appears to focus in the Indian subconti- nent and is very rare outside of south Asia and adjacent areas.
The principle of parsimony and the clinal distribution of these ‘local’ mutants suggests that the mutant alleles in the world’s cats should all be treated as identical by descent, at least in the first
instance. However, it is most unlikely that most or even any of the mutants first appeared in the early domesticated populations of Egypt. The case of poly- dactyly, a recently arisen mutant, is clearly an exception and trying to pin- point a place of origin for many of these mutants can be little better than an educated guess.
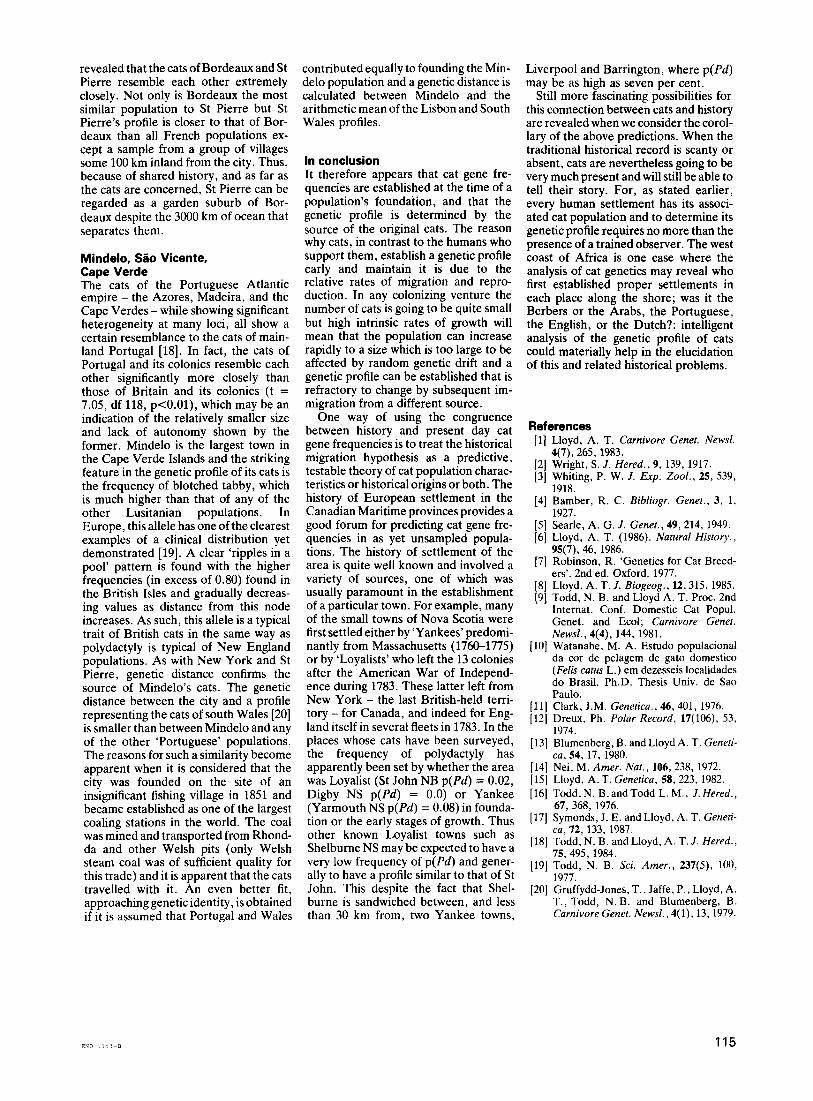
The fact that populations are poly- morphic for so many loci is intriguing not so much because the polymorphisms exist as because they vary in frequency between populations and, in at least some cases, this variation is non- random, systematic, or clinally distri- buted. There are too many unknowns and imponderables to attempt to ‘ex- plain the distribution’ of mutant allele frequencies in domestic cat populations. However, although some of the cat mutant alleles, including d, S, and a, show no discernible simple pattern of distribution, there are several cases where mutants in certain areas are apparently under selection due to clima- tic or environmental variation. I have demonstrated [8] significant associations between the frequency of long hair and latitude in two independent groups of populations (New England and the Brit- ish Isles) (figure 5) and M. A. Watanabe [lo] has calculated a correlation coef- ficient of -0.95 between longhair and mean annual temperature in tropical Brazil. Dominant white is rare in most populations-p(W) less than 2 per cent - but rises to higher values in several Scottish [ll] and north-eastern North American [8] populations. As with long- hair there is a significant %sociation between p(W) and latitude. These asso- ciations are just what might be predicted from a knowledge of the presumed in- sulative value of a long furry coat in cold climates and the prevalence of white arctic homeotherms. However clear these patterns are, climate cannot be the only determining factor involved: the association between longhair and lati- tude is contingent on ‘all other things being equal’ and disappears when the data from New England and Britain are
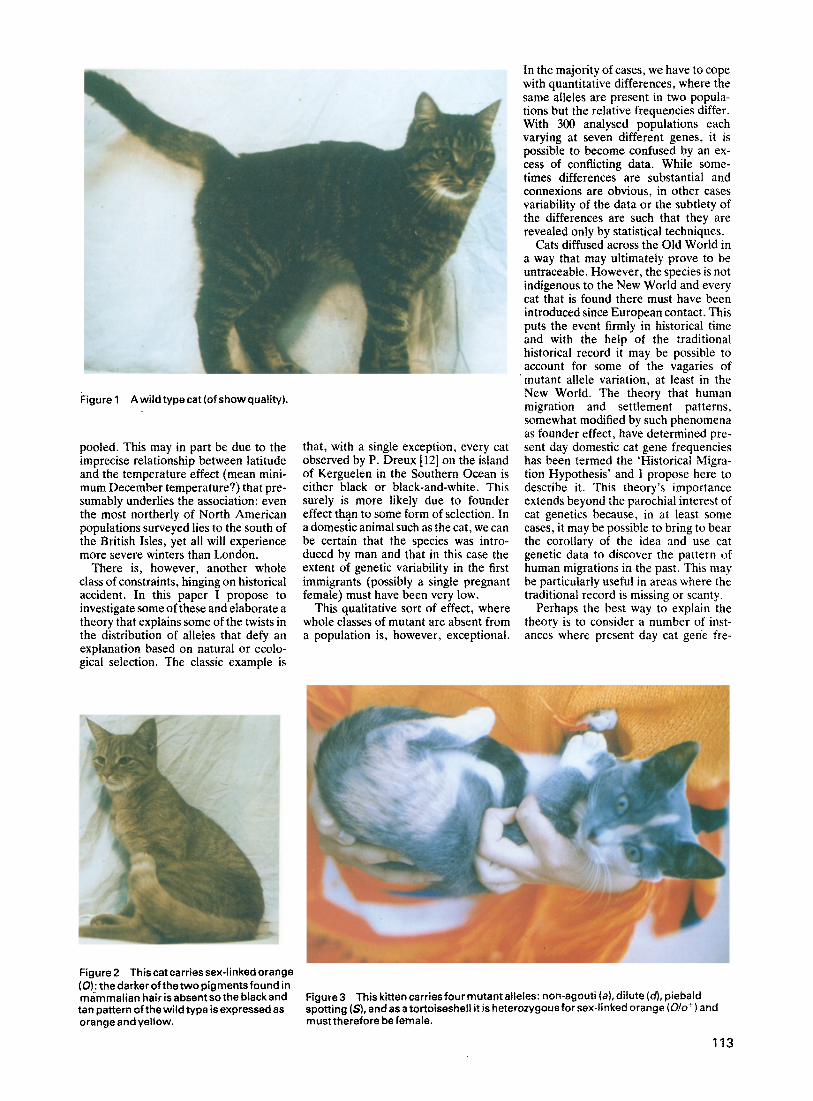
Figure 1 Awildtypecat(ofshowquali~).
pooled. This may in part be due to the imprecise relationship between latitude and the temperature effect (mean mini- mum December temperature?) that pre- sumably underlies the association: even the most northerly of North American populations surveyed lies to the south of the British Isles, yet all will experience more severe winters than London.
There is, however, another whole class of constraints, hinging on historical accident. In this paper I propose to investigate some of these and elaborate a theory that explains some of the twists in the dist~bution of alleles that defy an explanation based on natural or ecolo- gical selection. The classic example is
Figure 2 This cat carries sex-linked orange (0): thedarkerofthetwopigmentsfound in mammalian hairisabsentsothe blackand tan pattern of the wild type is expressed as orange and yellow.
that, with a single exception, every cat observed by P. Dreux [X2] on the island of Kerguelen in the Southern Ocean is either black or black-and-white. This surely is more likely due to founder effect than to some form of selection. In a domes& animal such as the cat, we can be certain that the species was intro- duced by man and that in this case the extent of genetic variability in the first immigrants (possibly a single pregnant female) must have been very low.
This qualitative sort of effect, where whole classes of mutant are absent from a population is, however, exceptional.
In the majority of cases, we have to cope with quantitative differences, where the same alieles are present in two popula- tions but the relative frequencies differ. With 300 analysed populations each varying at seven different genes, it is possible to become confused by an ex- cess of conflicting data. While some- times differences are substantial and connexions are obvious, in other cases variability of the data or the subtlety of the differences are such that they are revealed only by statistical techniques.
Cats diffused across the Old World in a way that may ultimately prove to be untraceable. However, the species is not indigenous to the New World and every cat that is found there must have been introduced since European contact. This puts the event firmly in historicai time and with the help of the traditional historical record it may be possible to account for some of the vagaries of mutant allele variation, at least in the New World. The theory that human migration and settlement patterns, somewhat modified by such phenomena as founder effect, have determined pre- sent day domestic cat gene frequencies has been termed the ‘Historical Migra- tion Hypothesis’ and I propose here to describe it. This theory’s importance extends beyond the parochial interest of cat genetics because, in at least some cases, it may be possible to bring to bear the corollary of the idea and use cat genetic data to discover the pattern of human migrations in the past. This may be particularly useful in areas where the traditional record is missing or scanty.
Perhaps the best way to explain the theory is to consider a number of inst- ances where present day cat gene fre-
Figure3 This ki~encarriesfour mutant alleles: non-agouti (a), dilute(d), piebald spotting (S), and as a tortoiseshell it is heterozygous for sex-linked orange (U/o’ ) and musttherefore be female.
113
5A % 5A 6 4
Figure4 Mutant allelefrequenciesfor polydactyly (Pd) shown as a percentage, in domesticcat populations in New England and the Canadian Maritimes.
quencies appear to have been deter- mined by what is known about human migration and settlement patterns. With exemplary fairness, the examples I prop- ose to discuss establish links between present day cat population genetics and aspects of the history of each of the great European maritime powers: Spain, Hol- land, France, Portugal and Britain. I shall deal with them in the order in which the connections between cats and history were discovered.
New Spain In the course of a study of the global distribution of cat gene frequencies, B. Blumenberg and A. T. Lloyd [13] used the technique of discriminant analysis to see if gene frequency profiles of the world’s cats could be clustered into non- overlapping, geographically contiguous groups. We first split the then available data into four groups: British Isles, con- tinental Europe, Asia, and the New World. Using the given distribution of gene frequencies within each group a ‘discriminant function’ was calculated for each constituent population to deter- mine whether it fitted naturally into its assigned group. A group of outliers was found in the New World group consist- ing of Los Mochis and Mexico City in
114
Mexico, and Dallas and Houston in Texas. The discriminant analysis prog- ramme ‘reassigned’ these to Europe - their genetic profiles more closely re- sembling that group. These populations may thus be envisaged as representing a different gene pool to the other North American populations, which has some connection with mainland Europe. -What is interesting is that this distinction matches the known areas of Spanish and British colonial influence in the New World, even to the extent of separating Mexico and part of Texas from the rest of North America.
New Hollrind In a detailed examination of the cats of New England and the Canadian Mari- time provinces, New York City was found to be a conspicuous outlier when compared with neighbouring popula- tions (such as Albany NY, Springfield MA, and New Haven CT), in having low frequencies of q(0) and q(l) and high frequencies of p(S) [8]. The most telling difference, however, is that New York is devoid of the polydactyl cats which are the hallmark of New England popula- tiohs. While a locus by locus account of the differences reveals that New York
really is different from New England, the frequencies of p(0) and q(l) and genetic distance [14] analysis pinpoints where the cats came from. The low frequencies of q([) and q(U) err in the direction of Dutch cats which have a characteristically lower incidence of these mutants [15] than British cats. Genetic distance compounds all the gene frequency data into a single number that represents the degree of genetic differ- ence between any pair of populations. The genetic distance between New York and Amsterdam is smaller than all but four of the 24 New England populations. Again the explanation agrees well with the known history of New York which was founded in 1620 by the Dutch and colonized almost exclusively by Dutch traders and settlers until it was taken over by the British later that century. Here the cats record the earliest history of the area. On the other hand, a genetic analysis of the human population of New York, thanks to subsequent waves of migration, would tell a different story, even depending on which neighbour- hoods were included in the survey.
St Pierre et Miquelon This, the smallest of France’s overseas departments, consists of two islands off the south coast of Newfoundland. The cats were surveyed in 1975 [16] and are significantly different from all other North American populations. Of 35 populations analysed from northeastern North America [8], this was the only one which showed a negative correlation between genetic and geographic dis- tance from other populations. This sug- gests that St Pierre has had only minimal contact with the rest of the continent. The provenance of these cats was assumed to be France, but this was not confirmed until last year, when Bor- deaux became the first French Atlantic port to have an exhaustive study of its cats carried out [17]. Genetic distance
A A
t
A A A 0.2 A A
A A
I A
m&i Latitude
Figure 5 Frequency of the long hair (7) allele in domestic cat populations of the British Isles plotted against latitude.
revealed that the cats of Bordeaux and St Pierre resemble each other extremely closely. Not only is Bordeaux the most similar population to St Pierre but St Pierre’s profile is closer to that of Bor- deaux than all French populations ex- cept a sample from a group of villages some 100 km inland from the city. Thus, because of shared history, and as far as the cats are concerned, St Pierre can be regarded as a garden suburb of Bor- deaux despite the 3000 km of ocean that separates them.
Mindelo, Sgo Vicente, Cape Verde The cats of the Portuguese Atlantic empire - the Azores, Madeira, and the Cape Verdes - while showing significant heterogeneity at many loci, all show a certain resemblance to the cats of main- land Portugal [18]. In fact, the cats of Portugal and its colonies resemble each other significantly more closely than those of Britain and its colonies (t = 7.05, df 118, p<O.Ol), which may be an indication of the relatively smaller size and lack of autonomy shown by the former. Mindelo is the largest town in the Cape Verde Islands and the striking feature in the genetic profile of its cats is the frequency of blotched tabby, which is much higher than that of any of the other Lusitanian populations. In Europe, this allele has one of the clearest examples of a clinical distribution yet demonstrated [19]. A clear ‘ripples in a pool’ pattern is found with the higher frequencies (in excess of 0.80) found in the British Isles and gradually decreas- ing values as distance from this node increases. As such, this allele is a typical trait of British cats in the same way as polydactyly is typical of New England populations. As with New York and St Pierre, genetic distance confirms the source of Mindelo’s cats. The genetic distance between the city and a profile representing the cats of south Wales [20] is smaller than between Mindelo and any of the other ‘Portuguese’ populations. The reasons for such a similarity become apparent when it is considered that the city was founded on the site of an insignificant fishing village in 1851 and became established as one of the largest coaling stations in the world. The coal was mined and transported from Rhond- da and other Welsh pits (only Welsh steam coal was of sufficient quality for this trade) and it is apparent that the cats travelled with it. An even better fit, approaching genetic identity, is obtained if it is assumed that Portugal and Wales
contributed equally to founding the Min- delo population and a genetic distance is calculated between Mindelo and the arithmetic mean of the Lisbon and South Wales profiles.
In conclusion It therefore appears that cat gene fre- quencies are established at the time of a population’s foundation, and that the genetic profile is determined by the source of the original cats. The reason why cats, in contrast to the humans who support them, establish a genetic profile early and maintain it is due to the relative rates of migration and repro- duction. In any colonizing venture the number of cats is going to be quite small but high intrinsic rates of growth will mean that the population can increase rapidly to a size which is too large to be affected by random genetic drift and a genetic profile can be established that is refractory to change by subsequent im- migration from a different source.
One way of using the congruence between history and present day cat gene frequencies is to treat the historical migration hypothesis as a predictive, testable theory of cat population charac- teristics or historical origins or both. The history of European settlement in the Canadian Maritime provinces provides a good forum for predicting cat gene fre- quencies in as yet unsampled popula- tions. The history of settlement of the area is quite well known and involved a variety of sources, one of which was usually paramount in the establishment of a particular town. For example, many of the small towns of Nova Scotia were first settled either by ‘Yankees’ predomi- nantly from Massachusetts (1760-1775) or by ‘Loyalists’ who left the 13 colonies after the American War of Independ- ence during 1783. These latter left from New York - the last British-held terri- tory - for Canada, and indeed for Eng- land itself in several fleets in 1783. In the places whose cats have been surveyed, the frequency of polydactyly has apparently been set by whether the area was Loyalist (St John NB p(Pd) = 0.02, Digby NS p(Pd) = 0.0) or Yankee (Yarmouth NS p(Pd) = 0.08) in founda- tion or the early stages of growth. Thus other known Loyalist towns such as Shelburne NS may be expected to have a very low frequency of p(Pd) and gener- ally to have a profile similar to that of St John. This despite the fact that Shel- burne is sandwiched between, and less than 30 km from. two Yankee towns.
Liverpool and Barrington, where p(Pd) may be as high as seven per cent.
Still more fascinating possibilities for this connection between cats and history are revealed when we consider the corol- lary of the above predictions. When the traditional historical record is scanty or absent, cats are nevertheless going to be very much present and will still be able to tell their story. For, as stated earlier, every human settlement has its associ- ated cat population and to determine its genetic profile requires no more than the presence of a trained observer. The west coast of Africa is one case where the analysis of cat genetics may reveal who first established proper settlements in each place along the shore; was it the Berbers or the Arabs, the Portuguese, the English, or the Dutch?: intelligent analysis of the genetic profile of cats could materially help in the elucidation of this and related historical problems.
Lloyd, A. T. Carnivore Genet. Newsl. 4(7), 265, 1983. Wright, S. J. Hered., 9, 139, 1917. Whiting, P. W. J. Exp. Zool., 25, 539, 1918.
References [II
t:]
141
[:I
[71
PI [9]
[lOI
Paula.
[ii]
Bamber, R. C. Bibliogr. Genet., 3, 1, 1927. Searle, A. G. J. Genet., 49,214, 1949. Lloyd, A. T. (1986). Natural History., 95(7), 46, 1986. Robinson, R. ‘Genetics for Cat Breed- ers’. 2nd ed. Oxford. 1977. Lloyd, A. T. J. Biogeog., 12,315, 1985. Todd, N. B. and Lloyd A. T. Proc. 2nd Internat. Conf. Domestic Cat Popul. Genet. and Ecol; Carnivore Genet. Newsl., 4(4), 144, 1981. Watanabe, M. A. Estudo populacional da car de pelagem de gato domestic0 (Fe/is carus L.) em dezesseis localidades do Brasil. Ph.D. Thesis Univ. de Sao
Clark, J.M. Genetica., 46, 401, 1976. Dreux, Ph. Polar Record, 17(106), 53, 1974.
[ 131 Blumenberg, B. and Lloyd A. T. Geneti- ca, 54, 17, 1980.
[14] Nei, M. Amer. Nat., 106, 238, 1972. [15] Lloyd, A. T. Genetica, 58, 223,1982. [ 161 Todd, N. B. and Todd L. M., .I. Hered.,
67, 368, 1976. [17] Symonds, J. E. and Lloyd, A. T. Geneti-
ca, 72, 133, 1987. [ 181 Todd, N. B. and Lloyd, A. T. J. Hered.,
75,495,1984. [19] Todd, N. B. Sci. Amer., 237(5), 100,
1977. (201 Gruffydd-Jones, T., Jaffe, P., Lloyd, A.
T., Todd, N. B. and Blumenberg, B. Carnivore Genet. Newsl., 4(l), 13, 1979.
115