Embed Size (px)
Citation preview
Basic Tools for Process Improvement
CAUSE-AND-EFFECT DIAGRAM 1
Module 5
CAUSE-AND-EFFECTDIAGRAM
Basic Tools for Process Improvement
2 CAUSE-AND-EFFECT DIAGRAM
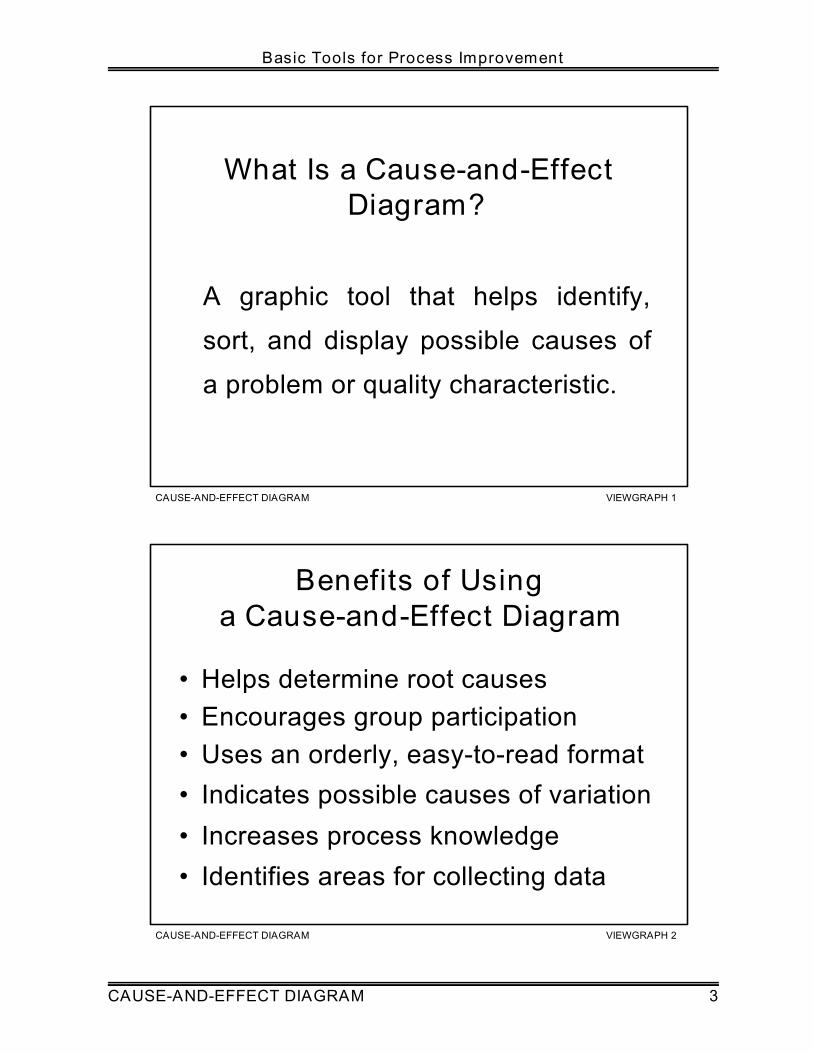
What is a Cause-and-Effect Diagram?
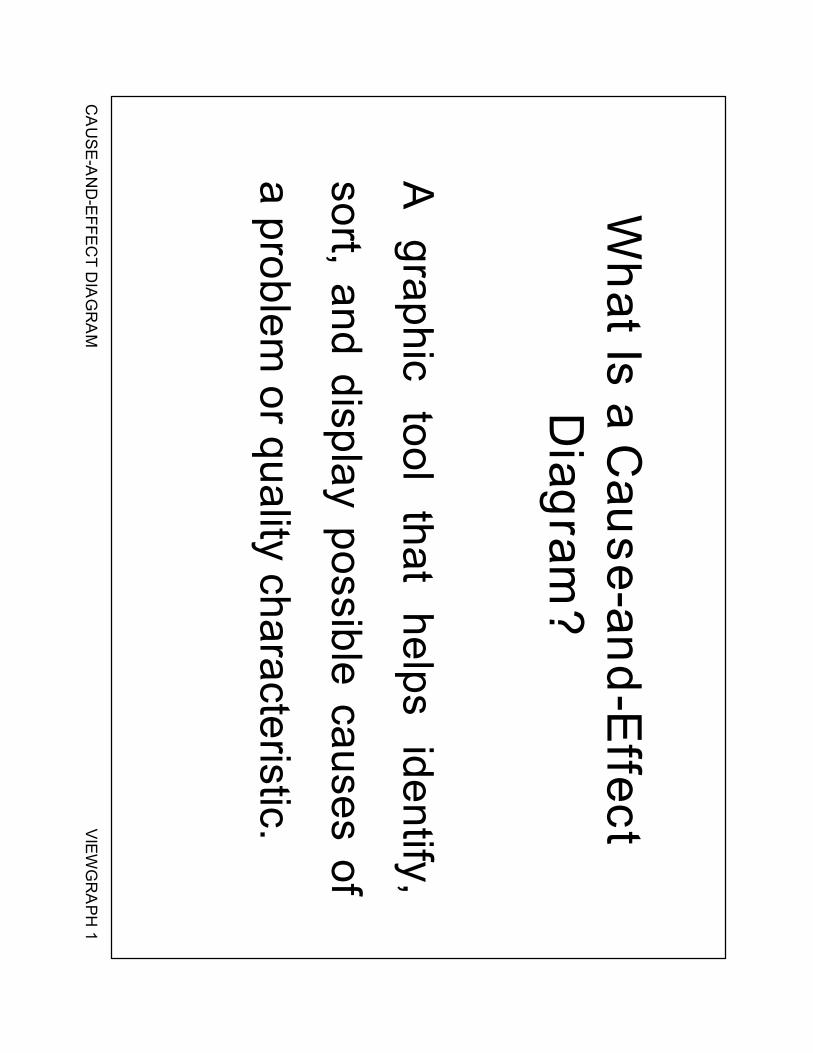
A Cause-and-Effect Diagram is a tool that helps identify, sort, and display possiblecauses of a specific problem or quality characteristic (Viewgraph 1). It graphicallyillustrates the relationship between a given outcome and all the factors that influencethe outcome. This type of diagram is sometimes called an "Ishikawa diagram"because it was invented by Kaoru Ishikawa, or a "fishbone diagram" because of theway it looks.
When should a team use a Cause-And-Effect Diagram?
Constructing a Cause-and-Effect Diagram can help your team when you need to
! Identify the possible root causes, the basic reasons, for a specific effect,problem, or condition.
! Sort out and relate some of the interactions among the factors affecting aparticular process or effect.
! Analyze existing problems so that corrective action can be taken.
Why should we use a Cause-and-Effect Diagram?
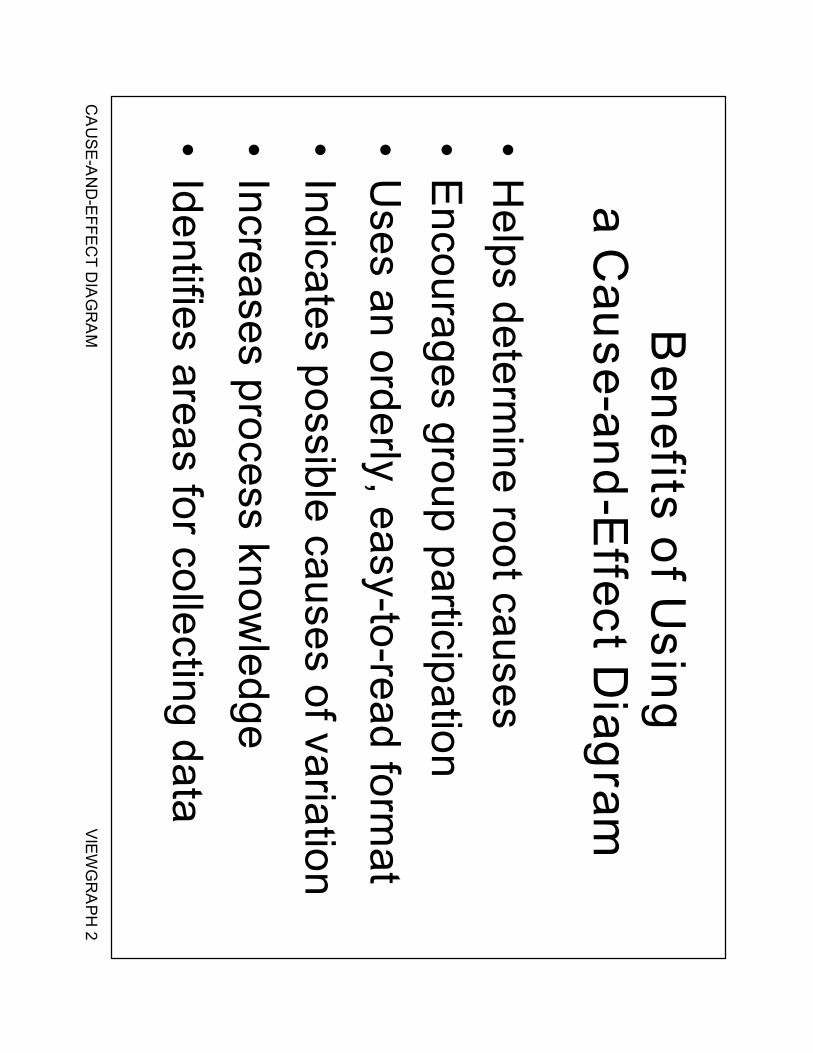
A Cause-and-Effect Diagram is a tool that is useful for identifying and organizing theknown or possible causes of quality, or the lack of it. The structure provided by thediagram helps team members think in a very systematic way. Some of the benefitsof constructing a Cause-and-Effect Diagram (Viewgraphs 2) are that it
! Helps determine the root causes of a problem or quality characteristicusing a structured approach.
! Encourages group participation and utilizes group knowledge of theprocess.
! Uses an orderly, easy-to-read format to diagram cause-and-effectrelationships.
! Indicates possible causes of variation in a process.
! Increases knowledge of the process by helping everyone to learn moreabout the factors at work and how they relate.
! Identifies areas where data should be collected for further study.
CAUSE-AND-EFFECT DIAGRAM VIEWGRAPH 1
What Is a Cause-and-EffectDiagram?
A graphic tool that helps identify,
sort, and display possible causes of
a problem or quality characteristic.
CAUSE-AND-EFFECT DIAGRAM VIEWGRAPH 2
Benefits of Usinga Cause-and-Effect Diagram
• Helps determine root causes• Encourages group participation• Uses an orderly, easy-to-read format• Indicates possible causes of variation
• Increases process knowledge• Identifies areas for collecting data
Basic Tools for Process Improvement
CAUSE-AND-EFFECT DIAGRAM 3
Basic Tools for Process Improvement
4 CAUSE-AND-EFFECT DIAGRAM
How do we develop a Cause-and-Effect Diagram?
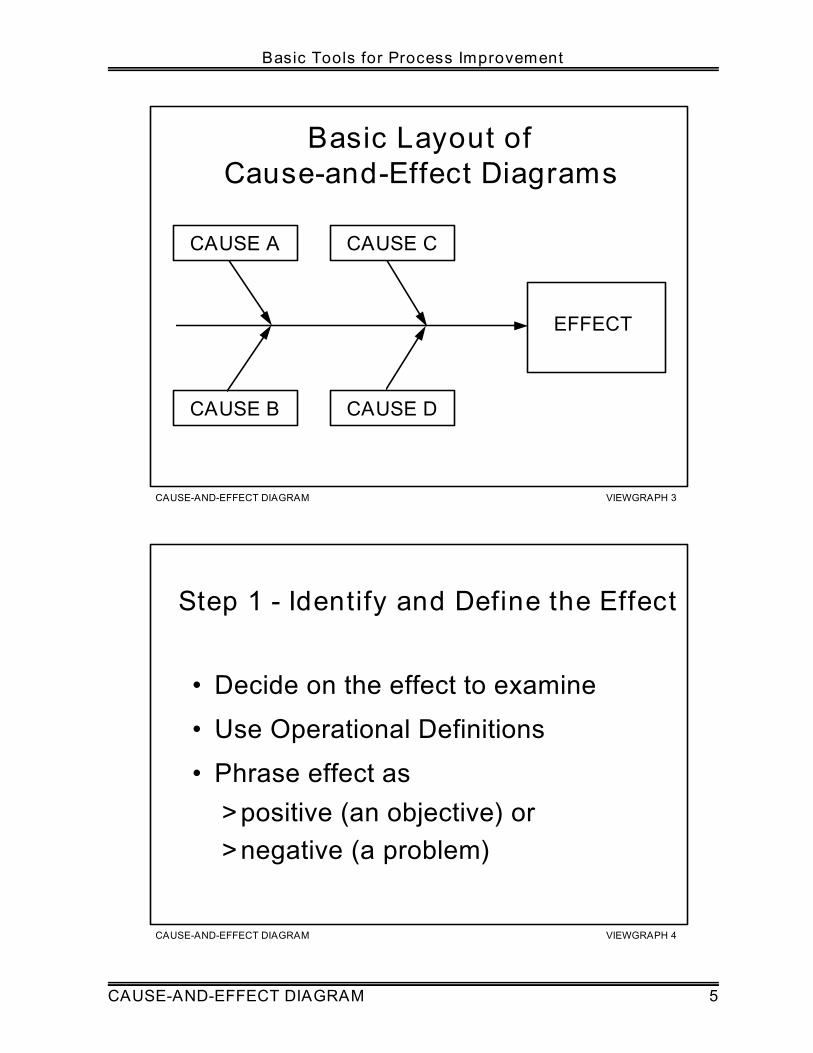
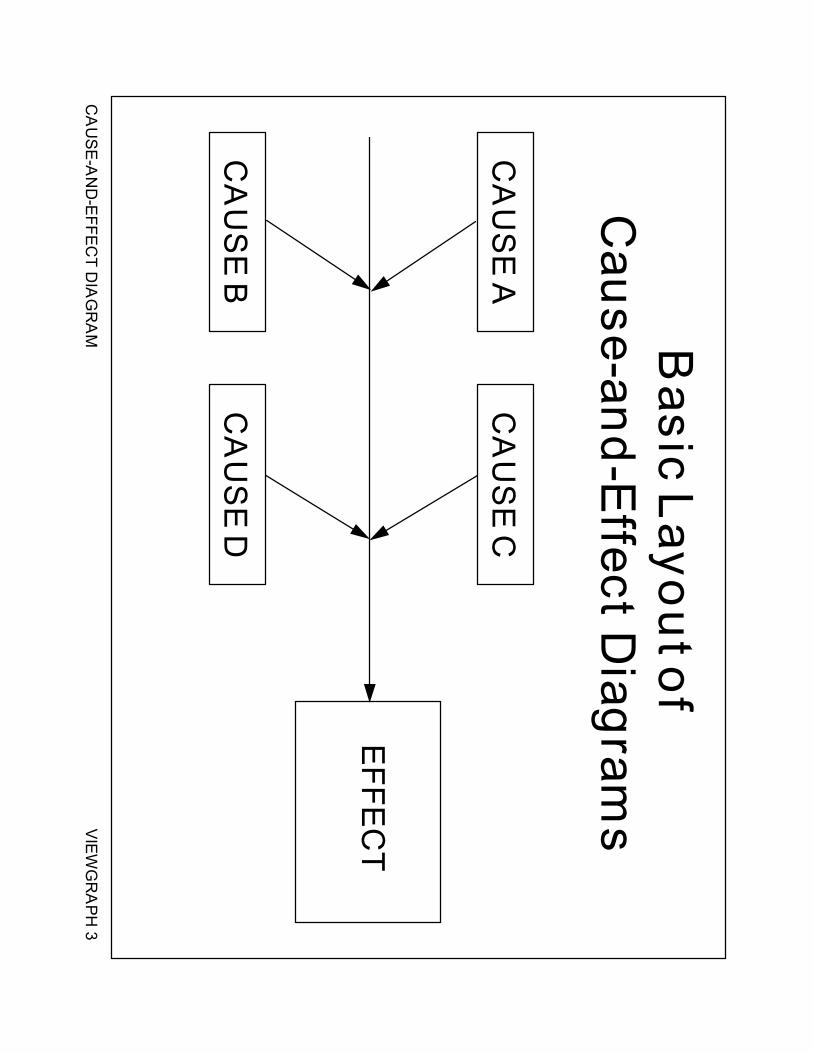
When you develop a Cause-and-Effect Diagram, you are constructing a structured,pictorial display of a list of causes organized to show their relationship to a specificeffect. Viewgraph 3 shows the basic layout of a Cause-and-Effect Diagram. Noticethat the diagram has a cause side and an effect side. The steps for constructing andanalyzing a Cause-and-Effect Diagram are outlined below.
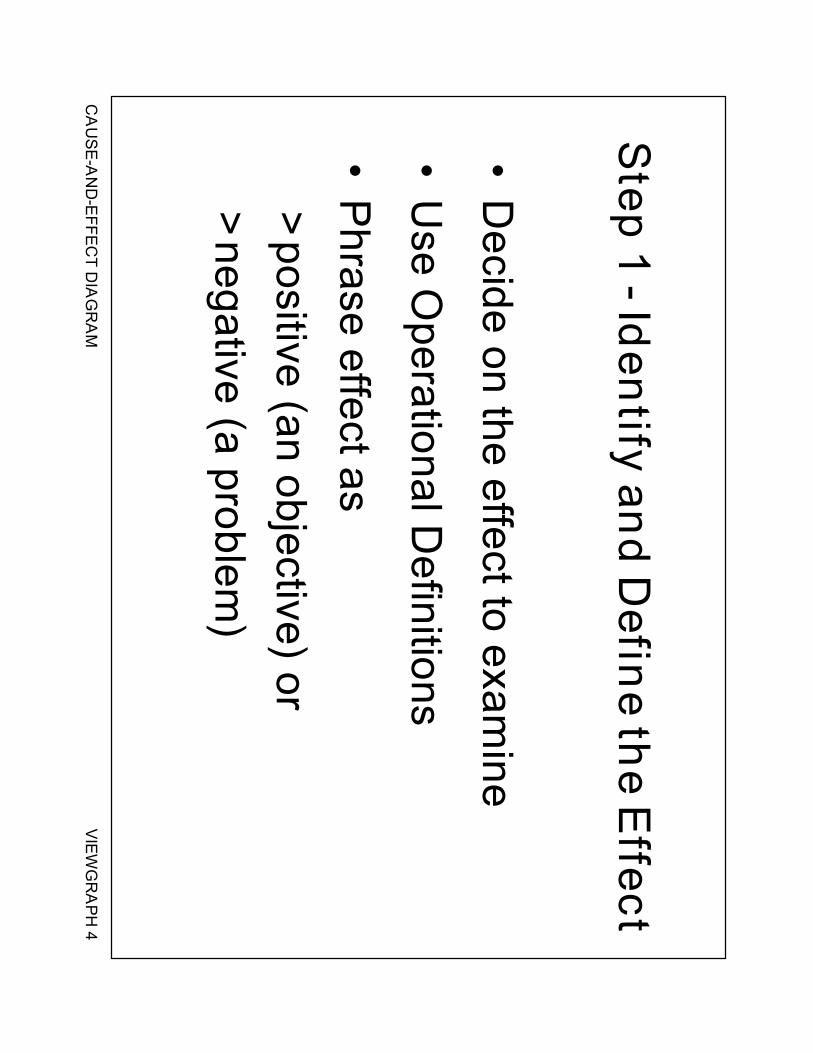
Step 1 - Identify and clearly define the outcome or EFFECT to be analyzed (Viewgraph 4).
! Decide on the effect to be examined. Effects are stated as particular qualitycharacteristics, problems resulting from work, planning objectives, and the like.
! Use Operational Definitions. Develop an Operational Definition of the effect toensure that it is clearly understood.
! Remember, an effect may be positive (an objective) or negative (a problem),depending upon the issue that’s being discussed.
> Using a positive effect which focuses on a desired outcome tends to fosterpride and ownership over productive areas. This may lead to an upbeatatmosphere that encourages the participation of the group. When possible,it is preferable to phrase the effect in positive terms.
> Focusing on a negative effect can sidetrack the team into justifying why theproblem occurred and placing blame. However, it is sometimes easier fora team to focus on what causes a problem than what causes an excellentoutcome. While you should be cautious about the fallout that can resultfrom focusing on a negative effect, getting a team to concentrate on thingsthat can go wrong may foster a more relaxed atmosphere and sometimesenhances group participation.
You must decide which approach will work best with your group.
NOTE: The EXAMPLE that is imbedded in the explanation of Cause-and-EffectDiagram construction and analysis on the next few pages is based on a chart inThe Memory Jogger [Ref. 1, p. 28]. This diagram has been broken down into itscomponent parts and expanded to illustrate the construction steps. Using thisexample, we will diagram the causes relating to a car’s getting poor gas mileage.
CAUSE-AND-EFFECT DIAGRAM VIEWGRAPH 3
Basic Layout ofCause-and-Effect Diagrams
CAUSE A
CAUSE D
CAUSE C
CAUSE B
EFFECT
CAUSE-AND-EFFECT DIAGRAM VIEWGRAPH 4
Step 1 - Identify and Define the Effect
• Decide on the effect to examine
• Use Operational Definitions
• Phrase effect as>positive (an objective) or>negative (a problem)
Basic Tools for Process Improvement
CAUSE-AND-EFFECT DIAGRAM 5
Basic Tools for Process Improvement
6 CAUSE-AND-EFFECT DIAGRAM
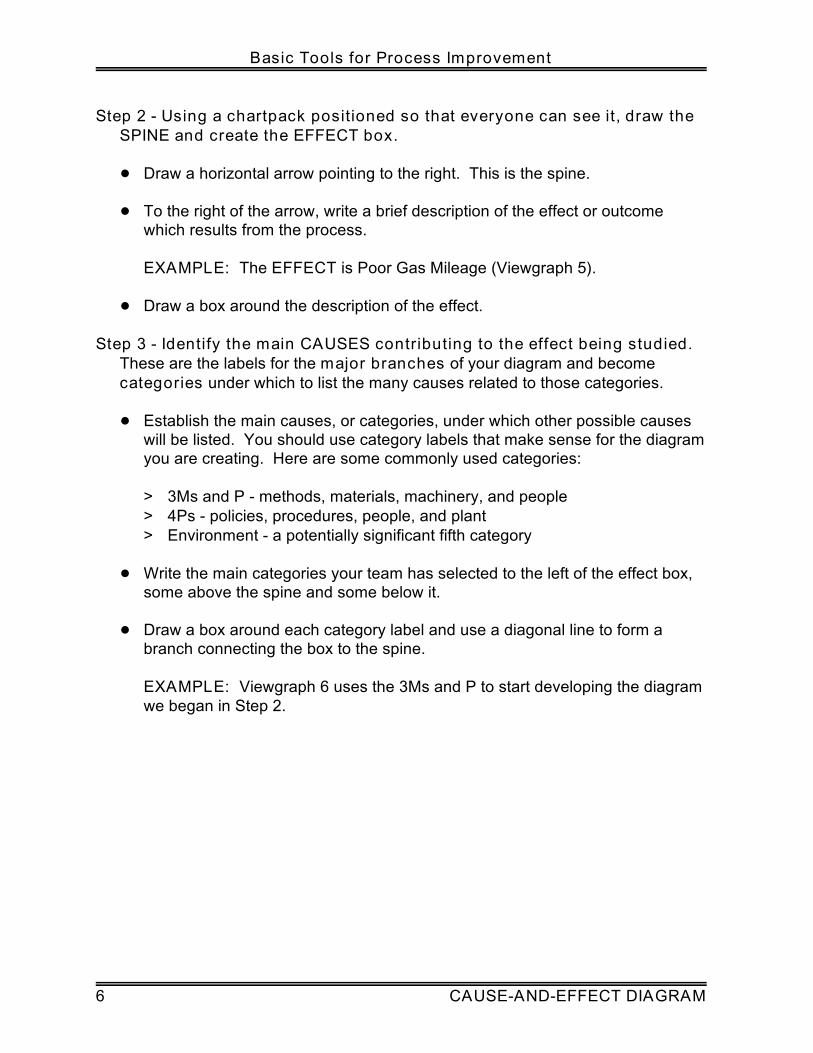
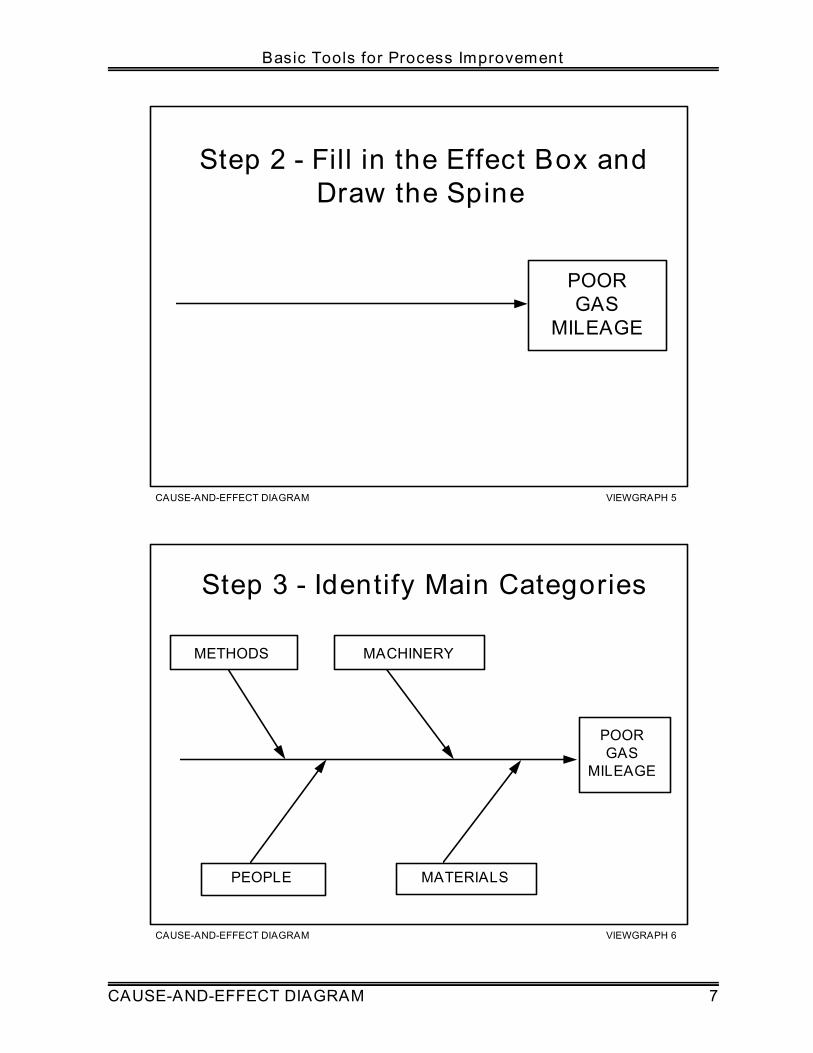
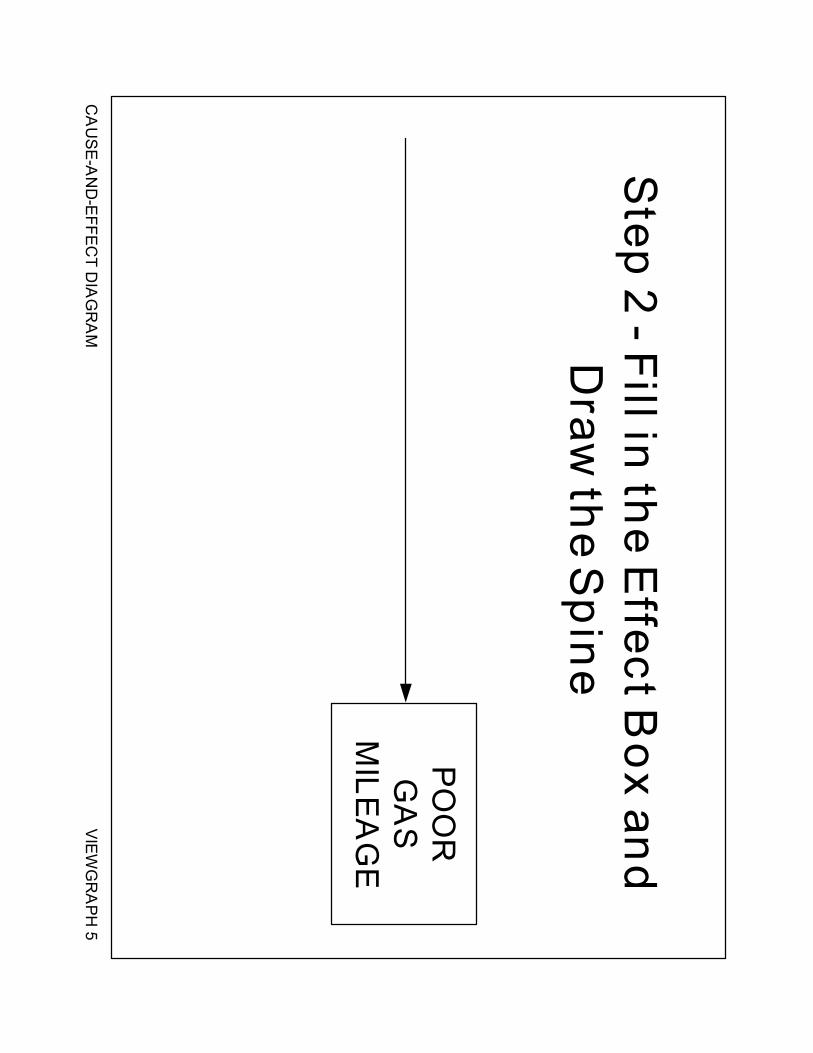
Step 2 - Using a chartpack positioned so that everyone can see it, draw the SPINE and create the EFFECT box.
! Draw a horizontal arrow pointing to the right. This is the spine.
! To the right of the arrow, write a brief description of the effect or outcomewhich results from the process.
EXAMPLE: The EFFECT is Poor Gas Mileage (Viewgraph 5).
! Draw a box around the description of the effect.
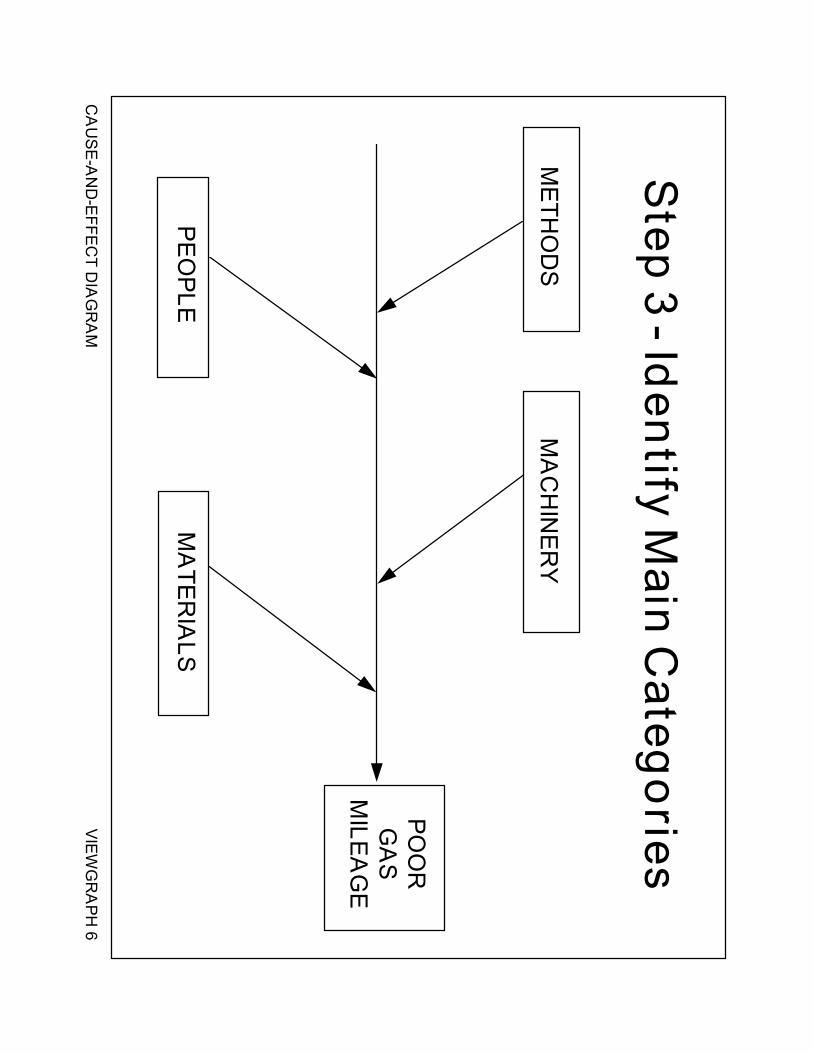
Step 3 - Identify the main CAUSES contributing to the effect being studied. These are the labels for the major branches of your diagram and becomecategories under which to list the many causes related to those categories.
! Establish the main causes, or categories, under which other possible causeswill be listed. You should use category labels that make sense for the diagramyou are creating. Here are some commonly used categories:
> 3Ms and P - methods, materials, machinery, and people> 4Ps - policies, procedures, people, and plant> Environment - a potentially significant fifth category
! Write the main categories your team has selected to the left of the effect box,some above the spine and some below it.
! Draw a box around each category label and use a diagonal line to form abranch connecting the box to the spine.
EXAMPLE: Viewgraph 6 uses the 3Ms and P to start developing the diagramwe began in Step 2.
CAUSE-AND-EFFECT DIAGRAM VIEWGRAPH 5
Step 2 - Fill in the Effect Box andDraw the Spine
POORGAS
MILEAGE
CAUSE-AND-EFFECT DIAGRAM VIEWGRAPH 6
Step 3 - Identify Main Categories
POORGAS
MILEAGE
METHODS MACHINERY
PEOPLE MATERIALS
Basic Tools for Process Improvement
CAUSE-AND-EFFECT DIAGRAM 7
Basic Tools for Process Improvement
8 CAUSE-AND-EFFECT DIAGRAM
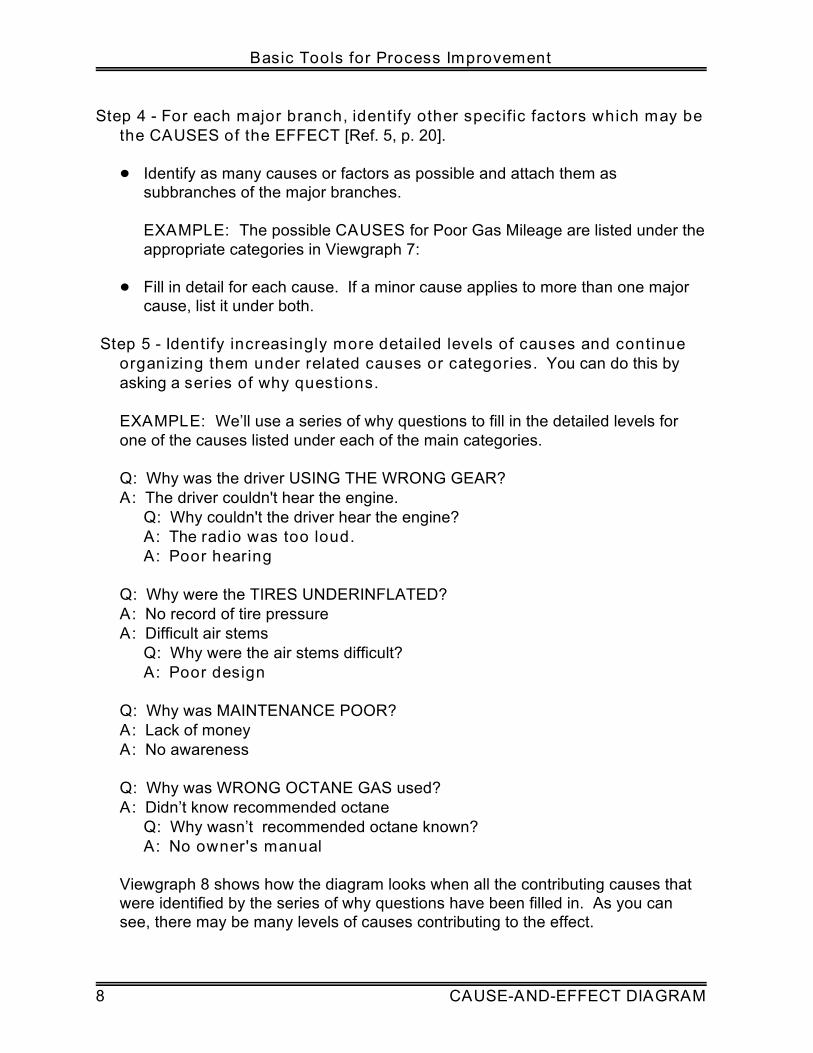
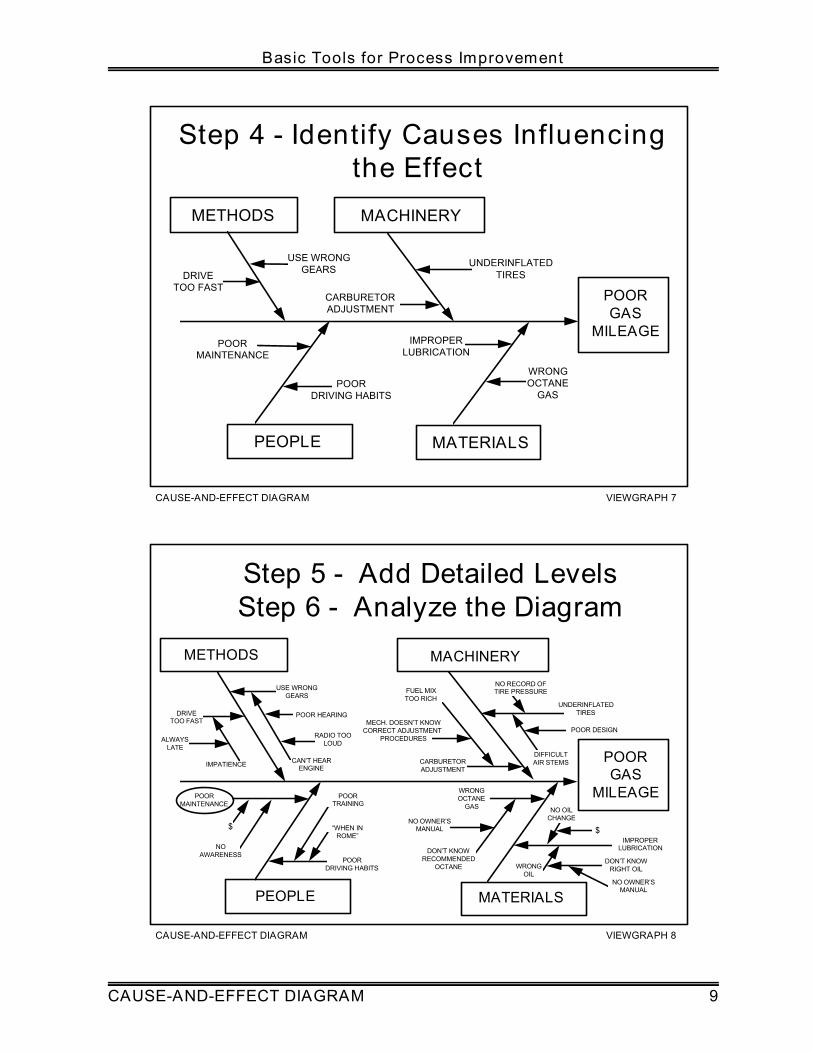
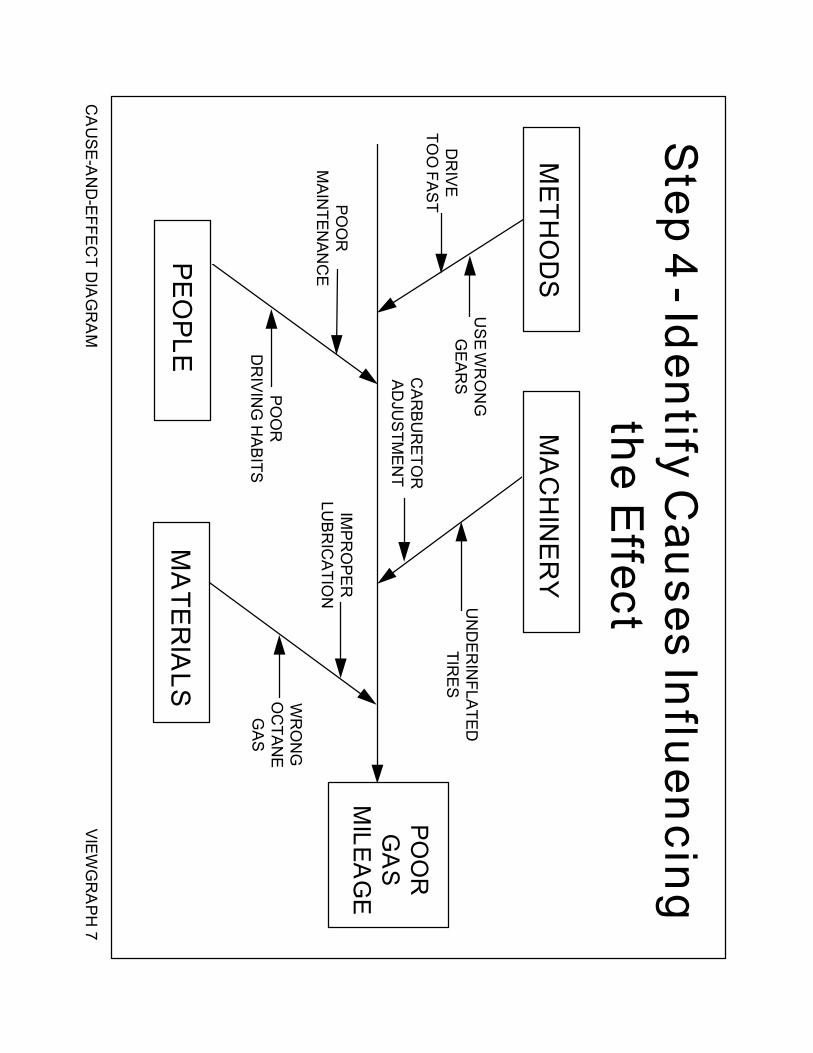
Step 4 - For each major branch, identify other specific factors which may bethe CAUSES of the EFFECT [Ref. 5, p. 20].
Identify as many causes or factors as possible and attach them assubbranches of the major branches.
EXAMPLE: The possible CAUSES for Poor Gas Mileage are listed under theappropriate categories in Viewgraph 7:
Fill in detail for each cause. If a minor cause applies to more than one majorcause, list it under both.
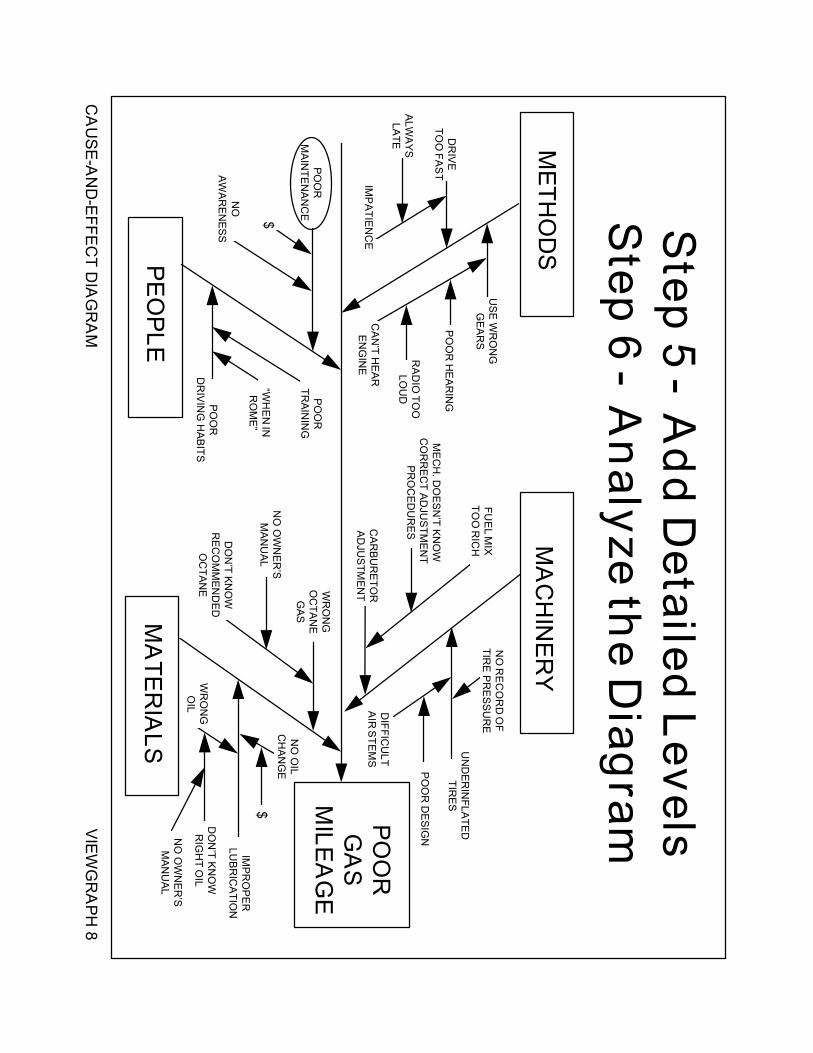
Step 5 - Identify increasingly more detailed levels of causes and continueorganizing them under related causes or categories. You can do this byasking a series of why questions.
EXAMPLE: We’ll use a series of why questions to fill in the detailed levels forone of the causes listed under each of the main categories.
Q: Why was the driver USING THE WRONG GEAR?A: The driver couldn't hear the engine.
Q: Why couldn't the driver hear the engine?A: The radio was too loud.A: Poor hearing
Q: Why were the TIRES UNDERINFLATED?A: No record of tire pressureA: Difficult air stems
Q: Why were the air stems difficult?A: Poor design
Q: Why was MAINTENANCE POOR?A: Lack of moneyA: No awareness
Q: Why was WRONG OCTANE GAS used?A: Didn’t know recommended octane
Q: Why wasn’t recommended octane known?A: No owner's manual
Viewgraph 8 shows how the diagram looks when all the contributing causes thatwere identified by the series of why questions have been filled in. As you cansee, there may be many levels of causes contributing to the effect.
CAUSE-AND-EFFECT DIAGRAM VIEWGRAPH 7
Step 4 - Identify Causes Influencingthe Effect
POORGAS
MILEAGE
METHODS MACHINERY
PEOPLE MATERIALS
DRIVETOO FAST
USE WRONGGEARS
CARBURETORADJUSTMENT
UNDERINFLATEDTIRES
POORMAINTENANCE
POORDRIVING HABITS
IMPROPERLUBRICATION
WRONGOCTANE
GAS
CAUSE-AND-EFFECT DIAGRAM VIEWGRAPH 8
Step 5 - Add Detailed LevelsStep 6 - Analyze the Diagram
ALWAYSLATE
POORGAS
MILEAGE
METHODS MACHINERY
PEOPLE MATERIALS
DRIVETOO FAST
USE WRONGGEARS
CARBURETORADJUSTMENT
UNDERINFLATEDTIRES
POORDRIVING HABITS
IMPROPERLUBRICATION
WRONGOCTANE
GAS
IMPATIENCE
POOR HEARING
RADIO TOOLOUD
CAN’T HEARENGINE
$
NOAWARENESS
MECH. DOESN’T KNOWCORRECT ADJUSTMENT
PROCEDURES
FUEL MIXTOO RICH
DIFFICULTAIR STEMS
POOR DESIGN
NO RECORD OFTIRE PRESSURE
POORTRAINING
“WHEN INROME”
NO OWNER’SMANUAL
DON’T KNOWRECOMMENDED
OCTANE
NO OILCHANGE
$
WRONGOIL
DON’T KNOWRIGHT OIL
NO OWNER’SMANUAL
POORMAINTENANCE
Basic Tools for Process Improvement
CAUSE-AND-EFFECT DIAGRAM 9
Basic Tools for Process Improvement
10 CAUSE-AND-EFFECT DIAGRAM
NOTE: You may need to break your diagram into smaller diagrams if one branchhas too many subbranches. Any main cause (3Ms and P, 4Ps, or a category youhave named) can be reworded into an effect.
Step 6 - Analyze the diagram. Analysis helps you identify causes that warrantfurther investigation. Since Cause-and-Effect Diagrams identify only possiblecauses, you may want to use a Pareto Chart to help your team determine thecause to focus on first.
Look at the “balance” of your diagram, checking for comparable levels of detailfor most of the categories.
> A thick cluster of items in one area may indicate a need for further study.> A main category having only a few specific causes may indicate a need for
further identification of causes.> If several major branches have only a few subbranches, you may need to
combine them under a single category.
Look for causes that appear repeatedly. These may represent root causes.
Look for what you can measure in each cause so you can quantify the effectsof any changes you make.
Most importantly, identify and circle the causes that you can take action on.
EXAMPLE: Let's analyze the diagram we have been constructing.
> The level of detail is pretty well balanced.
> No causes are repeated.
> Poor Maintenance appears to be a cause for which you could developmeasurements.
> Moreover, Poor Maintenance appears to be a cause that you can takeaction on. It is circled in Viewgraph 8 to earmark it for further investigation.
Basic Tools for Process Improvement
CAUSE-AND-EFFECT DIAGRAM 11
How can we practice what we’ve learned?
Some practical exercises will enable your team to practice constructing andanalyzing Cause-and-Effect Diagrams. The first exercise is sketched out in detail. When you have completed that, you can try your hand with one or two other topicsfrom the list that follows the detailed exercise.
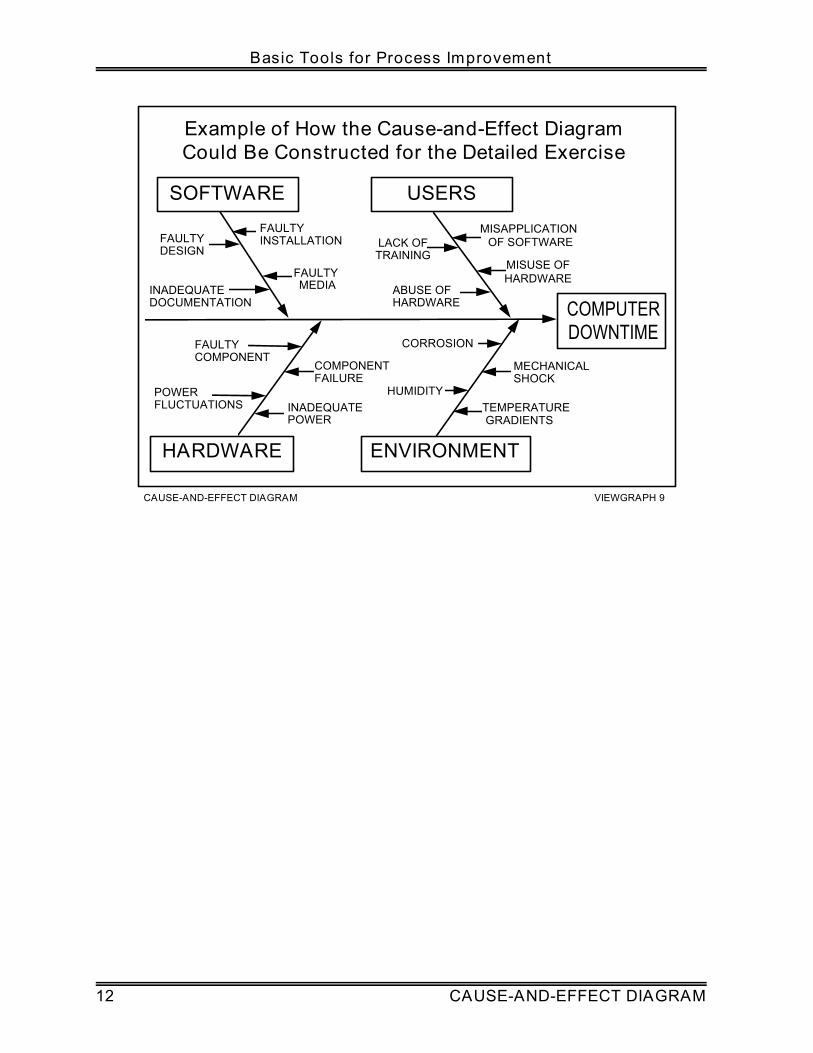
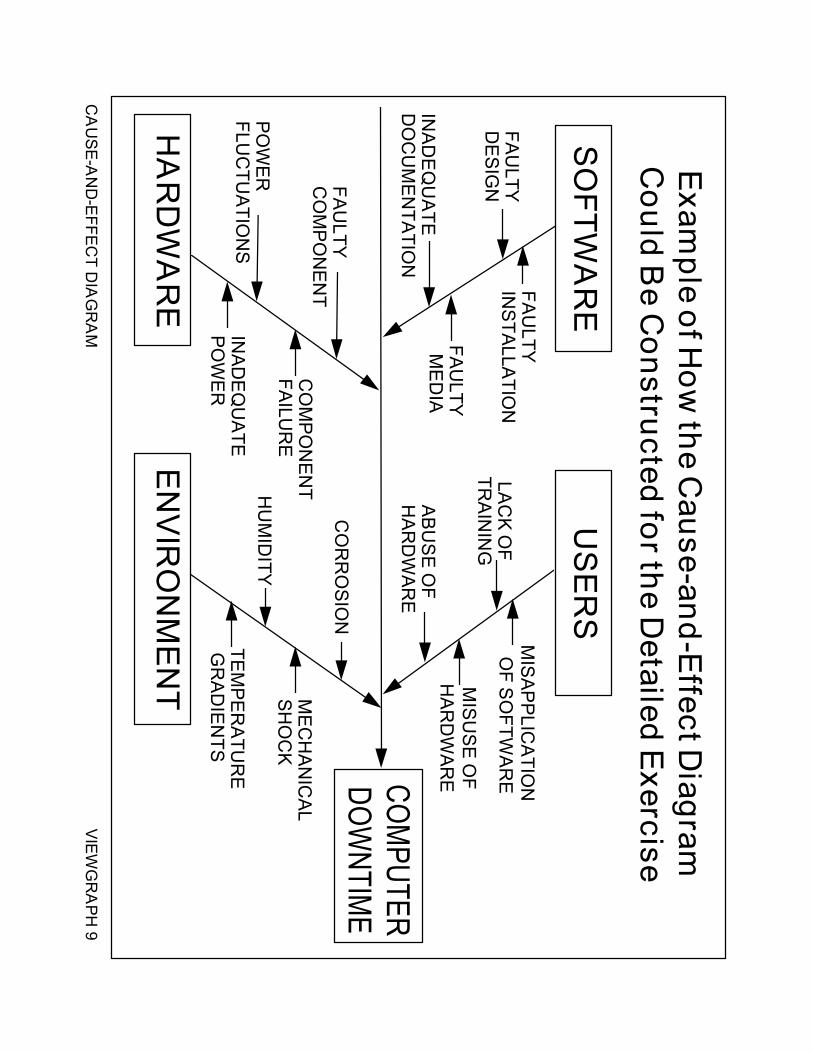
DETAILED EXERCISE: Construct a Cause-and-Effect Diagram to identifythe causes of computer downtime in your organization.
! Draw a horizontal arrow to the right, write the effect (computer downtime), anddraw a box around it.
! Identify the main causes contributing to the effect.
! Draw boxes around the main categories and connect the boxes to thehorizontal arrow with diagonal arrows to form the fishbone.
! For each branch, identify specific factors which may be the causes of theeffect.
! Add increasingly detailed levels of causes.
! Analyze the diagram and circle causes that you can take action on.
Viewgraph 9 shows one way the completed diagram could be drawn.
OTHER EXERCISE TOPICS:
> What is causing the poor state of readiness of the fire control systems?
> What is causing our ship to drag anchor in heavy weather?
> What is causing us to fail our corrosion-control inspections?
> What factors affect the proper disposal of recyclable material on the base?
> What things do we need to consider in planning a perfect meeting?
> What factors affect the flow of information within our organization?
> What is causing the organization's vehicles to get poor gas mileage?
> What factors contribute to slow prescription service at the pharmacy?
> What will ensure that we have a successful unit Christmas party?
CAUSE-AND-EFFECT DIAGRAM VIEWGRAPH 9
Example of How the Cause-and-Effect DiagramCould Be Constructed for the Detailed Exercise
COMPUTERDOWNTIME
SOFTWARE USERS
HARDWARE ENVIRONMENT
FAULTYDESIGN
FAULTY MEDIA
MISAPPLICATION OF SOFTWARE
INADEQUATEPOWER
TEMPERATURE GRADIENTS
MECHANICALSHOCK
HUMIDITY
CORROSION
INADEQUATE DOCUMENTATION
FAULTY INSTALLATION
POWERFLUCTUATIONS
COMPONENTFAILURE
LACK OFTRAINING
ABUSE OFHARDWARE
MISUSE OFHARDWARE
FAULTY COMPONENT
Basic Tools for Process Improvement
12 CAUSE-AND-EFFECT DIAGRAM
Basic Tools for Process Improvement
CAUSE-AND-EFFECT DIAGRAM 13
REFERENCES:
1. Brassard, M. (1988). The Memory Jogger, A Pocket Guide of Tools forContinuous Improvement, pp. 24 - 29. Methuen, MA: GOAL/QPC.
2. Department of the Navy (November 1992). Fundamentals of Total QualityLeadership (Instructor Guide), pp. 6-25 - 6-29. San Diego, CA: Navy PersonnelResearch and Development Center.
3. Department of the Navy (September 1993). Systems Approach to ProcessImprovement (Instructor Guide), pp. 5-15 - 5-27. San Diego, CA: OUSN TotalQuality Leadership Office and Navy Personnel Research and DevelopmentCenter.
4. Department of the Navy (November 1992). Team Skills and Concepts (InstructorGuide), pp. 5-47 - 5-56. Washington, DC: OUSN Total Quality Leadership Office.
5. Ishikawa, Kaoru (1968). Guide to Quality Control. Tokyo, Japan: AsianProductivity Organization.
6. U.S. Air Force (Undated). Process Improvement Guide - Total Quality Tools forTeams and Individuals, p. 33. Air Force Electronic Systems Center, Air ForceMateriel Command.
Basic Tools for Process Improvement
14 CAUSE-AND-EFFECT DIAGRAM
CA
US
E-A
ND
-EFFE
CT D
IAG
RA
MV
IEW
GR
AP
H 1
Wh
at Is a Cau
se-and
-Effect
Diag
ram?
A
graphic tool
that helps
identify,
sort, and display possible causes of
a problem or quality characteristic.
CA
US
E-A
ND
-EFFE
CT D
IAG
RA
MV
IEW
GR
AP
H 2
Ben
efits of U
sing
a Cau
se-and
-Effect D
iagram
•H
elps determine root causes
•E
ncourages group participation•
Uses an orderly, easy-to-read form
at•
Indicates possible causes of variation
•Increases process know
ledge•
Identifies areas for collecting data
CA
US
E-A
ND
-EFFE
CT D
IAG
RA
MV
IEW
GR
AP
H 3
Basic L
ayou
t of
Cau
se-and
-Effect D
iagram
s
CA
US
E A
CA
US
E D
CA
US
E C
CA
US
E B
EF
FE
CT
CA
US
E-A
ND
-EFFE
CT D
IAG
RA
MV
IEW
GR
AP
H 4
Step
1 - Iden
tify and
Defin
e the E
ffect
•D
ecide on the effect to examine
•U
se Operational D
efinitions
•P
hrase effect as>
positive (an objective) or>
negative (a problem)
CA
US
E-A
ND
-EFFE
CT D
IAG
RA
MV
IEW
GR
AP
H 5
Step
2 - Fill in
the E
ffect Bo
x and
Draw
the S
pin
e
PO
OR
GA
SM
ILE
AG
E
CA
US
E-A
ND
-EFFE
CT D
IAG
RA
MV
IEW
GR
AP
H 6
Step
3 - Iden
tify Main
Categ
ories
PO
OR
GA
SM
ILEA
GE
ME
THO
DS
MA
CH
INE
RY
PE
OP
LEM
ATE
RIA
LS
CA
US
E-A
ND
-EFFE
CT D
IAG
RA
MV
IEW
GR
AP
H 7
Step
4 - Iden
tify Cau
ses Influ
encin
gth
e Effect
PO
OR
GA
SM
ILEA
GE
ME
THO
DS
MA
CH
INE
RY
PE
OP
LEM
ATE
RIA
LS
DR
IVE
TOO
FAS
T
US
E W
RO
NG
GE
AR
SCA
RB
UR
ETO
RA
DJU
STM
EN
T
UN
DE
RIN
FLATE
DTIR
ES
PO
OR
MA
INTE
NA
NC
E
PO
OR
DR
IVIN
G H
AB
ITS
IMP
RO
PE
RLU
BR
ICA
TION
WR
ON
GO
CTA
NE
GA
S
CA
US
E-A
ND
-EFFE
CT D
IAG
RA
MV
IEW
GR
AP
H 8
Step
5 - Ad
d D
etailed L
evelsS
tep 6 - A
nalyze th
e Diag
ram
ALW
AY
SLA
TE
PO
OR
GA
SM
ILEA
GE
ME
THO
DS
MA
CH
INE
RY
PE
OP
LEM
ATE
RIA
LS
DR
IVE
TOO
FAS
T
US
E W
RO
NG
GE
AR
S
CA
RB
UR
ETO
RA
DJU
STM
EN
T
UN
DE
RIN
FLATE
DTIR
ES
PO
OR
DR
IVIN
G H
AB
ITS
IMP
RO
PE
RLU
BR
ICA
TION
WR
ON
GO
CTA
NE
GA
S
IMP
ATIE
NC
E
PO
OR
HE
AR
ING
RA
DIO
TOO
LOU
D
CA
N’T H
EA
RE
NG
INE
$
NO
AW
AR
EN
ES
S
ME
CH
. DO
ES
N’T K
NO
WC
OR
RE
CT A
DJU
STM
EN
T P
RO
CE
DU
RE
S
FU
EL M
IXTO
O R
ICH
DIFFIC
ULT
AIR
ST
EM
S
PO
OR
DE
SIG
N
NO
RE
CO
RD
OF
TIRE
PR
ES
SU
RE
PO
OR
TRA
ININ
G
“WH
EN
INR
OM
E”
NO
OW
NE
R’S
MA
NU
AL
DO
N’T K
NO
WR
EC
OM
ME
ND
ED
OC
TAN
E
NO
OIL
CH
AN
GE
$
WR
ON
GO
IL
DO
N’T K
NO
WR
IGH
T OIL
NO
OW
NE
R’S
MA
NU
AL
PO
OR
MA
INTE
NA
NC
E
CA
US
E-A
ND
-EFFE
CT D
IAG
RA
MV
IEW
GR
AP
H 9
Exam
ple of How
the Cause-and-E
ffect Diagram
Could B
e Constructed for the D
etailed Exercise
COM
PUTERDO
WNTIM
E
SO
FTWA
RE
US
ER
S
HA
RD
WA
RE
EN
VIR
ON
ME
NT
FAU
LTYD
ES
IGN
FAU
LTY M
ED
IA
MIS
AP
PLIC
ATIO
N O
F SO
FTWA
RE
INA
DE
QU
ATE
PO
WE
RTE
MP
ER
ATU
RE
GR
AD
IEN
TS
ME
CH
AN
ICA
LS
HO
CK
HU
MID
ITY
CO
RR
OS
ION
INA
DE
QU
ATE
D
OC
UM
EN
TATIO
N
FAU
LTY
INS
TALLA
TION
PO
WE
RFLU
CTU
ATIO
NS
CO
MP
ON
EN
TFA
ILUR
E
LAC
K O
FTR
AIN
ING
AB
US
E O
FH
AR
DW
AR
E
MIS
US
E O
FH
AR
DW
AR
E
FAU
LTY
CO
MP
ON
EN
T


![Qcl 14-v3 [cause effect diagram-[banasthali uni]_[anjali taneja].ppt](https://img.pdfslide.net/doc/110x75/55ade21f1a28ab73518b457d/qcl-14-v3-cause-effect-diagram-banasthali-unianjali-tanejappt.jpg)

![Qcl 14-v3 [cause-effect diagram]-[parinita dwivedi]_[banasthali university]](https://img.pdfslide.net/doc/110x75/55a773761a28abb2298b4792/qcl-14-v3-cause-effect-diagram-parinita-dwivedibanasthali-university.jpg)

![Qcl 14-v3 [cause-effect diagram]-[banasthali university]_[shreya gupta]](https://img.pdfslide.net/doc/110x75/55a58ed61a28ab636c8b4674/qcl-14-v3-cause-effect-diagram-banasthali-universityshreya-gupta.jpg)