Embed Size (px)
Citation preview
CDP CDP 2015 Climate Change 2015 Information Request
SolarWorld AG
Module: Introduction
Page: Introduction
CC0.1
Introduction
Please give a general description and introduction to your organization. SolarWorld REAL VALUE: SolarWorld manufactures and sells high-tech solar power solutions and in doing so contributes to a cleaner energy supply worldwide. The group, headquartered in Bonn, Germany, employs approximately 3,400 people and carries out production in Freiberg, Germany; Arnstadt, Germany; and Hillsboro, USA. From raw material silicon to solar wafers, cells and modules, SolarWorld manages all stages of production ‒ including its own research and development. Through an international distribution network with locations in Europe, USA, Singapore and South Africa, SolarWorld supplies customers all over the world. The company maintains high social standards at all locations across the globe, and has committed itself to resource- and energy-efficient production. SolarWorld was founded in 1998 and has been publically traded on the stock market since 1999.
CC0.2
Reporting Year
Please state the start and end date of the year for which you are reporting data. The current reporting year is the latest/most recent 12-month period for which data is reported. Enter the dates of this year first. We request data for more than one reporting period for some emission accounting questions. Please provide data for the three years prior to the current reporting year if you have not provided this information before, or if this is the first time you have answered a CDP information request. (This does not apply if you have been offered and selected the option of answering the shorter questionnaire). If you are going to provide additional years of data, please give the dates of those reporting periods here. Work backwards from the most recent reporting year. Please enter dates in following format: day(DD)/month(MM)/year(YYYY) (i.e. 31/01/2001).
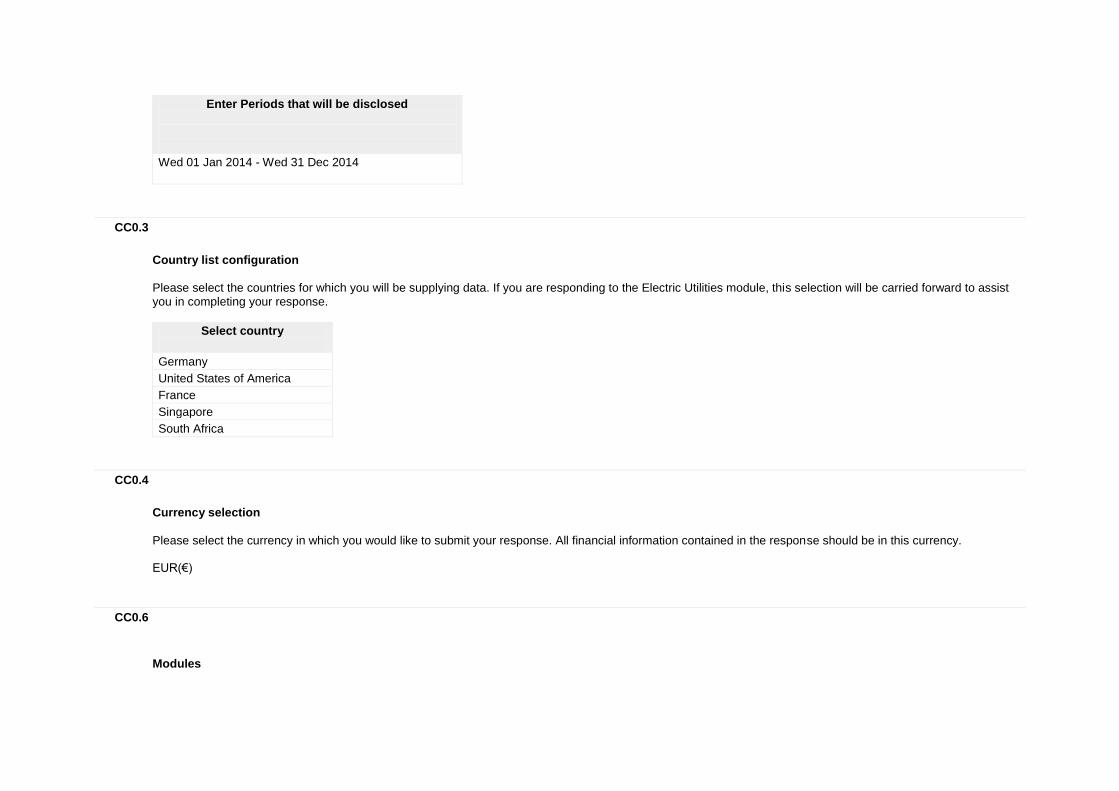
Enter Periods that will be disclosed
Wed 01 Jan 2014 - Wed 31 Dec 2014
CC0.3
Country list configuration
Please select the countries for which you will be supplying data. If you are responding to the Electric Utilities module, this selection will be carried forward to assist you in completing your response.
Select country
Germany
United States of America
France
Singapore
South Africa
CC0.4
Currency selection
Please select the currency in which you would like to submit your response. All financial information contained in the response should be in this currency. EUR(€)
CC0.6
Modules
As part of the request for information on behalf of investors, electric utilities, companies with electric utility activities or assets, companies in the automobile or auto component manufacture sub-industries, companies in the oil and gas sub-industries, companies in the information technology and telecommunications sectors and companies in the food, beverage and tobacco industry group should complete supplementary questions in addition to the main questionnaire. If you are in these sector groupings (according to the Global Industry Classification Standard (GICS)), the corresponding sector modules will not appear below but will automatically appear in the navigation bar when you save this page. If you want to query your classification, please email [email protected]. If you have not been presented with a sector module that you consider would be appropriate for your company to answer, please select the module below. If you wish to view the questions first, please see https://www.cdp.net/en-US/Programmes/Pages/More-questionnaires.aspx.
Further Information
Module: Management
Page: CC1. Governance
CC1.1
Where is the highest level of direct responsibility for climate change within your organization?
Board or individual/sub-set of the Board or other committee appointed by the Board
CC1.1a
Please identify the position of the individual or name of the committee with this responsibility
Climate change is a topic which is managed by the Management Board as well as by the areas Sustainability and QHSE. The entire Management Board commits itself to sustainability and compliance. In particular, these two topics are within the responsibility of the Chief Information, Brand & Personnel Officer in the Management Board. The Global Manager Sustainability & Global Compliance Officer reports directly to the Chief Information, Brand & Personnel Officer. The responsibility for the group's environmental management lies with the Head of Quality, Health, Safety and Environment (QHSE) who reports directly to the Chief Product Officer in the Management Board. In the framework of SolarWorld's Environmental Management System, a monitoring system has been introduced that controls the environmental performance and fulfilment of established environmental targets. The Board and the relevant executive bodies of each subsidiary are given reports of the actual target achievements within this monitoring system and are responsible for controlling target achievement. SolarWorld’s greenhouse gas (GHG) emission intensity is one of these environmental targets. The environmental targets are also part of SolarWorld's groupwide sustainability strategy.
CC1.2
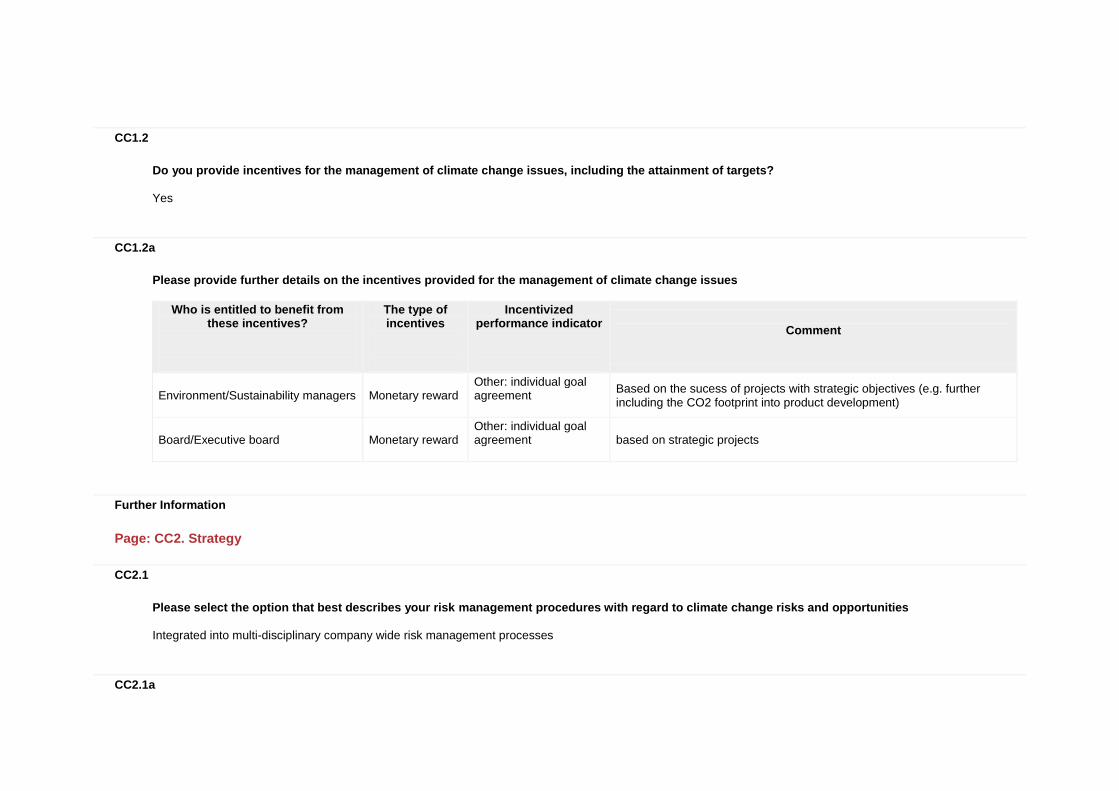
Do you provide incentives for the management of climate change issues, including the attainment of targets?
Yes
CC1.2a
Please provide further details on the incentives provided for the management of climate change issues
Who is entitled to benefit from these incentives?
The type of incentives
Incentivized performance indicator
Comment
Environment/Sustainability managers Monetary reward Other: individual goal agreement
Based on the sucess of projects with strategic objectives (e.g. further including the CO2 footprint into product development)
Board/Executive board Monetary reward Other: individual goal agreement
based on strategic projects
Further Information
Page: CC2. Strategy
CC2.1
Please select the option that best describes your risk management procedures with regard to climate change risks and opportunities
Integrated into multi-disciplinary company wide risk management processes
CC2.1a
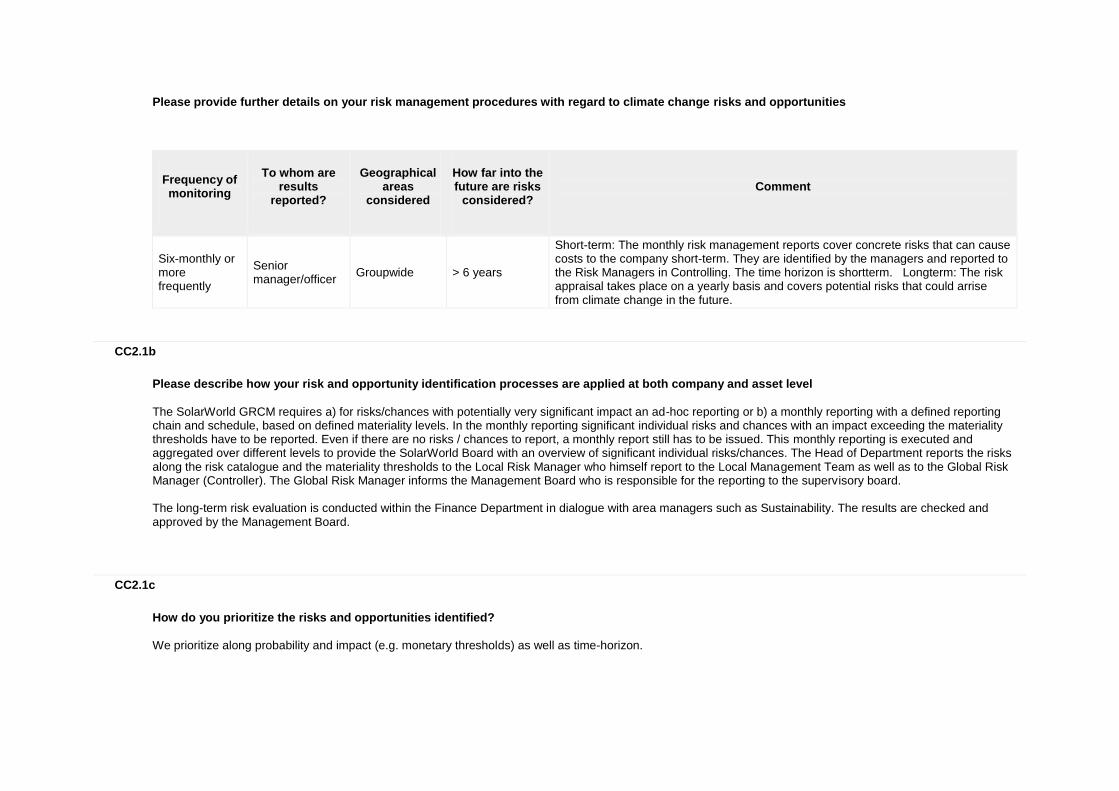
Please provide further details on your risk management procedures with regard to climate change risks and opportunities
Frequency of monitoring
To whom are
results reported?
Geographical
areas considered
How far into the future are risks
considered?
Comment
Six-monthly or more frequently
Senior manager/officer
Groupwide > 6 years
Short-term: The monthly risk management reports cover concrete risks that can cause costs to the company short-term. They are identified by the managers and reported to the Risk Managers in Controlling. The time horizon is shortterm. Longterm: The risk appraisal takes place on a yearly basis and covers potential risks that could arrise from climate change in the future.
CC2.1b
Please describe how your risk and opportunity identification processes are applied at both company and asset level
The SolarWorld GRCM requires a) for risks/chances with potentially very significant impact an ad-hoc reporting or b) a monthly reporting with a defined reporting chain and schedule, based on defined materiality levels. In the monthly reporting significant individual risks and chances with an impact exceeding the materiality thresholds have to be reported. Even if there are no risks / chances to report, a monthly report still has to be issued. This monthly reporting is executed and aggregated over different levels to provide the SolarWorld Board with an overview of significant individual risks/chances. The Head of Department reports the risks along the risk catalogue and the materiality thresholds to the Local Risk Manager who himself report to the Local Management Team as well as to the Global Risk Manager (Controller). The Global Risk Manager informs the Management Board who is responsible for the reporting to the supervisory board. The long-term risk evaluation is conducted within the Finance Department in dialogue with area managers such as Sustainability. The results are checked and approved by the Management Board.
CC2.1c
How do you prioritize the risks and opportunities identified?
We prioritize along probability and impact (e.g. monetary thresholds) as well as time-horizon.
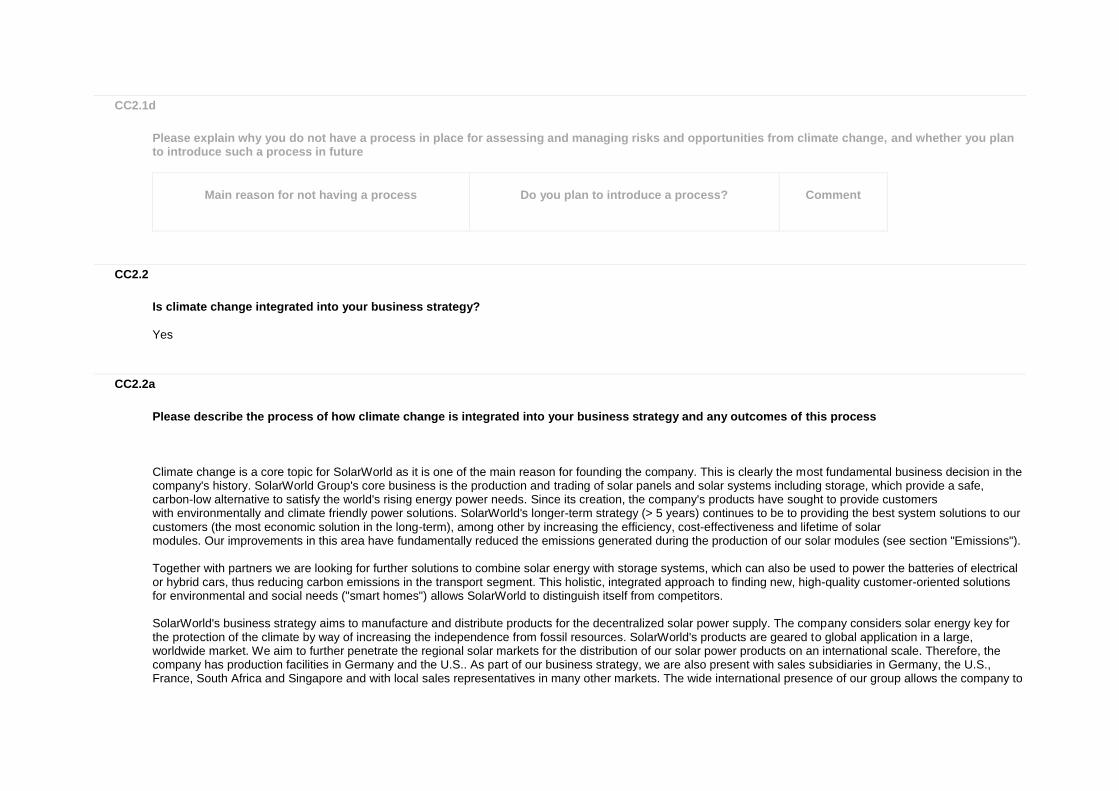
CC2.1d
Please explain why you do not have a process in place for assessing and managing risks and opportunities from climate change, and whether you plan to introduce such a process in future
Main reason for not having a process
Do you plan to introduce a process?
Comment
CC2.2
Is climate change integrated into your business strategy?
Yes
CC2.2a
Please describe the process of how climate change is integrated into your business strategy and any outcomes of this process
Climate change is a core topic for SolarWorld as it is one of the main reason for founding the company. This is clearly the most fundamental business decision in the company's history. SolarWorld Group's core business is the production and trading of solar panels and solar systems including storage, which provide a safe, carbon-low alternative to satisfy the world's rising energy power needs. Since its creation, the company's products have sought to provide customers with environmentally and climate friendly power solutions. SolarWorld's longer-term strategy (> 5 years) continues to be to providing the best system solutions to our customers (the most economic solution in the long-term), among other by increasing the efficiency, cost-effectiveness and lifetime of solar modules. Our improvements in this area have fundamentally reduced the emissions generated during the production of our solar modules (see section "Emissions"). Together with partners we are looking for further solutions to combine solar energy with storage systems, which can also be used to power the batteries of electrical or hybrid cars, thus reducing carbon emissions in the transport segment. This holistic, integrated approach to finding new, high-quality customer-oriented solutions for environmental and social needs ("smart homes") allows SolarWorld to distinguish itself from competitors. SolarWorld's business strategy aims to manufacture and distribute products for the decentralized solar power supply. The company considers solar energy key for the protection of the climate by way of increasing the independence from fossil resources. SolarWorld's products are geared to global application in a large, worldwide market. We aim to further penetrate the regional solar markets for the distribution of our solar power products on an international scale. Therefore, the company has production facilities in Germany and the U.S.. As part of our business strategy, we are also present with sales subsidiaries in Germany, the U.S., France, South Africa and Singapore and with local sales representatives in many other markets. The wide international presence of our group allows the company to
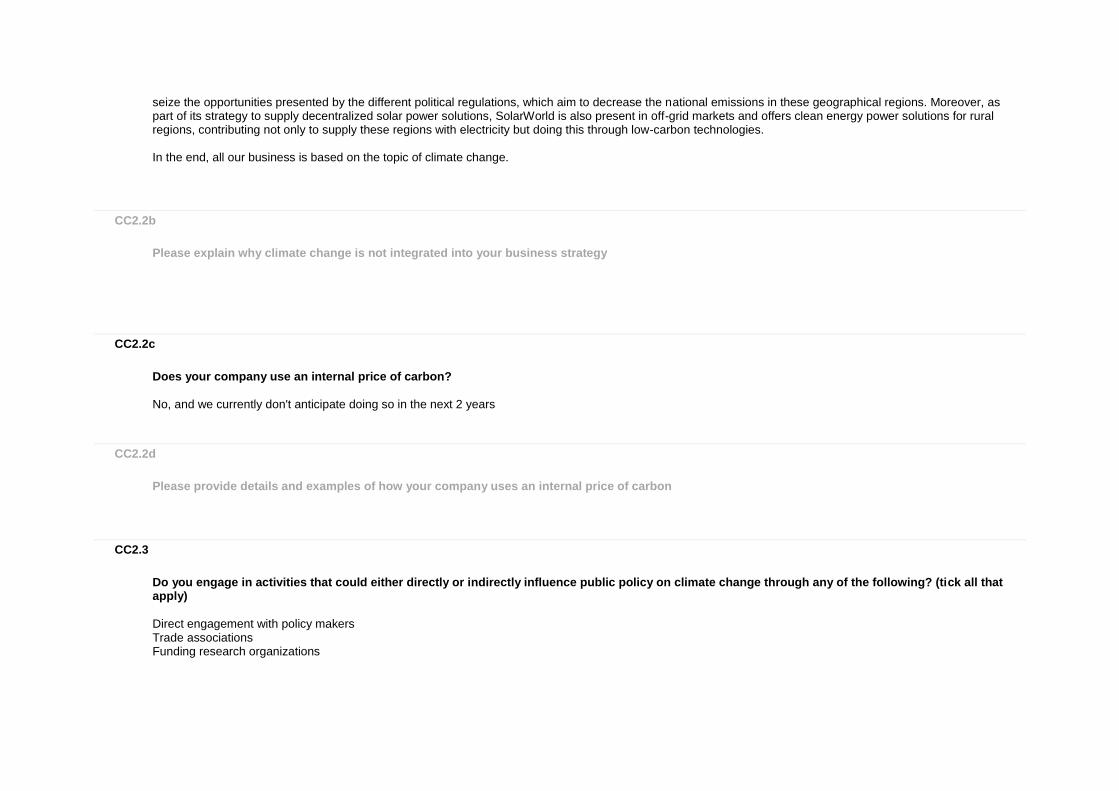
seize the opportunities presented by the different political regulations, which aim to decrease the national emissions in these geographical regions. Moreover, as part of its strategy to supply decentralized solar power solutions, SolarWorld is also present in off-grid markets and offers clean energy power solutions for rural regions, contributing not only to supply these regions with electricity but doing this through low-carbon technologies. In the end, all our business is based on the topic of climate change.
CC2.2b
Please explain why climate change is not integrated into your business strategy
CC2.2c
Does your company use an internal price of carbon?
No, and we currently don't anticipate doing so in the next 2 years
CC2.2d
Please provide details and examples of how your company uses an internal price of carbon
CC2.3
Do you engage in activities that could either directly or indirectly influence public policy on climate change through any of the following? (tick all that apply)
Direct engagement with policy makers Trade associations Funding research organizations
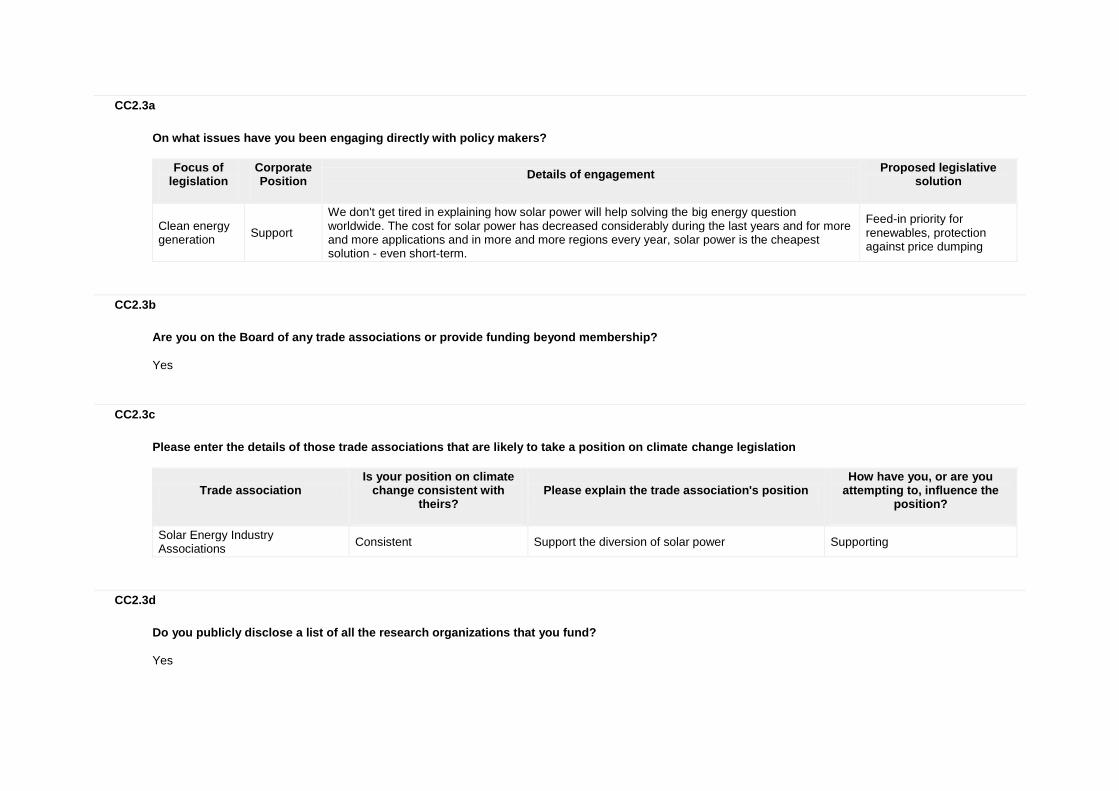
CC2.3a
On what issues have you been engaging directly with policy makers?
Focus of legislation
Corporate Position
Details of engagement
Proposed legislative solution
Clean energy generation
Support
We don't get tired in explaining how solar power will help solving the big energy question worldwide. The cost for solar power has decreased considerably during the last years and for more and more applications and in more and more regions every year, solar power is the cheapest solution - even short-term.
Feed-in priority for renewables, protection against price dumping
CC2.3b
Are you on the Board of any trade associations or provide funding beyond membership?
Yes
CC2.3c
Please enter the details of those trade associations that are likely to take a position on climate change legislation
Trade association
Is your position on climate change consistent with
theirs?
Please explain the trade association's position
How have you, or are you attempting to, influence the
position?
Solar Energy Industry Associations
Consistent Support the diversion of solar power Supporting
CC2.3d
Do you publicly disclose a list of all the research organizations that you fund?
Yes
CC2.3e
Do you fund any research organizations to produce or disseminate public work on climate change?
No
CC2.3f
Please describe the work and how it aligns with your own strategy on climate change
CC2.3g
Please provide details of the other engagement activities that you undertake
CC2.3h
What processes do you have in place to ensure that all of your direct and indirect activities that influence policy are consistent with your overall climate change strategy?
The overall climate change strategy is key to our core business, i.e. it is explicitly part of our vision, our strategy and our goals, initiatives and actions. We consider both the direct impact caused by our company and the impacts in our value chain (life cycle analysis). Comment: There is an ongoing discussion how long-term goals should be with regard to climate change, because the impacts are seen mainly in the long-term. However, to manage a company, to manage people, goals have to stay tangible. This is why we want to achieve our goals by 2020. When a goal has been reached, we set a new goal.
CC2.3i
Please explain why you do not engage with policy makers
CC2.4
Would your organization's board of directors support an international agreement between governments on climate change, which seeks to limit global temperature rise to under two degree Celsius from pre-industrial levels in line with IPCC scenarios such as RCP2.6?
Yes
CC2.4a
Please describe your board's position on what an effective agreement would mean for your organization and activities that you are undertaking to help deliver this agreement at the 2015 United Nations Climate Change Conference in Paris (COP 21)
Such an agreement would very likely be in favor of renewable energy sources, especially solar energy, and thus in line with our strategy. We are actively promoting solar energy and climate protection in the associations listed in our annual group report, page 196-198.
Further Information
Page: CC3. Targets and Initiatives
CC3.1
Did you have an emissions reduction target that was active (ongoing or reached completion) in the reporting year?
Intensity target
CC3.1a
Please provide details of your absolute target
ID
Scope
% of emissions in
scope
% reduction from base year
Base year
Base year emissions
(metric tonnes CO2e)
Target year
Comment
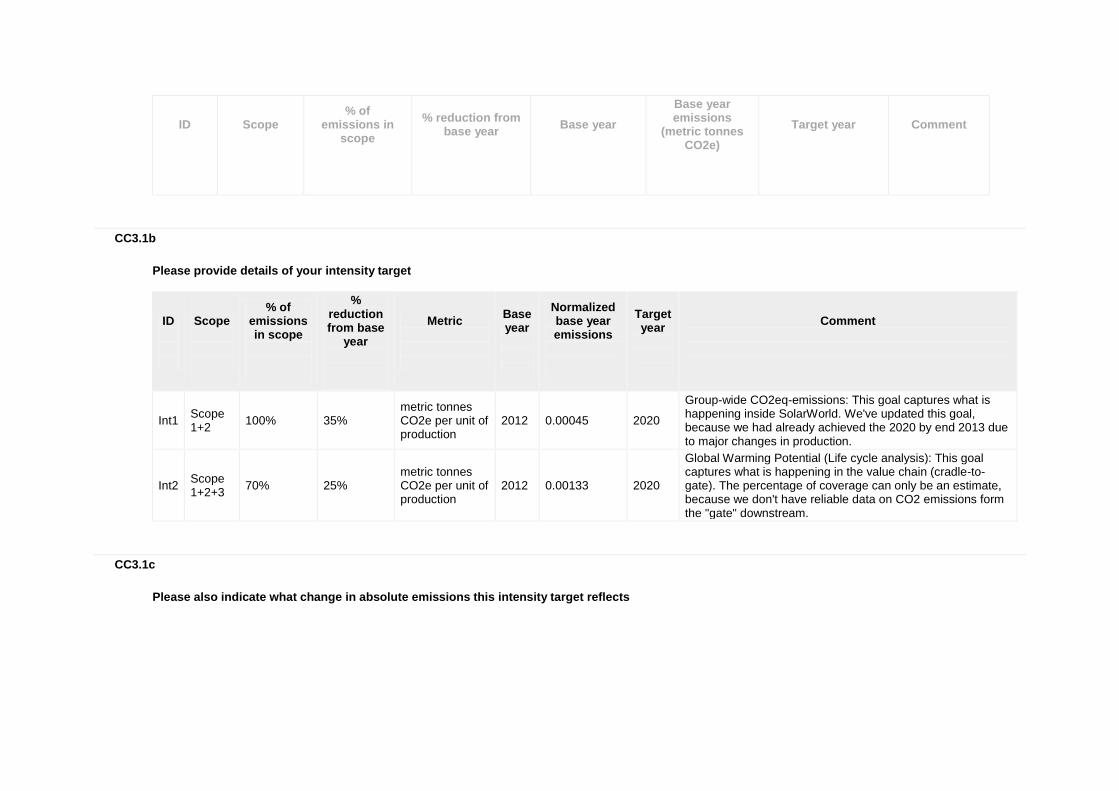
CC3.1b
Please provide details of your intensity target
ID
Scope
% of emissions in scope
% reduction from base
year
Metric
Base year
Normalized base year emissions
Target year
Comment
Int1 Scope 1+2
100% 35% metric tonnes CO2e per unit of production
2012 0.00045 2020
Group-wide CO2eq-emissions: This goal captures what is happening inside SolarWorld. We've updated this goal, because we had already achieved the 2020 by end 2013 due to major changes in production.
Int2 Scope 1+2+3
70% 25% metric tonnes CO2e per unit of production
2012 0.00133 2020
Global Warming Potential (Life cycle analysis): This goal captures what is happening in the value chain (cradle-to-gate). The percentage of coverage can only be an estimate, because we don't have reliable data on CO2 emissions form the "gate" downstream.
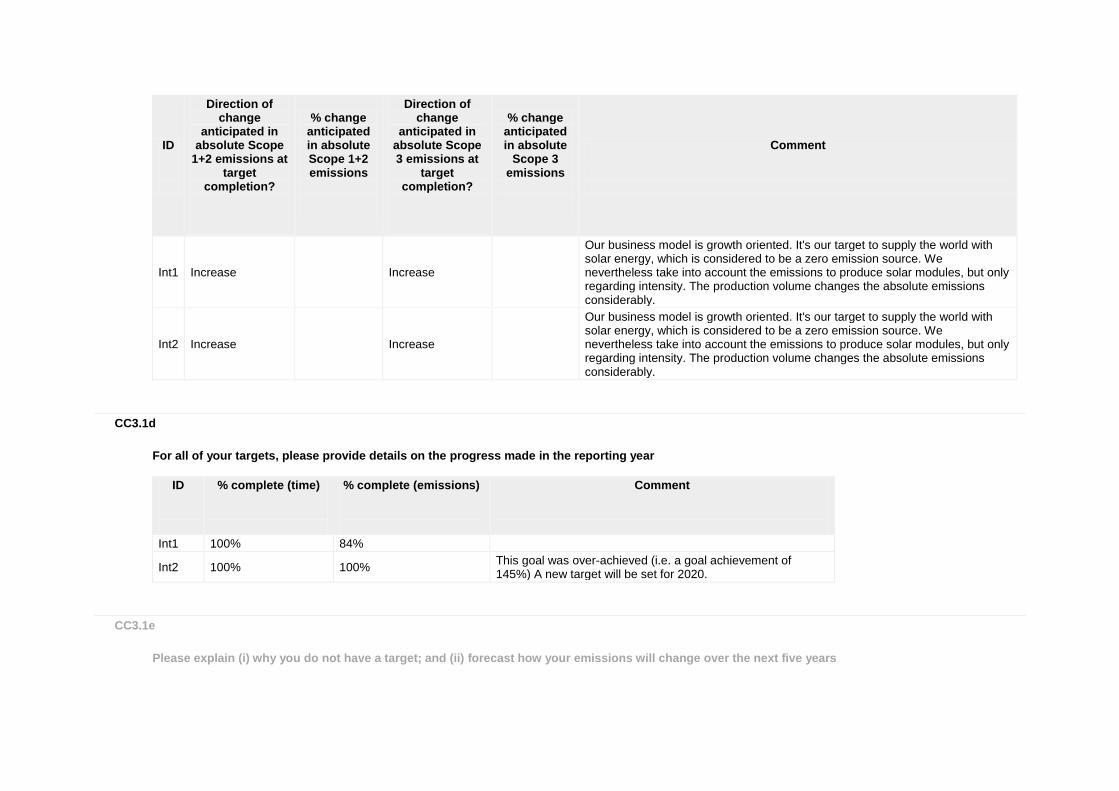
CC3.1c
Please also indicate what change in absolute emissions this intensity target reflects
ID
Direction of change
anticipated in absolute Scope
1+2 emissions at target
completion?
% change anticipated in absolute Scope 1+2 emissions
Direction of change
anticipated in absolute Scope 3 emissions at
target completion?
% change anticipated in absolute
Scope 3 emissions
Comment
Int1 Increase
Increase
Our business model is growth oriented. It's our target to supply the world with solar energy, which is considered to be a zero emission source. We nevertheless take into account the emissions to produce solar modules, but only regarding intensity. The production volume changes the absolute emissions considerably.
Int2 Increase
Increase
Our business model is growth oriented. It's our target to supply the world with solar energy, which is considered to be a zero emission source. We nevertheless take into account the emissions to produce solar modules, but only regarding intensity. The production volume changes the absolute emissions considerably.
CC3.1d
For all of your targets, please provide details on the progress made in the reporting year
ID
% complete (time)
% complete (emissions)
Comment
Int1 100% 84%
Int2 100% 100% This goal was over-achieved (i.e. a goal achievement of 145%) A new target will be set for 2020.
CC3.1e
Please explain (i) why you do not have a target; and (ii) forecast how your emissions will change over the next five years
CC3.2
Does the use of your goods and/or services directly enable GHG emissions to be avoided by a third party?
Yes
CC3.2a
Please provide details of how the use of your goods and/or services directly enable GHG emissions to be avoided by a third party
SolarWorld as a photovoltaic manufacturing company produces solar power modules which help to produce low-carbon electrical power. SolarWorld products offset emissions by giving our clients the opportunity to produce clean electricity instead of consuming the carbon intensive grid or off-grid power. SolarWorld panels help avoid emissions for a period of at least 25 years (timeframe in which SolarWorld guarantees an output range). By feeding the produced clean power into the grid, solar panels help reduce the emissions of the power mix in the region in which they are installed. In the case of self-consumption or off-grid use, the panels help clients to meet their power needs with a totally clean energy source. The energy payback time is the amount of time it takes the solar power plant to produce as much energy as was used to manufacture it. Similarly, the CO2 payback time refers to the time it takes to compensate for the greenhouse gases that were emitted during manufacturing. Our calculations are cradle-to-gate calculations. SolarWorld’s technological progress can be determined from the energy and CO2 payback times. PLEASE CONSIDER: Since new energy mix data are now available for the respective locations, the values have changed in comparison to the previous reporting. Moreover, we include all production sites in the calculation. While it takes two years to compensate for the energy consumption of the entire production process of a system in Bonn, Germany (power yield: 940 kWh/kWp), it only takes less than a year in San Francisco, U.S. (power yield: 1,670 kWh/kWp). By comparison, the energy payback time was 3.5 years according to a study by ESU-services in 2008. CO2 emissions are compensated for in less than two years in San Francisco, while it takes eleven years in Grenoble, France (power yield: 1,250 kWh/kWp) due to the high percentage of nuclear power in the French energy mix. These calculations come from our life cycle analysis for our solar modules (not including system components), installed on a roof with a southerly orientation and an optimum inclination with an average module lifespan of 30 years. Thanks to the volume of solar power modules sold in 2014, an energy surplus of 30,941 (2013: 20,116) GWh can be achieved during a lifetime of 30 years. Some 14.71 (2013: 8.41) million tCO2eq can be saved as a result. The costs for environmental damage avoided total around € 1,029 (2013: 589) million. The CO2 emissions avoided exceed the CO2 emissions caused along the entire production chain by a factor of 21 (2013: factor of 14). Since we have no exact information about how and where our modules are installed, our calculations are based on a standardized installation in Germany (1,275 kWh/m²).
We are not considering generating CERs or ERUs within the framework of CDM or JI (UNFCCC).
CC3.3
Did you have emissions reduction initiatives that were active within the reporting year (this can include those in the planning and/or implementation phases)
Yes
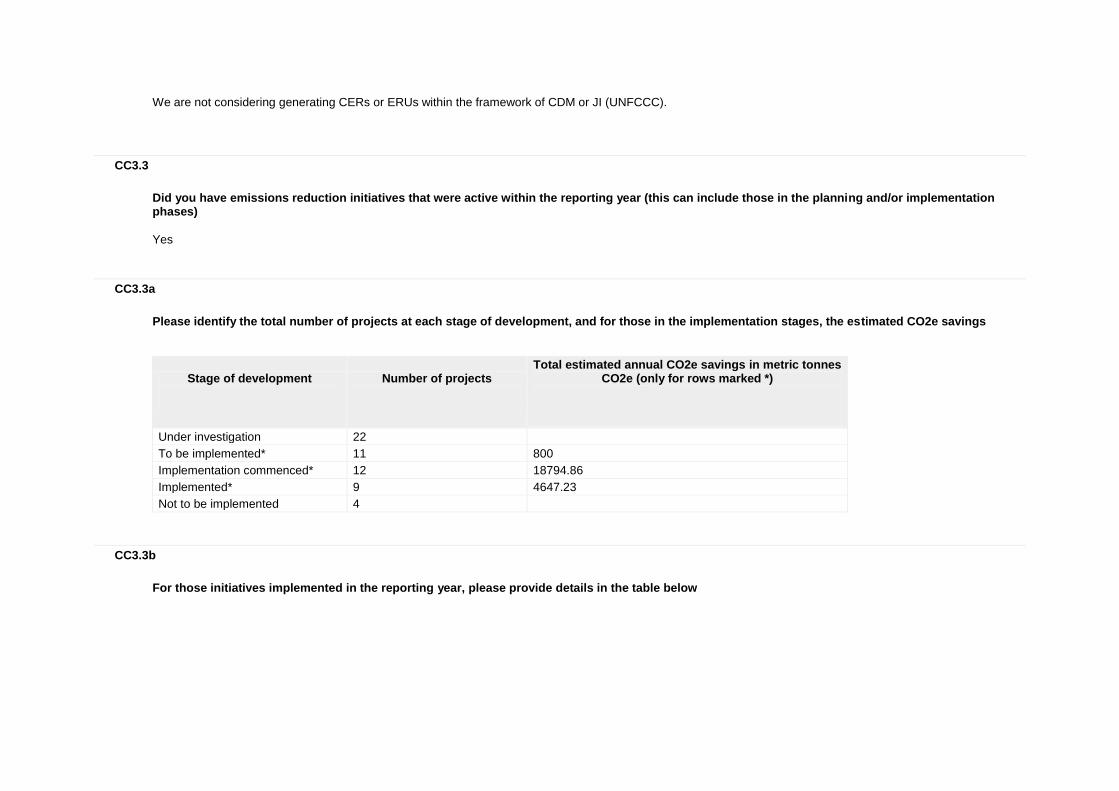
CC3.3a
Please identify the total number of projects at each stage of development, and for those in the implementation stages, the estimated CO2e savings
Stage of development
Number of projects
Total estimated annual CO2e savings in metric tonnes CO2e (only for rows marked *)
Under investigation 22
To be implemented* 11 800
Implementation commenced* 12 18794.86
Implemented* 9 4647.23
Not to be implemented 4
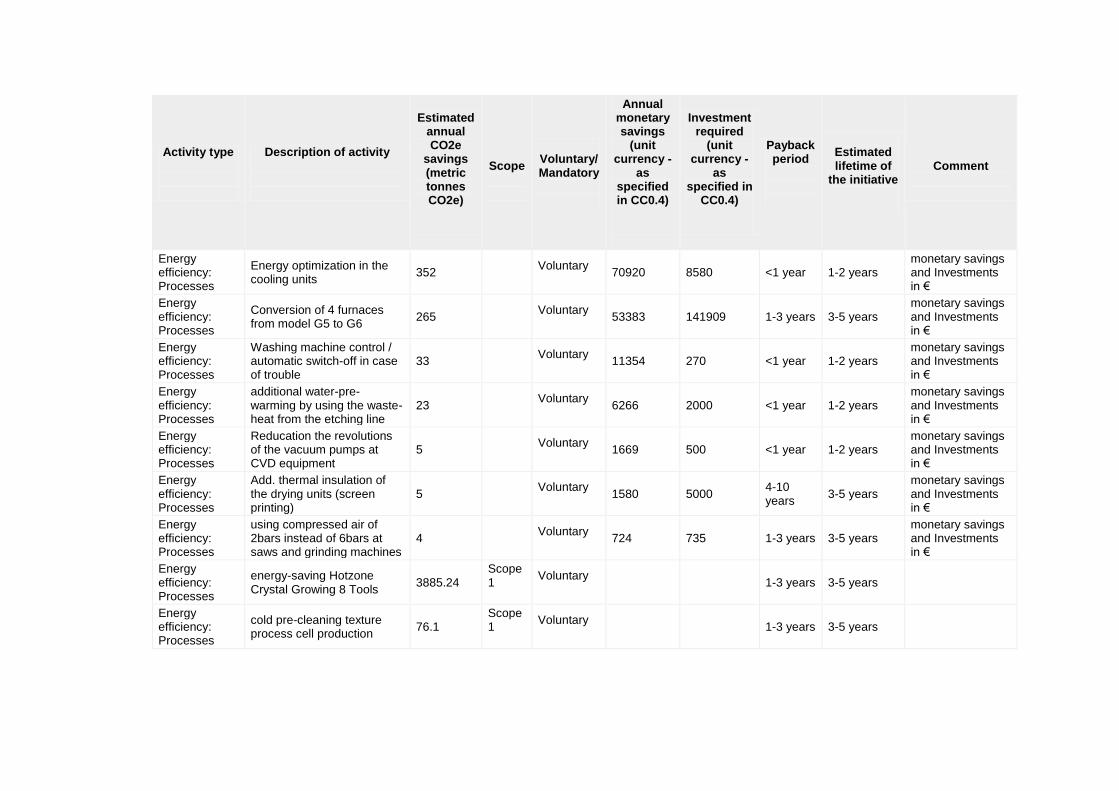
CC3.3b
For those initiatives implemented in the reporting year, please provide details in the table below
Activity type
Description of activity
Estimated annual CO2e
savings (metric tonnes CO2e)
Scope
Voluntary/ Mandatory
Annual monetary savings
(unit currency -
as specified in CC0.4)
Investment required
(unit currency -
as specified in
CC0.4)
Payback period
Estimated lifetime of
the initiative
Comment
Energy efficiency: Processes
Energy optimization in the cooling units
352
Voluntary
70920 8580 <1 year 1-2 years monetary savings and Investments in €
Energy efficiency: Processes
Conversion of 4 furnaces from model G5 to G6
265
Voluntary
53383 141909 1-3 years 3-5 years monetary savings and Investments in €
Energy efficiency: Processes
Washing machine control / automatic switch-off in case of trouble
33
Voluntary
11354 270 <1 year 1-2 years monetary savings and Investments in €
Energy efficiency: Processes
additional water-pre-warming by using the waste-heat from the etching line
23
Voluntary
6266 2000 <1 year 1-2 years monetary savings and Investments in €
Energy efficiency: Processes
Reducation the revolutions of the vacuum pumps at CVD equipment
5
Voluntary
1669 500 <1 year 1-2 years monetary savings and Investments in €
Energy efficiency: Processes
Add. thermal insulation of the drying units (screen printing)
5
Voluntary
1580 5000 4-10 years
3-5 years monetary savings and Investments in €
Energy efficiency: Processes
using compressed air of 2bars instead of 6bars at saws and grinding machines
4
Voluntary
724 735 1-3 years 3-5 years monetary savings and Investments in €
Energy efficiency: Processes
energy-saving Hotzone Crystal Growing 8 Tools
3885.24 Scope 1
Voluntary
1-3 years 3-5 years
Energy efficiency: Processes
cold pre-cleaning texture process cell production
76.1 Scope 1
Voluntary
1-3 years 3-5 years
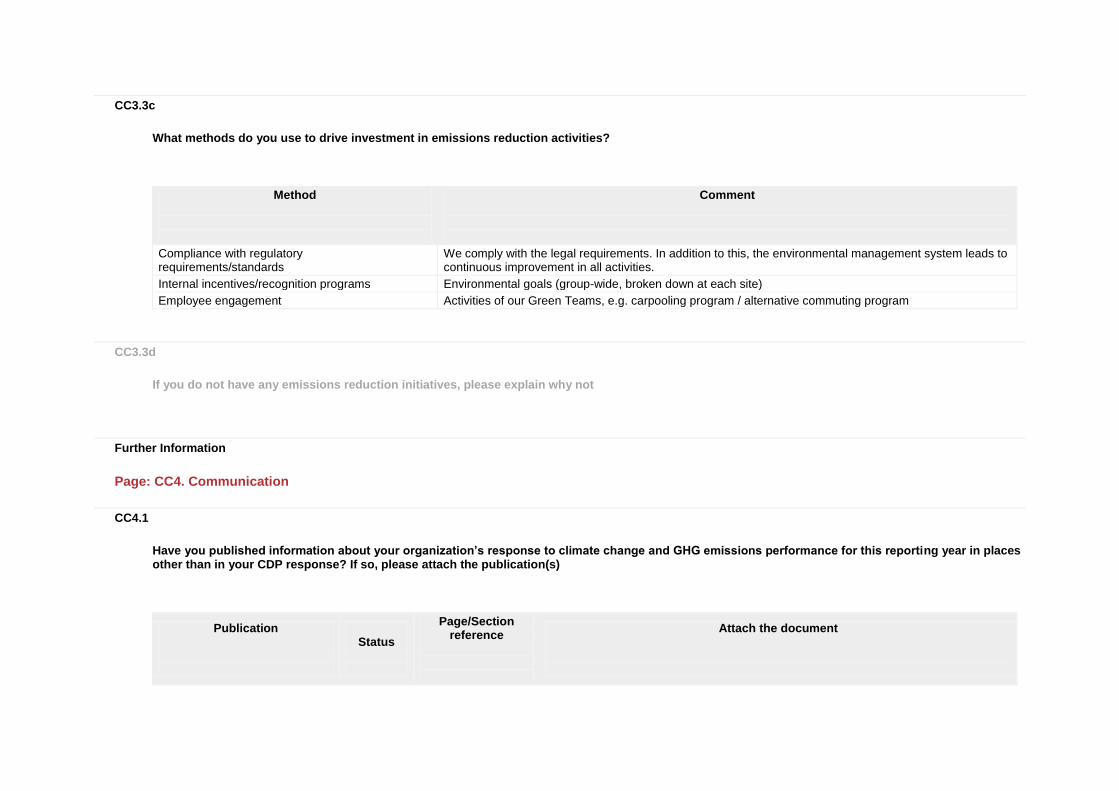
CC3.3c
What methods do you use to drive investment in emissions reduction activities?
Method
Comment
Compliance with regulatory requirements/standards
We comply with the legal requirements. In addition to this, the environmental management system leads to continuous improvement in all activities.
Internal incentives/recognition programs Environmental goals (group-wide, broken down at each site)
Employee engagement Activities of our Green Teams, e.g. carpooling program / alternative commuting program
CC3.3d
If you do not have any emissions reduction initiatives, please explain why not
Further Information
Page: CC4. Communication
CC4.1
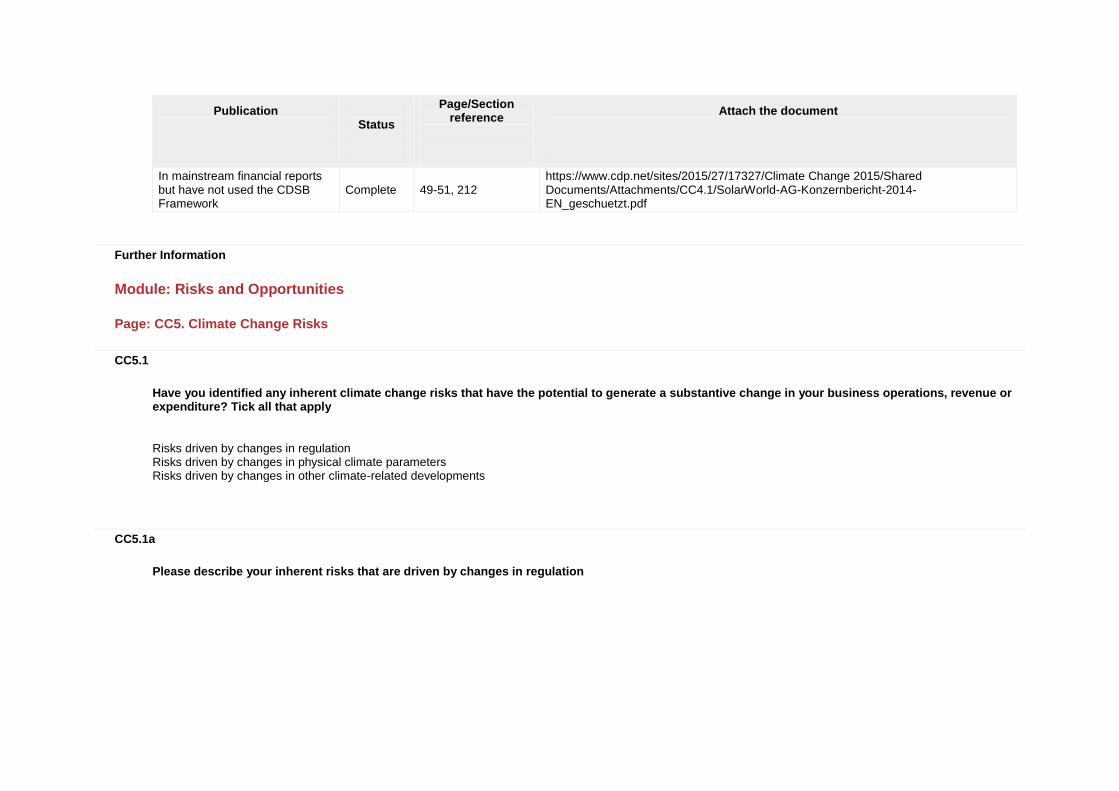
Have you published information about your organization’s response to climate change and GHG emissions performance for this reporting year in places other than in your CDP response? If so, please attach the publication(s)
Publication
Status
Page/Section reference
Attach the document
Publication
Status
Page/Section reference
Attach the document
In mainstream financial reports but have not used the CDSB Framework
Complete 49-51, 212 https://www.cdp.net/sites/2015/27/17327/Climate Change 2015/Shared Documents/Attachments/CC4.1/SolarWorld-AG-Konzernbericht-2014-EN_geschuetzt.pdf
Further Information
Module: Risks and Opportunities
Page: CC5. Climate Change Risks
CC5.1
Have you identified any inherent climate change risks that have the potential to generate a substantive change in your business operations, revenue or expenditure? Tick all that apply
Risks driven by changes in regulation Risks driven by changes in physical climate parameters Risks driven by changes in other climate-related developments
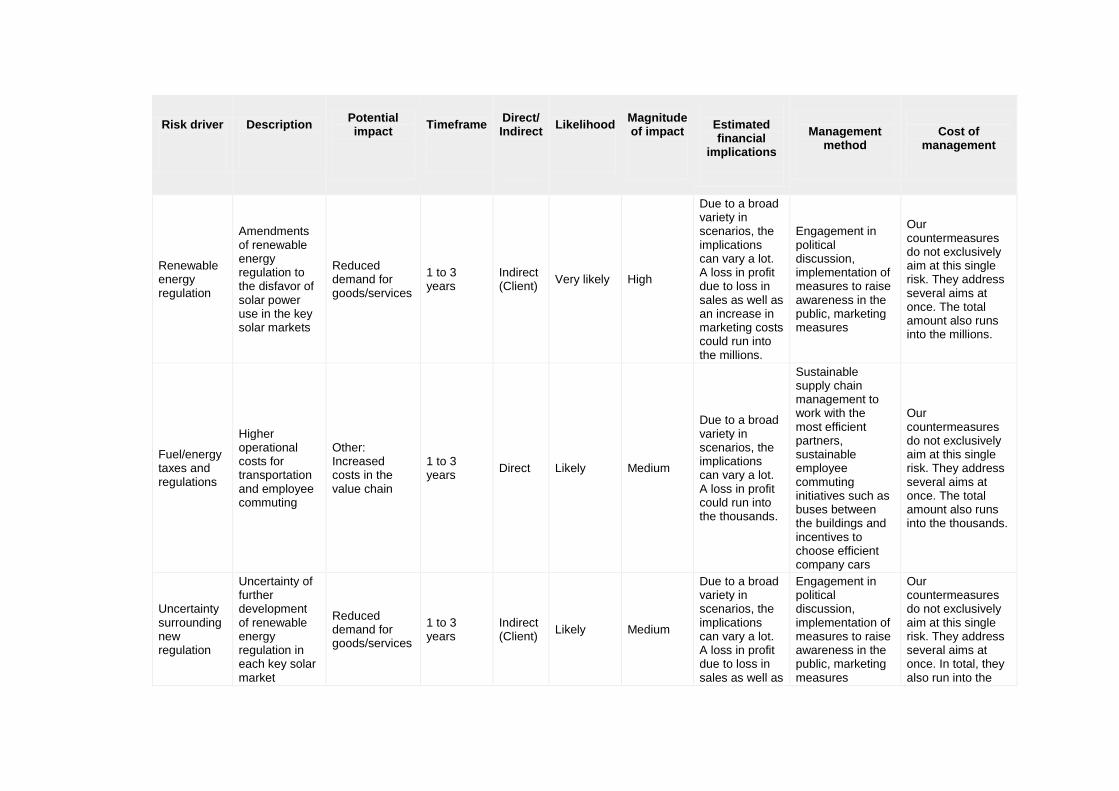
CC5.1a
Please describe your inherent risks that are driven by changes in regulation
Risk driver
Description
Potential impact
Timeframe
Direct/ Indirect
Likelihood
Magnitude of impact
Estimated financial
implications
Management
method
Cost of
management
Renewable energy regulation
Amendments of renewable energy regulation to the disfavor of solar power use in the key solar markets
Reduced demand for goods/services
1 to 3 years
Indirect (Client)
Very likely High
Due to a broad variety in scenarios, the implications can vary a lot. A loss in profit due to loss in sales as well as an increase in marketing costs could run into the millions.
Engagement in political discussion, implementation of measures to raise awareness in the public, marketing measures
Our countermeasures do not exclusively aim at this single risk. They address several aims at once. The total amount also runs into the millions.
Fuel/energy taxes and regulations
Higher operational costs for transportation and employee commuting
Other: Increased costs in the value chain
1 to 3 years
Direct Likely Medium
Due to a broad variety in scenarios, the implications can vary a lot. A loss in profit could run into the thousands.
Sustainable supply chain management to work with the most efficient partners, sustainable employee commuting initiatives such as buses between the buildings and incentives to choose efficient company cars
Our countermeasures do not exclusively aim at this single risk. They address several aims at once. The total amount also runs into the thousands.
Uncertainty surrounding new regulation
Uncertainty of further development of renewable energy regulation in each key solar market
Reduced demand for goods/services
1 to 3 years
Indirect (Client)
Likely Medium
Due to a broad variety in scenarios, the implications can vary a lot. A loss in profit due to loss in sales as well as
Engagement in political discussion, implementation of measures to raise awareness in the public, marketing measures
Our countermeasures do not exclusively aim at this single risk. They address several aims at once. In total, they also run into the
Risk driver
Description
Potential impact
Timeframe
Direct/ Indirect
Likelihood
Magnitude of impact
Estimated financial
implications
Management
method
Cost of
management
an increase in marketing costs could run into the millions.
millions.
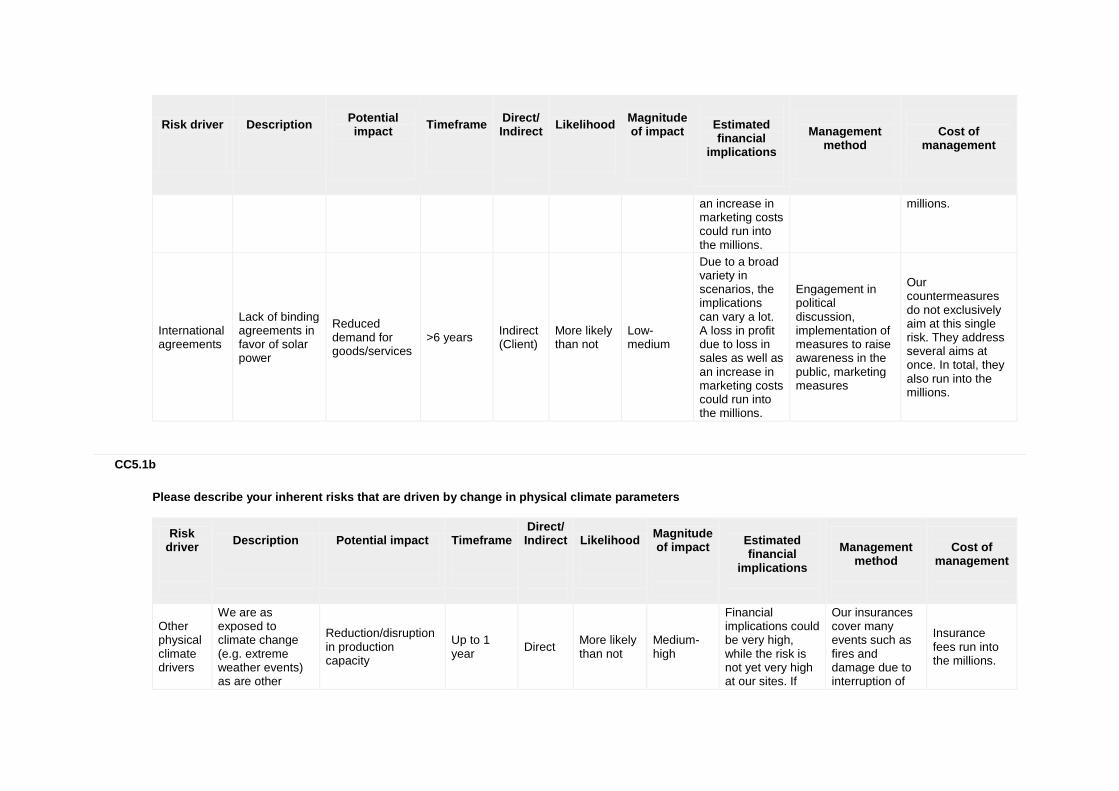
International agreements
Lack of binding agreements in favor of solar power
Reduced demand for goods/services
>6 years Indirect (Client)
More likely than not
Low-medium
Due to a broad variety in scenarios, the implications can vary a lot. A loss in profit due to loss in sales as well as an increase in marketing costs could run into the millions.
Engagement in political discussion, implementation of measures to raise awareness in the public, marketing measures
Our countermeasures do not exclusively aim at this single risk. They address several aims at once. In total, they also run into the millions.
CC5.1b
Please describe your inherent risks that are driven by change in physical climate parameters
Risk driver
Description
Potential impact
Timeframe
Direct/ Indirect
Likelihood
Magnitude of impact
Estimated financial
implications
Management
method
Cost of
management
Other physical climate drivers
We are as exposed to climate change (e.g. extreme weather events) as are other
Reduction/disruption in production capacity
Up to 1 year
Direct More likely than not
Medium-high
Financial implications could be very high, while the risk is not yet very high at our sites. If
Our insurances cover many events such as fires and damage due to interruption of
Insurance fees run into the millions.
Risk driver
Description
Potential impact
Timeframe
Direct/ Indirect
Likelihood
Magnitude of impact
Estimated financial
implications
Management
method
Cost of
management
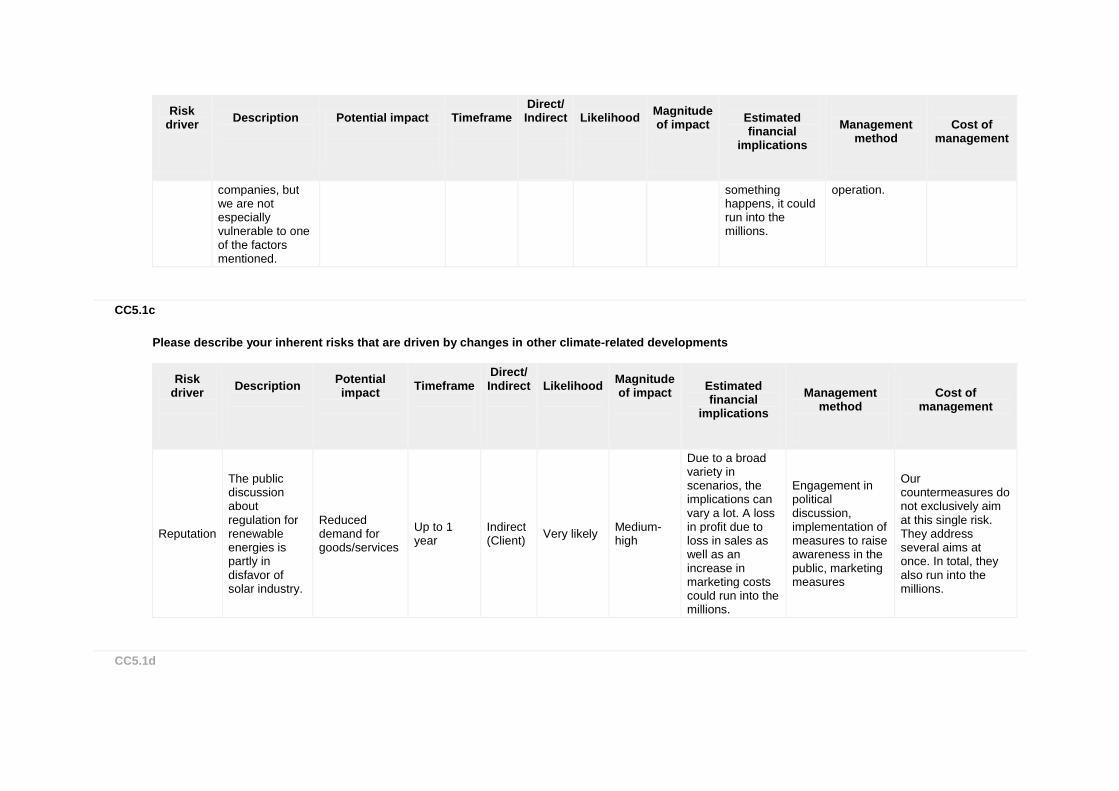
companies, but we are not especially vulnerable to one of the factors mentioned.
something happens, it could run into the millions.
operation.
CC5.1c
Please describe your inherent risks that are driven by changes in other climate-related developments
Risk driver
Description
Potential impact
Timeframe
Direct/ Indirect
Likelihood
Magnitude of impact
Estimated financial
implications
Management
method
Cost of
management
Reputation
The public discussion about regulation for renewable energies is partly in disfavor of solar industry.
Reduced demand for goods/services
Up to 1 year
Indirect (Client)
Very likely Medium-high
Due to a broad variety in scenarios, the implications can vary a lot. A loss in profit due to loss in sales as well as an increase in marketing costs could run into the millions.
Engagement in political discussion, implementation of measures to raise awareness in the public, marketing measures
Our countermeasures do not exclusively aim at this single risk. They address several aims at once. In total, they also run into the millions.
CC5.1d
Please explain why you do not consider your company to be exposed to inherent risks driven by changes in regulation that have the potential to generate a substantive change in your business operations, revenue or expenditure
CC5.1e
Please explain why you do not consider your company to be exposed to inherent risks driven by physical climate parameters that have the potential to generate a substantive change in your business operations, revenue or expenditure
CC5.1f
Please explain why you do not consider your company to be exposed to inherent risks driven by changes in other climate-related developments that have the potential to generate a substantive change in your business operations, revenue or expenditure
Further Information
Page: CC6. Climate Change Opportunities
CC6.1
Have you identified any inherent climate change opportunities that have the potential to generate a substantive change in your business operations, revenue or expenditure? Tick all that apply
Opportunities driven by changes in regulation Opportunities driven by changes in physical climate parameters
Opportunities driven by changes in other climate-related developments
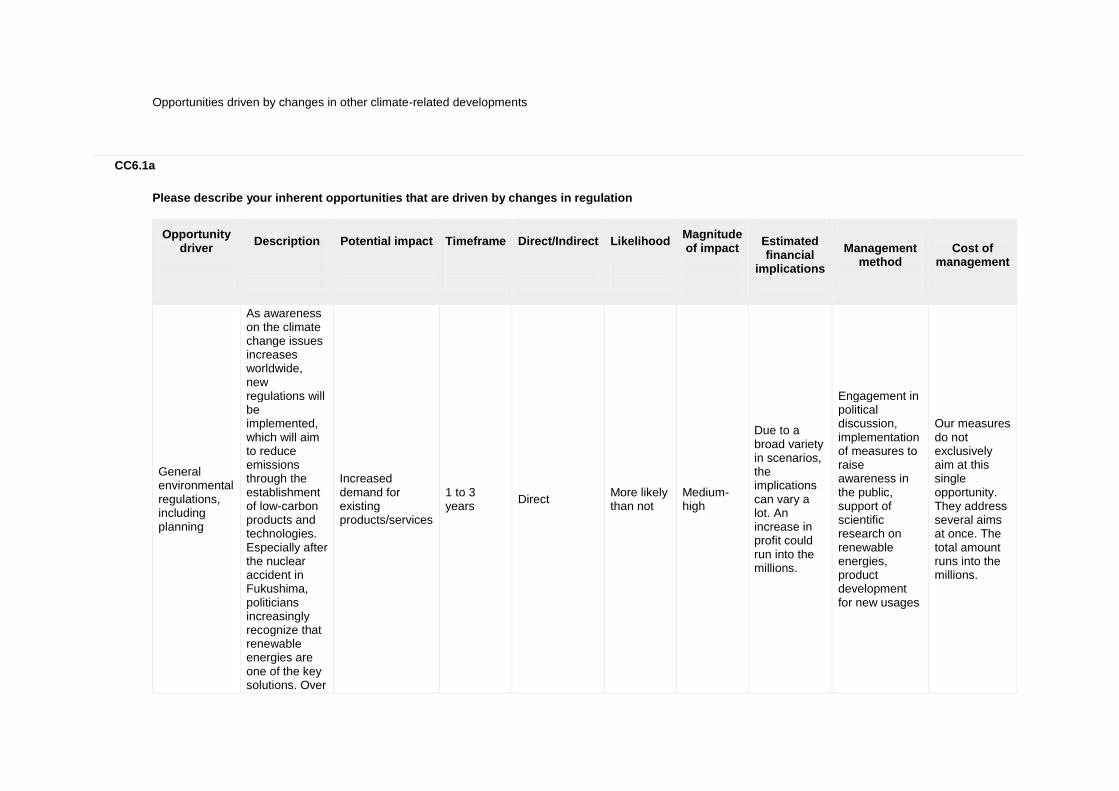
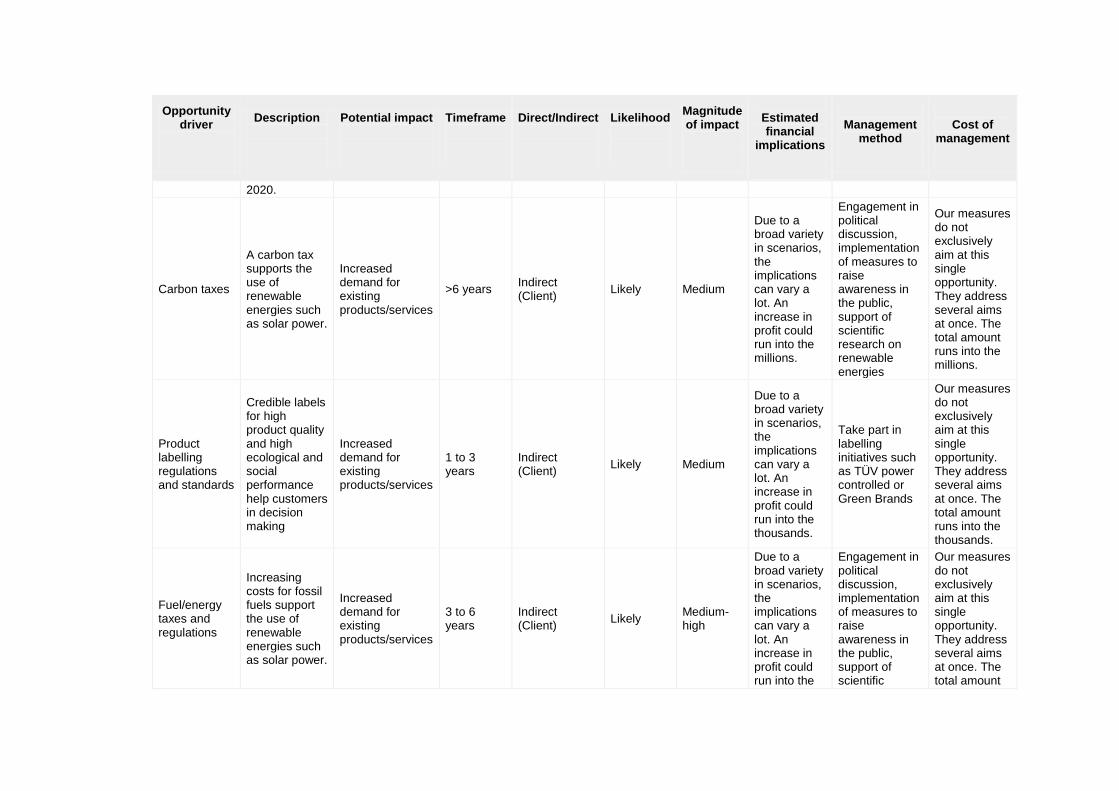
CC6.1a
Please describe your inherent opportunities that are driven by changes in regulation
Opportunity driver
Description
Potential impact
Timeframe
Direct/Indirect
Likelihood
Magnitude of impact
Estimated financial
implications
Management
method
Cost of
management
General environmental regulations, including planning
As awareness on the climate change issues increases worldwide, new regulations will be implemented, which will aim to reduce emissions through the establishment of low-carbon products and technologies. Especially after the nuclear accident in Fukushima, politicians increasingly recognize that renewable energies are one of the key solutions. Over
Increased demand for existing products/services
1 to 3 years
Direct More likely than not
Medium-high
Due to a broad variety in scenarios, the implications can vary a lot. An increase in profit could run into the millions.
Engagement in political discussion, implementation of measures to raise awareness in the public, support of scientific research on renewable energies, product development for new usages
Our measures do not exclusively aim at this single opportunity. They address several aims at once. The total amount runs into the millions.
Opportunity driver
Description
Potential impact
Timeframe
Direct/Indirect
Likelihood
Magnitude of impact
Estimated financial
implications
Management
method
Cost of
management
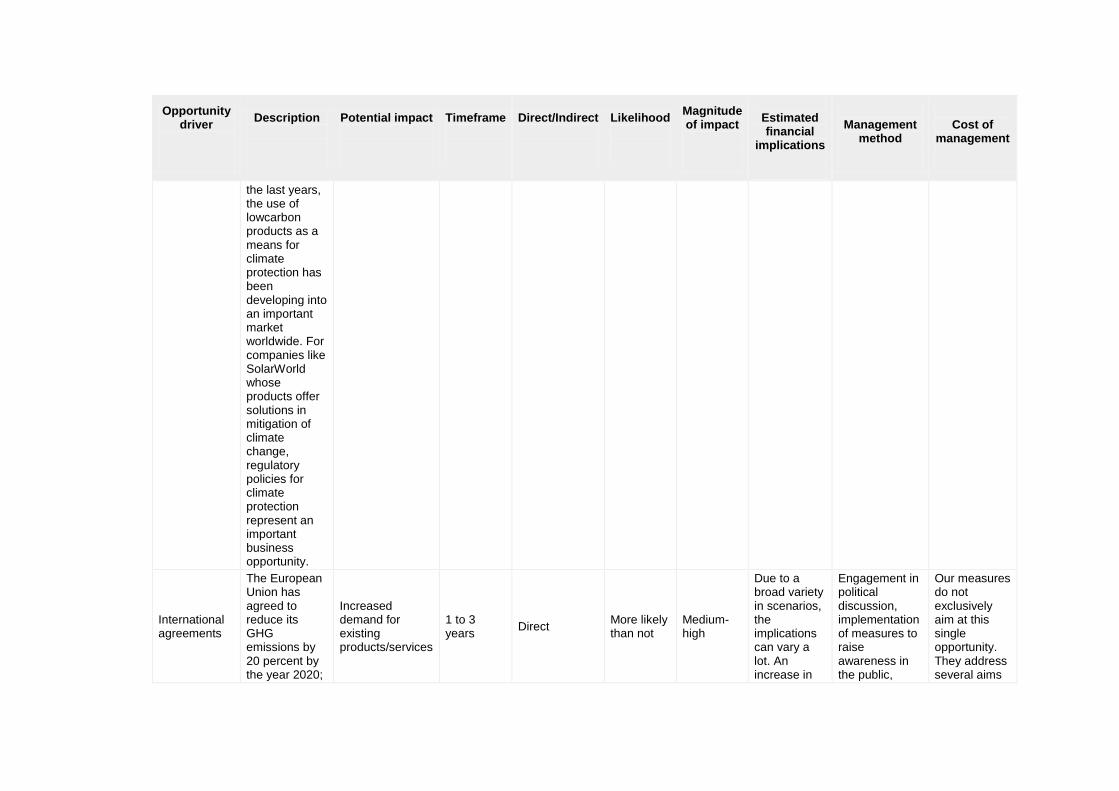
the last years, the use of lowcarbon products as a means for climate protection has been developing into an important market worldwide. For companies like SolarWorld whose products offer solutions in mitigation of climate change, regulatory policies for climate protection represent an important business opportunity.
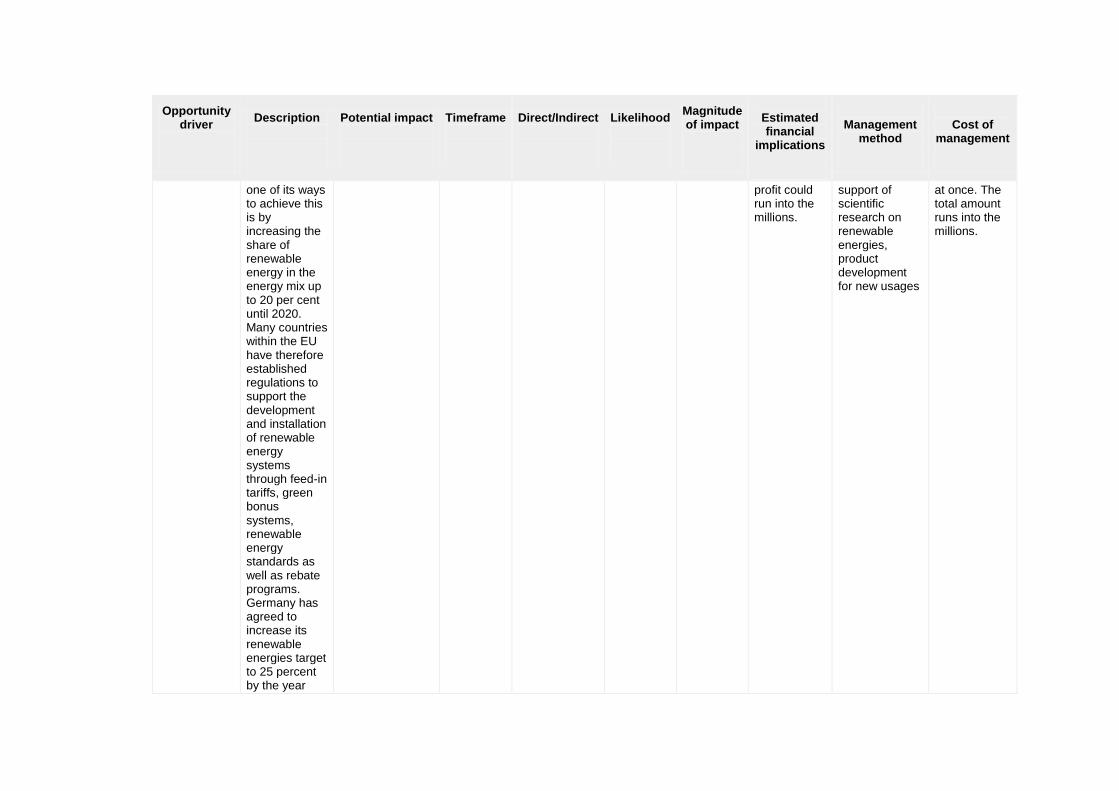
International agreements
The European Union has agreed to reduce its GHG emissions by 20 percent by the year 2020;
Increased demand for existing products/services
1 to 3 years
Direct More likely than not
Medium-high
Due to a broad variety in scenarios, the implications can vary a lot. An increase in
Engagement in political discussion, implementation of measures to raise awareness in the public,
Our measures do not exclusively aim at this single opportunity. They address several aims
Opportunity driver
Description
Potential impact
Timeframe
Direct/Indirect
Likelihood
Magnitude of impact
Estimated financial
implications
Management
method
Cost of
management
one of its ways to achieve this is by increasing the share of renewable energy in the energy mix up to 20 per cent until 2020. Many countries within the EU have therefore established regulations to support the development and installation of renewable energy systems through feed-in tariffs, green bonus systems, renewable energy standards as well as rebate programs. Germany has agreed to increase its renewable energies target to 25 percent by the year
profit could run into the millions.
support of scientific research on renewable energies, product development for new usages
at once. The total amount runs into the millions.
Opportunity driver
Description
Potential impact
Timeframe
Direct/Indirect
Likelihood
Magnitude of impact
Estimated financial
implications
Management
method
Cost of
management
2020.
Carbon taxes
A carbon tax supports the use of renewable energies such as solar power.
Increased demand for existing products/services
>6 years Indirect (Client)
Likely Medium
Due to a broad variety in scenarios, the implications can vary a lot. An increase in profit could run into the millions.
Engagement in political discussion, implementation of measures to raise awareness in the public, support of scientific research on renewable energies
Our measures do not exclusively aim at this single opportunity. They address several aims at once. The total amount runs into the millions.
Product labelling regulations and standards
Credible labels for high product quality and high ecological and social performance help customers in decision making
Increased demand for existing products/services
1 to 3 years
Indirect (Client)
Likely Medium
Due to a broad variety in scenarios, the implications can vary a lot. An increase in profit could run into the thousands.
Take part in labelling initiatives such as TÜV power controlled or Green Brands
Our measures do not exclusively aim at this single opportunity. They address several aims at once. The total amount runs into the thousands.
Fuel/energy taxes and regulations
Increasing costs for fossil fuels support the use of renewable energies such as solar power.
Increased demand for existing products/services
3 to 6 years
Indirect (Client)
Likely Medium-high
Due to a broad variety in scenarios, the implications can vary a lot. An increase in profit could run into the
Engagement in political discussion, implementation of measures to raise awareness in the public, support of scientific
Our measures do not exclusively aim at this single opportunity. They address several aims at once. The total amount
Opportunity driver
Description
Potential impact
Timeframe
Direct/Indirect
Likelihood
Magnitude of impact
Estimated financial
implications
Management
method
Cost of
management
thousands. research on renewable energies
runs into the millions.
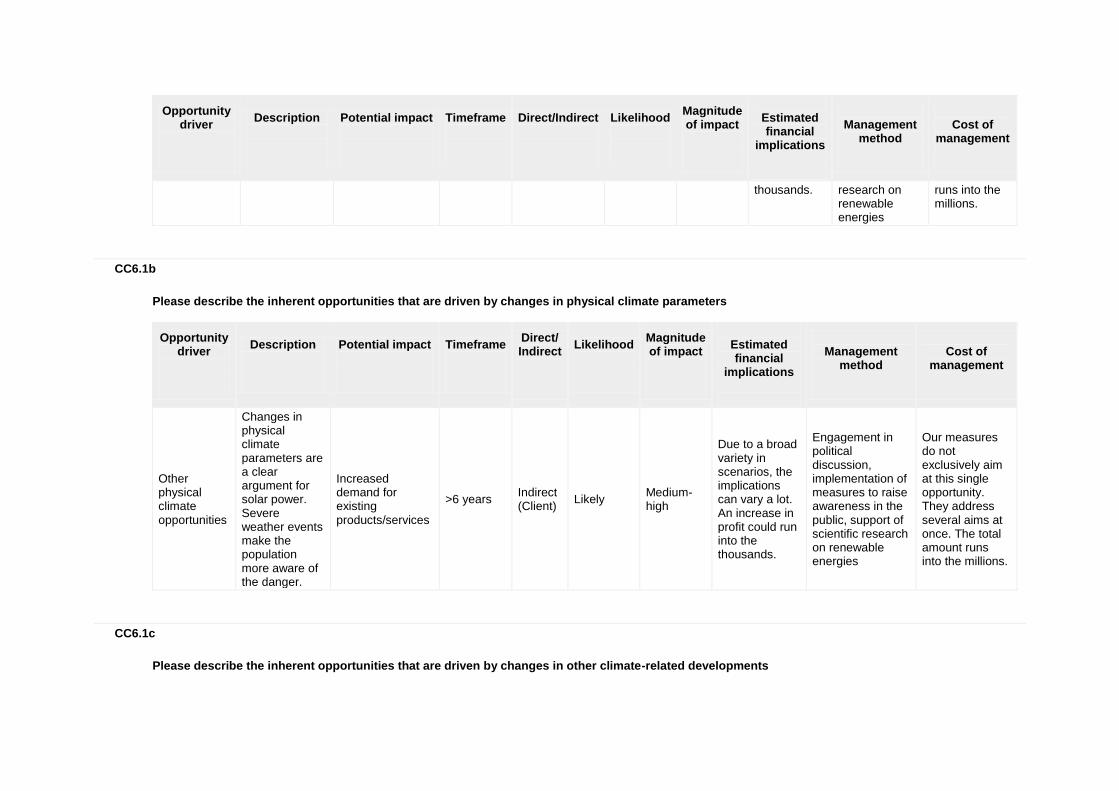
CC6.1b
Please describe the inherent opportunities that are driven by changes in physical climate parameters
Opportunity driver
Description
Potential impact
Timeframe
Direct/ Indirect
Likelihood
Magnitude of impact
Estimated financial
implications
Management
method
Cost of
management
Other physical climate opportunities
Changes in physical climate parameters are a clear argument for solar power. Severe weather events make the population more aware of the danger.
Increased demand for existing products/services
>6 years Indirect (Client)
Likely Medium-high
Due to a broad variety in scenarios, the implications can vary a lot. An increase in profit could run into the thousands.
Engagement in political discussion, implementation of measures to raise awareness in the public, support of scientific research on renewable energies
Our measures do not exclusively aim at this single opportunity. They address several aims at once. The total amount runs into the millions.
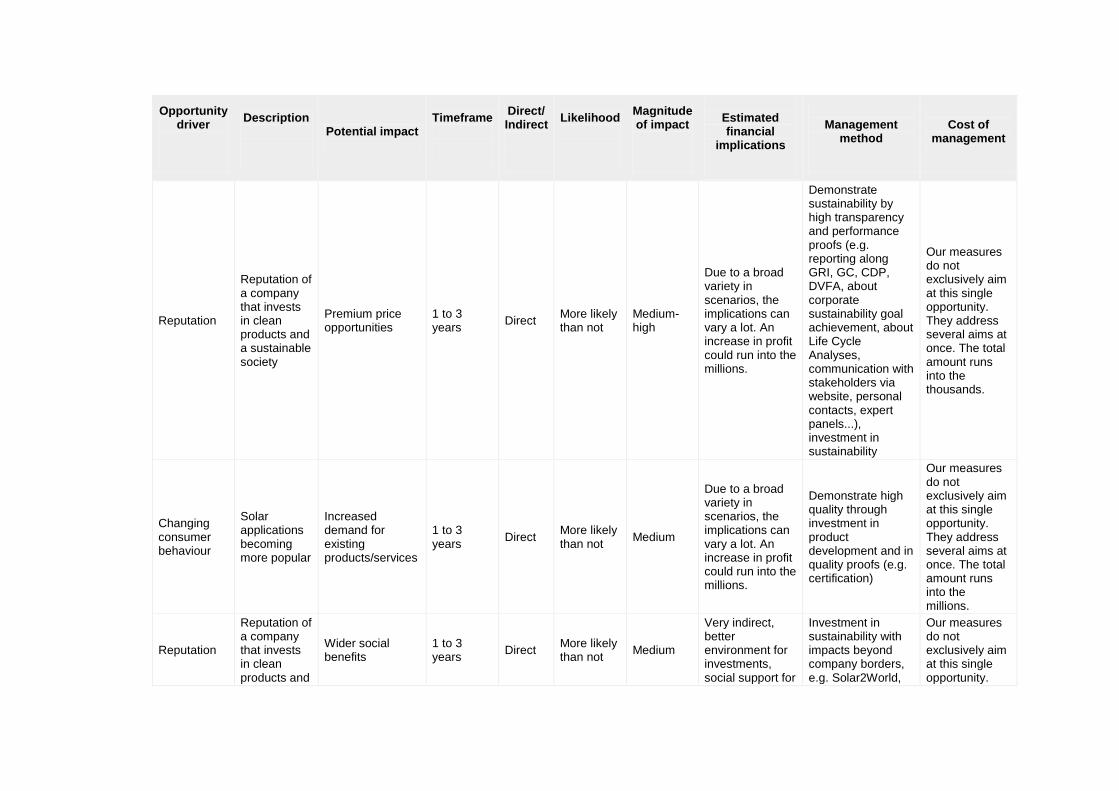
CC6.1c
Please describe the inherent opportunities that are driven by changes in other climate-related developments
Opportunity driver
Description
Potential impact
Timeframe
Direct/ Indirect
Likelihood
Magnitude of impact
Estimated financial
implications
Management
method
Cost of
management
Reputation
Reputation of a company that invests in clean products and a sustainable society
Premium price opportunities
1 to 3 years
Direct More likely than not
Medium-high
Due to a broad variety in scenarios, the implications can vary a lot. An increase in profit could run into the millions.
Demonstrate sustainability by high transparency and performance proofs (e.g. reporting along GRI, GC, CDP, DVFA, about corporate sustainability goal achievement, about Life Cycle Analyses, communication with stakeholders via website, personal contacts, expert panels...), investment in sustainability
Our measures do not exclusively aim at this single opportunity. They address several aims at once. The total amount runs into the thousands.
Changing consumer behaviour
Solar applications becoming more popular
Increased demand for existing products/services
1 to 3 years
Direct More likely than not
Medium
Due to a broad variety in scenarios, the implications can vary a lot. An increase in profit could run into the millions.
Demonstrate high quality through investment in product development and in quality proofs (e.g. certification)
Our measures do not exclusively aim at this single opportunity. They address several aims at once. The total amount runs into the millions.
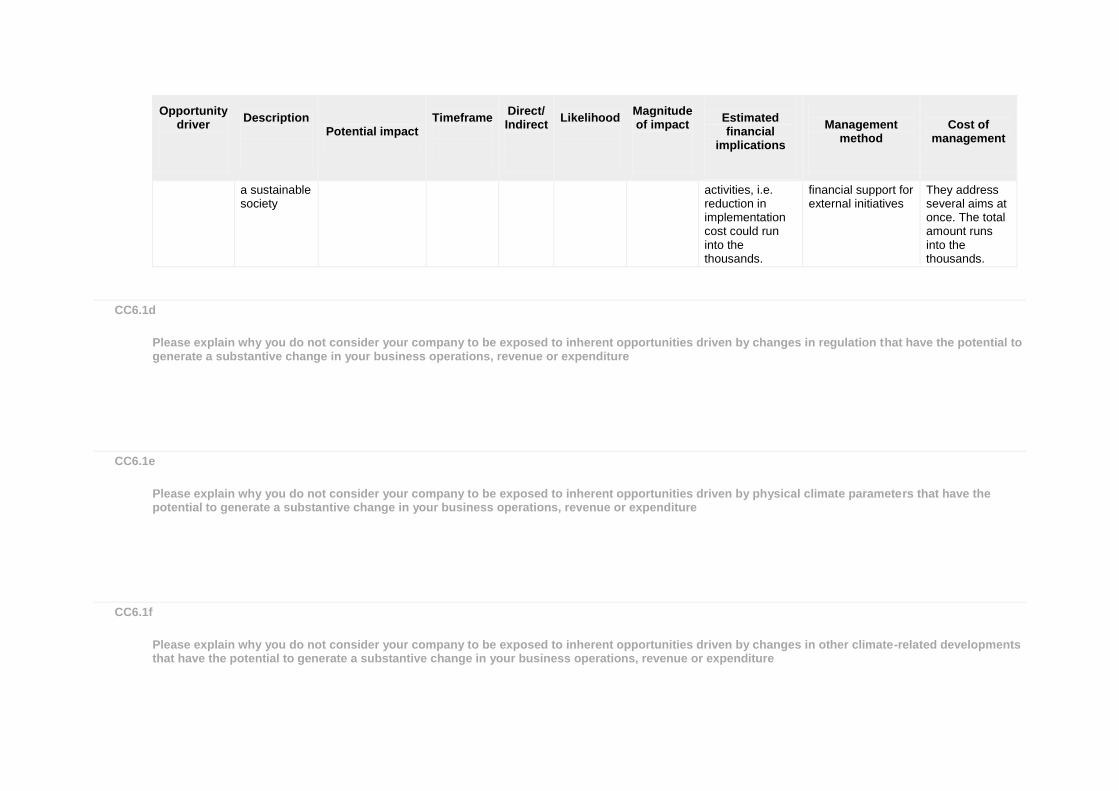
Reputation
Reputation of a company that invests in clean products and
Wider social benefits
1 to 3 years
Direct More likely than not
Medium
Very indirect, better environment for investments, social support for
Investment in sustainability with impacts beyond company borders, e.g. Solar2World,
Our measures do not exclusively aim at this single opportunity.
Opportunity driver
Description
Potential impact
Timeframe
Direct/ Indirect
Likelihood
Magnitude of impact
Estimated financial
implications
Management
method
Cost of
management
a sustainable society
activities, i.e. reduction in implementation cost could run into the thousands.
financial support for external initiatives
They address several aims at once. The total amount runs into the thousands.
CC6.1d
Please explain why you do not consider your company to be exposed to inherent opportunities driven by changes in regulation that have the potential to generate a substantive change in your business operations, revenue or expenditure
CC6.1e
Please explain why you do not consider your company to be exposed to inherent opportunities driven by physical climate parameters that have the potential to generate a substantive change in your business operations, revenue or expenditure
CC6.1f
Please explain why you do not consider your company to be exposed to inherent opportunities driven by changes in other climate-related developments that have the potential to generate a substantive change in your business operations, revenue or expenditure
Further Information
Module: GHG Emissions Accounting, Energy and Fuel Use, and Trading
Page: CC7. Emissions Methodology
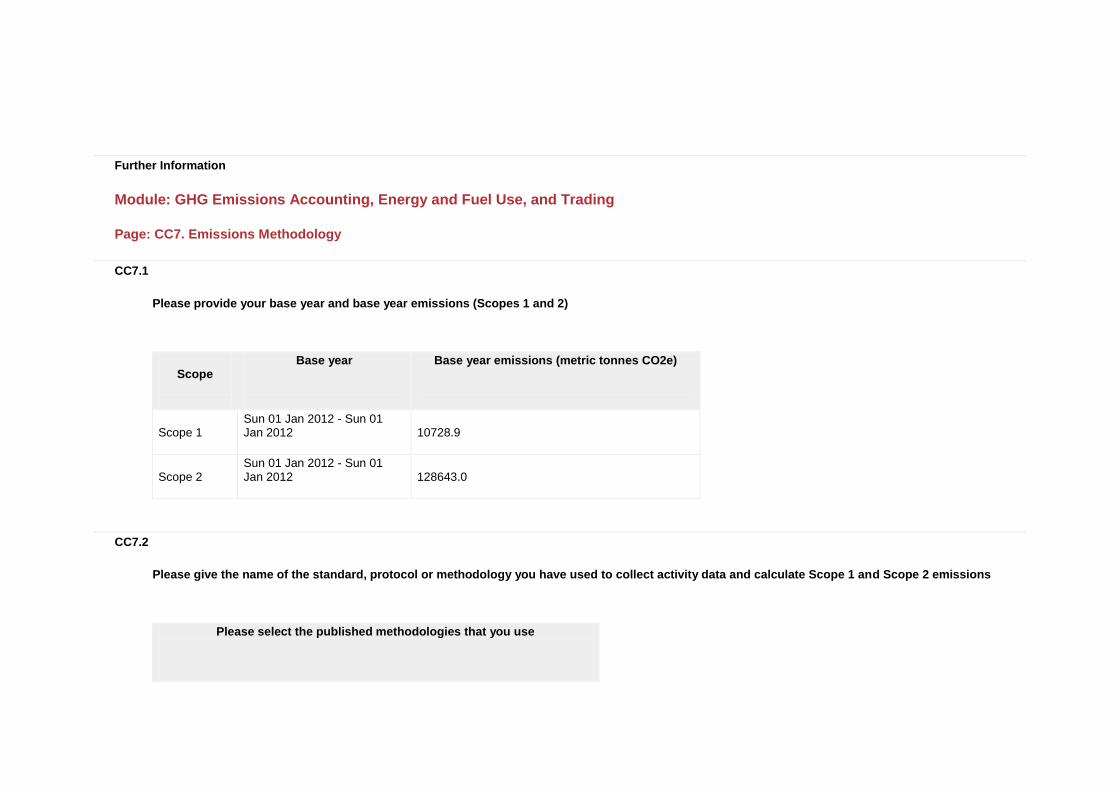
CC7.1
Please provide your base year and base year emissions (Scopes 1 and 2)
Scope
Base year
Base year emissions (metric tonnes CO2e)
Scope 1 Sun 01 Jan 2012 - Sun 01 Jan 2012
10728.9
Scope 2 Sun 01 Jan 2012 - Sun 01 Jan 2012
128643.0
CC7.2
Please give the name of the standard, protocol or methodology you have used to collect activity data and calculate Scope 1 and Scope 2 emissions
Please select the published methodologies that you use
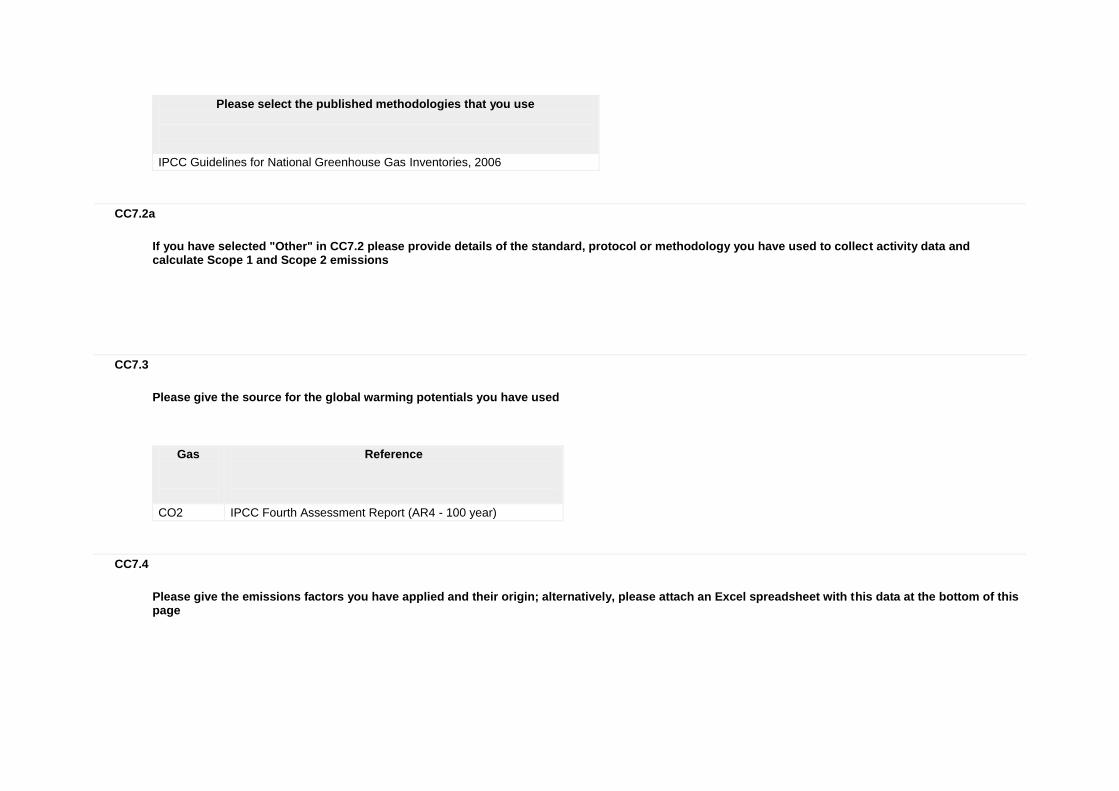
Please select the published methodologies that you use
IPCC Guidelines for National Greenhouse Gas Inventories, 2006
CC7.2a
If you have selected "Other" in CC7.2 please provide details of the standard, protocol or methodology you have used to collect activity data and calculate Scope 1 and Scope 2 emissions
CC7.3
Please give the source for the global warming potentials you have used
Gas
Reference
CO2 IPCC Fourth Assessment Report (AR4 - 100 year)
CC7.4
Please give the emissions factors you have applied and their origin; alternatively, please attach an Excel spreadsheet with this data at the bottom of this page
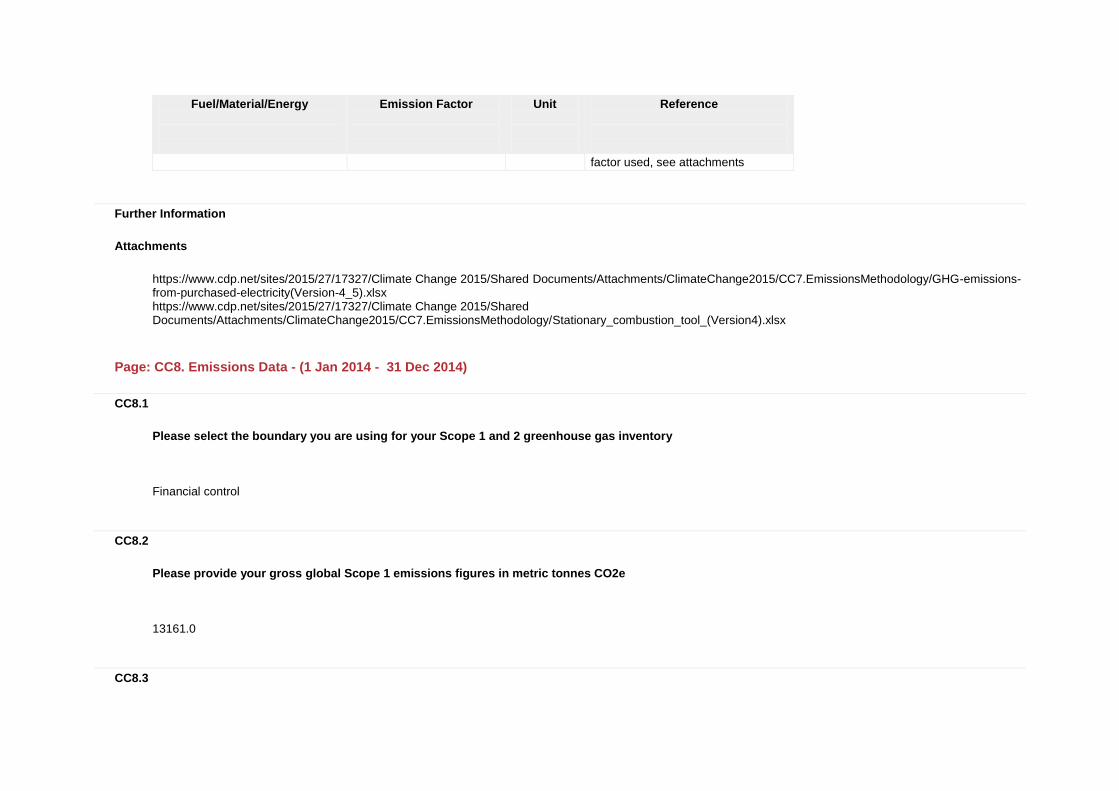
Fuel/Material/Energy
Emission Factor
Unit
Reference
factor used, see attachments
Further Information
Attachments
https://www.cdp.net/sites/2015/27/17327/Climate Change 2015/Shared Documents/Attachments/ClimateChange2015/CC7.EmissionsMethodology/GHG-emissions-from-purchased-electricity(Version-4_5).xlsx https://www.cdp.net/sites/2015/27/17327/Climate Change 2015/Shared Documents/Attachments/ClimateChange2015/CC7.EmissionsMethodology/Stationary_combustion_tool_(Version4).xlsx
Page: CC8. Emissions Data - (1 Jan 2014 - 31 Dec 2014)
CC8.1
Please select the boundary you are using for your Scope 1 and 2 greenhouse gas inventory
Financial control
CC8.2
Please provide your gross global Scope 1 emissions figures in metric tonnes CO2e
13161.0
CC8.3
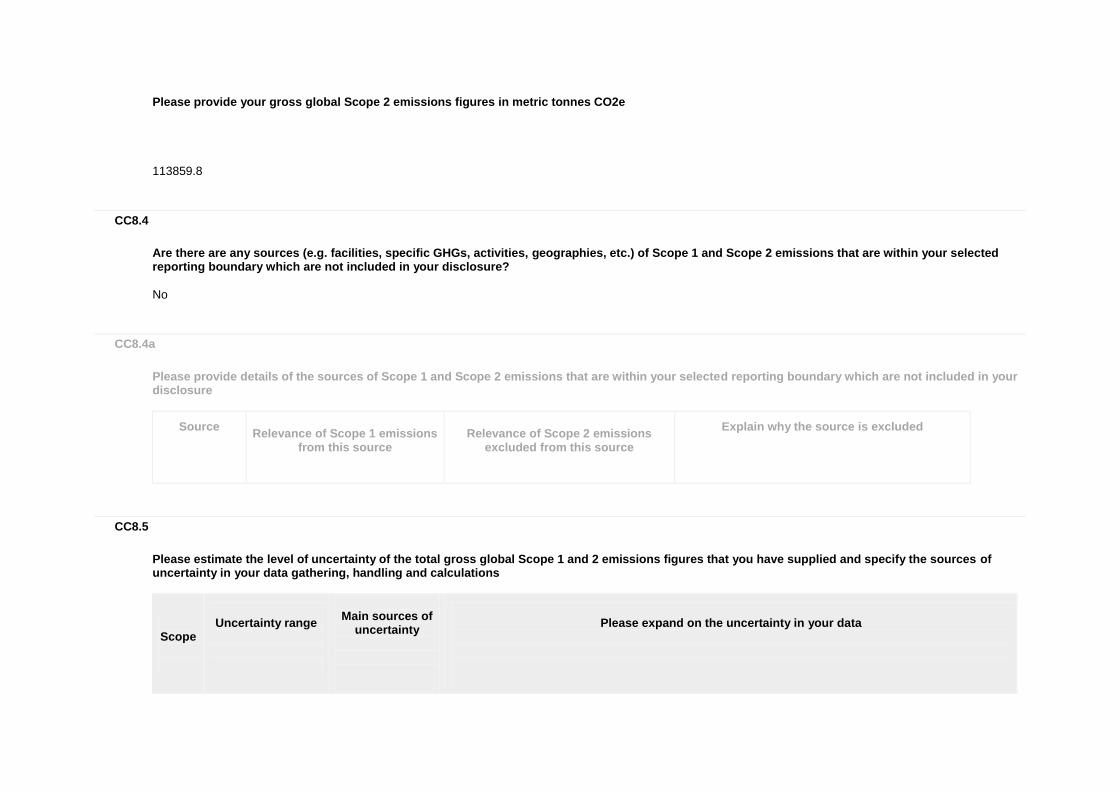
Please provide your gross global Scope 2 emissions figures in metric tonnes CO2e
113859.8
CC8.4
Are there are any sources (e.g. facilities, specific GHGs, activities, geographies, etc.) of Scope 1 and Scope 2 emissions that are within your selected reporting boundary which are not included in your disclosure?
No
CC8.4a
Please provide details of the sources of Scope 1 and Scope 2 emissions that are within your selected reporting boundary which are not included in your disclosure
Source
Relevance of Scope 1 emissions
from this source
Relevance of Scope 2 emissions
excluded from this source
Explain why the source is excluded
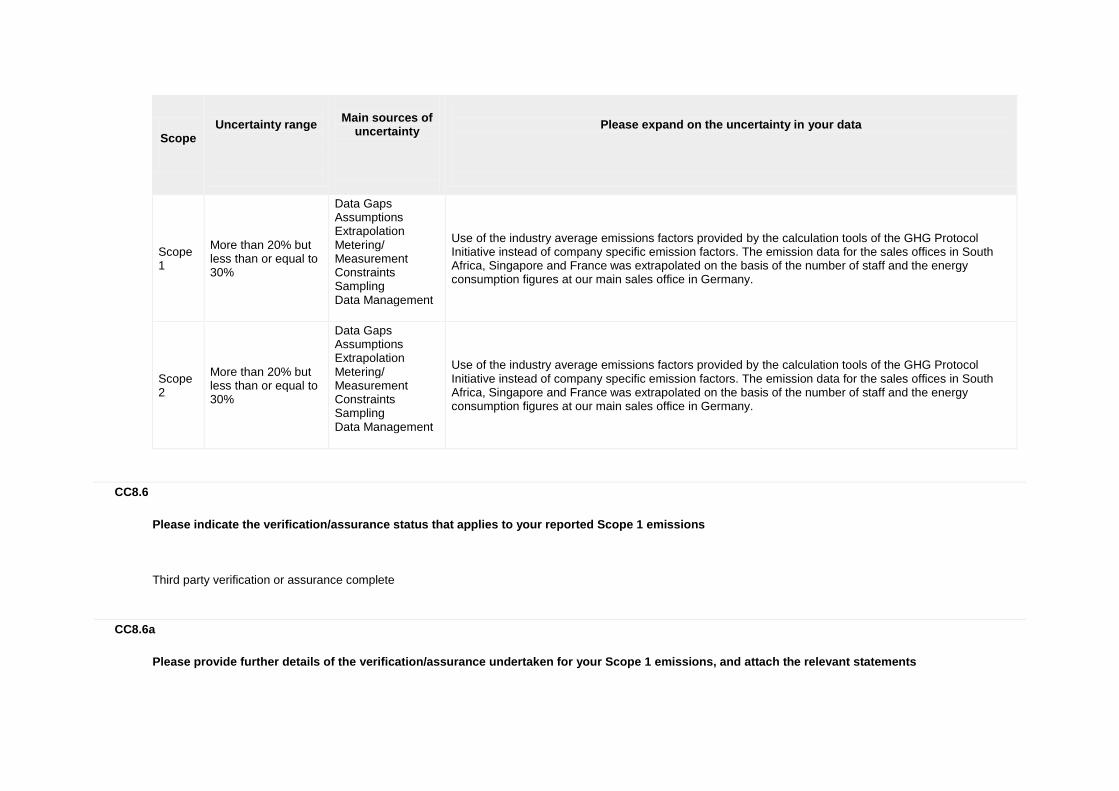
CC8.5
Please estimate the level of uncertainty of the total gross global Scope 1 and 2 emissions figures that you have supplied and specify the sources of uncertainty in your data gathering, handling and calculations
Scope
Uncertainty range
Main sources of
uncertainty
Please expand on the uncertainty in your data
Scope
Uncertainty range
Main sources of
uncertainty
Please expand on the uncertainty in your data
Scope 1
More than 20% but less than or equal to 30%
Data Gaps Assumptions Extrapolation Metering/ Measurement Constraints Sampling Data Management
Use of the industry average emissions factors provided by the calculation tools of the GHG Protocol Initiative instead of company specific emission factors. The emission data for the sales offices in South Africa, Singapore and France was extrapolated on the basis of the number of staff and the energy consumption figures at our main sales office in Germany.
Scope 2
More than 20% but less than or equal to 30%
Data Gaps Assumptions Extrapolation Metering/ Measurement Constraints Sampling Data Management
Use of the industry average emissions factors provided by the calculation tools of the GHG Protocol Initiative instead of company specific emission factors. The emission data for the sales offices in South Africa, Singapore and France was extrapolated on the basis of the number of staff and the energy consumption figures at our main sales office in Germany.
CC8.6
Please indicate the verification/assurance status that applies to your reported Scope 1 emissions
Third party verification or assurance complete
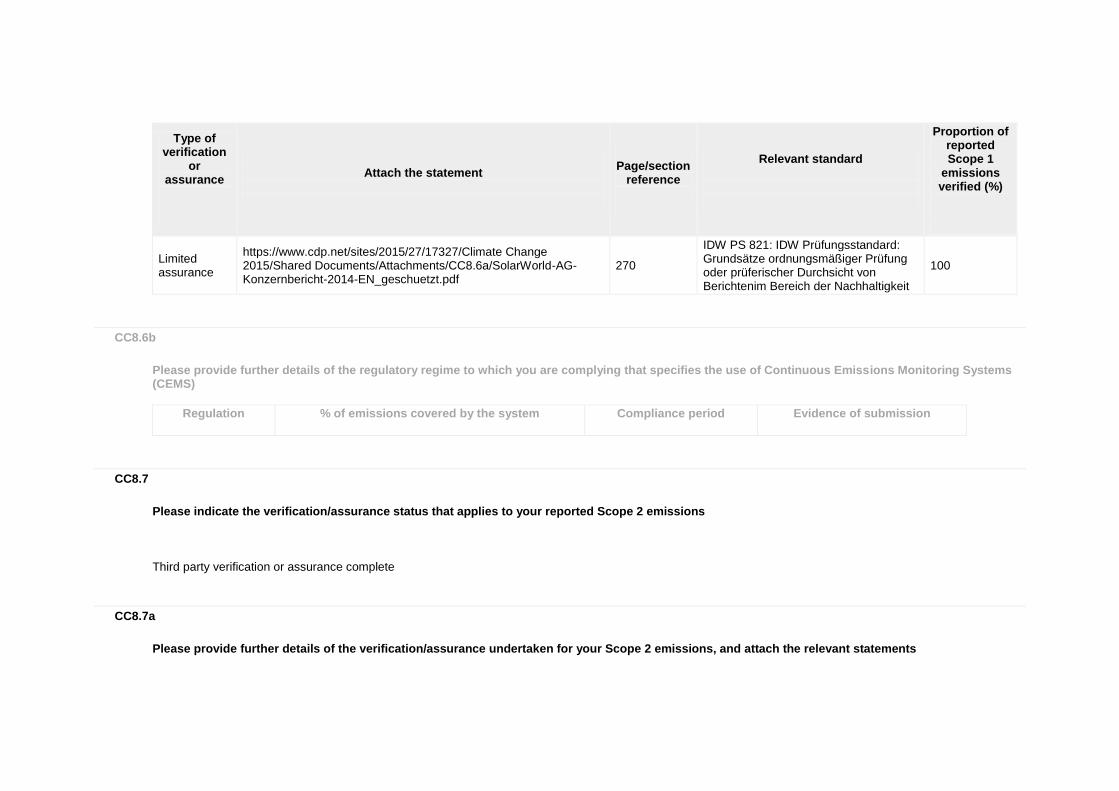
CC8.6a
Please provide further details of the verification/assurance undertaken for your Scope 1 emissions, and attach the relevant statements
Type of verification
or assurance
Attach the statement
Page/section
reference
Relevant standard
Proportion of reported Scope 1
emissions verified (%)
Limited assurance
https://www.cdp.net/sites/2015/27/17327/Climate Change 2015/Shared Documents/Attachments/CC8.6a/SolarWorld-AG-Konzernbericht-2014-EN_geschuetzt.pdf
270
IDW PS 821: IDW Prüfungsstandard: Grundsätze ordnungsmäßiger Prüfung oder prüferischer Durchsicht von Berichtenim Bereich der Nachhaltigkeit
100
CC8.6b
Please provide further details of the regulatory regime to which you are complying that specifies the use of Continuous Emissions Monitoring Systems (CEMS)
Regulation
% of emissions covered by the system
Compliance period
Evidence of submission
CC8.7
Please indicate the verification/assurance status that applies to your reported Scope 2 emissions
Third party verification or assurance complete
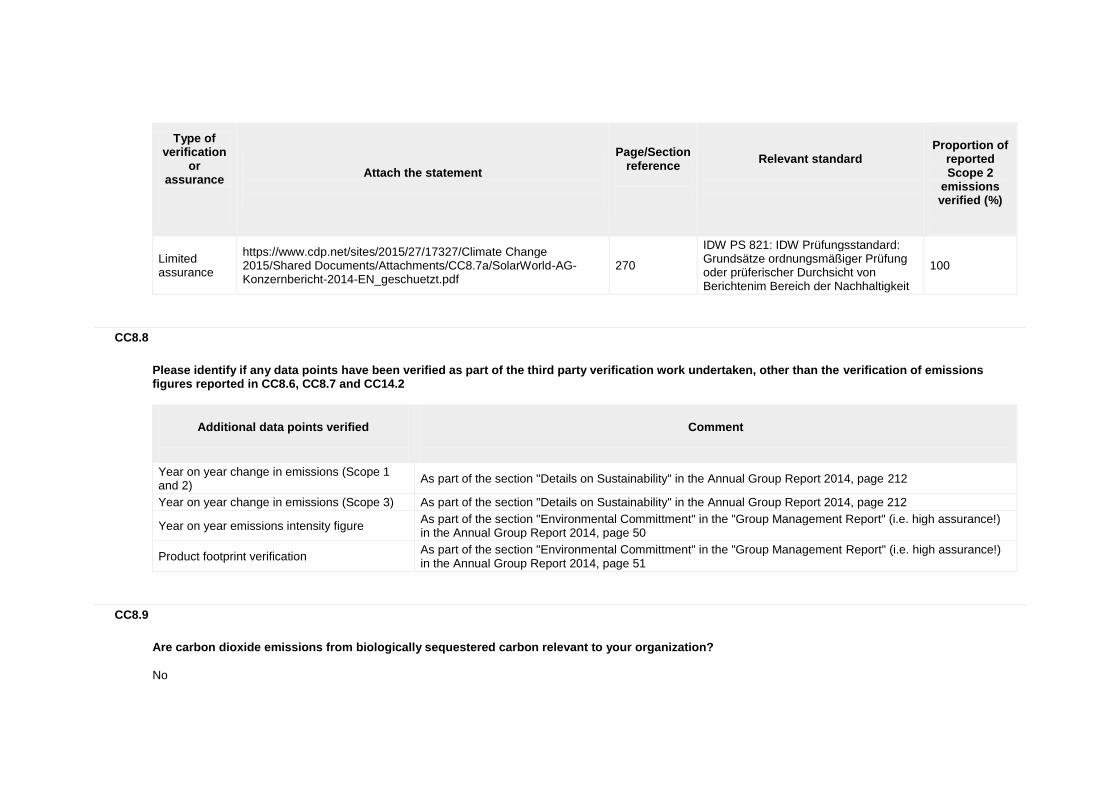
CC8.7a
Please provide further details of the verification/assurance undertaken for your Scope 2 emissions, and attach the relevant statements
Type of verification
or assurance
Attach the statement
Page/Section reference
Relevant standard
Proportion of
reported Scope 2
emissions verified (%)
Limited assurance
https://www.cdp.net/sites/2015/27/17327/Climate Change 2015/Shared Documents/Attachments/CC8.7a/SolarWorld-AG-Konzernbericht-2014-EN_geschuetzt.pdf
270
IDW PS 821: IDW Prüfungsstandard: Grundsätze ordnungsmäßiger Prüfung oder prüferischer Durchsicht von Berichtenim Bereich der Nachhaltigkeit
100
CC8.8
Please identify if any data points have been verified as part of the third party verification work undertaken, other than the verification of emissions figures reported in CC8.6, CC8.7 and CC14.2
Additional data points verified
Comment
Year on year change in emissions (Scope 1 and 2)
As part of the section "Details on Sustainability" in the Annual Group Report 2014, page 212
Year on year change in emissions (Scope 3) As part of the section "Details on Sustainability" in the Annual Group Report 2014, page 212
Year on year emissions intensity figure As part of the section "Environmental Committment" in the "Group Management Report" (i.e. high assurance!) in the Annual Group Report 2014, page 50
Product footprint verification As part of the section "Environmental Committment" in the "Group Management Report" (i.e. high assurance!) in the Annual Group Report 2014, page 51
CC8.9
Are carbon dioxide emissions from biologically sequestered carbon relevant to your organization?
No
CC8.9a
Please provide the emissions from biologically sequestered carbon relevant to your organization in metric tonnes CO2
Further Information
Page: CC9. Scope 1 Emissions Breakdown - (1 Jan 2014 - 31 Dec 2014)
CC9.1
Do you have Scope 1 emissions sources in more than one country?
Yes
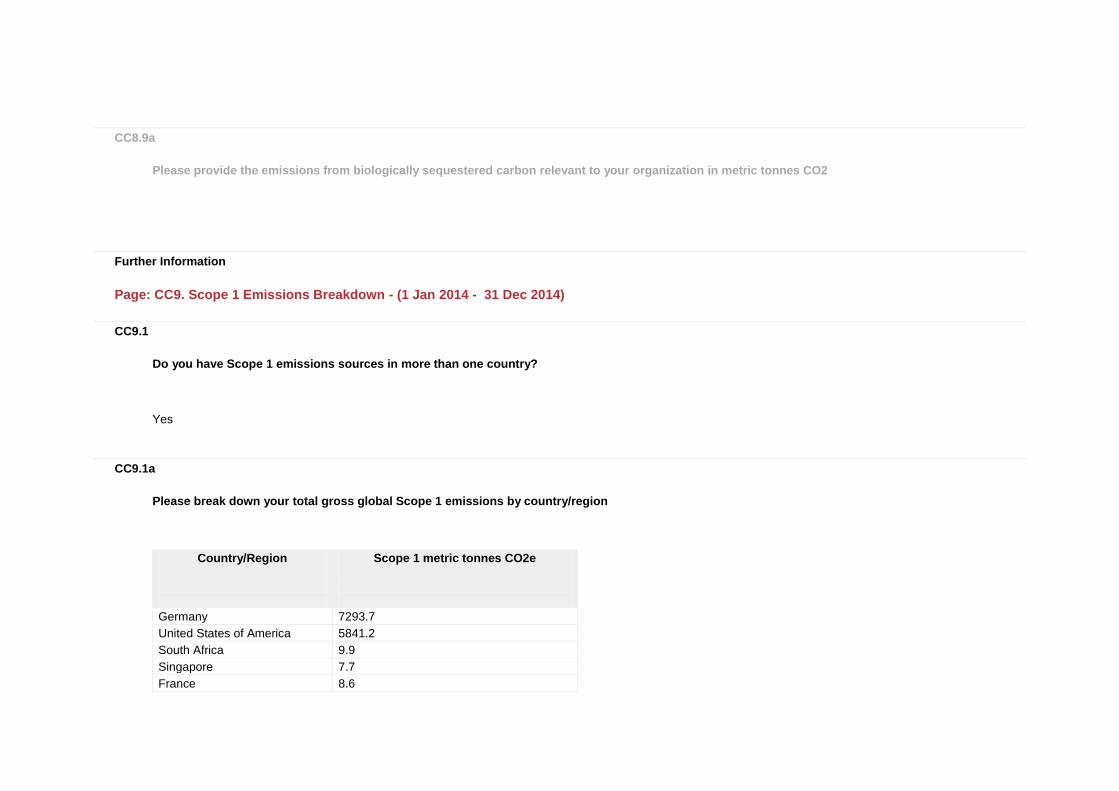
CC9.1a
Please break down your total gross global Scope 1 emissions by country/region
Country/Region
Scope 1 metric tonnes CO2e
Germany 7293.7
United States of America 5841.2
South Africa 9.9
Singapore 7.7
France 8.6
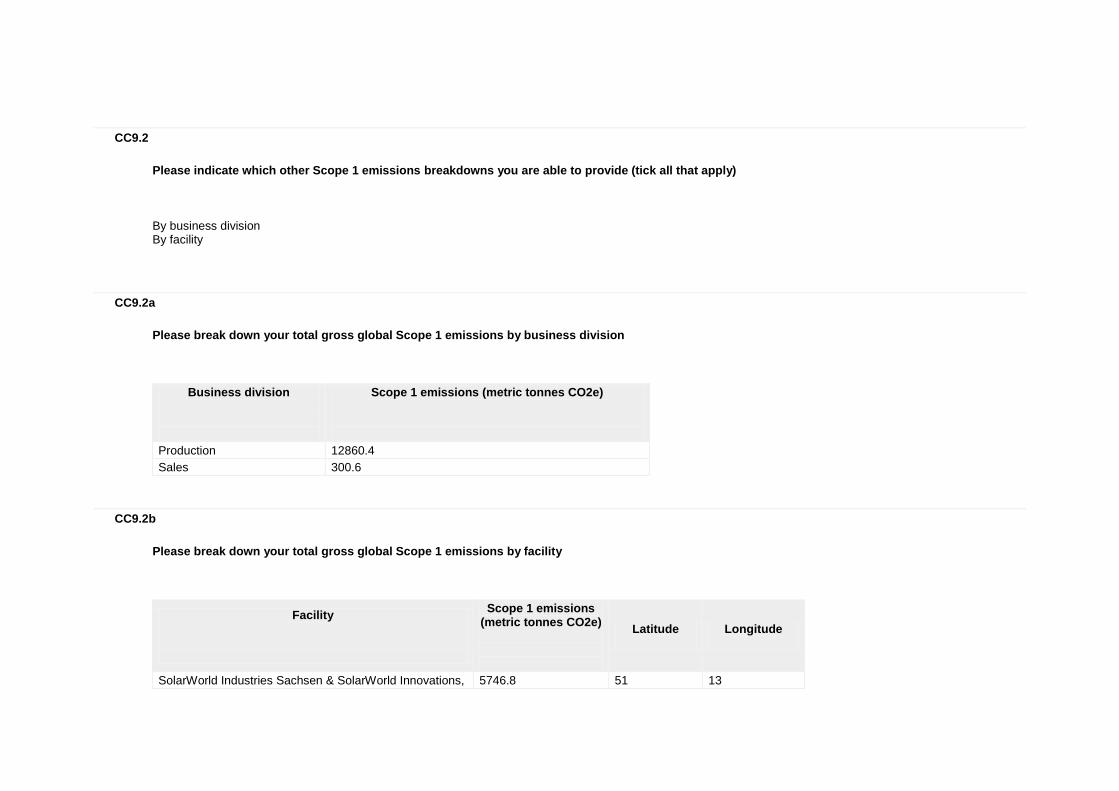
CC9.2
Please indicate which other Scope 1 emissions breakdowns you are able to provide (tick all that apply)
By business division By facility
CC9.2a
Please break down your total gross global Scope 1 emissions by business division
Business division
Scope 1 emissions (metric tonnes CO2e)
Production 12860.4
Sales 300.6
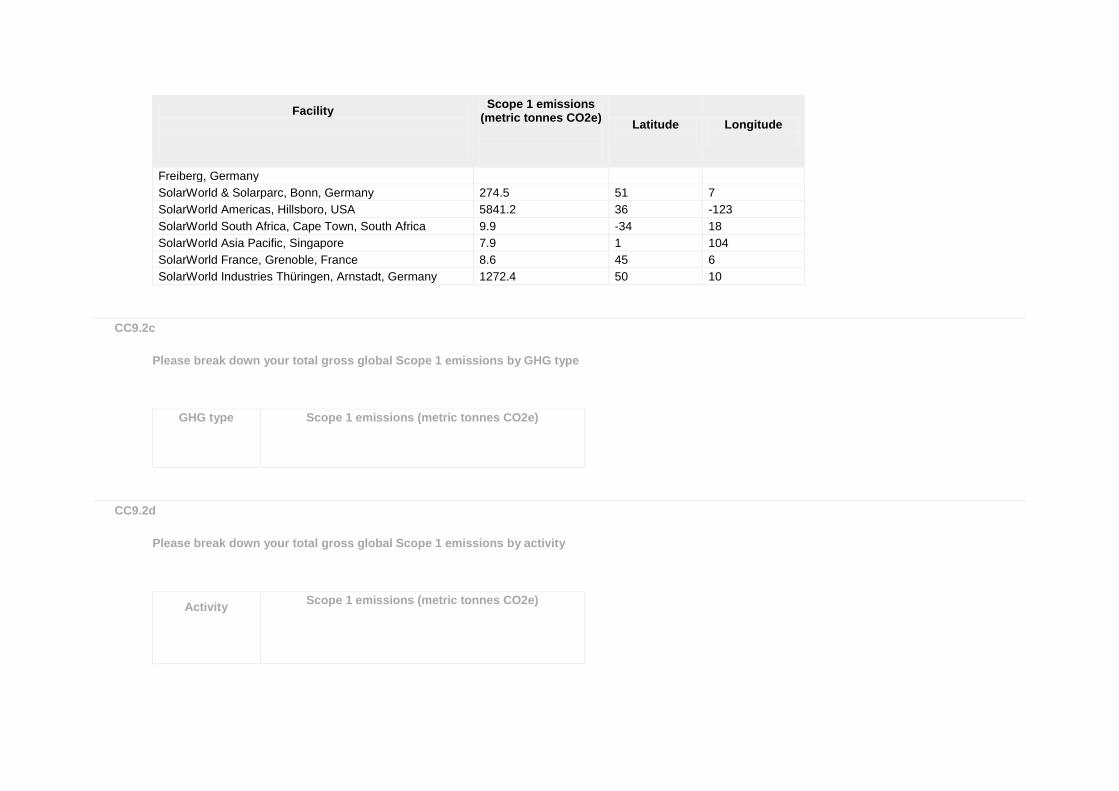
CC9.2b
Please break down your total gross global Scope 1 emissions by facility
Facility
Scope 1 emissions (metric tonnes CO2e)
Latitude
Longitude
SolarWorld Industries Sachsen & SolarWorld Innovations, 5746.8 51 13
Facility
Scope 1 emissions (metric tonnes CO2e)
Latitude
Longitude
Freiberg, Germany
SolarWorld & Solarparc, Bonn, Germany 274.5 51 7
SolarWorld Americas, Hillsboro, USA 5841.2 36 -123
SolarWorld South Africa, Cape Town, South Africa 9.9 -34 18
SolarWorld Asia Pacific, Singapore 7.9 1 104
SolarWorld France, Grenoble, France 8.6 45 6
SolarWorld Industries Thüringen, Arnstadt, Germany 1272.4 50 10
CC9.2c
Please break down your total gross global Scope 1 emissions by GHG type
GHG type
Scope 1 emissions (metric tonnes CO2e)
CC9.2d
Please break down your total gross global Scope 1 emissions by activity
Activity
Scope 1 emissions (metric tonnes CO2e)
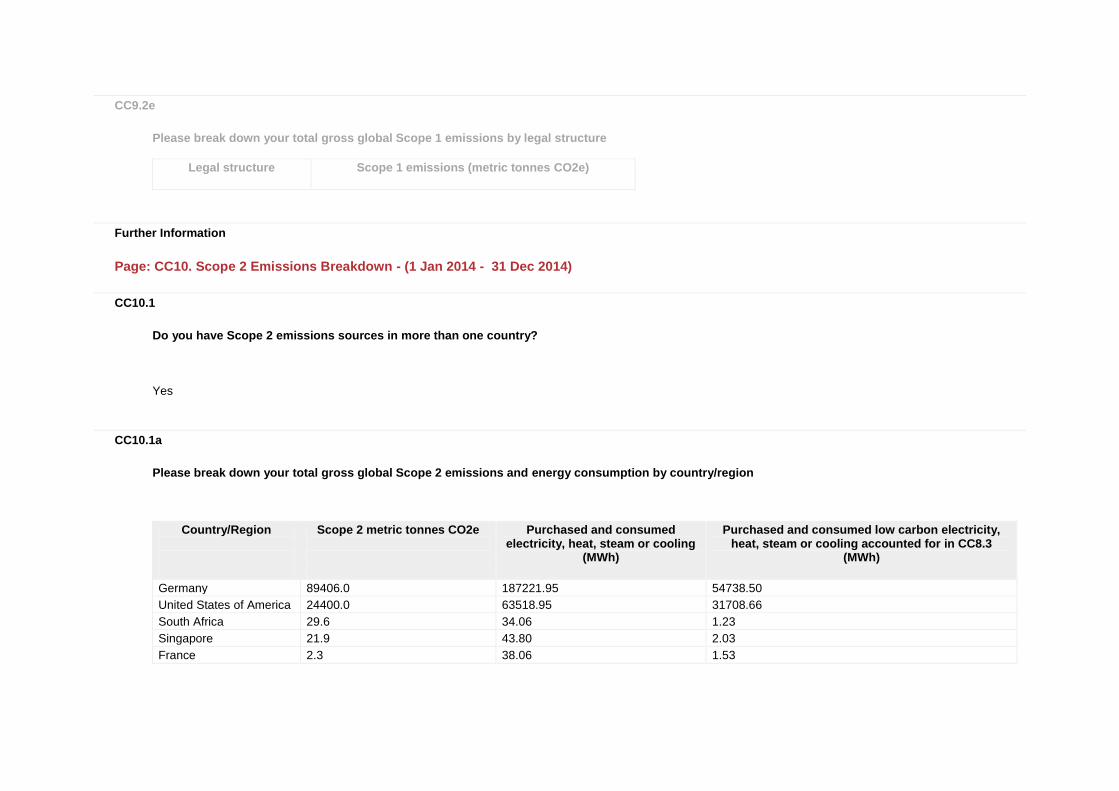
CC9.2e
Please break down your total gross global Scope 1 emissions by legal structure
Legal structure
Scope 1 emissions (metric tonnes CO2e)
Further Information
Page: CC10. Scope 2 Emissions Breakdown - (1 Jan 2014 - 31 Dec 2014)
CC10.1
Do you have Scope 2 emissions sources in more than one country?
Yes
CC10.1a
Please break down your total gross global Scope 2 emissions and energy consumption by country/region
Country/Region
Scope 2 metric tonnes CO2e
Purchased and consumed electricity, heat, steam or cooling
(MWh)
Purchased and consumed low carbon electricity, heat, steam or cooling accounted for in CC8.3
(MWh)
Germany 89406.0 187221.95 54738.50
United States of America 24400.0 63518.95 31708.66
South Africa 29.6 34.06 1.23
Singapore 21.9 43.80 2.03
France 2.3 38.06 1.53
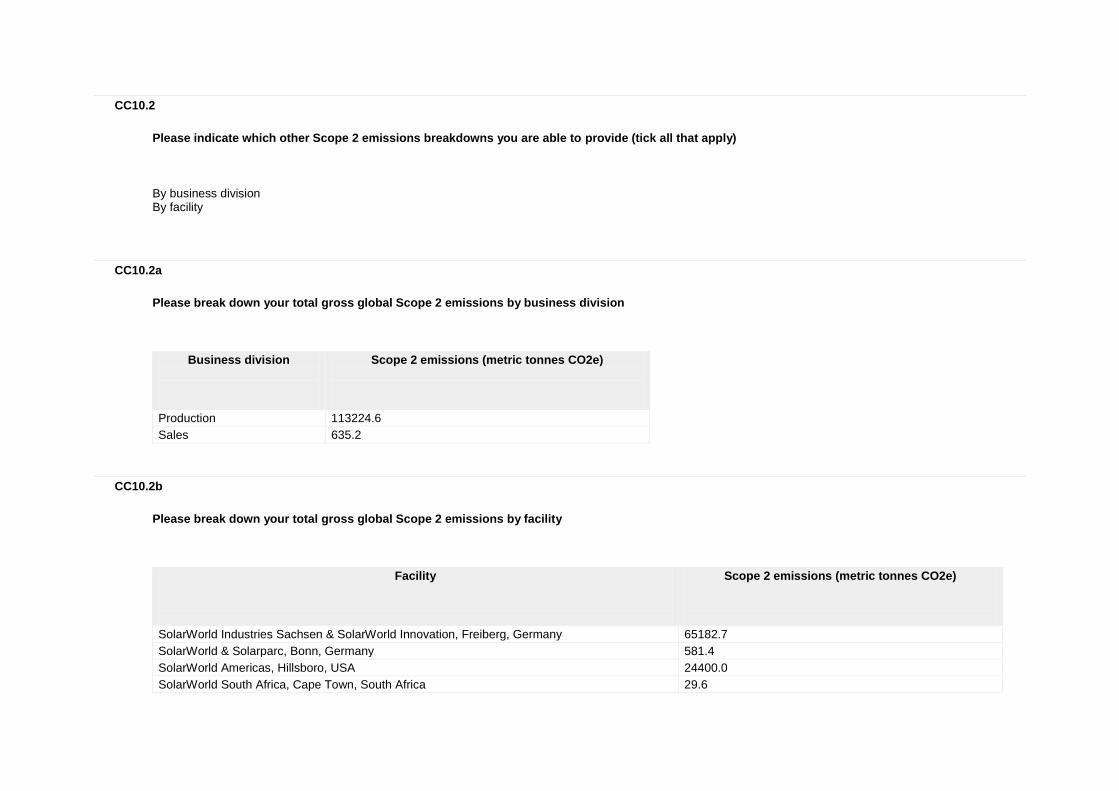
CC10.2
Please indicate which other Scope 2 emissions breakdowns you are able to provide (tick all that apply)
By business division By facility
CC10.2a
Please break down your total gross global Scope 2 emissions by business division
Business division
Scope 2 emissions (metric tonnes CO2e)
Production 113224.6
Sales 635.2
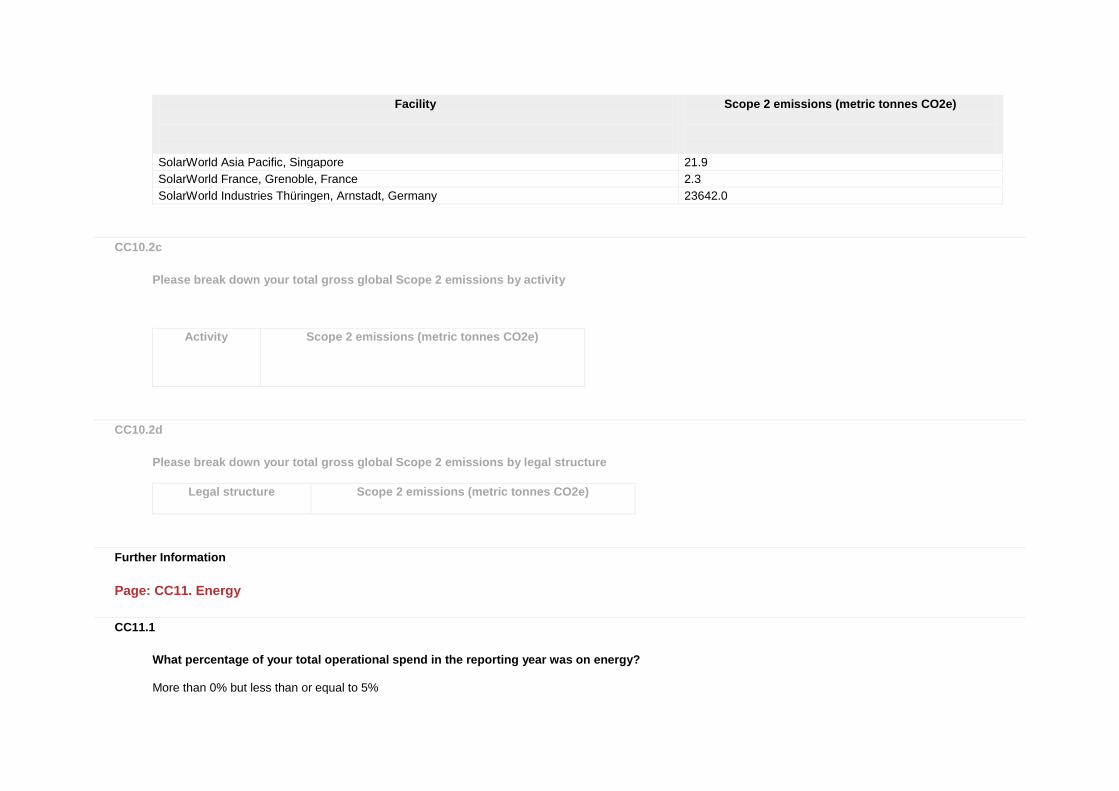
CC10.2b
Please break down your total gross global Scope 2 emissions by facility
Facility
Scope 2 emissions (metric tonnes CO2e)
SolarWorld Industries Sachsen & SolarWorld Innovation, Freiberg, Germany 65182.7
SolarWorld & Solarparc, Bonn, Germany 581.4
SolarWorld Americas, Hillsboro, USA 24400.0
SolarWorld South Africa, Cape Town, South Africa 29.6
Facility
Scope 2 emissions (metric tonnes CO2e)
SolarWorld Asia Pacific, Singapore 21.9
SolarWorld France, Grenoble, France 2.3
SolarWorld Industries Thüringen, Arnstadt, Germany 23642.0
CC10.2c
Please break down your total gross global Scope 2 emissions by activity
Activity
Scope 2 emissions (metric tonnes CO2e)
CC10.2d
Please break down your total gross global Scope 2 emissions by legal structure
Legal structure
Scope 2 emissions (metric tonnes CO2e)
Further Information
Page: CC11. Energy
CC11.1
What percentage of your total operational spend in the reporting year was on energy?
More than 0% but less than or equal to 5%
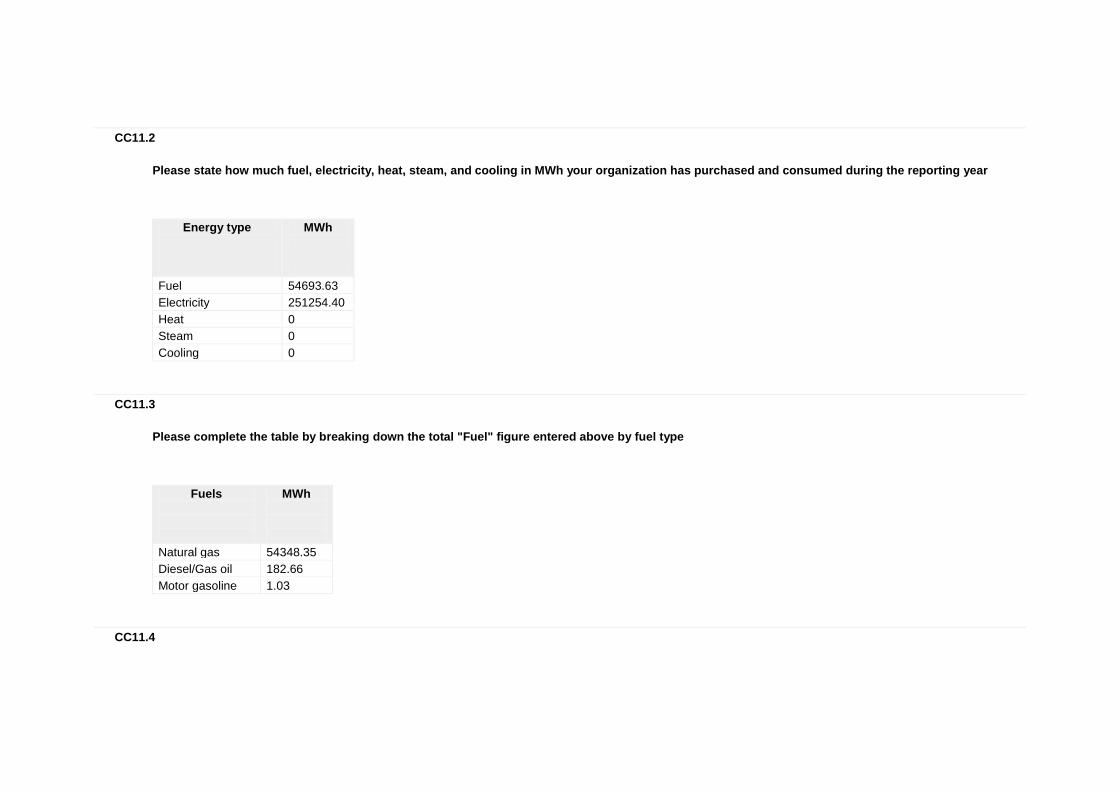
CC11.2
Please state how much fuel, electricity, heat, steam, and cooling in MWh your organization has purchased and consumed during the reporting year
Energy type
MWh
Fuel 54693.63
Electricity 251254.40
Heat 0
Steam 0
Cooling 0
CC11.3
Please complete the table by breaking down the total "Fuel" figure entered above by fuel type
Fuels
MWh
Natural gas 54348.35
Diesel/Gas oil 182.66
Motor gasoline 1.03
CC11.4
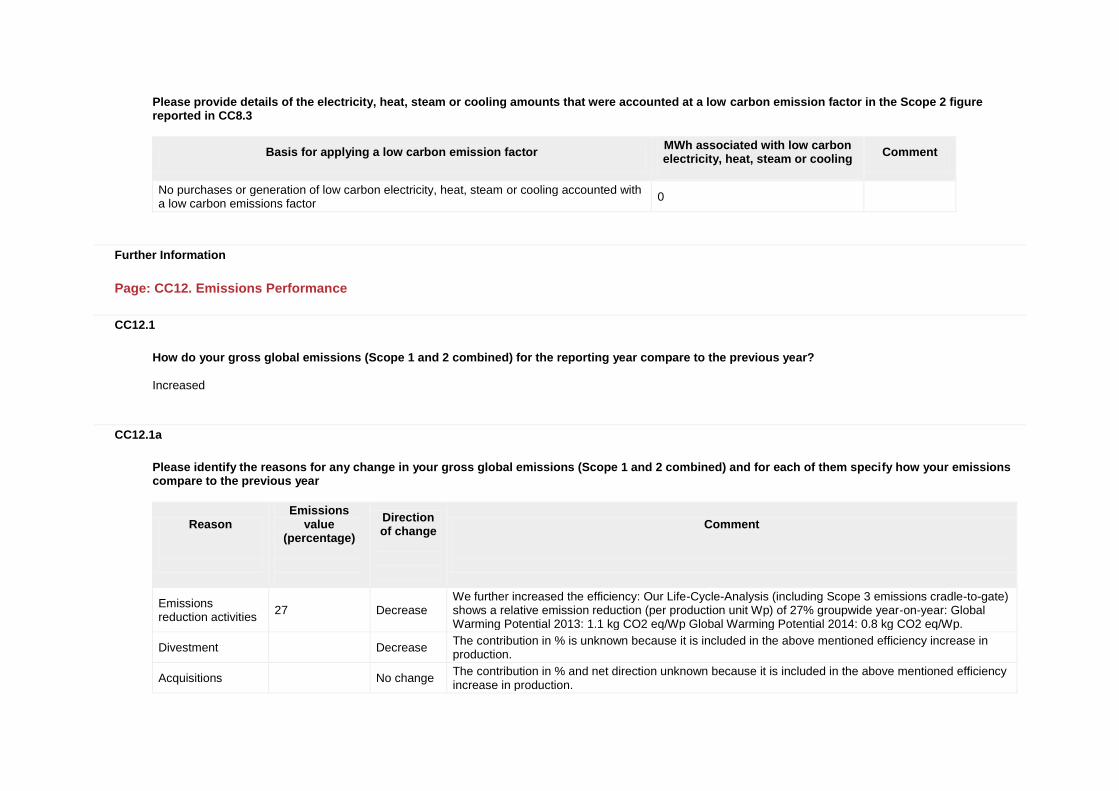
Please provide details of the electricity, heat, steam or cooling amounts that were accounted at a low carbon emission factor in the Scope 2 figure reported in CC8.3
Basis for applying a low carbon emission factor
MWh associated with low carbon electricity, heat, steam or cooling
Comment
No purchases or generation of low carbon electricity, heat, steam or cooling accounted with a low carbon emissions factor
0
Further Information
Page: CC12. Emissions Performance
CC12.1
How do your gross global emissions (Scope 1 and 2 combined) for the reporting year compare to the previous year?
Increased
CC12.1a
Please identify the reasons for any change in your gross global emissions (Scope 1 and 2 combined) and for each of them specify how your emissions compare to the previous year
Reason
Emissions value
(percentage)
Direction of change
Comment
Emissions reduction activities
27 Decrease We further increased the efficiency: Our Life-Cycle-Analysis (including Scope 3 emissions cradle-to-gate) shows a relative emission reduction (per production unit Wp) of 27% groupwide year-on-year: Global Warming Potential 2013: 1.1 kg CO2 eq/Wp Global Warming Potential 2014: 0.8 kg CO2 eq/Wp.
Divestment
Decrease The contribution in % is unknown because it is included in the above mentioned efficiency increase in production.
Acquisitions
No change The contribution in % and net direction unknown because it is included in the above mentioned efficiency increase in production.
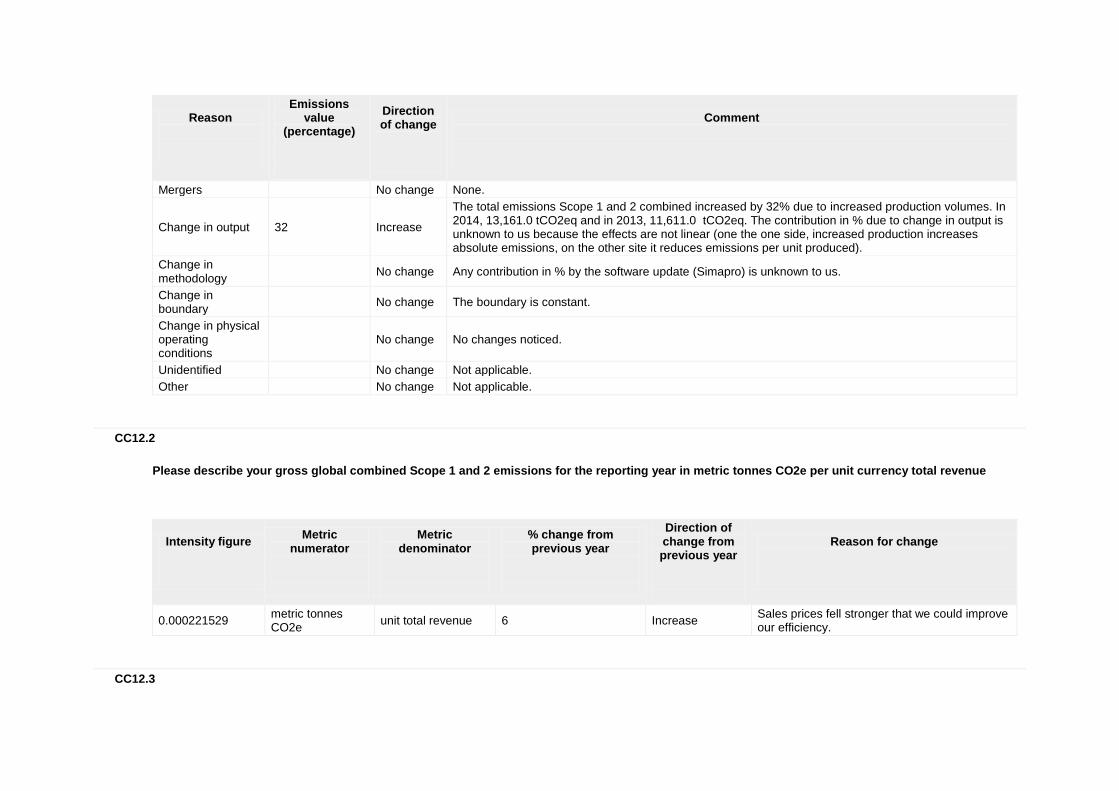
Reason
Emissions value
(percentage)
Direction of change
Comment
Mergers
No change None.
Change in output 32 Increase
The total emissions Scope 1 and 2 combined increased by 32% due to increased production volumes. In 2014, 13,161.0 tCO2eq and in 2013, 11,611.0 tCO2eq. The contribution in % due to change in output is unknown to us because the effects are not linear (one the one side, increased production increases absolute emissions, on the other site it reduces emissions per unit produced).
Change in methodology
No change Any contribution in % by the software update (Simapro) is unknown to us.
Change in boundary
No change The boundary is constant.
Change in physical operating conditions
No change No changes noticed.
Unidentified
No change Not applicable.
Other
No change Not applicable.
CC12.2
Please describe your gross global combined Scope 1 and 2 emissions for the reporting year in metric tonnes CO2e per unit currency total revenue
Intensity figure
Metric numerator
Metric denominator
% change from previous year
Direction of change from previous year
Reason for change
0.000221529 metric tonnes CO2e
unit total revenue 6 Increase Sales prices fell stronger that we could improve our efficiency.
CC12.3
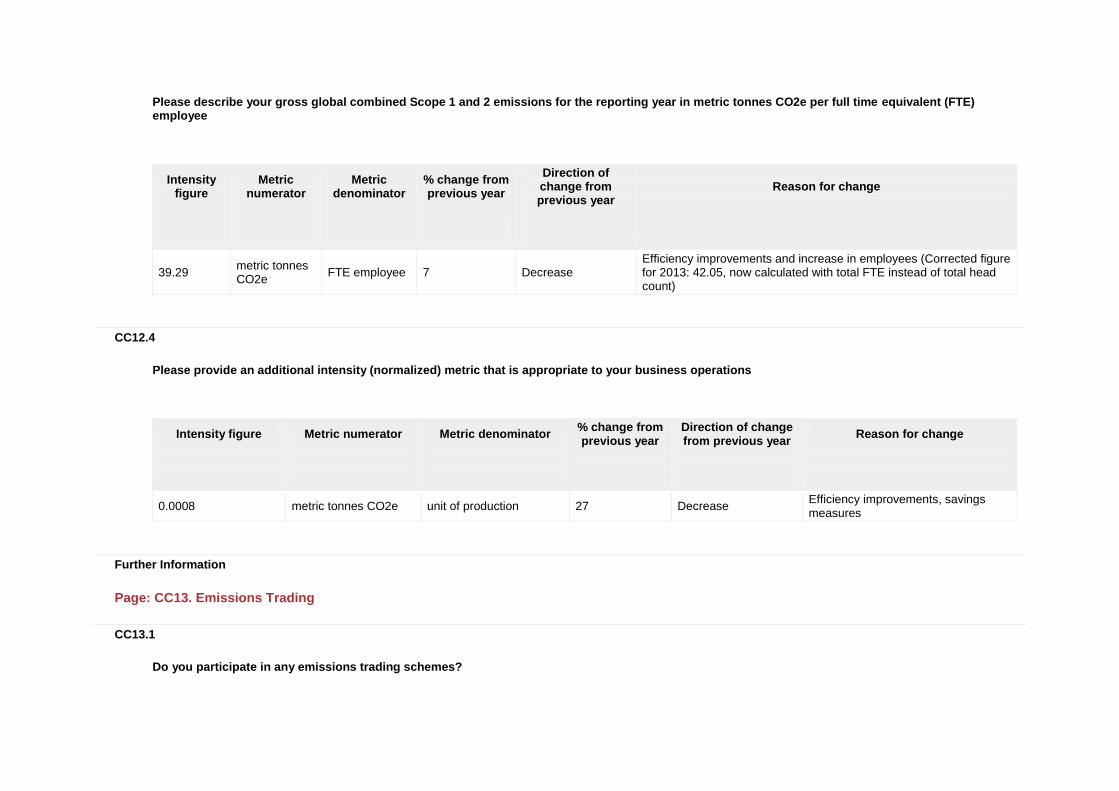
Please describe your gross global combined Scope 1 and 2 emissions for the reporting year in metric tonnes CO2e per full time equivalent (FTE) employee
Intensity figure
Metric numerator
Metric denominator
% change from previous year
Direction of change from previous year
Reason for change
39.29 metric tonnes CO2e
FTE employee 7 Decrease Efficiency improvements and increase in employees (Corrected figure for 2013: 42.05, now calculated with total FTE instead of total head count)
CC12.4
Please provide an additional intensity (normalized) metric that is appropriate to your business operations
Intensity figure
Metric numerator
Metric denominator
% change from previous year
Direction of change from previous year
Reason for change
0.0008 metric tonnes CO2e unit of production 27 Decrease Efficiency improvements, savings measures
Further Information
Page: CC13. Emissions Trading
CC13.1
Do you participate in any emissions trading schemes?
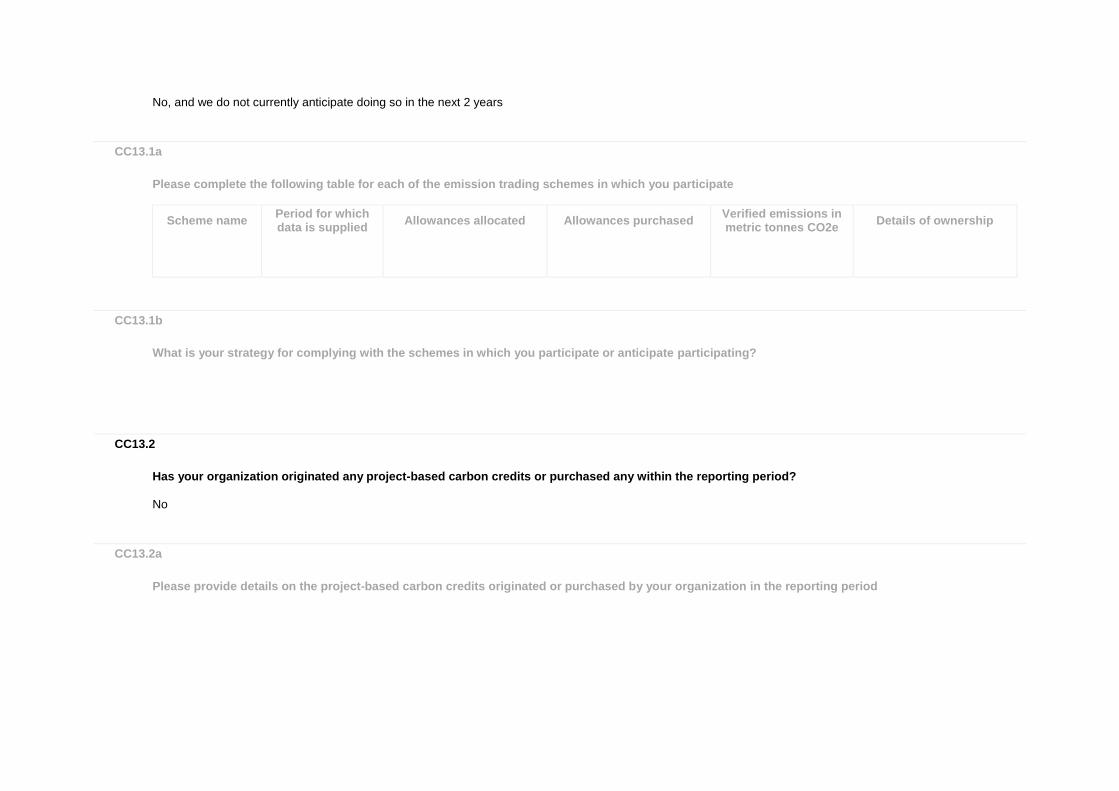
No, and we do not currently anticipate doing so in the next 2 years
CC13.1a
Please complete the following table for each of the emission trading schemes in which you participate
Scheme name
Period for which data is supplied
Allowances allocated
Allowances purchased
Verified emissions in metric tonnes CO2e
Details of ownership
CC13.1b
What is your strategy for complying with the schemes in which you participate or anticipate participating?
CC13.2
Has your organization originated any project-based carbon credits or purchased any within the reporting period?
No
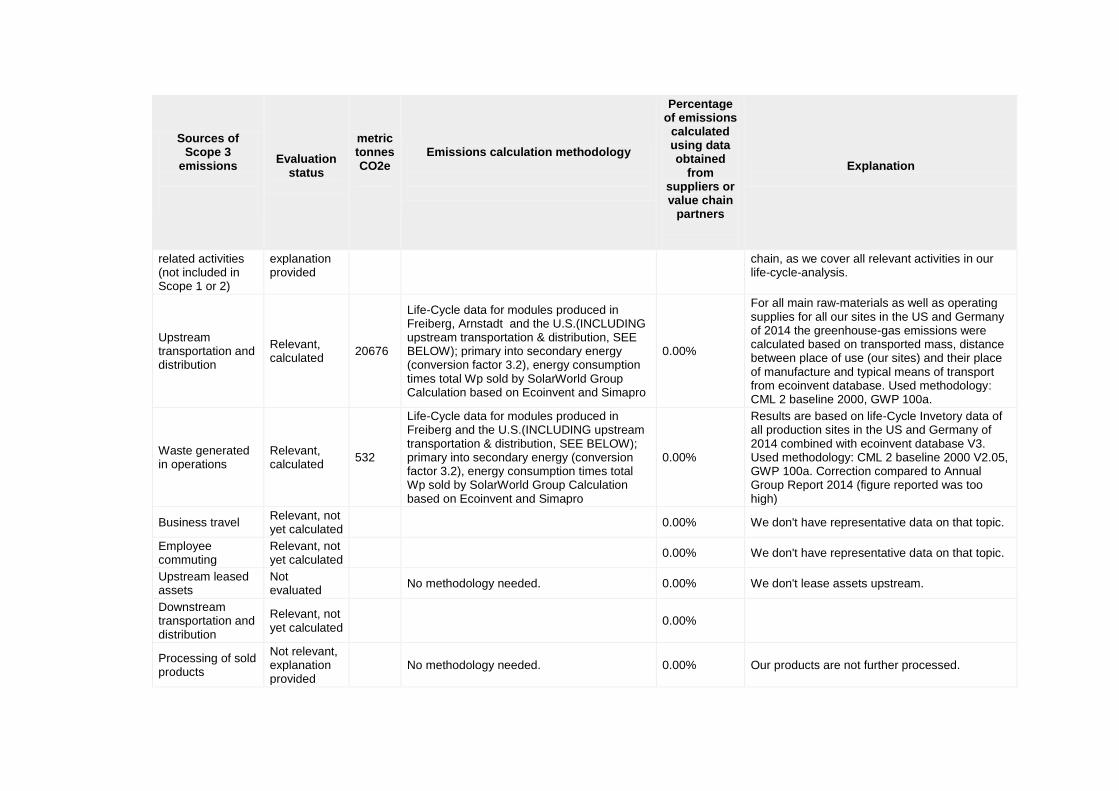
CC13.2a
Please provide details on the project-based carbon credits originated or purchased by your organization in the reporting period
Credit origination
or credit purchase
Project type
Project identification
Verified to which standard
Number of credits (metric
tonnes of CO2e)
Number of credits (metric tonnes
CO2e): Risk adjusted volume
Credits cancelled
Purpose, e.g. compliance
Further Information
Page: CC14. Scope 3 Emissions
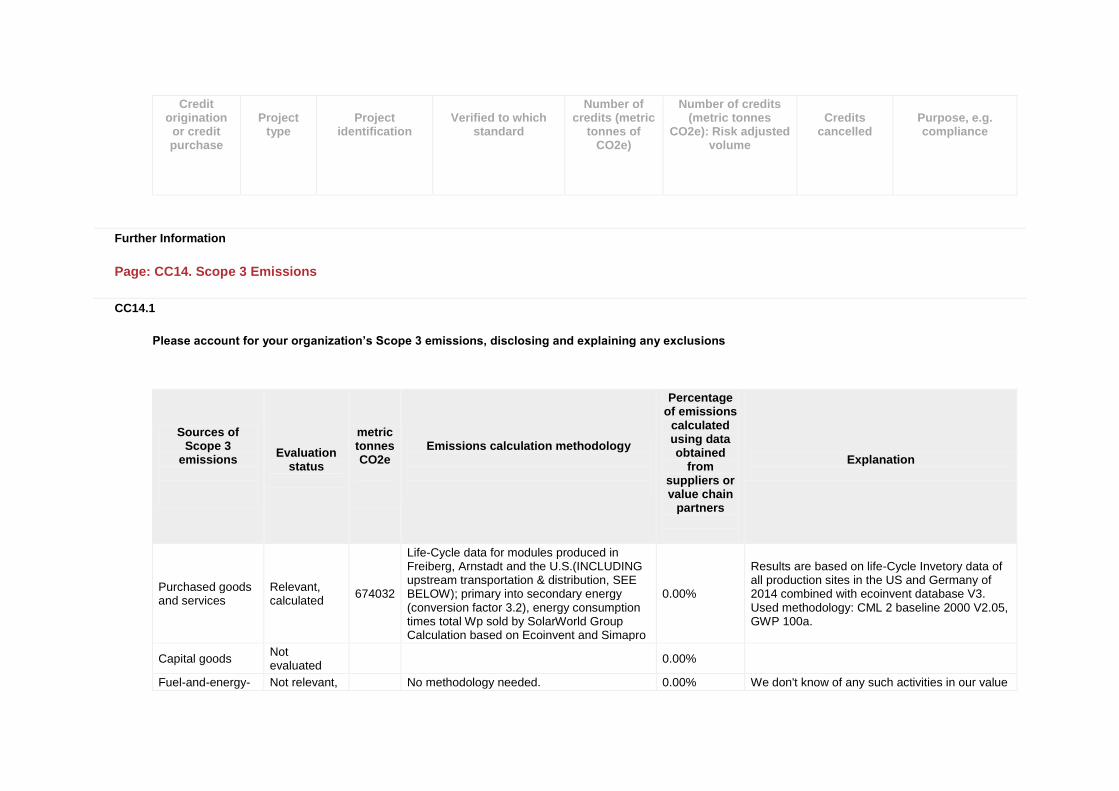
CC14.1
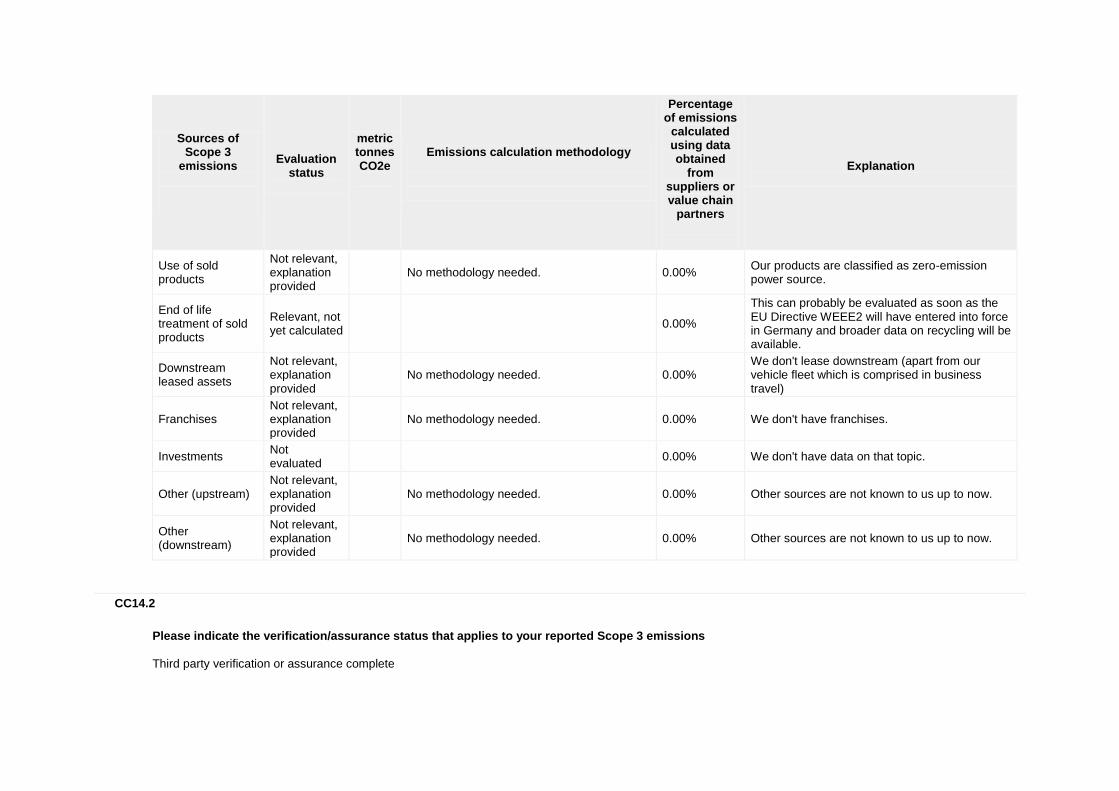
Please account for your organization’s Scope 3 emissions, disclosing and explaining any exclusions
Sources of Scope 3
emissions
Evaluation status
metric tonnes CO2e
Emissions calculation methodology
Percentage of emissions
calculated using data obtained
from suppliers or value chain
partners
Explanation
Purchased goods and services
Relevant, calculated
674032
Life-Cycle data for modules produced in Freiberg, Arnstadt and the U.S.(INCLUDING upstream transportation & distribution, SEE BELOW); primary into secondary energy (conversion factor 3.2), energy consumption times total Wp sold by SolarWorld Group Calculation based on Ecoinvent and Simapro
0.00%
Results are based on life-Cycle Invetory data of all production sites in the US and Germany of 2014 combined with ecoinvent database V3. Used methodology: CML 2 baseline 2000 V2.05, GWP 100a.
Capital goods Not evaluated
0.00%
Fuel-and-energy- Not relevant,
No methodology needed. 0.00% We don't know of any such activities in our value
Sources of Scope 3
emissions
Evaluation status
metric tonnes CO2e
Emissions calculation methodology
Percentage of emissions
calculated using data obtained
from suppliers or value chain
partners
Explanation
related activities (not included in Scope 1 or 2)
explanation provided
chain, as we cover all relevant activities in our life-cycle-analysis.
Upstream transportation and distribution
Relevant, calculated
20676
Life-Cycle data for modules produced in Freiberg, Arnstadt and the U.S.(INCLUDING upstream transportation & distribution, SEE BELOW); primary into secondary energy (conversion factor 3.2), energy consumption times total Wp sold by SolarWorld Group Calculation based on Ecoinvent and Simapro
0.00%
For all main raw-materials as well as operating supplies for all our sites in the US and Germany of 2014 the greenhouse-gas emissions were calculated based on transported mass, distance between place of use (our sites) and their place of manufacture and typical means of transport from ecoinvent database. Used methodology: CML 2 baseline 2000, GWP 100a.
Waste generated in operations
Relevant, calculated
532
Life-Cycle data for modules produced in Freiberg and the U.S.(INCLUDING upstream transportation & distribution, SEE BELOW); primary into secondary energy (conversion factor 3.2), energy consumption times total Wp sold by SolarWorld Group Calculation based on Ecoinvent and Simapro
0.00%
Results are based on life-Cycle Invetory data of all production sites in the US and Germany of 2014 combined with ecoinvent database V3. Used methodology: CML 2 baseline 2000 V2.05, GWP 100a. Correction compared to Annual Group Report 2014 (figure reported was too high)
Business travel Relevant, not yet calculated
0.00% We don't have representative data on that topic.
Employee commuting
Relevant, not yet calculated
0.00% We don't have representative data on that topic.
Upstream leased assets
Not evaluated
No methodology needed. 0.00% We don't lease assets upstream.
Downstream transportation and distribution
Relevant, not yet calculated
0.00%
Processing of sold products
Not relevant, explanation provided
No methodology needed. 0.00% Our products are not further processed.
Sources of Scope 3
emissions
Evaluation status
metric tonnes CO2e
Emissions calculation methodology
Percentage of emissions
calculated using data obtained
from suppliers or value chain
partners
Explanation
Use of sold products
Not relevant, explanation provided
No methodology needed. 0.00%
Our products are classified as zero-emission power source.
End of life treatment of sold products
Relevant, not yet calculated
0.00%
This can probably be evaluated as soon as the EU Directive WEEE2 will have entered into force in Germany and broader data on recycling will be available.
Downstream leased assets
Not relevant, explanation provided
No methodology needed. 0.00%
We don't lease downstream (apart from our vehicle fleet which is comprised in business travel)
Franchises Not relevant, explanation provided
No methodology needed. 0.00% We don't have franchises.
Investments Not evaluated
0.00% We don't have data on that topic.
Other (upstream) Not relevant, explanation provided
No methodology needed. 0.00% Other sources are not known to us up to now.
Other (downstream)
Not relevant, explanation provided
No methodology needed. 0.00% Other sources are not known to us up to now.
CC14.2
Please indicate the verification/assurance status that applies to your reported Scope 3 emissions
Third party verification or assurance complete
CC14.2a
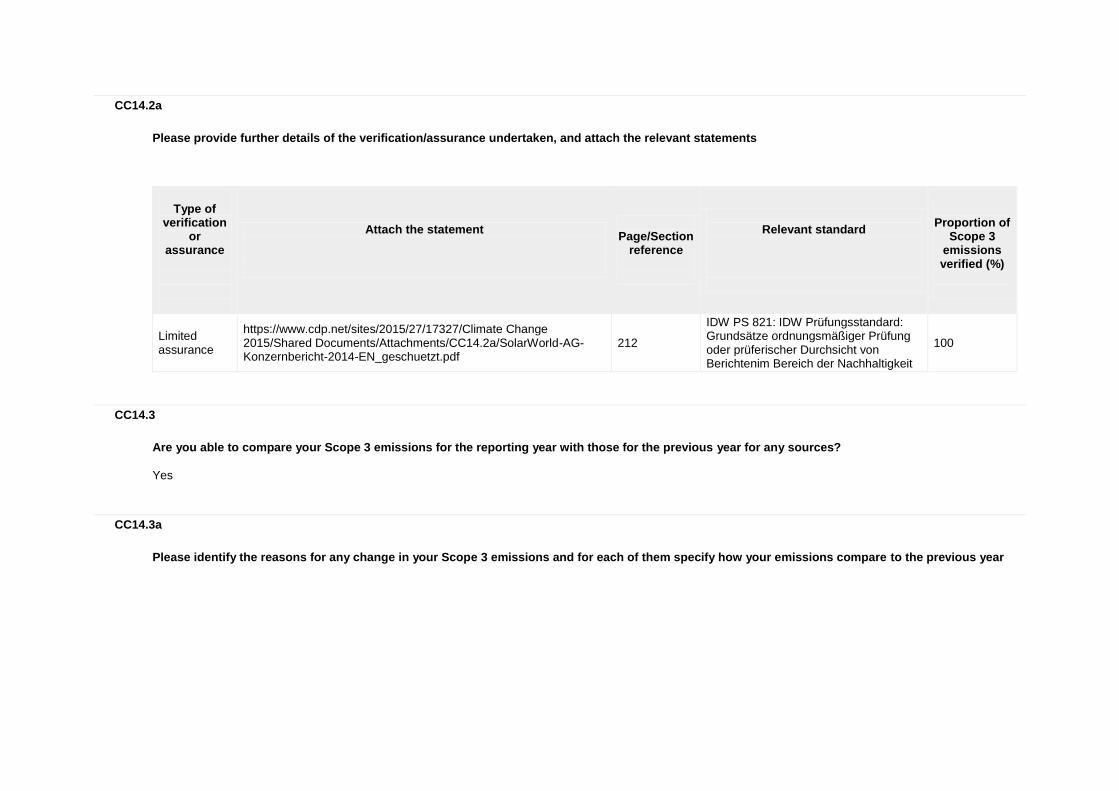
Please provide further details of the verification/assurance undertaken, and attach the relevant statements
Type of
verification or
assurance
Attach the statement
Page/Section
reference
Relevant standard
Proportion of
Scope 3 emissions verified (%)
Limited assurance
https://www.cdp.net/sites/2015/27/17327/Climate Change 2015/Shared Documents/Attachments/CC14.2a/SolarWorld-AG-Konzernbericht-2014-EN_geschuetzt.pdf
212
IDW PS 821: IDW Prüfungsstandard: Grundsätze ordnungsmäßiger Prüfung oder prüferischer Durchsicht von Berichtenim Bereich der Nachhaltigkeit
100
CC14.3
Are you able to compare your Scope 3 emissions for the reporting year with those for the previous year for any sources?
Yes
CC14.3a
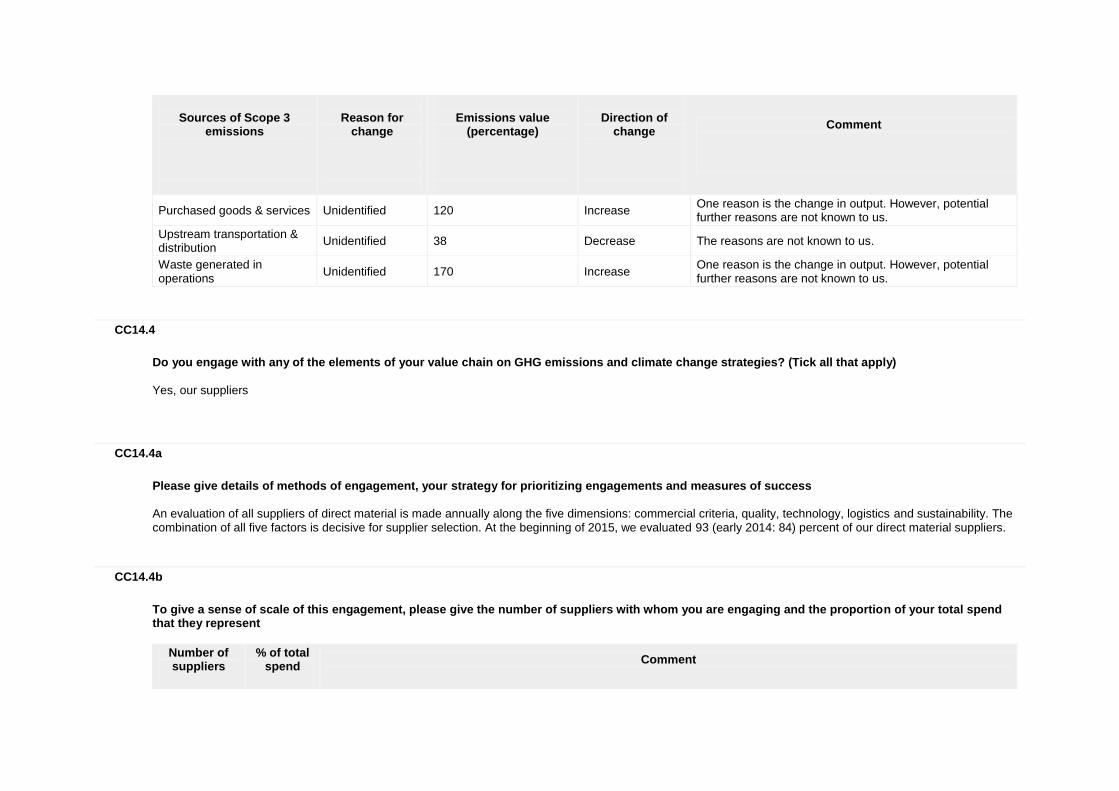
Please identify the reasons for any change in your Scope 3 emissions and for each of them specify how your emissions compare to the previous year
Sources of Scope 3
emissions
Reason for
change
Emissions value
(percentage)
Direction of
change
Comment
Purchased goods & services Unidentified 120 Increase One reason is the change in output. However, potential further reasons are not known to us.
Upstream transportation & distribution
Unidentified 38 Decrease The reasons are not known to us.
Waste generated in operations
Unidentified 170 Increase One reason is the change in output. However, potential further reasons are not known to us.
CC14.4
Do you engage with any of the elements of your value chain on GHG emissions and climate change strategies? (Tick all that apply)
Yes, our suppliers
CC14.4a
Please give details of methods of engagement, your strategy for prioritizing engagements and measures of success
An evaluation of all suppliers of direct material is made annually along the five dimensions: commercial criteria, quality, technology, logistics and sustainability. The combination of all five factors is decisive for supplier selection. At the beginning of 2015, we evaluated 93 (early 2014: 84) percent of our direct material suppliers.
CC14.4b
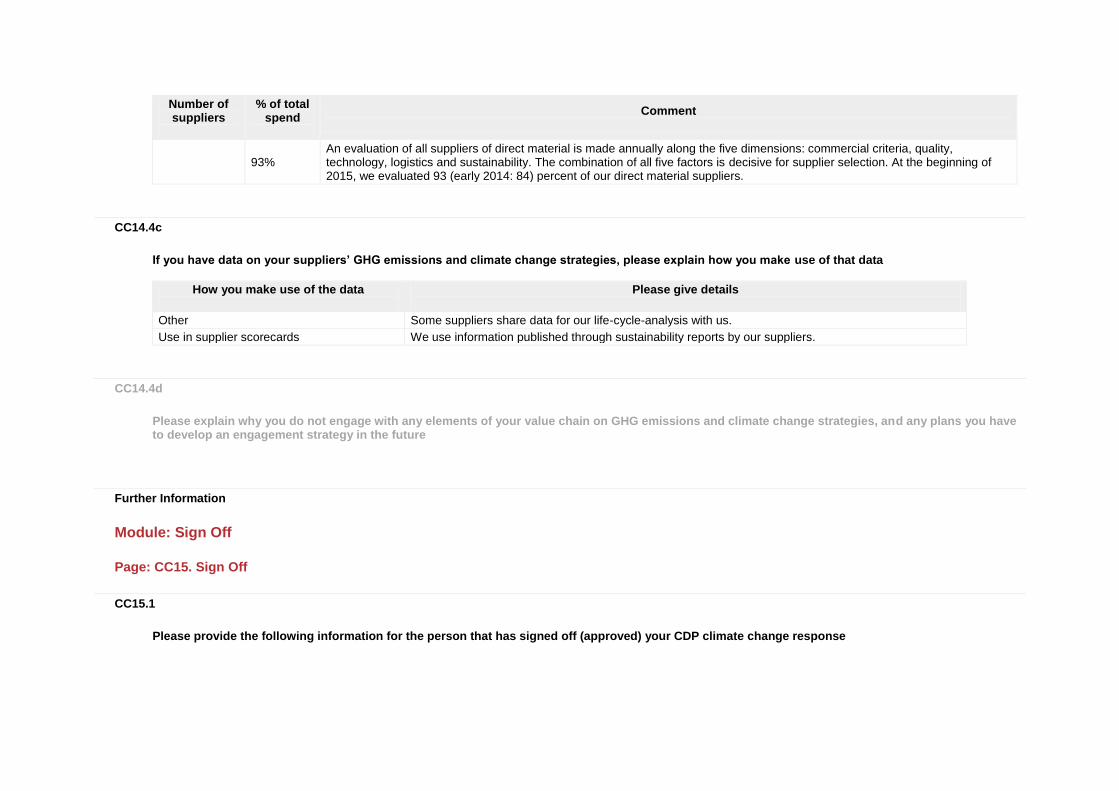
To give a sense of scale of this engagement, please give the number of suppliers with whom you are engaging and the proportion of your total spend that they represent
Number of suppliers
% of total spend
Comment
Number of suppliers
% of total spend
Comment
93%
An evaluation of all suppliers of direct material is made annually along the five dimensions: commercial criteria, quality, technology, logistics and sustainability. The combination of all five factors is decisive for supplier selection. At the beginning of 2015, we evaluated 93 (early 2014: 84) percent of our direct material suppliers.
CC14.4c
If you have data on your suppliers’ GHG emissions and climate change strategies, please explain how you make use of that data
How you make use of the data
Please give details
Other Some suppliers share data for our life-cycle-analysis with us.
Use in supplier scorecards We use information published through sustainability reports by our suppliers.
CC14.4d
Please explain why you do not engage with any elements of your value chain on GHG emissions and climate change strategies, and any plans you have to develop an engagement strategy in the future
Further Information
Module: Sign Off
Page: CC15. Sign Off
CC15.1
Please provide the following information for the person that has signed off (approved) your CDP climate change response
Name
Job title
Corresponding job category
Dr.-Ing. E. h. Frank Asbeck Vorstandsvorsitzender (Chief Executive Officer) Chief Executive Officer (CEO)
Further Information
Module: ICT
Page: ICT1. Data center activities
ICT0.1a
Please identify whether "data centers" comprise a significant component of your business within your reporting boundary
No
ICT1.1
Please provide a description of the parts of your business that fall under “data centers”
ICT1.2
Please provide your absolute Scope 1 and 2 emissions and electricity consumption for the data centers component of your business
Business activity
Scope 1 emissions (metric tonnes CO2e)
Scope 2 emissions (metric tonnes CO2e)
Annual electricity consumption (MWh)
Electricity data collection method
ICT1.3
What percentage of your ICT population sits in data centers where Power Usage Effectiveness (PUE) is measured on a regular basis?
Percentage
Comment
ICT1.4
Please provide a Power Usage Effectiveness (PUE) value for your data center(s). You can provide this information as (a) an average, (b) a range or (c) by individual data center - please tick the data you wish to provide (tick all that apply)
ICT1.4a
Please provide your average PUE across your data centers
Number of data centers
Average PUE
% change from previous year
Direction of change
Comment
ICT1.4b
Please provide the range of PUE values across your data centers
Number of data centers
PUE Minimum Value
% change of PUE Minimum Value from
previous year
PUE Maximum Value
% change of PUE Maximum Value from
previous year
Direction of change
Comment
ICT1.4c
Please provide your PUE values of all your data centers
Data center reference
PUE value
% change from previous year
Direction of change
Comment
ICT1.5
Please provide details of how you have calculated your PUE value
ICT1.6
Do you use any alternative intensity metrics to assess the energy or emissions performance of your data center(s)?
ICT1.6a
Please provide details on the alternative intensity metrics you use to assess the energy or the emissions performance of your data center(s)
ICT1.7
Please identify the measures you are planning or have undertaken in the reporting year to increase the energy efficiency of your data center(s)
Status in reporting year
Energy efficiency measure
Comment
ICT1.8
Do you participate in any other data center efficiency schemes or have buildings that are sustainably certified or rated?
ICT1.8a
Please provide details on the data center efficiency schemes you participate in or the buildings that are sustainably certified or rated
Scheme name
Level/certification (or equivalent) achieved in the reporting year
Percentage of your overall facilities to which the scheme applies
ICT1.9
Do you measure the utilization rate of your data center(s)?
ICT1.9a
What methodology do you use to calculate the utilization rate of your data center(s)?
ICT1.10
Do you provide carbon emissions data to your clients regarding the data center services they procure?
ICT1.10a
How do you provide carbon emissions data to your clients regarding the data center services they procure?
ICT1.11
Please describe any efforts you have made to incorporate renewable energy into the electricity supply to your data center(s) or to re-use waste heat
Further Information
Page: ICT2. Provision of network/connectivity services
ICT0.1b
Please identify whether "provision of network/connectivity services" comprises a significant component of your business within your reporting boundary
No
ICT2.1
Please provide a description of the parts of your business that fall under "provision of network/connectivity services"
ICT2.2
Please provide your absolute Scope 1 and 2 emissions and electricity consumption for the provision of network/connectivity services component of your business
Business activity
Scope 1 emissions (metric tonnes CO2e)
Scope 2 emissions (metric tonnes CO2e)
Annual electricity consumption (MWh)
Electricity data collection method
ICT2.3
Please describe your gross combined Scope 1 and 2 emissions or electricity use for the provision of network/connectivity services component of your business as an intensity metric
Intensity figure
Metric numerator
Metric denominator
% change from previous year
Direction of change from previous year
Reason for change
ICT2.4
Please explain how you calculated the intensity figures given in response to Question ICT2.3
ICT2.5
Do you provide carbon emissions data to your clients regarding the network/connectivity services they procure?
ICT2.5a
How do you provide carbon emissions data to your clients regarding the network/connectivity services they procure?
Further Information
Page: ICT3. Manufacture or assembly of hardware/components
ICT0.1c
Please identify whether "manufacture or assembly of hardware/components" comprises a significant part of your business within your reporting boundary
No
ICT3.1
Please provide a description of the parts of your business that fall under "manufacture or assembly of hardware/components"
ICT3.2
Please provide your absolute Scope 1 and 2 emissions and electricity consumption for the manufacture or assembly of hardware/components part of your business
Business activity
Scope 1 emissions (metric tonnes CO2e)
Scope 2 emissions (metric tonnes CO2e)
Annual electricity consumption (MWh)
Electricity data collection method
ICT3.3
Please identify the percentage of your products meeting recognized energy efficiency standards/specifications by sales weighted volume (full product range)
Product type
Standard (sleep mode)
Percentage of products meeting the
standard by sales volume (sleep mode)
Standard (standby mode)
Percentage of products meeting the
standard by sales volume (standby
mode)
Standard (in use mode)
Percentage of products meeting the
standard by sales volume (in use mode)
Comment
ICT3.4
Of the new products released in the reporting year, please identify the percentage (as a percentage of all new products in that product type category) that meet recognized energy efficiency standards/specifications
Product type
Standard (sleep mode)
Percentage of new products meeting
the standard (sleep mode)
Standard (standby mode)
Percentage of new products meeting
the standard (standby mode)
Standard (in use mode)
Percentage of new products meeting
the standard (in use mode)
Comment
ICT3.5
Please describe the efforts your organization has made to improve the energy efficiency of your products
ICT3.6
Please describe the GHG emissions abatement measures you have employed specifically in your ICT manufacturing operations
ICT3.7
Do you provide carbon emissions data to your clients regarding the hardware/component products they procure?
ICT3.7a
How do you provide carbon emissions data to your clients regarding the hardware/component products they procure?
Further Information
Page: ICT4. Manufacture of software
ICT0.1d
Please identify whether "manufacture of software" comprises a significant component of your business within your reporting boundary
No
ICT4.1
Please provide a description of the parts of your business that fall under "manufacture of software"
ICT4.2
Please provide your absolute Scope 1 and 2 emissions and electricity consumption for the software manufacture component of your business
Business activity
Scope 1 emissions (metric tonnes CO2e)
Scope 2 emissions (metric tonnes CO2e)
Annual electricity consumption (MWh)
Electricity data collection method
ICT4.3
Please describe your gross combined Scope 1 and 2 emissions for the software manufacture component of your business in metric tonnes CO2e per unit of production
Intensity figure
Metric numerator
Metric denominator
% change from previous year
Direction of change from previous year
Reason for change
ICT4.4
What percentage of your software sales (by volume) is in an electronic format?
ICT4.5
Do you provide carbon emissions data to your clients regarding the software products they procure?
ICT4.5a
How do you provide carbon emissions data to your clients regarding the software products they procure?
Further Information
Page: ICT5. Business services (office based activities)
ICT0.1e
Please identify whether "business services (office based activities)" comprise a significant component of your business within your reporting boundary
No
ICT5.1
Please provide a description of the parts of your business that fall under "business services (office based activities)"
ICT5.2
Please provide your absolute Scope 1 and 2 emissions and electricity consumption for the business services (office based activities) component of your business
Business activity
Scope 1 emissions (metric tonnes CO2e)
Scope 2 emissions (metric tonnes CO2e)
Annual electricity consumption (MWh)
Electricity data collection method
ICT5.3
Please describe your gross combined Scope 1 and 2 emissions for the business services (office based activities) component of your business in metric tonnes per square meter
Intensity figure
Metric numerator
Metric denominator
% change from previous year
Direction of change from previous year
Reason for change
ICT5.4
Please describe your electricity use for the provision of business services (office based activities) component of your business in MWh per square meter
Intensity figure
Metric numerator
Metric denominator
% change from previous year
Direction of change from previous year
Reason for change
Further Information
Page: ICT6. Other activities
ICT0.1f
Please identify whether "other activities" comprise a significant component of your business within your reporting boundary
No
ICT6.1
Please provide a description of the parts of your business that fall under "other"
ICT6.2
Please provide your absolute Scope 1 and 2 emissions and electricity consumption for the identified other activity component of your business
Activity
Scope 1 emissions (metric tonnes CO2e)
Scope 2 emissions (metric tonnes CO2e)
Annual electricity consumption (MWh)
Electricity data collection method
ICT6.3
Please describe your gross combined Scope 1 and 2 emissions for your defined additional activity using an appropriate activity based intensity metric
Activity
Intensity figure
Metric numerator
Metric denominator
% change from previous year
Direction of change from previous year
Reason for change
ICT6.4
If appropriate, please describe your electricity use for your defined additional activity using an appropriate activity based intensity metric
Activity
Intensity figure
Metric numerator
Metric denominator
% change from previous year
Direction of change from previous year
Reason for change
Further Information
CDP 2015 Climate Change 2015 Information Request