Embed Size (px)
Citation preview
11
Research Analyst:Binod Modi
Contact: (022) 41681371/9870009382Email: [email protected]
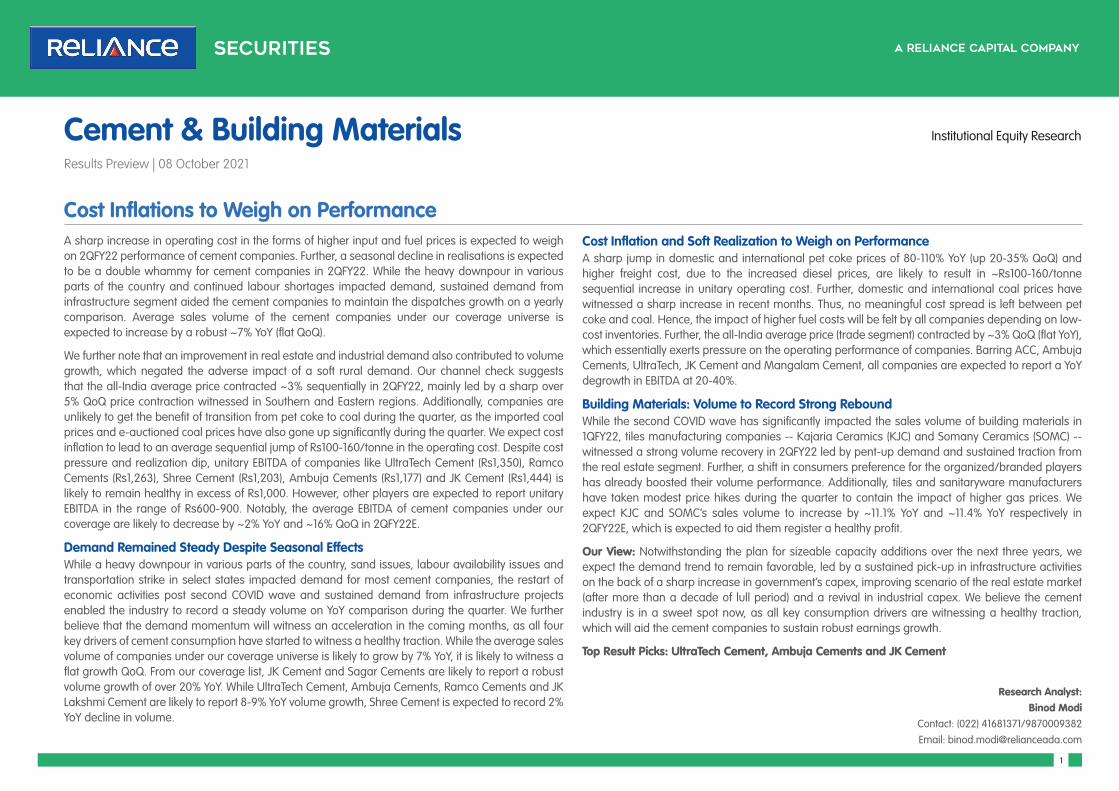
Cost Inflations to Weigh on PerformanceA sharp increase in operating cost in the forms of higher input and fuel prices is expected to weigh on 2QFY22 performance of cement companies. Further, a seasonal decline in realisations is expected to be a double whammy for cement companies in 2QFY22. While the heavy downpour in various parts of the country and continued labour shortages impacted demand, sustained demand from infrastructure segment aided the cement companies to maintain the dispatches growth on a yearly comparison. Average sales volume of the cement companies under our coverage universe is expected to increase by a robust ~7% YoY (flat QoQ).
We further note that an improvement in real estate and industrial demand also contributed to volume growth, which negated the adverse impact of a soft rural demand. Our channel check suggests that the all-India average price contracted ~3% sequentially in 2QFY22, mainly led by a sharp over 5% QoQ price contraction witnessed in Southern and Eastern regions. Additionally, companies are unlikely to get the benefit of transition from pet coke to coal during the quarter, as the imported coal prices and e-auctioned coal prices have also gone up significantly during the quarter. We expect cost inflation to lead to an average sequential jump of Rs100-160/tonne in the operating cost. Despite cost pressure and realization dip, unitary EBITDA of companies like UltraTech Cement (Rs1,350), Ramco Cements (Rs1,263), Shree Cement (Rs1,203), Ambuja Cements (Rs1,177) and JK Cement (Rs1,444) is likely to remain healthy in excess of Rs1,000. However, other players are expected to report unitary EBITDA in the range of Rs600-900. Notably, the average EBITDA of cement companies under our coverage are likely to decrease by ~2% YoY and ~16% QoQ in 2QFY22E.
Demand Remained Steady Despite Seasonal EffectsWhile a heavy downpour in various parts of the country, sand issues, labour availability issues and transportation strike in select states impacted demand for most cement companies, the restart of economic activities post second COVID wave and sustained demand from infrastructure projects enabled the industry to record a steady volume on YoY comparison during the quarter. We further believe that the demand momentum will witness an acceleration in the coming months, as all four key drivers of cement consumption have started to witness a healthy traction. While the average sales volume of companies under our coverage universe is likely to grow by 7% YoY, it is likely to witness a flat growth QoQ. From our coverage list, JK Cement and Sagar Cements are likely to report a robust volume growth of over 20% YoY. While UltraTech Cement, Ambuja Cements, Ramco Cements and JK Lakshmi Cement are likely to report 8-9% YoY volume growth, Shree Cement is expected to record 2% YoY decline in volume.
Cost Inflation and Soft Realization to Weigh on Performance A sharp jump in domestic and international pet coke prices of 80-110% YoY (up 20-35% QoQ) and higher freight cost, due to the increased diesel prices, are likely to result in ~Rs100-160/tonne sequential increase in unitary operating cost. Further, domestic and international coal prices have witnessed a sharp increase in recent months. Thus, no meaningful cost spread is left between pet coke and coal. Hence, the impact of higher fuel costs will be felt by all companies depending on low-cost inventories. Further, the all-India average price (trade segment) contracted by ~3% QoQ (flat YoY), which essentially exerts pressure on the operating performance of companies. Barring ACC, Ambuja Cements, UltraTech, JK Cement and Mangalam Cement, all companies are expected to report a YoY degrowth in EBITDA at 20-40%.
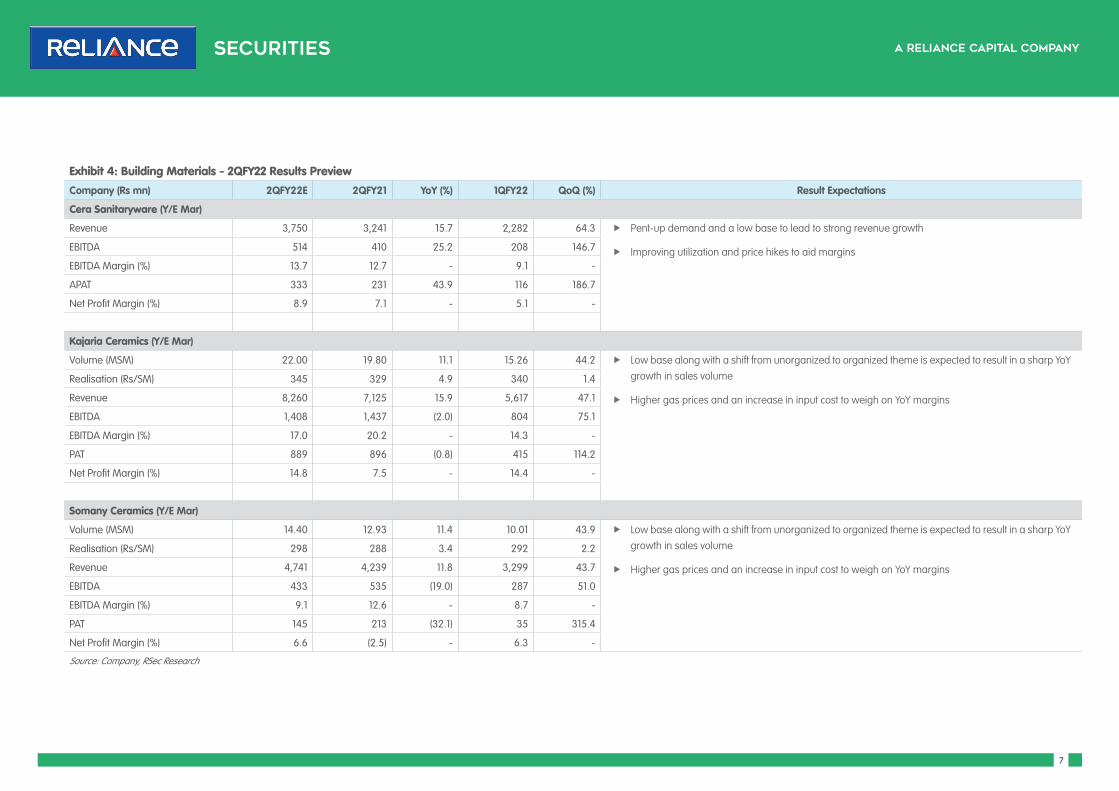
Building Materials: Volume to Record Strong ReboundWhile the second COVID wave has significantly impacted the sales volume of building materials in 1QFY22, tiles manufacturing companies -- Kajaria Ceramics (KJC) and Somany Ceramics (SOMC) -- witnessed a strong volume recovery in 2QFY22 led by pent-up demand and sustained traction from the real estate segment. Further, a shift in consumers preference for the organized/branded players has already boosted their volume performance. Additionally, tiles and sanitaryware manufacturers have taken modest price hikes during the quarter to contain the impact of higher gas prices. We expect KJC and SOMC’s sales volume to increase by ~11.1% YoY and ~11.4% YoY respectively in 2QFY22E, which is expected to aid them register a healthy profit.
Our View: Notwithstanding the plan for sizeable capacity additions over the next three years, we expect the demand trend to remain favorable, led by a sustained pick-up in infrastructure activities on the back of a sharp increase in government’s capex, improving scenario of the real estate market (after more than a decade of lull period) and a revival in industrial capex. We believe the cement industry is in a sweet spot now, as all key consumption drivers are witnessing a healthy traction, which will aid the cement companies to sustain robust earnings growth.
Top Result Picks: UltraTech Cement, Ambuja Cements and JK Cement
Cement & Building Materials Institutional Equity Research
Results Preview | 08 October 2021
22
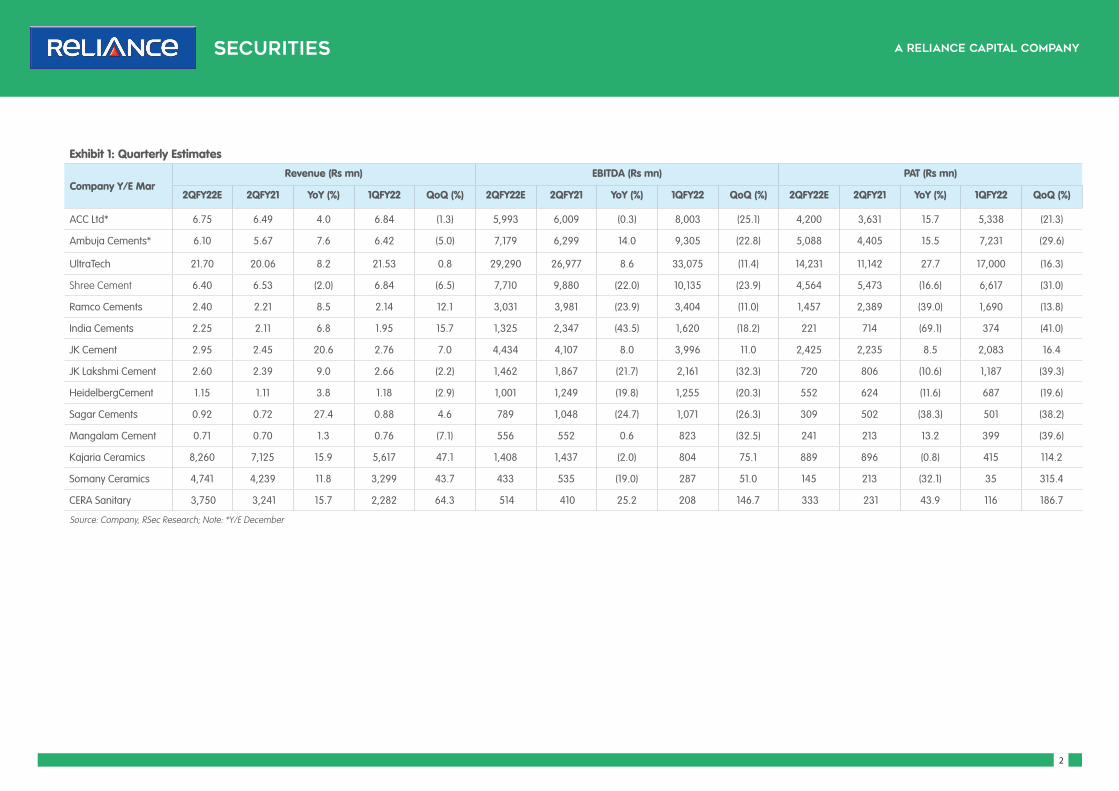
Exhibit 1: Quarterly Estimates
Company Y/E MarRevenue (Rs mn) EBITDA (Rs mn) PAT (Rs mn)
2QFY22E 2QFY21 YoY (%) 1QFY22 QoQ (%) 2QFY22E 2QFY21 YoY (%) 1QFY22 QoQ (%) 2QFY22E 2QFY21 YoY (%) 1QFY22 QoQ (%)
ACC Ltd* 6.75 6.49 4.0 6.84 (1.3) 5,993 6,009 (0.3) 8,003 (25.1) 4,200 3,631 15.7 5,338 (21.3)
Ambuja Cements* 6.10 5.67 7.6 6.42 (5.0) 7,179 6,299 14.0 9,305 (22.8) 5,088 4,405 15.5 7,231 (29.6)
UltraTech 21.70 20.06 8.2 21.53 0.8 29,290 26,977 8.6 33,075 (11.4) 14,231 11,142 27.7 17,000 (16.3)
Shree Cement 6.40 6.53 (2.0) 6.84 (6.5) 7,710 9,880 (22.0) 10,135 (23.9) 4,564 5,473 (16.6) 6,617 (31.0)
Ramco Cements 2.40 2.21 8.5 2.14 12.1 3,031 3,981 (23.9) 3,404 (11.0) 1,457 2,389 (39.0) 1,690 (13.8)
India Cements 2.25 2.11 6.8 1.95 15.7 1,325 2,347 (43.5) 1,620 (18.2) 221 714 (69.1) 374 (41.0)
JK Cement 2.95 2.45 20.6 2.76 7.0 4,434 4,107 8.0 3,996 11.0 2,425 2,235 8.5 2,083 16.4
JK Lakshmi Cement 2.60 2.39 9.0 2.66 (2.2) 1,462 1,867 (21.7) 2,161 (32.3) 720 806 (10.6) 1,187 (39.3)
HeidelbergCement 1.15 1.11 3.8 1.18 (2.9) 1,001 1,249 (19.8) 1,255 (20.3) 552 624 (11.6) 687 (19.6)
Sagar Cements 0.92 0.72 27.4 0.88 4.6 789 1,048 (24.7) 1,071 (26.3) 309 502 (38.3) 501 (38.2)
Mangalam Cement 0.71 0.70 1.3 0.76 (7.1) 556 552 0.6 823 (32.5) 241 213 13.2 399 (39.6)
Kajaria Ceramics 8,260 7,125 15.9 5,617 47.1 1,408 1,437 (2.0) 804 75.1 889 896 (0.8) 415 114.2
Somany Ceramics 4,741 4,239 11.8 3,299 43.7 433 535 (19.0) 287 51.0 145 213 (32.1) 35 315.4
CERA Sanitary 3,750 3,241 15.7 2,282 64.3 514 410 25.2 208 146.7 333 231 43.9 116 186.7
Source: Company, RSec Research; Note: *Y/E December
33
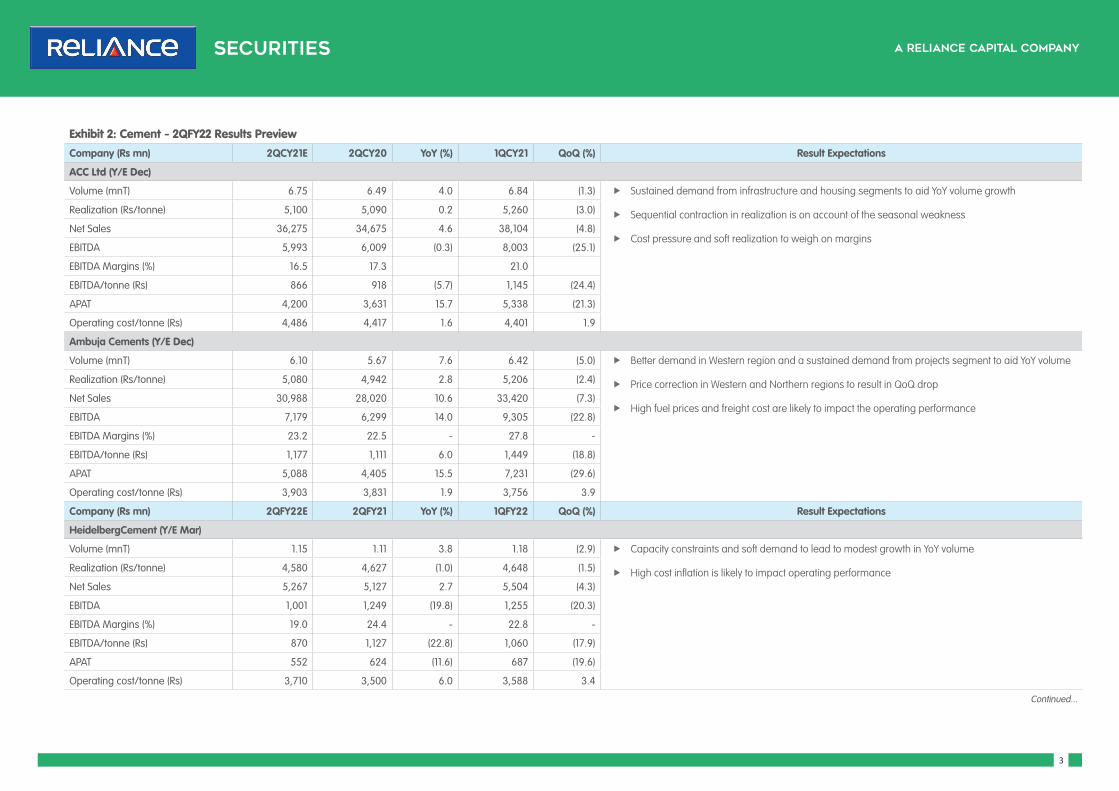
Exhibit 2: Cement - 2QFY22 Results PreviewCompany (Rs mn) 2QCY21E 2QCY20 YoY (%) 1QCY21 QoQ (%) Result Expectations
ACC Ltd (Y/E Dec)
Volume (mnT) 6.75 6.49 4.0 6.84 (1.3) f Sustained demand from infrastructure and housing segments to aid YoY volume growth
f Sequential contraction in realization is on account of the seasonal weakness
f Cost pressure and soft realization to weigh on margins
Realization (Rs/tonne) 5,100 5,090 0.2 5,260 (3.0)
Net Sales 36,275 34,675 4.6 38,104 (4.8)
EBITDA 5,993 6,009 (0.3) 8,003 (25.1)
EBITDA Margins (%) 16.5 17.3 21.0
EBITDA/tonne (Rs) 866 918 (5.7) 1,145 (24.4)
APAT 4,200 3,631 15.7 5,338 (21.3)
Operating cost/tonne (Rs) 4,486 4,417 1.6 4,401 1.9
Ambuja Cements (Y/E Dec)
Volume (mnT) 6.10 5.67 7.6 6.42 (5.0) f Better demand in Western region and a sustained demand from projects segment to aid YoY volume
f Price correction in Western and Northern regions to result in QoQ drop
f High fuel prices and freight cost are likely to impact the operating performance
Realization (Rs/tonne) 5,080 4,942 2.8 5,206 (2.4)
Net Sales 30,988 28,020 10.6 33,420 (7.3)
EBITDA 7,179 6,299 14.0 9,305 (22.8)
EBITDA Margins (%) 23.2 22.5 - 27.8 -
EBITDA/tonne (Rs) 1,177 1,111 6.0 1,449 (18.8)
APAT 5,088 4,405 15.5 7,231 (29.6)
Operating cost/tonne (Rs) 3,903 3,831 1.9 3,756 3.9
Company (Rs mn) 2QFY22E 2QFY21 YoY (%) 1QFY22 QoQ (%) Result Expectations
HeidelbergCement (Y/E Mar)
Volume (mnT) 1.15 1.11 3.8 1.18 (2.9) f Capacity constraints and soft demand to lead to modest growth in YoY volume
f High cost inflation is likely to impact operating performance Realization (Rs/tonne) 4,580 4,627 (1.0) 4,648 (1.5)
Net Sales 5,267 5,127 2.7 5,504 (4.3)
EBITDA 1,001 1,249 (19.8) 1,255 (20.3)
EBITDA Margins (%) 19.0 24.4 - 22.8 -
EBITDA/tonne (Rs) 870 1,127 (22.8) 1,060 (17.9)
APAT 552 624 (11.6) 687 (19.6)
Operating cost/tonne (Rs) 3,710 3,500 6.0 3,588 3.4
Continued...
44
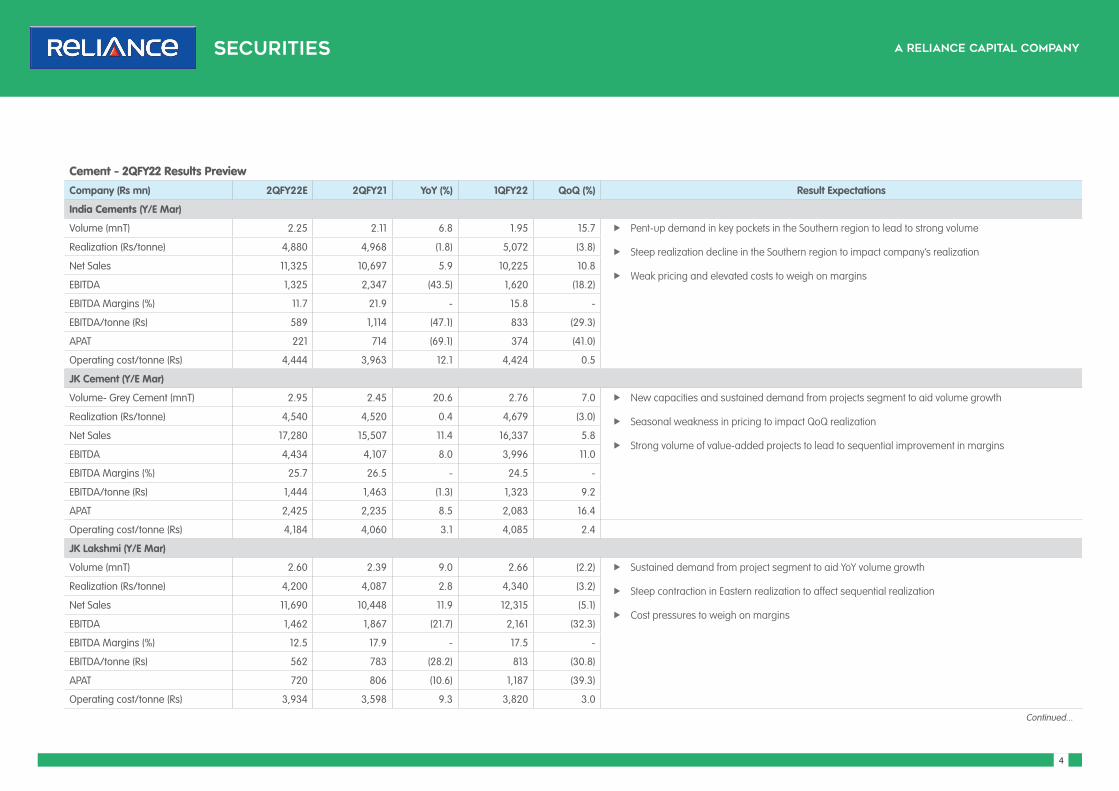
Cement - 2QFY22 Results PreviewCompany (Rs mn) 2QFY22E 2QFY21 YoY (%) 1QFY22 QoQ (%) Result Expectations
India Cements (Y/E Mar)
Volume (mnT) 2.25 2.11 6.8 1.95 15.7 f Pent-up demand in key pockets in the Southern region to lead to strong volume
f Steep realization decline in the Southern region to impact company’s realization
f Weak pricing and elevated costs to weigh on margins
Realization (Rs/tonne) 4,880 4,968 (1.8) 5,072 (3.8)
Net Sales 11,325 10,697 5.9 10,225 10.8
EBITDA 1,325 2,347 (43.5) 1,620 (18.2)
EBITDA Margins (%) 11.7 21.9 - 15.8 -
EBITDA/tonne (Rs) 589 1,114 (47.1) 833 (29.3)
APAT 221 714 (69.1) 374 (41.0)
Operating cost/tonne (Rs) 4,444 3,963 12.1 4,424 0.5
JK Cement (Y/E Mar)
Volume- Grey Cement (mnT) 2.95 2.45 20.6 2.76 7.0 f New capacities and sustained demand from projects segment to aid volume growth
f Seasonal weakness in pricing to impact QoQ realization
f Strong volume of value-added projects to lead to sequential improvement in margins
Realization (Rs/tonne) 4,540 4,520 0.4 4,679 (3.0)
Net Sales 17,280 15,507 11.4 16,337 5.8
EBITDA 4,434 4,107 8.0 3,996 11.0
EBITDA Margins (%) 25.7 26.5 - 24.5 -
EBITDA/tonne (Rs) 1,444 1,463 (1.3) 1,323 9.2
APAT 2,425 2,235 8.5 2,083 16.4
Operating cost/tonne (Rs) 4,184 4,060 3.1 4,085 2.4
JK Lakshmi (Y/E Mar)
Volume (mnT) 2.60 2.39 9.0 2.66 (2.2) f Sustained demand from project segment to aid YoY volume growth
f Steep contraction in Eastern realization to affect sequential realization
f Cost pressures to weigh on margins
Realization (Rs/tonne) 4,200 4,087 2.8 4,340 (3.2)
Net Sales 11,690 10,448 11.9 12,315 (5.1)
EBITDA 1,462 1,867 (21.7) 2,161 (32.3)
EBITDA Margins (%) 12.5 17.9 - 17.5 -
EBITDA/tonne (Rs) 562 783 (28.2) 813 (30.8)
APAT 720 806 (10.6) 1,187 (39.3)
Operating cost/tonne (Rs) 3,934 3,598 9.3 3,820 3.0
Continued...
55
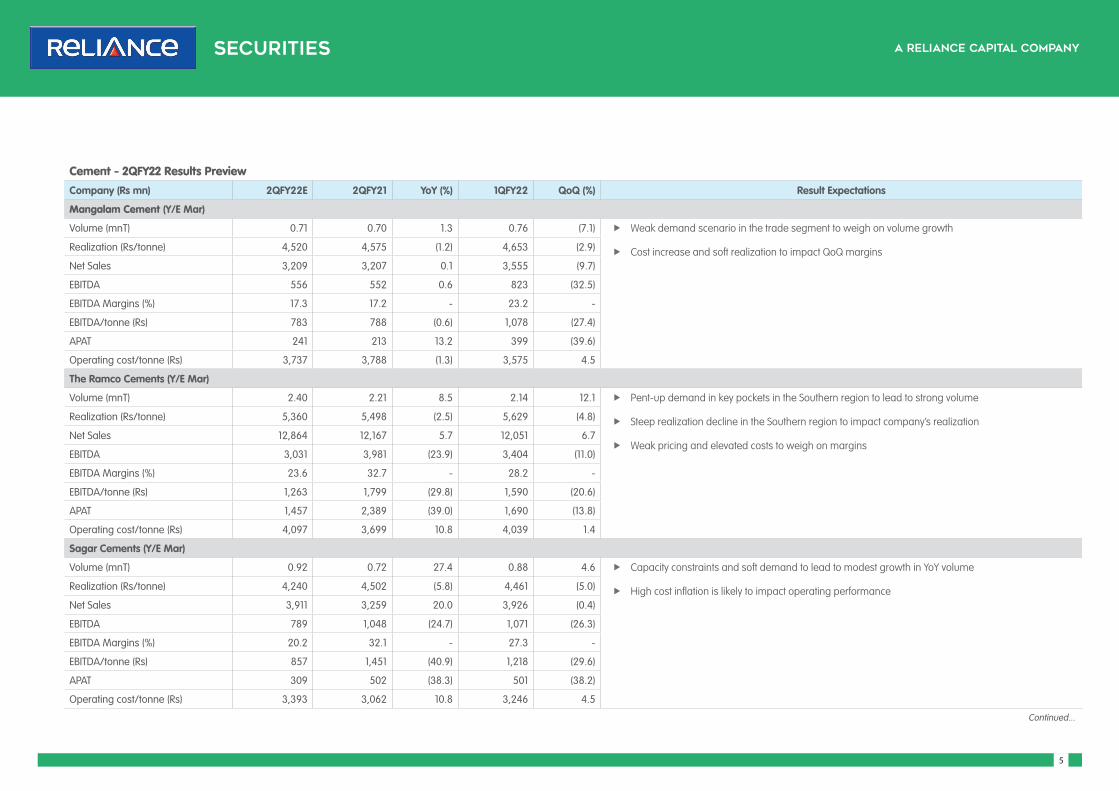
Cement - 2QFY22 Results PreviewCompany (Rs mn) 2QFY22E 2QFY21 YoY (%) 1QFY22 QoQ (%) Result Expectations
Mangalam Cement (Y/E Mar)
Volume (mnT) 0.71 0.70 1.3 0.76 (7.1) f Weak demand scenario in the trade segment to weigh on volume growth
f Cost increase and soft realization to impact QoQ marginsRealization (Rs/tonne) 4,520 4,575 (1.2) 4,653 (2.9)
Net Sales 3,209 3,207 0.1 3,555 (9.7)
EBITDA 556 552 0.6 823 (32.5)
EBITDA Margins (%) 17.3 17.2 - 23.2 -
EBITDA/tonne (Rs) 783 788 (0.6) 1,078 (27.4)
APAT 241 213 13.2 399 (39.6)
Operating cost/tonne (Rs) 3,737 3,788 (1.3) 3,575 4.5
The Ramco Cements (Y/E Mar)
Volume (mnT) 2.40 2.21 8.5 2.14 12.1 f Pent-up demand in key pockets in the Southern region to lead to strong volume
f Steep realization decline in the Southern region to impact company’s realization
f Weak pricing and elevated costs to weigh on margins
Realization (Rs/tonne) 5,360 5,498 (2.5) 5,629 (4.8)
Net Sales 12,864 12,167 5.7 12,051 6.7
EBITDA 3,031 3,981 (23.9) 3,404 (11.0)
EBITDA Margins (%) 23.6 32.7 - 28.2 -
EBITDA/tonne (Rs) 1,263 1,799 (29.8) 1,590 (20.6)
APAT 1,457 2,389 (39.0) 1,690 (13.8)
Operating cost/tonne (Rs) 4,097 3,699 10.8 4,039 1.4
Sagar Cements (Y/E Mar)
Volume (mnT) 0.92 0.72 27.4 0.88 4.6 f Capacity constraints and soft demand to lead to modest growth in YoY volume
f High cost inflation is likely to impact operating performance Realization (Rs/tonne) 4,240 4,502 (5.8) 4,461 (5.0)
Net Sales 3,911 3,259 20.0 3,926 (0.4)
EBITDA 789 1,048 (24.7) 1,071 (26.3)
EBITDA Margins (%) 20.2 32.1 - 27.3 -
EBITDA/tonne (Rs) 857 1,451 (40.9) 1,218 (29.6)
APAT 309 502 (38.3) 501 (38.2)
Operating cost/tonne (Rs) 3,393 3,062 10.8 3,246 4.5
Continued...
66
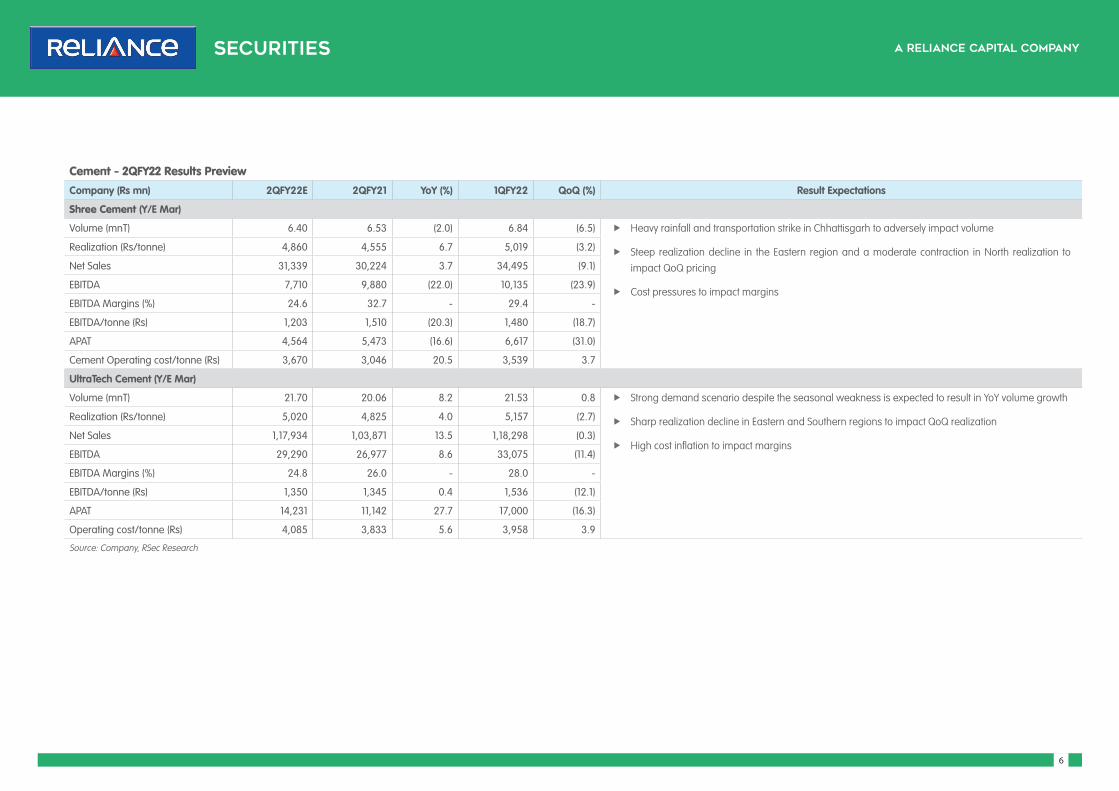
Cement - 2QFY22 Results PreviewCompany (Rs mn) 2QFY22E 2QFY21 YoY (%) 1QFY22 QoQ (%) Result Expectations
Shree Cement (Y/E Mar)
Volume (mnT) 6.40 6.53 (2.0) 6.84 (6.5) f Heavy rainfall and transportation strike in Chhattisgarh to adversely impact volume
f Steep realization decline in the Eastern region and a moderate contraction in North realization to impact QoQ pricing
f Cost pressures to impact margins
Realization (Rs/tonne) 4,860 4,555 6.7 5,019 (3.2)
Net Sales 31,339 30,224 3.7 34,495 (9.1)
EBITDA 7,710 9,880 (22.0) 10,135 (23.9)
EBITDA Margins (%) 24.6 32.7 - 29.4 -
EBITDA/tonne (Rs) 1,203 1,510 (20.3) 1,480 (18.7)
APAT 4,564 5,473 (16.6) 6,617 (31.0)
Cement Operating cost/tonne (Rs) 3,670 3,046 20.5 3,539 3.7
UltraTech Cement (Y/E Mar)
Volume (mnT) 21.70 20.06 8.2 21.53 0.8 f Strong demand scenario despite the seasonal weakness is expected to result in YoY volume growth
f Sharp realization decline in Eastern and Southern regions to impact QoQ realization
f High cost inflation to impact margins
Realization (Rs/tonne) 5,020 4,825 4.0 5,157 (2.7)
Net Sales 1,17,934 1,03,871 13.5 1,18,298 (0.3)
EBITDA 29,290 26,977 8.6 33,075 (11.4)
EBITDA Margins (%) 24.8 26.0 - 28.0 -
EBITDA/tonne (Rs) 1,350 1,345 0.4 1,536 (12.1)
APAT 14,231 11,142 27.7 17,000 (16.3)
Operating cost/tonne (Rs) 4,085 3,833 5.6 3,958 3.9
Source: Company, RSec Research
77
Exhibit 4: Building Materials - 2QFY22 Results PreviewCompany (Rs mn) 2QFY22E 2QFY21 YoY (%) 1QFY22 QoQ (%) Result Expectations
Cera Sanitaryware (Y/E Mar)
Revenue 3,750 3,241 15.7 2,282 64.3 f Pent-up demand and a low base to lead to strong revenue growth
f Improving utilization and price hikes to aid marginsEBITDA 514 410 25.2 208 146.7
EBITDA Margin (%) 13.7 12.7 - 9.1 -
APAT 333 231 43.9 116 186.7
Net Profit Margin (%) 8.9 7.1 - 5.1 -
Kajaria Ceramics (Y/E Mar)
Volume (MSM) 22.00 19.80 11.1 15.26 44.2 f Low base along with a shift from unorganized to organized theme is expected to result in a sharp YoY growth in sales volume
f Higher gas prices and an increase in input cost to weigh on YoY margins
Realisation (Rs/SM) 345 329 4.9 340 1.4
Revenue 8,260 7,125 15.9 5,617 47.1
EBITDA 1,408 1,437 (2.0) 804 75.1
EBITDA Margin (%) 17.0 20.2 - 14.3 -
PAT 889 896 (0.8) 415 114.2
Net Profit Margin (%) 14.8 7.5 - 14.4 -
Somany Ceramics (Y/E Mar)
Volume (MSM) 14.40 12.93 11.4 10.01 43.9 f Low base along with a shift from unorganized to organized theme is expected to result in a sharp YoY growth in sales volume
f Higher gas prices and an increase in input cost to weigh on YoY margins
Realisation (Rs/SM) 298 288 3.4 292 2.2
Revenue 4,741 4,239 11.8 3,299 43.7
EBITDA 433 535 (19.0) 287 51.0
EBITDA Margin (%) 9.1 12.6 - 8.7 -
PAT 145 213 (32.1) 35 315.4
Net Profit Margin (%) 6.6 (2.5) - 6.3 -
Source: Company, RSec Research

88
Reliance Securities Limited (RSL), the broking arm of Reliance Capital is one of the India’s leading retail broking houses. Reliance Capital is amongst India’s leading and most valuable financial services companies in the private sector. Reliance Capital has interests in asset management and mutual funds, life and general insurance, commercial finance, equities and commodities broking, wealth management services, distribution of financial products, private equity, asset reconstruction, proprietary investments and other activities in financial services. The list of associates of RSL is available on the website www.reliancecapital.co.in. RSL is registered as a Research Analyst under SEBI (Research Analyst) Regulations, 2014
General Disclaimers: This Research Report (hereinafter called ‘Report’) is prepared and distributed by RSL for information purposes only. The recommendations, if any, made herein are expression of views and/or opinions and should not be deemed or construed to be neither advice for the purpose of purchase or sale of any security, derivatives or any other security through RSL nor any solicitation or offering of any investment /trading opportunity on behalf of the issuer(s) of the respective security(ies) referred to herein. These information / opinions / views are not meant to serve as a professional investment guide for the readers. No action is solicited based upon the information provided herein. Recipients of this Report should rely on information/data arising out of their own investigations. Readers are advised to seek independent professional advice and arrive at an informed trading/investment decision before executing any trades or making any investments. This Report has been prepared on the basis of publicly available information, internally developed data and other sources believed by RSL to be reliable. RSL or its directors, employees, affiliates or representatives do not assume any responsibility for, or warrant the accuracy, completeness, adequacy and reliability of such information / opinions / views. While due care has been taken to ensure that the disclosures and opinions given are fair and reasonable, none of the directors, employees, affiliates or representatives of RSL shall be liable for any direct, indirect, special, incidental, consequential, punitive or exemplary damages, including lost profits arising in any way whatsoever from the information / opinions / views contained in this Report.
Risks: Trading and investment in securities are subject to market risks. There are no assurances or guarantees that the objectives of any of trading / investment in securities will be achieved. The trades/ investments referred to herein may not be suitable to all categories of traders/investors. The names of securities mentioned herein do not in any manner indicate their prospects or returns. The value of securities referred to herein may be adversely affected by the performance or otherwise of the respective issuer companies, changes in the market conditions, micro and macro factors and forces affecting capital markets like interest rate risk, credit risk, liquidity risk and reinvestment risk. Derivative products may also be affected by various risks including but not limited to counter party risk, market risk, valuation risk, liquidity risk and other risks. Besides the price of the underlying asset, volatility, tenor and interest rates may affect the pricing of derivatives.
Disclaimers in respect of jurisdiction: The possession, circulation and/or distribution of this Report may be restricted or regulated in certain jurisdictions by appropriate laws. No action has been or will be taken by RSL in any jurisdiction (other than India), where any action for such purpose(s) is required. Accordingly, this Report shall not be possessed, circulated and/or distributed in any such country or jurisdiction unless such action is in compliance with all applicable laws and regulations of such country or jurisdiction. RSL requires such recipient to inform himself about and to observe any restrictions at his own expense, without any liability to RSL. Any dispute arising out of this Report shall be subject to the exclusive jurisdiction of the Courts in India.
Disclosure of Interest: The research analysts who have prepared this Report hereby certify that the views /opinions expressed in this Report are their personal independent views/opinions in respect of the securities and their respective issuers. None of RSL, research analysts, or their relatives had any known direct /indirect material conflict of interest including any long/short position(s) in any specific security on which views/opinions have been made in this Report, during its preparation. RSL’s Associates may have other potential/material conflict of interest with respect to any recommendation and related information and opinions at the time of publication of research report. RSL, its Associates, the research analysts, or their relatives might have financial interest in the issuer company(ies) of the said securities. RSL or its Associates may have received a compensation from the said issuer company(ies) in last 12 months for the brokerage or non brokerage services.RSL, its Associates, the research analysts or their relatives have not received any compensation or other benefits directly or indirectly from the said issuer company(ies) or any third party in last 12 months in any respect whatsoever for preparation of this report.
The research analysts has served as an officer, director or employee of the said issuer company(ies)?: No
RSL, its Associates, the research analysts or their relatives holds ownership of 1% or more, in respect of the said issuer company(ies).?: No
Copyright: The copyright in this Report belongs exclusively to RSL. This Report shall only be read by those persons to whom it has been delivered. No reprinting, reproduction, copying, distribution of this Report in any manner whatsoever, in whole or in part, is permitted without the prior express written consent of RSL.
RSL’s activities were neither suspended nor have defaulted with any stock exchange with whom RSL is registered. Further, there does not exist any material adverse order/judgments/strictures assessed by any regulatory, government or public authority or agency or any law enforcing agency in last three years. Further, there does not exist any material enquiry of whatsoever nature instituted or pending against RSL as on the date of this Report.
Important These disclaimers, risks and other disclosures must be read in conjunction with the information / opinions / views of which they form part of.
RSL CIN: U65990MH2005PLC154052. SEBI registration no. (Stock Broker: INZ000172433, Depository Participants: CDSL IN-DP-257-2016 IN-DP-NSDL-363-2013, Research Analyst: INH000002384); AMFI ARN No.29889.
Change in Ratings
We have changed our rating system and included HOLD recommendation. We have BUY, HOLD and SELL recommendation now.
We have also shifted to 1-Year Target Price from 2-Year Target Price.