Embed Size (px)
Citation preview
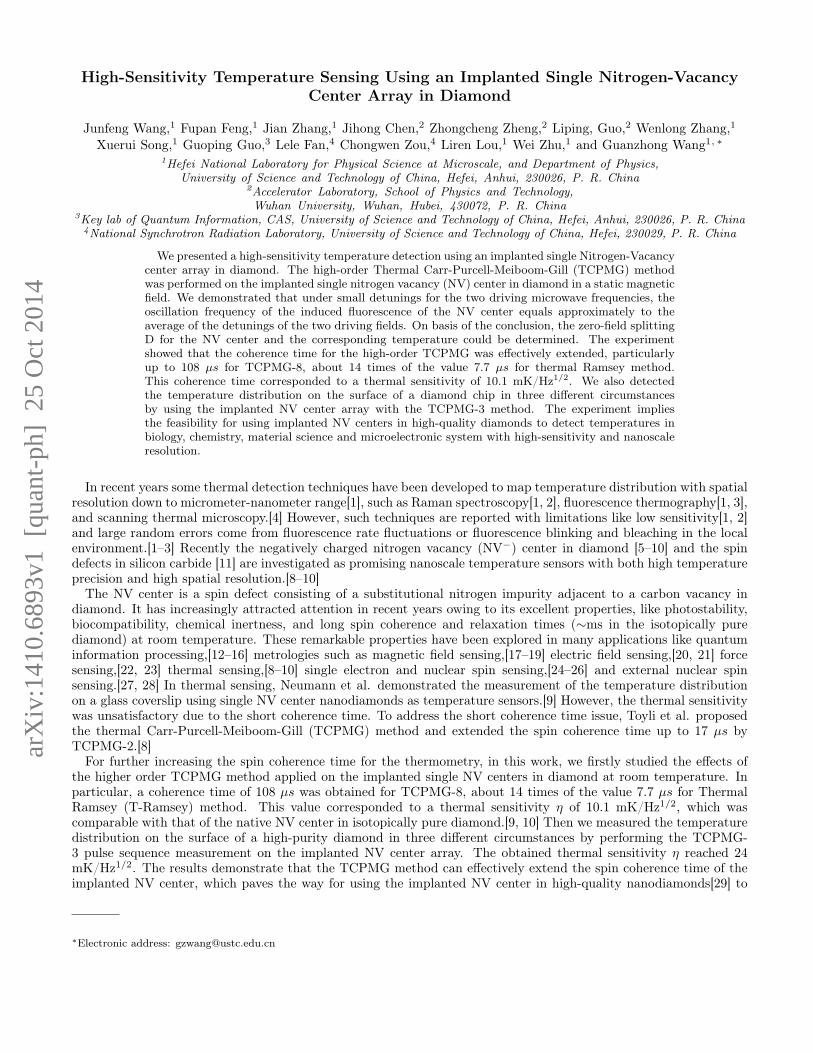
High-Sensitivity Temperature Sensing Using an Implanted Single Nitrogen-VacancyCenter Array in Diamond
Junfeng Wang,1 Fupan Feng,1 Jian Zhang,1 Jihong Chen,2 Zhongcheng Zheng,2 Liping, Guo,2 Wenlong Zhang,1
Xuerui Song,1 Guoping Guo,3 Lele Fan,4 Chongwen Zou,4 Liren Lou,1 Wei Zhu,1 and Guanzhong Wang1, ∗
1Hefei National Laboratory for Physical Science at Microscale, and Department of Physics,University of Science and Technology of China, Hefei, Anhui, 230026, P. R. China
2Accelerator Laboratory, School of Physics and Technology,Wuhan University, Wuhan, Hubei, 430072, P. R. China
3Key lab of Quantum Information, CAS, University of Science and Technology of China, Hefei, Anhui, 230026, P. R. China4National Synchrotron Radiation Laboratory, University of Science and Technology of China, Hefei, 230029, P. R. China
We presented a high-sensitivity temperature detection using an implanted single Nitrogen-Vacancycenter array in diamond. The high-order Thermal Carr-Purcell-Meiboom-Gill (TCPMG) methodwas performed on the implanted single nitrogen vacancy (NV) center in diamond in a static magneticfield. We demonstrated that under small detunings for the two driving microwave frequencies, theoscillation frequency of the induced fluorescence of the NV center equals approximately to theaverage of the detunings of the two driving fields. On basis of the conclusion, the zero-field splittingD for the NV center and the corresponding temperature could be determined. The experimentshowed that the coherence time for the high-order TCPMG was effectively extended, particularlyup to 108 µs for TCPMG-8, about 14 times of the value 7.7 µs for thermal Ramsey method.This coherence time corresponded to a thermal sensitivity of 10.1 mK/Hz1/2. We also detectedthe temperature distribution on the surface of a diamond chip in three different circumstancesby using the implanted NV center array with the TCPMG-3 method. The experiment impliesthe feasibility for using implanted NV centers in high-quality diamonds to detect temperatures inbiology, chemistry, material science and microelectronic system with high-sensitivity and nanoscaleresolution.
In recent years some thermal detection techniques have been developed to map temperature distribution with spatialresolution down to micrometer-nanometer range[1], such as Raman spectroscopy[1, 2], fluorescence thermography[1, 3],and scanning thermal microscopy.[4] However, such techniques are reported with limitations like low sensitivity[1, 2]and large random errors come from fluorescence rate fluctuations or fluorescence blinking and bleaching in the localenvironment.[1–3] Recently the negatively charged nitrogen vacancy (NV−) center in diamond [5–10] and the spindefects in silicon carbide [11] are investigated as promising nanoscale temperature sensors with both high temperatureprecision and high spatial resolution.[8–10]
The NV center is a spin defect consisting of a substitutional nitrogen impurity adjacent to a carbon vacancy indiamond. It has increasingly attracted attention in recent years owing to its excellent properties, like photostability,biocompatibility, chemical inertness, and long spin coherence and relaxation times (∼ms in the isotopically purediamond) at room temperature. These remarkable properties have been explored in many applications like quantuminformation processing,[12–16] metrologies such as magnetic field sensing,[17–19] electric field sensing,[20, 21] forcesensing,[22, 23] thermal sensing,[8–10] single electron and nuclear spin sensing,[24–26] and external nuclear spinsensing.[27, 28] In thermal sensing, Neumann et al. demonstrated the measurement of the temperature distributionon a glass coverslip using single NV center nanodiamonds as temperature sensors.[9] However, the thermal sensitivitywas unsatisfactory due to the short coherence time. To address the short coherence time issue, Toyli et al. proposedthe thermal Carr-Purcell-Meiboom-Gill (TCPMG) method and extended the spin coherence time up to 17 µs byTCPMG-2.[8]
For further increasing the spin coherence time for the thermometry, in this work, we firstly studied the effects ofthe higher order TCPMG method applied on the implanted single NV centers in diamond at room temperature. Inparticular, a coherence time of 108 µs was obtained for TCPMG-8, about 14 times of the value 7.7 µs for ThermalRamsey (T-Ramsey) method. This value corresponded to a thermal sensitivity η of 10.1 mK/Hz1/2, which wascomparable with that of the native NV center in isotopically pure diamond.[9, 10] Then we measured the temperaturedistribution on the surface of a high-purity diamond in three different circumstances by performing the TCPMG-3 pulse sequence measurement on the implanted NV center array. The obtained thermal sensitivity η reached 24mK/Hz1/2. The results demonstrate that the TCPMG method can effectively extend the spin coherence time of theimplanted NV center, which paves the way for using the implanted NV center in high-quality nanodiamonds[29] to
∗Electronic address: [email protected]
arX
iv:1
410.
6893
v1 [
quan
t-ph
] 2
5 O
ct 2
014
2
D(T)
En
erg
y E
Magnetic field B
|+1>
|-1>
|0>
B
( )b (c)
(d)
Evolution time ( μs)
No
rma
lize
dP
L
No
rma
lize
dP
L
Evolution time ( μs)
(e) ( f )
N
V
C
No
rma
lize
dP
L
Evolution time ( μs)
π/4π/4 π
tt
3π/2+1π/2-1π-1 π-1π+1
t t
3π/2-1π/2-1
π+1 π+1π-1 π-1π-1π+1
tt
(a)
NV array
Copper wireNichrome wire
Diamond chip
TE
T-Ramsey TE
7
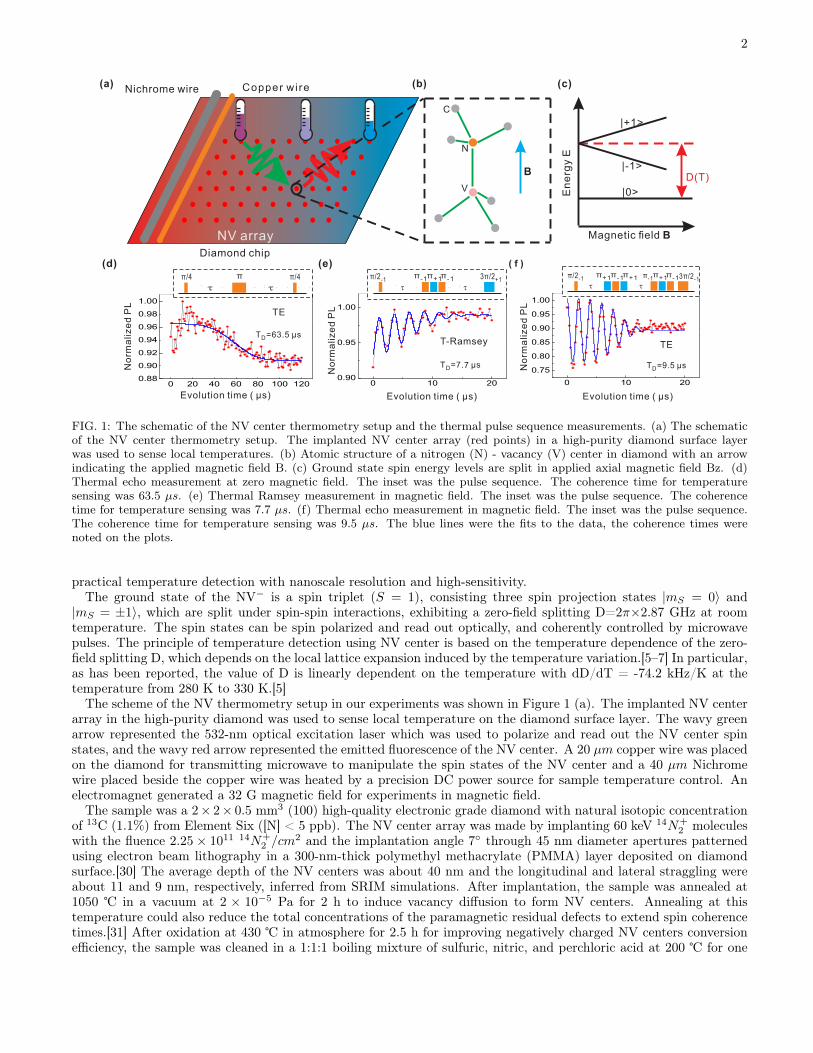
FIG. 1: The schematic of the NV center thermometry setup and the thermal pulse sequence measurements. (a) The schematicof the NV center thermometry setup. The implanted NV center array (red points) in a high-purity diamond surface layerwas used to sense local temperatures. (b) Atomic structure of a nitrogen (N) - vacancy (V) center in diamond with an arrowindicating the applied magnetic field B. (c) Ground state spin energy levels are split in applied axial magnetic field Bz. (d)Thermal echo measurement at zero magnetic field. The inset was the pulse sequence. The coherence time for temperaturesensing was 63.5 µs. (e) Thermal Ramsey measurement in magnetic field. The inset was the pulse sequence. The coherencetime for temperature sensing was 7.7 µs. (f) Thermal echo measurement in magnetic field. The inset was the pulse sequence.The coherence time for temperature sensing was 9.5 µs. The blue lines were the fits to the data, the coherence times werenoted on the plots.
practical temperature detection with nanoscale resolution and high-sensitivity.The ground state of the NV− is a spin triplet (S = 1), consisting three spin projection states |mS = 0〉 and
|mS = ±1〉, which are split under spin-spin interactions, exhibiting a zero-field splitting D=2π×2.87 GHz at roomtemperature. The spin states can be spin polarized and read out optically, and coherently controlled by microwavepulses. The principle of temperature detection using NV center is based on the temperature dependence of the zero-field splitting D, which depends on the local lattice expansion induced by the temperature variation.[5–7] In particular,as has been reported, the value of D is linearly dependent on the temperature with dD/dT = -74.2 kHz/K at thetemperature from 280 K to 330 K.[5]
The scheme of the NV thermometry setup in our experiments was shown in Figure 1 (a). The implanted NV centerarray in the high-purity diamond was used to sense local temperature on the diamond surface layer. The wavy greenarrow represented the 532-nm optical excitation laser which was used to polarize and read out the NV center spinstates, and the wavy red arrow represented the emitted fluorescence of the NV center. A 20 µm copper wire was placedon the diamond for transmitting microwave to manipulate the spin states of the NV center and a 40 µm Nichromewire placed beside the copper wire was heated by a precision DC power source for sample temperature control. Anelectromagnet generated a 32 G magnetic field for experiments in magnetic field.
The sample was a 2× 2× 0.5 mm3 (100) high-quality electronic grade diamond with natural isotopic concentrationof 13C (1.1%) from Element Six ([N] < 5 ppb). The NV center array was made by implanting 60 keV 14N+
2 moleculeswith the fluence 2.25 × 10¹¹ 14N+
2 /cm2 and the implantation angle 7◦ through 45 nm diameter apertures patterned
using electron beam lithography in a 300-nm-thick polymethyl methacrylate (PMMA) layer deposited on diamondsurface.[30] The average depth of the NV centers was about 40 nm and the longitudinal and lateral straggling wereabout 11 and 9 nm, respectively, inferred from SRIM simulations. After implantation, the sample was annealed at1050 ℃ in a vacuum at 2 × 10⁻⁵ Pa for 2 h to induce vacancy diffusion to form NV centers. Annealing at thistemperature could also reduce the total concentrations of the paramagnetic residual defects to extend spin coherencetimes.[31] After oxidation at 430 ℃ in atmosphere for 2.5 h for improving negatively charged NV centers conversionefficiency, the sample was cleaned in a 1:1:1 boiling mixture of sulfuric, nitric, and perchloric acid at 200 ℃ for one
3
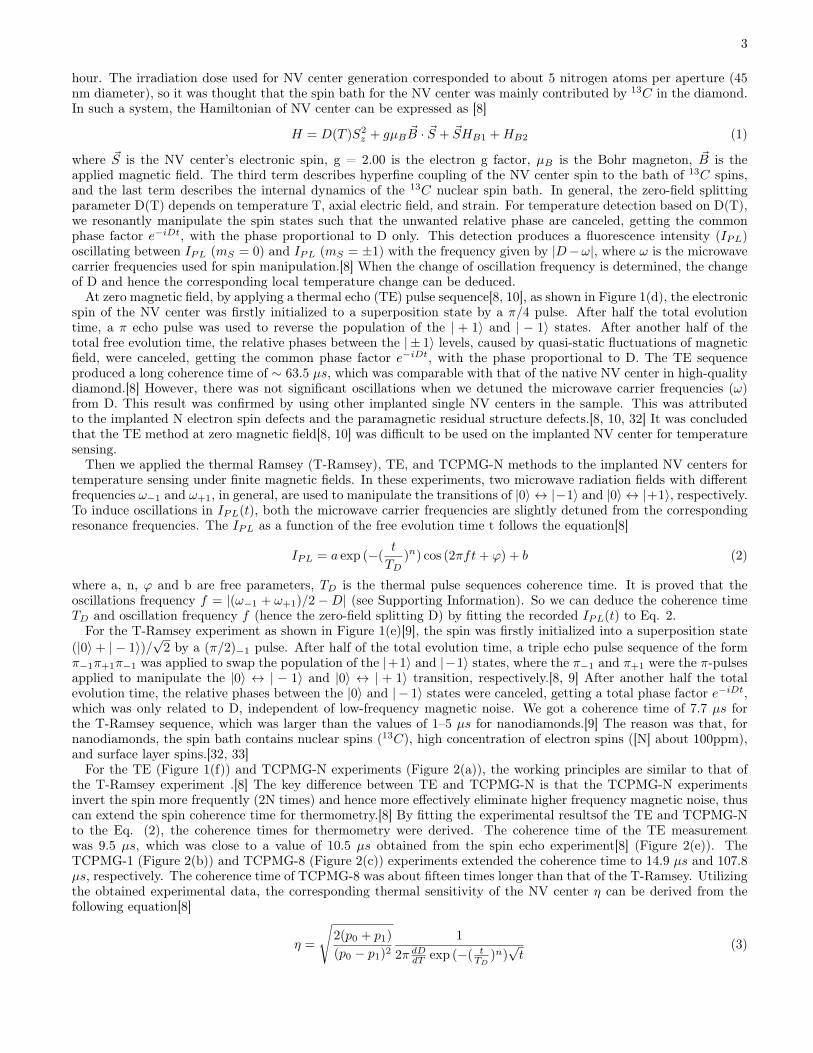
hour. The irradiation dose used for NV center generation corresponded to about 5 nitrogen atoms per aperture (45nm diameter), so it was thought that the spin bath for the NV center was mainly contributed by 13C in the diamond.In such a system, the Hamiltonian of NV center can be expressed as [8]
H = D(T )S2z + gµB ~B · ~S + ~SHB1 +HB2 (1)
where ~S is the NV center’s electronic spin, g = 2.00 is the electron g factor, µB is the Bohr magneton, ~B is theapplied magnetic field. The third term describes hyperfine coupling of the NV center spin to the bath of 13C spins,and the last term describes the internal dynamics of the 13C nuclear spin bath. In general, the zero-field splittingparameter D(T) depends on temperature T, axial electric field, and strain. For temperature detection based on D(T),we resonantly manipulate the spin states such that the unwanted relative phase are canceled, getting the commonphase factor e−iDt, with the phase proportional to D only. This detection produces a fluorescence intensity (IPL)oscillating between IPL (mS = 0) and IPL (mS = ±1) with the frequency given by |D−ω|, where ω is the microwavecarrier frequencies used for spin manipulation.[8] When the change of oscillation frequency is determined, the changeof D and hence the corresponding local temperature change can be deduced.
At zero magnetic field, by applying a thermal echo (TE) pulse sequence[8, 10], as shown in Figure 1(d), the electronicspin of the NV center was firstly initialized to a superposition state by a π/4 pulse. After half the total evolutiontime, a π echo pulse was used to reverse the population of the | + 1〉 and | − 1〉 states. After another half of thetotal free evolution time, the relative phases between the | ± 1〉 levels, caused by quasi-static fluctuations of magneticfield, were canceled, getting the common phase factor e−iDt, with the phase proportional to D. The TE sequenceproduced a long coherence time of ∼ 63.5 µs, which was comparable with that of the native NV center in high-qualitydiamond.[8] However, there was not significant oscillations when we detuned the microwave carrier frequencies (ω)from D. This result was confirmed by using other implanted single NV centers in the sample. This was attributedto the implanted N electron spin defects and the paramagnetic residual structure defects.[8, 10, 32] It was concludedthat the TE method at zero magnetic field[8, 10] was difficult to be used on the implanted NV center for temperaturesensing.
Then we applied the thermal Ramsey (T-Ramsey), TE, and TCPMG-N methods to the implanted NV centers fortemperature sensing under finite magnetic fields. In these experiments, two microwave radiation fields with differentfrequencies ω−1 and ω+1, in general, are used to manipulate the transitions of |0〉 ↔ |−1〉 and |0〉 ↔ |+1〉, respectively.To induce oscillations in IPL(t), both the microwave carrier frequencies are slightly detuned from the correspondingresonance frequencies. The IPL as a function of the free evolution time t follows the equation[8]
IPL = a exp (−(t
TD)n) cos (2πft+ ϕ) + b (2)
where a, n, ϕ and b are free parameters, TD is the thermal pulse sequences coherence time. It is proved that theoscillations frequency f = |(ω−1 + ω+1)/2 −D| (see Supporting Information). So we can deduce the coherence timeTD and oscillation frequency f (hence the zero-field splitting D) by fitting the recorded IPL(t) to Eq. 2.
For the T-Ramsey experiment as shown in Figure 1(e)[9], the spin was firstly initialized into a superposition state(|0〉+ | − 1〉)/
√2 by a (π/2)−1 pulse. After half of the total evolution time, a triple echo pulse sequence of the form
π−1π+1π−1 was applied to swap the population of the |+1〉 and |−1〉 states, where the π−1 and π+1 were the π-pulsesapplied to manipulate the |0〉 ↔ | − 1〉 and |0〉 ↔ | + 1〉 transition, respectively.[8, 9] After another half the totalevolution time, the relative phases between the |0〉 and | − 1〉 states were canceled, getting a total phase factor e−iDt,which was only related to D, independent of low-frequency magnetic noise. We got a coherence time of 7.7 µs forthe T-Ramsey sequence, which was larger than the values of 1–5 µs for nanodiamonds.[9] The reason was that, fornanodiamonds, the spin bath contains nuclear spins (13C), high concentration of electron spins ([N] about 100ppm),and surface layer spins.[32, 33]
For the TE (Figure 1(f)) and TCPMG-N experiments (Figure 2(a)), the working principles are similar to that ofthe T-Ramsey experiment .[8] The key difference between TE and TCPMG-N is that the TCPMG-N experimentsinvert the spin more frequently (2N times) and hence more effectively eliminate higher frequency magnetic noise, thuscan extend the spin coherence time for thermometry.[8] By fitting the experimental resultsof the TE and TCPMG-Nto the Eq. (2), the coherence times for thermometry were derived. The coherence time of the TE measurementwas 9.5 µs, which was close to a value of 10.5 µs obtained from the spin echo experiment[8] (Figure 2(e)). TheTCPMG-1 (Figure 2(b)) and TCPMG-8 (Figure 2(c)) experiments extended the coherence time to 14.9 µs and 107.8µs, respectively. The coherence time of TCPMG-8 was about fifteen times longer than that of the T-Ramsey. Utilizingthe obtained experimental data, the corresponding thermal sensitivity of the NV center η can be derived from thefollowing equation[8]
η =
√2(p0 + p1)
(p0 − p1)21
2π dDdT exp (−( tTD
)n)√t
(3)
4
(a)TCPMG-N in finite magnetic
(d)
(b)
(c)Evolution time ( μs)
No
rma
lize
dP
L
Evolution time ( μs)
No
rma
lize
dP
L
(e)
Evolution time ( μs)
No
rma
lize
dP
L
( f )
Co
he
ren
ce
tim
e(μ
s)
Pluse number N
CPMG-N in finite magnetic fields
N3π/2-1
π/2-1π+1 π+1π-1 π-1 π-1π+1
CPMG16CPMG12 CPMG14
CPMG6 CPMG10CPMG8CPMG4CPMG2Echo
TCPMG-8
TCPMG-1
3π/2-1
Nπ/2-1 π-1
tt t t2t
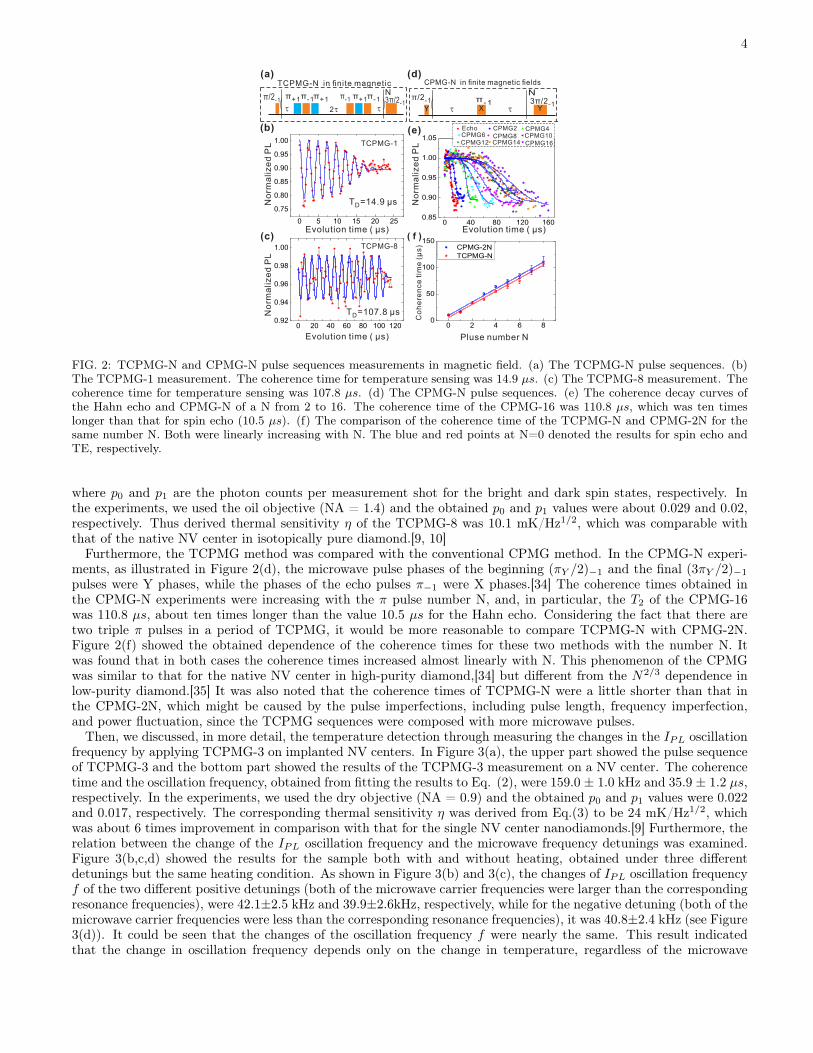
FIG. 2: TCPMG-N and CPMG-N pulse sequences measurements in magnetic field. (a) The TCPMG-N pulse sequences. (b)The TCPMG-1 measurement. The coherence time for temperature sensing was 14.9 µs. (c) The TCPMG-8 measurement. Thecoherence time for temperature sensing was 107.8 µs. (d) The CPMG-N pulse sequences. (e) The coherence decay curves ofthe Hahn echo and CPMG-N of a N from 2 to 16. The coherence time of the CPMG-16 was 110.8 µs, which was ten timeslonger than that for spin echo (10.5 µs). (f) The comparison of the coherence time of the TCPMG-N and CPMG-2N for thesame number N. Both were linearly increasing with N. The blue and red points at N=0 denoted the results for spin echo andTE, respectively.
where p0 and p1 are the photon counts per measurement shot for the bright and dark spin states, respectively. Inthe experiments, we used the oil objective (NA = 1.4) and the obtained p0 and p1 values were about 0.029 and 0.02,respectively. Thus derived thermal sensitivity η of the TCPMG-8 was 10.1 mK/Hz1/2, which was comparable withthat of the native NV center in isotopically pure diamond.[9, 10]
Furthermore, the TCPMG method was compared with the conventional CPMG method. In the CPMG-N experi-ments, as illustrated in Figure 2(d), the microwave pulse phases of the beginning (πY /2)−1 and the final (3πY /2)−1
pulses were Y phases, while the phases of the echo pulses π−1 were X phases.[34] The coherence times obtained inthe CPMG-N experiments were increasing with the π pulse number N, and, in particular, the T2 of the CPMG-16was 110.8 µs, about ten times longer than the value 10.5 µs for the Hahn echo. Considering the fact that there aretwo triple π pulses in a period of TCPMG, it would be more reasonable to compare TCPMG-N with CPMG-2N.Figure 2(f) showed the obtained dependence of the coherence times for these two methods with the number N. Itwas found that in both cases the coherence times increased almost linearly with N. This phenomenon of the CPMGwas similar to that for the native NV center in high-purity diamond,[34] but different from the N2/3 dependence inlow-purity diamond.[35] It was also noted that the coherence times of TCPMG-N were a little shorter than that inthe CPMG-2N, which might be caused by the pulse imperfections, including pulse length, frequency imperfection,and power fluctuation, since the TCPMG sequences were composed with more microwave pulses.
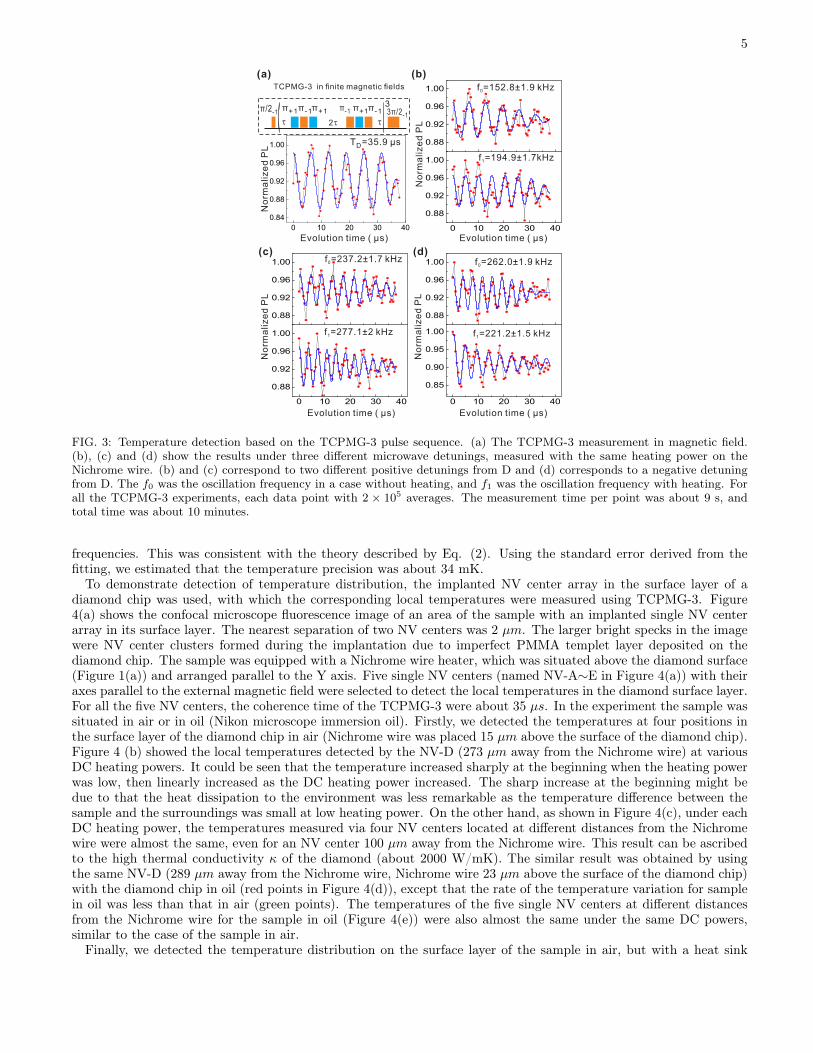
Then, we discussed, in more detail, the temperature detection through measuring the changes in the IPL oscillationfrequency by applying TCPMG-3 on implanted NV centers. In Figure 3(a), the upper part showed the pulse sequenceof TCPMG-3 and the bottom part showed the results of the TCPMG-3 measurement on a NV center. The coherencetime and the oscillation frequency, obtained from fitting the results to Eq. (2), were 159.0 ± 1.0 kHz and 35.9 ± 1.2 µs,respectively. In the experiments, we used the dry objective (NA = 0.9) and the obtained p0 and p1 values were 0.022and 0.017, respectively. The corresponding thermal sensitivity η was derived from Eq.(3) to be 24 mK/Hz1/2, whichwas about 6 times improvement in comparison with that for the single NV center nanodiamonds.[9] Furthermore, therelation between the change of the IPL oscillation frequency and the microwave frequency detunings was examined.Figure 3(b,c,d) showed the results for the sample both with and without heating, obtained under three differentdetunings but the same heating condition. As shown in Figure 3(b) and 3(c), the changes of IPL oscillation frequencyf of the two different positive detunings (both of the microwave carrier frequencies were larger than the correspondingresonance frequencies), were 42.1±2.5 kHz and 39.9±2.6kHz, respectively, while for the negative detuning (both of themicrowave carrier frequencies were less than the corresponding resonance frequencies), it was 40.8±2.4 kHz (see Figure3(d)). It could be seen that the changes of the oscillation frequency f were nearly the same. This result indicatedthat the change in oscillation frequency depends only on the change in temperature, regardless of the microwave
5
(a)TCPMG-3 in finite magnetic fields
33π/2-1
π/2-1π+1 π+1π-1 π-1 π-1π+1
No
rma
lize
dP
L
Evolution time ( μs)
(b)
No
rma
lize
dP
L
Evolution time ( μs)
Evolution time ( μs)
No
rma
lize
dP
L
(c) (d)
No
rma
lize
dP
LEvolution time ( μs)
f =152.8±1.9 kHz0
f =194.9±1.7kHz1
f =262.0±1.9 kHz0
f =221.2±1.5 kHz1f =277.1±2 kHz1
f =237.2±1.7 kHz0
T =35.9 μsD
t t2t
FIG. 3: Temperature detection based on the TCPMG-3 pulse sequence. (a) The TCPMG-3 measurement in magnetic field.(b), (c) and (d) show the results under three different microwave detunings, measured with the same heating power on theNichrome wire. (b) and (c) correspond to two different positive detunings from D and (d) corresponds to a negative detuningfrom D. The f0 was the oscillation frequency in a case without heating, and f1 was the oscillation frequency with heating. Forall the TCPMG-3 experiments, each data point with 2 × 10⁵ averages. The measurement time per point was about 9 s, andtotal time was about 10 minutes.
frequencies. This was consistent with the theory described by Eq. (2). Using the standard error derived from thefitting, we estimated that the temperature precision was about 34 mK.
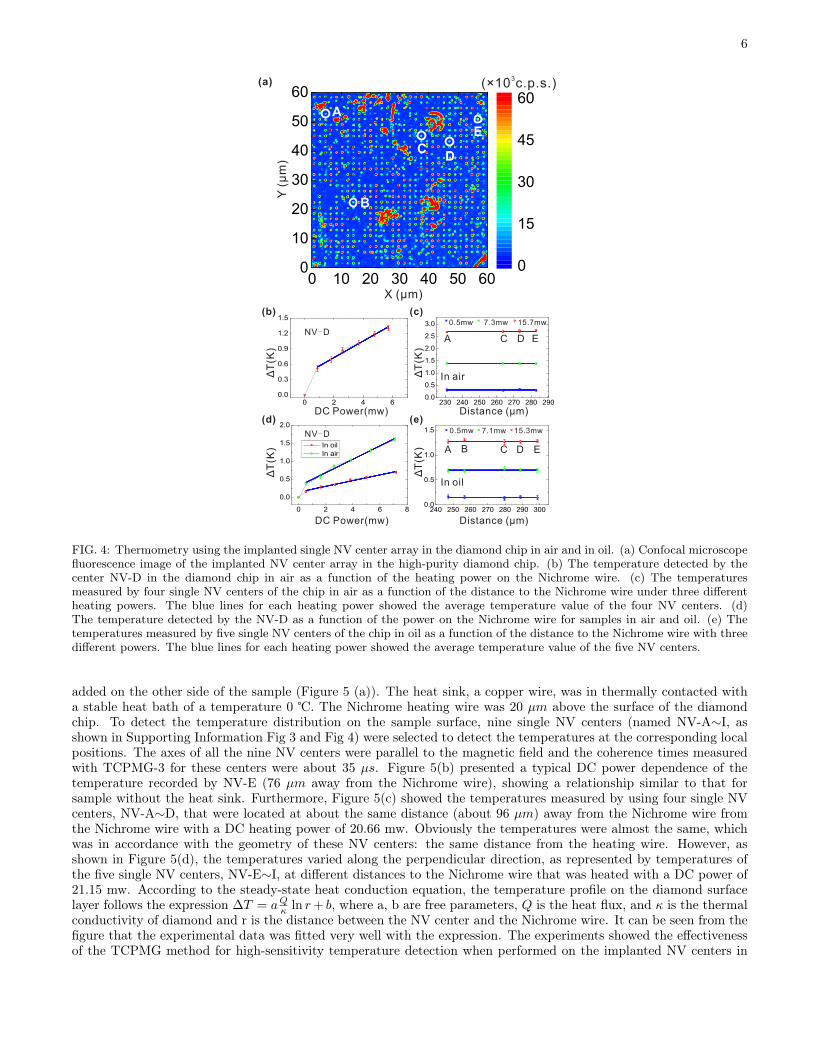
To demonstrate detection of temperature distribution, the implanted NV center array in the surface layer of adiamond chip was used, with which the corresponding local temperatures were measured using TCPMG-3. Figure4(a) shows the confocal microscope fluorescence image of an area of the sample with an implanted single NV centerarray in its surface layer. The nearest separation of two NV centers was 2 µm. The larger bright specks in the imagewere NV center clusters formed during the implantation due to imperfect PMMA templet layer deposited on thediamond chip. The sample was equipped with a Nichrome wire heater, which was situated above the diamond surface(Figure 1(a)) and arranged parallel to the Y axis. Five single NV centers (named NV-A∼E in Figure 4(a)) with theiraxes parallel to the external magnetic field were selected to detect the local temperatures in the diamond surface layer.For all the five NV centers, the coherence time of the TCPMG-3 were about 35 µs. In the experiment the sample wassituated in air or in oil (Nikon microscope immersion oil). Firstly, we detected the temperatures at four positions inthe surface layer of the diamond chip in air (Nichrome wire was placed 15 µm above the surface of the diamond chip).Figure 4 (b) showed the local temperatures detected by the NV-D (273 µm away from the Nichrome wire) at variousDC heating powers. It could be seen that the temperature increased sharply at the beginning when the heating powerwas low, then linearly increased as the DC heating power increased. The sharp increase at the beginning might bedue to that the heat dissipation to the environment was less remarkable as the temperature difference between thesample and the surroundings was small at low heating power. On the other hand, as shown in Figure 4(c), under eachDC heating power, the temperatures measured via four NV centers located at different distances from the Nichromewire were almost the same, even for an NV center 100 µm away from the Nichrome wire. This result can be ascribedto the high thermal conductivity κ of the diamond (about 2000 W/mK). The similar result was obtained by usingthe same NV-D (289 µm away from the Nichrome wire, Nichrome wire 23 µm above the surface of the diamond chip)with the diamond chip in oil (red points in Figure 4(d)), except that the rate of the temperature variation for samplein oil was less than that in air (green points). The temperatures of the five single NV centers at different distancesfrom the Nichrome wire for the sample in oil (Figure 4(e)) were also almost the same under the same DC powers,similar to the case of the sample in air.
Finally, we detected the temperature distribution on the surface layer of the sample in air, but with a heat sink
6
(a)
(b) (c)
(d) (e)DC Power(mw)
ΔΤ
(K)
ΔΤ
(K)
Χ (μm)Υ
(μm
)
(×10 c.p.s.)3
DC Power(mw)
ΔΤ
(K)
ΔΤ
(K)
Distance (μm)
Distance (μm)
A C D E
A B C D E
15.3mw7.1mw0.5mw
Ιn oil
0.5mw 7.3mw 15.7mw
Ιn air
NV D-
NV D-
A
B
DC
E
FIG. 4: Thermometry using the implanted single NV center array in the diamond chip in air and in oil. (a) Confocal microscopefluorescence image of the implanted NV center array in the high-purity diamond chip. (b) The temperature detected by thecenter NV-D in the diamond chip in air as a function of the heating power on the Nichrome wire. (c) The temperaturesmeasured by four single NV centers of the chip in air as a function of the distance to the Nichrome wire under three differentheating powers. The blue lines for each heating power showed the average temperature value of the four NV centers. (d)The temperature detected by the NV-D as a function of the power on the Nichrome wire for samples in air and oil. (e) Thetemperatures measured by five single NV centers of the chip in oil as a function of the distance to the Nichrome wire with threedifferent powers. The blue lines for each heating power showed the average temperature value of the five NV centers.
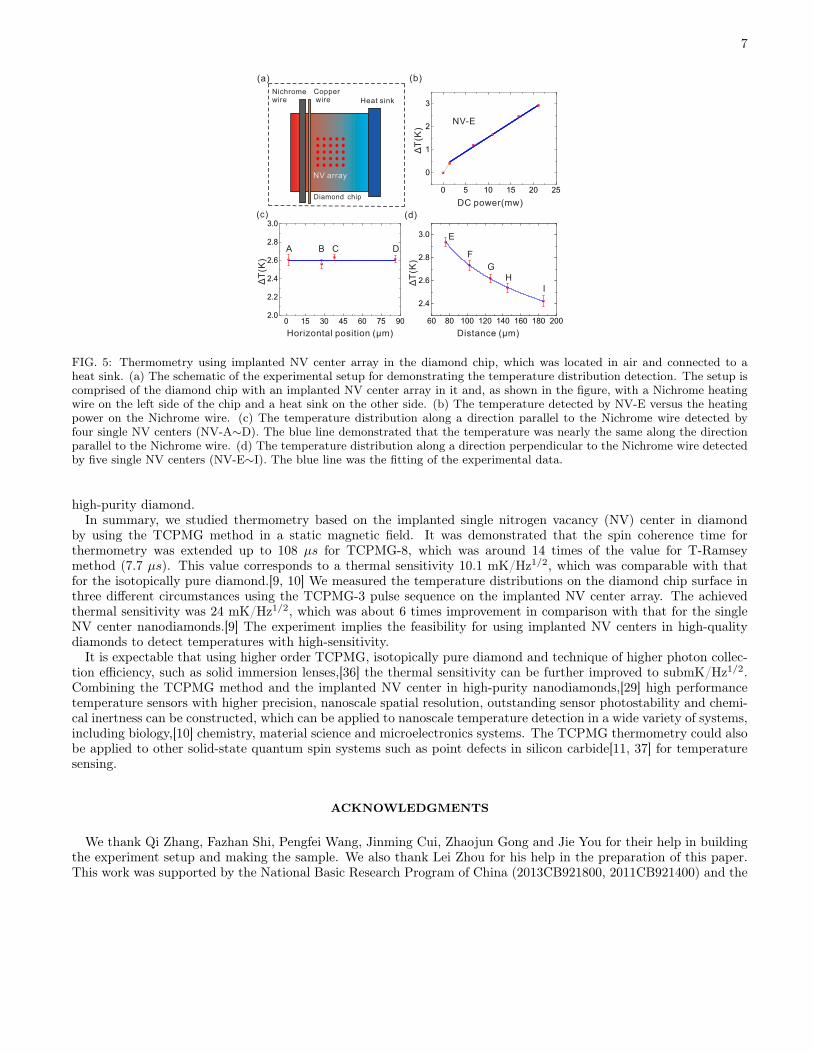
added on the other side of the sample (Figure 5 (a)). The heat sink, a copper wire, was in thermally contacted witha stable heat bath of a temperature 0 ℃. The Nichrome heating wire was 20 µm above the surface of the diamondchip. To detect the temperature distribution on the sample surface, nine single NV centers (named NV-A∼I, asshown in Supporting Information Fig 3 and Fig 4) were selected to detect the temperatures at the corresponding localpositions. The axes of all the nine NV centers were parallel to the magnetic field and the coherence times measuredwith TCPMG-3 for these centers were about 35 µs. Figure 5(b) presented a typical DC power dependence of thetemperature recorded by NV-E (76 µm away from the Nichrome wire), showing a relationship similar to that forsample without the heat sink. Furthermore, Figure 5(c) showed the temperatures measured by using four single NVcenters, NV-A∼D, that were located at about the same distance (about 96 µm) away from the Nichrome wire fromthe Nichrome wire with a DC heating power of 20.66 mw. Obviously the temperatures were almost the same, whichwas in accordance with the geometry of these NV centers: the same distance from the heating wire. However, asshown in Figure 5(d), the temperatures varied along the perpendicular direction, as represented by temperatures ofthe five single NV centers, NV-E∼I, at different distances to the Nichrome wire that was heated with a DC power of21.15 mw. According to the steady-state heat conduction equation, the temperature profile on the diamond surfacelayer follows the expression ∆T = aQκ ln r+ b, where a, b are free parameters, Q is the heat flux, and κ is the thermalconductivity of diamond and r is the distance between the NV center and the Nichrome wire. It can be seen from thefigure that the experimental data was fitted very well with the expression. The experiments showed the effectivenessof the TCPMG method for high-sensitivity temperature detection when performed on the implanted NV centers in
7
Nichromewire
NV array
Copperwire
Diamond chip
Heat sink
(a) (b)
NV-E
ΔΤ
(K)
DC power(mw)
ΔΤ
(K)
(d)( )c
Horizontal position (μm)
ΔΤ
(K)
Distance (μm)
A B C D
E
F
G
I
H
FIG. 5: Thermometry using implanted NV center array in the diamond chip, which was located in air and connected to aheat sink. (a) The schematic of the experimental setup for demonstrating the temperature distribution detection. The setup iscomprised of the diamond chip with an implanted NV center array in it and, as shown in the figure, with a Nichrome heatingwire on the left side of the chip and a heat sink on the other side. (b) The temperature detected by NV-E versus the heatingpower on the Nichrome wire. (c) The temperature distribution along a direction parallel to the Nichrome wire detected byfour single NV centers (NV-A∼D). The blue line demonstrated that the temperature was nearly the same along the directionparallel to the Nichrome wire. (d) The temperature distribution along a direction perpendicular to the Nichrome wire detectedby five single NV centers (NV-E∼I). The blue line was the fitting of the experimental data.
high-purity diamond.In summary, we studied thermometry based on the implanted single nitrogen vacancy (NV) center in diamond
by using the TCPMG method in a static magnetic field. It was demonstrated that the spin coherence time forthermometry was extended up to 108 µs for TCPMG-8, which was around 14 times of the value for T-Ramseymethod (7.7 µs). This value corresponds to a thermal sensitivity 10.1 mK/Hz1/2, which was comparable with thatfor the isotopically pure diamond.[9, 10] We measured the temperature distributions on the diamond chip surface inthree different circumstances using the TCPMG-3 pulse sequence on the implanted NV center array. The achievedthermal sensitivity was 24 mK/Hz1/2, which was about 6 times improvement in comparison with that for the singleNV center nanodiamonds.[9] The experiment implies the feasibility for using implanted NV centers in high-qualitydiamonds to detect temperatures with high-sensitivity.
It is expectable that using higher order TCPMG, isotopically pure diamond and technique of higher photon collec-tion efficiency, such as solid immersion lenses,[36] the thermal sensitivity can be further improved to submK/Hz1/2.Combining the TCPMG method and the implanted NV center in high-purity nanodiamonds,[29] high performancetemperature sensors with higher precision, nanoscale spatial resolution, outstanding sensor photostability and chemi-cal inertness can be constructed, which can be applied to nanoscale temperature detection in a wide variety of systems,including biology,[10] chemistry, material science and microelectronics systems. The TCPMG thermometry could alsobe applied to other solid-state quantum spin systems such as point defects in silicon carbide[11, 37] for temperaturesensing.
ACKNOWLEDGMENTS
We thank Qi Zhang, Fazhan Shi, Pengfei Wang, Jinming Cui, Zhaojun Gong and Jie You for their help in buildingthe experiment setup and making the sample. We also thank Lei Zhou for his help in the preparation of this paper.This work was supported by the National Basic Research Program of China (2013CB921800, 2011CB921400) and the
8
Natural Science Foundation of China (Grant Nos. 11374280, 50772110).
[1] Brites, C. D. S.; Lima, P. P.; Silva, N. J. O.; Millan, A.; Amaral, V. S.; Palacio, F.; Carlos, L. D. Nanoscale 2012, 4, 4799.[2] Balandin, A. A.; Ghosh, S.; Bao, W. Z.; Calizo, I.; Teweldebrhan, D.; Miao, F.; Lau, C. N. Nano Lett. 2008, 8, 902.[3] Walker, G. W.; Sundar, V. C.; Rudzinski, C. M.; Wun, A. W.; Bawendi, M. G.; Nocera, D. G. Appl. Phys. Lett. 2003, 83,
3555.[4] Majumdar, A. Annu. Rev. Mater. Sci. 1999, 29, 505.[5] Acosta, V. M.; Bauch, E.; Ledbetter, M. P.; Waxman, A.; Bouchard, L. S.; Budker, D. Phys. Rev. Lett. 2010, 104, 070801.[6] Chen, X. D.; Dong, C. H.; Sun, F. W.; Zou, C. L.; Cui, J. M.; Han, Z. F.; Guo, G. C. Appl. Phys. Lett. 2011, 99, 161903.[7] Toyli, D. M.; Christle, D. J.; Alkauskas, A.; Buckley, B. B.; Van de Walle, C. G.; Awschalom, D. D. Phys. Rev. X 2012, 2,
031001.[8] Toyli, D. M.; de Las Casas, C. F.; Christle, D. J.; Dobrovitski, V. V.; Awschalom, D. D. Proc. Natl. Acad. Sci. U.S.A.
2013, 110, 8417.[9] Neumann, P.; Jakobi, I.; Dolde, F.; Burk, C.; Reuter, R.; Waldherr, G.; Honert, J.; Wolf, T.; Brunner, A.; Shim, J. H.;
Suter, D.; Sumiya, H.; Isoya,J.; Wrachtrup, J. Nano Lett. 2013, 13, 2738.[10] Kucsko, G.; Maurer, P. C.; Yao, N. Y.; Kubo, M.; Noh, H. J.; Lo, P. K.; Park, H.; Lukin, M. D. Nature 2013, 500, 54.[11] Kraus, H.; Soltamov, V. A.; Fuchs, F.; Simin, D.; Sperlich, A.; Baranov, P. G.; Astakhov, G. V.; Dyakonov, V. Sci. Rep.
2014, 4, 5303.[12] Jelezko, F.; Gaebel, T.; Popa, I.; Domhan, M.; Gruber, A.; Wrachtrup J. Phys. Rev. Lett. 2004, 93, 130501.[13] Dutt, M. V. G.; Childress, L.; Jiang, L.; Togan, E.; Maze, J.; Jelezko, F.; Zibrov, A. S.; Hemmer, P. R.; Lukin, M. D.
Science 2007, 316, 1312.[14] Neumann, P.; Mizuochi, N.; Rempp, F.; Hemmer, P.; Watanabe, H.; Yamasaki, S.; Jacques, V.; Gaebel, T.; Jelezko, F.;
Wrachtrup, J. Science 2008, 320, 1326-1329.[15] Shi, F. Z.; Rong, X.; Xu, N. Y.; Wang, Y.; Wu, J.; Chong, B.; Peng, X. H.; Kniepert, J.; Schoenfeld, R. S.; Harneit, W.;
Feng, M; Du, J. F. Phys. Rev. Lett. 2010, 105, 040504.[16] Waldherr, G.; Wang, Y.; Zaiser, S.; Jamali, M.; Herbruggen, T. S.; Abe, H.; Ohshima, T.; Isoya, J.; Du, J. F.; Neumann,
P.; Wrachtrup, J. Nature 2014, 461, 1.[17] Taylor, J. M.; Cappellaro, P.; Childress, L.; Jiang, L.;Budker, L. D.; Hemmer, P. R.; Yacoby, A.; Walsworth, R.; Lukin,
M. D. Nat. Phys. 2008, 4, 810.[18] Maze, J. R.; Stanwix, P. L.; Hodges, J. S.; Hong, S.; Taylor, J. M.; Cappellaro, P.; Jiang, L.; Dutt, M. V. G.; Togan, E.;
Zibrov, A. S.; Yacoby, A.; Walsworth, R. L.; Lukin, M. D. Nature 2008, 455, 644.[19] Balasubramanian, G.; Chan, I. Y.; Kolesov, R.; Al-Hmoud, M.; Tisler, J.; Shin, C.; Kim, C.; Wojcik, A.; Hemmer, P. R.;
Krueger, A.; Hanke, T.; Leitenstorfer, A.; Bratschitsch, R.; Jelezko, F.; Wrachtrup, J. Nature 2008, 455, 648.[20] Dolde, F.; Fedder, H.; Doherty, M. W.; Nöbauer, T.; Rempp, F.; Balasubramanian, G.; Wolf, T.; Reinhard, F.; Hollenberg,
L. C. L.; Jelezko, F.; Wrachtrup, J. Nat. Phys. 2011, 7, 459.[21] Dolde, F.; Doherty, M. W.; Michl, J; Jakobi, I.; Naydenov, B. Pezzagna, S.; Meijer, J. Neumann, P.; Jelezko, F.; Manson,
N. B.; Wrachtrup, J. Phys. Rev. Lett. 2014, 112, 097603.[22] Kolkowitz, S.; Jayich, A. C. B.; Unterreithmeier, Q. P.; Bennett, S. D.; Rabl, P.; Harris, J. G. E.; Lukin, M. D. Science
2012, 335,1603.[23] Hong, S. K.; Grinolds, M. S.; Maletinsky, P.; Walsworth, R. L.; Lukin, M. D.; Yacoby, A. Nano Lett. 2012, 12, 3920.[24] Zhao, N.; Honert, J.; Schmid, B.; Klas, M.; Isoya, J.; Markham, M.; Twitchen, D.; Jelezko, F.; Liu, R. B.; Fedder, H.;
Wrachtrup, J. Nat. Nanotech. 2012, 7, 657.[25] Taminiau, T. H.; Wagenaar, J. J. T.; van der Sar, T.; Jelezko, F.; Dobrovitski, V. V.; Hanson, R. Phys. Rev. Lett. 2012,
109, 137602.[26] Shi, F. Z.; Zhang, Q.; Naydenov, B.; Jelezko, F.; Du, J. F.; Reinhard, F.; Wrachtrup, J. Phys. Rev. B 2013, 87, 195414.[27] Mamin, H. J.; Kim, M.; Sherwood, M. H.; Rettner, C. T.; Ohno, K.; Awschalom, D. D.; Rugar, D. Science 2013, 339, 557.[28] Staudacher,T.; Shi, F. Z.; Pezzagna, S.; Meijer, J.; Du, J. F.; Meriles, C. A.; Reinhard, F.; Wrachtrup, J. Science 2013,
339, 561.[29] Trusheim, M. E.; Li, L.; Laraoui, A.; Chen, E. H.; Gaathon, O.; Bakhru, H.; Schroeder, T.; Meriles, C. A.; Englund, D.
Nano Lett. 2014, 14, 32.[30] Spinicelli, P.; Dréau, A.; Rondin, L.; Silva, F.; Achard, J.; Xavier, S.; Bansropun, S.; Debuisschert, T.; Pezzagna, S.;
Meijer, J.; Jacques, V.; Roch, J. New J. Phys. 2011 13, 025014.[31] Yamamoto, T.; Umeda, T.; Watanabe, K.; Onoda, S.; Markham, M. L.; Twitchen, D. J.; Naydenov, B.; McGuinness, L.
P.; Teraji, T.; Koizumi, S.; Dolde, F.; Fedder, H.; Honert, J.; Wrachtrup, J.; Ohshima, T.; Jelezko, F.; Isoya, J. Phys. Rev.B 2013, 88, 075206.
[32] Laraoui, A.; Hodges, J. S.; Meriles, C. A. Nano Lett. 2012, 12, 3477.[33] Song, X. R.; Zhang, J.; Feng, F. P.; Wang, J. F.; Zhang, W. L.; Lou, L. R.; Zhu, W.; Wang, G. Z. AIP advances 2014, 4,
047103.[34] Ryan, C. A.; Hodges, J. S.; Cory, D. G. Phys. Rev. Lett. 2010, 105, 200402.[35] De Lange, G.; Wang, Z. H.; Ristè, D.; Dobrovitski, V. V.; Hanson, R. Science 2010, 330, 60.
9
[36] Hadden, J. P.; Harrison, J. P.; Stanley Clarke, A. C.; Marseglia, L.; Ho, Y.-L. D.; Patton, B. R.; O’Brien, J. L.; Rarity, J.G. Appl. Phys. Lett. 2010, 97, 241901.
[37] Klimov, P. V.; Falk, A. L.; Buckley, B. B.; Awschalom, D. D. Phys. Rev. Lett. 2014, 112, 087601.


![[Array, Array, Array, Array, Array, Array, Array, Array, Array, Array, Array, Array]](https://img.pdfslide.net/doc/110x75/56816460550346895dd63b8b/array-array-array-array-array-array-array-array-array-array-array.jpg)