Embed Size (px)
Citation preview

CENTRAL CONTROL OPERATOR’S MANUAL
Stratus™ LT • Stratus™ II • Nimbus™ II • Cirrus™

Central Control Operator’s Manual
© 2005 Rain Bird Corporation, 6991 E. Southpoint Rd. Bldg. #1 • Tucson, AZ 85706, U.S.A.
Phone (800) 984-2255 • (520) 741-6100 Fax (520) 741-6522
i
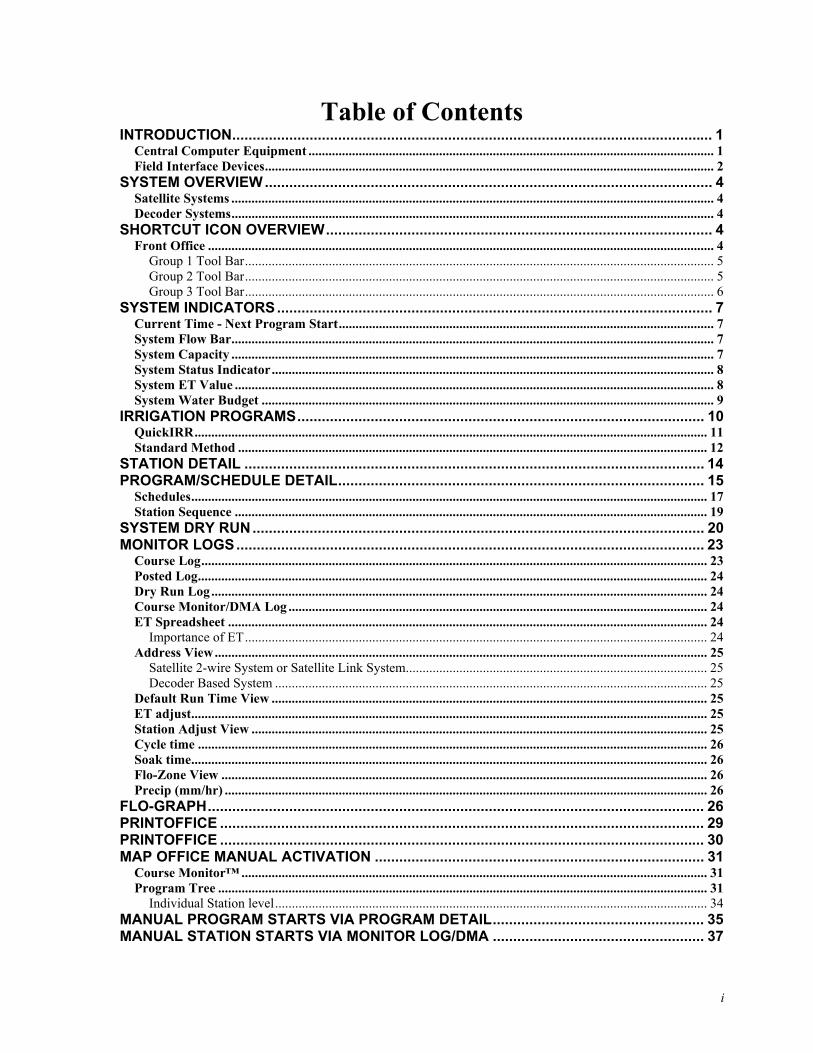
Table of Contents INTRODUCTION...................................................................................................................... 1
Central Computer Equipment ......................................................................................................................... 1 Field Interface Devices...................................................................................................................................... 2
SYSTEM OVERVIEW.............................................................................................................. 4 Satellite Systems ................................................................................................................................................ 4 Decoder Systems................................................................................................................................................ 4
SHORTCUT ICON OVERVIEW............................................................................................... 4 Front Office ....................................................................................................................................................... 4
Group 1 Tool Bar............................................................................................................................................ 5 Group 2 Tool Bar............................................................................................................................................ 5 Group 3 Tool Bar............................................................................................................................................ 6
SYSTEM INDICATORS........................................................................................................... 7 Current Time - Next Program Start................................................................................................................ 7 System Flow Bar................................................................................................................................................ 7 System Capacity ................................................................................................................................................ 7 System Status Indicator.................................................................................................................................... 8 System ET Value ............................................................................................................................................... 8 System Water Budget ....................................................................................................................................... 9
IRRIGATION PROGRAMS.................................................................................................... 10 QuickIRR......................................................................................................................................................... 11 Standard Method ............................................................................................................................................ 12
STATION DETAIL ................................................................................................................. 14 PROGRAM/SCHEDULE DETAIL.......................................................................................... 15
Schedules.......................................................................................................................................................... 17 Station Sequence ............................................................................................................................................. 19
SYSTEM DRY RUN............................................................................................................... 20 MONITOR LOGS................................................................................................................... 23
Course Log....................................................................................................................................................... 23 Posted Log........................................................................................................................................................ 24 Dry Run Log.................................................................................................................................................... 24 Course Monitor/DMA Log ............................................................................................................................. 24 ET Spreadsheet ............................................................................................................................................... 24
Importance of ET.......................................................................................................................................... 24 Address View................................................................................................................................................... 25
Satellite 2-wire System or Satellite Link System.......................................................................................... 25 Decoder Based System ................................................................................................................................. 25
Default Run Time View .................................................................................................................................. 25 ET adjust.......................................................................................................................................................... 25 Station Adjust View ........................................................................................................................................ 25 Cycle time ........................................................................................................................................................ 26 Soak time.......................................................................................................................................................... 26 Flo-Zone View ................................................................................................................................................. 26 Precip (mm/hr) ................................................................................................................................................ 26
FLO-GRAPH.......................................................................................................................... 26 PRINTOFFICE ....................................................................................................................... 29 PRINTOFFICE ....................................................................................................................... 30 MAP OFFICE MANUAL ACTIVATION ................................................................................. 31
Course Monitor™ ........................................................................................................................................... 31 Program Tree .................................................................................................................................................. 31
Individual Station level................................................................................................................................. 34 MANUAL PROGRAM STARTS VIA PROGRAM DETAIL.................................................... 35 MANUAL STATION STARTS VIA MONITOR LOG/DMA .................................................... 37
ii
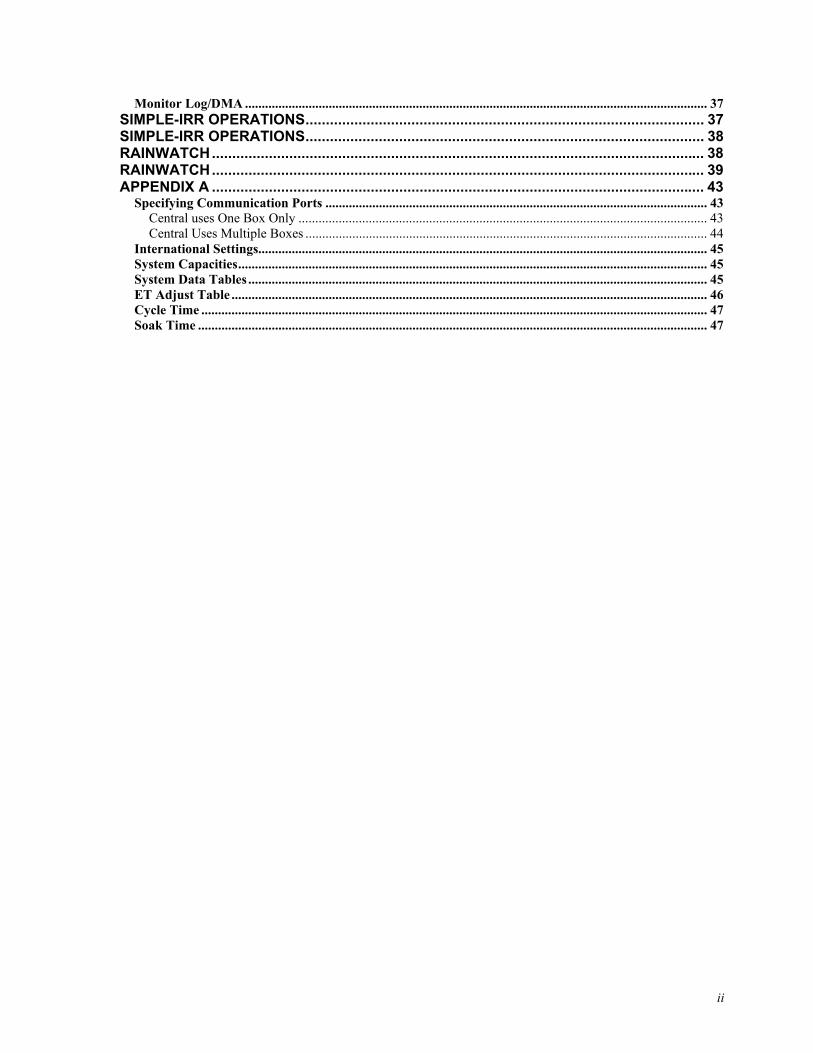
Monitor Log/DMA .......................................................................................................................................... 37 SIMPLE-IRR OPERATIONS.................................................................................................. 37 SIMPLE-IRR OPERATIONS.................................................................................................. 38 RAINWATCH......................................................................................................................... 38 RAINWATCH......................................................................................................................... 39 APPENDIX A ......................................................................................................................... 43
Specifying Communication Ports .................................................................................................................. 43 Central uses One Box Only .......................................................................................................................... 43 Central Uses Multiple Boxes ........................................................................................................................ 44
International Settings...................................................................................................................................... 45 System Capacities............................................................................................................................................ 45 System Data Tables ......................................................................................................................................... 45 ET Adjust Table .............................................................................................................................................. 46 Cycle Time ....................................................................................................................................................... 47 Soak Time ........................................................................................................................................................ 47
Page 1 of 47 Operator’s Manual
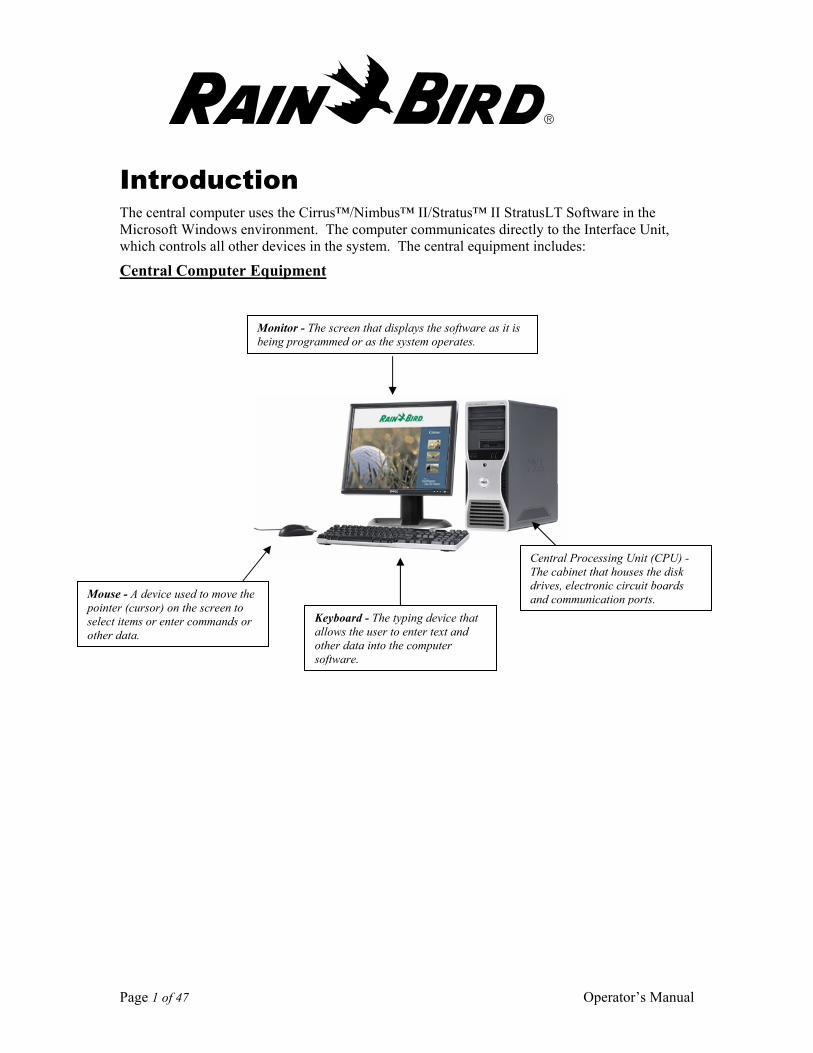
Introduction The central computer uses the Cirrus™/Nimbus™ II/Stratus™ II StratusLT Software in the Microsoft Windows environment. The computer communicates directly to the Interface Unit, which controls all other devices in the system. The central equipment includes:
Central Computer Equipment
Central Processing Unit (CPU) - The cabinet that houses the disk drives, electronic circuit boards and communication ports.
Keyboard - The typing device that allows the user to enter text and other data into the computer software.
Mouse - A device used to move the pointer (cursor) on the screen to select items or enter commands or other data.
Monitor - The screen that displays the software as it is being programmed or as the system operates.
Page 2 of 47 Operator’s Manual
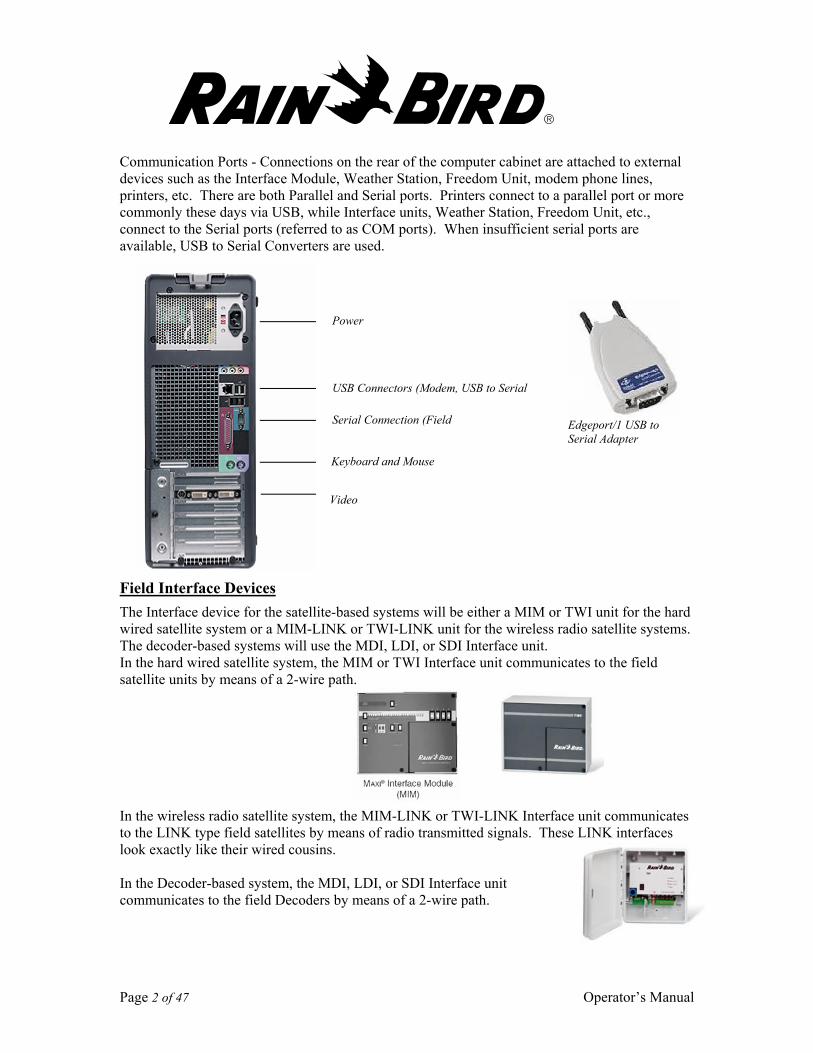
Communication Ports - Connections on the rear of the computer cabinet are attached to external devices such as the Interface Module, Weather Station, Freedom Unit, modem phone lines, printers, etc. There are both Parallel and Serial ports. Printers connect to a parallel port or more commonly these days via USB, while Interface units, Weather Station, Freedom Unit, etc., connect to the Serial ports (referred to as COM ports). When insufficient serial ports are available, USB to Serial Converters are used.
Field Interface Devices The Interface device for the satellite-based systems will be either a MIM or TWI unit for the hard wired satellite system or a MIM-LINK or TWI-LINK unit for the wireless radio satellite systems. The decoder-based systems will use the MDI, LDI, or SDI Interface unit. In the hard wired satellite system, the MIM or TWI Interface unit communicates to the field satellite units by means of a 2-wire path.
In the wireless radio satellite system, the MIM-LINK or TWI-LINK Interface unit communicates to the LINK type field satellites by means of radio transmitted signals. These LINK interfaces look exactly like their wired cousins. In the Decoder-based system, the MDI, LDI, or SDI Interface unit communicates to the field Decoders by means of a 2-wire path.
Edgeport/1 USB to Serial Adapter
Power
Serial Connection (Field
Keyboard and Mouse
Video
USB Connectors (Modem, USB to Serial
Page 3 of 47 Operator’s Manual
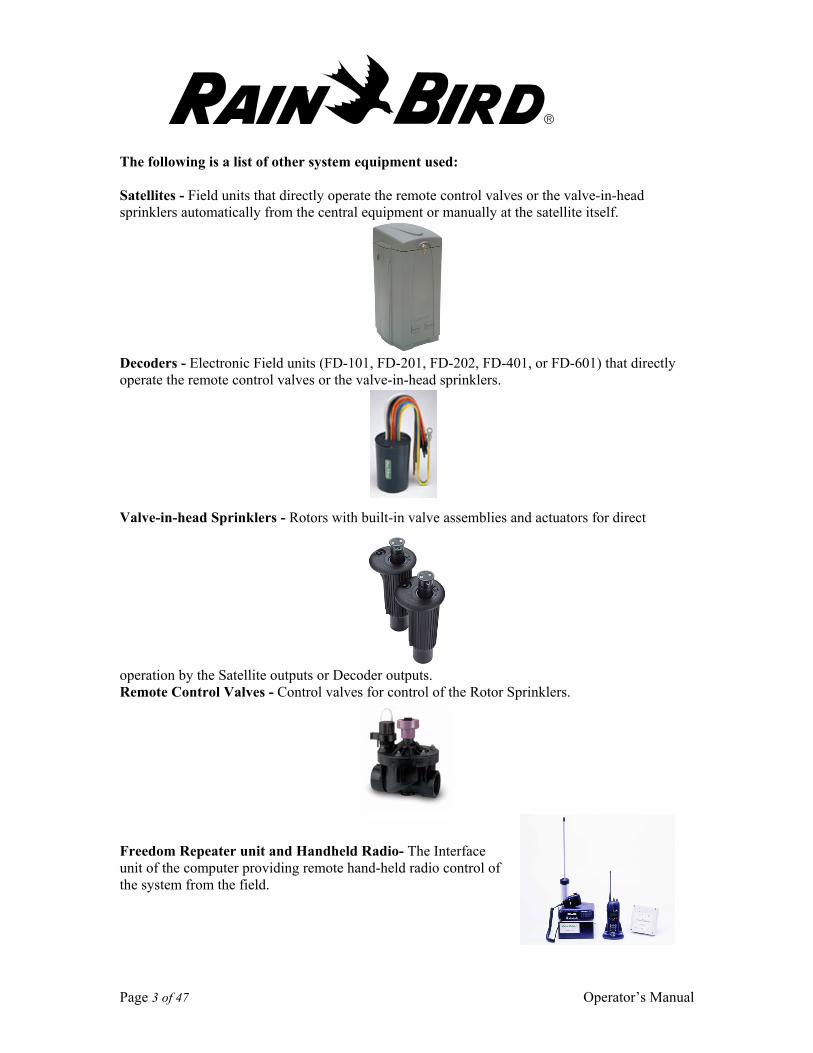
The following is a list of other system equipment used: Satellites - Field units that directly operate the remote control valves or the valve-in-head sprinklers automatically from the central equipment or manually at the satellite itself.
Decoders - Electronic Field units (FD-101, FD-201, FD-202, FD-401, or FD-601) that directly operate the remote control valves or the valve-in-head sprinklers.
Valve-in-head Sprinklers - Rotors with built-in valve assemblies and actuators for direct
operation by the Satellite outputs or Decoder outputs. Remote Control Valves - Control valves for control of the Rotor Sprinklers.
Freedom Repeater unit and Handheld Radio- The Interface unit of the computer providing remote hand-held radio control of the system from the field.
Page 4 of 47 Operator’s Manual
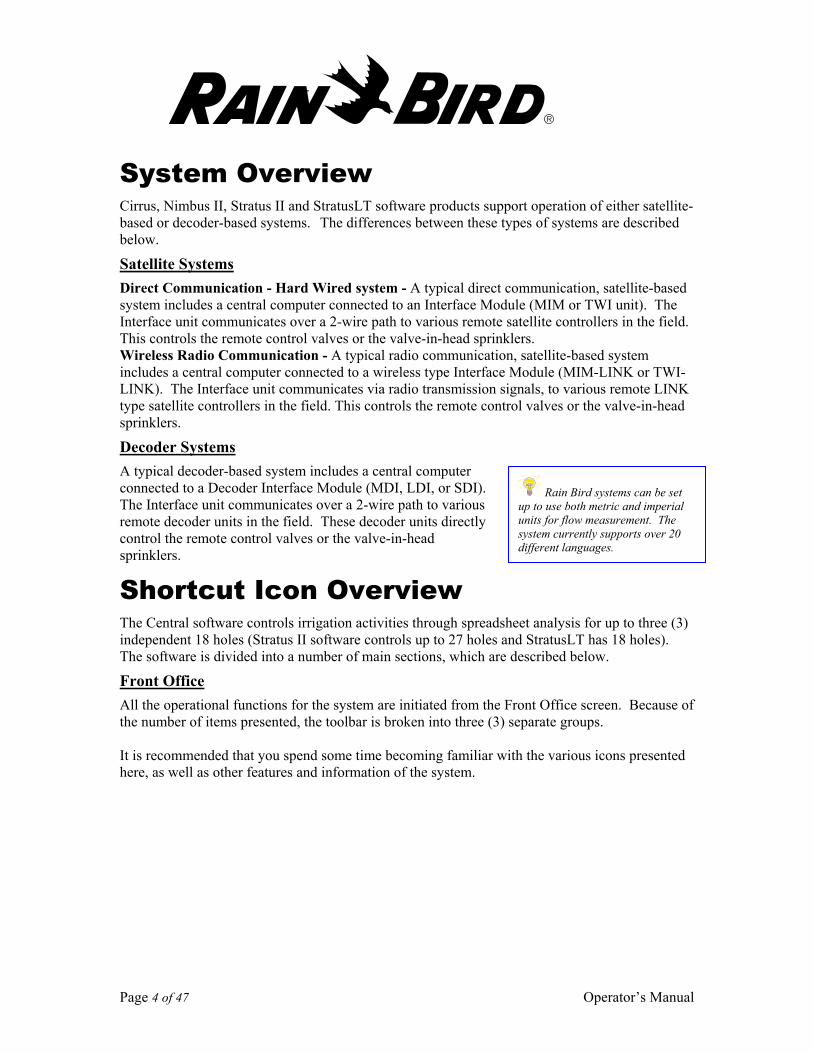
System Overview Cirrus, Nimbus II, Stratus II and StratusLT software products support operation of either satellite-based or decoder-based systems. The differences between these types of systems are described below.
Satellite Systems Direct Communication - Hard Wired system - A typical direct communication, satellite-based system includes a central computer connected to an Interface Module (MIM or TWI unit). The Interface unit communicates over a 2-wire path to various remote satellite controllers in the field. This controls the remote control valves or the valve-in-head sprinklers. Wireless Radio Communication - A typical radio communication, satellite-based system includes a central computer connected to a wireless type Interface Module (MIM-LINK or TWI-LINK). The Interface unit communicates via radio transmission signals, to various remote LINK type satellite controllers in the field. This controls the remote control valves or the valve-in-head sprinklers.
Decoder Systems A typical decoder-based system includes a central computer connected to a Decoder Interface Module (MDI, LDI, or SDI). The Interface unit communicates over a 2-wire path to various remote decoder units in the field. These decoder units directly control the remote control valves or the valve-in-head sprinklers.
Shortcut Icon Overview The Central software controls irrigation activities through spreadsheet analysis for up to three (3) independent 18 holes (Stratus II software controls up to 27 holes and StratusLT has 18 holes). The software is divided into a number of main sections, which are described below.
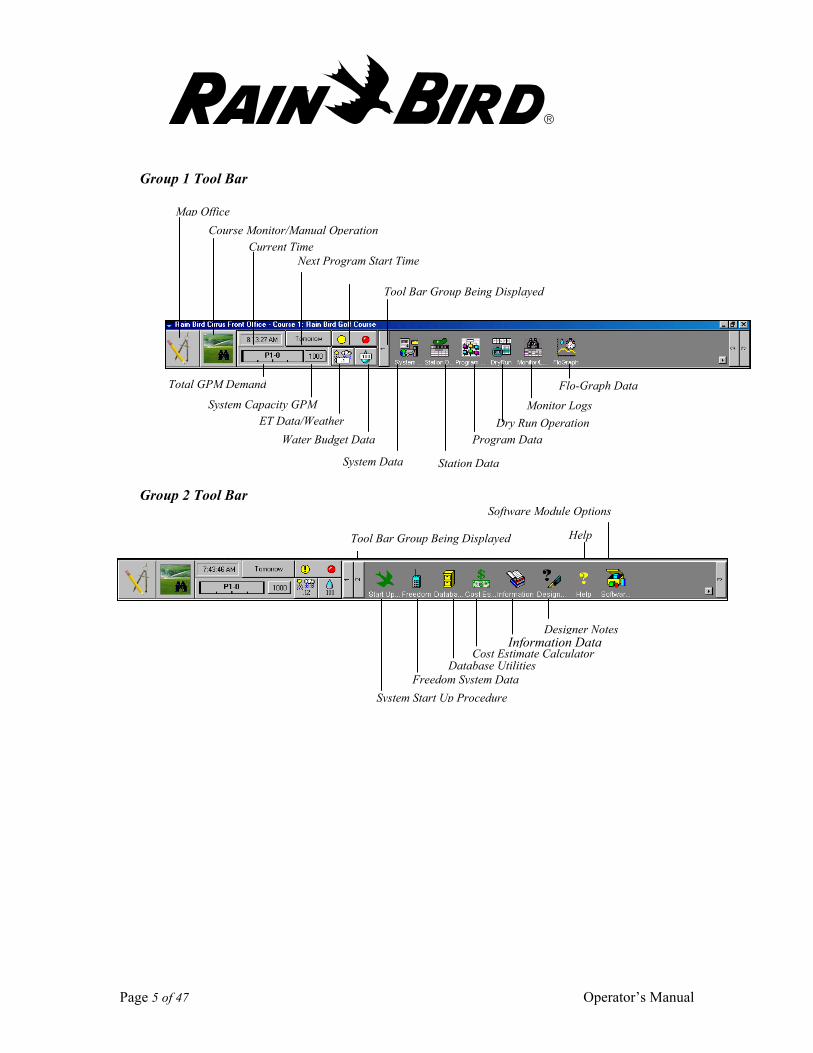
Front Office All the operational functions for the system are initiated from the Front Office screen. Because of the number of items presented, the toolbar is broken into three (3) separate groups. It is recommended that you spend some time becoming familiar with the various icons presented here, as well as other features and information of the system.
Rain Bird systems can be set up to use both metric and imperial units for flow measurement. The system currently supports over 20 different languages.
Page 5 of 47 Operator’s Manual
Group 1 Tool Bar
System Status
Group 2 Tool Bar
Course Monitor/Manual OperationMap Office
Current Time Next Program Start Time
Tool Bar Group Being Displayed
Total GPM Demand
Monitor Logs Dry Run Operation
Flo-Graph Data
Program Data
Station Data System Data
Water Budget DataET Data/Weather
System Capacity GPM
Help
Software Module Options
Tool Bar Group Being Displayed
Designer Notes
Cost Estimate Calculator Information Data
Freedom System DataSystem Start Up Procedure
Database Utilities
Page 6 of 47 Operator’s Manual
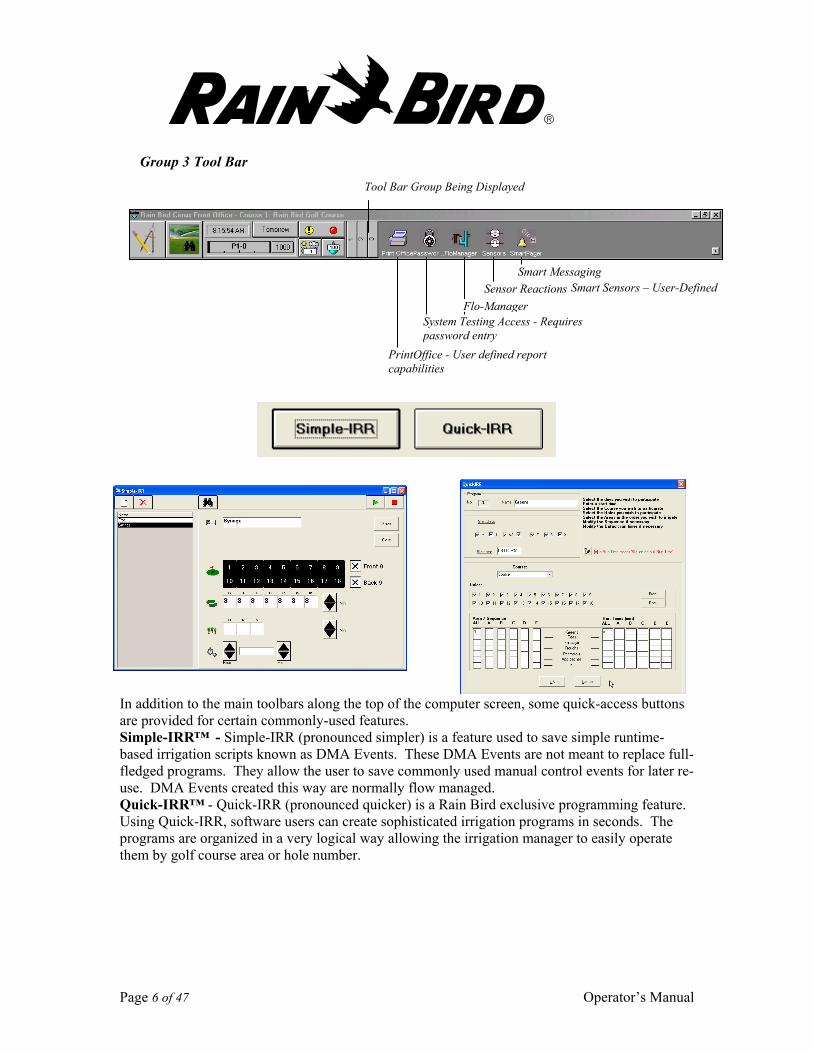
Group 3 Tool Bar
In addition to the main toolbars along the top of the computer screen, some quick-access buttons are provided for certain commonly-used features. Simple-IRR™ - Simple-IRR (pronounced simpler) is a feature used to save simple runtime-based irrigation scripts known as DMA Events. These DMA Events are not meant to replace full-fledged programs. They allow the user to save commonly used manual control events for later re-use. DMA Events created this way are normally flow managed. Quick-IRR™ - Quick-IRR (pronounced quicker) is a Rain Bird exclusive programming feature. Using Quick-IRR, software users can create sophisticated irrigation programs in seconds. The programs are organized in a very logical way allowing the irrigation manager to easily operate them by golf course area or hole number.
Tool Bar Group Being Displayed
Smart Messaging Sensor Reactions
Flo-Manager Smart Sensors – User-Defined
System Testing Access - Requires password entry
PrintOffice - User defined report capabilities
Page 7 of 47 Operator’s Manual
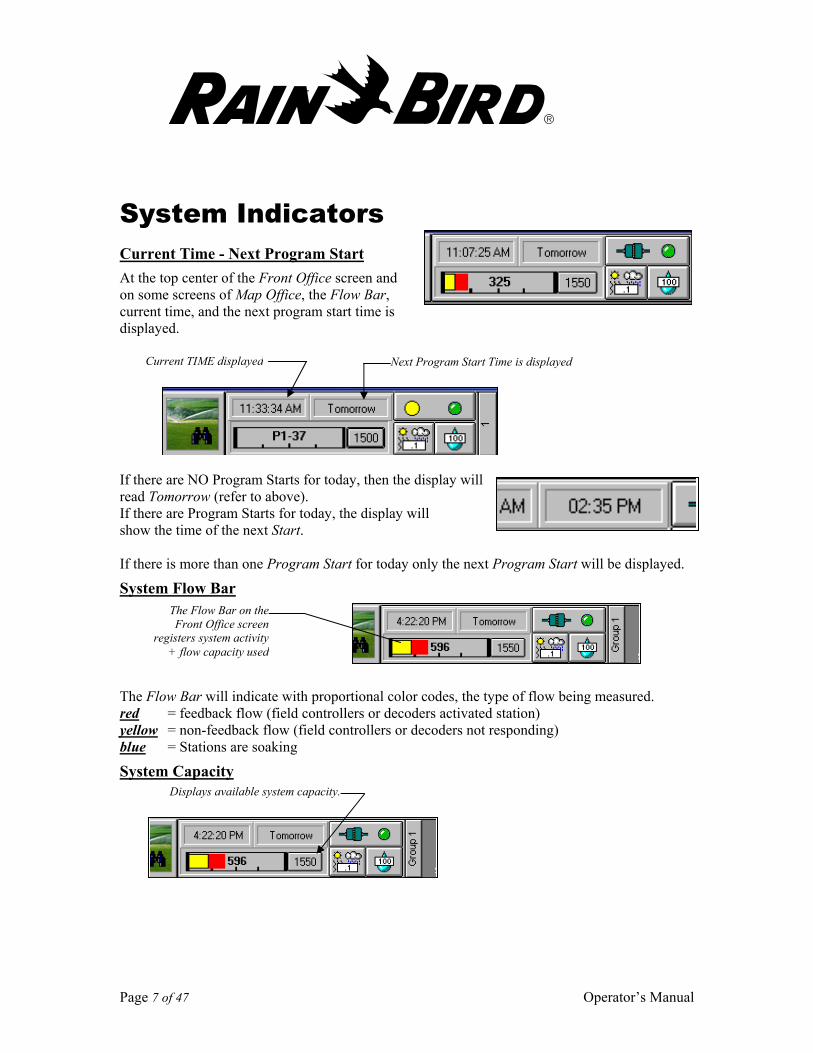
System Indicators Current Time - Next Program Start At the top center of the Front Office screen and on some screens of Map Office, the Flow Bar, current time, and the next program start time is displayed. If there are NO Program Starts for today, then the display will read Tomorrow (refer to above). If there are Program Starts for today, the display will show the time of the next Start. If there is more than one Program Start for today only the next Program Start will be displayed.
System Flow Bar The Flow Bar will indicate with proportional color codes, the type of flow being measured. red = feedback flow (field controllers or decoders activated station) yellow = non-feedback flow (field controllers or decoders not responding) blue = Stations are soaking
System Capacity
Current TIME displayed Next Program Start Time is displayed
The Flow Bar on the Front Office screen
registers system activity+ flow capacity used
Displays available system capacity.
Page 8 of 47 Operator’s Manual
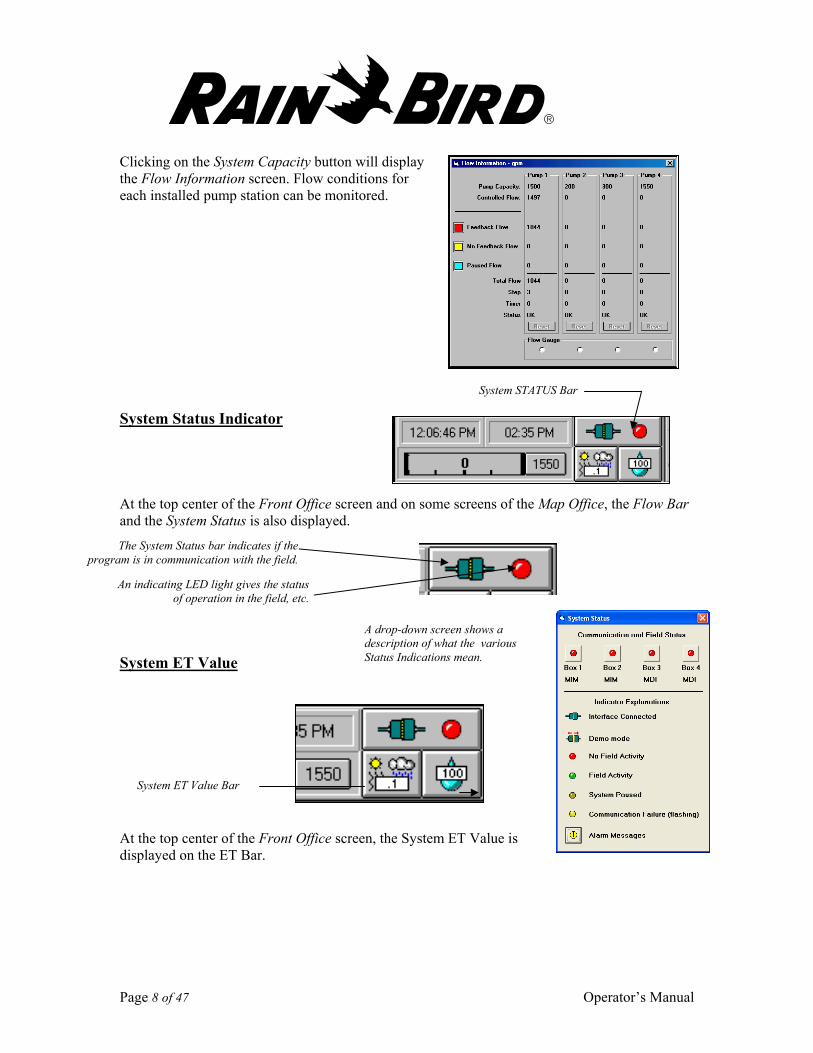
Clicking on the System Capacity button will display the Flow Information screen. Flow conditions for each installed pump station can be monitored.
System Status Indicator
At the top center of the Front Office screen and on some screens of the Map Office, the Flow Bar and the System Status is also displayed. Click on the Status Bar.
System ET Value At the top center of the Front Office screen, the System ET Value is displayed on the ET Bar.
System STATUS Bar
The System Status bar indicates if theprogram is in communication with the field.
An indicating LED light gives the statusof operation in the field, etc.
A drop-down screen shows a description of what the various Status Indications mean.
System ET Value Bar
Page 9 of 47 Operator’s Manual
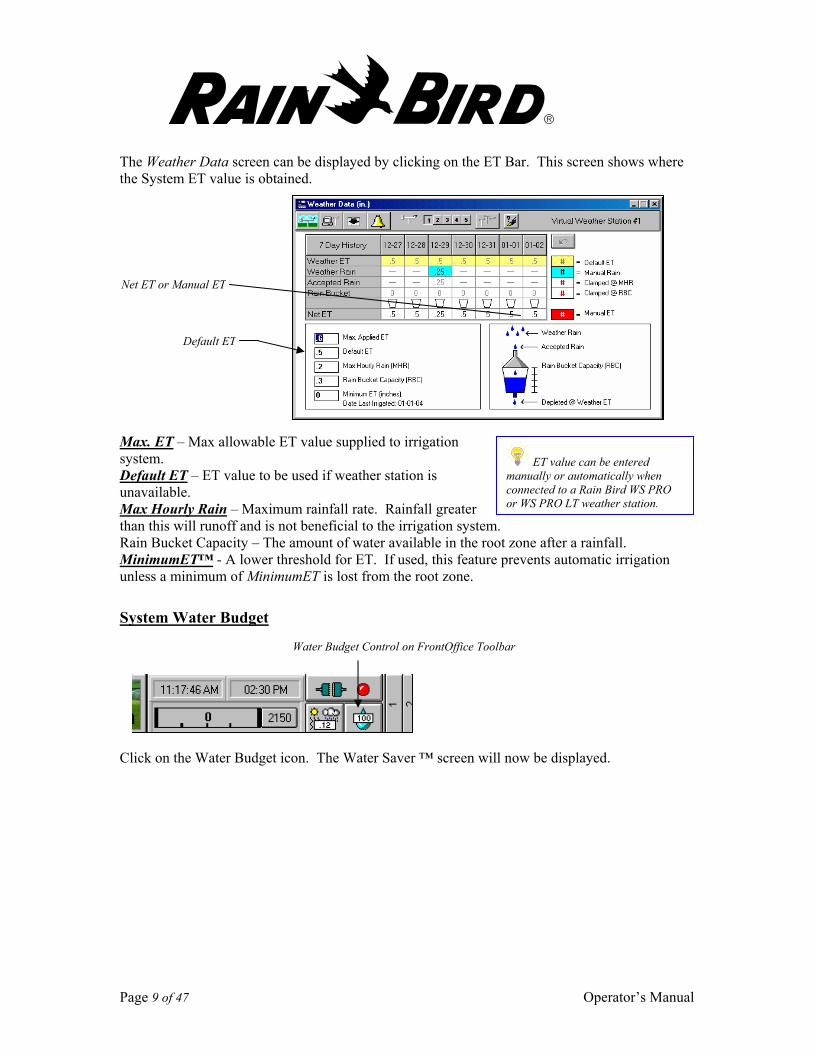
The Weather Data screen can be displayed by clicking on the ET Bar. This screen shows where the System ET value is obtained.
Max. ET – Max allowable ET value supplied to irrigation system. Default ET – ET value to be used if weather station is unavailable. Max Hourly Rain – Maximum rainfall rate. Rainfall greater than this will runoff and is not beneficial to the irrigation system. Rain Bucket Capacity – The amount of water available in the root zone after a rainfall. MinimumET™ - A lower threshold for ET. If used, this feature prevents automatic irrigation unless a minimum of MinimumET is lost from the root zone.
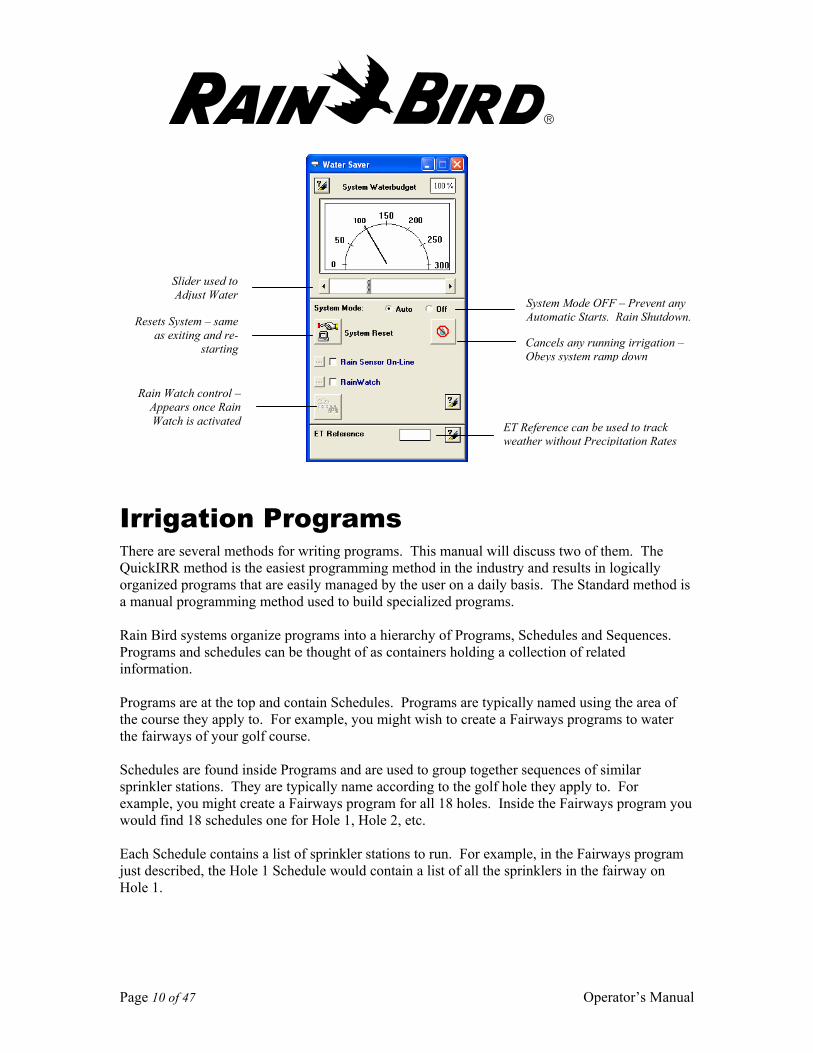
System Water Budget Click on the Water Budget icon. The Water Saver ™ screen will now be displayed.
ET value can be entered manually or automatically when connected to a Rain Bird WS PRO or WS PRO LT weather station.
Water Budget Control on FrontOffice Toolbar
Net ET or Manual ET
Default ET
Page 10 of 47 Operator’s Manual
Irrigation Programs There are several methods for writing programs. This manual will discuss two of them. The QuickIRR method is the easiest programming method in the industry and results in logically organized programs that are easily managed by the user on a daily basis. The Standard method is a manual programming method used to build specialized programs. Rain Bird systems organize programs into a hierarchy of Programs, Schedules and Sequences. Programs and schedules can be thought of as containers holding a collection of related information. Programs are at the top and contain Schedules. Programs are typically named using the area of the course they apply to. For example, you might wish to create a Fairways programs to water the fairways of your golf course. Schedules are found inside Programs and are used to group together sequences of similar sprinkler stations. They are typically name according to the golf hole they apply to. For example, you might create a Fairways program for all 18 holes. Inside the Fairways program you would find 18 schedules one for Hole 1, Hole 2, etc. Each Schedule contains a list of sprinkler stations to run. For example, in the Fairways program just described, the Hole 1 Schedule would contain a list of all the sprinklers in the fairway on Hole 1.
Slider used to Adjust Water
Resets System – same as exiting and re-
starting
Rain Watch control – Appears once Rain Watch is activated ET Reference can be used to track
weather without Precipitation Rates
Cancels any running irrigation – Obeys system ramp down
System Mode OFF – Prevent any Automatic Starts. Rain Shutdown.
Page 11 of 47 Operator’s Manual
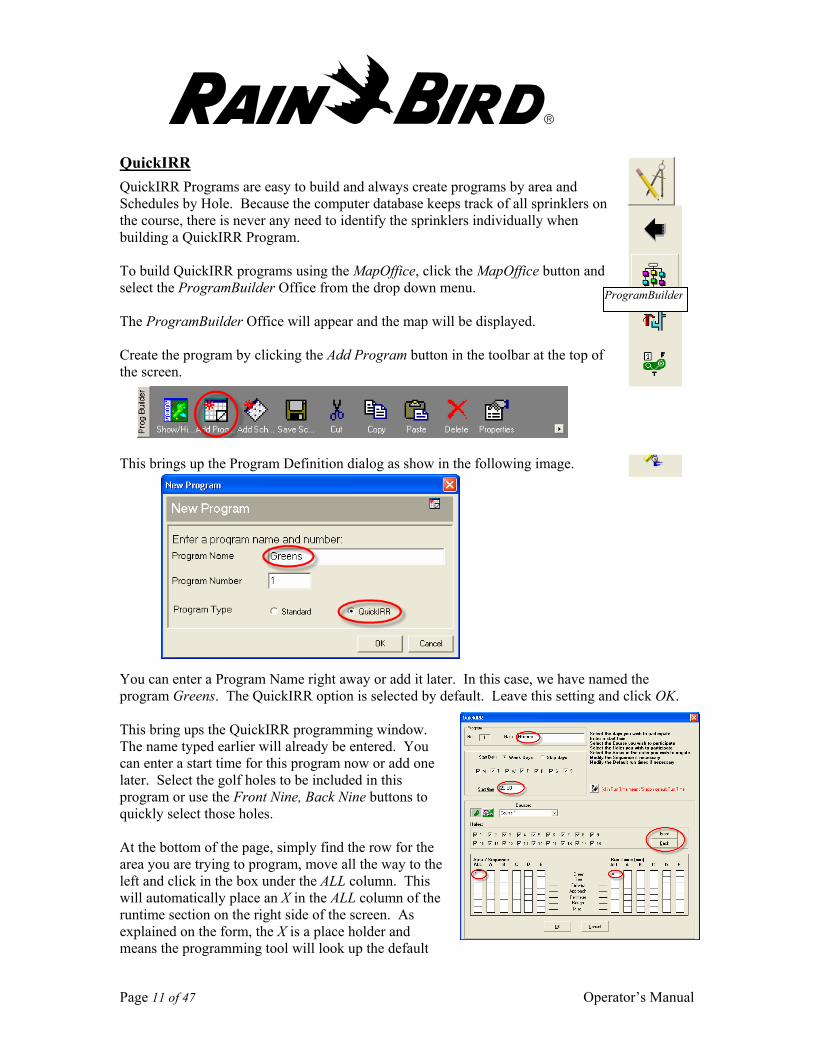
QuickIRR QuickIRR Programs are easy to build and always create programs by area and Schedules by Hole. Because the computer database keeps track of all sprinklers on the course, there is never any need to identify the sprinklers individually when building a QuickIRR Program. To build QuickIRR programs using the MapOffice, click the MapOffice button and select the ProgramBuilder Office from the drop down menu. The ProgramBuilder Office will appear and the map will be displayed. Create the program by clicking the Add Program button in the toolbar at the top of the screen.
This brings up the Program Definition dialog as show in the following image.
You can enter a Program Name right away or add it later. In this case, we have named the program Greens. The QuickIRR option is selected by default. Leave this setting and click OK. This bring ups the QuickIRR programming window. The name typed earlier will already be entered. You can enter a start time for this program now or add one later. Select the golf holes to be included in this program or use the Front Nine, Back Nine buttons to quickly select those holes. At the bottom of the page, simply find the row for the area you are trying to program, move all the way to the left and click in the box under the ALL column. This will automatically place an X in the ALL column of the runtime section on the right side of the screen. As explained on the form, the X is a place holder and means the programming tool will look up the default
ProgramBuilder
Page 12 of 47 Operator’s Manual
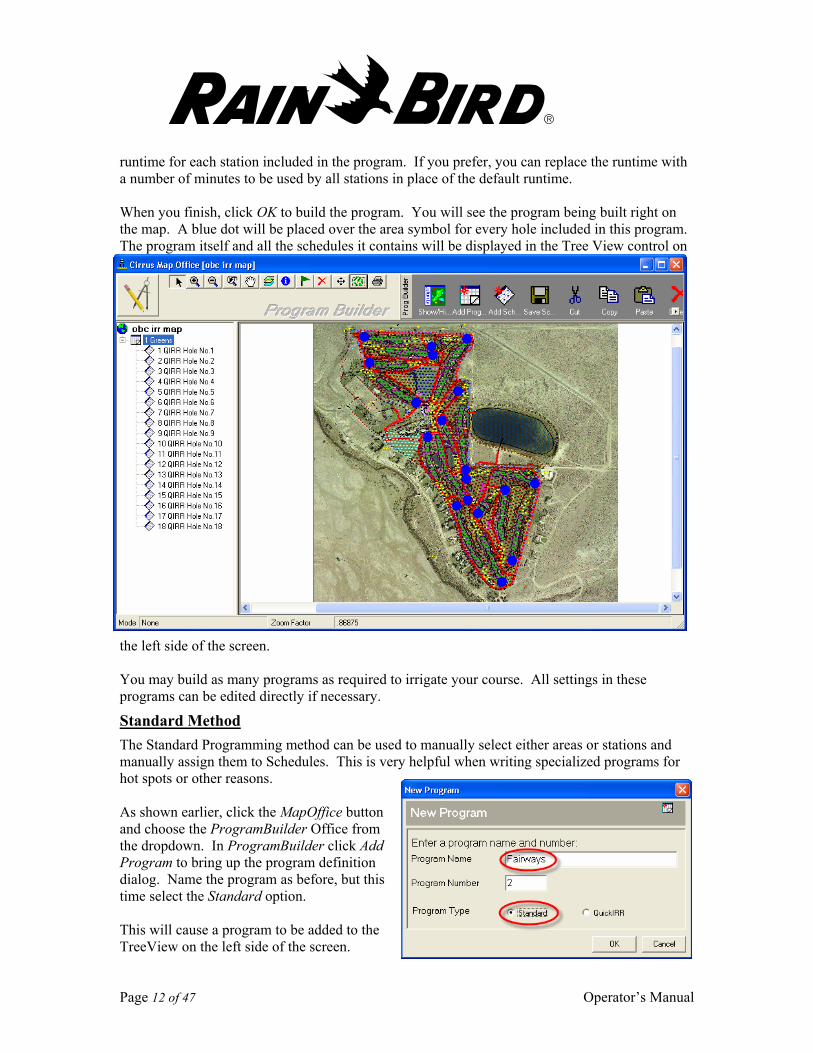
runtime for each station included in the program. If you prefer, you can replace the runtime with a number of minutes to be used by all stations in place of the default runtime. When you finish, click OK to build the program. You will see the program being built right on the map. A blue dot will be placed over the area symbol for every hole included in this program. The program itself and all the schedules it contains will be displayed in the Tree View control on
the left side of the screen. You may build as many programs as required to irrigate your course. All settings in these programs can be edited directly if necessary.
Standard Method The Standard Programming method can be used to manually select either areas or stations and manually assign them to Schedules. This is very helpful when writing specialized programs for hot spots or other reasons. As shown earlier, click the MapOffice button and choose the ProgramBuilder Office from the dropdown. In ProgramBuilder click Add Program to bring up the program definition dialog. Name the program as before, but this time select the Standard option. This will cause a program to be added to the TreeView on the left side of the screen.
Page 13 of 47 Operator’s Manual
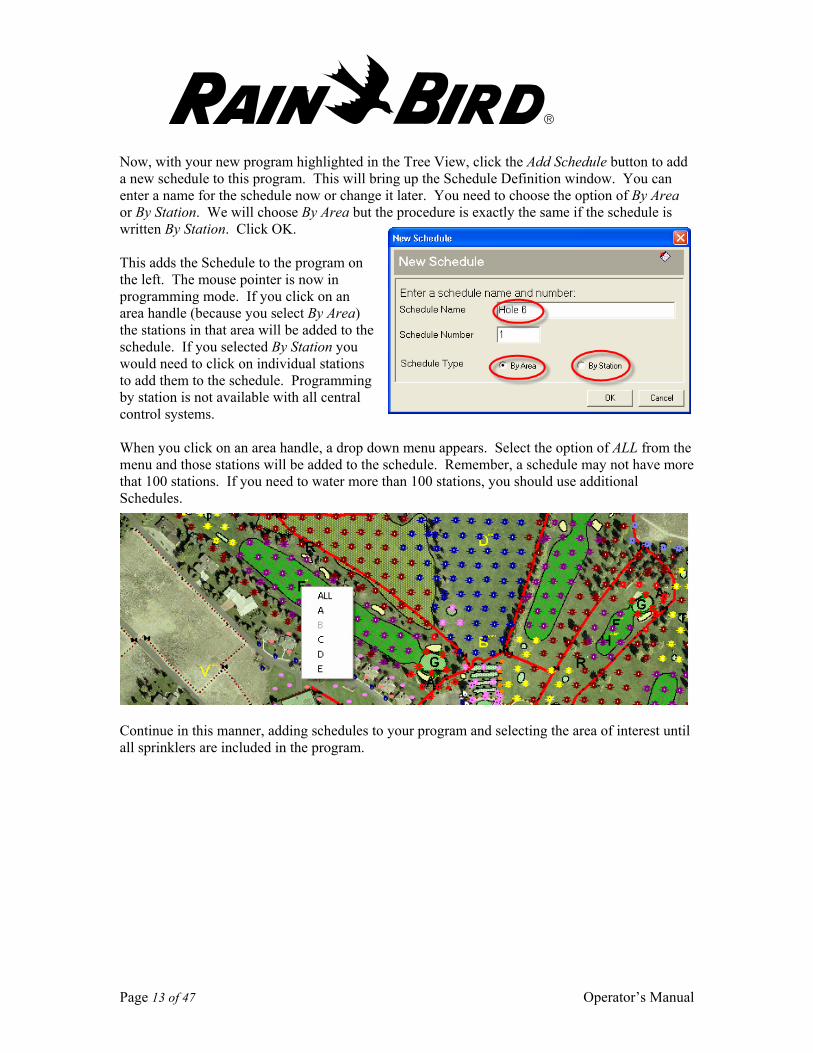
Now, with your new program highlighted in the Tree View, click the Add Schedule button to add a new schedule to this program. This will bring up the Schedule Definition window. You can enter a name for the schedule now or change it later. You need to choose the option of By Area or By Station. We will choose By Area but the procedure is exactly the same if the schedule is written By Station. Click OK. This adds the Schedule to the program on the left. The mouse pointer is now in programming mode. If you click on an area handle (because you select By Area) the stations in that area will be added to the schedule. If you selected By Station you would need to click on individual stations to add them to the schedule. Programming by station is not available with all central control systems. When you click on an area handle, a drop down menu appears. Select the option of ALL from the menu and those stations will be added to the schedule. Remember, a schedule may not have more that 100 stations. If you need to water more than 100 stations, you should use additional Schedules.
Continue in this manner, adding schedules to your program and selecting the area of interest until all sprinklers are included in the program.
Page 14 of 47 Operator’s Manual
Station Detail
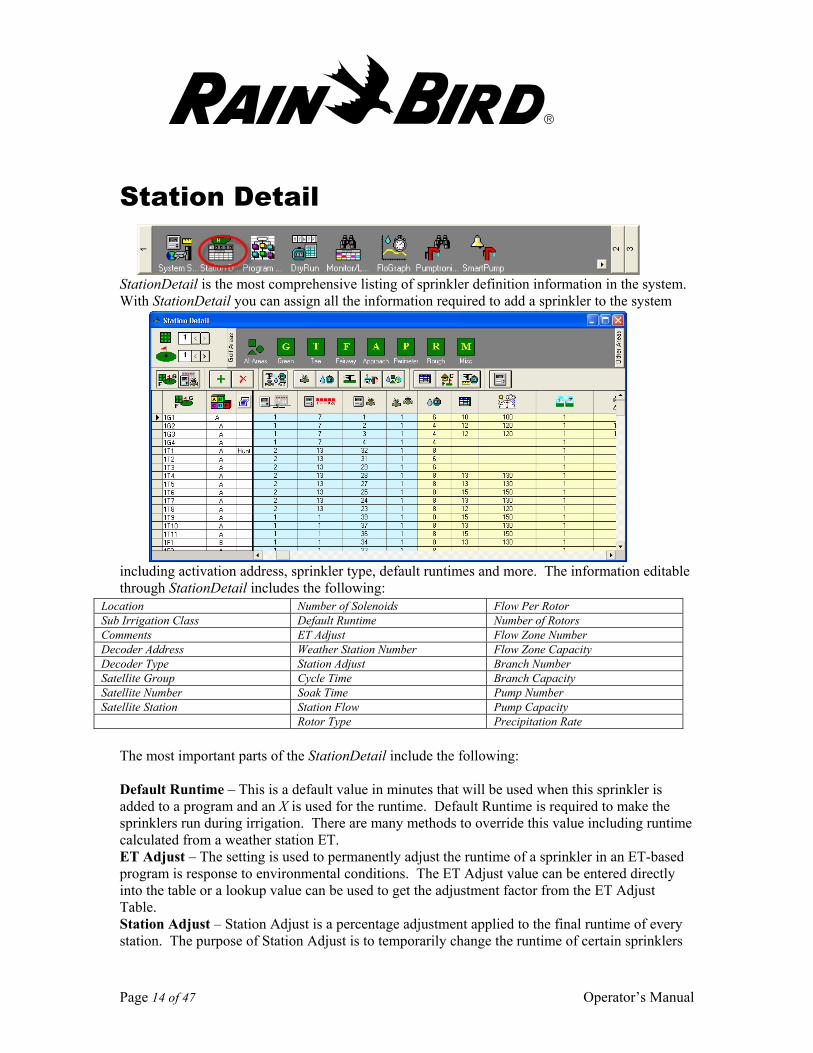
StationDetail is the most comprehensive listing of sprinkler definition information in the system. With StationDetail you can assign all the information required to add a sprinkler to the system
including activation address, sprinkler type, default runtimes and more. The information editable through StationDetail includes the following:
The most important parts of the StationDetail include the following: Default Runtime – This is a default value in minutes that will be used when this sprinkler is added to a program and an X is used for the runtime. Default Runtime is required to make the sprinklers run during irrigation. There are many methods to override this value including runtime calculated from a weather station ET. ET Adjust – The setting is used to permanently adjust the runtime of a sprinkler in an ET-based program is response to environmental conditions. The ET Adjust value can be entered directly into the table or a lookup value can be used to get the adjustment factor from the ET Adjust Table. Station Adjust – Station Adjust is a percentage adjustment applied to the final runtime of every station. The purpose of Station Adjust is to temporarily change the runtime of certain sprinklers
Location Number of Solenoids Flow Per Rotor Sub Irrigation Class Default Runtime Number of Rotors Comments ET Adjust Flow Zone Number Decoder Address Weather Station Number Flow Zone Capacity Decoder Type Station Adjust Branch Number Satellite Group Cycle Time Branch Capacity Satellite Number Soak Time Pump Number Satellite Station Station Flow Pump Capacity Rotor Type Precipitation Rate
Page 15 of 47 Operator’s Manual
for a few days due to some infrequent watering requirement. For example, occasionally it may be useful to turn a sprinkler off for a few days. In this case, set that sprinkler’s ET Adjust to 0% and the sprinkler will not turn on – even if it is included in programs. Version 5 of the central control applications included the ability to set a day timer for station adjustments. Beginning with version 5, you can set the station adjust to 0% for 3 days. After that the adjustment will return to its original setting. Cycle & Soak – Cycle and Soak are rally two settings that work together. Cycle Time is the maximum number of minutes the station may run in a row before it must stop to allow water to soak into the ground. Soak Time is the minimum amount of time the station must remain off before it can cycle on again. For example, a sprinkler that must run 8 minutes is assigned a cycle time of 5 minutes and a soak time of 2 minutes. When the station is started, it will run for 5 minutes, then pause. After at least 2 minutes, the station will turn on again and run the remaining 3 minutes for a total of 8 minutes runtime.
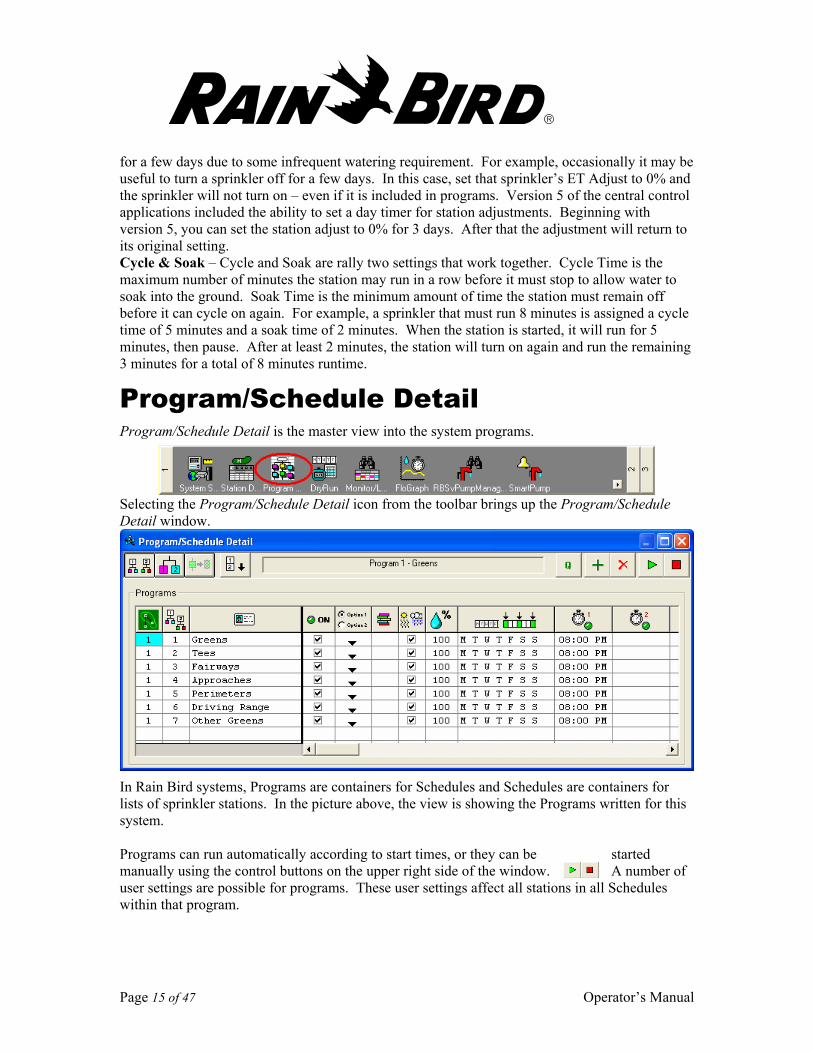
Program/Schedule Detail Program/Schedule Detail is the master view into the system programs.
Selecting the Program/Schedule Detail icon from the toolbar brings up the Program/Schedule Detail window.
In Rain Bird systems, Programs are containers for Schedules and Schedules are containers for lists of sprinkler stations. In the picture above, the view is showing the Programs written for this system. Programs can run automatically according to start times, or they can be started manually using the control buttons on the upper right side of the window. A number of user settings are possible for programs. These user settings affect all stations in all Schedules within that program.
Page 16 of 47 Operator’s Manual
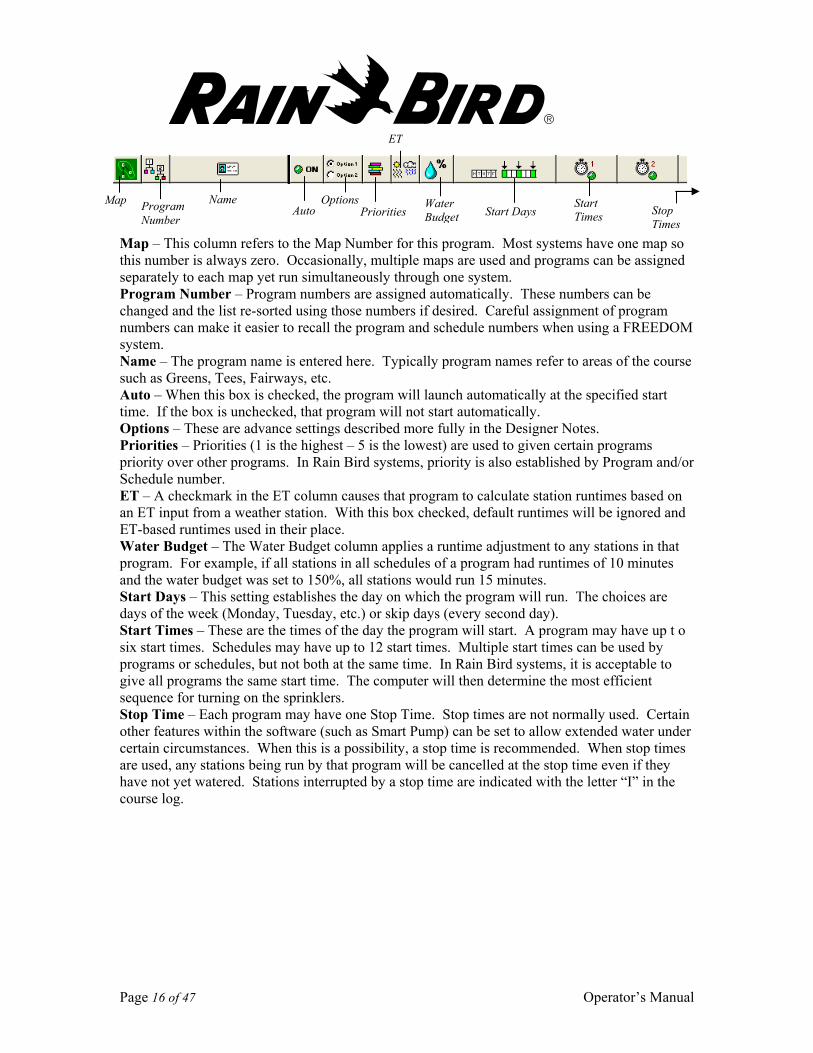
Map – This column refers to the Map Number for this program. Most systems have one map so this number is always zero. Occasionally, multiple maps are used and programs can be assigned separately to each map yet run simultaneously through one system. Program Number – Program numbers are assigned automatically. These numbers can be changed and the list re-sorted using those numbers if desired. Careful assignment of program numbers can make it easier to recall the program and schedule numbers when using a FREEDOM system. Name – The program name is entered here. Typically program names refer to areas of the course such as Greens, Tees, Fairways, etc. Auto – When this box is checked, the program will launch automatically at the specified start time. If the box is unchecked, that program will not start automatically. Options – These are advance settings described more fully in the Designer Notes. Priorities – Priorities (1 is the highest – 5 is the lowest) are used to given certain programs priority over other programs. In Rain Bird systems, priority is also established by Program and/or Schedule number. ET – A checkmark in the ET column causes that program to calculate station runtimes based on an ET input from a weather station. With this box checked, default runtimes will be ignored and ET-based runtimes used in their place. Water Budget – The Water Budget column applies a runtime adjustment to any stations in that program. For example, if all stations in all schedules of a program had runtimes of 10 minutes and the water budget was set to 150%, all stations would run 15 minutes. Start Days – This setting establishes the day on which the program will run. The choices are days of the week (Monday, Tuesday, etc.) or skip days (every second day). Start Times – These are the times of the day the program will start. A program may have up t o six start times. Schedules may have up to 12 start times. Multiple start times can be used by programs or schedules, but not both at the same time. In Rain Bird systems, it is acceptable to give all programs the same start time. The computer will then determine the most efficient sequence for turning on the sprinklers. Stop Time – Each program may have one Stop Time. Stop times are not normally used. Certain other features within the software (such as Smart Pump) can be set to allow extended water under certain circumstances. When this is a possibility, a stop time is recommended. When stop times are used, any stations being run by that program will be cancelled at the stop time even if they have not yet watered. Stations interrupted by a stop time are indicated with the letter “I” in the course log.
Map Program Number
Name Auto
Options Priorities
ET
Water Budget Start Days
Start Times Stop
Times
Page 17 of 47 Operator’s Manual
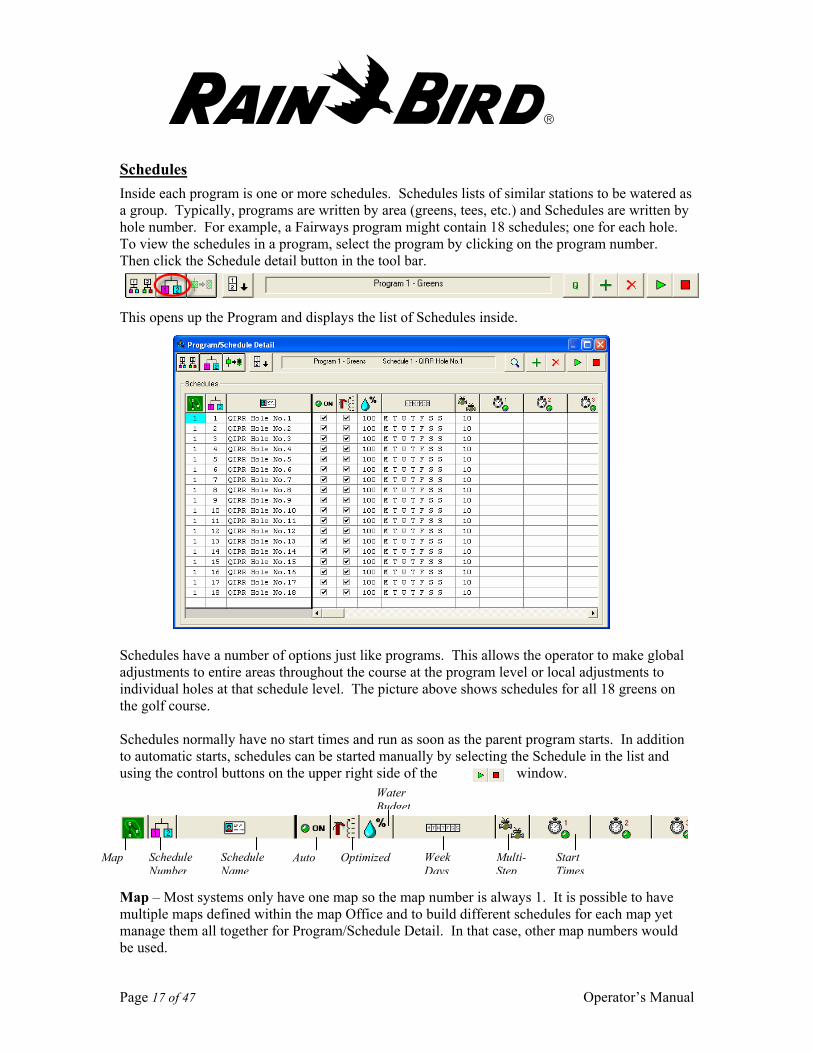
Schedules Inside each program is one or more schedules. Schedules lists of similar stations to be watered as a group. Typically, programs are written by area (greens, tees, etc.) and Schedules are written by hole number. For example, a Fairways program might contain 18 schedules; one for each hole. To view the schedules in a program, select the program by clicking on the program number. Then click the Schedule detail button in the tool bar.
This opens up the Program and displays the list of Schedules inside.
Schedules have a number of options just like programs. This allows the operator to make global adjustments to entire areas throughout the course at the program level or local adjustments to individual holes at that schedule level. The picture above shows schedules for all 18 greens on the golf course. Schedules normally have no start times and run as soon as the parent program starts. In addition to automatic starts, schedules can be started manually by selecting the Schedule in the list and using the control buttons on the upper right side of the window.
Map – Most systems only have one map so the map number is always 1. It is possible to have multiple maps defined within the map Office and to build different schedules for each map yet manage them all together for Program/Schedule Detail. In that case, other map numbers would be used.
Water Budget
Map Schedule Number
Schedule Name
Auto Optimized Week Days
Multi-Step
Start Times
Page 18 of 47 Operator’s Manual
Schedule Number – The Schedule Number is entered automatically when schedules are built. The number establishes that schedule’s priority relative to other schedules in the program. The schedule number can be edited on screen if desired to move it higher in the list and give the stations within it a higher priority. Schedule Name – This is the name of the schedule. The name should be descriptive of the stations contained within the schedule. If all the stations are on Hole 1, the schedule name might be Hole One. If all the stations are on the Driving Range Tee, the schedule might be called Driving Range Tee. Auto – A checkmark in this box means that schedule will start automatically when the parent program starts or at each of its assigned start times, whichever is later. Optimized – This option is selected by default and is usually not changed. Optimized schedules are fully flow managed. When this option is not selected, stations in this schedule will be started according to the multi-step setting explained below. Water Budget – Water Budget is a percentage adjustment to runtimes of stations within in the schedule. The water budget value is cumulative meaning it is in addition to any System Level Water Budget Factor and Program Level Water Budget Factor. If you System Water Budget Factor is 50%, your program water budget factor is 50% and your schedule water budget factor is 50%, and stations in that schedule have runtimes of 15 minutes, they will run 50% X 50% X 50% X 15 minutes or about 2 minutes. Week Days – This is the days of the week that the schedule will run. Normally every day of the week is selected. If you have a reason to turn the hole off on a certain day, uncheck that box. Be sure the days the hole is scheduled to run are compatible with the parent program. If the parent program is set to run only on Monday and the schedule is set to run only on Tuesday, the stations will never run because every Monday the program runs but the schedule is off. On Tuesday when the Schedule is set to run, the program never launches and is therefore unable to start the schedule. Multi-Step – This setting defaults to 10 is rarely changed. Occasionally there is a need to control the way a schedule steps through its stations. In that case the Multi-Step setting might be changed. If the Optimized box is unchecked, the schedule will turn on only the number of stations indicated by the multi-step setting. For example, if Multi-Step were set to 1 and Optimized was turned off, stations in that schedule will run one at a time. If Multi-Step were 2, stations would be started two at a time if there were capacity. Start Times – Schedules can have up to 12 start times. If multiple start times are used in the parent program, they may not be used at the schedule level. If no start time is used, the schedule will launch as soon as the parent program opens. When using start times, be sure they are compatible with the start time of the parent program. If the parent program is set to start at 20:00 and a schedule is set to start at 19:00, that schedule will start at 19:00 THE NEXT DAY. If the Schedule has a start time of 20:30, that schedule will start 30 minutes after the program launches.
Page 19 of 47 Operator’s Manual
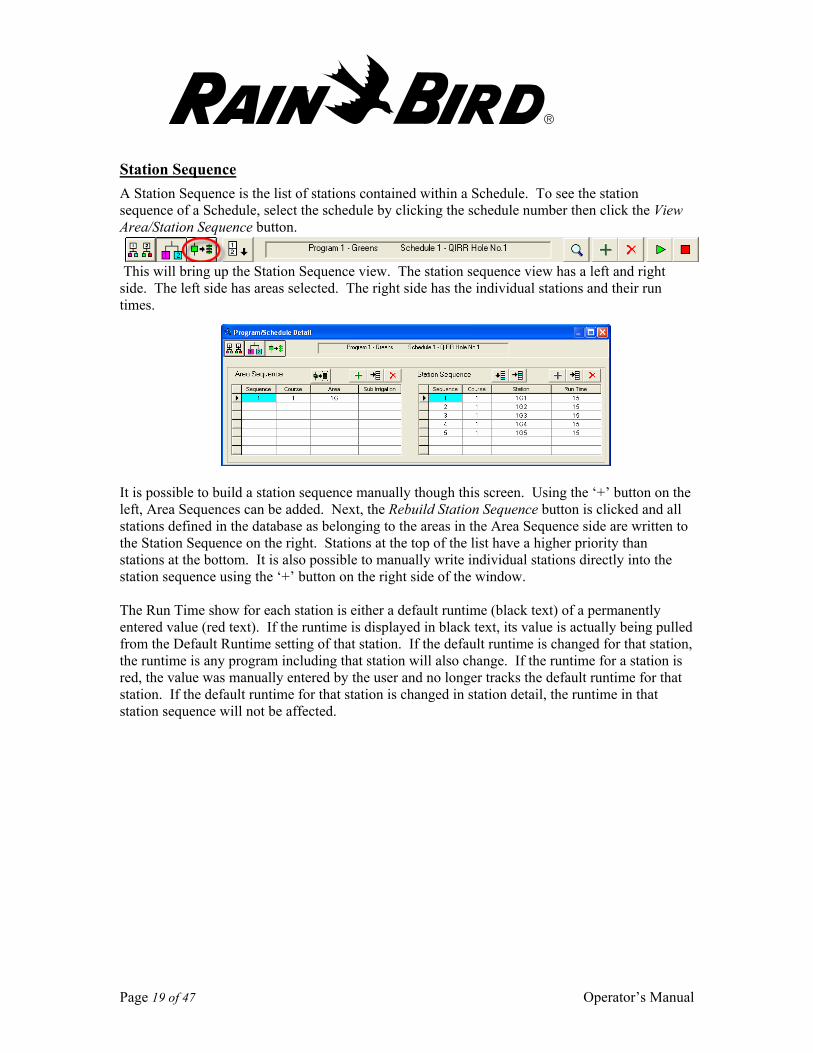
Station Sequence A Station Sequence is the list of stations contained within a Schedule. To see the station sequence of a Schedule, select the schedule by clicking the schedule number then click the View Area/Station Sequence button.
This will bring up the Station Sequence view. The station sequence view has a left and right side. The left side has areas selected. The right side has the individual stations and their run times.
It is possible to build a station sequence manually though this screen. Using the ‘+’ button on the left, Area Sequences can be added. Next, the Rebuild Station Sequence button is clicked and all stations defined in the database as belonging to the areas in the Area Sequence side are written to the Station Sequence on the right. Stations at the top of the list have a higher priority than stations at the bottom. It is also possible to manually write individual stations directly into the station sequence using the ‘+’ button on the right side of the window. The Run Time show for each station is either a default runtime (black text) of a permanently entered value (red text). If the runtime is displayed in black text, its value is actually being pulled from the Default Runtime setting of that station. If the default runtime is changed for that station, the runtime is any program including that station will also change. If the runtime for a station is red, the value was manually entered by the user and no longer tracks the default runtime for that station. If the default runtime for that station is changed in station detail, the runtime in that station sequence will not be affected.
Page 20 of 47 Operator’s Manual
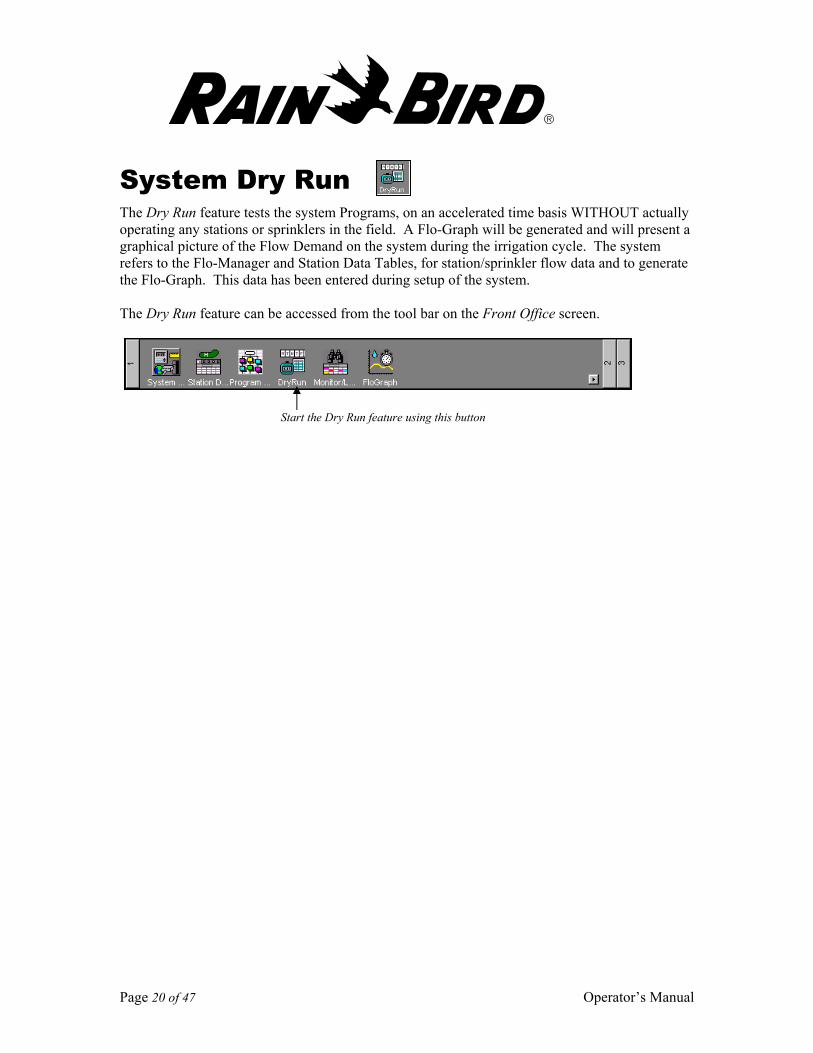
System Dry Run The Dry Run feature tests the system Programs, on an accelerated time basis WITHOUT actually operating any stations or sprinklers in the field. A Flo-Graph will be generated and will present a graphical picture of the Flow Demand on the system during the irrigation cycle. The system refers to the Flo-Manager and Station Data Tables, for station/sprinkler flow data and to generate the Flo-Graph. This data has been entered during setup of the system. The Dry Run feature can be accessed from the tool bar on the Front Office screen.
Start the Dry Run feature using this button
Page 21 of 47 Operator’s Manual
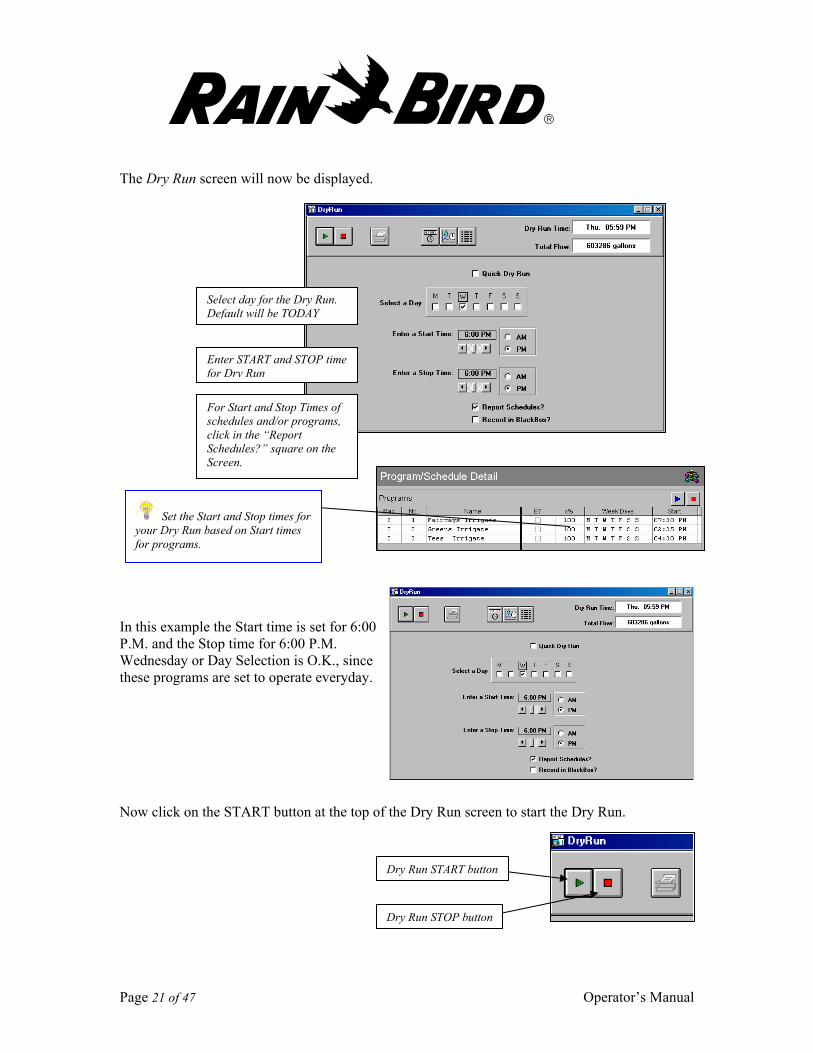
The Dry Run screen will now be displayed.
In this example the Start time is set for 6:00 P.M. and the Stop time for 6:00 P.M. Wednesday or Day Selection is O.K., since these programs are set to operate everyday. Now click on the START button at the top of the Dry Run screen to start the Dry Run.
Select day for the Dry Run. Default will be TODAY
Enter START and STOP time for Dry Run
For Start and Stop Times of schedules and/or programs, click in the “Report Schedules?” square on the Screen.
Set the Start and Stop times for your Dry Run based on Start times for programs.
Dry Run START button
Dry Run STOP button
Page 22 of 47 Operator’s Manual
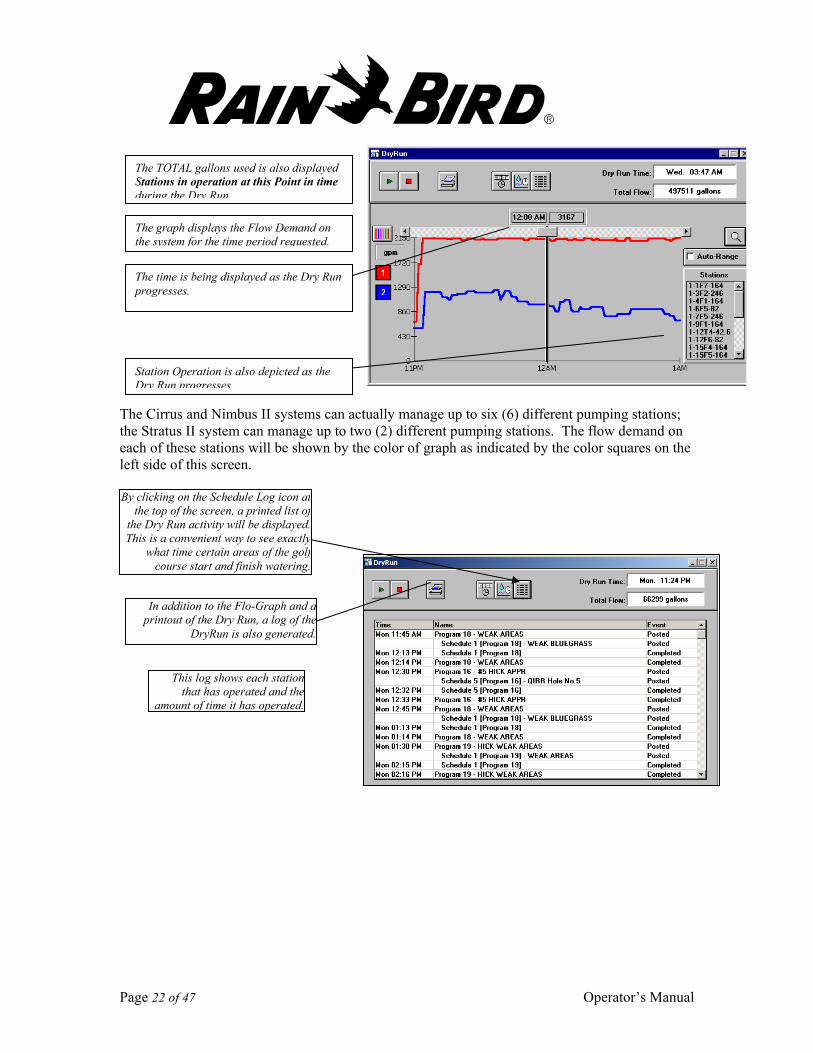
The Cirrus and Nimbus II systems can actually manage up to six (6) different pumping stations; the Stratus II system can manage up to two (2) different pumping stations. The flow demand on each of these stations will be shown by the color of graph as indicated by the color squares on the left side of this screen. This list may be printed by
Station Operation is also depicted as the Dry Run progresses
The time is being displayed as the Dry Run progresses.
The TOTAL gallons used is also displayed Stations in operation at this Point in time during the Dry Run
The graph displays the Flow Demand on the system for the time period requested.
By clicking on the Schedule Log icon atthe top of the screen, a printed list of
the Dry Run activity will be displayed.This is a convenient way to see exactly
what time certain areas of the golfcourse start and finish watering.
In addition to the Flo-Graph and a printout of the Dry Run, a log of the
DryRun is also generated.
This log shows each stationthat has operated and the
amount of time it has operated.
Page 23 of 47 Operator’s Manual
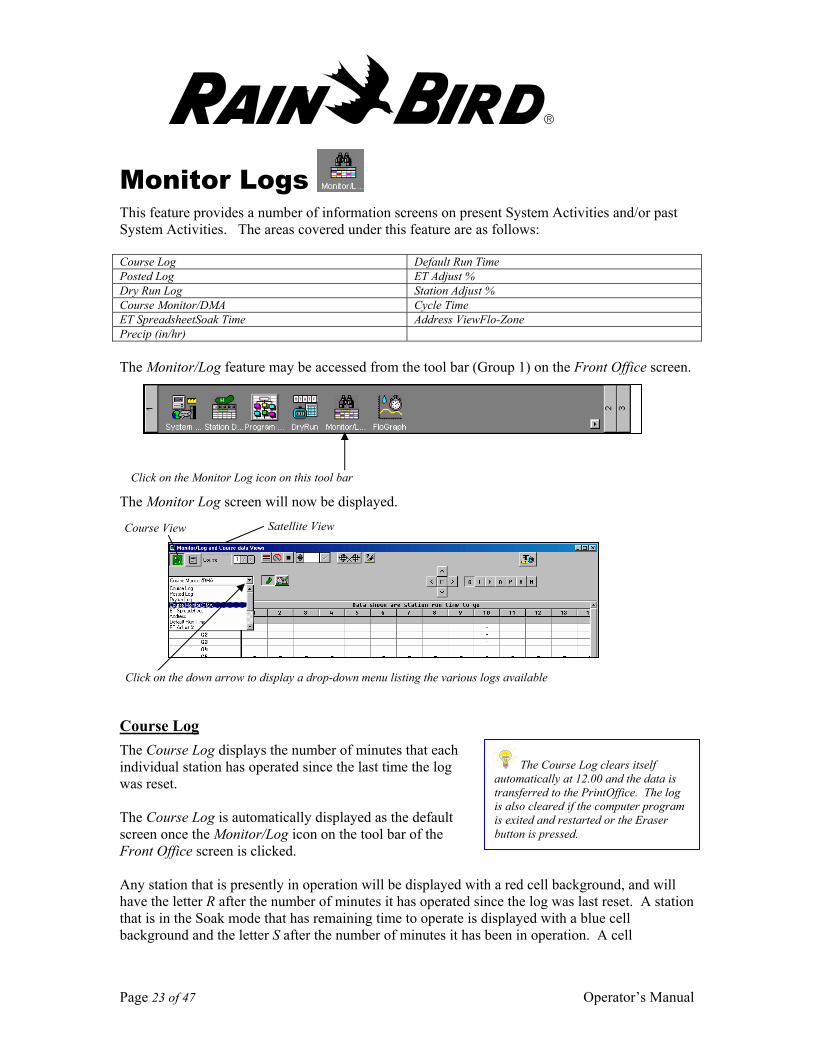
Monitor Logs This feature provides a number of information screens on present System Activities and/or past System Activities. The areas covered under this feature are as follows: Course Log Default Run Time Posted Log ET Adjust % Dry Run Log Station Adjust % Course Monitor/DMA Cycle Time ET SpreadsheetSoak Time Address ViewFlo-Zone Precip (in/hr) The Monitor/Log feature may be accessed from the tool bar (Group 1) on the Front Office screen. The Monitor Log screen will now be displayed.
Course Log The Course Log displays the number of minutes that each individual station has operated since the last time the log was reset. The Course Log is automatically displayed as the default screen once the Monitor/Log icon on the tool bar of the Front Office screen is clicked. Any station that is presently in operation will be displayed with a red cell background, and will have the letter R after the number of minutes it has operated since the log was last reset. A station that is in the Soak mode that has remaining time to operate is displayed with a blue cell background and the letter S after the number of minutes it has been in operation. A cell
The Course Log clears itself automatically at 12.00 and the data is transferred to the PrintOffice. The log is also cleared if the computer program is exited and restarted or the Eraser button is pressed.
Click on the Monitor Log icon on this tool bar
Course View Satellite View
Click on the down arrow to display a drop-down menu listing the various logs available
Page 24 of 47 Operator’s Manual
background in yellow with the letter N indicates that station was programmed to operate, but there is no feedback from the station. It will register 0 (zero) time and is an indication that there may be a problem with the station and/or controller. Stations which are interrupted by a program STOP time will be identified with the letter I in the cell.
Posted Log This feature displays, in chart form, the number of minutes each station will operate during the next scheduled program.
Dry Run Log The Dry Run Log displays the number of minutes that each individual station would actually operate during an irrigation cycle. The Dry Run assumes that every thing would operate satisfactorily in the field, even though none of the actual operation of sprinklers in the field will take place during the Dry Run. The information is organized by hole and by area within the hole.
Course Monitor/DMA Log Stations started by both Programs and manually are posted to this screen when started. The total amount of time left to operate is placed in the appropriate cell. The various stations will be operated as they are worked into the Flo-Manager scheme. A station in operation will have a red cell background and the letter R after the time left to operate. A cell with a white background has not yet been placed into operation and the amount of time left to operate is shown. A station in the SOAK mode will have a blue background and the letter S after the time left to operate. A station cell with a yellow background and the letter N after the time to operate indicates a station that is programmed to operate but has No Feedback, therefore may have a problem and should be checked.
ET Spreadsheet The ET Spreadsheet feature displays the number of minutes that each station will operate in a given cycle according to the system ET value. ET adjustments and Station Runtime adjustments are not factored into this screen. To see the effects of these ET and station adjustments, perform a Dry Run and review the Dry Run Log. When the ET Spreadsheet is first displayed, the data will be based on the system ET value for the present day. The system ET Value is displayed on the window in the top center of the chart. The Total water volume that would be required is shown in the window at the top right of the chart. This is NOT to be confused with the Total water volume that might be required for the irrigation that will take place on the next cycle. The figure displayed here is if ALL stations were to operate, and this may not be the case for any given Irrigation Cycle.
Importance of ET The importance of ET can be quickly seen by observing the total water volume that would be required for the present system ET value. For example: For a System ET Value of 6,1 mm (0.24 inches) the Water Volume is 4.155 cubic meters (41,097,658 gallons)
If the ET value shown on the ET spreadsheet is change, equivalent run times are calculated for each station and displayed on the screen.
Page 25 of 47 Operator’s Manual
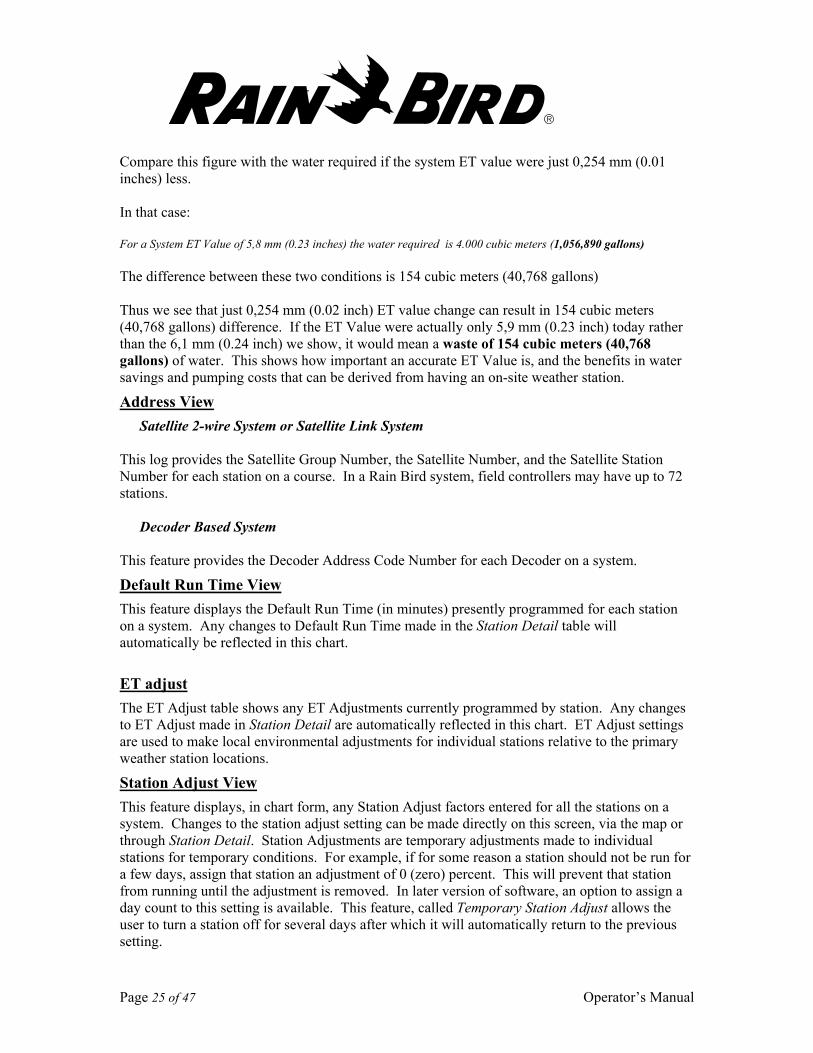
Compare this figure with the water required if the system ET value were just 0,254 mm (0.01 inches) less. In that case: For a System ET Value of 5,8 mm (0.23 inches) the water required is 4.000 cubic meters (1,056,890 gallons) The difference between these two conditions is 154 cubic meters (40,768 gallons) Thus we see that just 0,254 mm (0.02 inch) ET value change can result in 154 cubic meters (40,768 gallons) difference. If the ET Value were actually only 5,9 mm (0.23 inch) today rather than the 6,1 mm (0.24 inch) we show, it would mean a waste of 154 cubic meters (40,768 gallons) of water. This shows how important an accurate ET Value is, and the benefits in water savings and pumping costs that can be derived from having an on-site weather station.
Address View Satellite 2-wire System or Satellite Link System
This log provides the Satellite Group Number, the Satellite Number, and the Satellite Station Number for each station on a course. In a Rain Bird system, field controllers may have up to 72 stations.
Decoder Based System This feature provides the Decoder Address Code Number for each Decoder on a system.
Default Run Time View This feature displays the Default Run Time (in minutes) presently programmed for each station on a system. Any changes to Default Run Time made in the Station Detail table will automatically be reflected in this chart.
ET adjust The ET Adjust table shows any ET Adjustments currently programmed by station. Any changes to ET Adjust made in Station Detail are automatically reflected in this chart. ET Adjust settings are used to make local environmental adjustments for individual stations relative to the primary weather station locations.
Station Adjust View This feature displays, in chart form, any Station Adjust factors entered for all the stations on a system. Changes to the station adjust setting can be made directly on this screen, via the map or through Station Detail. Station Adjustments are temporary adjustments made to individual stations for temporary conditions. For example, if for some reason a station should not be run for a few days, assign that station an adjustment of 0 (zero) percent. This will prevent that station from running until the adjustment is removed. In later version of software, an option to assign a day count to this setting is available. This feature, called Temporary Station Adjust allows the user to turn a station off for several days after which it will automatically return to the previous setting.
Page 26 of 47 Operator’s Manual
Cycle time The Cycle Time table shows Cycle time values currently assigned to each station in the system. Cycle times work with Soak times and refer to the maximum number of minutes a station may run before pausing to allow water to soak into the root zone. A station with an expected runtime of 13 minutes that has a Cycle Time of 7 minutes will run 7 minutes, pause for it assigned soak time, then come back on and run the remaining 6 minutes for a total of 13.
Soak time Soak time is the complimentary wait to the cycle time just described. A station programmed to run 13 minutes that has an assigned cycle time of 7 minutes and an assigned soak time of 10 minutes will run for 7 minutes, pause and allow the water to soak in for at least 10 minutes, then turn on and run the remaining 6 minutes. Soak times are the minimum amount of time a station will wait before cycling on again, because Rain Bird systems are designed to use all available water all the time so while the station is soaking, other stations will be run in their place.
Flo-Zone View This feature displays, in chart form, the Pumping Station Number and the Flo-Zone Number that has been assigned to each station on a system.
Precip (mm/hr) The Precip Table indicates the programmed precipitation rate for each sprinkler in the system. The precipitation rate is in either mm/hour or inches per hour depending on the units selected. A precipitation rate of 22 mm/hr (0.87 inch/hour) means that when that sprinkler is running it will apply a depth of water equivalent to 22 mm (0.87 inches) if it runs for 60 minutes.
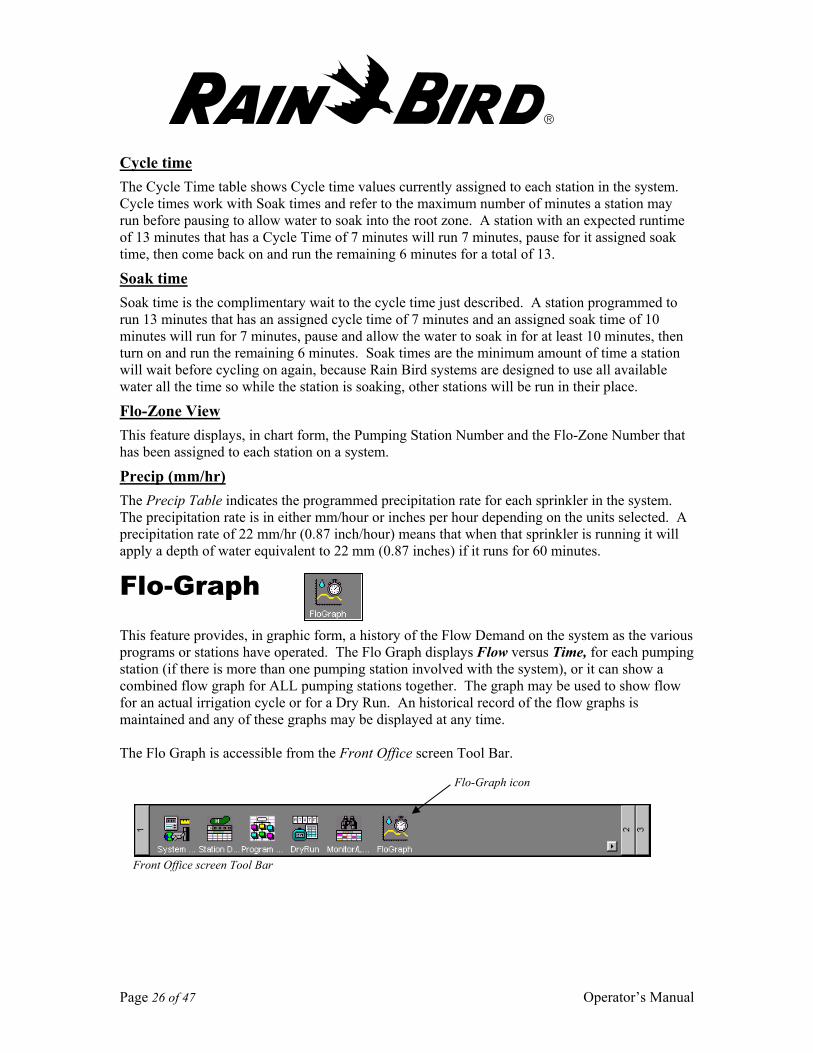
Flo-Graph This feature provides, in graphic form, a history of the Flow Demand on the system as the various programs or stations have operated. The Flo Graph displays Flow versus Time, for each pumping station (if there is more than one pumping station involved with the system), or it can show a combined flow graph for ALL pumping stations together. The graph may be used to show flow for an actual irrigation cycle or for a Dry Run. An historical record of the flow graphs is maintained and any of these graphs may be displayed at any time. The Flo Graph is accessible from the Front Office screen Tool Bar. Front Office screen Tool Bar
Flo-Graph icon
Page 27 of 47 Operator’s Manual
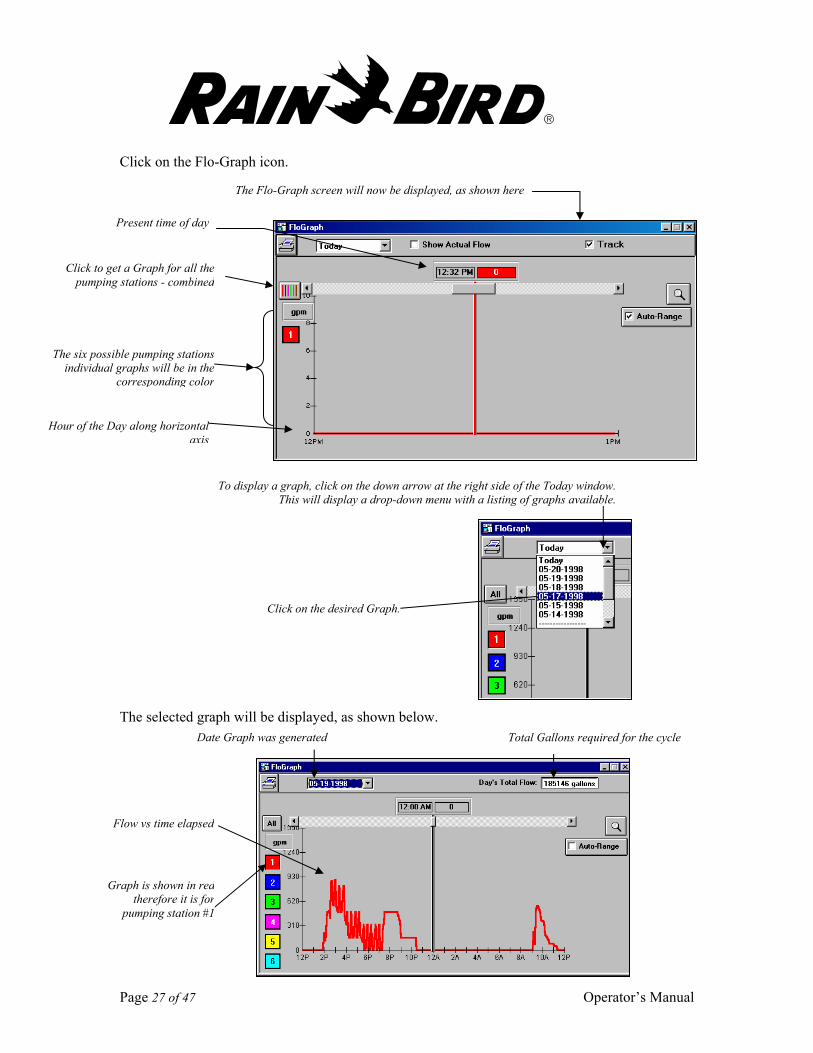
Click on the Flo-Graph icon. The selected graph will be displayed, as shown below.
The Flo-Graph screen will now be displayed, as shown here
Present time of day
Click to get a Graph for all thepumping stations - combined
The six possible pumping stationsindividual graphs will be in the
corresponding color
Hour of the Day along horizontal axis
To display a graph, click on the down arrow at the right side of the Today window.This will display a drop-down menu with a listing of graphs available.
Click on the desired Graph.
Total Gallons required for the cycleDate Graph was generated
Flow vs time elapsed
Graph is shown in red therefore it is for
pumping station #1
Page 28 of 47 Operator’s Manual
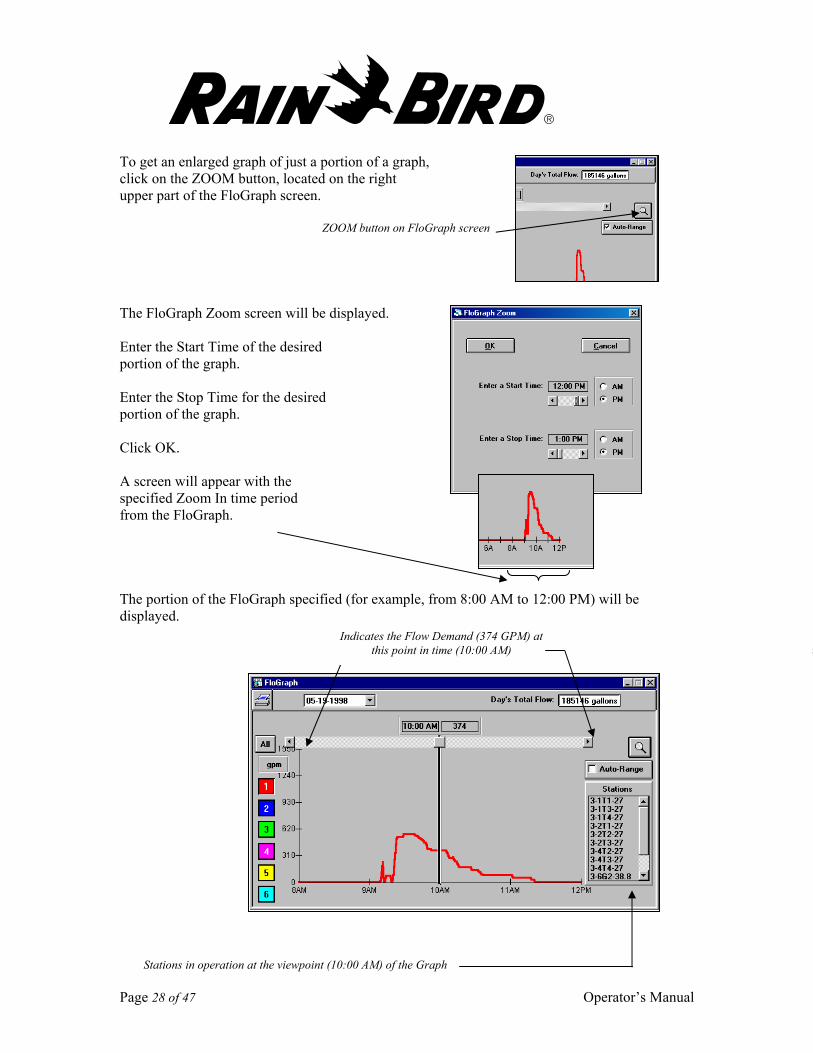
To get an enlarged graph of just a portion of a graph, click on the ZOOM button, located on the right upper part of the FloGraph screen. The FloGraph Zoom screen will be displayed. Enter the Start Time of the desired portion of the graph. Enter the Stop Time for the desired portion of the graph. Click OK. A screen will appear with the specified Zoom In time period from the FloGraph. The portion of the FloGraph specified (for example, from 8:00 AM to 12:00 PM) will be displayed. a
ZOOM button on FloGraph screen
Indicates the Flow Demand (374 GPM) at this point in time (10:00 AM)
Stations in operation at the viewpoint (10:00 AM) of the Graph
Page 29 of 47 Operator’s Manual
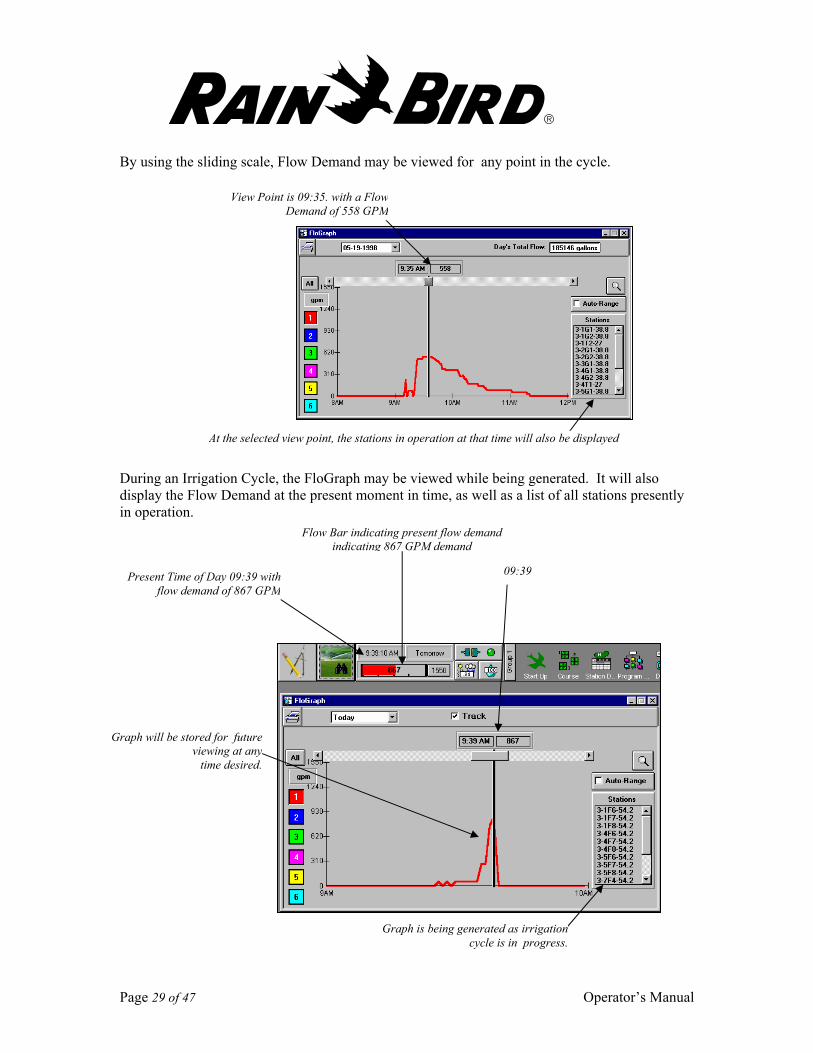
By using the sliding scale, Flow Demand may be viewed for any point in the cycle. During an Irrigation Cycle, the FloGraph may be viewed while being generated. It will also display the Flow Demand at the present moment in time, as well as a list of all stations presently in operation.
View Point is 09:35. with a FlowDemand of 558 GPM
At the selected view point, the stations in operation at that time will also be displayed
Flow Bar indicating present flow demand indicating 867 GPM demand
Present Time of Day 09:39 withflow demand of 867 GPM
09:39
Graph is being generated as irrigation cycle is in progress.
Graph will be stored for futureviewing at any
time desired.
Page 30 of 47 Operator’s Manual
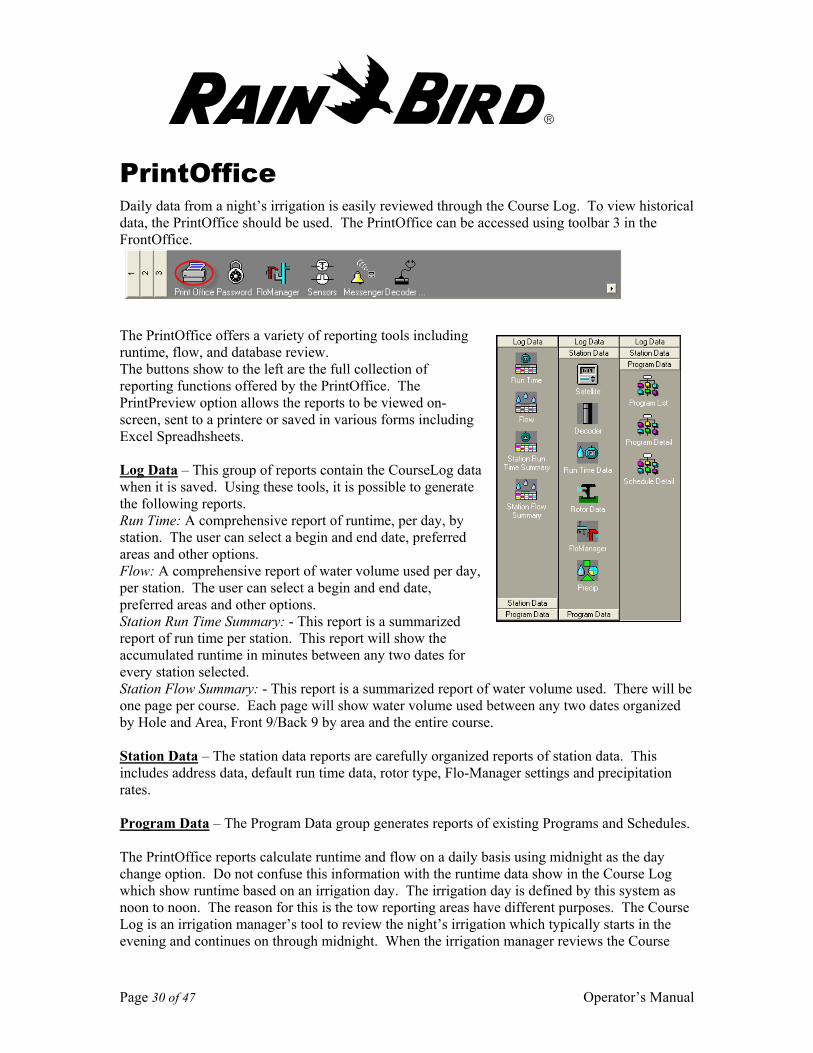
PrintOffice Daily data from a night’s irrigation is easily reviewed through the Course Log. To view historical data, the PrintOffice should be used. The PrintOffice can be accessed using toolbar 3 in the FrontOffice.
The PrintOffice offers a variety of reporting tools including runtime, flow, and database review. The buttons show to the left are the full collection of reporting functions offered by the PrintOffice. The PrintPreview option allows the reports to be viewed on-screen, sent to a printere or saved in various forms including Excel Spreadhsheets. Log Data – This group of reports contain the CourseLog data when it is saved. Using these tools, it is possible to generate the following reports. Run Time: A comprehensive report of runtime, per day, by station. The user can select a begin and end date, preferred areas and other options. Flow: A comprehensive report of water volume used per day, per station. The user can select a begin and end date, preferred areas and other options. Station Run Time Summary: - This report is a summarized report of run time per station. This report will show the accumulated runtime in minutes between any two dates for every station selected. Station Flow Summary: - This report is a summarized report of water volume used. There will be one page per course. Each page will show water volume used between any two dates organized by Hole and Area, Front 9/Back 9 by area and the entire course. Station Data – The station data reports are carefully organized reports of station data. This includes address data, default run time data, rotor type, Flo-Manager settings and precipitation rates. Program Data – The Program Data group generates reports of existing Programs and Schedules. The PrintOffice reports calculate runtime and flow on a daily basis using midnight as the day change option. Do not confuse this information with the runtime data show in the Course Log which show runtime based on an irrigation day. The irrigation day is defined by this system as noon to noon. The reason for this is the tow reporting areas have different purposes. The Course Log is an irrigation manager’s tool to review the night’s irrigation which typically starts in the evening and continues on through midnight. When the irrigation manager reviews the Course
Page 31 of 47 Operator’s Manual
Log, the numbers are expected to reflect the night’s irrigation, not the irrigation since midnight. The PrintOffice was designed to as a way to report water use to others. Water use rates are typically evaluated on the calendar day (midnight to midnight). For this reason, the PrintOffice reports use the midnight to midnight formulation.
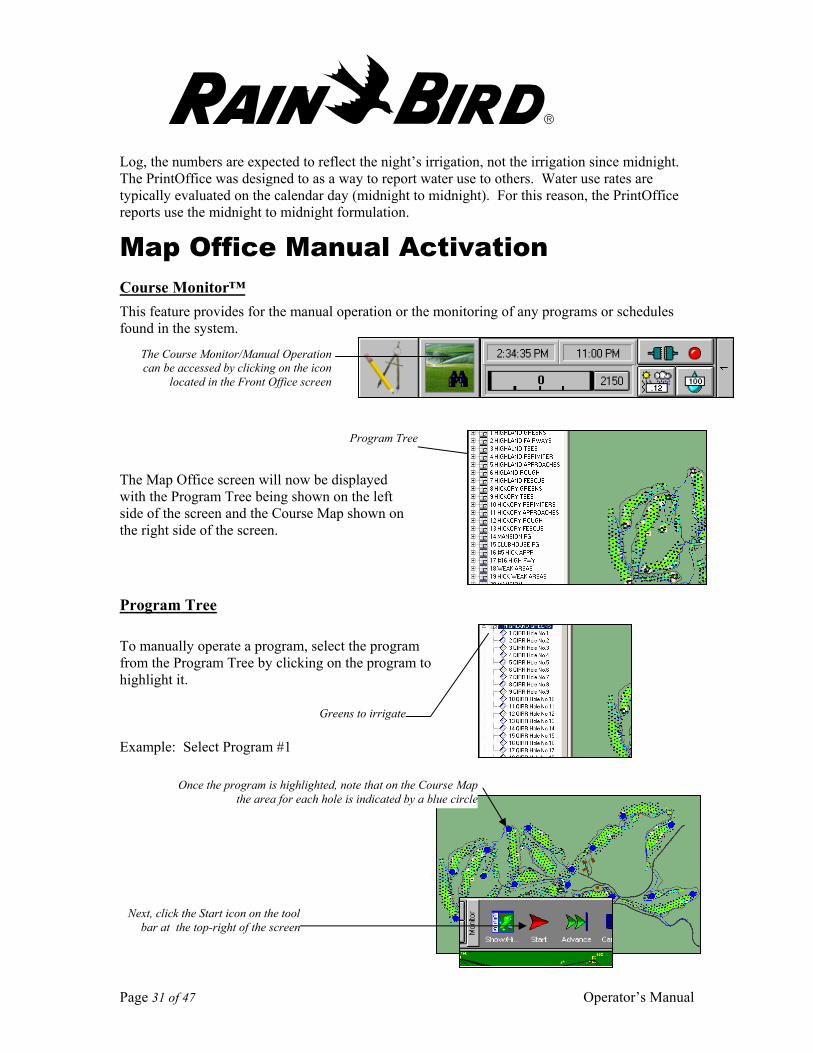
Map Office Manual Activation Course Monitor™ This feature provides for the manual operation or the monitoring of any programs or schedules found in the system. The Map Office screen will now be displayed with the Program Tree being shown on the left side of the screen and the Course Map shown on the right side of the screen.
Program Tree To manually operate a program, select the program from the Program Tree by clicking on the program to highlight it. Example: Select Program #1
The Course Monitor/Manual Operationcan be accessed by clicking on the icon
located in the Front Office screen
Program Tree
Greens to irrigate
Once the program is highlighted, note that on the Course Mapthe area for each hole is indicated by a blue circle
Next, click the Start icon on the toolbar at the top-right of the screen
Page 32 of 47 Operator’s Manual
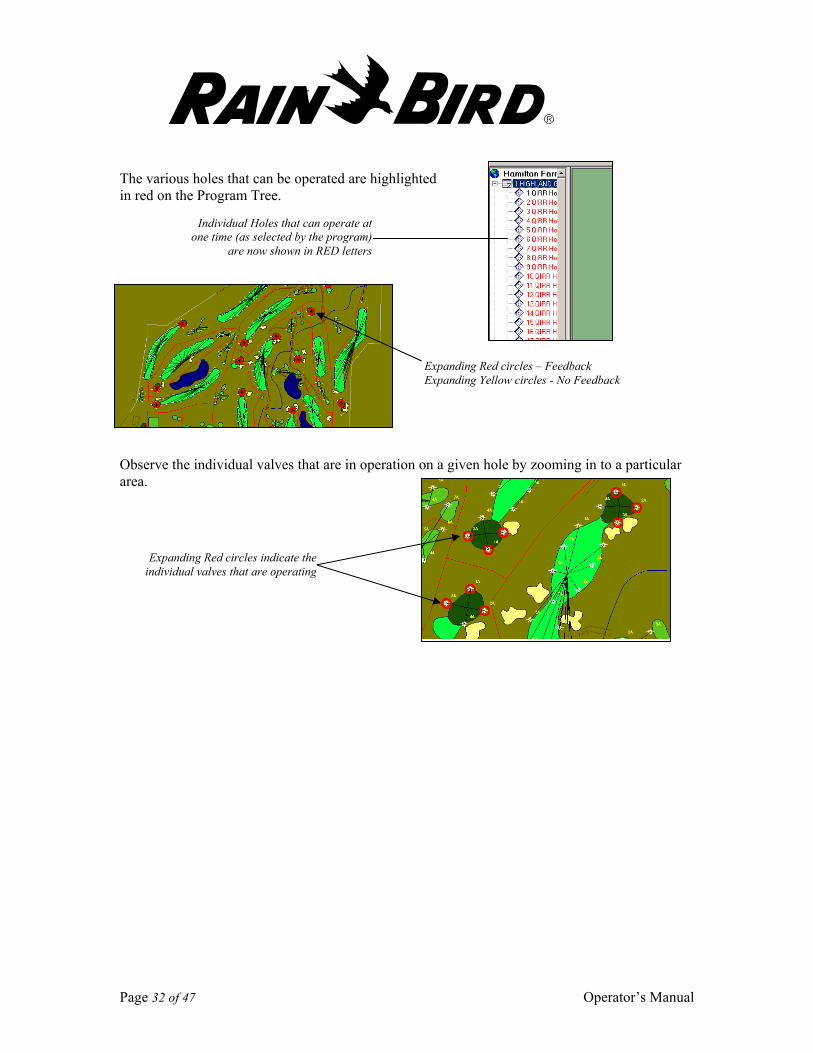
The various holes that can be operated are highlighted in red on the Program Tree. On the Course Map, the individual holes will be indicated by an expanding yellow circle (indicating No Feedback.) As feedback is received, the expanding circles will change to red. Observe the individual valves that are in operation on a given hole by zooming in to a particular area.
Individual Holes that can operate atone time (as selected by the program)
are now shown in RED letters
Expanding Red circles – Feedback Expanding Yellow circles - No Feedback
Expanding Red circles indicate theindividual valves that are operating
Page 33 of 47 Operator’s Manual
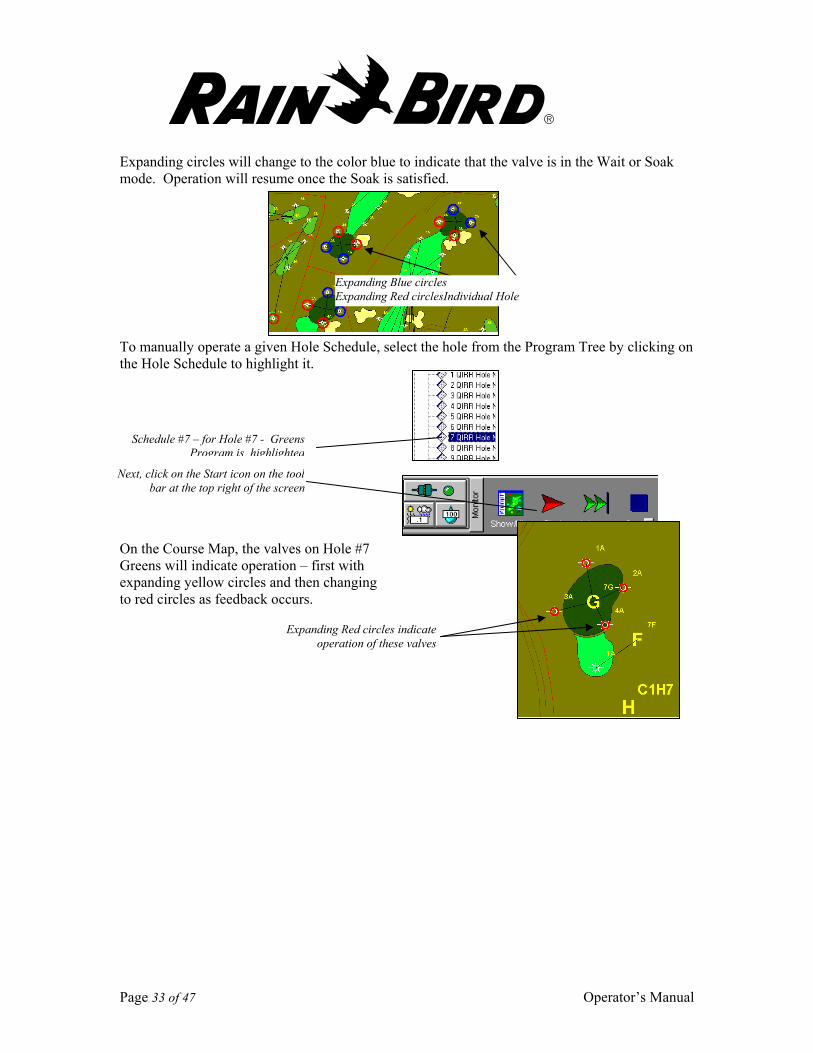
Expanding circles will change to the color blue to indicate that the valve is in the Wait or Soak mode. Operation will resume once the Soak is satisfied. To manually operate a given Hole Schedule, select the hole from the Program Tree by clicking on the Hole Schedule to highlight it. On the Course Map, the valves on Hole #7 Greens will indicate operation – first with expanding yellow circles and then changing to red circles as feedback occurs.
Expanding Blue circles Expanding Red circlesIndividual Hole
Schedule #7 – for Hole #7 - Greens Program is highlighted
Next, click on the Start icon on the toolbar at the top right of the screen
Expanding Red circles indicateoperation of these valves
Page 34 of 47 Operator’s Manual
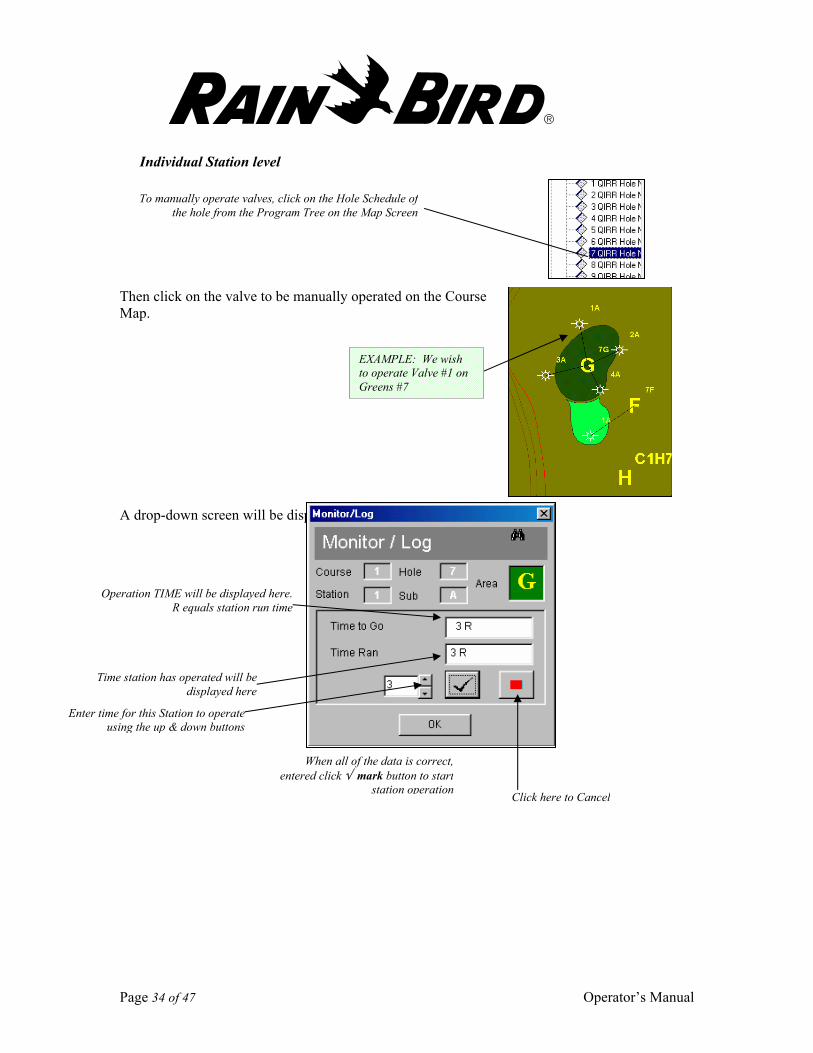
Individual Station level Then click on the valve to be manually operated on the Course Map. A drop-down screen will be displayed.
EXAMPLE: We wish to operate Valve #1 on Greens #7
To manually operate valves, click on the Hole Schedule ofthe hole from the Program Tree on the Map Screen
Operation TIME will be displayed here.R equals station run time
Time station has operated will bedisplayed here
Enter time for this Station to operateusing the up & down buttons
Click here to Cancel
When all of the data is correct,entered click √ mark button to start
station operation
Page 35 of 47 Operator’s Manual
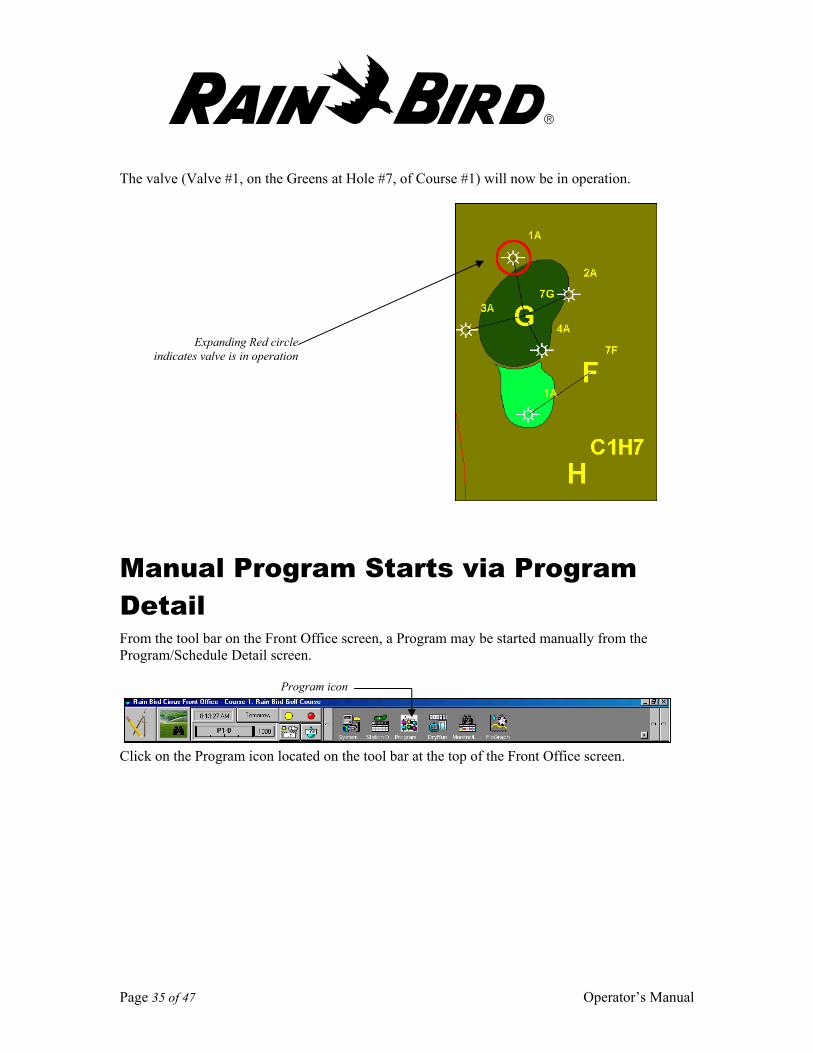
The valve (Valve #1, on the Greens at Hole #7, of Course #1) will now be in operation.
Manual Program Starts via Program Detail From the tool bar on the Front Office screen, a Program may be started manually from the Program/Schedule Detail screen. Click on the Program icon located on the tool bar at the top of the Front Office screen.
Expanding Red circleindicates valve is in operation
Program icon
Page 36 of 47 Operator’s Manual
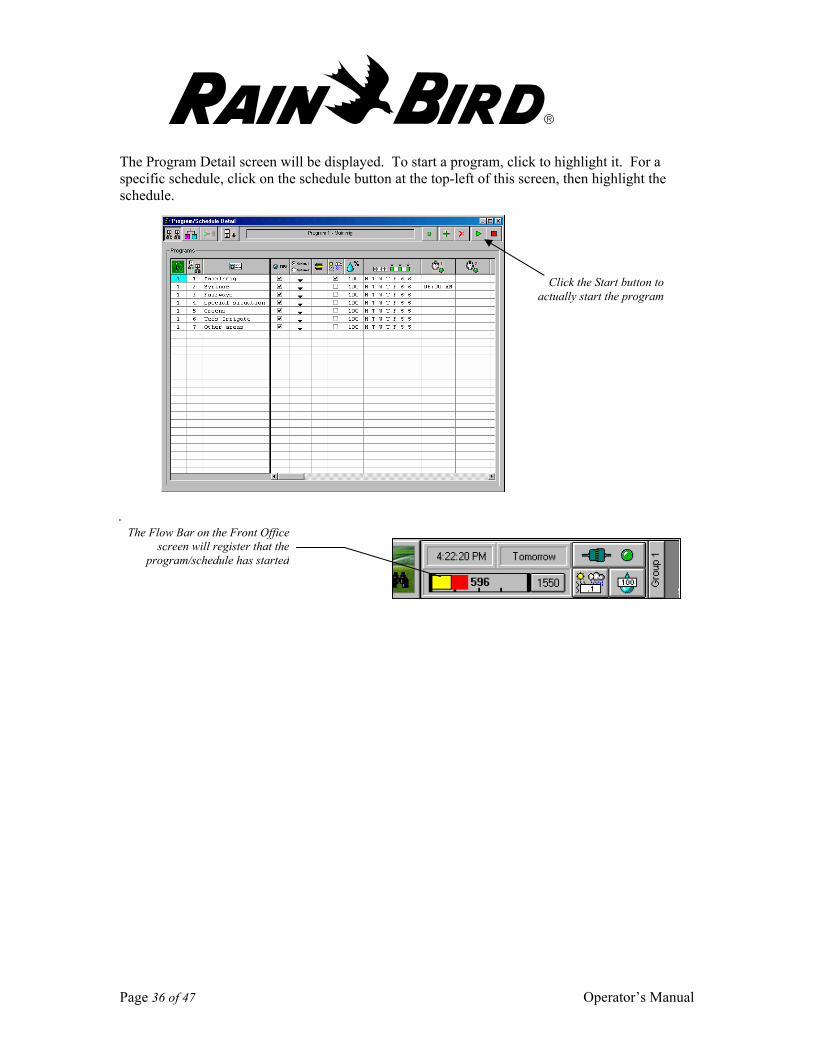
The Program Detail screen will be displayed. To start a program, click to highlight it. For a specific schedule, click on the schedule button at the top-left of this screen, then highlight the schedule.
Click the Start button to actually start the program
The Flow Bar on the Front Officescreen will register that the
program/schedule has started
Page 37 of 47 Operator’s Manual
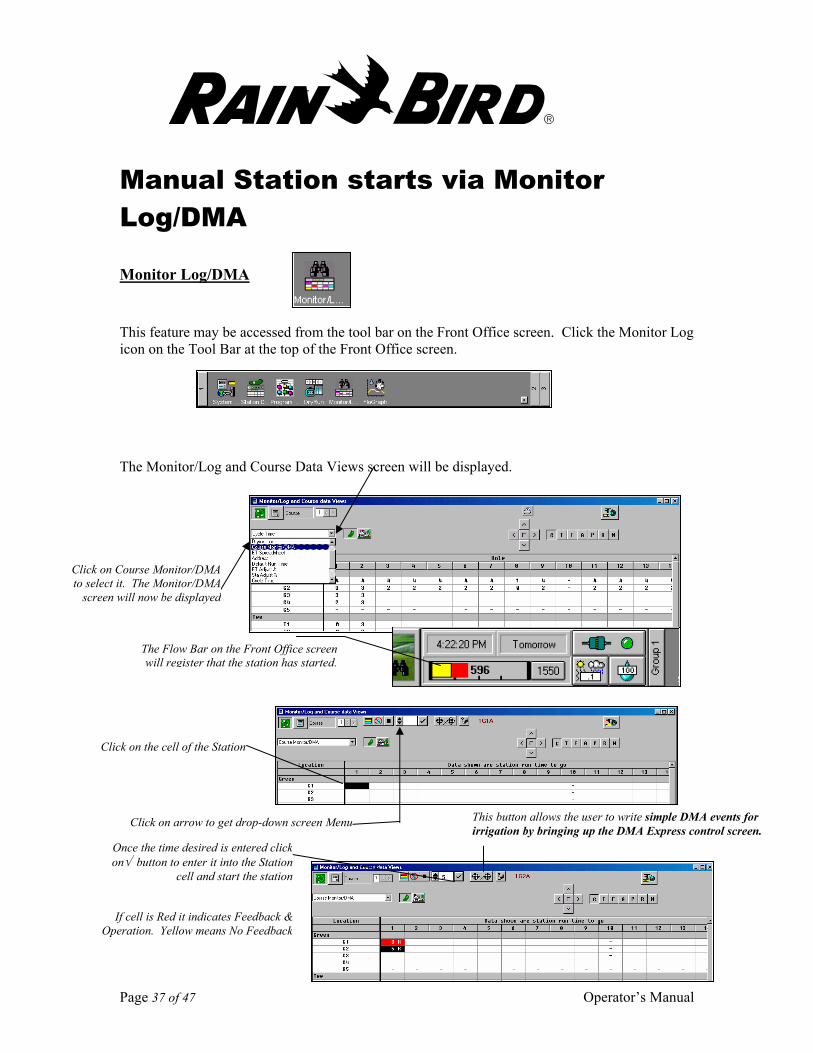
Manual Station starts via Monitor Log/DMA
Monitor Log/DMA This feature may be accessed from the tool bar on the Front Office screen. Click the Monitor Log icon on the Tool Bar at the top of the Front Office screen.
The Monitor/Log and Course Data Views screen will be displayed. If cell is Blue it indicates it is in the Soak mode.
Click on arrow to get drop-down screen Menu
Click on Course Monitor/DMA to select it. The Monitor/DMA
screen will now be displayed
Click on the cell of the Station
This button allows the user to write simple DMA events for irrigation by bringing up the DMA Express control screen.
Once the time desired is entered clickon√ button to enter it into the Station
cell and start the station
If cell is Red it indicates Feedback &Operation. Yellow means No Feedback
The Flow Bar on the Front Office screenwill register that the station has started.
Page 38 of 47 Operator’s Manual
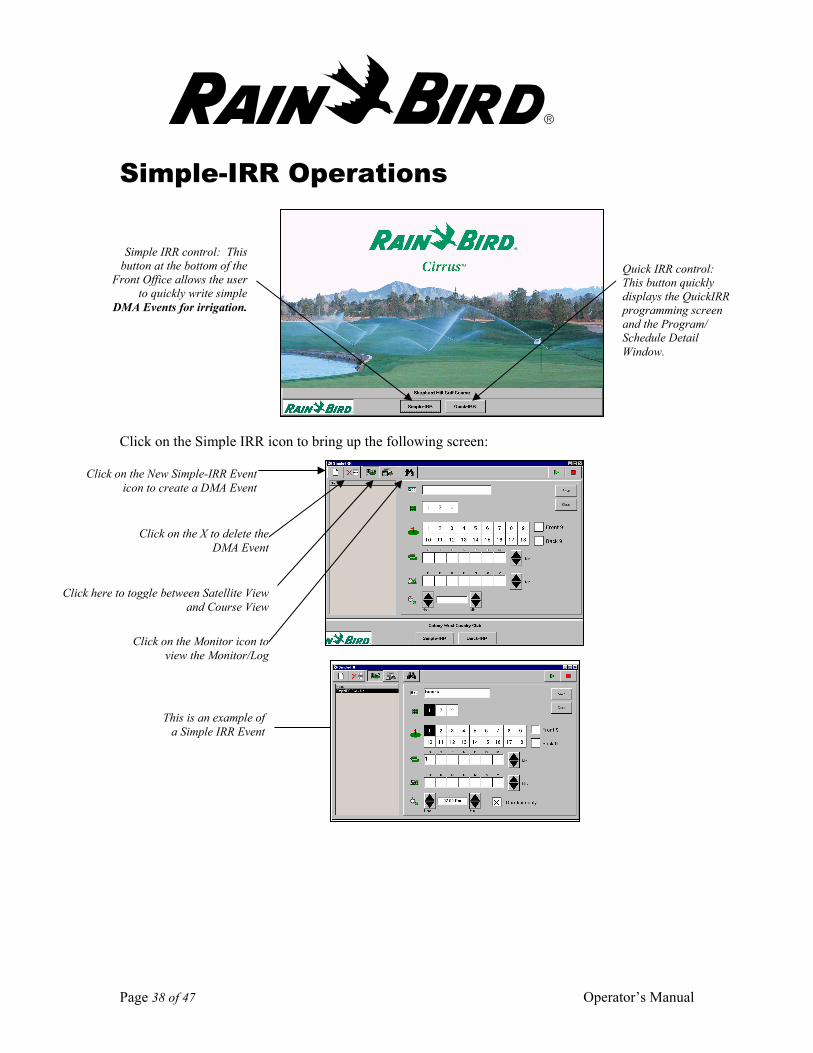
Simple-IRR Operations Click on the Simple IRR icon to bring up the following screen:
Quick IRR control: This button quickly displays the QuickIRR programming screen and the Program/ Schedule Detail Window.
Simple IRR control: This button at the bottom of the
Front Office allows the user to quickly write simple
DMA Events for irrigation.
Click on the New Simple-IRR Event icon to create a DMA Event
Click on the X to delete theDMA Event
Click here to toggle between Satellite Viewand Course View
Click on the Monitor icon toview the Monitor/Log
This is an example of a Simple IRR Event
Page 39 of 47 Operator’s Manual
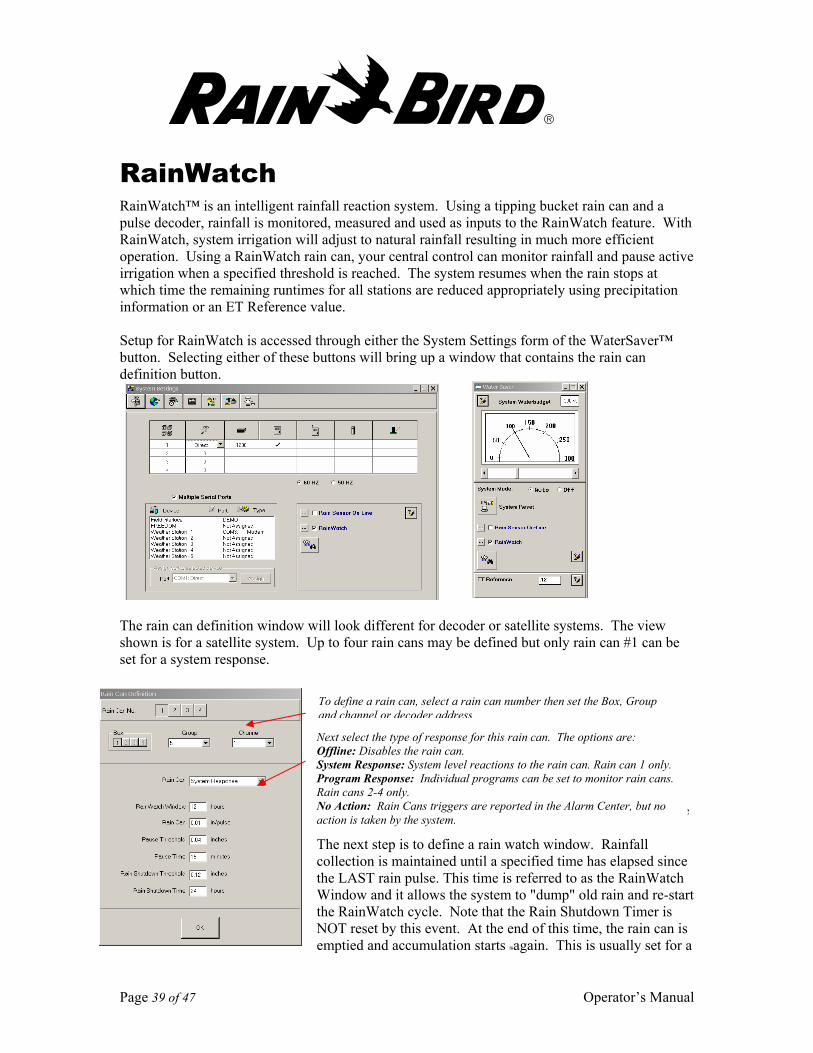
RainWatch RainWatch™ is an intelligent rainfall reaction system. Using a tipping bucket rain can and a pulse decoder, rainfall is monitored, measured and used as inputs to the RainWatch feature. With RainWatch, system irrigation will adjust to natural rainfall resulting in much more efficient operation. Using a RainWatch rain can, your central control can monitor rainfall and pause active irrigation when a specified threshold is reached. The system resumes when the rain stops at which time the remaining runtimes for all stations are reduced appropriately using precipitation information or an ET Reference value. Setup for RainWatch is accessed through either the System Settings form of the WaterSaver™ button. Selecting either of these buttons will bring up a window that contains the rain can definition button.
The rain can definition window will look different for decoder or satellite systems. The view shown is for a satellite system. Up to four rain cans may be defined but only rain can #1 can be set for a system response.
Note that RainWatch has no effect in the following situations: Programs with the System Off Override option set. Station activated annually using DMA. This includes FREEDOM and SimpleIRR as well as stations started using the DMA screen or by clicking them on the map. The next step is to define a rain watch window. Rainfall collection is maintained until a specified time has elapsed since the LAST rain pulse. This time is referred to as the RainWatch Window and it allows the system to "dump" old rain and re-start the RainWatch cycle. Note that the Rain Shutdown Timer is NOT reset by this event. At the end of this time, the rain can is emptied and accumulation starts again. This is usually set for a
To define a rain can, select a rain can number then set the Box, Group and channel or decoder address
Next select the type of response for this rain can. The options are: Offline: Disables the rain can. System Response: System level reactions to the rain can. Rain can 1 only. Program Response: Individual programs can be set to monitor rain cans. Rain cans 2-4 only. No Action: Rain Cans triggers are reported in the Alarm Center, but no action is taken by the system.
Page 40 of 47 Operator’s Manual
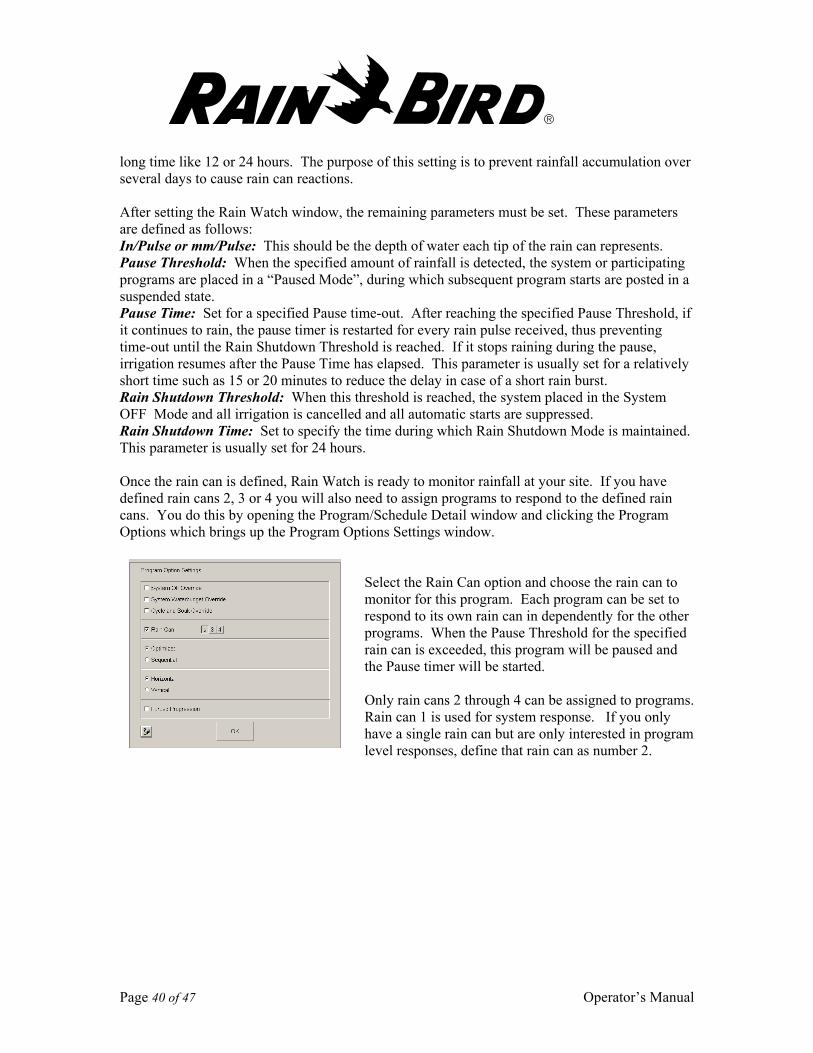
long time like 12 or 24 hours. The purpose of this setting is to prevent rainfall accumulation over several days to cause rain can reactions. After setting the Rain Watch window, the remaining parameters must be set. These parameters are defined as follows: In/Pulse or mm/Pulse: This should be the depth of water each tip of the rain can represents. Pause Threshold: When the specified amount of rainfall is detected, the system or participating programs are placed in a “Paused Mode”, during which subsequent program starts are posted in a suspended state. Pause Time: Set for a specified Pause time-out. After reaching the specified Pause Threshold, if it continues to rain, the pause timer is restarted for every rain pulse received, thus preventing time-out until the Rain Shutdown Threshold is reached. If it stops raining during the pause, irrigation resumes after the Pause Time has elapsed. This parameter is usually set for a relatively short time such as 15 or 20 minutes to reduce the delay in case of a short rain burst. Rain Shutdown Threshold: When this threshold is reached, the system placed in the System OFF Mode and all irrigation is cancelled and all automatic starts are suppressed. Rain Shutdown Time: Set to specify the time during which Rain Shutdown Mode is maintained. This parameter is usually set for 24 hours. Once the rain can is defined, Rain Watch is ready to monitor rainfall at your site. If you have defined rain cans 2, 3 or 4 you will also need to assign programs to respond to the defined rain cans. You do this by opening the Program/Schedule Detail window and clicking the Program Options which brings up the Program Options Settings window.
Select the Rain Can option and choose the rain can to monitor for this program. Each program can be set to respond to its own rain can in dependently for the other programs. When the Pause Threshold for the specified rain can is exceeded, this program will be paused and the Pause timer will be started. Only rain cans 2 through 4 can be assigned to programs. Rain can 1 is used for system response. If you only have a single rain can but are only interested in program level responses, define that rain can as number 2.
Page 41 of 47 Operator’s Manual
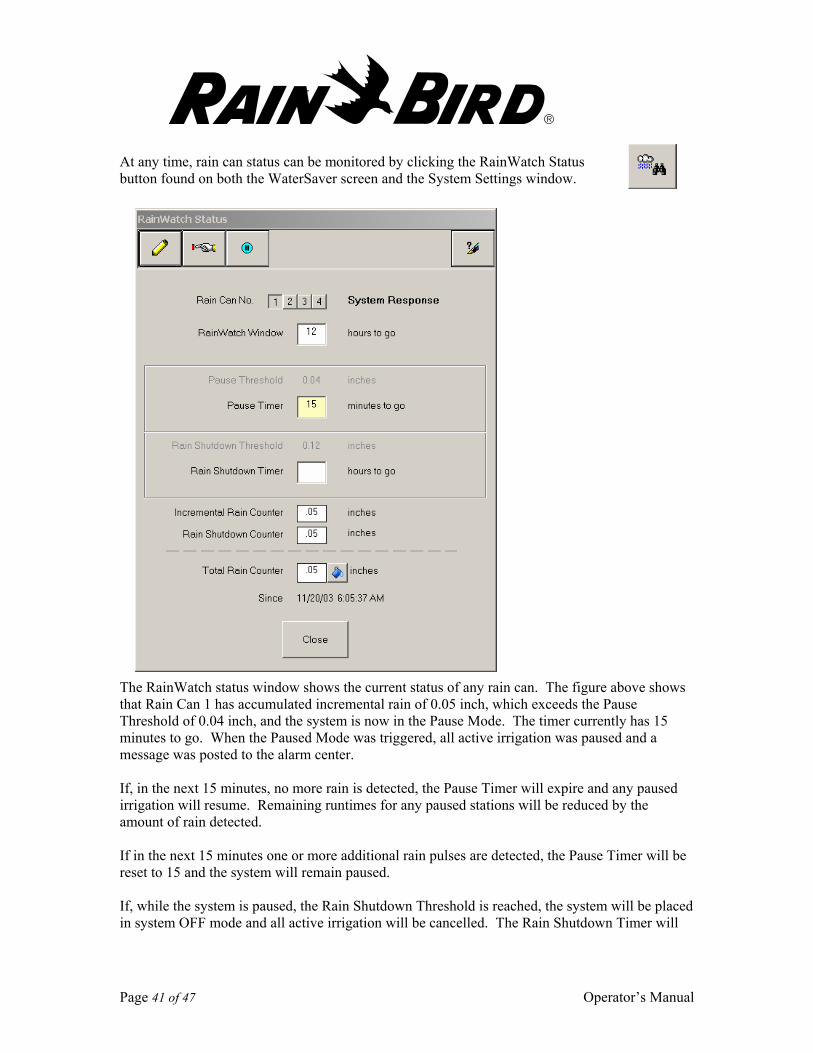
At any time, rain can status can be monitored by clicking the RainWatch Status button found on both the WaterSaver screen and the System Settings window.
The RainWatch status window shows the current status of any rain can. The figure above shows that Rain Can 1 has accumulated incremental rain of 0.05 inch, which exceeds the Pause Threshold of 0.04 inch, and the system is now in the Pause Mode. The timer currently has 15 minutes to go. When the Paused Mode was triggered, all active irrigation was paused and a message was posted to the alarm center. If, in the next 15 minutes, no more rain is detected, the Pause Timer will expire and any paused irrigation will resume. Remaining runtimes for any paused stations will be reduced by the amount of rain detected. If in the next 15 minutes one or more additional rain pulses are detected, the Pause Timer will be reset to 15 and the system will remain paused. If, while the system is paused, the Rain Shutdown Threshold is reached, the system will be placed in system OFF mode and all active irrigation will be cancelled. The Rain Shutdown Timer will

Page 42 of 47 Operator’s Manual
be set according to the parameter defined for this rain can and all subsequent automatic stats will be suppressed until the Rain Shutdown Timer expires. The Rain Shutdown Timer is cleared when System Mode is reset to Auto. The Rain counters however are preserved to prevent loss of collected rainfall. The entire RainWatch status can be cleared with the Reset button on the RainWatch Monitor screen or the "System Reset" button on the WaterSaver screen. The Incremental Rain Counter and Rain Shutdown Counter keep track of incremental rainfall for interaction with the Pause and Rain Shutdown thresholds. The total rain counter tracks total rainfall since the last time the rain bucket was manually reset or emptied. To ensure proper operation of the RainWatch feature, regular maintenance of the rain can is necessary. There should be no debris inside the rain can and nothing should block the funnel of the rain can.
Page 43 of 47 Operator’s Manual
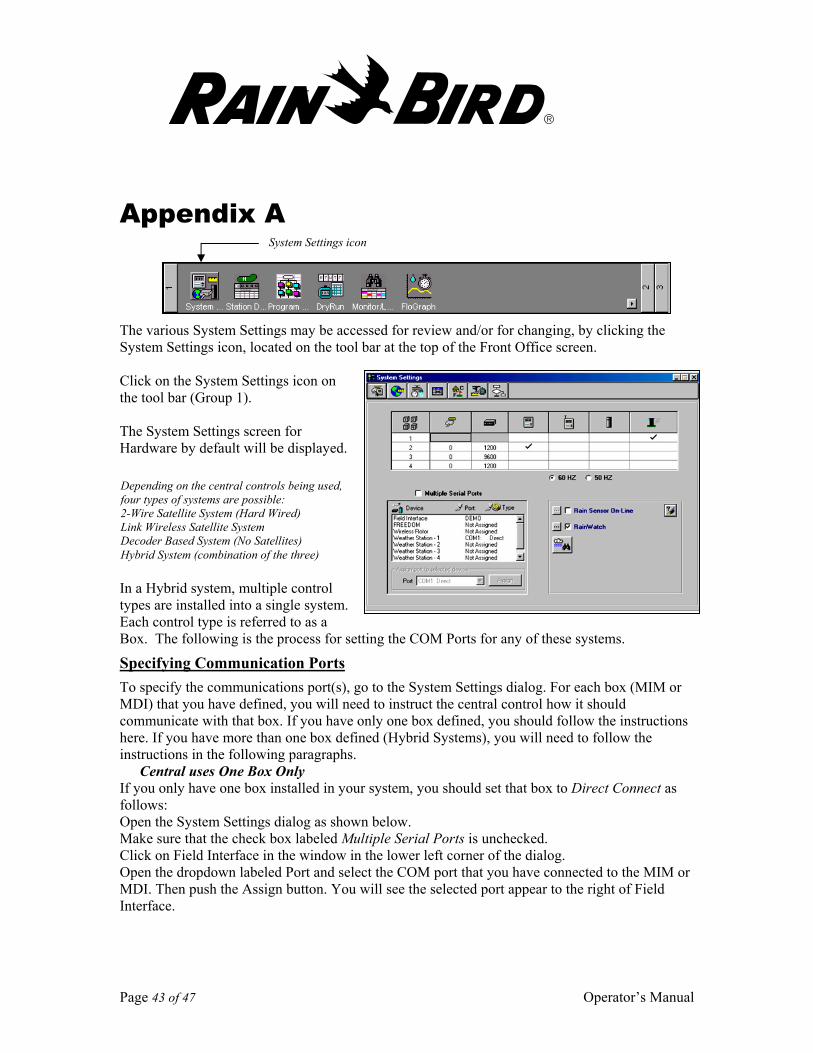
Appendix A The various System Settings may be accessed for review and/or for changing, by clicking the System Settings icon, located on the tool bar at the top of the Front Office screen. Click on the System Settings icon on the tool bar (Group 1). The System Settings screen for Hardware by default will be displayed.
In a Hybrid system, multiple control types are installed into a single system. Each control type is referred to as a Box. The following is the process for setting the COM Ports for any of these systems.
Specifying Communication Ports To specify the communications port(s), go to the System Settings dialog. For each box (MIM or MDI) that you have defined, you will need to instruct the central control how it should communicate with that box. If you have only one box defined, you should follow the instructions here. If you have more than one box defined (Hybrid Systems), you will need to follow the instructions in the following paragraphs.
Central uses One Box Only If you only have one box installed in your system, you should set that box to Direct Connect as follows: Open the System Settings dialog as shown below. Make sure that the check box labeled Multiple Serial Ports is unchecked. Click on Field Interface in the window in the lower left corner of the dialog. Open the dropdown labeled Port and select the COM port that you have connected to the MIM or MDI. Then push the Assign button. You will see the selected port appear to the right of Field Interface.
System Settings icon
Depending on the central controls being used, four types of systems are possible: 2-Wire Satellite System (Hard Wired) Link Wireless Satellite System Decoder Based System (No Satellites) Hybrid System (combination of the three)
Page 44 of 47 Operator’s Manual
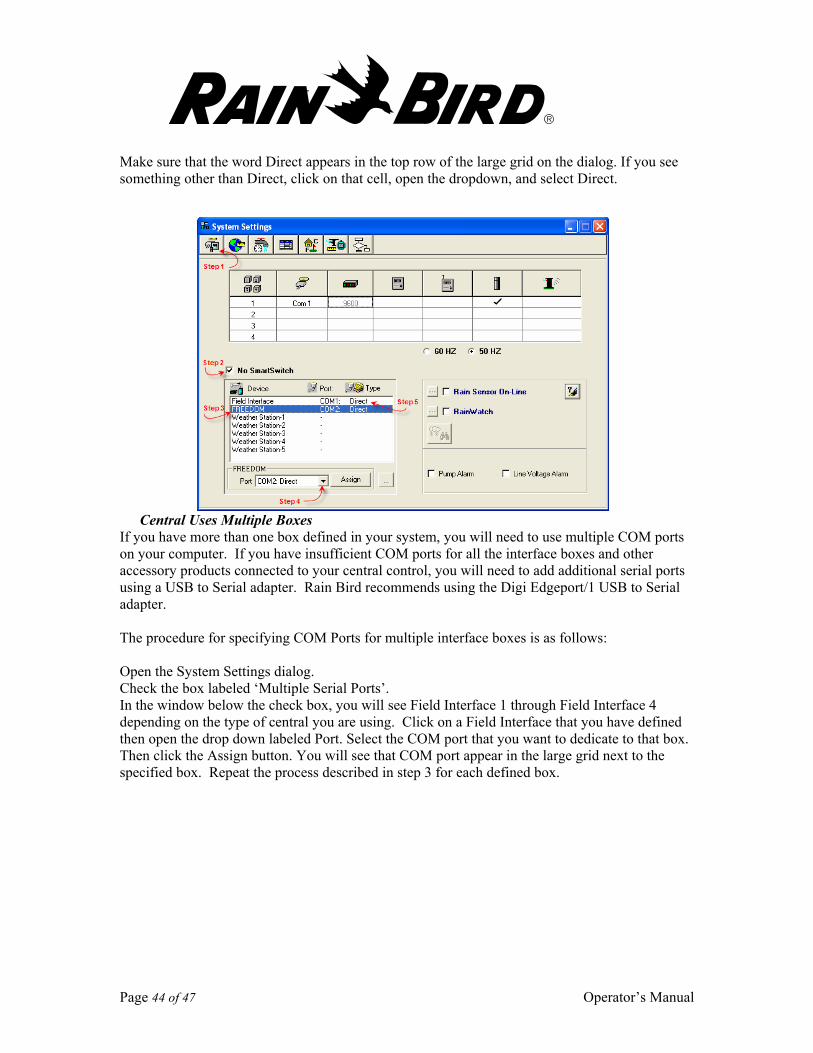
Make sure that the word Direct appears in the top row of the large grid on the dialog. If you see something other than Direct, click on that cell, open the dropdown, and select Direct.
Central Uses Multiple Boxes If you have more than one box defined in your system, you will need to use multiple COM ports on your computer. If you have insufficient COM ports for all the interface boxes and other accessory products connected to your central control, you will need to add additional serial ports using a USB to Serial adapter. Rain Bird recommends using the Digi Edgeport/1 USB to Serial adapter. The procedure for specifying COM Ports for multiple interface boxes is as follows: Open the System Settings dialog. Check the box labeled ‘Multiple Serial Ports’. In the window below the check box, you will see Field Interface 1 through Field Interface 4 depending on the type of central you are using. Click on a Field Interface that you have defined then open the drop down labeled Port. Select the COM port that you want to dedicate to that box. Then click the Assign button. You will see that COM port appear in the large grid next to the specified box. Repeat the process described in step 3 for each defined box.
Page 45 of 47 Operator’s Manual
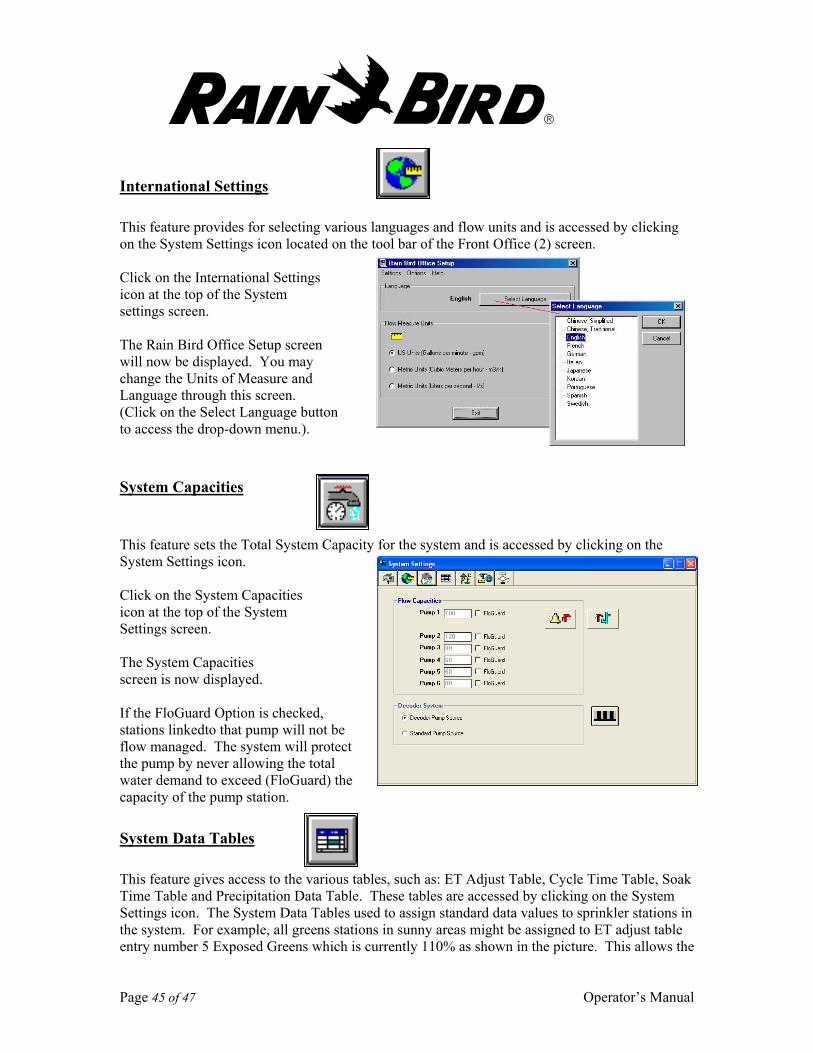
International Settings This feature provides for selecting various languages and flow units and is accessed by clicking on the System Settings icon located on the tool bar of the Front Office (2) screen. Click on the International Settings icon at the top of the System settings screen. The Rain Bird Office Setup screen will now be displayed. You may change the Units of Measure and Language through this screen. (Click on the Select Language button to access the drop-down menu.).
System Capacities This feature sets the Total System Capacity for the system and is accessed by clicking on the System Settings icon. Click on the System Capacities icon at the top of the System Settings screen. The System Capacities screen is now displayed. If the FloGuard Option is checked, stations linkedto that pump will not be flow managed. The system will protect the pump by never allowing the total water demand to exceed (FloGuard) the capacity of the pump station.
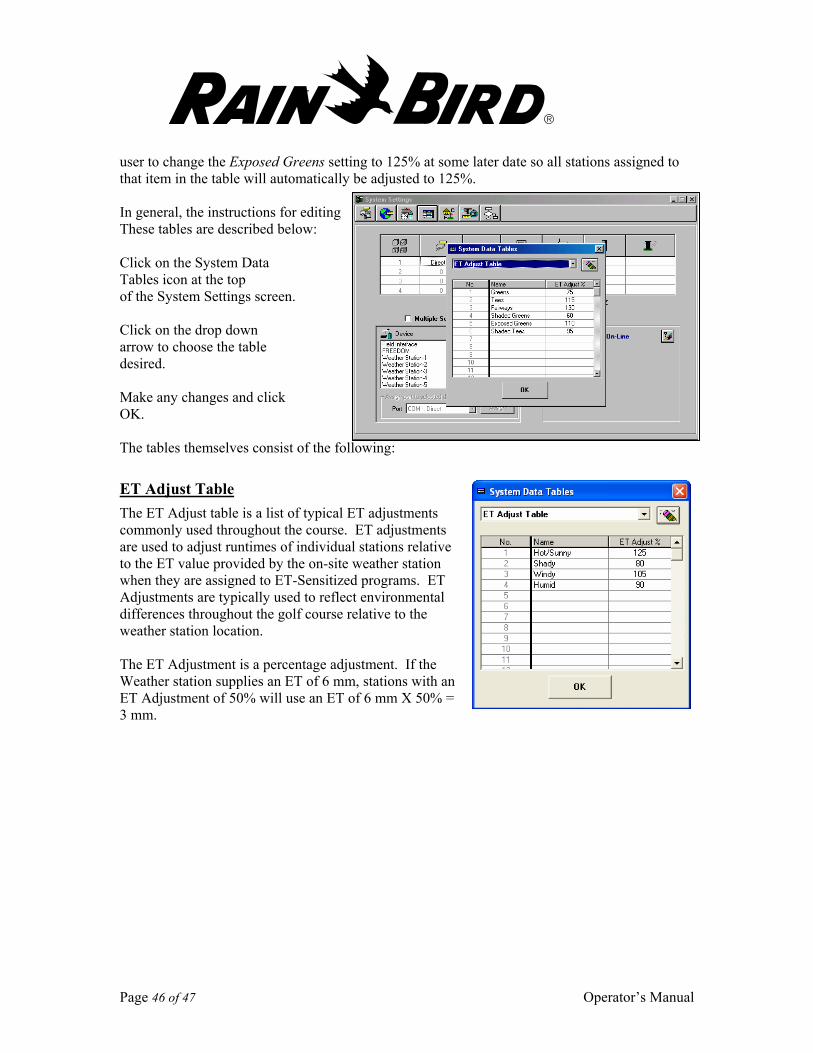
System Data Tables This feature gives access to the various tables, such as: ET Adjust Table, Cycle Time Table, Soak Time Table and Precipitation Data Table. These tables are accessed by clicking on the System Settings icon. The System Data Tables used to assign standard data values to sprinkler stations in the system. For example, all greens stations in sunny areas might be assigned to ET adjust table entry number 5 Exposed Greens which is currently 110% as shown in the picture. This allows the
Page 46 of 47 Operator’s Manual
user to change the Exposed Greens setting to 125% at some later date so all stations assigned to that item in the table will automatically be adjusted to 125%. In general, the instructions for editing These tables are described below: Click on the System Data Tables icon at the top of the System Settings screen. Click on the drop down arrow to choose the table desired. Make any changes and click OK. The tables themselves consist of the following:
ET Adjust Table The ET Adjust table is a list of typical ET adjustments commonly used throughout the course. ET adjustments are used to adjust runtimes of individual stations relative to the ET value provided by the on-site weather station when they are assigned to ET-Sensitized programs. ET Adjustments are typically used to reflect environmental differences throughout the golf course relative to the weather station location. The ET Adjustment is a percentage adjustment. If the Weather station supplies an ET of 6 mm, stations with an ET Adjustment of 50% will use an ET of 6 mm X 50% = 3 mm.
Page 47 of 47 Operator’s Manual
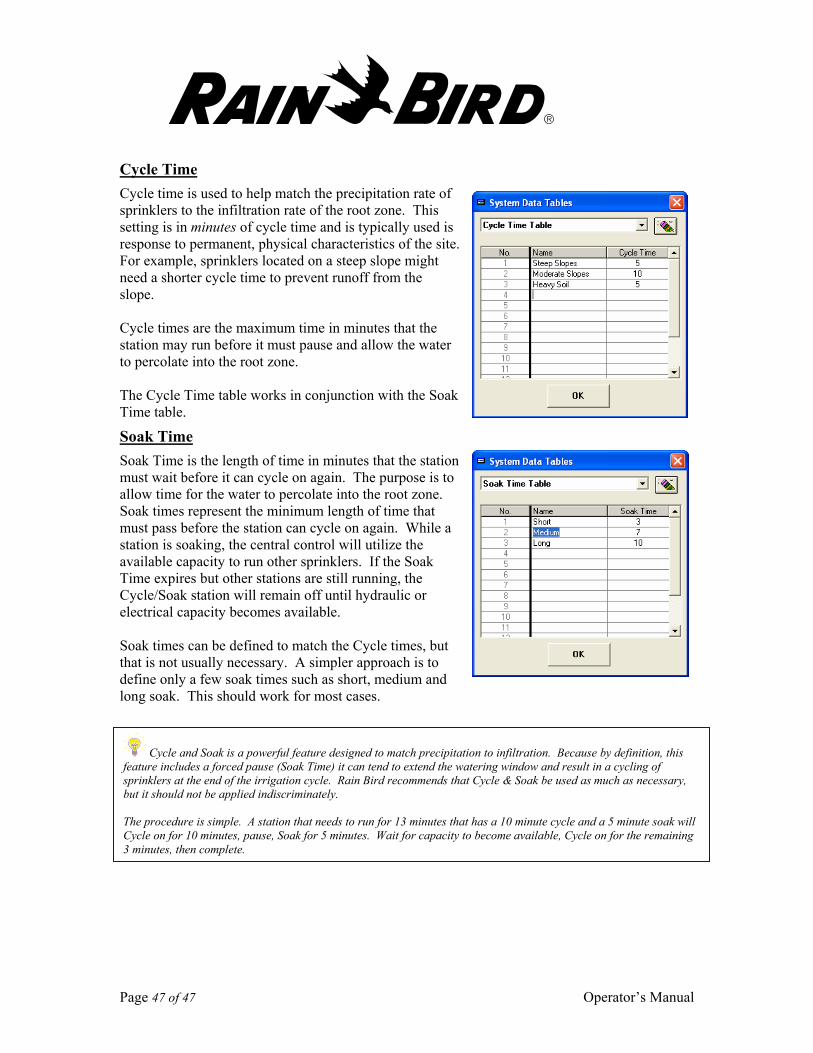
Cycle Time Cycle time is used to help match the precipitation rate of sprinklers to the infiltration rate of the root zone. This setting is in minutes of cycle time and is typically used is response to permanent, physical characteristics of the site. For example, sprinklers located on a steep slope might need a shorter cycle time to prevent runoff from the slope. Cycle times are the maximum time in minutes that the station may run before it must pause and allow the water to percolate into the root zone. The Cycle Time table works in conjunction with the Soak Time table.
Soak Time Soak Time is the length of time in minutes that the station must wait before it can cycle on again. The purpose is to allow time for the water to percolate into the root zone. Soak times represent the minimum length of time that must pass before the station can cycle on again. While a station is soaking, the central control will utilize the available capacity to run other sprinklers. If the Soak Time expires but other stations are still running, the Cycle/Soak station will remain off until hydraulic or electrical capacity becomes available. Soak times can be defined to match the Cycle times, but that is not usually necessary. A simpler approach is to define only a few soak times such as short, medium and long soak. This should work for most cases.
Cycle and Soak is a powerful feature designed to match precipitation to infiltration. Because by definition, this feature includes a forced pause (Soak Time) it can tend to extend the watering window and result in a cycling of sprinklers at the end of the irrigation cycle. Rain Bird recommends that Cycle & Soak be used as much as necessary, but it should not be applied indiscriminately. The procedure is simple. A station that needs to run for 13 minutes that has a 10 minute cycle and a 5 minute soak will Cycle on for 10 minutes, pause, Soak for 5 minutes. Wait for capacity to become available, Cycle on for the remaining 3 minutes, then complete.

Rain Bird Corporation, Golf Division 6991 East Southpoint Tucson, Arizona 85706, USA Phone: (800) 984-2255 Fax: (520) 741-6522 Rain Bird International Inc. 6640 South Bonney Tucson, AZ 85706, USA Phone: +(520) 878-2400 ®Registered Trademark of Rain Bird Sprinkler Mfg. Corp. Fax: +(520) 878-2445