Embed Size (px)
Citation preview
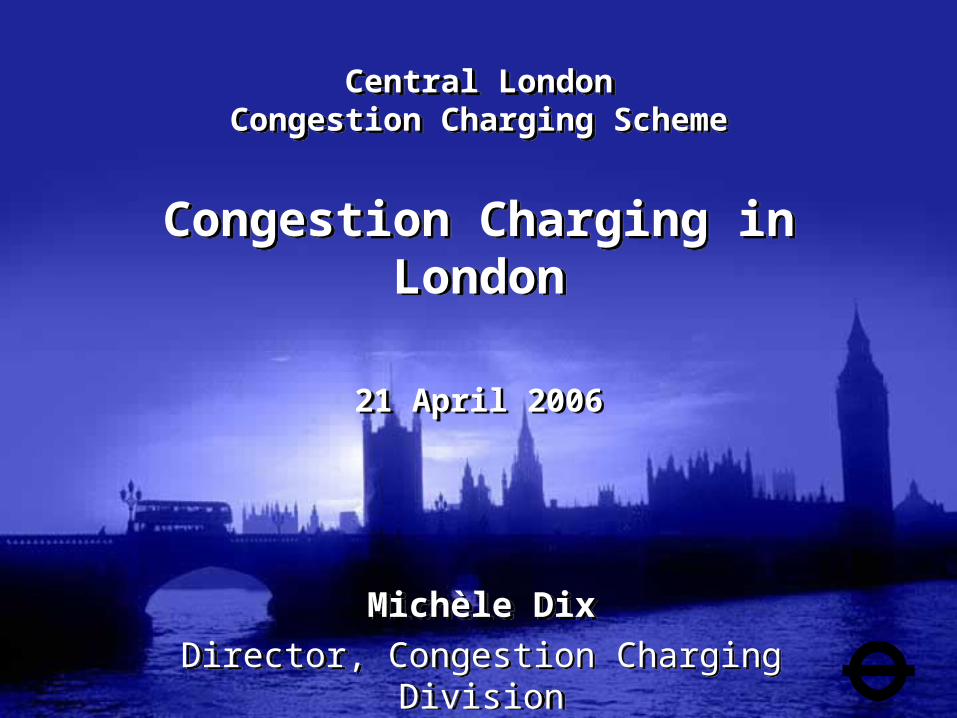
Central LondonCongestion Charging Scheme
Congestion Charging in London
21 April 2006
Central LondonCongestion Charging Scheme
Congestion Charging in London
21 April 2006
Michèle Dix
Director, Congestion Charging Division
Michèle Dix
Director, Congestion Charging Division
Contents
1. The Central London Scheme
2. Its impacts
3. Would it be suitable elsewhere?
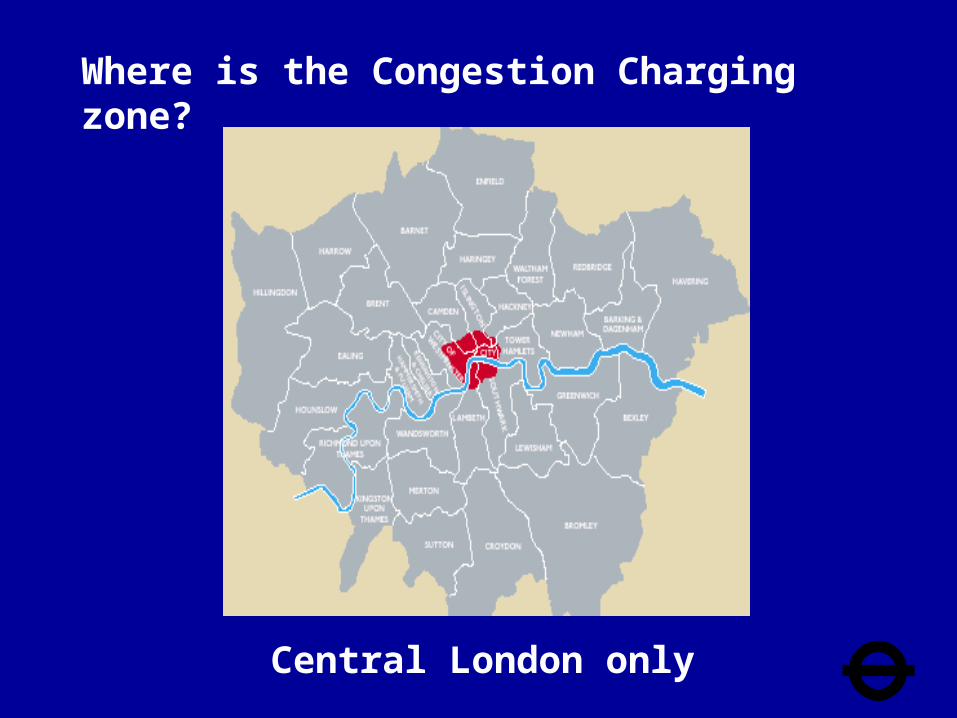
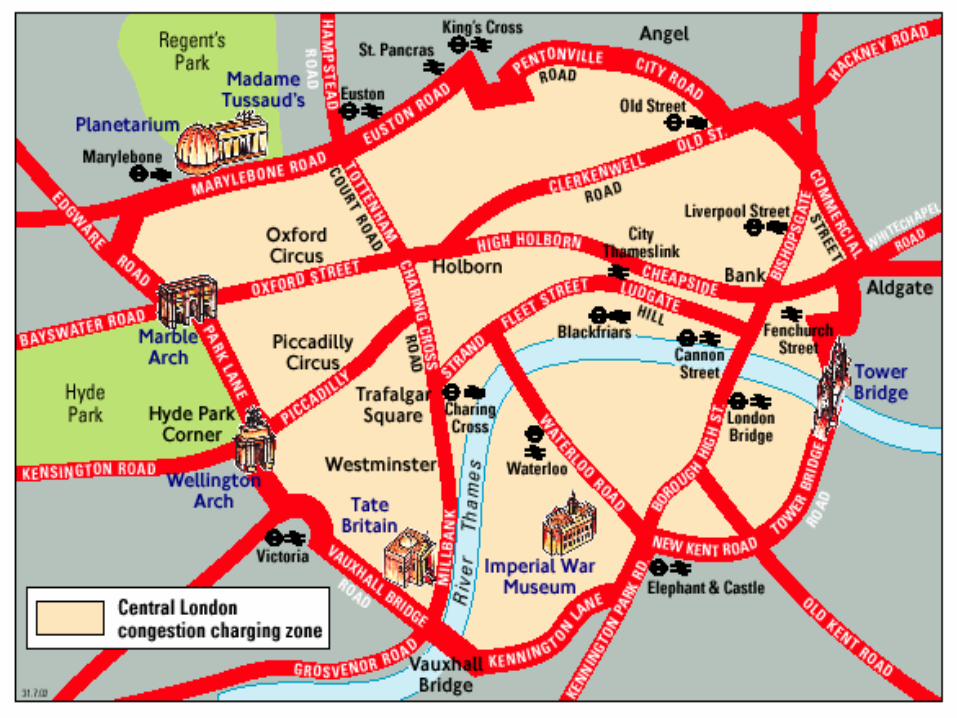
Where is the Congestion Charging zone?
Central London only
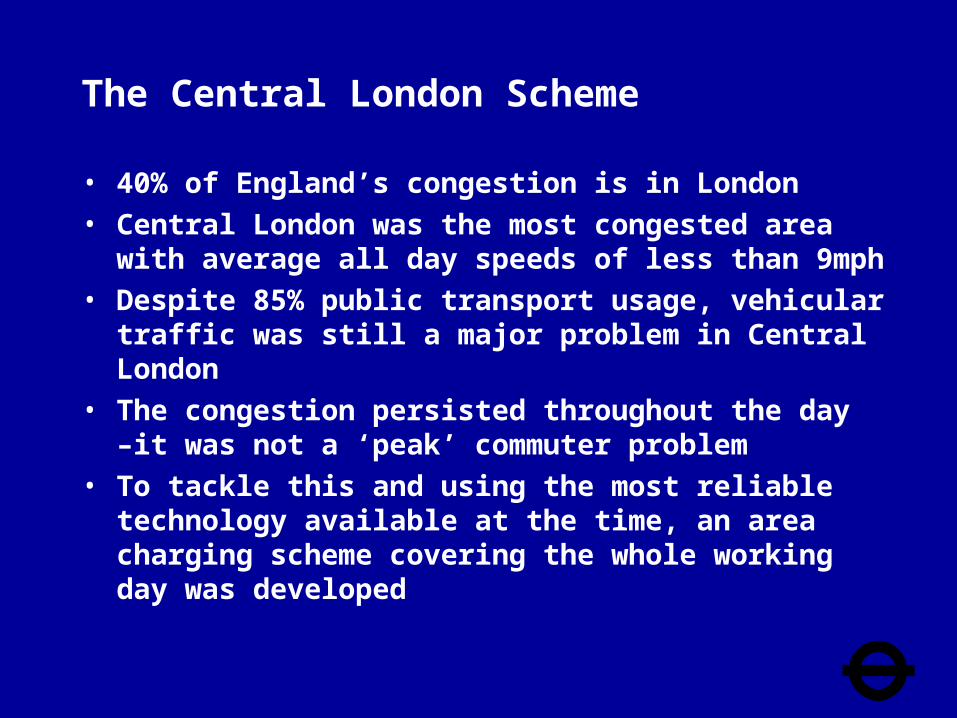
The Central London Scheme
• 40% of England’s congestion is in London
• Central London was the most congested area with average all day speeds of less than 9mph
• Despite 85% public transport usage, vehicular traffic was still a major problem in Central London
• The congestion persisted throughout the day –it was not a ‘peak’ commuter problem
• To tackle this and using the most reliable technology available at the time, an area charging scheme covering the whole working day was developed
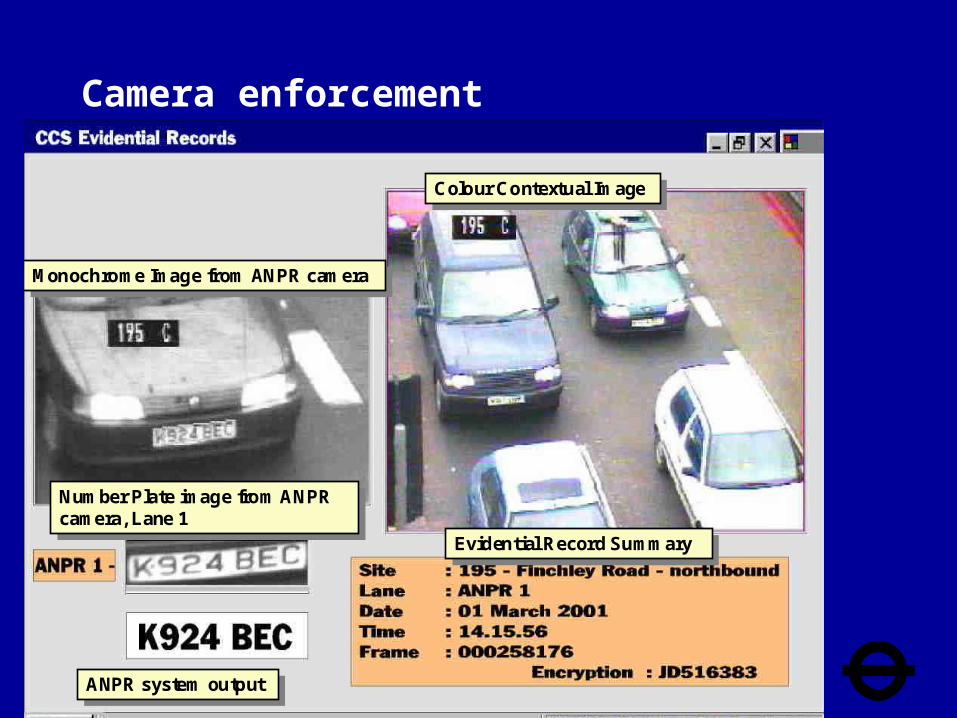
Colour Contextual ImageColour Contextual Image
Monochrome Image from ANPR cameraMonochrome Image from ANPR camera
ANPR system outputANPR system output
Evidential Record SummaryEvidential Record Summary
Number Plate image from ANPRcamera, Lane 1
Number Plate image from ANPRcamera, Lane 1
Camera enforcement
T 123 ABC
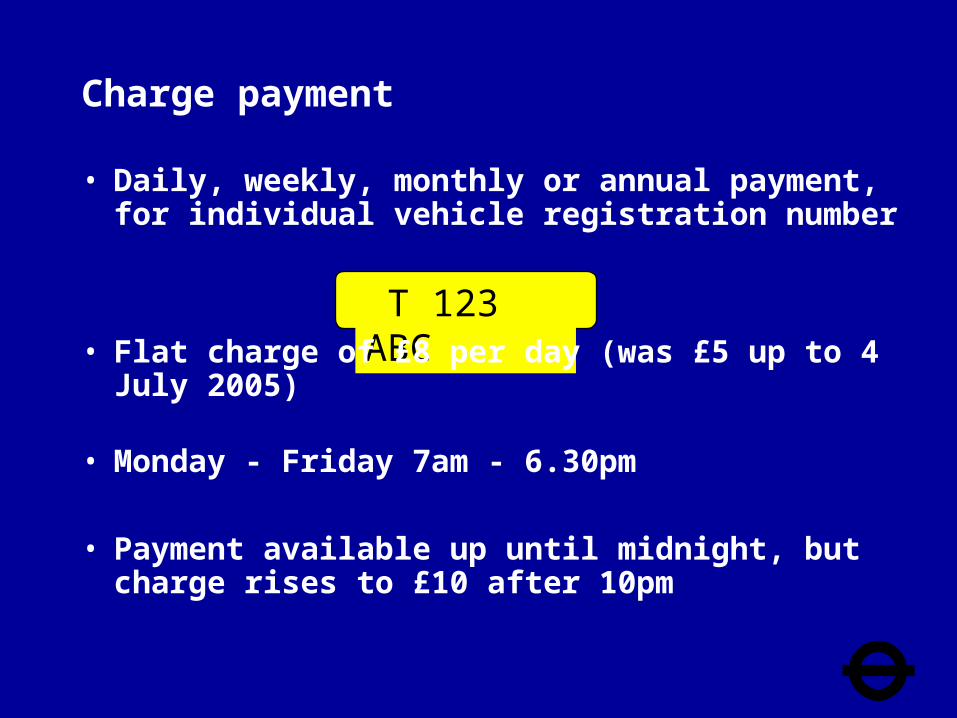
Charge payment
• Daily, weekly, monthly or annual payment,for individual vehicle registration number
• Flat charge of £8 per day (was £5 up to 4 July 2005)
• Monday - Friday 7am - 6.30pm
• Payment available up until midnight, but charge rises to £10 after 10pm
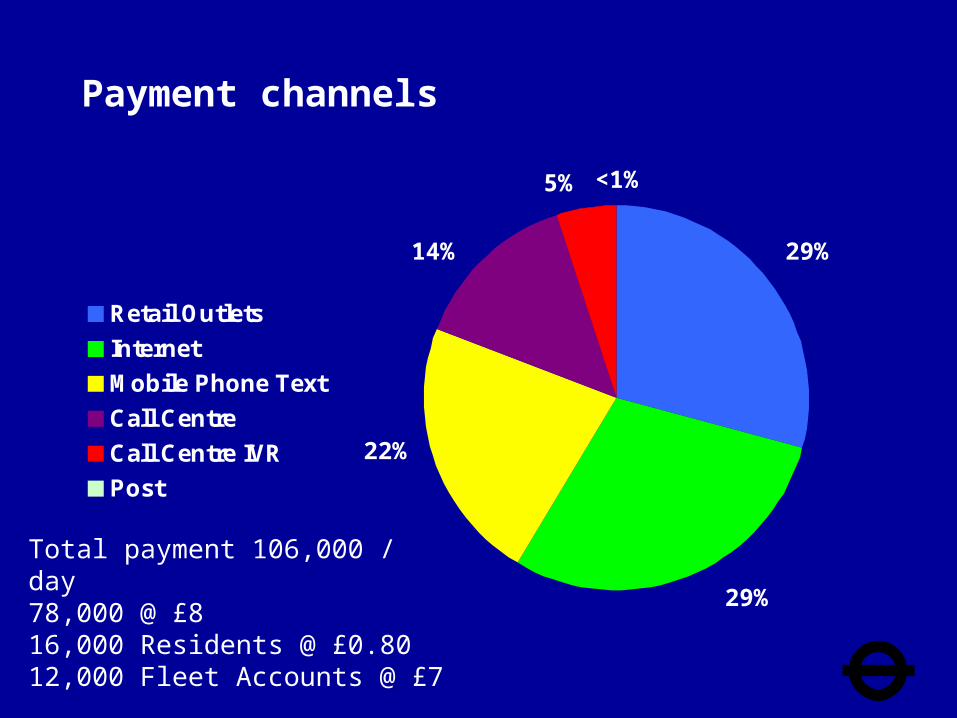
29%
29%
22%
14%
5% <1%
Total payment 106,000 / day78,000 @ £816,000 Residents @ £0.8012,000 Fleet Accounts @ £7
Payment channels
Retail Outlets
Internet
Mobile Phone Text
Call Centre
Call Centre IVR
Post

Impacts of the Scheme
• Results are all for the £5 Charge
• The impacts of the £8 charge (which started on July 4th 2005) are being monitored
• Initial findings are that traffic levels & charges/payments are in line with our forecasts – early monitoring was affected by the London bombings
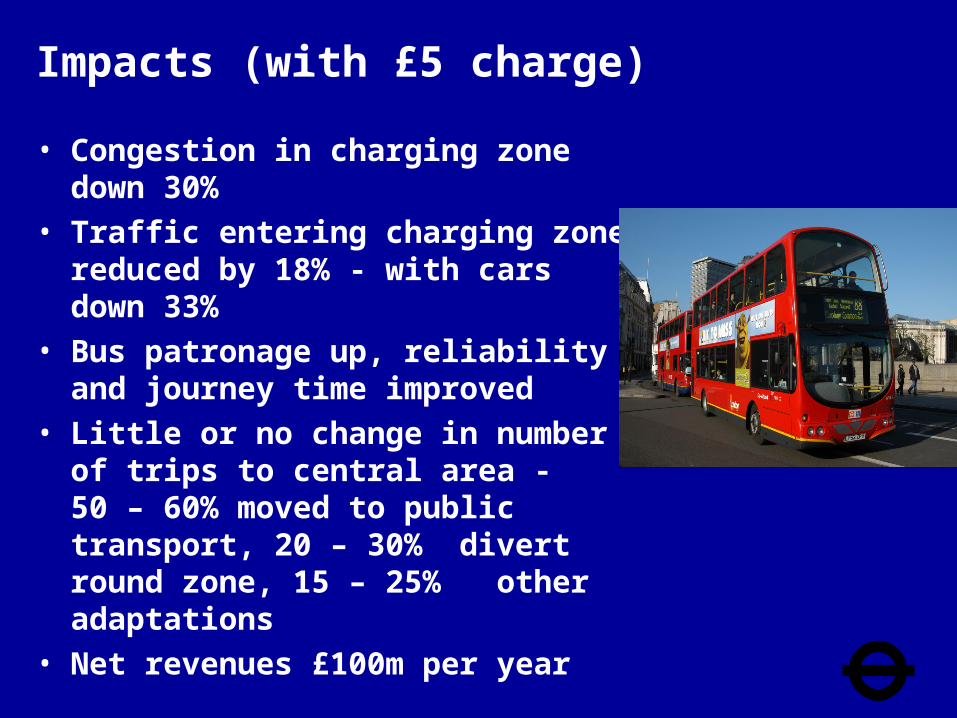
Impacts (with £5 charge)
• Congestion in charging zone down 30%
• Traffic entering charging zone reduced by 18% - with cars down 33%
• Bus patronage up, reliability and journey time improved
• Little or no change in number of trips to central area - 50 – 60% moved to public transport, 20 – 30% divert round zone, 15 – 25% other adaptations
• Net revenues £100m per year
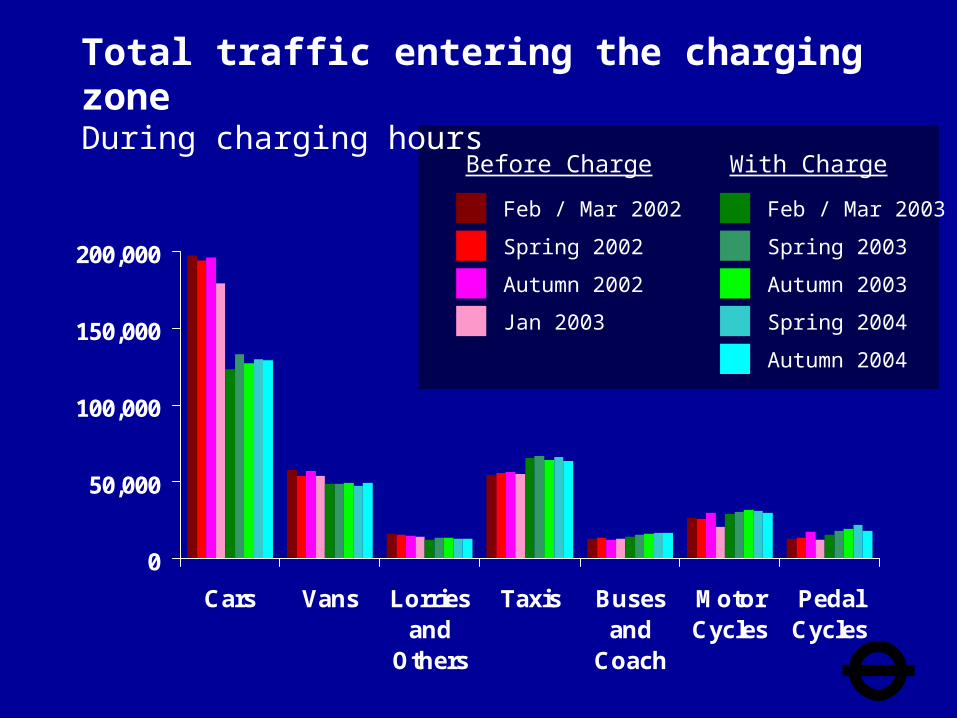
Total traffic entering the charging zoneDuring charging hours
0
50,000
100,000
150,000
200,000
Cars Vans Lorriesand
Others
Taxis Busesand
Coach
MotorCycles
PedalCycles
Feb / Mar 2002
Spring 2002
Autumn 2002
Jan 2003
Feb / Mar 2003
Spring 2003
Autumn 2003
Spring 2004
Autumn 2004
Before Charge With Charge
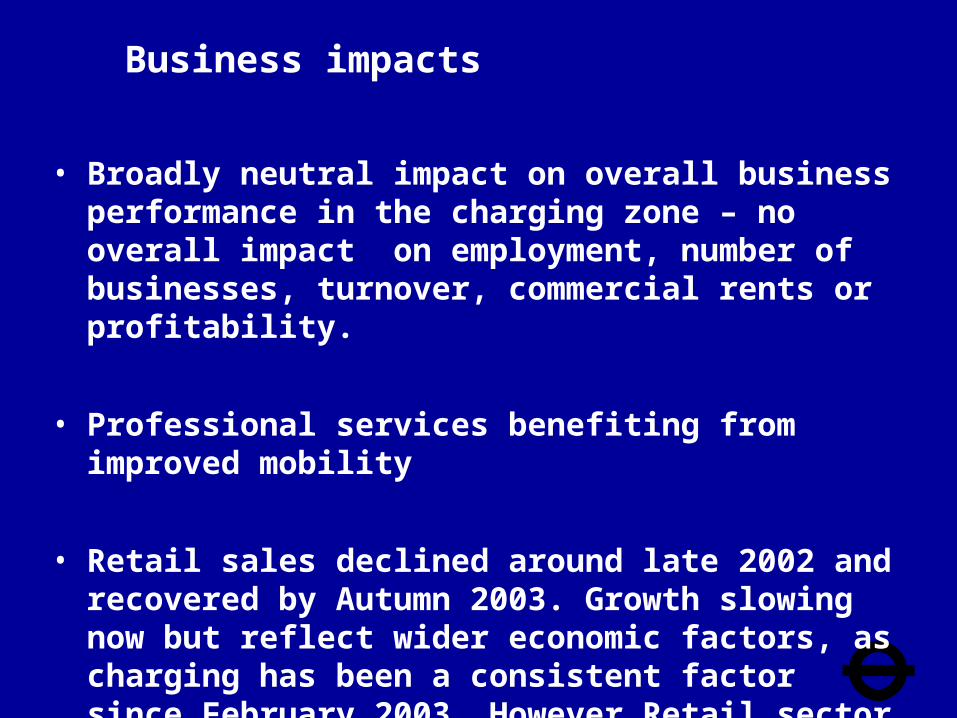
Business impacts
• Broadly neutral impact on overall business performance in the charging zone – no overall impact on employment, number of businesses, turnover, commercial rents or profitability.
• Professional services benefiting from improved mobility
• Retail sales declined around late 2002 and recovered by Autumn 2003. Growth slowing now but reflect wider economic factors, as charging has been a consistent factor since February 2003. However Retail sector remains concerned
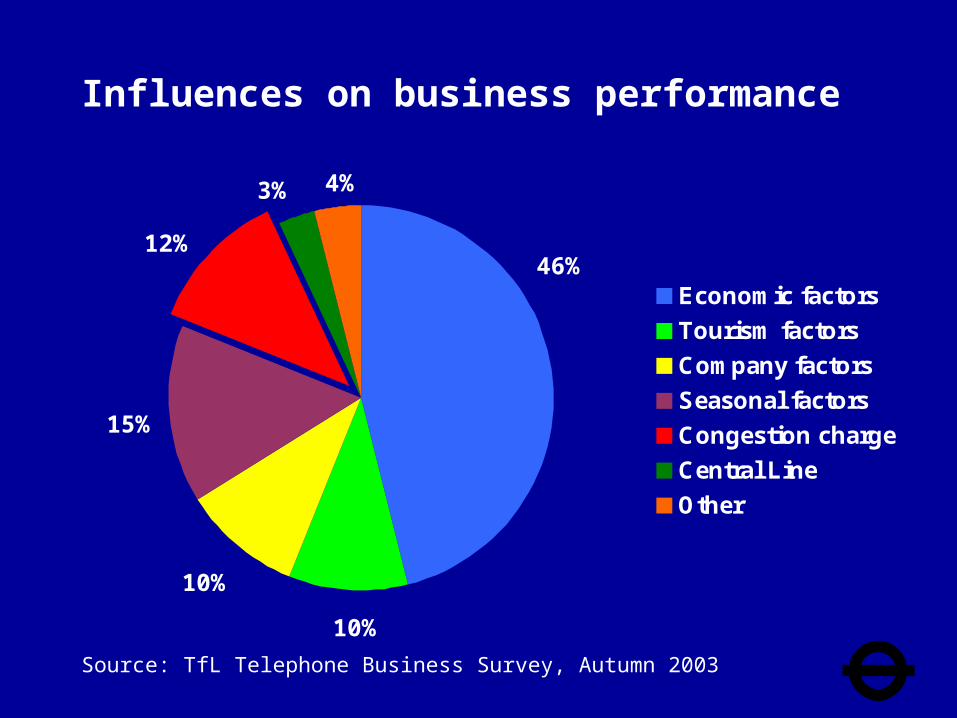
46%
10%
10%
15%
12%
3% 4%
Influences on business performance
Economic factors
Tourism factors
Company factors
Seasonal factors
Congestion charge
Central Line
Other
Source: TfL Telephone Business Survey, Autumn 2003
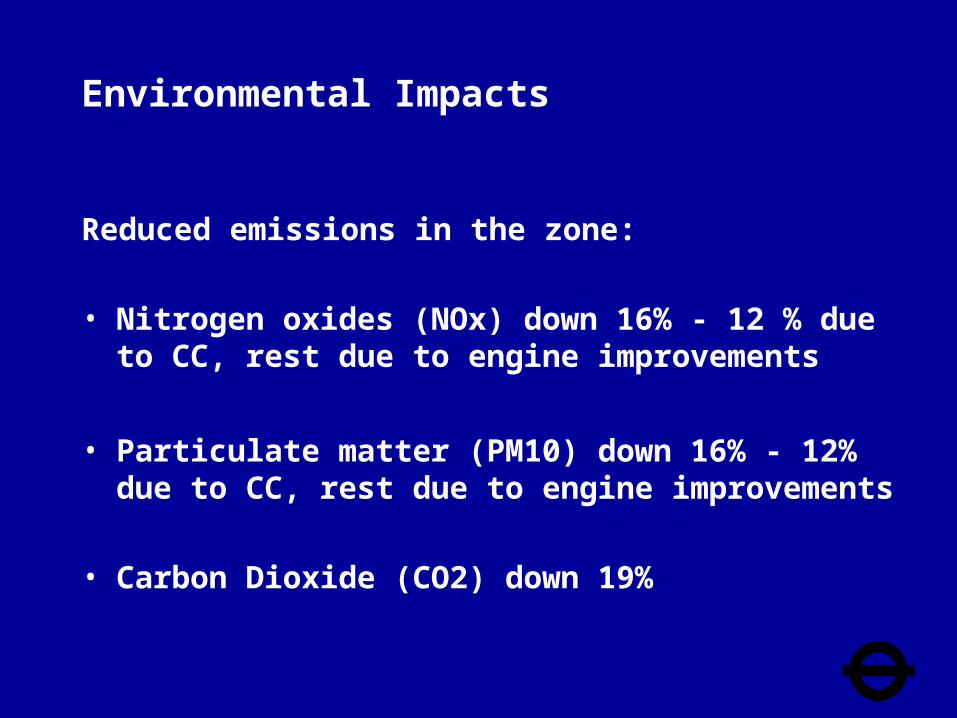
Environmental Impacts
Reduced emissions in the zone:
• Nitrogen oxides (NOx) down 16% - 12 % due to CC, rest due to engine improvements
• Particulate matter (PM10) down 16% - 12% due to CC, rest due to engine improvements
• Carbon Dioxide (CO2) down 19%
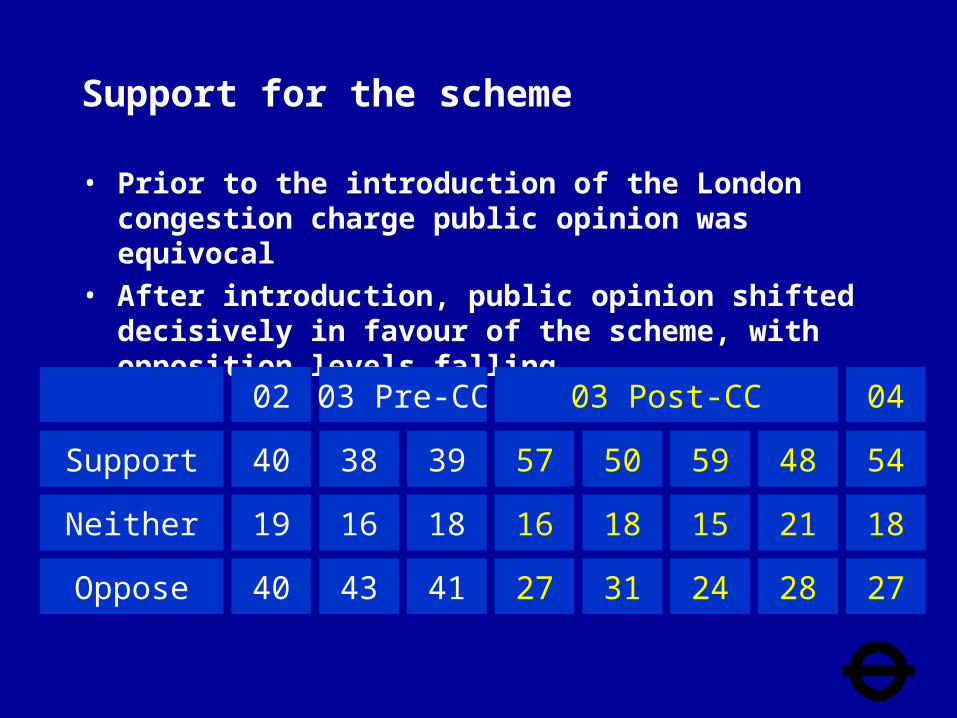
Support for the scheme
• Prior to the introduction of the London congestion charge public opinion was equivocal
• After introduction, public opinion shifted decisively in favour of the scheme, with opposition levels falling
Support
Neither
Oppose
02
40
19
40
03 Pre-CC
38
16
43
39
18
41
03 Post-CC
57
16
27
50
18
31
59
15
24
48
21
28
04
54
18
27
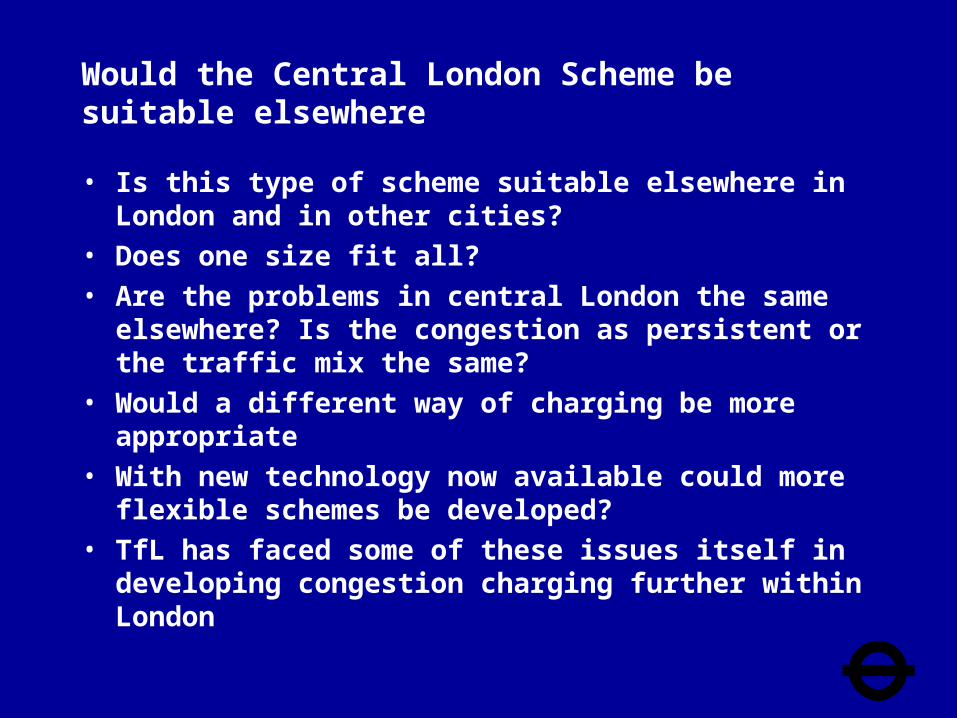
Would the Central London Scheme be suitable elsewhere
• Is this type of scheme suitable elsewhere in London and in other cities?
• Does one size fit all?
• Are the problems in central London the same elsewhere? Is the congestion as persistent or the traffic mix the same?
• Would a different way of charging be more appropriate
• With new technology now available could more flexible schemes be developed?
• TfL has faced some of these issues itself in developing congestion charging further within London
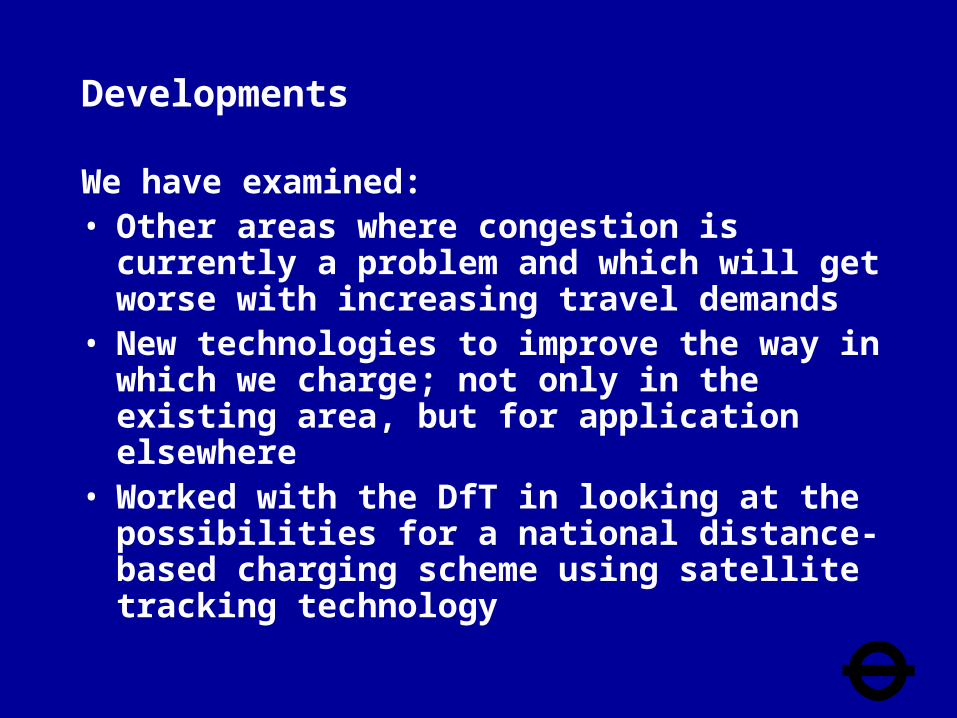
Developments
We have examined:• Other areas where congestion is currently a
problem and which will get worse with increasing travel demands
• New technologies to improve the way in which we charge; not only in the existing area, but for application elsewhere
• Worked with the DfT in looking at the possibilities for a national distance-based charging scheme using satellite tracking technology
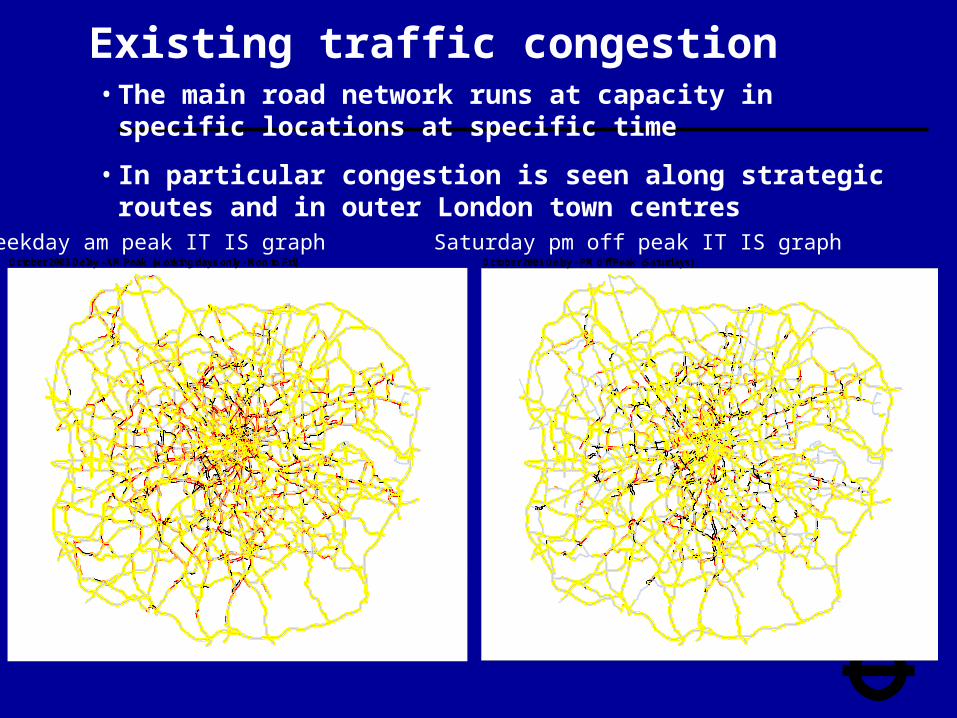
Existing traffic congestion• The main road network runs at capacity in specific locations
at specific time
• In particular congestion is seen along strategic routes and in outer London town centres
Saturday pm off peak IT IS graphWeekday am peak IT IS graphOctober 2003 Delay - AM Peak (Working days only - Mon to Fri)
Road Network Performance and Research
Information derived from data provided by ITIS Holdingsobtained from vehicles fittedwith GPS devices
Note: - Network shown is ITISlinks on Network of Interest.- AM Peak is 7am to 10am.- Delay measurement is peakspeed compared to night speed (10pm to 6am - free flow) in mins/km- Links with 2 or more observations are shown- Both directions are shown
October 2003 Delay - PM Off Peak (Saturdays)
Road Network Performance and Research
Information derived from data provided by ITIS Holdingsobtained from vehicles fittedwith GPS devices
Note: - Network shown is ITISlinks on Network of Interest.- PM Off Peak is 2pm to 4pm.- Delay measurement is peakspeed compared to night speed (10pm to 6am - free flow) in mins/km- All links with one or more observations are included- Both directions are shown
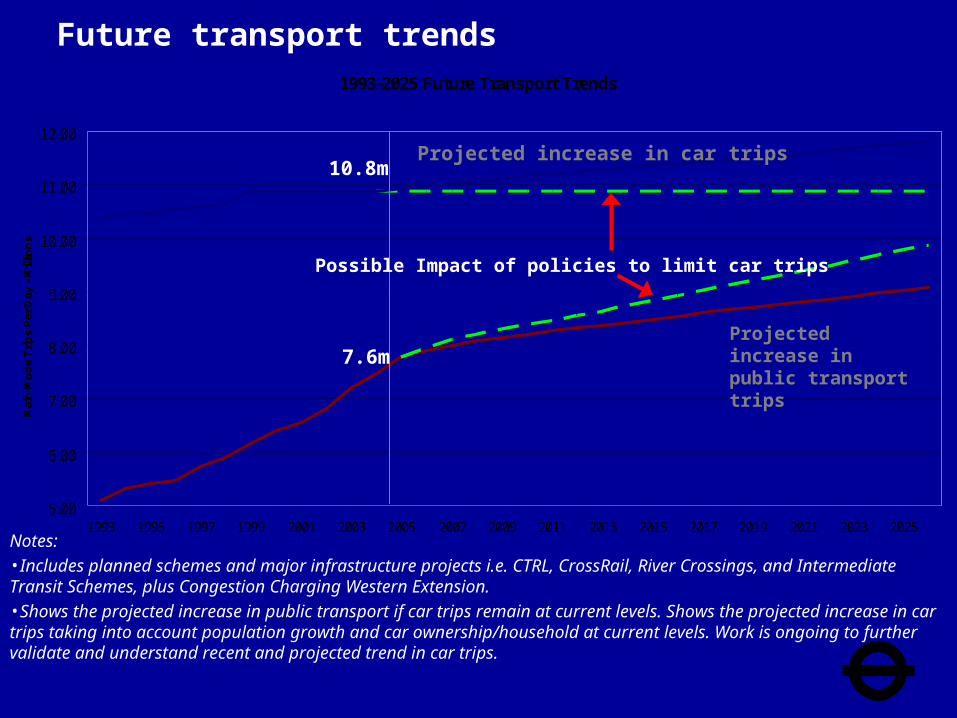
Future transport trends1993-2025 Future Transport Trends
5.00
6.00
7.00
8.00
9.00
10.00
11.00
12.00
1993 1995 1997 1999 2001 2003 2005 2007 2009 2011 2013 2015 2017 2019 2021 2023 2025
Mai
n M
od
e T
rip
s P
er D
ay -
Mill
ion
s
Notes: •Includes planned schemes and major infrastructure projects i.e. CTRL, CrossRail, River Crossings, and Intermediate Transit Schemes, plus Congestion Charging Western Extension.•Shows the projected increase in public transport if car trips remain at current levels. Shows the projected increase in car trips taking into account population growth and car ownership/household at current levels. Work is ongoing to further validate and understand recent and projected trend in car trips.
Possible Impact of policies to limit car trips
Projected increase in public transport trips
10.8m
7.6m
Projected increase in car trips
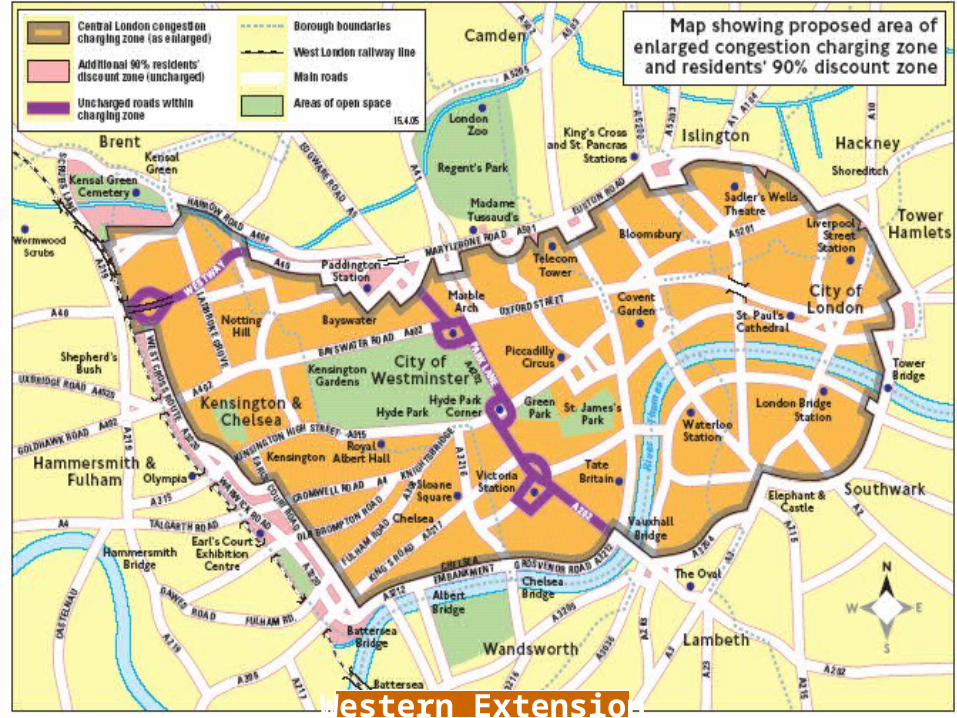
Western Extension
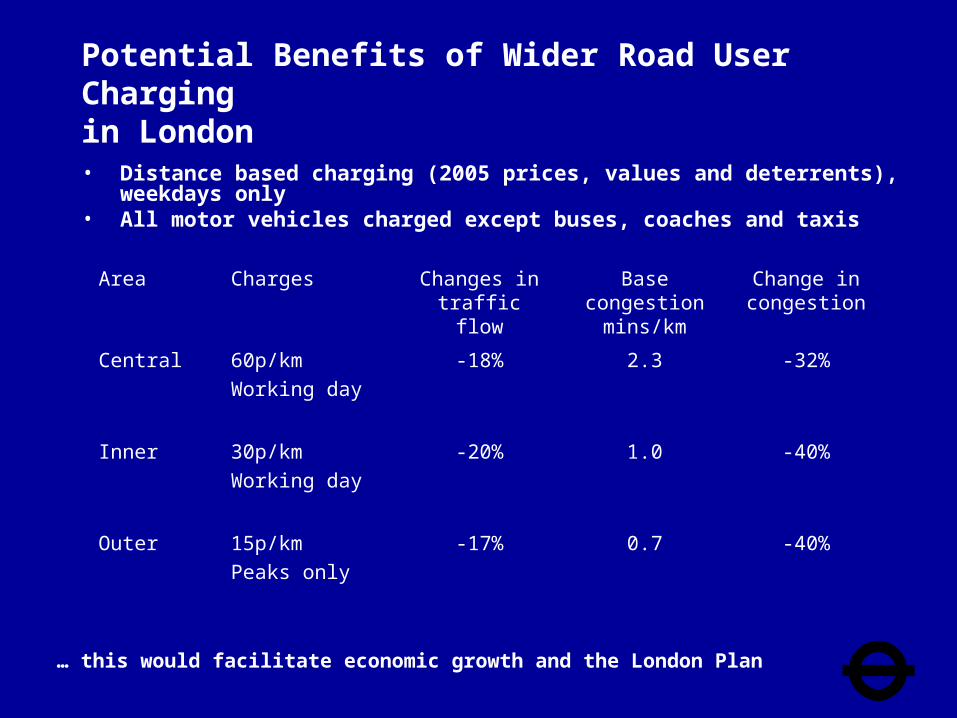
Potential Benefits of Wider Road User Charging in London
• Distance based charging (2005 prices, values and deterrents), weekdays only• All motor vehicles charged except buses, coaches and taxis
Area Charges Changes in traffic flow
Base congestion mins/km
Change in congestion
Central 60p/km
Working day
-18% 2.3 -32%
Inner 30p/km
Working day
-20% 1.0 -40%
Outer 15p/km
Peaks only
-17% 0.7 -40%
… this would facilitate economic growth and the London Plan
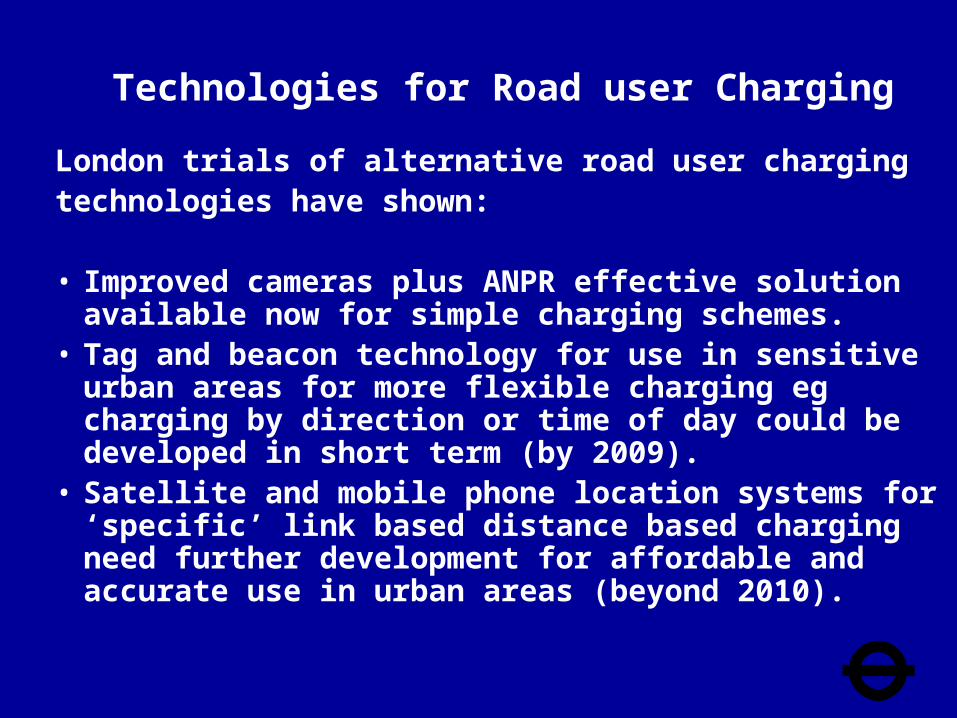
Technologies for Road user Charging
London trials of alternative road user charging technologies have shown:
• Improved cameras plus ANPR effective solution available now for simple charging schemes.
• Tag and beacon technology for use in sensitive urban areas for more flexible charging eg charging by direction or time of day could be developed in short term (by 2009).
• Satellite and mobile phone location systems for ‘specific’ link based distance based charging need further development for affordable and accurate use in urban areas (beyond 2010).
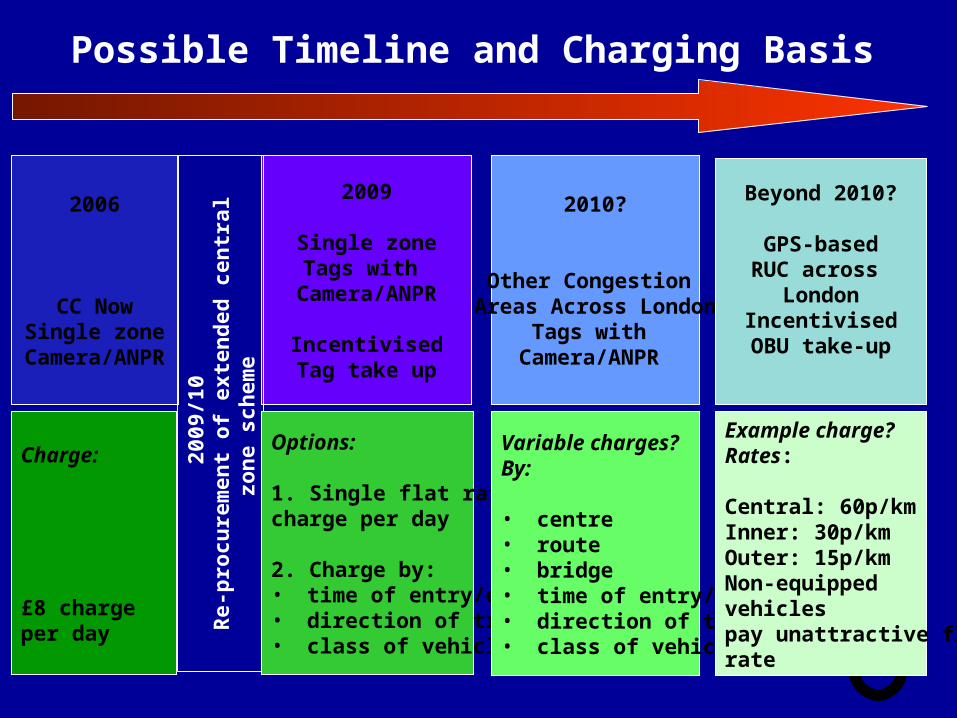
Possible Timeline and Charging Basis
2006
CC NowSingle zone
Camera/ANPR
2009
Single zoneTags with
Camera/ANPR
IncentivisedTag take up
2010?
Other Congestion Areas Across London
Tags with Camera/ANPR
Beyond 2010?
GPS-basedRUC across
LondonIncentivisedOBU take-up
2009
/10
Re-
pro
cure
men
t o
f ex
ten
ded
cen
tral
zo
ne
sch
eme
Options:
1. Single flat rate £8charge per day
2. Charge by:• time of entry/exit• direction of travel• class of vehicle
Charge:
£8 chargeper day
Variable charges? By:
• centre • route• bridge• time of entry/exit• direction of travel• class of vehicle
Example charge? Rates:
Central: 60p/kmInner: 30p/kmOuter: 15p/km Non-equipped vehicles pay unattractive flat rate

www.tfl.gov.uk