Embed Size (px)
DESCRIPTION
High School Principals’ Luncheon. Central Piedmont Community College 2012 Data Report for CMS High Schools (CMS Graduates Attending CPCC from Fall 2007-11). Number of CMS Graduates at CPCC Fall 2007-2011. 2008. 2009. 2010. 2011. 2012. Additional CMS Graduates at CPCC Spring 2008-2012. - PowerPoint PPT Presentation
Citation preview
Central Piedmont Community College2012 Data Report for CMS High Schools
(CMS Graduates Attending CPCC from Fall 2007-11)
High School Principals’ Luncheon
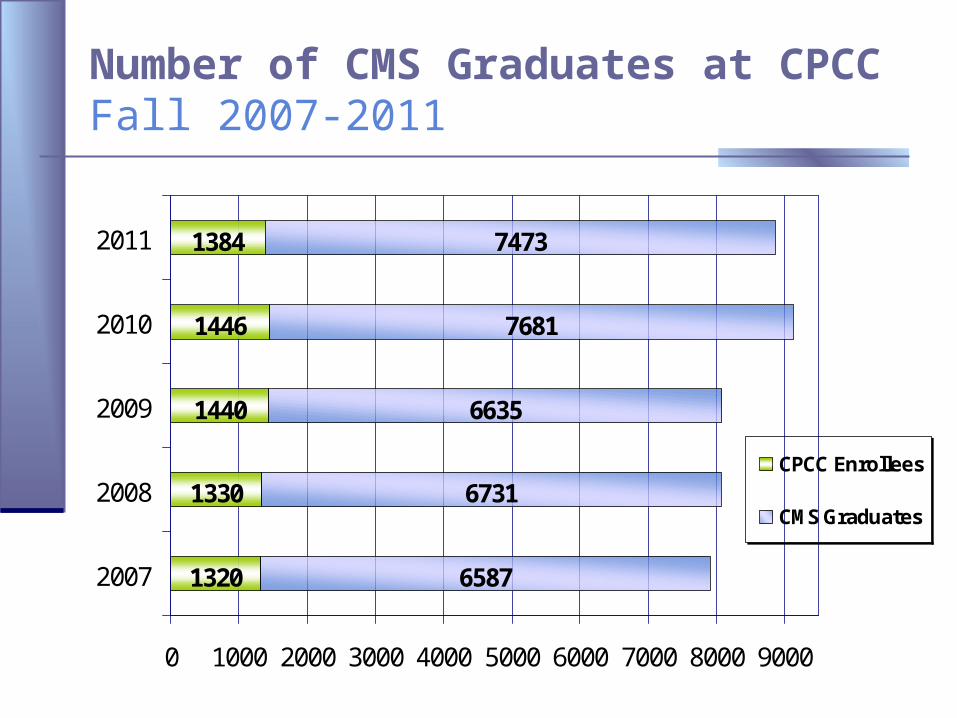
Number of CMS Graduates at CPCCFall 2007-2011
1320
1330
1440
1446
6587
6731
6635
7681
74731384
0 1000 2000 3000 4000 5000 6000 7000 8000 9000
2007
2008
2009
2010
2011
CPCC Enrollees
CMS Graduates
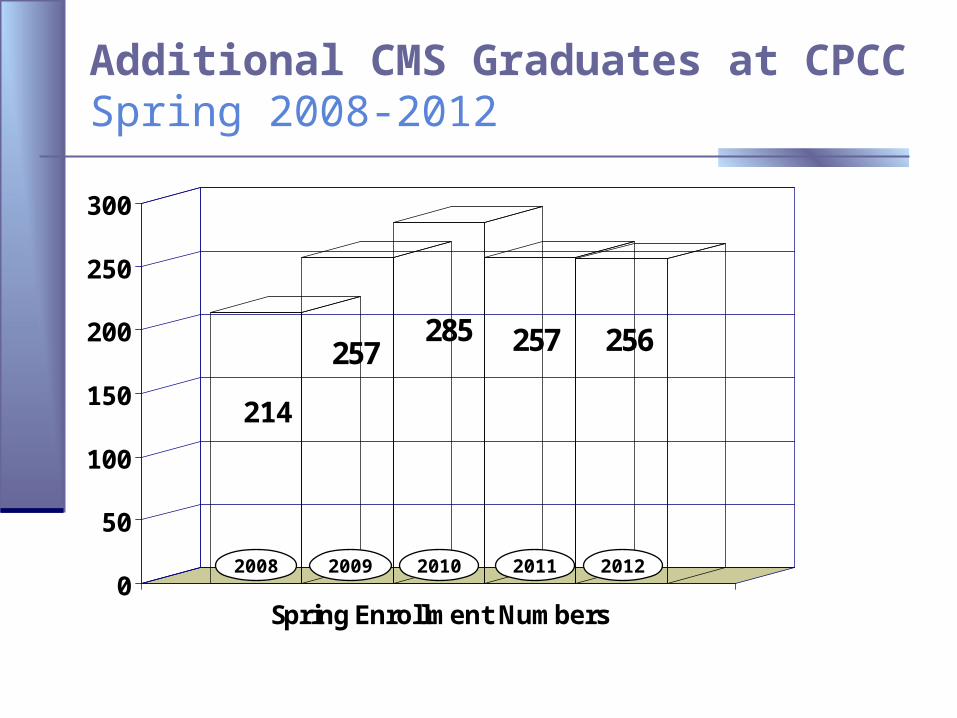
Additional CMS Graduates at CPCCSpring 2008-2012
214
257285 257 256
0
50
100
150
200
250
300
Spring Enrollment Numbers
2009 2010 2011 20122008
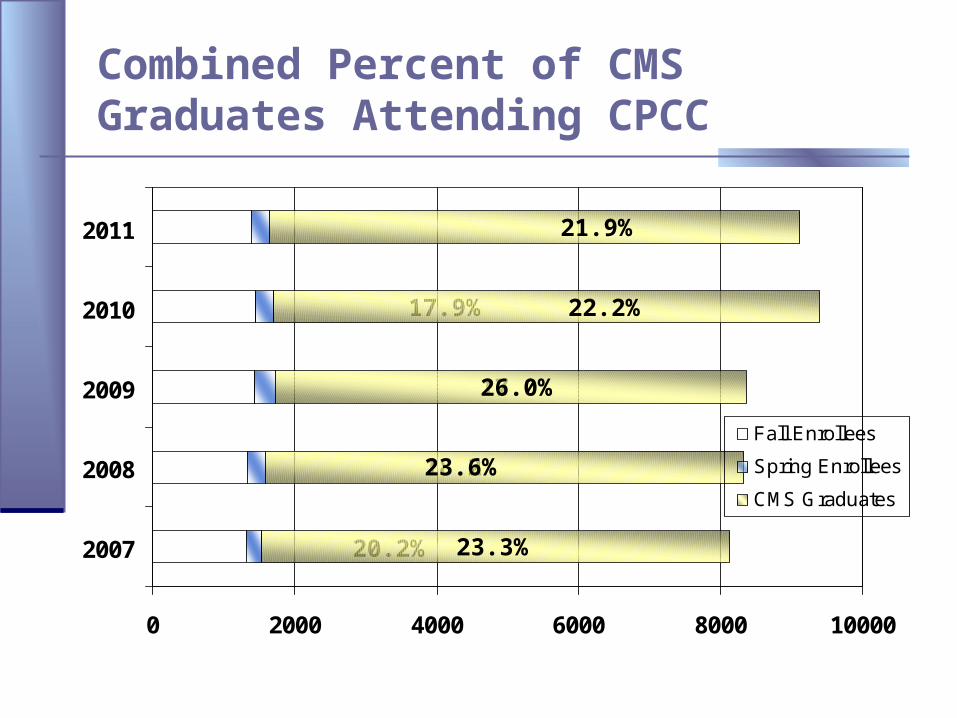
Combined Percent of CMS Graduates Attending CPCC
17.9%
17.0%
18.2%
20.2%
0 2000 4000 6000 8000 10000
2007
2008
2009
2010
2011
Fall Enrollees
Spring Enrollees
CMS Graduates
22.2%
26.0%
23.6%
23.3%
21.9%
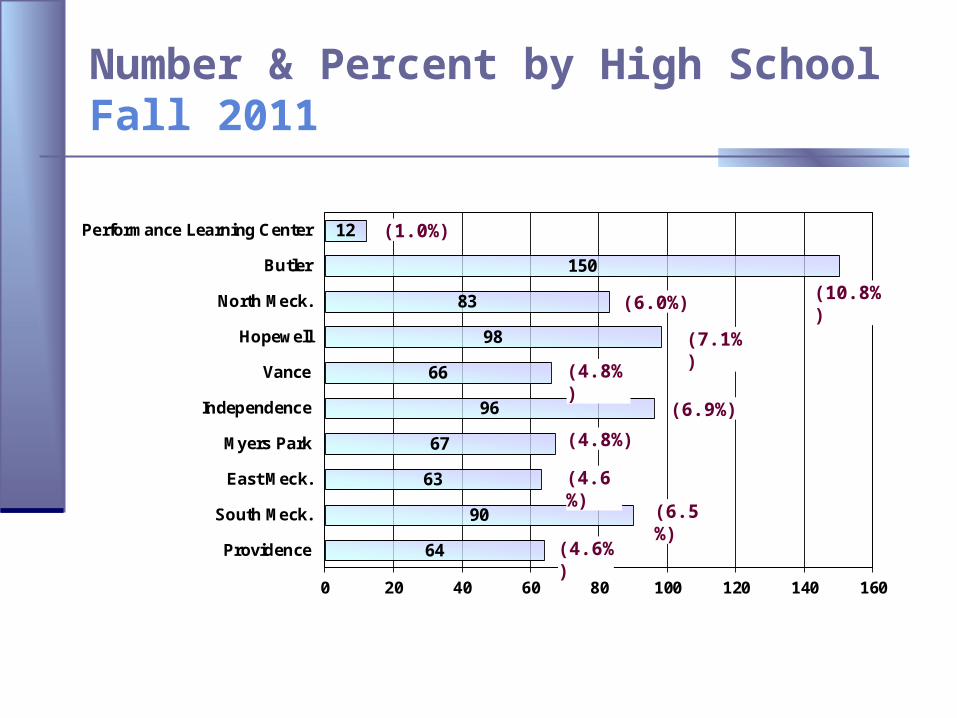
Number & Percent by High SchoolFall 2011
64
90
63
67
96
66
98
83
150
12
0 20 40 60 80 100 120 140 160
Providence
South Meck.
East Meck.
Myers Park
Independence
Vance
Hopewell
North Meck.
Butler
Performance Learning Center
(10.8%)(6.0%)
(7.1%)
(4.8%)
(6.9%)
(4.8%)
(4.6%)
(6.5%)
(4.6%)
(1.0%)
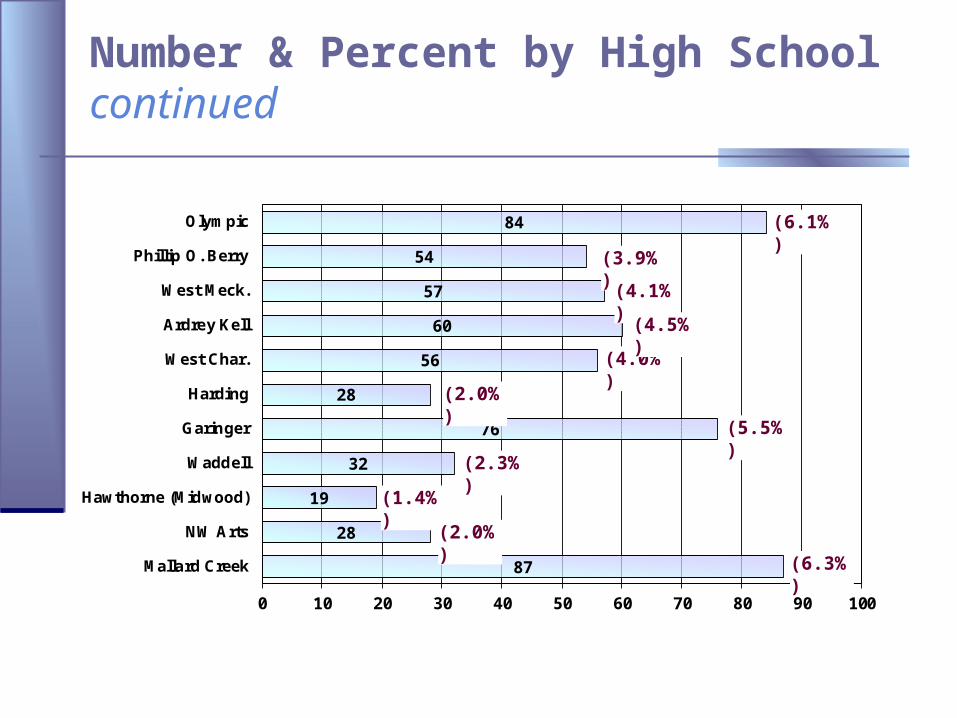
Number & Percent by High Schoolcontinued
87
28
19
32
76
28
56
60
57
54
84
0 10 20 30 40 50 60 70 80 90 100
Mallard Creek
NW Arts
Hawthorne (Midwood)
Waddell
Garinger
Harding
West Char.
Ardrey Kell
West Meck.
Phillip O. Berry
Olympic (6.1%)
(3.9%)
(4.1%)
(4.0%)
(2.0%)
(5.5%)
(2.3%)
(1.4%)
(4.5%)
(2.0%)
(6.3%)
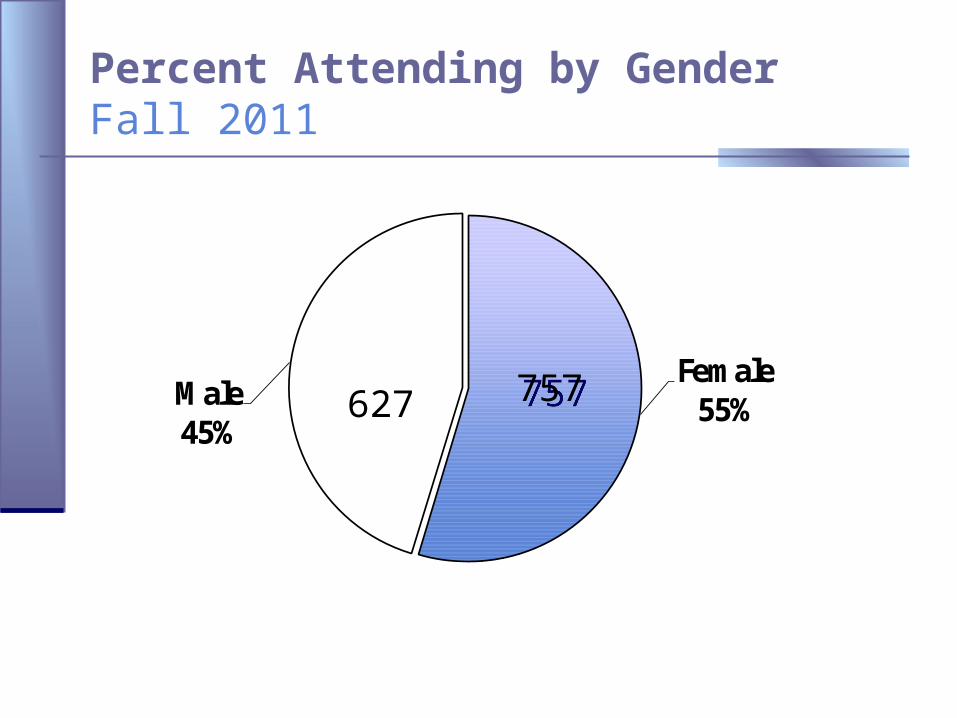
Percent Attending by GenderFall 2011
Female55%Male
45%627 757 757
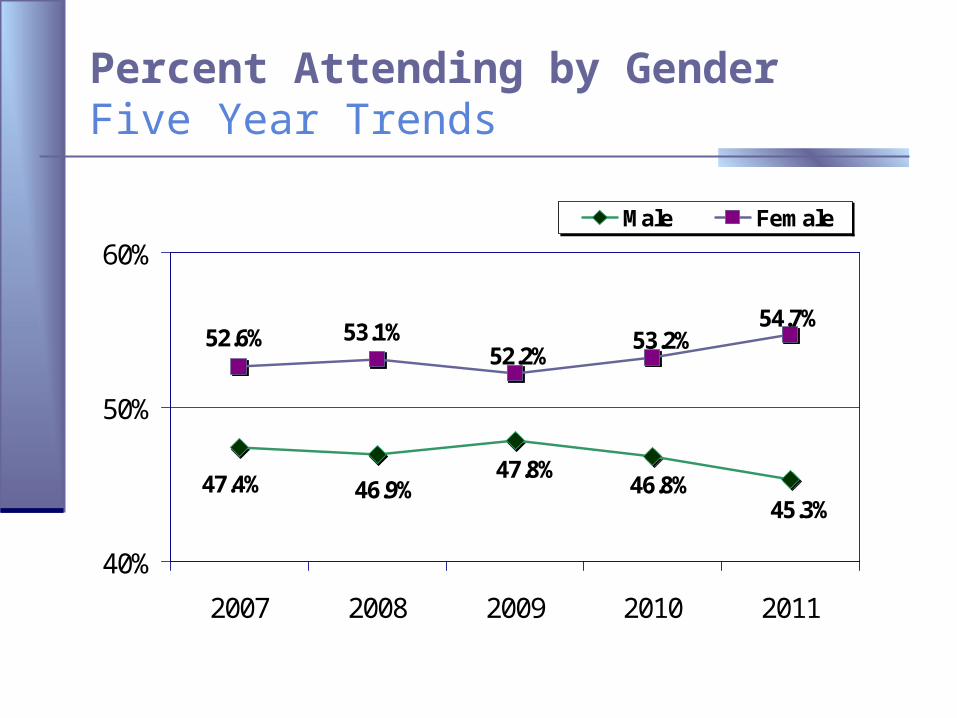
Percent Attending by GenderFive Year Trends
45.3%46.8%
47.8%46.9%47.4%
54.7%53.2%
52.2%53.1%52.6%
40%
50%
60%
2007 2008 2009 2010 2011
Male Female
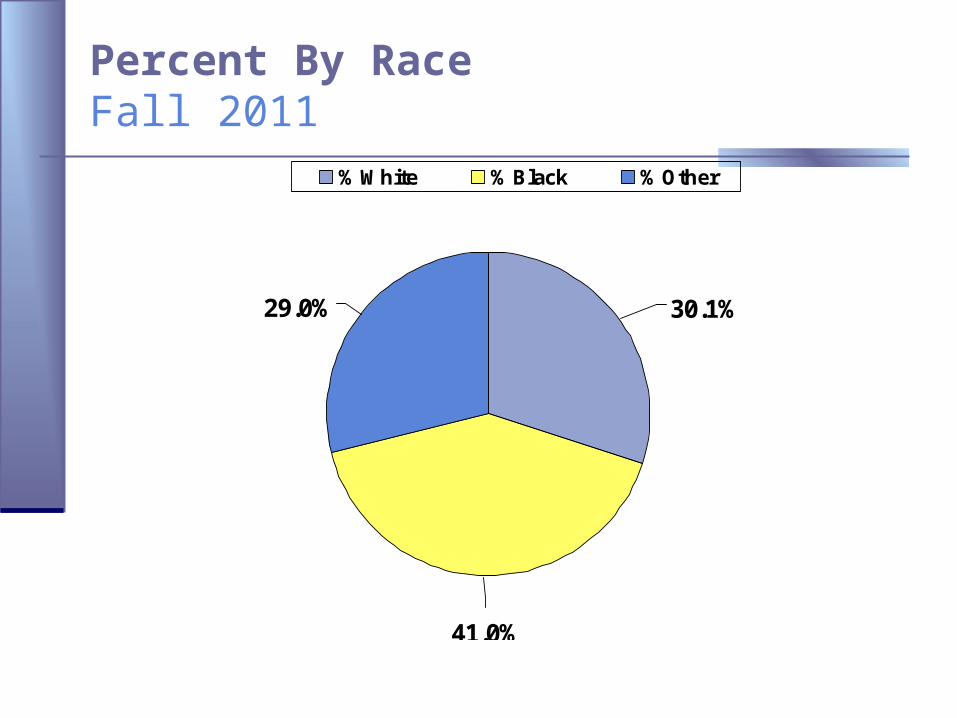
Percent By RaceFall 2011
41.0%
30.1%29.0%
% White % Black % Other
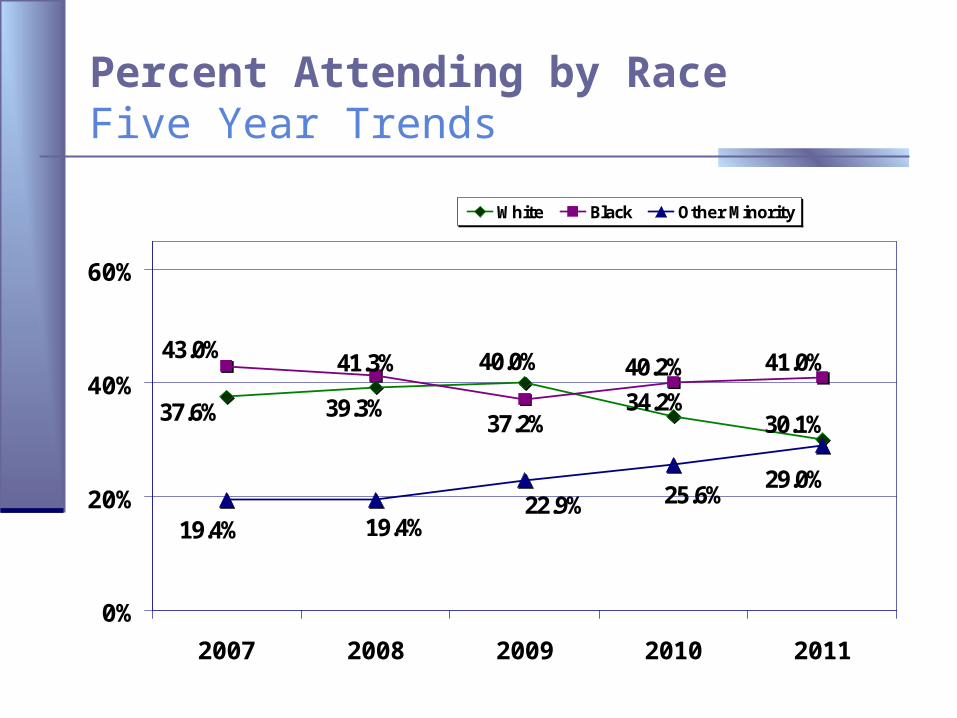
Percent Attending by RaceFive Year Trends
30.1%34.2%
40.0%
39.3%37.6%
41.0%40.2%
37.2%
41.3%43.0%
19.4% 19.4%22.9% 25.6%
29.0%
0%
20%
40%
60%
2007 2008 2009 2010 2011
White Black Other Minority
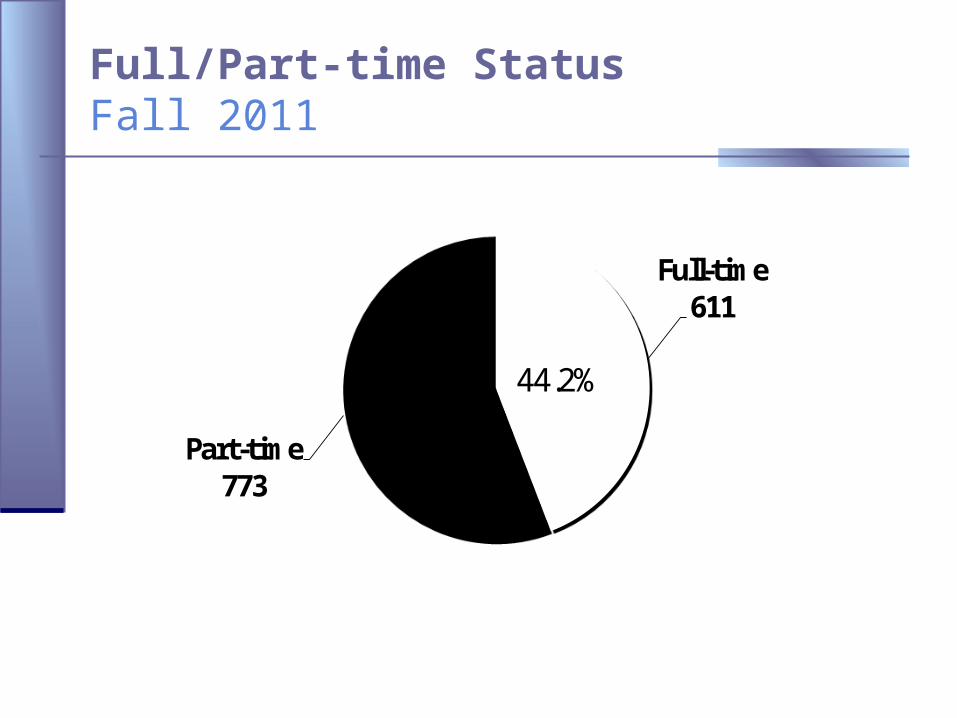
Full/Part-time StatusFall 2011
Full-time611
Part-time773
44.2%55.8%
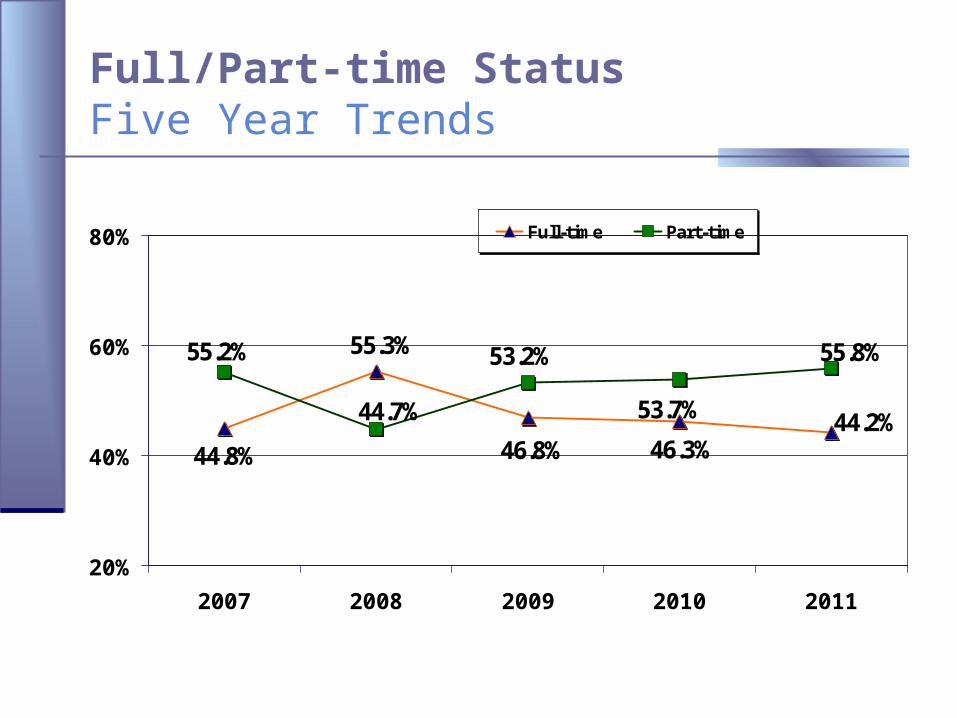
Full/Part-time StatusFive Year Trends
44.8%
55.3%
46.8% 46.3%44.2%
55.8%
53.7%
53.2%
44.7%
55.2%
20%
40%
60%
80%
2007 2008 2009 2010 2011
Full-time Part-time
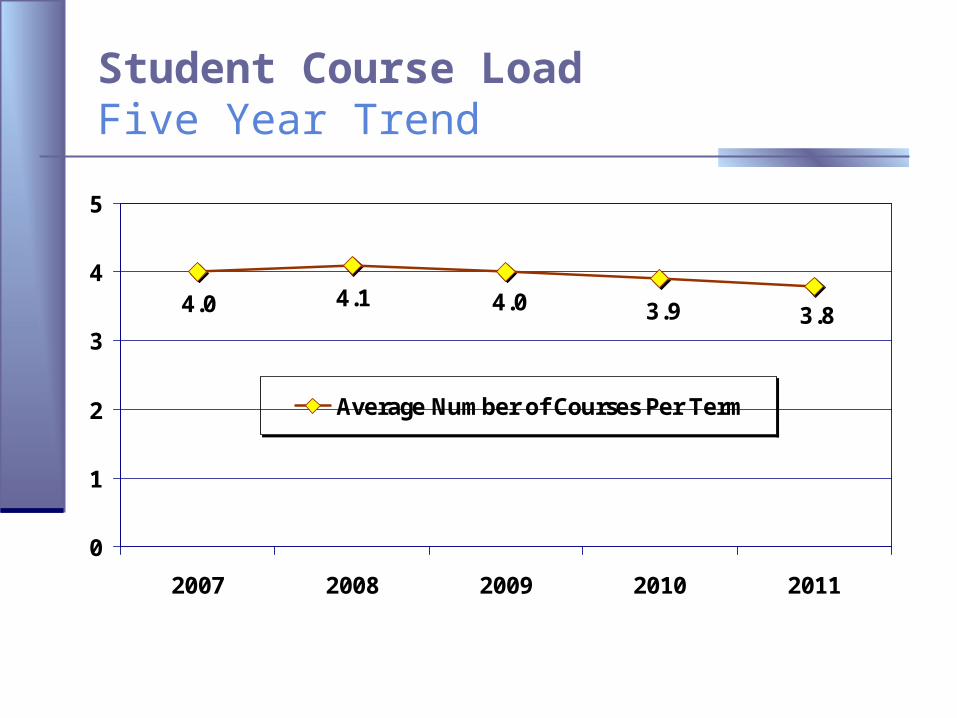
Student Course LoadFive Year Trend
3.83.94.04.14.0
0
1
2
3
4
5
2007 2008 2009 2010 2011
Average Number of Courses Per Term
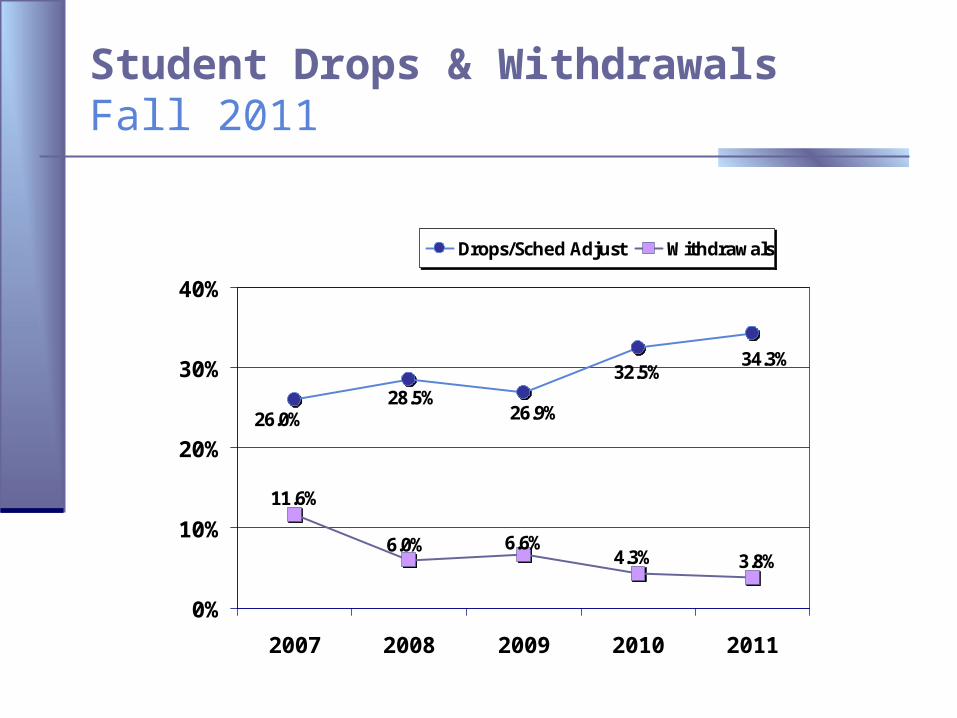
Student Drops & WithdrawalsFall 2011
34.3%32.5%
26.9%28.5%
26.0%
3.8%4.3%6.6%6.0%
11.6%
0%
10%
20%
30%
40%
2007 2008 2009 2010 2011
Drops/Sched Adjust Withdrawals
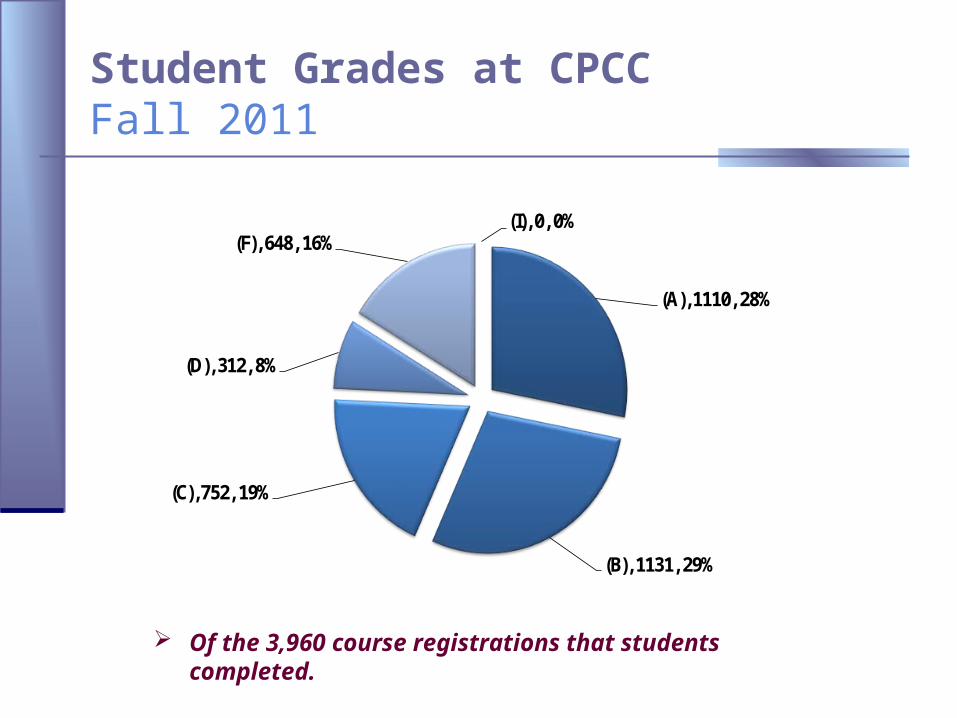
Student Grades at CPCCFall 2011
(A), 1110, 28%
(B), 1131, 29%
(C), 752, 19%
(D), 312, 8%
(F), 648, 16%(I), 0, 0%
Of the 3,960 course registrations that students completed.
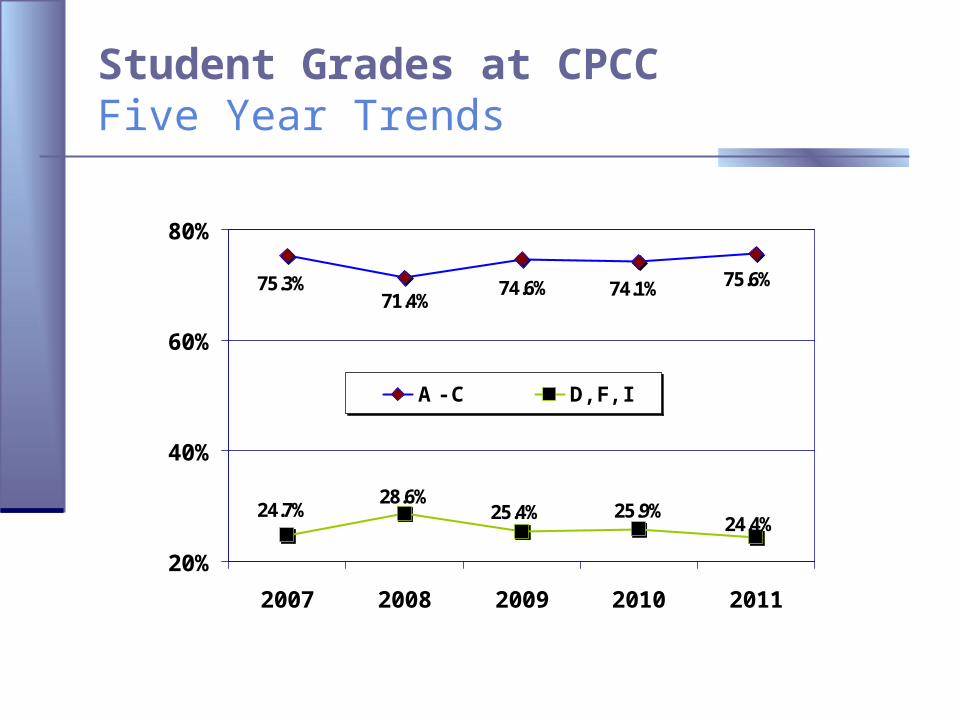
Student Grades at CPCCFive Year Trends
75.6%74.1%74.6%71.4%
75.3%
24.4%25.9%
28.6%24.7% 25.4%
20%
40%
60%
80%
2007 2008 2009 2010 2011
A - C D, F, I
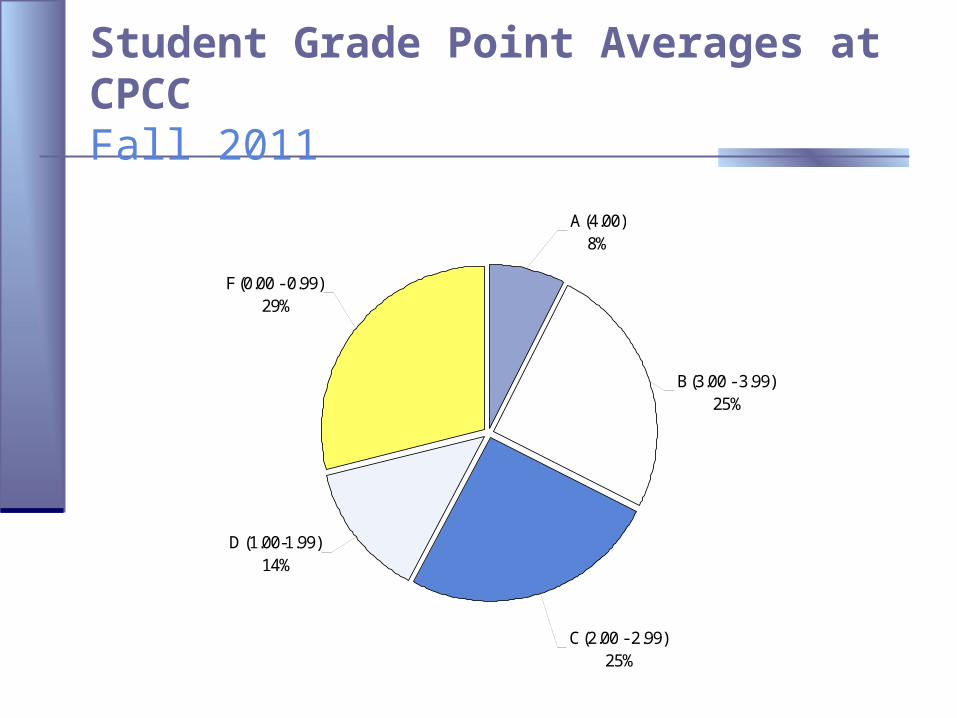
Student Grade Point Averages at CPCCFall 2011
C (2.00 - 2.99) 25%
D (1.00-1.99) 14%
B (3.00 - 3.99) 25%
A (4.00)8%
F (0.00 - 0.99) 29%
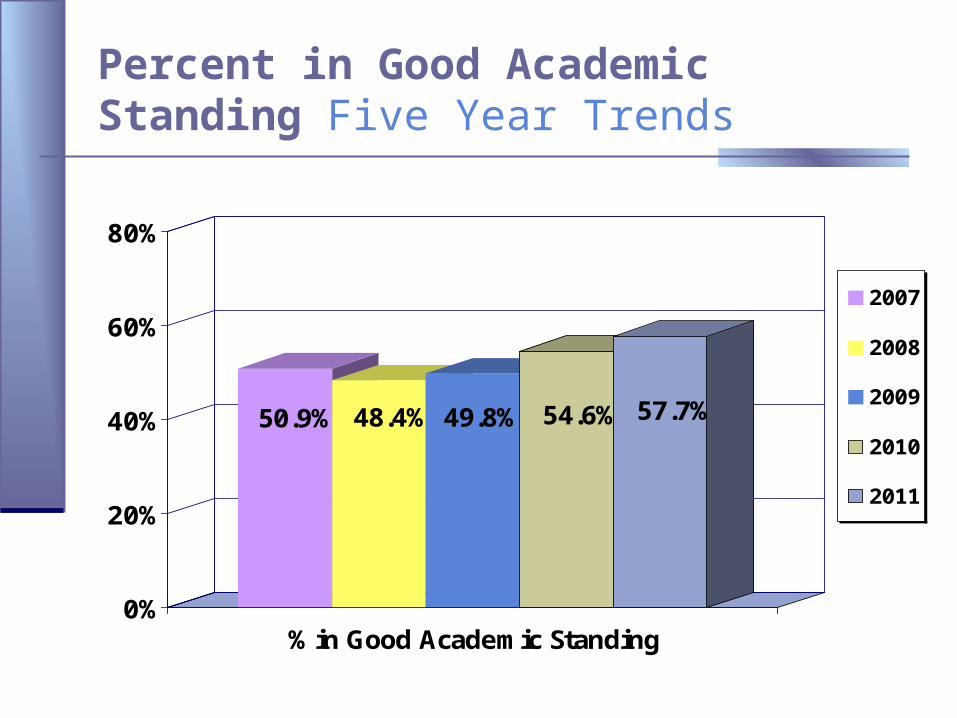
Percent in Good Academic Standing Five Year Trends
50.9% 48.4% 49.8% 54.6% 57.7%
0%
20%
40%
60%
80%
% in Good Academic Standing
2007
2008
2009
2010
2011
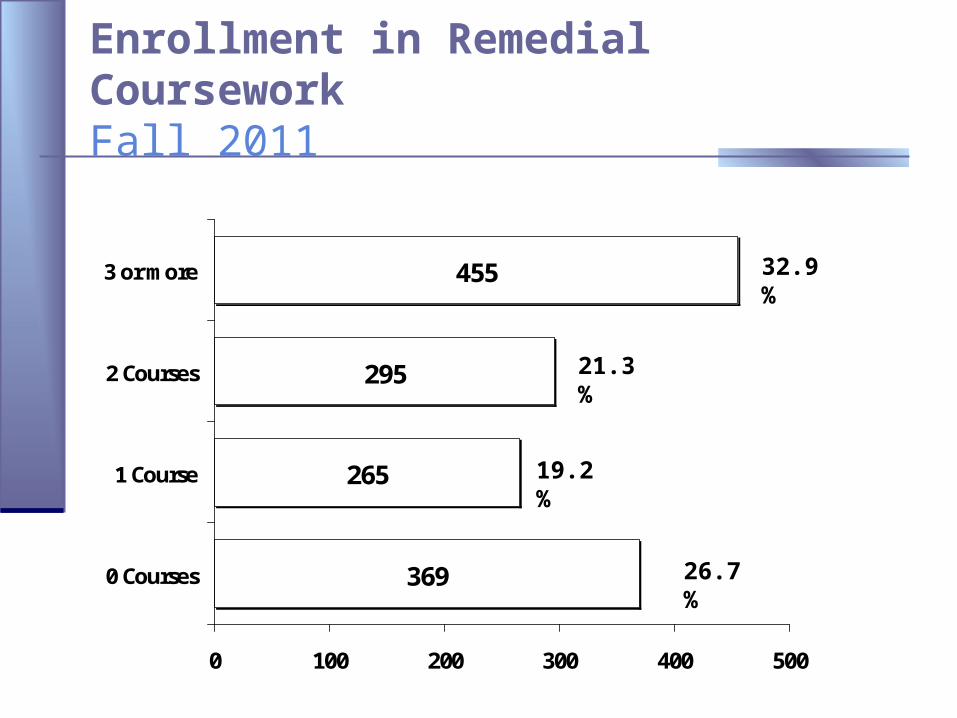
Enrollment in Remedial CourseworkFall 2011
369
265
295
455
0 100 200 300 400 500
0 Courses
1 Course
2 Courses
3 or more
26.7%
19.2%
21.3%
32.9%
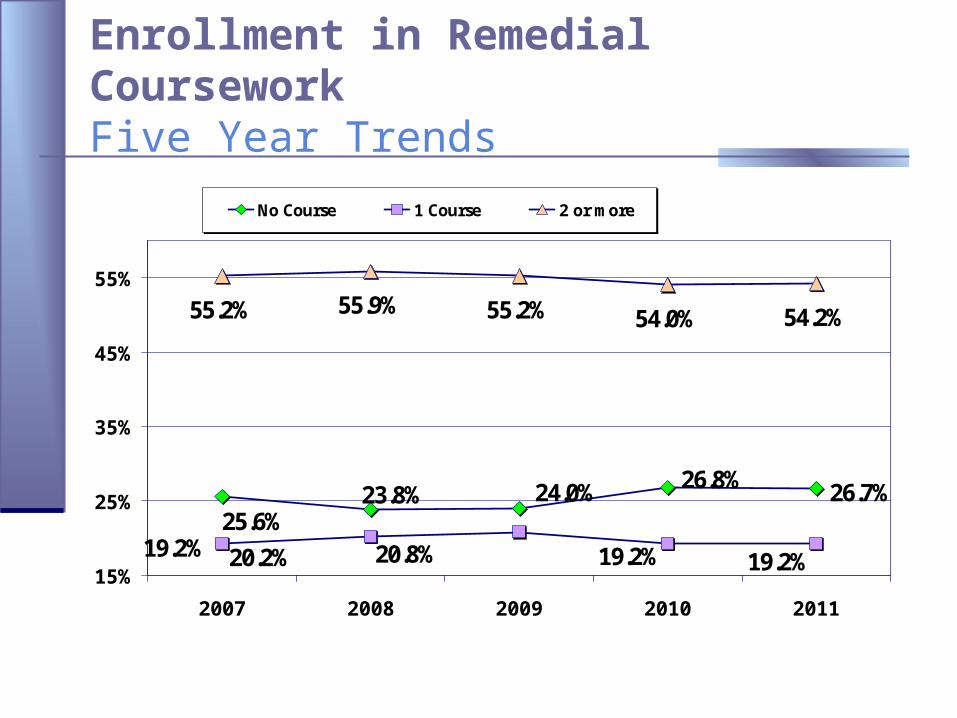
Enrollment in Remedial CourseworkFive Year Trends
25.6%23.8% 26.7%26.8%24.0%
19.2% 20.2% 19.2%19.2%20.8%
55.2% 55.9% 55.2% 54.0% 54.2%
15%
25%
35%
45%
55%
2007 2008 2009 2010 2011
No Course 1 Course 2 or more
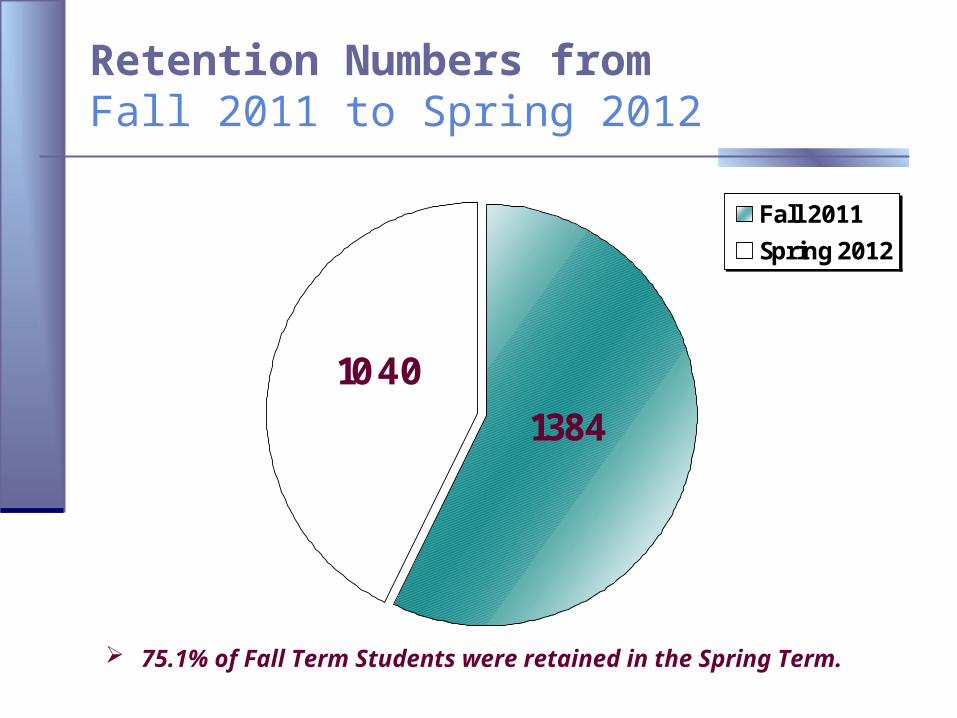
Retention Numbers from Fall 2011 to Spring 2012
1384
1040
Fall 2011
Spring 2012
75.1% of Fall Term Students were retained in the Spring Term.
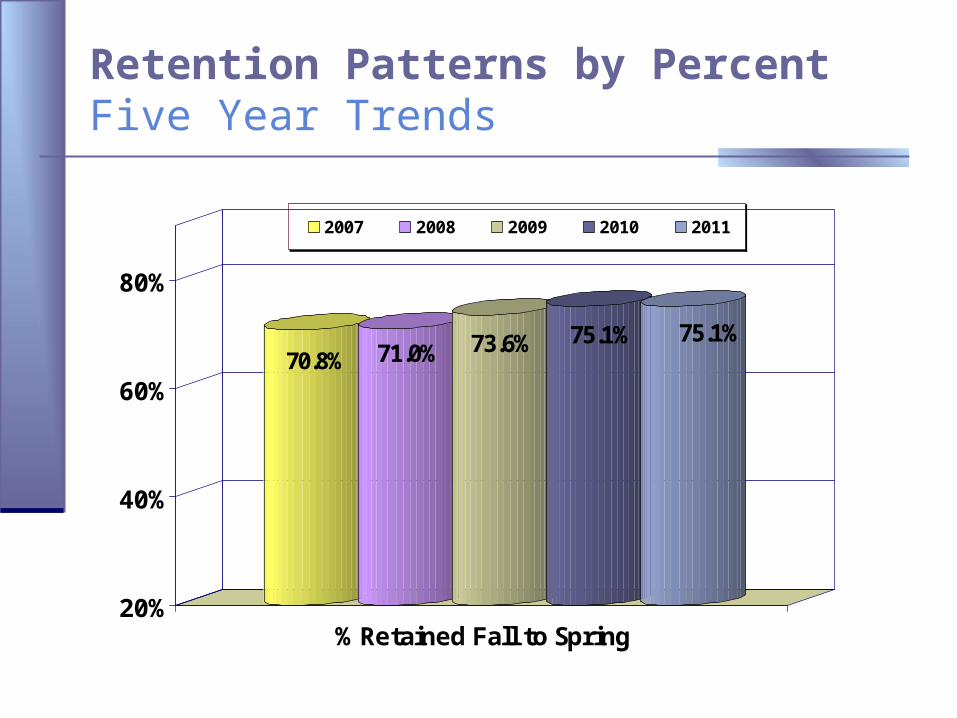
Retention Patterns by PercentFive Year Trends
70.8% 71.0% 73.6% 75.1% 75.1%
20%
40%
60%
80%
% Retained Fall to Spring
2007 2008 2009 2010 2011
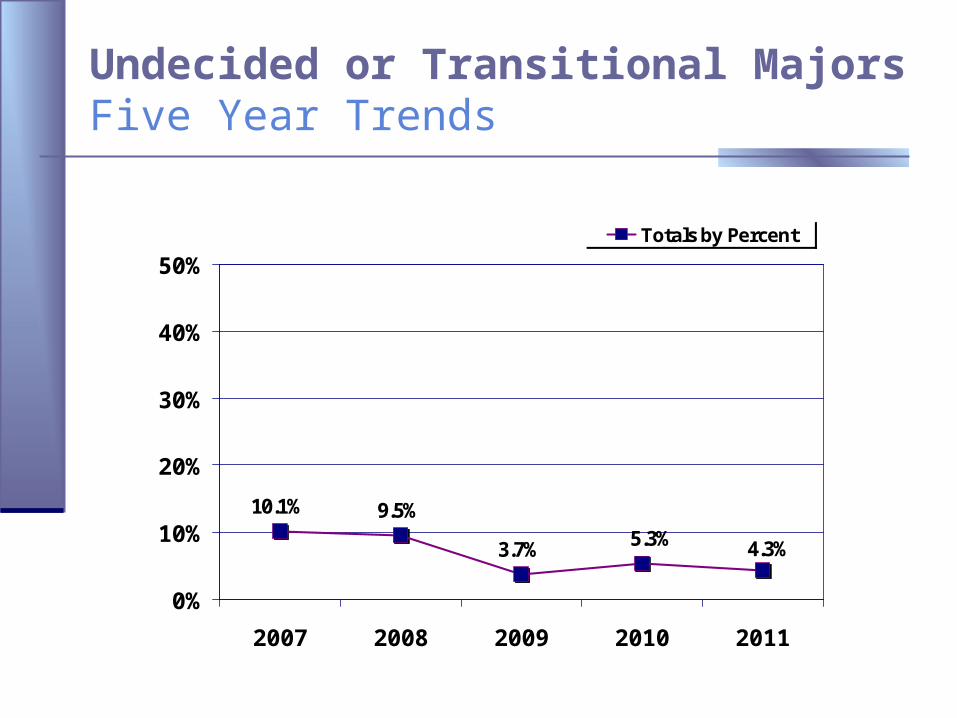
Undecided or Transitional MajorsFive Year Trends
4.3%5.3%3.7%
9.5%10.1%
0%
10%
20%
30%
40%
50%
2007 2008 2009 2010 2011
Totals by Percent
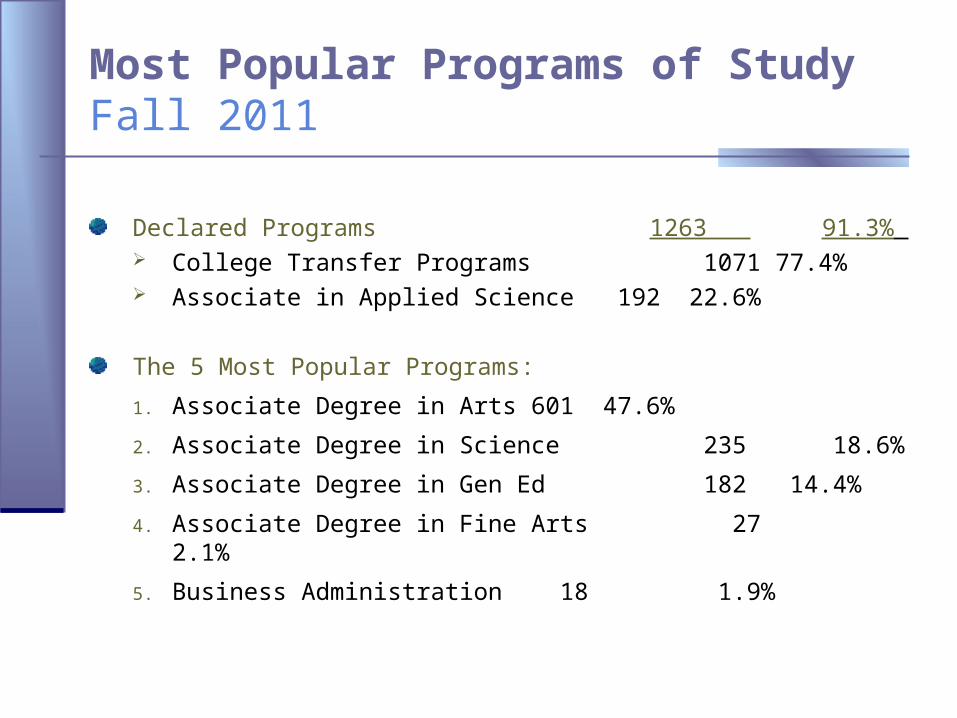
Most Popular Programs of StudyFall 2011
Declared Programs 1263 91.3% College Transfer Programs 1071 77.4% Associate in Applied Science 192 22.6%
The 5 Most Popular Programs:
1. Associate Degree in Arts 601 47.6%
2. Associate Degree in Science 235 18.6%
3. Associate Degree in Gen Ed 182 14.4%
4. Associate Degree in Fine Arts 27 2.1%
5. Business Administration 18 1.9%
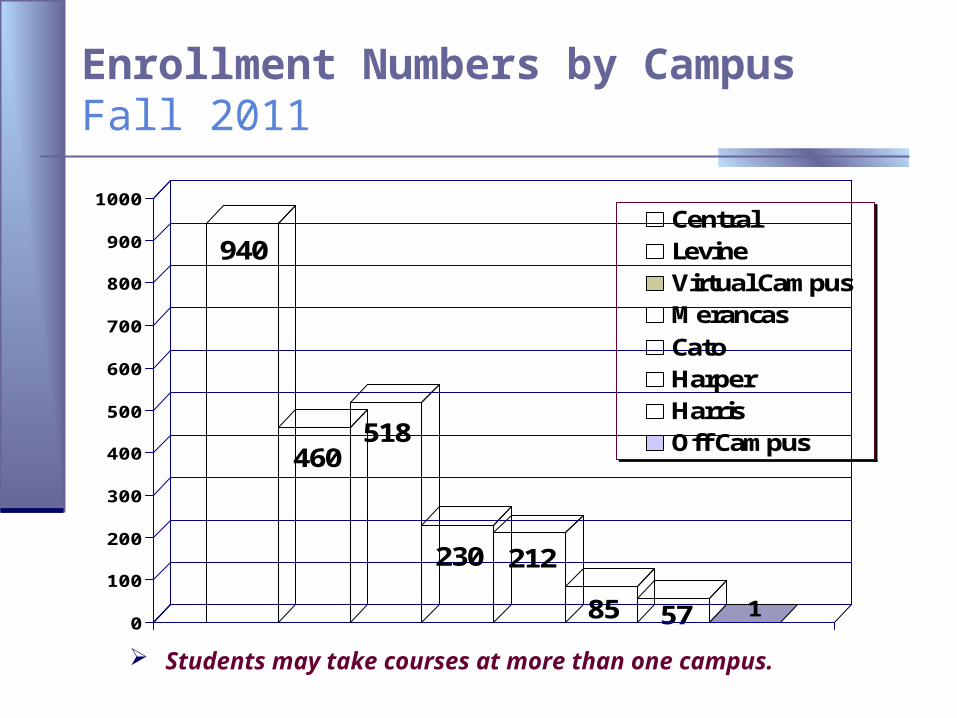
Enrollment Numbers by CampusFall 2011
940
460518
230 212
85 57 10
100
200
300
400
500
600
700
800
900
1000
Central LevineVirtual CampusMerancasCatoHarperHarrisOff Campus
Students may take courses at more than one campus.
For Additional Copies or an Electronic Version of This Presentation. . .
Call: 704-330-6592
Email: [email protected]
Log on to: http://www.cpcc.edu/planning- click on “studies and reports”
The High School Principals’ Luncheon 2012 Report is posted there.