Embed Size (px)
Citation preview
2015-16 School Accountability Report Card for Cesar E. Chavez Elementary School Page 1 of 12
Cesar E. Chavez Elementary School
School Accountability Report Card
Reported Using Data from the 2015-16 School Year
Published During 2016-17
By February 1 of each year, every school in California is required by state law to publish a School Accountability Report Card (SARC). The SARC contains information about the condition and performance of each California public school. Under the Local Control Funding Formula (LCFF) all local educational agencies (LEAs) are required to prepare a Local Control and Accountability Plan (LCAP), which describes how they intend to meet annual school-specific goals for all pupils, with specific activities to address state and local priorities. Additionally, data reported in an LCAP is to be consistent with data reported in the SARC. • For more information about SARC requirements, see the California Department of Education (CDE) SARC Web page at
http://www.cde.ca.gov/ta/ac/sa/. • For more information about the LCFF or LCAP, see the CDE LCFF Web page at http://www.cde.ca.gov/fg/aa/lc/. • For additional information about the school, parents/guardians and community members should contact the school principal or
the district office. DataQuest DataQuest is an online data tool located on the CDE DataQuest Web page at http://dq.cde.ca.gov/dataquest/ that contains additional information about this school and comparisons of the school to the district and the county. Specifically, DataQuest is a dynamic system that provides reports for accountability (e.g., test data, enrollment, high school graduates, dropouts, course enrollments, staffing, and data regarding English learners). Internet Access Internet access is available at public libraries and other locations that are publicly accessible (e.g., the California State Library). Access to the Internet at libraries and public locations is generally provided on a first-come, first-served basis. Other use restrictions may include the hours of operation, the length of time that a workstation may be used (depending on availability), the types of software programs available on a workstation, and the ability to print documents.
About This School Contact Information (School Year 2016-17)
School Contact Information
School Name------- Cesar E. Chavez Elementary School
Street------- 960 - 17th Street
City, State, Zip------- Richmond, CA 94801-2400
Phone Number------- (510) 231-1418
Principal------- Alison Evert
E-mail Address------- [email protected]
Web Site------- www.wccusd.net/Page/768
CDS Code 07-61796-6114094
2015-16 School Accountability Report Card for Cesar E. Chavez Elementary School Page 2 of 12
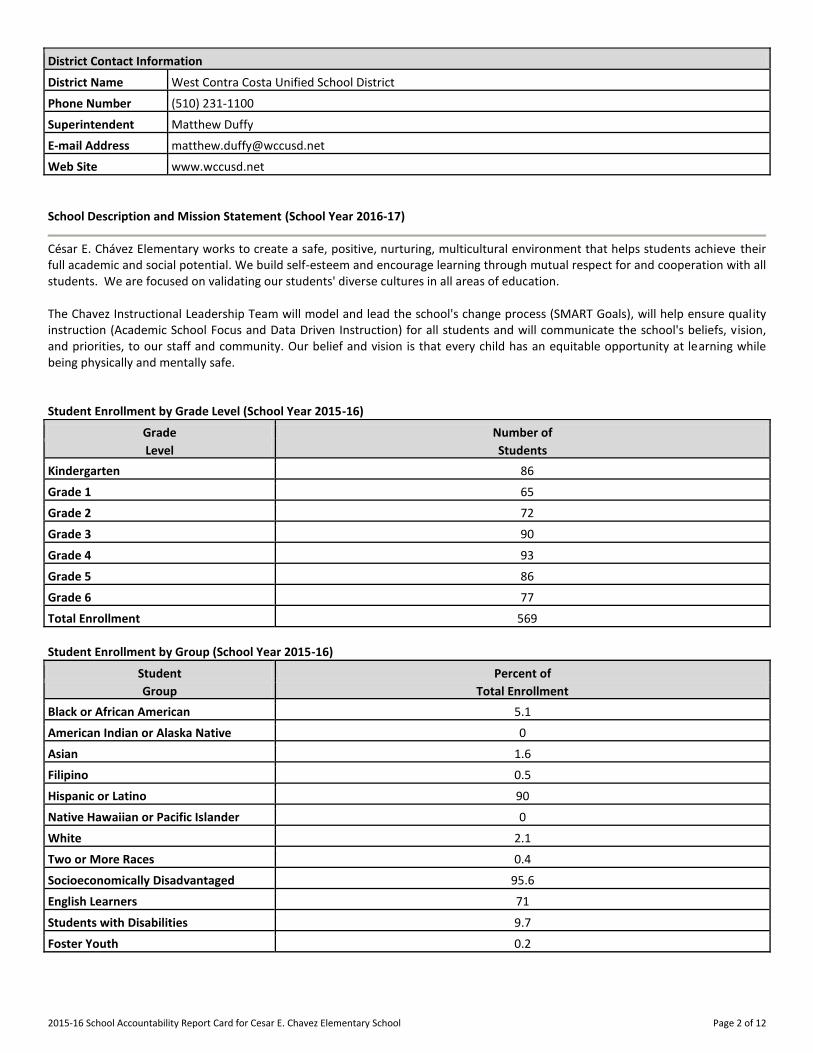
District Contact Information
District Name------- West Contra Costa Unified School District
Phone Number------- (510) 231-1100
Superintendent------- Matthew Duffy
E-mail Address------- [email protected]
Web Site------- www.wccusd.net
School Description and Mission Statement (School Year 2016-17)
César E. Chávez Elementary works to create a safe, positive, nurturing, multicultural environment that helps students achieve their full academic and social potential. We build self-esteem and encourage learning through mutual respect for and cooperation with all students. We are focused on validating our students' diverse cultures in all areas of education. The Chavez Instructional Leadership Team will model and lead the school's change process (SMART Goals), will help ensure quality instruction (Academic School Focus and Data Driven Instruction) for all students and will communicate the school's beliefs, vision, and priorities, to our staff and community. Our belief and vision is that every child has an equitable opportunity at learning while being physically and mentally safe. Student Enrollment by Grade Level (School Year 2015-16)
Grade Number of
Level Students
Kindergarten 86
Grade 1 65
Grade 2 72
Grade 3 90
Grade 4 93
Grade 5 86
Grade 6 77
Total Enrollment 569
Student Enrollment by Group (School Year 2015-16)
Student Percent of
Group Total Enrollment
Black or African American 5.1
American Indian or Alaska Native 0
Asian 1.6
Filipino 0.5
Hispanic or Latino 90
Native Hawaiian or Pacific Islander 0
White 2.1
Two or More Races 0.4
Socioeconomically Disadvantaged 95.6
English Learners 71
Students with Disabilities 9.7
Foster Youth 0.2
2015-16 School Accountability Report Card for Cesar E. Chavez Elementary School Page 3 of 12
A. Conditions of Learning
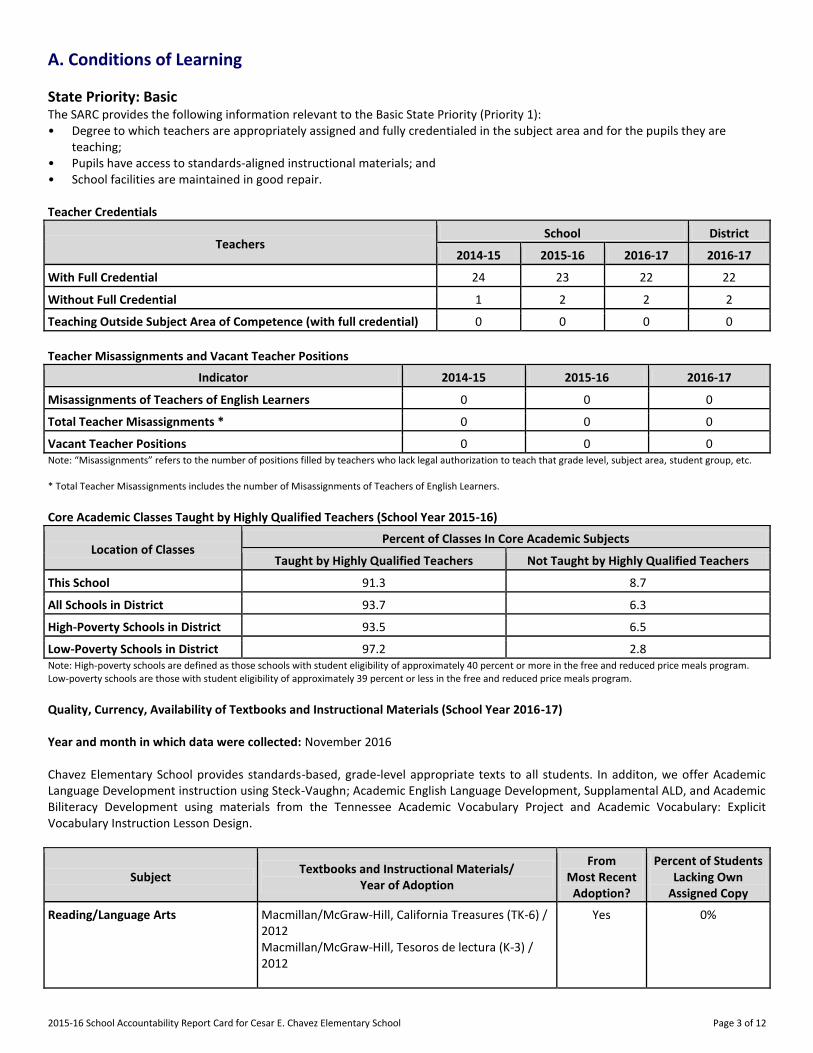
State Priority: Basic The SARC provides the following information relevant to the Basic State Priority (Priority 1): • Degree to which teachers are appropriately assigned and fully credentialed in the subject area and for the pupils they are
teaching; • Pupils have access to standards-aligned instructional materials; and • School facilities are maintained in good repair. Teacher Credentials
Teachers School District
2014-15 2015-16 2016-17 2016-17
With Full Credential 24 23 22 22
Without Full Credential 1 2 2 2
Teaching Outside Subject Area of Competence (with full credential) 0 0 0 0
Teacher Misassignments and Vacant Teacher Positions
Indicator 2014-15 2015-16 2016-17
Misassignments of Teachers of English Learners 0 0 0
Total Teacher Misassignments * 0 0 0
Vacant Teacher Positions 0 0 0 Note: “Misassignments” refers to the number of positions filled by teachers who lack legal authorization to teach that grade level, subject area, student group, etc. * Total Teacher Misassignments includes the number of Misassignments of Teachers of English Learners. Core Academic Classes Taught by Highly Qualified Teachers (School Year 2015-16)
Location of Classes Percent of Classes In Core Academic Subjects
Taught by Highly Qualified Teachers Not Taught by Highly Qualified Teachers
This School 91.3 8.7
All Schools in District 93.7 6.3
High-Poverty Schools in District 93.5 6.5
Low-Poverty Schools in District 97.2 2.8 Note: High-poverty schools are defined as those schools with student eligibility of approximately 40 percent or more in the free and reduced price meals program. Low-poverty schools are those with student eligibility of approximately 39 percent or less in the free and reduced price meals program. Quality, Currency, Availability of Textbooks and Instructional Materials (School Year 2016-17) Year and month in which data were collected: November 2016 Chavez Elementary School provides standards-based, grade-level appropriate texts to all students. In additon, we offer Academic Language Development instruction using Steck-Vaughn; Academic English Language Development, Supplamental ALD, and Academic Biliteracy Development using materials from the Tennessee Academic Vocabulary Project and Academic Vocabulary: Explicit Vocabulary Instruction Lesson Design.
Subject Textbooks and Instructional Materials/
Year of Adoption
From Most Recent
Adoption?
Percent of Students Lacking Own
Assigned Copy
Reading/Language Arts Macmillan/McGraw-Hill, California Treasures (TK-6) / 2012
Macmillan/McGraw-Hill, Tesoros de lectura (K-3) / 2012
Yes 0%
2015-16 School Accountability Report Card for Cesar E. Chavez Elementary School Page 4 of 12
Subject Textbooks and Instructional Materials/
Year of Adoption
From Most Recent
Adoption?
Percent of Students Lacking Own
Assigned Copy
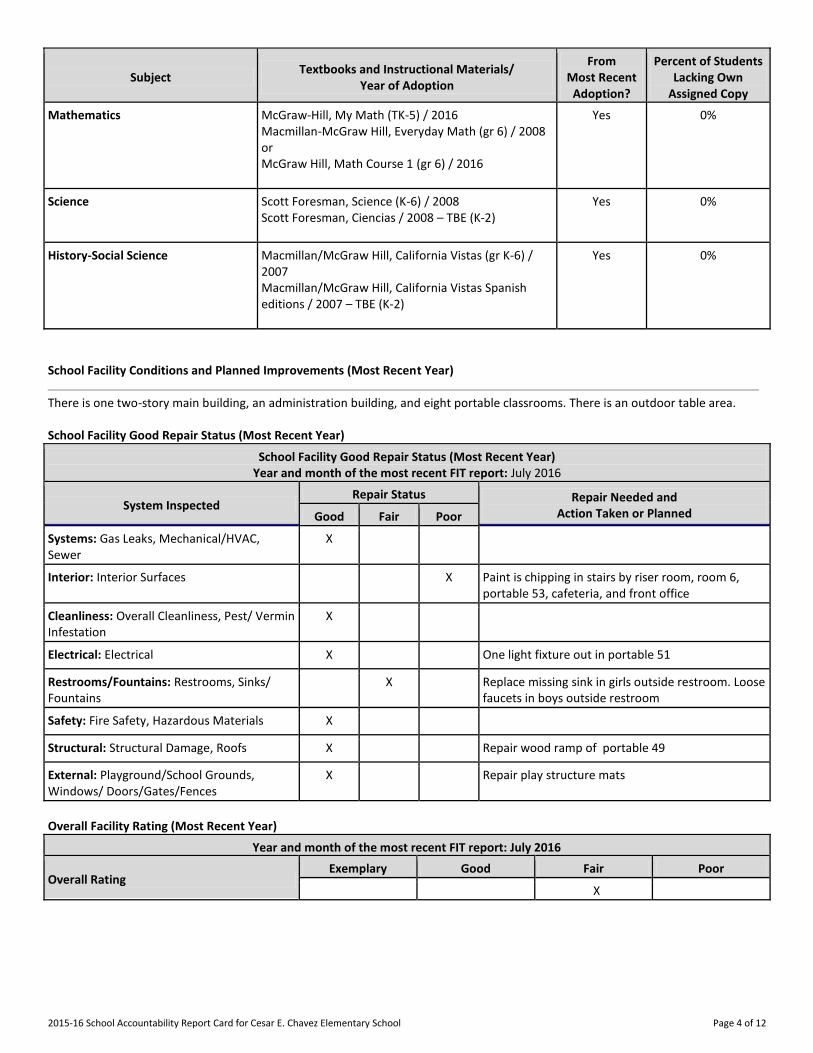
Mathematics McGraw-Hill, My Math (TK-5) / 2016
Macmillan-McGraw Hill, Everyday Math (gr 6) / 2008 or
McGraw Hill, Math Course 1 (gr 6) / 2016
Yes 0%
Science Scott Foresman, Science (K-6) / 2008
Scott Foresman, Ciencias / 2008 – TBE (K-2)
Yes 0%
History-Social Science Macmillan/McGraw Hill, California Vistas (gr K-6) / 2007
Macmillan/McGraw Hill, California Vistas Spanish editions / 2007 – TBE (K-2)
Yes 0%
School Facility Conditions and Planned Improvements (Most Recent Year)
There is one two-story main building, an administration building, and eight portable classrooms. There is an outdoor table area. School Facility Good Repair Status (Most Recent Year)
School Facility Good Repair Status (Most Recent Year) Year and month of the most recent FIT report: July 2016
System Inspected Repair Status Repair Needed and
Action Taken or Planned Good Fair Poor
Systems: Gas Leaks, Mechanical/HVAC, Sewer
X
Interior: Interior Surfaces X Paint is chipping in stairs by riser room, room 6, portable 53, cafeteria, and front office
Cleanliness: Overall Cleanliness, Pest/ Vermin Infestation
X
Electrical: Electrical X One light fixture out in portable 51
Restrooms/Fountains: Restrooms, Sinks/ Fountains
X Replace missing sink in girls outside restroom. Loose faucets in boys outside restroom
Safety: Fire Safety, Hazardous Materials X
Structural: Structural Damage, Roofs X Repair wood ramp of portable 49
External: Playground/School Grounds, Windows/ Doors/Gates/Fences
X Repair play structure mats
Overall Facility Rating (Most Recent Year)
Year and month of the most recent FIT report: July 2016
Overall Rating Exemplary Good Fair Poor
X
2015-16 School Accountability Report Card for Cesar E. Chavez Elementary School Page 5 of 12
B. Pupil Outcomes
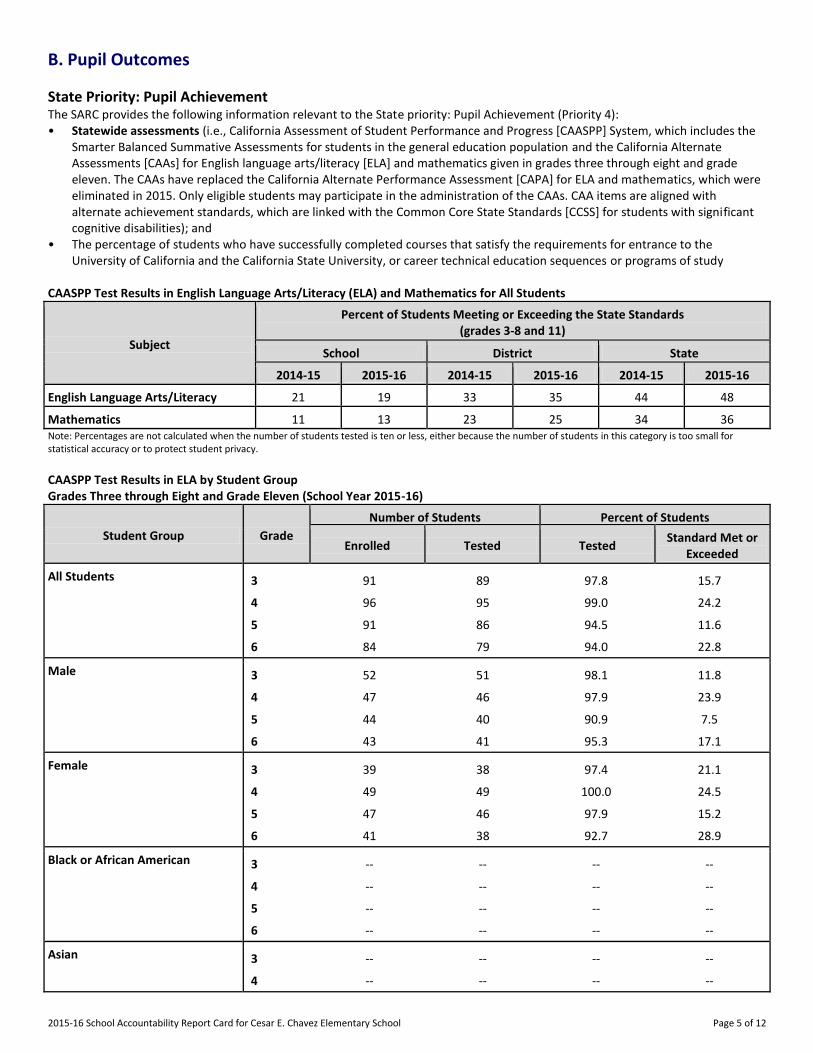
State Priority: Pupil Achievement The SARC provides the following information relevant to the State priority: Pupil Achievement (Priority 4): • Statewide assessments (i.e., California Assessment of Student Performance and Progress [CAASPP] System, which includes the
Smarter Balanced Summative Assessments for students in the general education population and the California Alternate Assessments [CAAs] for English language arts/literacy [ELA] and mathematics given in grades three through eight and grade eleven. The CAAs have replaced the California Alternate Performance Assessment [CAPA] for ELA and mathematics, which were eliminated in 2015. Only eligible students may participate in the administration of the CAAs. CAA items are aligned with alternate achievement standards, which are linked with the Common Core State Standards [CCSS] for students with significant cognitive disabilities); and
• The percentage of students who have successfully completed courses that satisfy the requirements for entrance to the University of California and the California State University, or career technical education sequences or programs of study
CAASPP Test Results in English Language Arts/Literacy (ELA) and Mathematics for All Students
Subject
Percent of Students Meeting or Exceeding the State Standards (grades 3-8 and 11)
School District State
2014-15 2015-16 2014-15 2015-16 2014-15 2015-16
English Language Arts/Literacy 21 19 33 35 44 48
Mathematics 11 13 23 25 34 36 Note: Percentages are not calculated when the number of students tested is ten or less, either because the number of students in this category is too small for statistical accuracy or to protect student privacy.
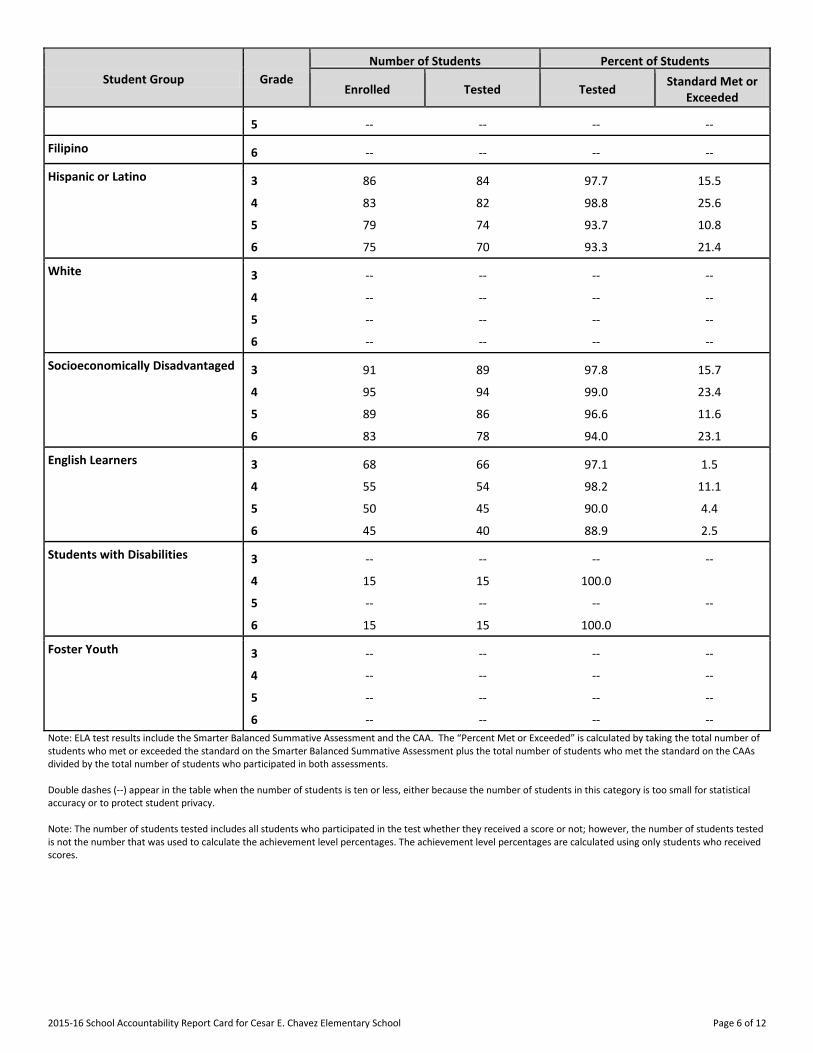
CAASPP Test Results in ELA by Student Group Grades Three through Eight and Grade Eleven (School Year 2015-16)
Student Group Grade
Number of Students Percent of Students
Enrolled Tested Tested Standard Met or
Exceeded
All Students 3 91 89 97.8 15.7
4 96 95 99.0 24.2
5 91 86 94.5 11.6
6 84 79 94.0 22.8
Male 3 52 51 98.1 11.8
4 47 46 97.9 23.9
5 44 40 90.9 7.5
6 43 41 95.3 17.1
Female 3 39 38 97.4 21.1
4 49 49 100.0 24.5
5 47 46 97.9 15.2
6 41 38 92.7 28.9
Black or African American 3 -- -- -- --
4 -- -- -- --
5 -- -- -- --
6 -- -- -- --
Asian 3 -- -- -- --
4 -- -- -- --
2015-16 School Accountability Report Card for Cesar E. Chavez Elementary School Page 6 of 12
Student Group Grade
Number of Students Percent of Students
Enrolled Tested Tested Standard Met or
Exceeded
5 -- -- -- --
Filipino 6 -- -- -- --
Hispanic or Latino 3 86 84 97.7 15.5
4 83 82 98.8 25.6
5 79 74 93.7 10.8
6 75 70 93.3 21.4
White 3 -- -- -- --
4 -- -- -- --
5 -- -- -- --
6 -- -- -- --
Socioeconomically Disadvantaged 3 91 89 97.8 15.7
4 95 94 99.0 23.4
5 89 86 96.6 11.6
6 83 78 94.0 23.1
English Learners 3 68 66 97.1 1.5
4 55 54 98.2 11.1
5 50 45 90.0 4.4
6 45 40 88.9 2.5
Students with Disabilities 3 -- -- -- --
4 15 15 100.0
5 -- -- -- --
6 15 15 100.0
Foster Youth 3 -- -- -- --
4 -- -- -- --
5 -- -- -- --
6 -- -- -- --
Note: ELA test results include the Smarter Balanced Summative Assessment and the CAA. The “Percent Met or Exceeded” is calculated by taking the total number of students who met or exceeded the standard on the Smarter Balanced Summative Assessment plus the total number of students who met the standard on the CAAs divided by the total number of students who participated in both assessments. Double dashes (--) appear in the table when the number of students is ten or less, either because the number of students in this category is too small for statistical accuracy or to protect student privacy. Note: The number of students tested includes all students who participated in the test whether they received a score or not; however, the number of students tested is not the number that was used to calculate the achievement level percentages. The achievement level percentages are calculated using only students who received scores.
2015-16 School Accountability Report Card for Cesar E. Chavez Elementary School Page 7 of 12
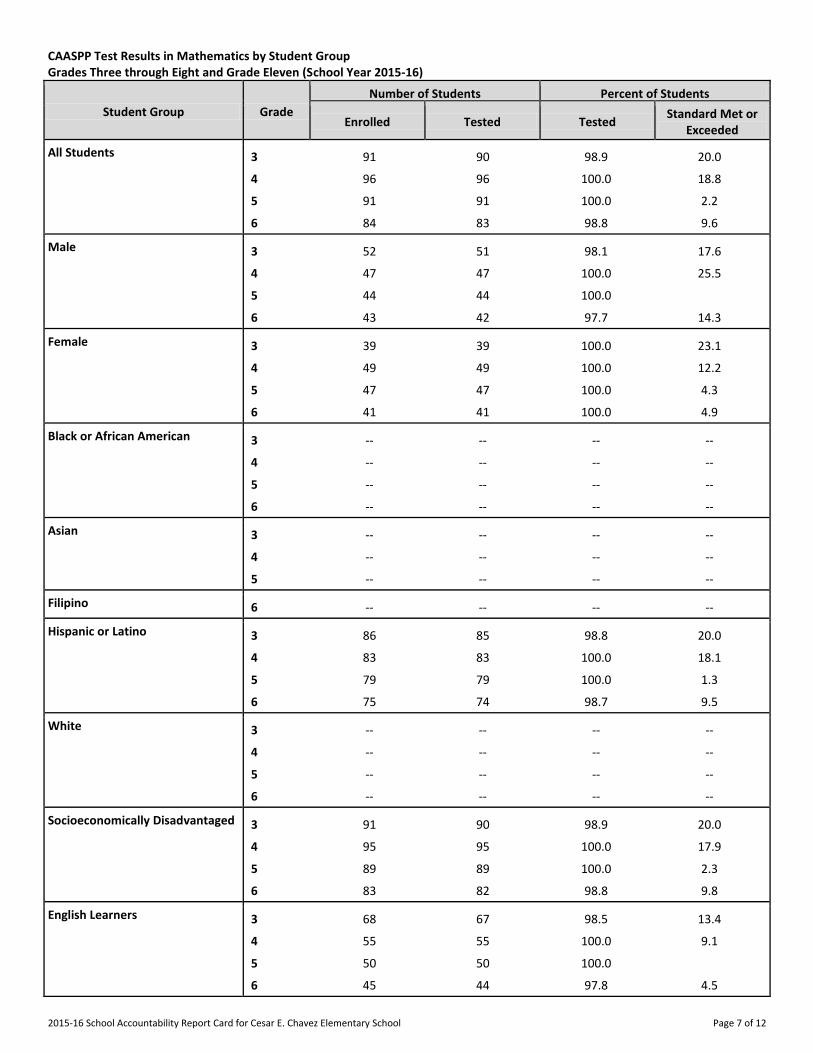
CAASPP Test Results in Mathematics by Student Group Grades Three through Eight and Grade Eleven (School Year 2015-16)
Student Group Grade
Number of Students Percent of Students
Enrolled Tested Tested Standard Met or
Exceeded
All Students 3 91 90 98.9 20.0
4 96 96 100.0 18.8
5 91 91 100.0 2.2
6 84 83 98.8 9.6
Male 3 52 51 98.1 17.6
4 47 47 100.0 25.5
5 44 44 100.0
6 43 42 97.7 14.3
Female 3 39 39 100.0 23.1
4 49 49 100.0 12.2
5 47 47 100.0 4.3
6 41 41 100.0 4.9
Black or African American 3 -- -- -- --
4 -- -- -- --
5 -- -- -- --
6 -- -- -- --
Asian 3 -- -- -- --
4 -- -- -- --
5 -- -- -- --
Filipino 6 -- -- -- --
Hispanic or Latino 3 86 85 98.8 20.0
4 83 83 100.0 18.1
5 79 79 100.0 1.3
6 75 74 98.7 9.5
White 3 -- -- -- --
4 -- -- -- --
5 -- -- -- --
6 -- -- -- --
Socioeconomically Disadvantaged 3 91 90 98.9 20.0
4 95 95 100.0 17.9
5 89 89 100.0 2.3
6 83 82 98.8 9.8
English Learners 3 68 67 98.5 13.4
4 55 55 100.0 9.1
5 50 50 100.0
6 45 44 97.8 4.5
2015-16 School Accountability Report Card for Cesar E. Chavez Elementary School Page 8 of 12
Student Group Grade
Number of Students Percent of Students
Enrolled Tested Tested Standard Met or
Exceeded
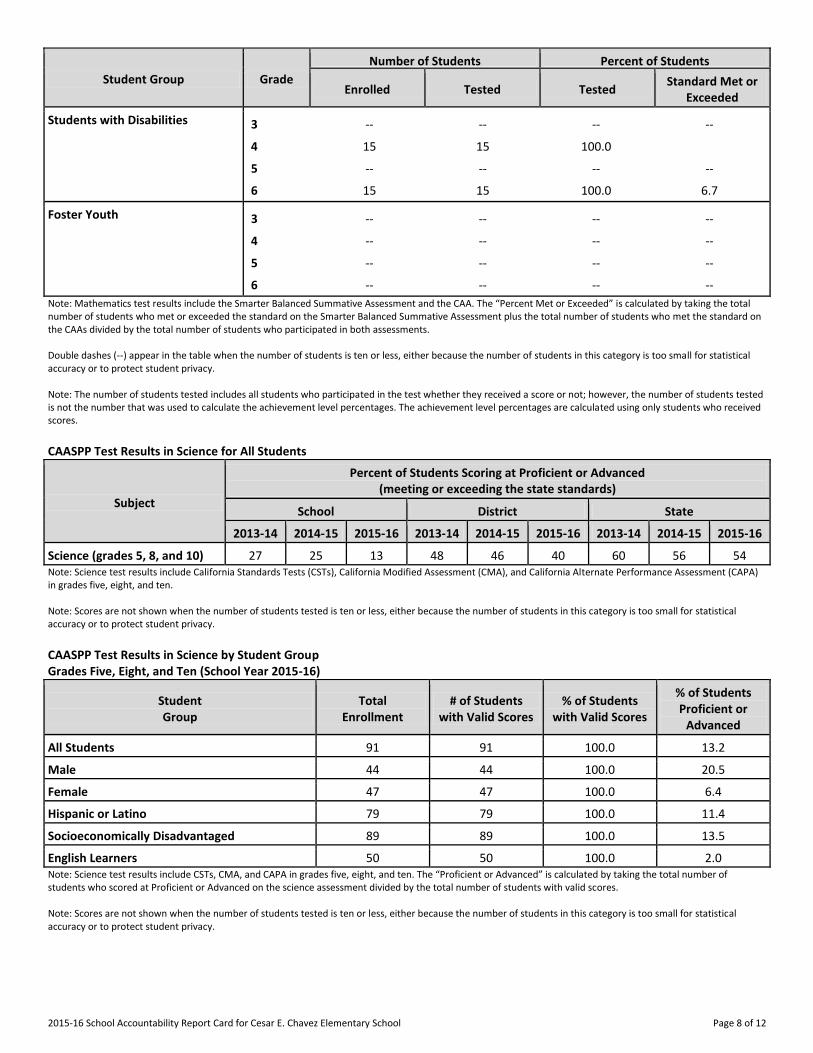
Students with Disabilities 3 -- -- -- --
4 15 15 100.0
5 -- -- -- --
6 15 15 100.0 6.7
Foster Youth 3 -- -- -- --
4 -- -- -- --
5 -- -- -- --
6 -- -- -- --
Note: Mathematics test results include the Smarter Balanced Summative Assessment and the CAA. The “Percent Met or Exceeded” is calculated by taking the total number of students who met or exceeded the standard on the Smarter Balanced Summative Assessment plus the total number of students who met the standard on the CAAs divided by the total number of students who participated in both assessments. Double dashes (--) appear in the table when the number of students is ten or less, either because the number of students in this category is too small for statistical accuracy or to protect student privacy. Note: The number of students tested includes all students who participated in the test whether they received a score or not; however, the number of students tested is not the number that was used to calculate the achievement level percentages. The achievement level percentages are calculated using only students who received scores.
CAASPP Test Results in Science for All Students
Subject
Percent of Students Scoring at Proficient or Advanced (meeting or exceeding the state standards)
School District State
2013-14 2014-15 2015-16 2013-14 2014-15 2015-16 2013-14 2014-15 2015-16
Science (grades 5, 8, and 10) 27 25 13 48 46 40 60 56 54 Note: Science test results include California Standards Tests (CSTs), California Modified Assessment (CMA), and California Alternate Performance Assessment (CAPA) in grades five, eight, and ten. Note: Scores are not shown when the number of students tested is ten or less, either because the number of students in this category is too small for statistical accuracy or to protect student privacy.
CAASPP Test Results in Science by Student Group Grades Five, Eight, and Ten (School Year 2015-16)
Student Group
Total Enrollment
# of Students with Valid Scores
% of Students with Valid Scores
% of Students Proficient or
Advanced
All Students 91 91 100.0 13.2
Male 44 44 100.0 20.5
Female 47 47 100.0 6.4
Hispanic or Latino 79 79 100.0 11.4
Socioeconomically Disadvantaged 89 89 100.0 13.5
English Learners 50 50 100.0 2.0 Note: Science test results include CSTs, CMA, and CAPA in grades five, eight, and ten. The “Proficient or Advanced” is calculated by taking the total number of students who scored at Proficient or Advanced on the science assessment divided by the total number of students with valid scores. Note: Scores are not shown when the number of students tested is ten or less, either because the number of students in this category is too small for statistical accuracy or to protect student privacy.
2015-16 School Accountability Report Card for Cesar E. Chavez Elementary School Page 9 of 12
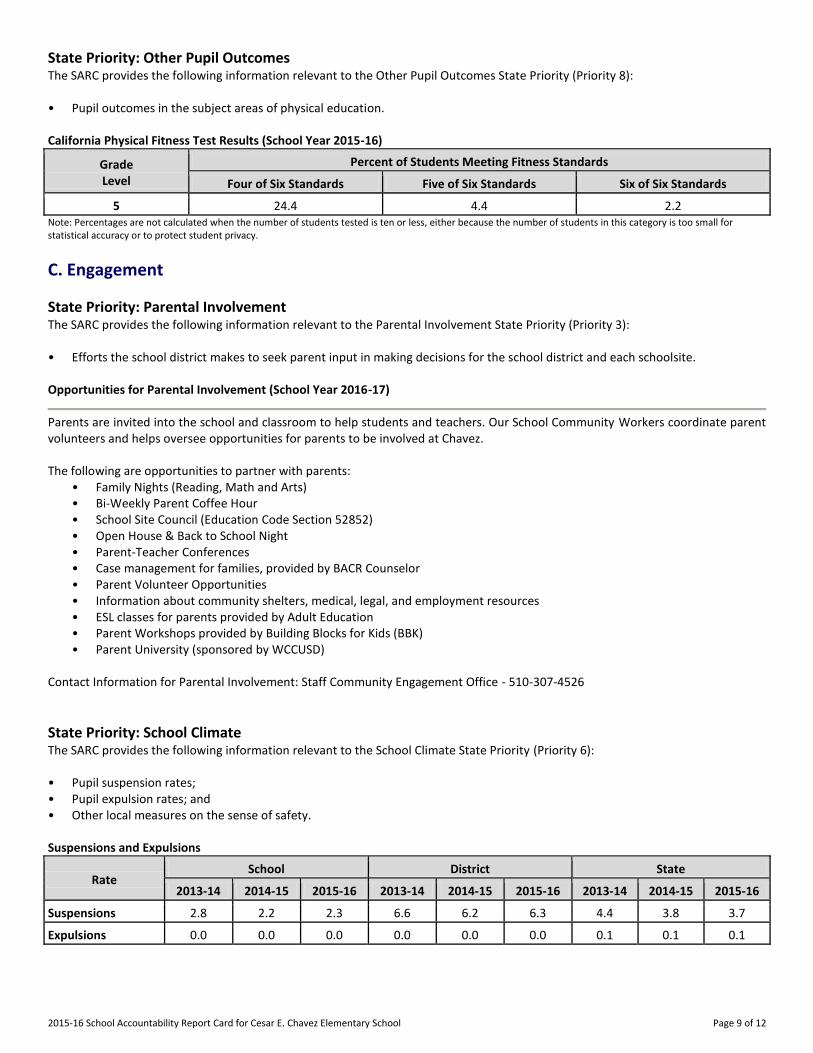
State Priority: Other Pupil Outcomes The SARC provides the following information relevant to the Other Pupil Outcomes State Priority (Priority 8): • Pupil outcomes in the subject areas of physical education. California Physical Fitness Test Results (School Year 2015-16)
Grade Level
Percent of Students Meeting Fitness Standards
Four of Six Standards Five of Six Standards Six of Six Standards
---5--- 24.4 4.4 2.2 Note: Percentages are not calculated when the number of students tested is ten or less, either because the number of students in this category is too small for statistical accuracy or to protect student privacy.
C. Engagement
State Priority: Parental Involvement The SARC provides the following information relevant to the Parental Involvement State Priority (Priority 3): • Efforts the school district makes to seek parent input in making decisions for the school district and each schoolsite. Opportunities for Parental Involvement (School Year 2016-17)
Parents are invited into the school and classroom to help students and teachers. Our School Community Workers coordinate parent volunteers and helps oversee opportunities for parents to be involved at Chavez. The following are opportunities to partner with parents:
• Family Nights (Reading, Math and Arts) • Bi-Weekly Parent Coffee Hour • School Site Council (Education Code Section 52852) • Open House & Back to School Night • Parent-Teacher Conferences • Case management for families, provided by BACR Counselor • Parent Volunteer Opportunities • Information about community shelters, medical, legal, and employment resources • ESL classes for parents provided by Adult Education • Parent Workshops provided by Building Blocks for Kids (BBK) • Parent University (sponsored by WCCUSD)
Contact Information for Parental Involvement: Staff Community Engagement Office - 510-307-4526
State Priority: School Climate The SARC provides the following information relevant to the School Climate State Priority (Priority 6): • Pupil suspension rates; • Pupil expulsion rates; and • Other local measures on the sense of safety. Suspensions and Expulsions
Rate School District State
2013-14 2014-15 2015-16 2013-14 2014-15 2015-16 2013-14 2014-15 2015-16
Suspensions------- 2.8 2.2 2.3 6.6 6.2 6.3 4.4 3.8 3.7
Expulsions------- 0.0 0.0 0.0 0.0 0.0 0.0 0.1 0.1 0.1
2015-16 School Accountability Report Card for Cesar E. Chavez Elementary School Page 10 of 12
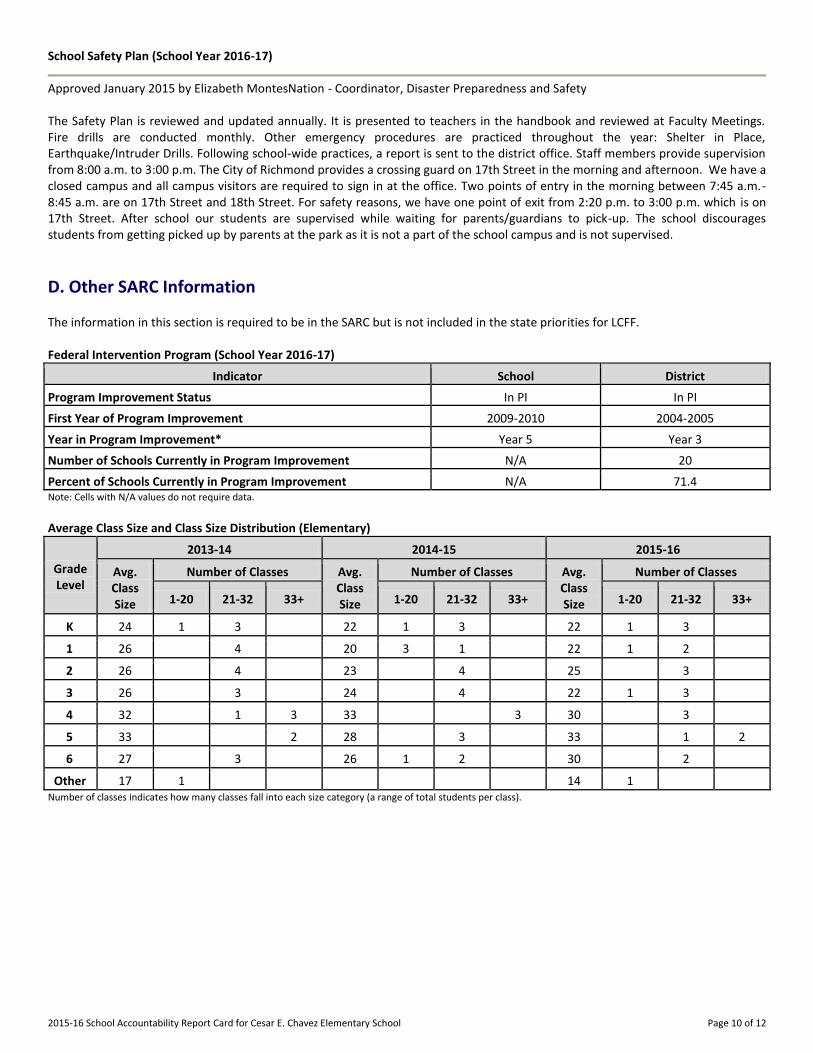
School Safety Plan (School Year 2016-17)
Approved January 2015 by Elizabeth MontesNation - Coordinator, Disaster Preparedness and Safety The Safety Plan is reviewed and updated annually. It is presented to teachers in the handbook and reviewed at Faculty Meetings. Fire drills are conducted monthly. Other emergency procedures are practiced throughout the year: Shelter in Place, Earthquake/Intruder Drills. Following school-wide practices, a report is sent to the district office. Staff members provide supervision from 8:00 a.m. to 3:00 p.m. The City of Richmond provides a crossing guard on 17th Street in the morning and afternoon. We have a closed campus and all campus visitors are required to sign in at the office. Two points of entry in the morning between 7:45 a.m.-8:45 a.m. are on 17th Street and 18th Street. For safety reasons, we have one point of exit from 2:20 p.m. to 3:00 p.m. which is on 17th Street. After school our students are supervised while waiting for parents/guardians to pick-up. The school discourages students from getting picked up by parents at the park as it is not a part of the school campus and is not supervised.
D. Other SARC Information
The information in this section is required to be in the SARC but is not included in the state priorities for LCFF. Federal Intervention Program (School Year 2016-17)
Indicator School District
Program Improvement Status In PI In PI
First Year of Program Improvement 2009-2010 2004-2005
Year in Program Improvement* Year 5 Year 3
Number of Schools Currently in Program Improvement N/A 20
Percent of Schools Currently in Program Improvement N/A 71.4 Note: Cells with N/A values do not require data.
Average Class Size and Class Size Distribution (Elementary)
Grade Level
2013-14 2014-15 2015-16
Avg. Class Size
Number of Classes Avg. Class Size
Number of Classes Avg. Class Size
Number of Classes
1-20 21-32 33+ 1-20 21-32 33+ 1-20 21-32 33+
K
24 1 3 22 1 3 22 1 3
1
26 4 20 3 1 22 1 2
2
26 4 23 4 25 3
3
26 3 24 4 22 1 3
4
32 1 3 33 3 30 3
5
33 2 28 3 33 1 2
6
27 3 26 1 2 30 2
Other
17 1 14 1 Number of classes indicates how many classes fall into each size category (a range of total students per class).
2015-16 School Accountability Report Card for Cesar E. Chavez Elementary School Page 11 of 12
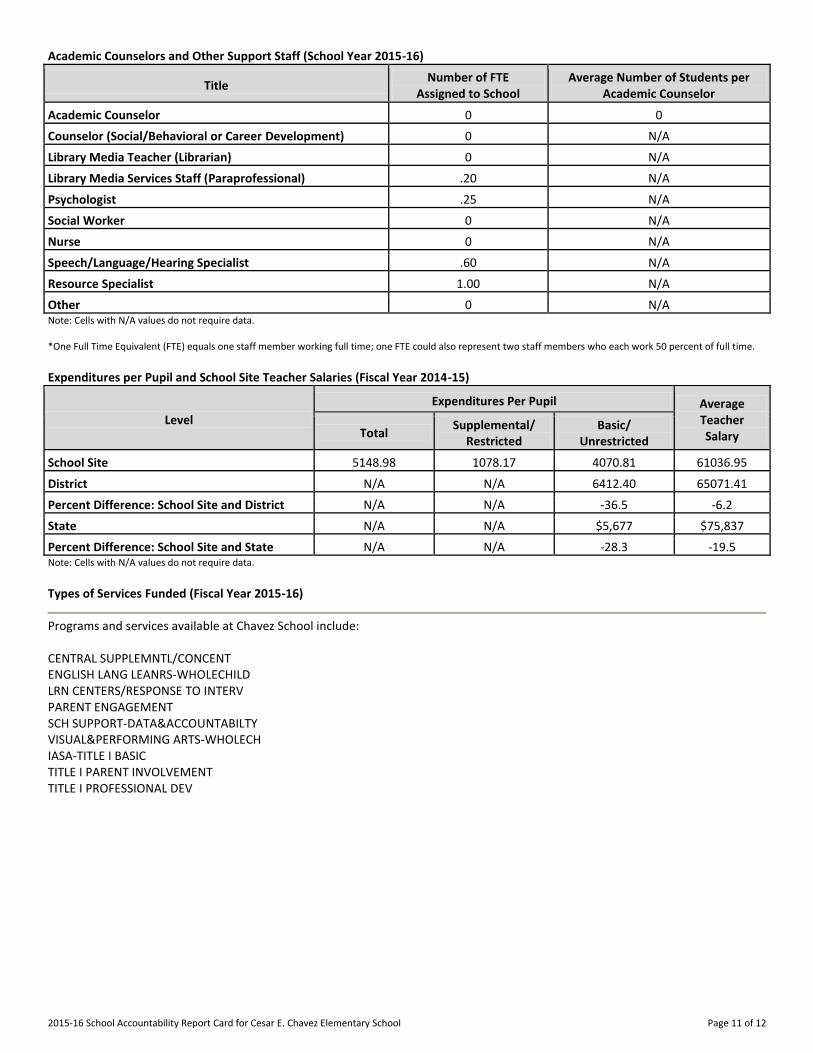
Academic Counselors and Other Support Staff (School Year 2015-16)
Title Number of FTE
Assigned to School Average Number of Students per
Academic Counselor
Academic Counselor------- 0 0
Counselor (Social/Behavioral or Career Development) 0 N/A
Library Media Teacher (Librarian) 0 N/A
Library Media Services Staff (Paraprofessional) .20 N/A
Psychologist------- .25 N/A
Social Worker------- 0 N/A
Nurse------- 0 N/A
Speech/Language/Hearing Specialist .60 N/A
Resource Specialist------- 1.00 N/A
Other------- 0 N/A Note: Cells with N/A values do not require data. *One Full Time Equivalent (FTE) equals one staff member working full time; one FTE could also represent two staff members who each work 50 percent of full time.
Expenditures per Pupil and School Site Teacher Salaries (Fiscal Year 2014-15)
Level
Expenditures Per Pupil Average Teacher Salary Total
Supplemental/ Restricted
Basic/ Unrestricted
School Site------- 5148.98 1078.17 4070.81 61036.95
District------- N/A N/A 6412.40 65071.41
Percent Difference: School Site and District N/A N/A -36.5 -6.2
State------- N/A N/A $5,677 $75,837
Percent Difference: School Site and State N/A N/A -28.3 -19.5 Note: Cells with N/A values do not require data.
Types of Services Funded (Fiscal Year 2015-16)
Programs and services available at Chavez School include: CENTRAL SUPPLEMNTL/CONCENT ENGLISH LANG LEANRS-WHOLECHILD LRN CENTERS/RESPONSE TO INTERV PARENT ENGAGEMENT SCH SUPPORT-DATA&ACCOUNTABILTY VISUAL&PERFORMING ARTS-WHOLECH IASA-TITLE I BASIC TITLE I PARENT INVOLVEMENT TITLE I PROFESSIONAL DEV
2015-16 School Accountability Report Card for Cesar E. Chavez Elementary School Page 12 of 12
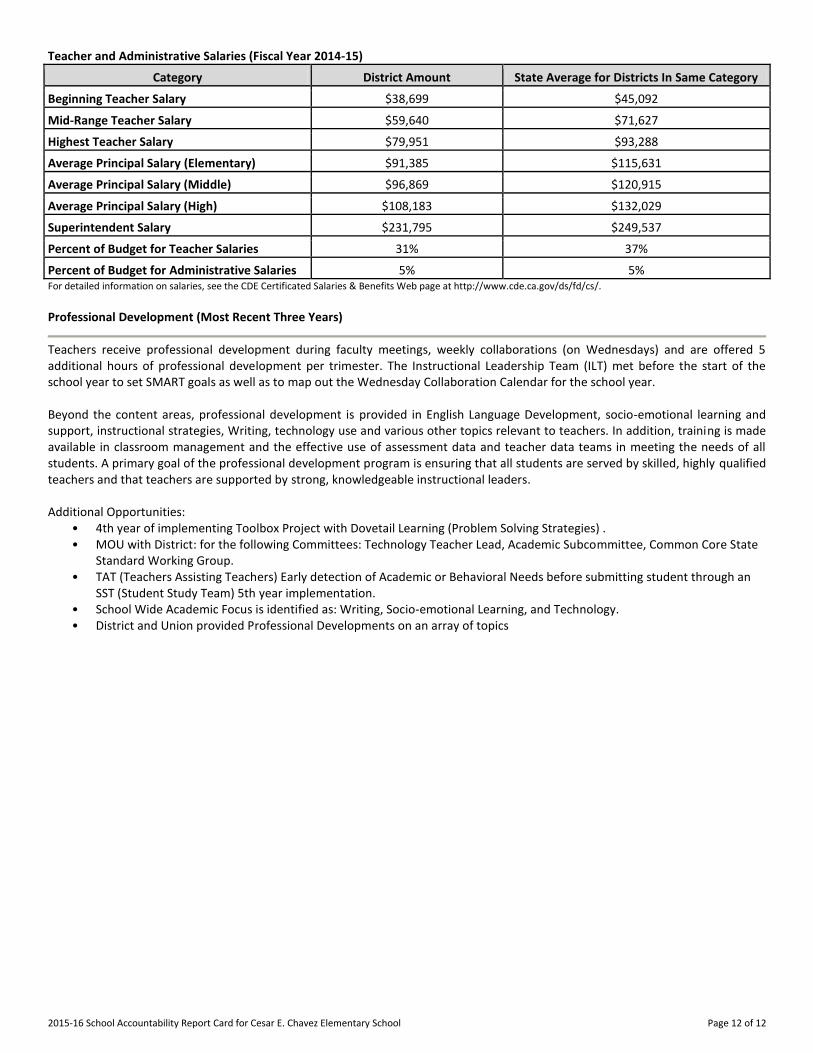
Teacher and Administrative Salaries (Fiscal Year 2014-15)
Category District Amount State Average for Districts In Same Category
Beginning Teacher Salary $38,699 $45,092
Mid-Range Teacher Salary $59,640 $71,627
Highest Teacher Salary $79,951 $93,288
Average Principal Salary (Elementary) $91,385 $115,631
Average Principal Salary (Middle) $96,869 $120,915
Average Principal Salary (High) $108,183 $132,029
Superintendent Salary $231,795 $249,537
Percent of Budget for Teacher Salaries 31% 37%
Percent of Budget for Administrative Salaries 5% 5% For detailed information on salaries, see the CDE Certificated Salaries & Benefits Web page at http://www.cde.ca.gov/ds/fd/cs/. Professional Development (Most Recent Three Years)
Teachers receive professional development during faculty meetings, weekly collaborations (on Wednesdays) and are offered 5 additional hours of professional development per trimester. The Instructional Leadership Team (ILT) met before the start of the school year to set SMART goals as well as to map out the Wednesday Collaboration Calendar for the school year. Beyond the content areas, professional development is provided in English Language Development, socio-emotional learning and support, instructional strategies, Writing, technology use and various other topics relevant to teachers. In addition, training is made available in classroom management and the effective use of assessment data and teacher data teams in meeting the needs of all students. A primary goal of the professional development program is ensuring that all students are served by skilled, highly qualified teachers and that teachers are supported by strong, knowledgeable instructional leaders. Additional Opportunities:
• 4th year of implementing Toolbox Project with Dovetail Learning (Problem Solving Strategies) . • MOU with District: for the following Committees: Technology Teacher Lead, Academic Subcommittee, Common Core State
Standard Working Group. • TAT (Teachers Assisting Teachers) Early detection of Academic or Behavioral Needs before submitting student through an
SST (Student Study Team) 5th year implementation. • School Wide Academic Focus is identified as: Writing, Socio-emotional Learning, and Technology. • District and Union provided Professional Developments on an array of topics