Embed Size (px)
Citation preview
CESIS Electronic Working Paper Series
Paper No. 98
CORPORATE GOVERNANCE AND INVESTMENTS IN SCANDINAVIA
- ownership concentration and dual-class equity structure
Johan E. Eklund
(JIBS and CESIS)
September 2007
- 1 -
Corporate Governance and Investments in Scandinavia - Ownership Concentration and Dual-Class Equity Structure
Johan E. Eklund1 2 Jönköping International Business School and the Royal Institute of Technology
P.O. Box 1026, SE-551 11 Jönköping, Sweden +46-36-101744
[email protected] Abstract Juridical-political theories suggest that legal origin (La Porta et al. (1997)) and political factors (Roe (2003)) matters for firm performance. In Scandinavia there are a number of legal practices, with common political roots, that impinge on the distribution of corporate control, which accordingly may affect firm performance. This paper examines the return on investments and the effects of ownership concentration in a large sample of listed Scandinavian firms. As a performance measure marginal q developed by Mueller and Reardon (1993) is used. Marginal q measures the marginal return on capital relative its cost of capital. This is a more appropriate measure of performance than Tobin’s average q. The question of how ownership concentration affects managerial investment decisions is examined. A Scandinavian corporate governance feature is the wide spread use of vote-differentiation. How deviations from the one-share-one-vote principle affects this ownership-performance relationship is analyzed. JEL Codes: G 30, C 23, K22, L25 Keywords: Investments, Marginal q, Corporate Governance, Ownership Concentration, Dual-Class Shares.
1 Financial support from the Ratio institute and Föreningssparbankernas forskningsstiftelse is gratefully acknowledged. 2 This paper was initiated during a six month visit to George Mason University, and subsequently benefited a great deal from valuable comments and suggestions given by a large number of people. In particular I’m grateful for comments provided by Robin H. Hansson. Furthermore I also greatly appreciate valuable discussions during seminars held at Jönköping International Business School. In particular I thank Åke E. Andersson and Agostino Manduchi for valuable insights and helpful comments.
- 2 -
1. Introduction The way in which corporations are governed has received popular attention in recent years due to
a series of corporate scandals, such as for example the so-called “Skandia scandal” in Sweden,
Paramlat in Italy or Enron in the US. These are cases where the management has misused
corporate resources and failed to serve the interests of the owners. However, the importance of
sound corporate governance institutions and practices is more fundamental, and goes deeper than
merely preventing flagrant fraud and managerial deceitfulness. A growing body of literature
shows that corporate governance has a much more profound affect on the efficiency of resource
allocation3.
In essence the corporate governance system in a country is the institutional framework that
supports the suppliers of finance to corporations and enables firms to raise substantial amounts of
capital (Shleifer and Vishny (1997)). By protecting suppliers of capital and safeguarding
property, sound governance systems facilitate mobilization and allocation of capital to useful
investments. Corporate governance systems take a central position in determining how efficient
capital is channeled to productive investments. It can be argued that the corporate governance
system in a country determines the speed of structural change and economic development by
affecting allocation and reallocation of capital. The crucial question here is therefore whether
managers of corporations are making good investments decisions or not. This paper looks at
corporate governance and the rate of return on corporate investments in Scandinavia. In particular
the structure of ownership and its effects on performance is examined.
Taking an outsider’s view of Scandinavia, the corporate governance systems in the Scandinavian
countries, Sweden, Finland, Norway and Denmark, arguably display more similarities than
differences. The countries share a number of important features that make them unison in
comparison to other countries. It has for example been hypothesized that the common origin of
the legal systems in Scandinavia is still reflected in the quality of corporate governance (La Porta
(1997)). Furthermore, Scandinavian firms are typically controlled by one single dominant owner
and only a small minority of firms is characterized by dispersed ownership structure.
3 For a review of the corporate governance literature see for example Shleifer and Vishny (1997), Morck et al. (2005) and Denis and McConnell (2003).
- 3 -
Furthermore, the Scandinavian countries can be said to have a common political orientation, with
strong social democratic traditions, which according to Roe (2003) matters for corporate
governance.
Such apparent homogeneity of the Scandinavian countries in combination with the importance of
well functioning corporate governance systems motivates a comparison of corporate returns and
ownership structure in Scandinavia. The purpose of this paper is therefore twofold: First, the
returns on investments made by the largest firms in Scandinavia are assessed. Secondly, the effect
of ownership structure on investment decisions is examined, which may be an important factor
explaining variation in performance and in returns on investments. How deviations from the one-
share-one-vote principle affect this ownership-performance relationship is analyzed.
The paper is organized in six sections. Relevant literature on investments, corporate governance
and ownership is reviewed in section two. Section three derives the method employed and
describes the data. In section four the return on corporate investments in Scandinavia are
examined and assessed. The fifth section examines how ownership and the extensive use of dual-
class shares affect investment decisions. Section six provides the conclusion.
- 4 -
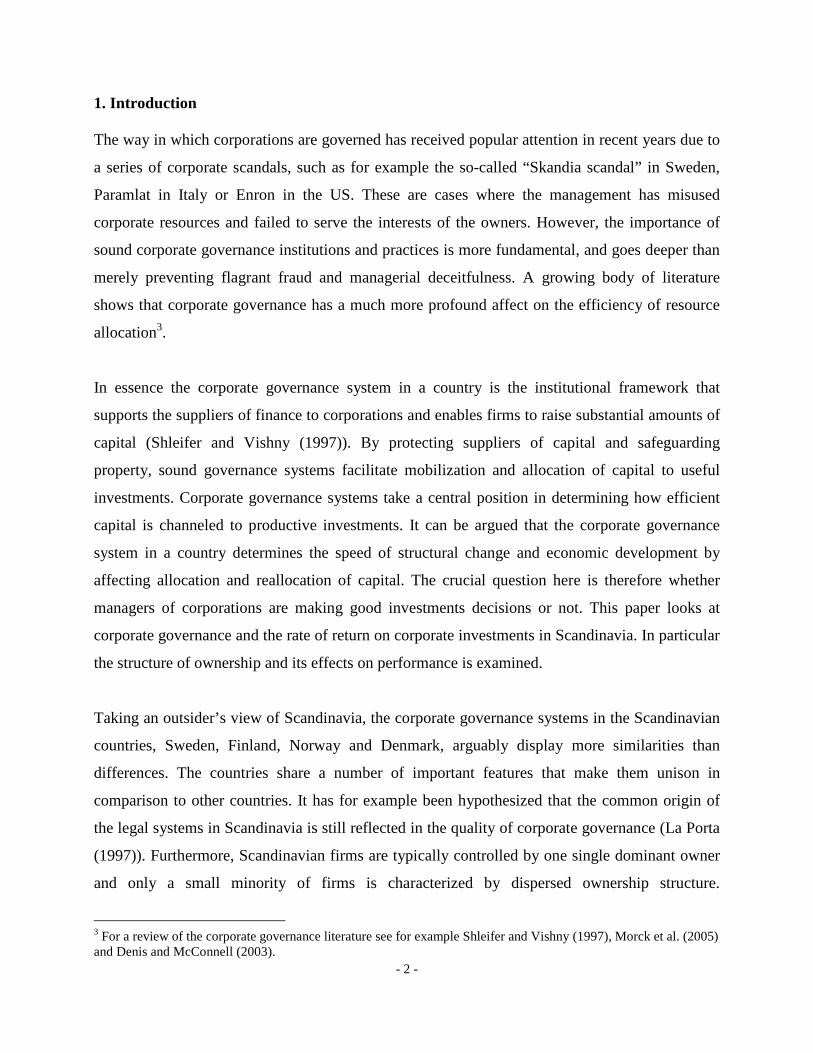
2. Corporate control and investment
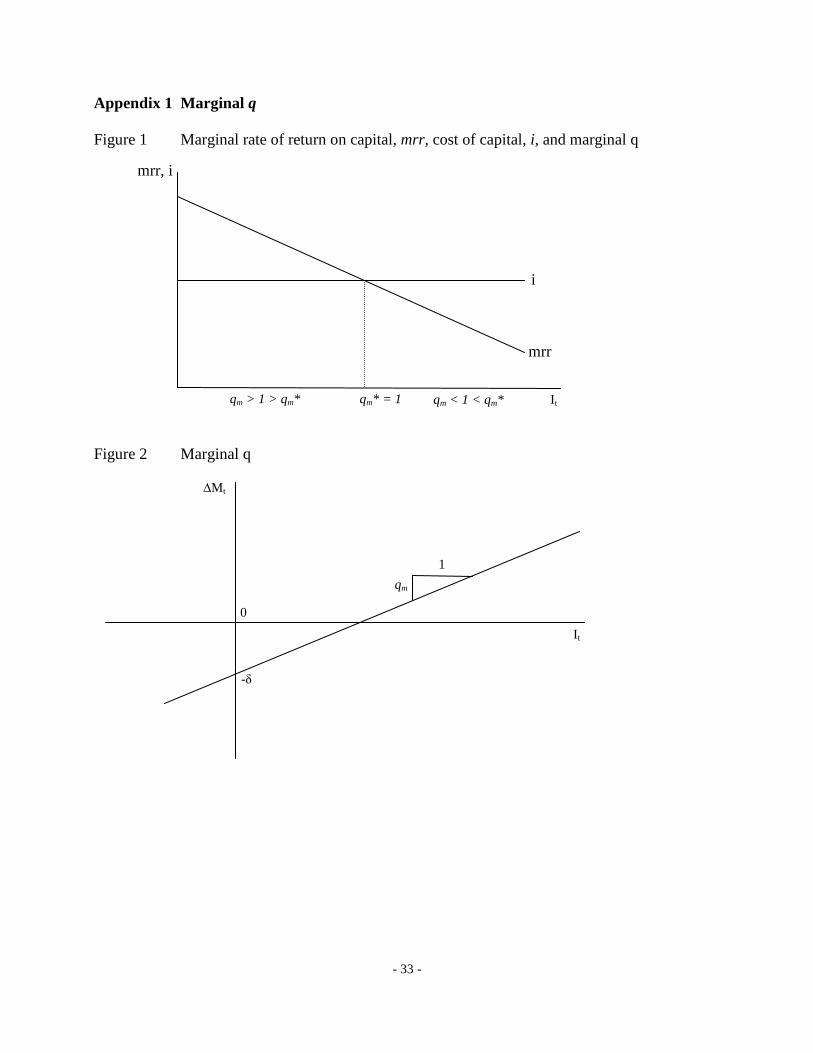
Neoclassical investment theory suggests that investments are made up to the point where the
marginal rate of return equals the opportunity cost of capital (see figure 1 in appendix 1). This
would be the case in a friction free world without any informational asymmetries or agency
problems. Capital would flow automatically to the most efficient use and thereby guarantees that
welfare is maximized. However, the rise of the modern corporation, with its separation of owners
and financiers from the management, has created a set of agency problems that can cause
investment decisions to deviate from what is expected from neoclassical models (see Mueller
(2003) for a review of investment theories).
The modern corporation emerged in the early 18th century as a tool for financing ventures that
were too large for any single investor to be able or willing to supply all the necessary capital, but
it also meant that the investors handed over most of the decision making to managers. Thus a
classical principal agent dilemma arose as a direct corollary of this partition of decision-making
process and supply of capital. This was observed already, at the very dawn of the modern
corporation, by Adam Smith, who wrote that: “The directors of such companies, however, being
the managers rather of other people’s money than of their own, cannot well be expected, that they
should watch over it with the same anxious vigilance with which the partners of a private
copartnery frequently watch over their own.” Adam Smith (1776).
In the absence of agency problems, investment decisions and firm performance should be
expected to be independent from the structure and concentration of ownership. However, if
agency problems can be attributed to the fact that firms are incorporated one should no longer
expect firm value and investment decisions to be independent from ownership structure and
concentration. Among the first to call attention to the potential agency costs4 were Berle & Means
(1932). They argued that corporate ownership would become dispersed up to a point where
professional managers would become unaccountable to the shareholders. Later, Jensen &
Meckling (1976) provide a more theoretical underpinning to the linkages between agency costs
4 Agency costs are costs that arise from the principal-agent problem, i.e. divergence of managerial objectives from the objectives of shareholders.
- 5 -
and ownership structure. Jensen and Meckling analyse how the interests of utility maximizing
owner-managers and minority shareholders diverge as ownership structure becomes more
dispersed. Their basic argument is that the owner-manager will not bear the full cost of on-the-
job-consumption5. Potential minority investors will realize this and subsequently the share price
will reflect the divergence of interest between owner-managers and minority shareholders.
Arguably the conflict of interests becomes more severe as owner-managers equity stake
decreases. They argue that investors with high stakes will also have strong incentives to
maximize firm value. This is referred to as the incentive effect. Hypothesis one is therefore:
H1: Ownership concentration will reduce agency conflicts and thereby improve
investment performance.
In this view agency costs increase as ownership is diluted and becomes dispersed. However, not
all have seen the separation of ownership and control as a potential problem, where the counter
hypothesis is that control and ownership separation may improve allocate efficiency. Thorstein
Veblen (1921), for example, argues that this separation would lead to that the control would be
turned over from “monopoly” seeking owners/businessmen to growth and efficiency seeking
management. Veblen claims for example that if “(…) industry were completely organized as a
systemic whole, and were then managed by competent technicians with an eye single to maximum
production of goods and services; instead of, as now, being manhandled by ignorant business
men with an eye single to maximum profits; the resulting output of goods and services would
doubtless exceed the current output by several hundred per cent.” (Veblen (1921)
Recognizing that owner-managers are also guided by utility maximization and not pure profit
maximization, Demsetz (1983) argues that it is not clear that diffusion of ownership
automatically will have a detrimental effect. In fact, it has been argued that as the stake of owner-
managers increase, so does their ability to misallocate resources also increase. This effect is
referred to as the entrenchment effect. Expecting entrenchment effects leads to the second
hypothesis.
5 Jensen and Meckling (1976) also point out that the most serious problem of not having equity claims is probably that the incentive to seek new profitable investment opportunities and engage in innovative efforts will fall.
- 6 -
H2: Ownership concentration will be associated with both positive incentive effects
and negative entrenchment effect and ownership will as a consequence have a
non-liner effect on performance.
The generality of Berle and Means observation can however be empirically questioned. Looking
at ownership structure around the world most corporations have concentrated ownership and are
controlled by families (Morck et al. (2005) and La Porta et al. (1999)).
Faccio and Lang (2002) study the ownership in Europe and find that corporations are
predominantly controlled by families in continental Europe. This control is achieved without
corresponding capital through using primarily three different control mechanisms: vote-
differentiation of shares, pyramid ownership and cross-holdings. This means that the division of
what Berle and Means (1932) call “nominal ownership” and the corporate control is further
enhanced by separating the capital stake and voting power, making it possible for a small group
of investors, often the founding family, to maintain the control of the firm.
Bebchuk et al. (1999) find that these control mechanisms distort the incentives of the controlling
owners and therefore potentially may cause a sharp increase in agency costs. When the incentives
are distorted this may potentially have a negative impact on the optimal choice of investments,
scope of the firm and transferal of control. Separation of control rights and cash-flow right not
only alters the control structure of the corporation but also changes the incentives of owner-
managers. An effect one can expect from the separation of cash-flow and control rights is that the
positive incentive effect will be weakened whereas the entrenchment effect will be enhanced.
From this hypothesis three follows:
H3: Control-mechanisms, such as dual-class equity structure, will through separation
of control and cash-flow rights alter the incentives of controlling owners, and as a
consequence the incentive effect will be weekend and the entrenchment effect will
be enhanced.
- 7 -
A large number of studies also establish a link between ownership structure and concentration on
the one hand and performance on the other. Countries with weaker investor protection tend to
have more concentrated ownership structure (see for example La Porta et al. (1997)). In fact the
two most common ways of dealing with the agency aspects of corporate governance are,
according to Shleifer and Vishny (1997), first legal and regulatory protection of investor and
minority rights, and secondly large and concentrated owners. Outright expropriation of corporate
assets and investor funds by managers is likely to be small in developed economies such as the
Scandinavian ones. Overinvestment in pursuit of other ends than profit maximization and
misallocation of assets is more likely to be a problem.
2.1 Corporate Governance in Scandinavia
The corporate governance systems in Scandinavia have some unique features that changes the
prediction of the Jensen and Meckling model. Like most firms in continental Europe the
Scandinavian firms very often controlling owners that have maintained their control even as their
capital stake has declined and the firms have grown. Most European countries allow for at least
one of the three principal instruments for control ownership: cross-holdings, pyramid ownership
and vote-differentiation (Söderström et al. (2003)).
In particular the extensive use of vote differentiated shares has a substantial impact on the way in
which the ownership structure has evolved in Scandinavia. In Norway about 14 percent of listed
firms use dual-class shares, in Denmark and Finland more than 30 percent and in Sweden it is as
high as 55 percent (Bøhren and Ødegaard (2005) and Söderström et al. (2003)). Many countries
in Europe do not allow for dual-class share systems so this is one of the prominent distinguishing
features of the corporate governance systems in Scandinavia. In Scandinavia the frequent use of
dual-class shares with strong separation of voting rights and equity claims have produced very
strong and stable ownership structures. By using vote-differentiation the founding families may
retain control of firms even with a very small equity share. Most firms in Scandinavia have one
single controlling owner and very few firms are characterized by dispersed ownership. For a
sample of 4096 European firms Bennedsen and Nielsen (2005) report significant differences in
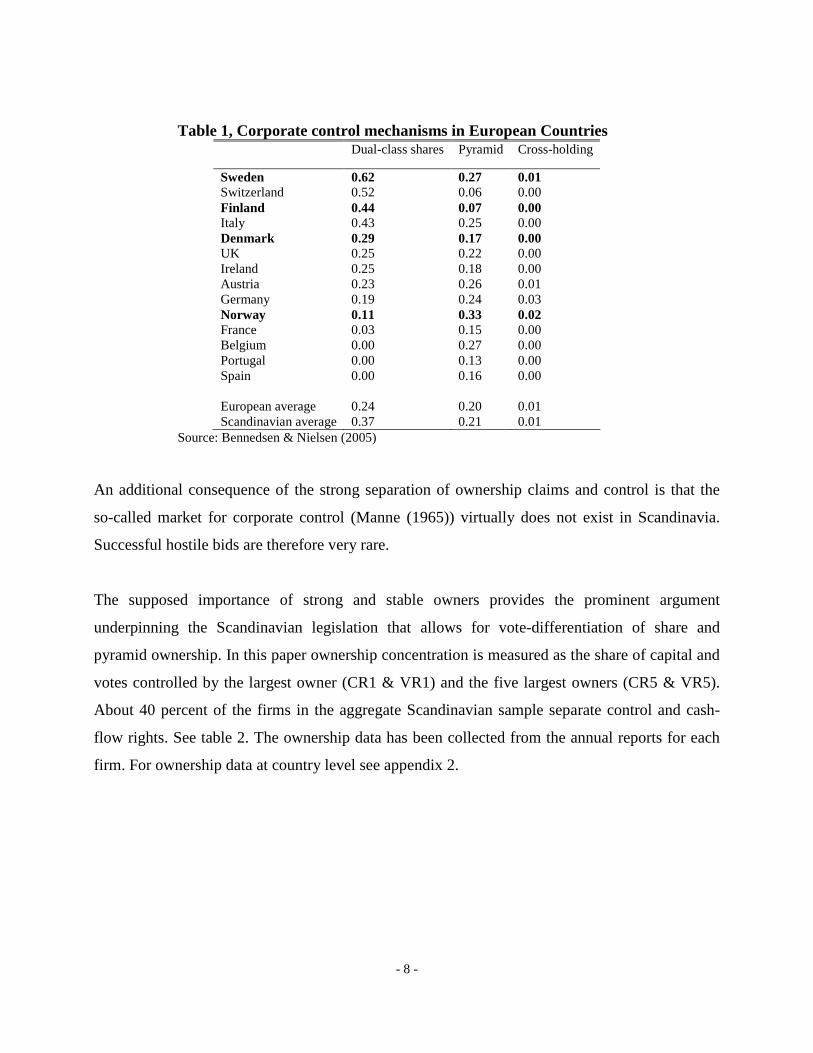
the frequency that control mechanisms are used (see table 1).
- 8 -
Table 1, Corporate control mechanisms in European Countries Dual-class shares Pyramid Cross-holding
Sweden 0.62 0.27 0.01 Switzerland 0.52 0.06 0.00 Finland 0.44 0.07 0.00 Italy 0.43 0.25 0.00 Denmark 0.29 0.17 0.00 UK 0.25 0.22 0.00 Ireland 0.25 0.18 0.00 Austria 0.23 0.26 0.01 Germany 0.19 0.24 0.03 Norway 0.11 0.33 0.02 France 0.03 0.15 0.00 Belgium 0.00 0.27 0.00 Portugal 0.00 0.13 0.00 Spain 0.00 0.16 0.00 European average 0.24 0.20 0.01 Scandinavian average 0.37 0.21 0.01
Source: Bennedsen & Nielsen (2005)
An additional consequence of the strong separation of ownership claims and control is that the
so-called market for corporate control (Manne (1965)) virtually does not exist in Scandinavia.
Successful hostile bids are therefore very rare.
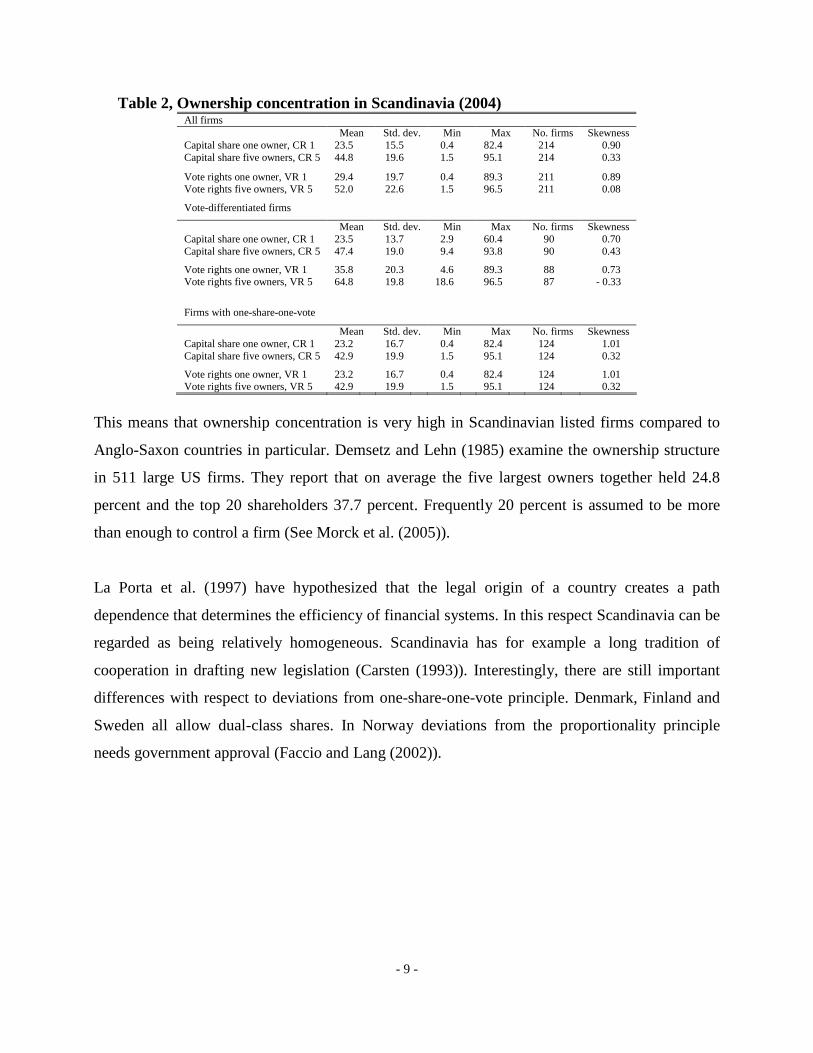
The supposed importance of strong and stable owners provides the prominent argument
underpinning the Scandinavian legislation that allows for vote-differentiation of share and
pyramid ownership. In this paper ownership concentration is measured as the share of capital and
votes controlled by the largest owner (CR1 & VR1) and the five largest owners (CR5 & VR5).
About 40 percent of the firms in the aggregate Scandinavian sample separate control and cash-
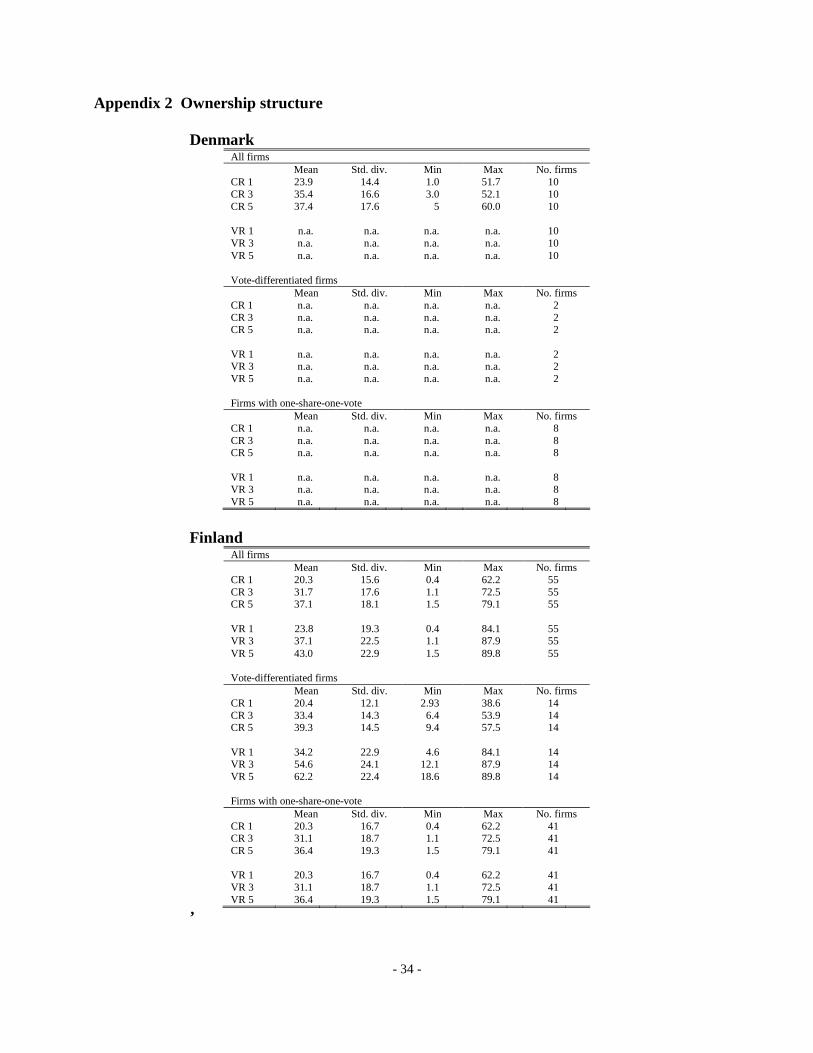
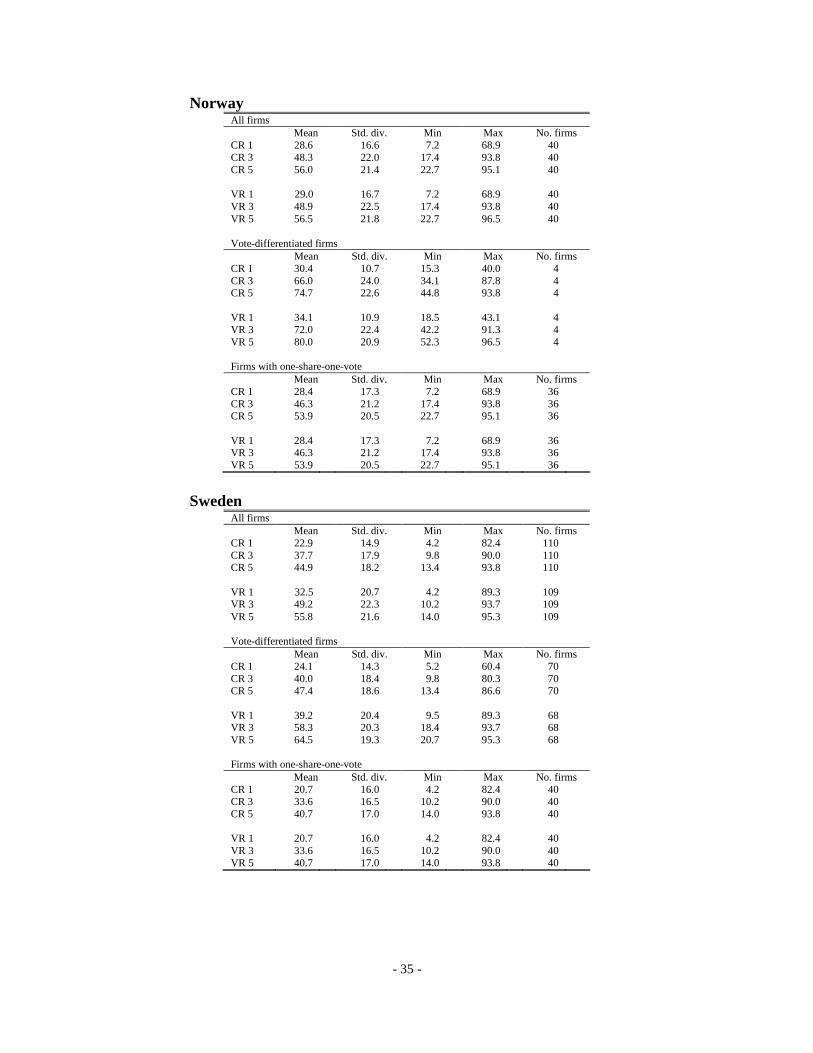
flow rights. See table 2. The ownership data has been collected from the annual reports for each
firm. For ownership data at country level see appendix 2.
- 9 -
Table 2, Ownership concentration in Scandinavia (2004) All firms Mean Std. dev. Min Max No. firms Skewness Capital share one owner, CR 1 23.5 15.5 0.4 82.4 214 0.90 Capital share five owners, CR 5 44.8 19.6 1.5 95.1 214 0.33
Vote rights one owner, VR 1 29.4 19.7 0.4 89.3 211 0.89 Vote rights five owners, VR 5 52.0 22.6 1.5 96.5 211 0.08
Vote-differentiated firms
Mean Std. dev. Min Max No. firms Skewness Capital share one owner, CR 1 23.5 13.7 2.9 60.4 90 0.70 Capital share five owners, CR 5 47.4 19.0 9.4 93.8 90 0.43
Vote rights one owner, VR 1 35.8 20.3 4.6 89.3 88 0.73 Vote rights five owners, VR 5 64.8 19.8 18.6 96.5 87 - 0.33
Firms with one-share-one-vote
Mean Std. dev. Min Max No. firms Skewness Capital share one owner, CR 1 23.2 16.7 0.4 82.4 124 1.01 Capital share five owners, CR 5 42.9 19.9 1.5 95.1 124 0.32
Vote rights one owner, VR 1 23.2 16.7 0.4 82.4 124 1.01 Vote rights five owners, VR 5 42.9 19.9 1.5 95.1 124 0.32
This means that ownership concentration is very high in Scandinavian listed firms compared to
Anglo-Saxon countries in particular. Demsetz and Lehn (1985) examine the ownership structure
in 511 large US firms. They report that on average the five largest owners together held 24.8
percent and the top 20 shareholders 37.7 percent. Frequently 20 percent is assumed to be more
than enough to control a firm (See Morck et al. (2005)).
La Porta et al. (1997) have hypothesized that the legal origin of a country creates a path
dependence that determines the efficiency of financial systems. In this respect Scandinavia can be
regarded as being relatively homogeneous. Scandinavia has for example a long tradition of
cooperation in drafting new legislation (Carsten (1993)). Interestingly, there are still important
differences with respect to deviations from one-share-one-vote principle. Denmark, Finland and
Sweden all allow dual-class shares. In Norway deviations from the proportionality principle
needs government approval (Faccio and Lang (2002)).
- 10 -
3. Methodology
This paper applies a method to appraise the rate of return on investments developed by Mueller
and Reardon (1993), which essentially is a marginal version of Tobin’s q. Tobin’s q is defined as
the market value of a firm over the replacement cost of its assets, which translates to the averages
return on total assets. The marginal version of Tobin’s q, on the other hand, measures the return
on investments, or the marginal return on capital (Mueller (2003)). It is thus a measure of what
Tobin (1982) calls the “functional form” of stock market efficiency6. Marginal q is also a more
appropriate measure of performance since average q for example contains infra-marginal returns7.
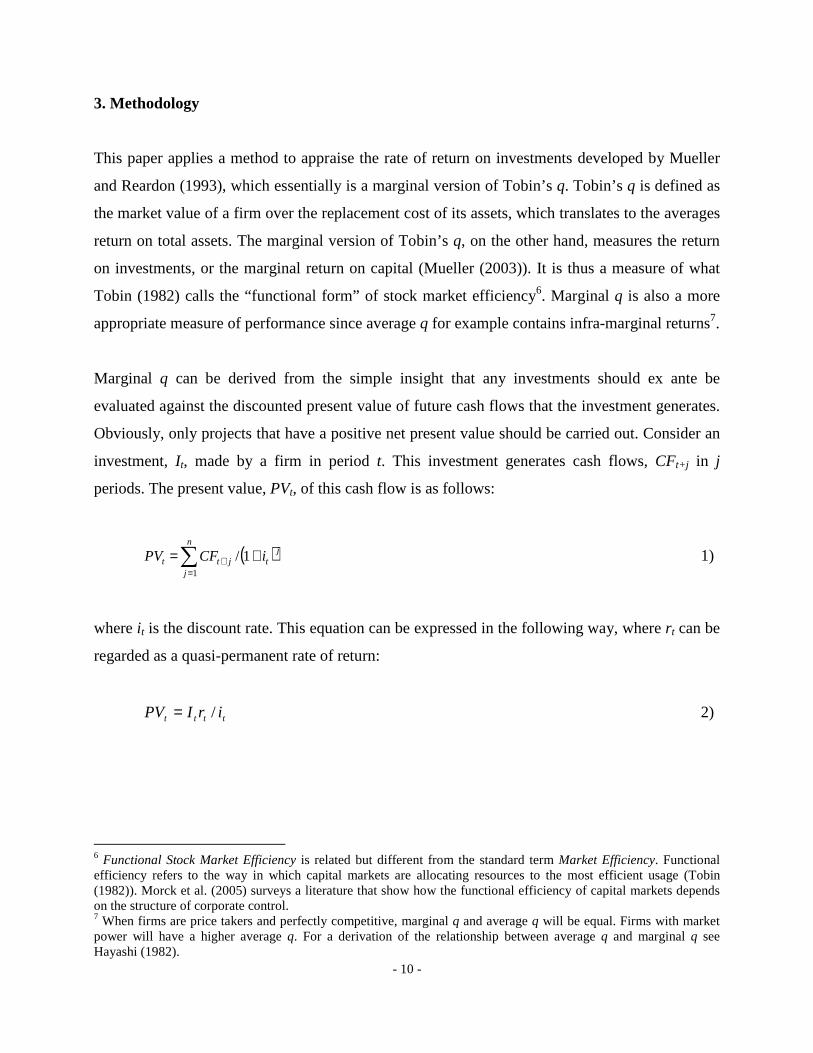
Marginal q can be derived from the simple insight that any investments should ex ante be
evaluated against the discounted present value of future cash flows that the investment generates.
Obviously, only projects that have a positive net present value should be carried out. Consider an
investment, It, made by a firm in period t. This investment generates cash flows, CFt+j in j
periods. The present value, PVt, of this cash flow is as follows:
( )∑=
+ +=n
j
jtjtt iCFPV
1
1/ 1)
where i t is the discount rate. This equation can be expressed in the following way, where rt can be
regarded as a quasi-permanent rate of return:
tttt irIPV /= 2)
6 Functional Stock Market Efficiency is related but different from the standard term Market Efficiency. Functional efficiency refers to the way in which capital markets are allocating resources to the most efficient usage (Tobin (1982)). Morck et al. (2005) surveys a literature that show how the functional efficiency of capital markets depends on the structure of corporate control. 7 When firms are price takers and perfectly competitive, marginal q and average q will be equal. Firms with market power will have a higher average q. For a derivation of the relationship between average q and marginal q see Hayashi (1982).
- 11 -
For investments to be efficient from a shareholder perspective the investment being considered
must generate future cash flows that, discounted to present value, equals or exceeds the
investment cost.
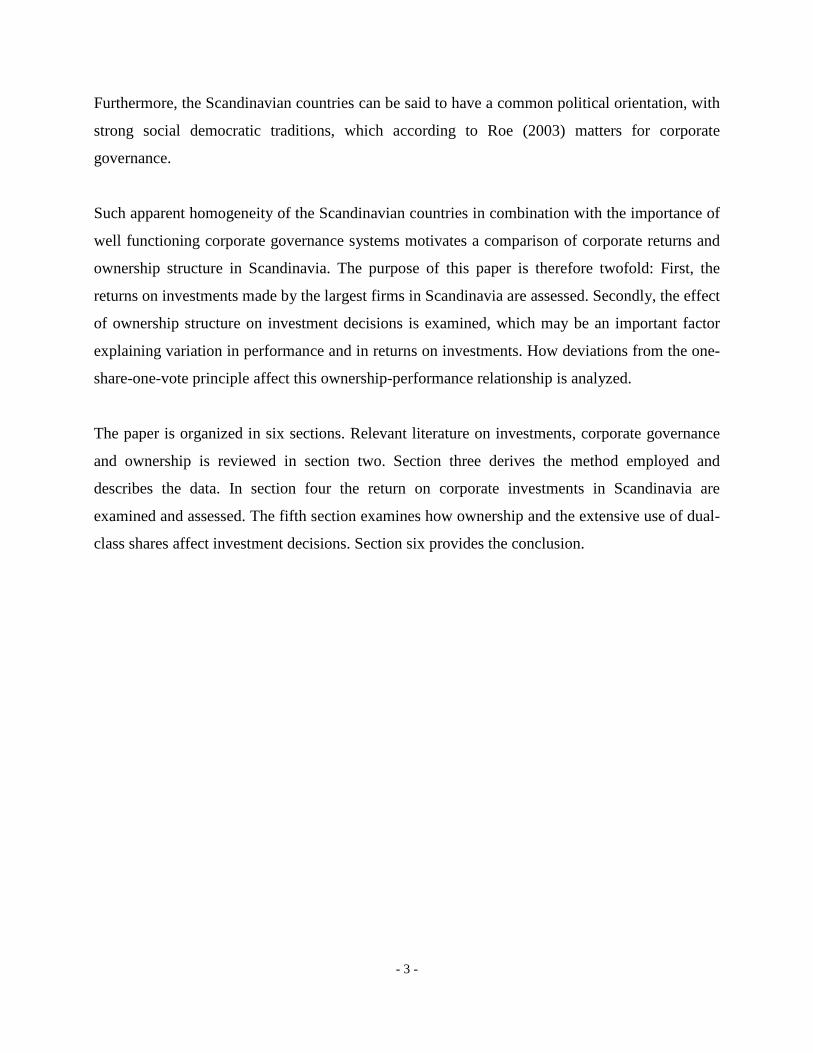
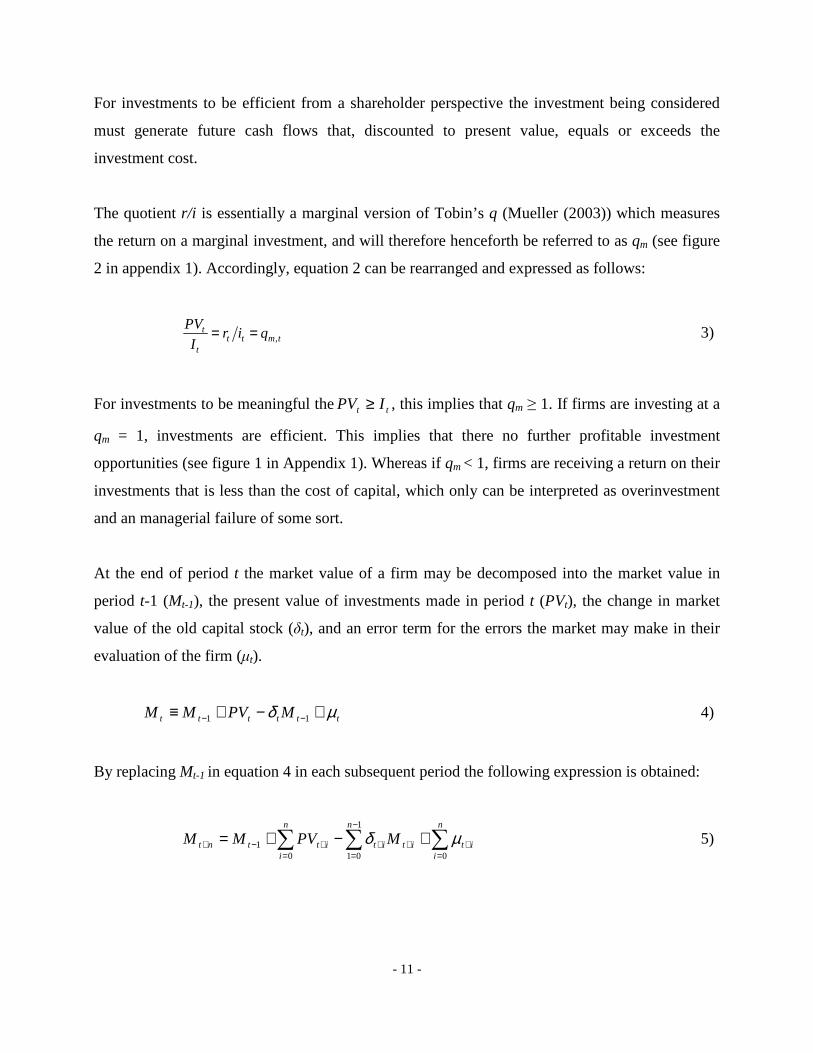
The quotient r/i is essentially a marginal version of Tobin’s q (Mueller (2003)) which measures
the return on a marginal investment, and will therefore henceforth be referred to as qm (see figure
2 in appendix 1). Accordingly, equation 2 can be rearranged and expressed as follows:
tmttt
t qirI
PV,== 3)
For investments to be meaningful the tt IPV ≥ , this implies that qm ≥ 1. If firms are investing at a
qm = 1, investments are efficient. This implies that there no further profitable investment
opportunities (see figure 1 in Appendix 1). Whereas if qm < 1, firms are receiving a return on their
investments that is less than the cost of capital, which only can be interpreted as overinvestment
and an managerial failure of some sort.
At the end of period t the market value of a firm may be decomposed into the market value in
period t-1 (Mt-1), the present value of investments made in period t (PVt), the change in market
value of the old capital stock (δt), and an error term for the errors the market may make in their
evaluation of the firm (µt).
tttttt MPVMM µδ +−+≡ −− 11 4)
By replacing Mt-1 in equation 4 in each subsequent period the following expression is obtained:
∑∑∑=
+
−
=++
=+−+ +−+=
n
iit
n
itit
n
iittnt MPVMM
0
1
0101 µδ 5)
- 12 -
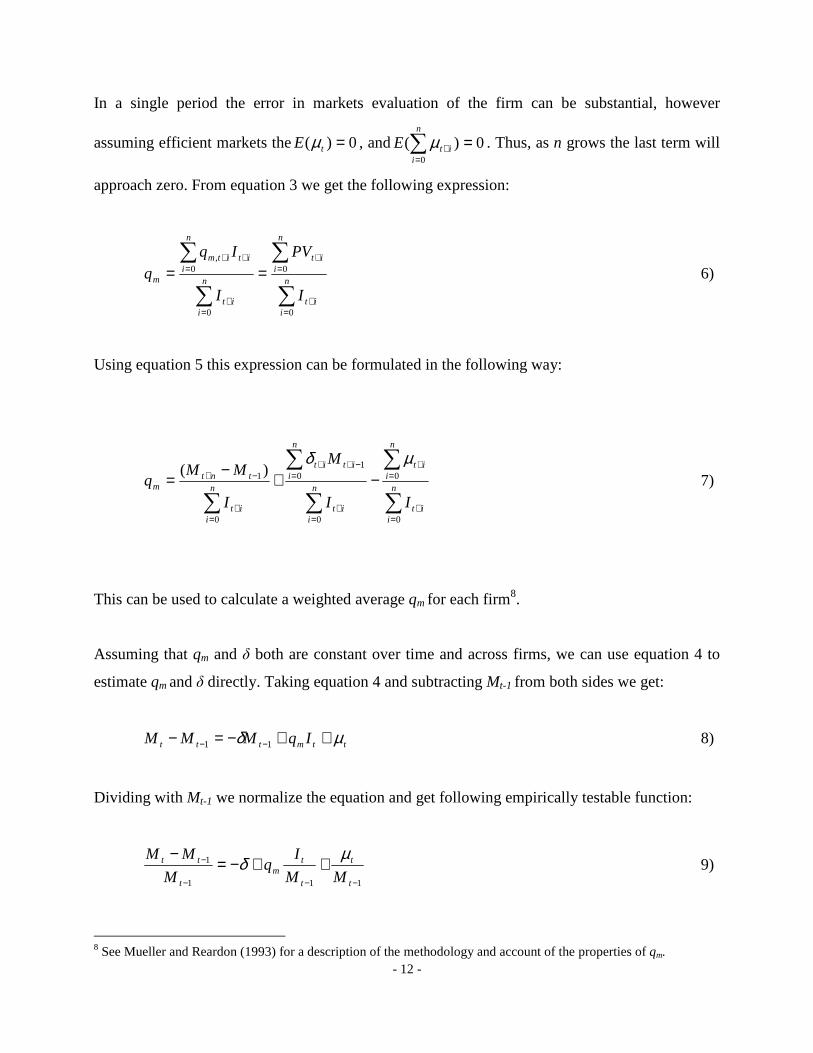
In a single period the error in markets evaluation of the firm can be substantial, however
assuming efficient markets the 0)( =tE µ , and 0)(0
=∑=
+
n
iitE µ . Thus, as n grows the last term will
approach zero. From equation 3 we get the following expression:
∑
∑
∑
∑
=+
=+
=+
=++
==n
iit
n
iit
n
iit
n
iititm
m
I
PV
I
Iqq
0
0
0
0,
6)
Using equation 5 this expression can be formulated in the following way:
∑
∑
∑
∑
∑=
+
=+
=+
=−++
=+
−+ −+−
=n
iit
n
iit
n
iit
n
iitit
n
iit
tntm
II
M
I
MMq
0
0
0
01
0
1)(µδ
7)
This can be used to calculate a weighted average qm for each firm8.
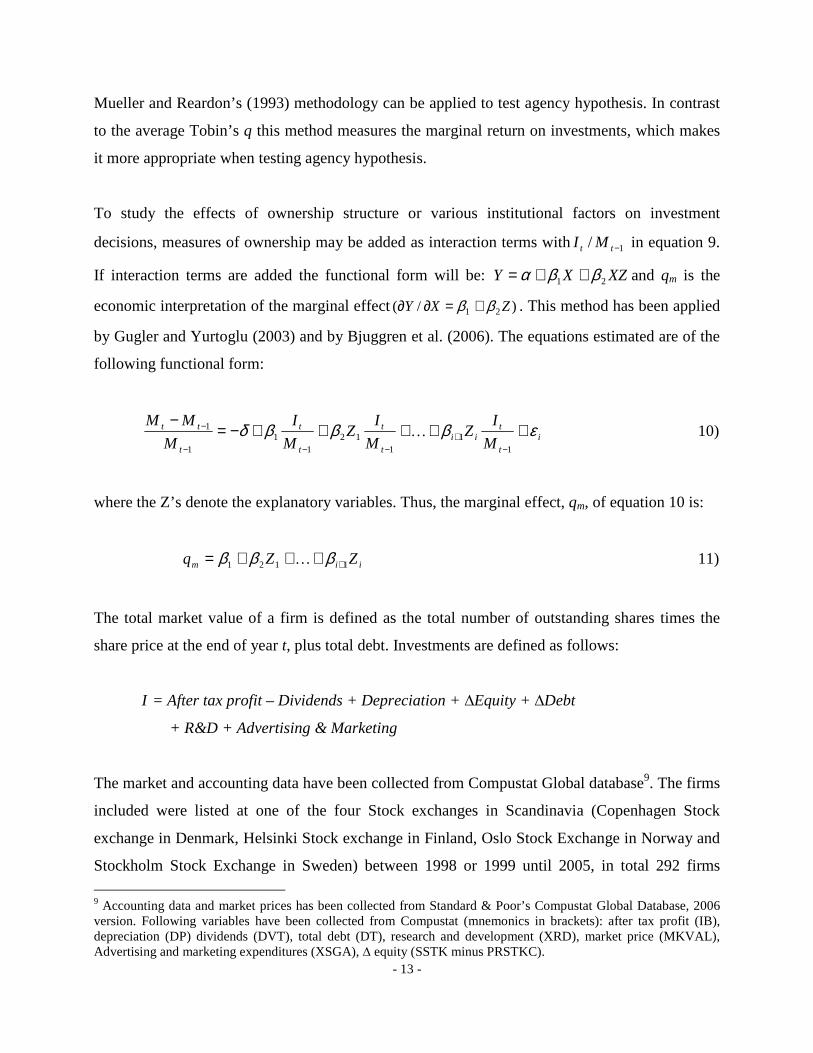
Assuming that qm and δ both are constant over time and across firms, we can use equation 4 to
estimate qm and δ directly. Taking equation 4 and subtracting Mt-1 from both sides we get:
ttmttt IqMMM µδ ++−=− −− 11 8)
Dividing with Mt-1 we normalize the equation and get following empirically testable function:
111
1
−−−
− ++−=−
t
t
t
tm
t
tt
MM
Iq
M
MM µδ 9)
8 See Mueller and Reardon (1993) for a description of the methodology and account of the properties of qm.
- 13 -
Mueller and Reardon’s (1993) methodology can be applied to test agency hypothesis. In contrast
to the average Tobin’s q this method measures the marginal return on investments, which makes
it more appropriate when testing agency hypothesis.
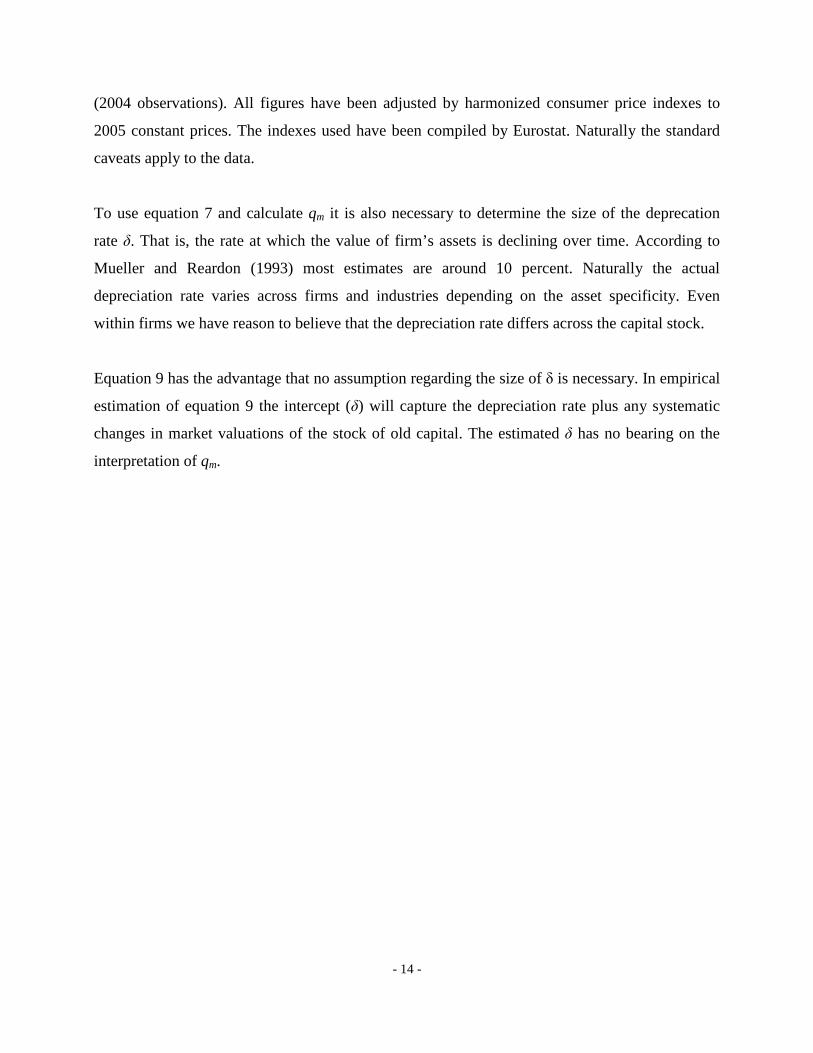
To study the effects of ownership structure or various institutional factors on investment
decisions, measures of ownership may be added as interaction terms with 1/ −tt MI in equation 9.
If interaction terms are added the functional form will be: XZXY 21 ββα ++= and qm is the
economic interpretation of the marginal effect )/( 21 ZXY ββ +=∂∂ . This method has been applied
by Gugler and Yurtoglu (2003) and by Bjuggren et al. (2006). The equations estimated are of the
following functional form:
it
tii
t
t
t
t
t
tt
M
IZ
M
IZ
M
I
M
MM εβββδ +++++−=−
−+
−−−
−
11
112
11
1
1K 10)
where the Z’s denote the explanatory variables. Thus, the marginal effect, qm, of equation 10 is:
iim ZZq 1121 ++++= βββ K 11)
The total market value of a firm is defined as the total number of outstanding shares times the
share price at the end of year t, plus total debt. Investments are defined as follows:
I = After tax profit – Dividends + Depreciation + ∆Equity + ∆Debt
+ R&D + Advertising & Marketing
The market and accounting data have been collected from Compustat Global database9. The firms
included were listed at one of the four Stock exchanges in Scandinavia (Copenhagen Stock
exchange in Denmark, Helsinki Stock exchange in Finland, Oslo Stock Exchange in Norway and
Stockholm Stock Exchange in Sweden) between 1998 or 1999 until 2005, in total 292 firms
9 Accounting data and market prices has been collected from Standard & Poor’s Compustat Global Database, 2006 version. Following variables have been collected from Compustat (mnemonics in brackets): after tax profit (IB), depreciation (DP) dividends (DVT), total debt (DT), research and development (XRD), market price (MKVAL), Advertising and marketing expenditures (XSGA), ∆ equity (SSTK minus PRSTKC).
- 14 -
(2004 observations). All figures have been adjusted by harmonized consumer price indexes to
2005 constant prices. The indexes used have been compiled by Eurostat. Naturally the standard
caveats apply to the data.
To use equation 7 and calculate qm it is also necessary to determine the size of the deprecation
rate δ. That is, the rate at which the value of firm’s assets is declining over time. According to
Mueller and Reardon (1993) most estimates are around 10 percent. Naturally the actual
depreciation rate varies across firms and industries depending on the asset specificity. Even
within firms we have reason to believe that the depreciation rate differs across the capital stock.
Equation 9 has the advantage that no assumption regarding the size of δ is necessary. In empirical
estimation of equation 9 the intercept (δ) will capture the depreciation rate plus any systematic
changes in market valuations of the stock of old capital. The estimated δ has no bearing on the
interpretation of qm.
- 15 -
4. Corporate Return in Scandinavia
This study covers 292 large Scandinavian firms that are listed at one of the four stock exchanges.
This make up about 40 percent of all listed firms. In 2004 the top 100 of these 292 firms (25
largest in each country) accounted for approximately 42 percent of the total stock market
capitalization (33 percent of GDP)10. The firms approximately follow a rank-size distribution
where the second largest firm is about half the size of the largest11.
For Scandinavia the estimated average marginal q, excluding the upper 95 percentile and the
lower 5 percentile, is 1.19. This means that during the period 1999 until 2005 the Scandinavian
firms had an average return on investments that was 19 percent above the cost of capital.
However the median qm is 1.03, which implies a return that is 3 percent above cost of capital.
Neither the average qm nor the median qm give any reason to believe that Scandinavian firms are
under performing. This is based on the assumption that the depreciation rate was 5 percent per
annum. Equation 7 is sensitive to the choice of depreciation rate. Consequently, a more rapid
deprecation will translate into a higher qm, all else equal.
Investments as defined in this paper can be negative. This will be the case if a firm is making
losses that are larger in absolute terms than new equity and debt. It is neither meaningful to ask
what the returns on investment are if investments are negative, nor does equation 7 make any
sense when investments are negative or equal to zero. Accordingly some firms have been
excluded from table 3.
10 In 2004 there were a total of 796 listed firms in Scandinavia (194 in Denmark, 143 in Finland, 177 in Norway and 282 in Sweden). 11 The formula iMM i /1= , where 1M is the largest firm and i the firm rank, approximates the size distribution of
the firms in the sample.
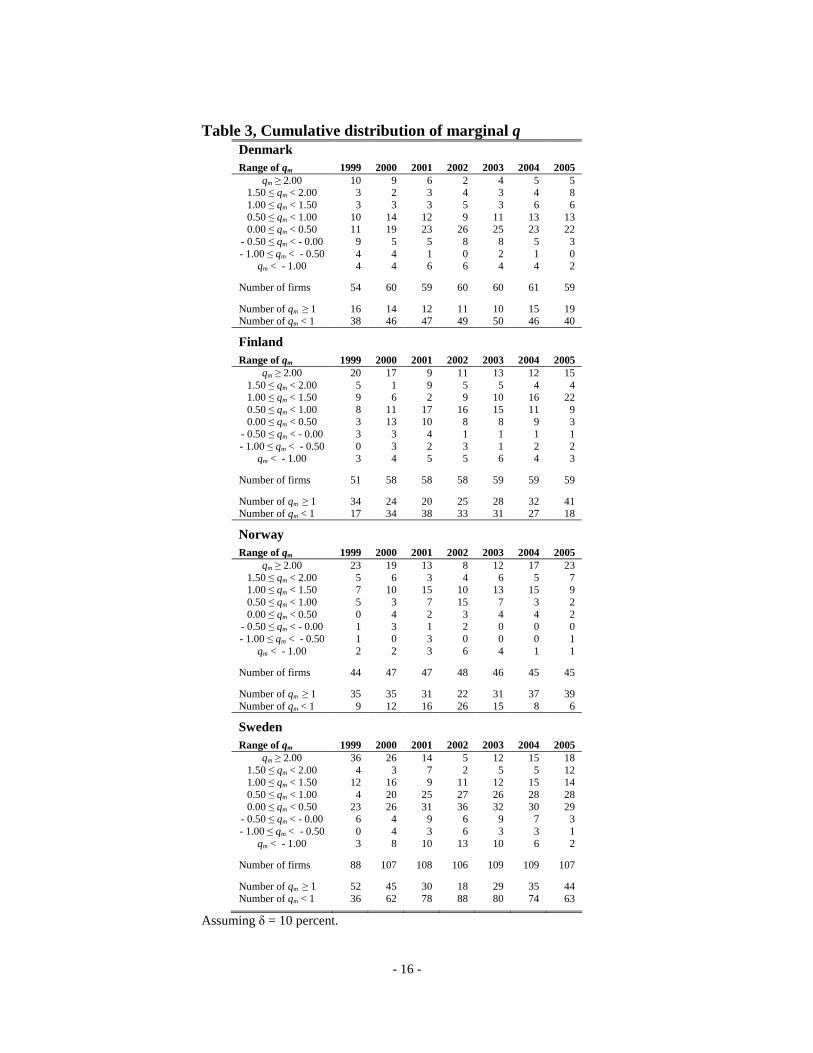
- 16 -
Table 3, Cumulative distribution of marginal q Denmark
Range of qm
1999
2000
2001
2002
2003
2004
2005 qm ≥ 2.00 10 9 6 2 4 5 5
1.50 ≤ qm < 2.00 3 2 3 4 3 4 8 1.00 ≤ qm < 1.50 3 3 3 5 3 6 6 0.50 ≤ qm < 1.00 10 14 12 9 11 13 13 0.00 ≤ qm < 0.50 11 19 23 26 25 23 22
- 0.50 ≤ qm < - 0.00 9 5 5 8 8 5 3 - 1.00 ≤ qm < - 0.50 4 4 1 0 2 1 0
qm < - 1.00 4 4 6 6 4 4 2
Number of firms 54 60 59 60 60 61 59
Number of qm ≥ 1 16 14 12 11 10 15 19 Number of qm < 1 38 46 47 49 50 46 40
Finland
Range of qm
1999
2000
2001
2002
2003
2004
2005 qm ≥ 2.00 20 17 9 11 13 12 15
1.50 ≤ qm < 2.00 5 1 9 5 5 4 4 1.00 ≤ qm < 1.50 9 6 2 9 10 16 22 0.50 ≤ qm < 1.00 8 11 17 16 15 11 9 0.00 ≤ qm < 0.50 3 13 10 8 8 9 3
- 0.50 ≤ qm < - 0.00 3 3 4 1 1 1 1 - 1.00 ≤ qm < - 0.50 0 3 2 3 1 2 2
qm < - 1.00 3 4 5 5 6 4 3
Number of firms 51 58 58 58 59 59 59
Number of qm ≥ 1 34 24 20 25 28 32 41 Number of qm < 1 17 34 38 33 31 27 18
Norway
Range of qm
1999
2000
2001
2002
2003
2004
2005 qm ≥ 2.00 23 19 13 8 12 17 23
1.50 ≤ qm < 2.00 5 6 3 4 6 5 7 1.00 ≤ qm < 1.50 7 10 15 10 13 15 9 0.50 ≤ qm < 1.00 5 3 7 15 7 3 2 0.00 ≤ qm < 0.50 0 4 2 3 4 4 2
- 0.50 ≤ qm < - 0.00 1 3 1 2 0 0 0 - 1.00 ≤ qm < - 0.50 1 0 3 0 0 0 1
qm < - 1.00 2 2 3 6 4 1 1
Number of firms 44 47 47 48 46 45 45
Number of qm ≥ 1 35 35 31 22 31 37 39 Number of qm < 1 9 12 16 26 15 8 6
Sweden
Range of qm
1999
2000
2001
2002
2003
2004
2005 qm ≥ 2.00 36 26 14 5 12 15 18
1.50 ≤ qm < 2.00 4 3 7 2 5 5 12 1.00 ≤ qm < 1.50 12 16 9 11 12 15 14 0.50 ≤ qm < 1.00 4 20 25 27 26 28 28 0.00 ≤ qm < 0.50 23 26 31 36 32 30 29
- 0.50 ≤ qm < - 0.00 6 4 9 6 9 7 3 - 1.00 ≤ qm < - 0.50 0 4 3 6 3 3 1
qm < - 1.00 3 8 10 13 10 6 2
Number of firms 88 107 108 106 109 109 107
Number of qm ≥ 1 52 45 30 18 29 35 44 Number of qm < 1 36 62 78 88 80 74 63
Assuming δ = 10 percent.
- 17 -
As can be seen from table 3, returns on investments are approximately normally distributed
around a mean of one in all of the four Scandinavian countries, except Norway. As the estimated
qm’s are cumulated over 1999 to 2005 the distribution seems to become more centered around
one.
A few of these are extreme values that distort the average qm across firms. These are typically
smaller firms that for some reason either have very high return on invested capital or a massive
loss in market value. There are several plausible explanations for these extreme values. For
example firms may introduce radical innovations that do not require any substantial investments,
but nevertheless substantially increase firm value. For this reason the average qm is also
calculated excluding 5 percent in both ends of the distribution.
Dropping 5 percent in both ends of the distribution, the average qm for Denmark is 0.76, 1.27 for
Finland, 1.83 for Norway and 1.11 for Sweden. The median qm for Denmark is 0.57, 1.18 for
Finland, 1.86 for Norway and 0.85 for Sweden. If the assumption that δ = 10 percent is
approximately correct, this means that all four of the Scandinavian countries, with the exception
of Denmark, have average returns equal or above the cost of capital.
Bjuggren and Wiberg (2006) have found that qm is sensitive to stock market swings and that
depending on period selection the qm may either be over or underestimated. The choice of 5-6
year period therefore approximately coincides with the average length of a business cycle.
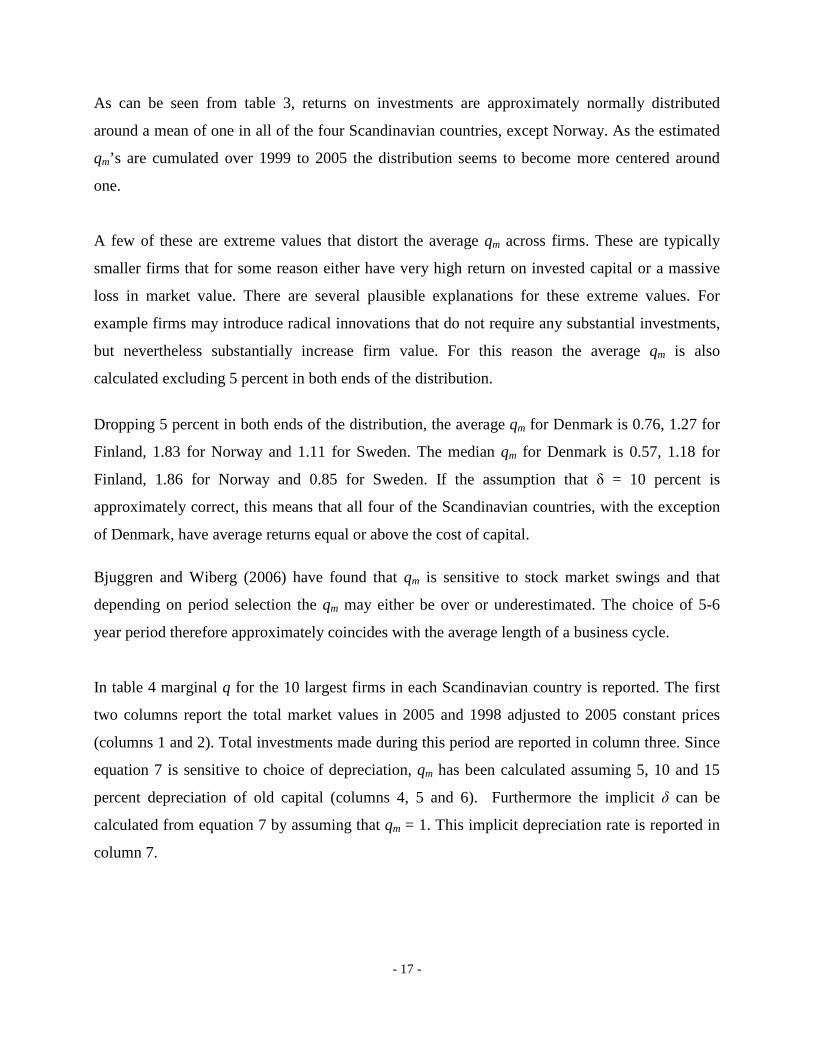
In table 4 marginal q for the 10 largest firms in each Scandinavian country is reported. The first
two columns report the total market values in 2005 and 1998 adjusted to 2005 constant prices
(columns 1 and 2). Total investments made during this period are reported in column three. Since
equation 7 is sensitive to choice of depreciation, qm has been calculated assuming 5, 10 and 15
percent depreciation of old capital (columns 4, 5 and 6). Furthermore the implicit δ can be
calculated from equation 7 by assuming that qm = 1. This implicit depreciation rate is reported in
column 7.
- 18 -
Table 4, 10 largest companies in the Scandinavian countries 2005 1 2 3 4 5 6 7 Company
M 2005a
M 1998
a ∑ INV a qm
(δ = 5%)b qm
(δ = 10%)b qm
(δ = 15%)b δc
Denmark A.P. MÖLLER – MAERSK 47702.9 7211.4 27433.4 1.668 1.860 2.052 - 0.124 TDC 13932.1 15676.0 12303.0 0.244 0.630 1.016 0.148 NOVO NORDISK 13124.1 8752.7 17150.9 0.481 0.706 0.932 0.048 CARLSBERG 6842.0 4706.6 19592.3 0.199 0.289 0.378 0.113 H. LUNDBECK 3904.8 2607.8d 5400.0 0.515 0.790 1.065 0.138 DANISCO 5105.6 3728.0 6866.8 0.395 0.590 0.784 0.205 WILLIAM DEMANT HOLDING 3165.8 962.1 2303.6 1.288 1.620 1.951 0.007 COLOPLAST 2486.8 1326.3 1998.2 0.869 1.157 1.444 0.073 COPENHAGEN AIRPORTS 2479.6 1441.4 811.0 1.870 2.460 3.049 - 0.024 DE SAMMENSLUTTENDE 2411.3 292.3 1215.6 1.972 2.201 2.430 - 0.162 Finland NOKIA 64861.2 68445.3 14966.5 0.619 1.293 1.966 0.078 STORA ENSO 15108.7 13268.3 3364.9 0.690 1.214 1.739 0.080 UPM-KYMMENE 13964.4 11361.0 1818.2 0.650 1.073 1.495 0.091 METSO 4061.7 1415.5 16770.9 0.429 0.537 0.644 0.315 SANOMA-WSOY 4050.2 789.6 658.2 2.072 2.517 2.963 - 0.070 M-REAL 3914.6 2933.6 16027.0 0.476 0.752 1.029 0.014 RAUTARUUKKI 3304.8 1953.9 1406.0 1.806 2.396 2.986 - 0.018 WARTSILA 2752.5 1662.5 1287.0 1.770 2.381 2.993 - 0.013 TIETOENATOR 2739.7 2298.9 2135.4 0.968 1.615 2.263 0.052 YIT CORP 2589.4 409.8 662.4 3.530 3.902 4.275 - 0.289 Norway NORSK HYDRO 24942.5 12014.9 19283.6 0.986 1.302 1.617 0.052 ORKLA 9539.4 5729.7 3582.9 1.698 2.332 2.967 - 0.005 NORSKE SKOGINDUSTRIER 5043.3 2355.1 1477.6 1.573 1.599 1.624 - 1.050 HAFSLUND 3135.1 1156.5 1823.6 1.448 1.811 2.174 - 0.012 FRED. OLSEN ENERGY 2152.9 641.2 610.7 3.019 3.563 4.107 - 0.136 SCHIBSTED 1900.9 1121.6 495.6 2.462 3.352 4.241 - 0.032 DNO 1867.4 46.8 474.2 3.971 4.104 4.236 - 1.071 TOMRA SYSTEMS 1056.9 1399.7 336.8 3.677 4.130 4.584 -0.245 FARSTAD SHIPPING 950.9 263.6 791.9 1.111 1.355 1.598 0.027 Sweden ERICSSON 49367.6 49661.1 62411.5 0.355 0.714 1.073 0.140 VOLVO 24244.6 18240.9 32494.6 0.376 0.568 0.760 0.213 H & M HENNES & MAURITZ 21244.0 15067.1 14736.6 0.825 1.232 1.638 0.071 ATLAS COPCO 12599.3 5329.9 11514.7 0.850 1.069 1.287 0.084 SCA 11652.2 7553.9 8847.4 0.860 1.257 1.654 0.068 SANDVIK 11038.2 5502.1 12743.4 0.648 0.862 1.076 0.132 SCANIA 9262.2 6128.1 11352.3 0.528 0.780 1.032 0.144 ELECTROLUX 7426.0 9994.2 22765.3 0.019 0.150 0.281 0.424 SECURITAS 6787.2 5421.3 7191.6 0.525 0.860 1.195 0.121 SKF 5940.4 2348.3 7975.8 0.591 0.731 0.872 0.196
a Million Euros, 2005 constant prices, b qm calculated assuming that δ is 5, 10 and 15 percent respectively, c Depreciation rate calculated given qm = 1, d market value 1999. A few firms in table 4 have implicit deprecation rates that are negative, which indicates that these
firms all had returns in excess of their cost of capital.
The dominant firm in Finland, Nokia, for example, has performed well over a long period and
consequently has a qm around or slightly above one. This can be compared to the Swedish
telecom firm Ericsson, one of Nokia’s main competitors. Ericsson seems to have a lover qm given
any depreciation rate, but remains approximately equal to one. It is plausible to assume that the
differences in returns can be attributed to different performance since Nokia and Ericson can be
- 19 -
assumed to have approximately the same depreciation rate. The dominant firm in Denmark,
Moller-Mearsk with its high marginal q appears to be underinvesting. Finally, the dominating
Norwegian firm Norsk Hydro seems to have a marginal q approximately equal to one.
Assuming that the marginal rate of return (qm) and the depreciation rate (δ) are the same across
companies and overtime these can be estimated by equation 9. Since the data is cross-sectional
time series, a panel fixed effect model is used as estimator (industry and time fixed effects
model). The stock market may fail to make a correct valuation in a single period, but assuming
efficient markets this error will approach zero as time span increases. To take the possibility for
market errors into account, time dummies were used in the estimations. Both industry and time
dummies are restricted to sum to zero, so that any effects measures the deviation from the
average depreciation rate. The results are reported in table 5.
In order to remove outliers some of the observations have been removed from the data set. The
absolute deviation between the dependent variable and the explanatory variable, (|(Mt – Mt-1)/M t-1
– It/M t-1|)12, has been used to identify outliers. Observations that had an absolute deviation above
two (41 observations) were removed. This captures for example firms that have large swings in
market value without corresponding changes in investments. The excluded firms are
predominantly found among relatively small hi-tech firms within the biotechnology and ICT
sector. Bjuggren and Wiberg (2006) have shown that marginal q measure is sensitive to swings in
valuation of new high-tech firms.
12 In practice this excludes observations that have missing observations, accounting errors et cetera. Observations that were excluded were only among the small firms in the sample.
- 20 -
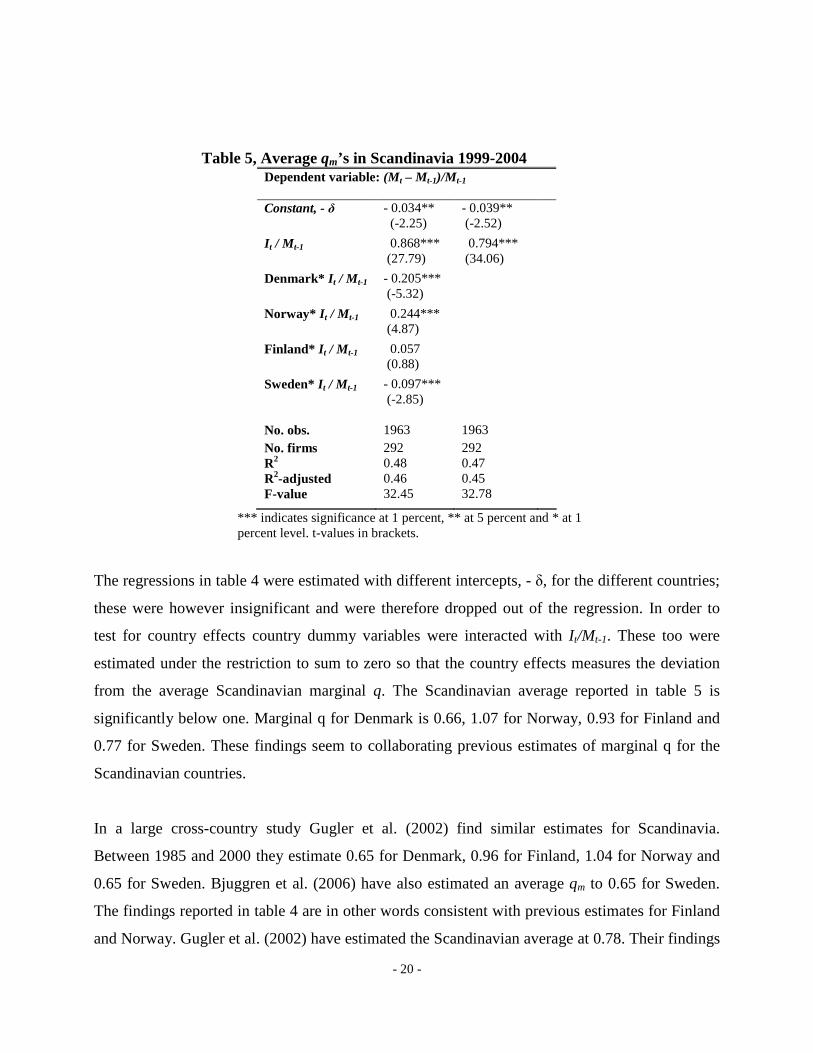
Table 5, Average qm’s in Scandinavia 1999-2004 Dependent variable: (M t – Mt-1)/M t-1 Constant, - δ
- 0.034** (-2.25)
- 0.039** (-2.52)
I t / Mt-1 0.868*** (27.79)
0.794*** (34.06)
Denmark* I t / Mt-1
- 0.205*** (-5.32)
Norway* I t / Mt-1
0.244*** (4.87)
Finland* I t / Mt-1 0.057 (0.88)
Sweden* I t / Mt-1 - 0.097*** (-2.85)
No. obs. 1963 1963 No. firms 292 292
R2 0.48 0.47 R2-adjusted 0.46 0.45 F-value 32.45 32.78
*** indicates significance at 1 percent, ** at 5 percent and * at 1 percent level. t-values in brackets.
The regressions in table 4 were estimated with different intercepts, - δ, for the different countries;
these were however insignificant and were therefore dropped out of the regression. In order to
test for country effects country dummy variables were interacted with It/Mt-1. These too were
estimated under the restriction to sum to zero so that the country effects measures the deviation
from the average Scandinavian marginal q. The Scandinavian average reported in table 5 is
significantly below one. Marginal q for Denmark is 0.66, 1.07 for Norway, 0.93 for Finland and
0.77 for Sweden. These findings seem to collaborating previous estimates of marginal q for the
Scandinavian countries.
In a large cross-country study Gugler et al. (2002) find similar estimates for Scandinavia.
Between 1985 and 2000 they estimate 0.65 for Denmark, 0.96 for Finland, 1.04 for Norway and
0.65 for Sweden. Bjuggren et al. (2006) have also estimated an average qm to 0.65 for Sweden.
The findings reported in table 4 are in other words consistent with previous estimates for Finland
and Norway. Gugler et al. (2002) have estimated the Scandinavian average at 0.78. Their findings
- 21 -
support the legal origin hypothesis. Anglo-Saxon countries perform best with qm = 1.02. Average
qm for Germanic and French origin is 0.74 and 0.59 respectively.
However there is considerable variation in the returns in all four Scandinavian countries, where a
large number of firms deviate from the average marginal return on investments. This can have
several causes, for example it might be plausible to believe there are industry differences. This is
supported by the variation of the implicit deprecation rates in table 4.
In the following section the relationship between ownership concentration, separation of cash-
flow rights and control rights, and performance are examined.
- 22 -
5. Corporate return and ownership structure
In this section equation 10 is used to test the effects of ownership concentration and separation of
control from cash-flow rights on performance. As measures of ownership concentration, the share
of capital (cash-flow rights) held by the largest owner (CR1) and the five largest (CR5) are used.
Control rights are measured by the share of votes (control rights) held by the largest (VR1) and
five largest owners (VR5). Dummies are used to control for dual-class shares. 49 percent of the
firms in the sample use a dual-class share structure. Matching accounting and market data with
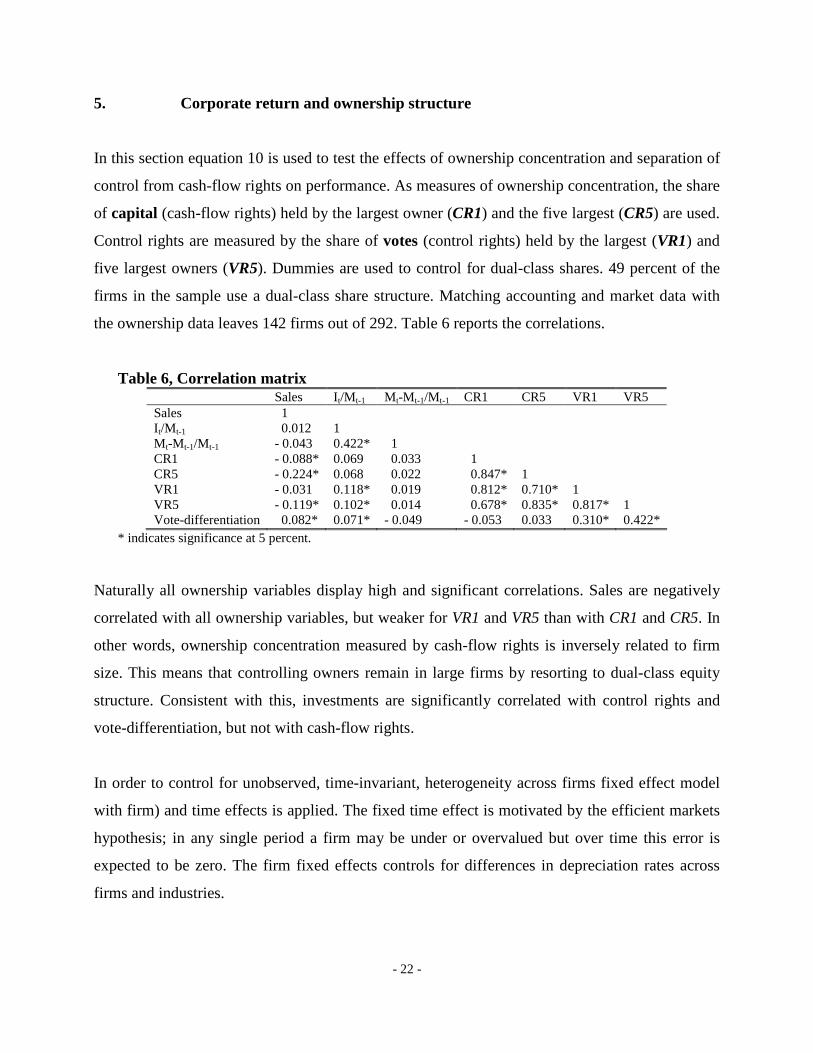
the ownership data leaves 142 firms out of 292. Table 6 reports the correlations.
Table 6, Correlation matrix Sales It/M t-1 Mt-M t-1/M t-1 CR1 CR5 VR1 VR5 Sales 1 I t/M t-1 0.012 1 M t-M t-1/M t-1 - 0.043 0.422* 1 CR1 - 0.088* 0.069 0.033 1 CR5 - 0.224* 0.068 0.022 0.847* 1 VR1 - 0.031 0.118* 0.019 0.812* 0.710* 1 VR5 - 0.119* 0.102* 0.014 0.678* 0.835* 0.817* 1 Vote-differentiation 0.082* 0.071* - 0.049 - 0.053 0.033 0.310* 0.422*
* indicates significance at 5 percent.
Naturally all ownership variables display high and significant correlations. Sales are negatively
correlated with all ownership variables, but weaker for VR1 and VR5 than with CR1 and CR5. In
other words, ownership concentration measured by cash-flow rights is inversely related to firm
size. This means that controlling owners remain in large firms by resorting to dual-class equity
structure. Consistent with this, investments are significantly correlated with control rights and
vote-differentiation, but not with cash-flow rights.
In order to control for unobserved, time-invariant, heterogeneity across firms fixed effect model
with firm) and time effects is applied. The fixed time effect is motivated by the efficient markets
hypothesis; in any single period a firm may be under or overvalued but over time this error is
expected to be zero. The firm fixed effects controls for differences in depreciation rates across
firms and industries.
- 23 -
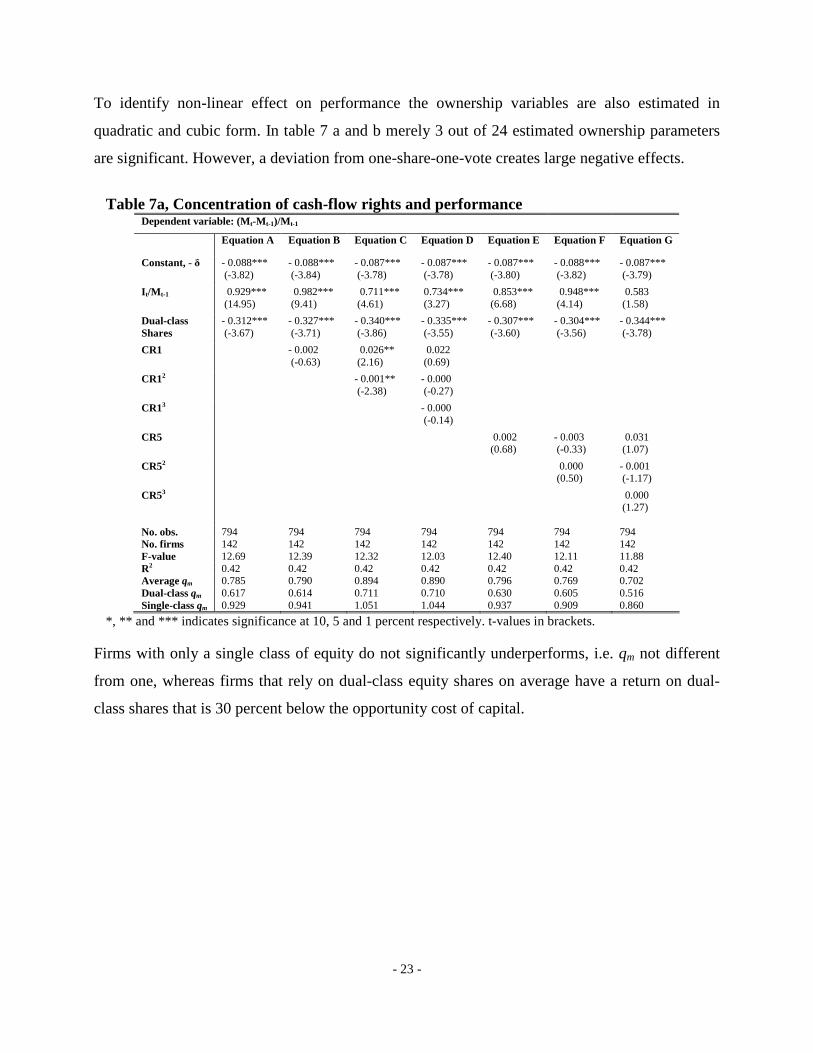
To identify non-linear effect on performance the ownership variables are also estimated in
quadratic and cubic form. In table 7 a and b merely 3 out of 24 estimated ownership parameters
are significant. However, a deviation from one-share-one-vote creates large negative effects.
Table 7a, Concentration of cash-flow rights and performance
Dependent variable: (Mt-M t-1)/M t-1
Equation A Equation B Equation C Equation D Equation E Equation F Equation G
Constant, - δ - 0.088*** (-3.82)
- 0.088*** (-3.84)
- 0.087*** (-3.78)
- 0.087*** (-3.78)
- 0.087*** (-3.80)
- 0.088*** (-3.82)
- 0.087*** (-3.79)
I t/M t-1 0.929*** (14.95)
0.982*** (9.41)
0.711*** (4.61)
0.734*** (3.27)
0.853*** (6.68)
0.948*** (4.14)
0.583 (1.58)
Dual-class Shares
- 0.312*** (-3.67)
- 0.327*** (-3.71)
- 0.340*** (-3.86)
- 0.335*** (-3.55)
- 0.307*** (-3.60)
- 0.304*** (-3.56)
- 0.344*** (-3.78)
CR1 - 0.002 (-0.63)
0.026** (2.16)
0.022 (0.69)
CR12 - 0.001** (-2.38)
- 0.000 (-0.27)
CR13 - 0.000 (-0.14)
CR5 0.002 (0.68)
- 0.003 (-0.33)
0.031 (1.07)
CR52 0.000 (0.50)
- 0.001 (-1.17)
CR53 0.000 (1.27)
No. obs. 794 794 794 794 794 794 794 No. firms 142 142 142 142 142 142 142 F-value 12.69 12.39 12.32 12.03 12.40 12.11 11.88 R2 0.42 0.42 0.42 0.42 0.42 0.42 0.42 Average qm 0.785 0.790 0.894 0.890 0.796 0.769 0.702 Dual-class qm 0.617 0.614 0.711 0.710 0.630 0.605 0.516 Single-class qm 0.929 0.941 1.051 1.044 0.937 0.909 0.860
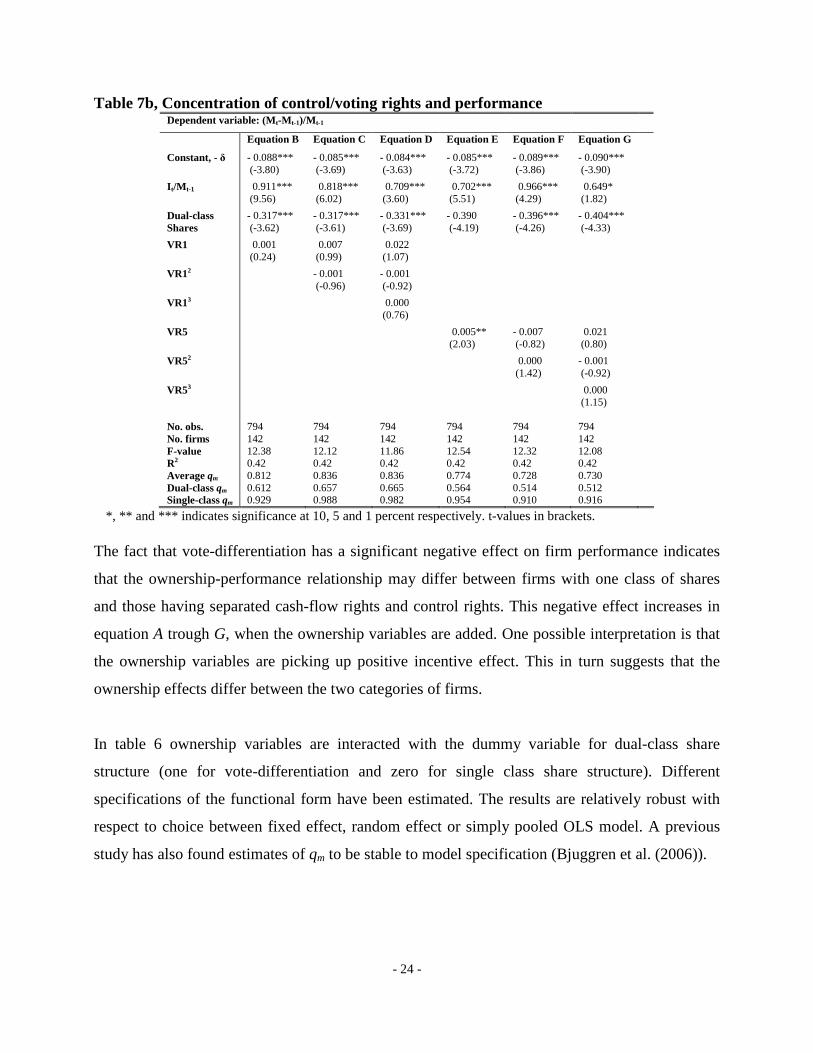
*, ** and *** indicates significance at 10, 5 and 1 percent respectively. t-values in brackets. Firms with only a single class of equity do not significantly underperforms, i.e. qm not different
from one, whereas firms that rely on dual-class equity shares on average have a return on dual-
class shares that is 30 percent below the opportunity cost of capital.
- 24 -
Table 7b, Concentration of control/voting rights and performance Dependent variable: (Mt-M t-1)/M t-1
Equation B Equation C Equation D Equation E Equation F Equation G
Constant, - δ - 0.088*** (-3.80)
- 0.085*** (-3.69)
- 0.084*** (-3.63)
- 0.085*** (-3.72)
- 0.089*** (-3.86)
- 0.090*** (-3.90)
I t/M t-1 0.911*** (9.56)
0.818*** (6.02)
0.709*** (3.60)
0.702*** (5.51)
0.966*** (4.29)
0.649* (1.82)
Dual-class Shares
- 0.317*** (-3.62)
- 0.317*** (-3.61)
- 0.331*** (-3.69)
- 0.390 (-4.19)
- 0.396*** (-4.26)
- 0.404*** (-4.33)
VR1 0.001 (0.24)
0.007 (0.99)
0.022 (1.07)
VR12 - 0.001 (-0.96)
- 0.001 (-0.92)
VR13 0.000 (0.76)
VR5 0.005** (2.03)
- 0.007 (-0.82)
0.021 (0.80)
VR52 0.000 (1.42)
- 0.001 (-0.92)
VR53 0.000 (1.15)
No. obs. 794 794 794 794 794 794 No. firms 142 142 142 142 142 142 F-value 12.38 12.12 11.86 12.54 12.32 12.08 R2 0.42 0.42 0.42 0.42 0.42 0.42 Average qm 0.812 0.836 0.836 0.774 0.728 0.730 Dual-class qm 0.612 0.657 0.665 0.564 0.514 0.512 Single-class qm 0.929 0.988 0.982 0.954 0.910 0.916
*, ** and *** indicates significance at 10, 5 and 1 percent respectively. t-values in brackets. The fact that vote-differentiation has a significant negative effect on firm performance indicates
that the ownership-performance relationship may differ between firms with one class of shares
and those having separated cash-flow rights and control rights. This negative effect increases in
equation A trough G, when the ownership variables are added. One possible interpretation is that
the ownership variables are picking up positive incentive effect. This in turn suggests that the
ownership effects differ between the two categories of firms.
In table 6 ownership variables are interacted with the dummy variable for dual-class share
structure (one for vote-differentiation and zero for single class share structure). Different
specifications of the functional form have been estimated. The results are relatively robust with
respect to choice between fixed effect, random effect or simply pooled OLS model. A previous
study has also found estimates of qm to be stable to model specification (Bjuggren et al. (2006)).
- 25 -
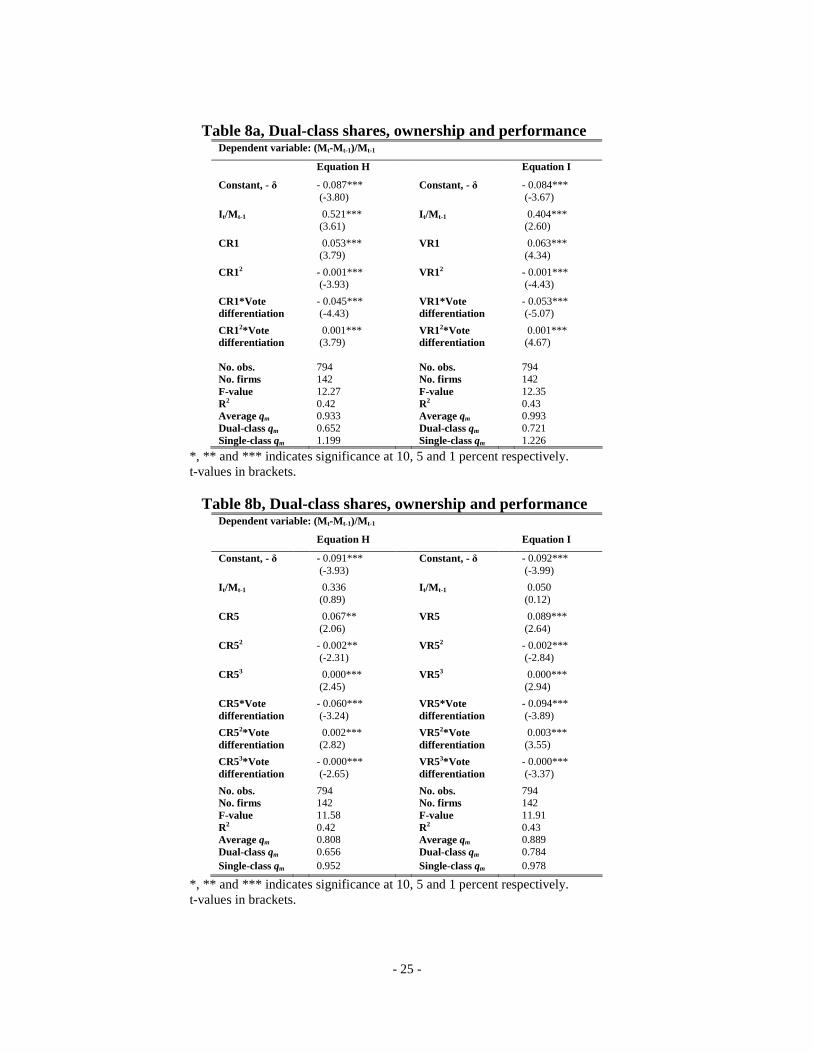
Table 8a, Dual-class shares, ownership and performance Dependent variable: (Mt-M t-1)/M t-1
Equation H Equation I
Constant, - δ - 0.087*** (-3.80)
Constant, - δ - 0.084*** (-3.67)
I t/M t-1 0.521*** (3.61)
I t/M t-1 0.404*** (2.60)
CR1 0.053*** (3.79)
VR1 0.063*** (4.34)
CR12 - 0.001*** (-3.93)
VR12 - 0.001*** (-4.43)
CR1*Vote differentiation
- 0.045*** (-4.43)
VR1*Vote differentiation
- 0.053*** (-5.07)
CR12*Vote differentiation
0.001*** (3.79)
VR12*Vote differentiation
0.001*** (4.67)
No. obs. 794 No. obs. 794 No. firms 142 No. firms 142 F-value 12.27 F-value 12.35 R2 0.42 R2 0.43 Average qm 0.933 Average qm 0.993 Dual-class qm 0.652 Dual-class qm 0.721 Single-class qm 1.199 Single-class qm 1.226
*, ** and *** indicates significance at 10, 5 and 1 percent respectively. t-values in brackets.
Table 8b, Dual-class shares, ownership and performance
Dependent variable: (Mt-M t-1)/M t-1
Equation H Equation I
Constant, - δ - 0.091*** (-3.93)
Constant, - δ - 0.092*** (-3.99)
I t/M t-1 0.336 (0.89)
I t/M t-1 0.050 (0.12)
CR5 0.067** (2.06)
VR5 0.089*** (2.64)
CR52 - 0.002** (-2.31)
VR52 - 0.002*** (-2.84)
CR53 0.000*** (2.45)
VR53 0.000*** (2.94)
CR5*Vote differentiation
- 0.060*** (-3.24)
VR5*Vote differentiation
- 0.094*** (-3.89)
CR52*Vote differentiation
0.002*** (2.82)
VR52*Vote differentiation
0.003*** (3.55)
CR53*Vote differentiation
- 0.000*** (-2.65)
VR53*Vote differentiation
- 0.000*** (-3.37)
No. obs. 794 No. obs. 794 No. firms 142 No. firms 142 F-value 11.58 F-value 11.91 R2 0.42 R2 0.43 Average qm 0.808 Average qm 0.889 Dual-class qm 0.656 Dual-class qm 0.784 Single-class qm 0.952 Single-class qm 0.978
*, ** and *** indicates significance at 10, 5 and 1 percent respectively. t-values in brackets.
- 26 -
The results are robust with respect to the choice between simple pooled OLS with year dummies,
fixed effect model with year and firm effects and random effects model. The estimates are robust
with respect to model specification. Since the number of firms with available ownership data is
limited to 143, the firm effects affectively captures any industry effects. Consequently, all
equation shave been estimated with two digit industry SIC codes.
The stock market may in any single period be under- or overestimated, but for a longer period of
time the expected error in stock market evaluations is zero, E(µt) = 0. To control for this
possibility annual dummy variables are included and estimated under the restriction that they
summarize to zero. Annual deviations in stock market evaluations are therefore measured as
deviations from the average. To control for the possibility that the Scandinavian countries have
systematic differences in returns, country dummies are also included. These are also estimated
under the restriction that they summarize to zero, so that any deviation is measured as the
deviation from the Scandinavian average. Time, industry and country effect are not reported.
Hypothesis 1 and 2 (H1 and H2) can not be rejected. For all measures of ownership concentration
(CR1, CR5, VR1 and VR5) a positive non-linear relationship is found. In firms with one-share-
one-vote increasing ownership has a positive but marginally diminishing effect on performance.
For the two concentration measure of the single largest owner, CR1 and VR1, a quadratic form
gives the best fit, whereas for the concentration of the five largest owners, CR5 and VR5, a cubic
form provides the best fit.
The average qm for single class equity firms lie between 0.95 and 1.2313. In firms with vote-
differentiated shares the effects are similar but much weaker. By comparing the parameters in
equations H and I in table 8 a and b one can see that in vote-differentiated firms the positive
effect of ownership concentration is significantly lower compared to other firms. Average qm’s
estimate for firms with dual-share class structure lie between 0.65 and 0.78 (equation H and I
respectively). As in equation A, firms with dual-class shares seem to be investing at
approximately 30 percent below their cost of capital. From equation H and I in table 8 a and b it
13 The marginal effects have been calculated based on the average ownership concentration in the data set. (CR1 = 22.24, CR5 = 44.52, VR1 = 28.58 and VR5 = 52.85).
- 27 -
is clear that the separation cash-flow and control rights reduces the positive effect of ownership
and enhance the entrenchment effect. Examining listed firms in Sweden, Bjuggren et al. (2006)
find similar negative effect of vote-differentiation and positive effect of ownership concentration
on investment performance of firms.
Controlling for ownership characteristics and dual-class equity weakens the country effects (not
reported here), but remains significantly negative for Sweden and positive for Norway. However
the effects of ownership and deviations from one-share-one-vote cut across national boundaries.
The intercept will as, discussed in section 2, capture both the depreciation rate and any systematic
changes in market evaluations. In equation A to I the intercept is estimated to approximately 9
percent. This is a reasonable estimate and is in line with previous estimates of depreciation rates.
Furthermore, the intercept dose not affect the marginal effect, thus not of any importance for the
interpretation of the results.
- 28 -
6. Conclusions
This paper examines the linkage between corporate investments, returns and ownership structure
in the Scandinavian countries. Marginal q is used as performance measure. Marginal q measures
the marginal return on capital relative its cost of capital. This return to cost of capital ratio (r/i =
qm) is a measure of what Tobin (1982) labeled the functional efficiency of capital markets. When
studying firm performance this method has some clear advantages over the conventional market
to book measures of Tobin’s average q.
Few Scandinavian firms can be characterized as having dispersed ownership as described by
Berle and Means (1932). Vote-differentiation is a common tool for creating and maintaining
strong and concentrated ownership structures. Scandinavian firms make more frequent use of
control mechanisms than firms in comparable countries. On average the largest owner holds more
than 20 percent of the capital (CR1) and close to 30 percent of the vote rights (VR1).
The hypothesis that ownership concentration improves resource allocation by reducing agency
problems is supported in this paper. The effect of ownership on investment performance is
however found to be non-liner; cubic or quadratic form. This is consistent with the entrenchment
hypothesis. Strong support of the hypothesis that control mechanisms are detrimental to firm
performance is found.
Ownership concentration is found to have a non-linear effect on firm performance. This is
consistent with previous studies that both find positive incentive effects and negative
entrenchment effect of ownership concentration. For firms with one-share-one-vote ownership
has a positive impact but marginally diminishing, whereas for firms controlled by dual-class
shares this effect is weaker, and have a systematically worse performance. Firms with vote-
differentiated shares are found to have a systematically worse performance as compared to firms
with one single class of shares. Dual-class shares drive a wedge between cash-flow rights and
control rights. Not only does this change the control structure, but it also changes the incentive
structure. Firms with only one equity class are on average investing efficiently, whereas firm with
dual-class equity structure are over investing. The separation of cash-flow rights and control
- 29 -
rights reduces the positive incentive effect and enhances the negative entrenchment effect. By
impairing capital reallocation corporate control mechanisms are in the long run going to be
harmful for industry dynamics and economic renewal.
Vote-differentiation creates massive entrenchment effects and destroys large values that in the
long-run are likely to be detrimental to the functional efficiency of the Scandinavian capital
markets. On average these firms have returns on investments that are approximately 30 percent
below their cost of capital.
Differences in investment performance across firms can largely be explained by differences in
ownership structure and in particular to what extent corporate control is upheld by dual-class
equity structure. Separation of cash-flow rights from control appears to distort the incentives of
the controlling owner by significantly reducing the incentive effect. These results appear to be
inconsistent with the legal origin hypothesis.
- 30 -
References Baumol, W. J., Heim, P., Malkiel, B. G. & Quandt, R. E., (1970), “Earnings Retention, New Capital and the Growth of the Firm,” Review of Economics and Statistics, 345-355. Bebchuk, L., Kraakman, R. & Triantis, G., (1999), Stock Pyramids, Cross-Ownership, and Dual-Class Equity: The Creation and Agency Costs of Separating Control from Cash Flow Rights. NBER Working Paper, No. 6951. Bennedsen M. B., & Nielsen, K. M., (2005), “The principle of Proportionality: Separating the Impact of Dual Class Shares, Pyramids and Cross-ownership on Firm Value Across Legal Regimes in Western Europe,” Center for Industrial Economics Discussion papers, University of Copenhagen. Berle, A. A. & Means, G., (1932), The Modern Corporation and Private Property, The Macmillan Company, New York. Bergström, C. & Rydqvist, K., (1990), “Ownership of equity in dual-class firms,” Journal of Fiancial Economics, 14, 255-269. Bjuggren, P-O., Eklund, J., E., & Wiberg, D., K., (2007), “Ownership Structure, Control and Firm Performance: the Effects of Vote Differentiated Shares.” Forthcoming: Applied Financial Economics. Bjuggren, P-O. & Wiberg, D., (2006), “Industry Specific Effects in Investment Performace and Valuation of Firms; Marginal q in a Stock Market Bubble,” Forthcoming: Empirica. Bøhren, Ø, & Ødegaard, A. B., (2005), “Governance and performance revisited,” Forthcoming in: Gregouriu, G., & Ali, P., (ed), International Corporate Goverance after Sarbanes-Oxley, Wiley. Carsten, G., (1993), “Europäische Integration und Nordische Zusammenarbeit auf dem Gebiet des Zivilrechts,“ Zeitschrift für Europäisches Privatrecht, 335. Cho, M-H., (1998), “Ownership Structure, Investments, and the Corporate Value: An Empitical Analysis”, Journal of Financial Economics, vol. 47, no.1, 103-121. Demsetz, H., (1983), “The Structure of Ownership and the Theory of the Firm”, Journal of Law and Economics, vol. 26, no. 2, 375-390. Demsetz, H. & Lehn, K., (1985), “The Structure of Corporate Ownership: Causes and Consequences,” Journal of Political Economy, vol. 93, no. 6, 1155-1177. Demsetz, H. & Villalonga, B., (2001), “Ownership Structure and Corporate Performance,” Journal of Corporate Finance, 7, 209-233.
- 31 -
Denis, D. K. & McConnell, (2003), “International Corporate Governance,” Journal of Financial and Quantitative Analysis, vol. 38, no. 1, 1-36. Faccio, M. & Land L.H.P., (2002), “The ultimate ownership of Western European corporations,” Journal of Financial Economics, 65, 365-395. Gugler, K., & Yurtoglu, B. B, (2003), “Average q, marginal q, and the relation between ownership and performance.” Economics Letters, 78, 379-384. Gugler, K., Mueller, D. C. & Yurtoglu, B. B., (2002), ”Corporate Goverance, Capital Market Discipline and Return on Investments,” miemo Universty of Vienna. Hayashi, F., (1982), “Tobin’s Marginal q and Average q: A Neoclassical Interpretation,” Econometrica, vol. 50, no. 1, 213-224. Henrekson, M. & Jakobsson, U., (2006), Den svenska modellen för företagsägande och företagskontroll vid skiljevägen, Institutet för näringslivsforskning, Policy Paper No. 1, Stockholm. Högfeldt, P., (2004), The History of Politics of Corporate Ownership in Sweden, NBER Working Paper No. 10641. Jensen, J. & Meckling, W., (1976), “Theory of the firm; managerial behavior, agency costs and ownership structure,” Journal of Financial Economics, no. 3 305-360. La Porta, R., Lopez-de-Silanes, F. & Shleifer, A., (1999), ”Corporate Ownership around the World,” Journal of Finance, vol. 54, no. 2, 471-517. La Porta, R., Lopez-de-Silanes, F., Shleifer, A. & Vishny, R. W., (1998), ”Law and Finance,” Journal of Political Economy, vol. 106, no. 6, 1113-1155. La Porta, R., Lopez-de-Silanes, F., Schleifer, A. & Vishny, R. W., (1997), ”Legal Determinats of External Finance,” Journal of Finance, vol. 52, no. 3, 1131-1150. Manne, H., (1965), “Mergers and the Market for Corporate Control,” Journal of Political Economy, 75:110-26. Marris, R., (1964), The Economic Theory of Managerial Capitalism, New York: Free Press. Morck, R., Schleifer, A. & Vishny, R., (1988), Management Ownership and Market Valuation: An Empirical Analysis,” Journal of Financial Economics, 20, 293-315. Morck, R., Wolfenzon, D. and Yeung, B., (2005), “Corporate Governance, Economic, Entrenchment, and Growth,” Journal of Economic Literature, 43:655-720. Mueller, D. C., (2003), The Corporation; Investments, mergers and growth, Routledge.
- 32 -
Mueller, D. C. & Reardon, E. A., (1993), “Rates of Return on Corporate Investment,” Southern Economic Journal, vol. 60, no. 2, 430-453. Roe, M. J., (2003), Political Determinants of Corporate Governance, Oxford University Press, Oxford. Shleifer, A. & Vishny, R. W., (1997), “A Survey of Corporate Governance,” Journal of Finance, vol. 52, no. 2, 737-783. Smith, A., (1776), An Inquiry into the Nature and Causes of the Wealth of Nations. Modern Library (2000), New York. Söderström, H. T., (eds.) Berglöf, E., Holmström B., Högfeldt, P., & Mayersson Milgrom, E. M., (2003), Ägarmakt och omvandling - Den svenska modellen utmanad, Ekonomirådets rapport 2003, SNS, Stockholm. Tobin, J., (1982), “On the Efficiency of Financial Systems,” Lloyd’s Banking Review. 153, 1-15. Veblen, T., (1921), The Engineers and the Price System, New York, Viking.
- 33 -
Appendix 1 Marginal q Figure 1 Marginal rate of return on capital, mrr, cost of capital, i, and marginal q
Figure 2 Marginal q
I t qm* = 1
mrr, i
mrr
i
qm > 1 > qm* qm < 1 < qm*
∆M t
I t
0
-δ
qm
1
- 34 -
Appendix 2 Ownership structure Denmark
All firms Mean Std. div. Min Max No. firms CR 1 23.9 14.4 1.0 51.7 10 CR 3 35.4 16.6 3.0 52.1 10 CR 5 37.4 17.6 5 60.0 10 VR 1 n.a. n.a. n.a. n.a. 10 VR 3 n.a. n.a. n.a. n.a. 10 VR 5 n.a. n.a. n.a. n.a. 10 Vote-differentiated firms Mean Std. div. Min Max No. firms CR 1 n.a. n.a. n.a. n.a. 2 CR 3 n.a. n.a. n.a. n.a. 2 CR 5 n.a. n.a. n.a. n.a. 2 VR 1 n.a. n.a. n.a. n.a. 2 VR 3 n.a. n.a. n.a. n.a. 2 VR 5 n.a. n.a. n.a. n.a. 2 Firms with one-share-one-vote Mean Std. div. Min Max No. firms CR 1 n.a. n.a. n.a. n.a. 8 CR 3 n.a. n.a. n.a. n.a. 8 CR 5 n.a. n.a. n.a. n.a. 8 VR 1 n.a. n.a. n.a. n.a. 8 VR 3 n.a. n.a. n.a. n.a. 8 VR 5 n.a. n.a. n.a. n.a. 8
Finland
All firms Mean Std. div. Min Max No. firms CR 1 20.3 15.6 0.4 62.2 55 CR 3 31.7 17.6 1.1 72.5 55 CR 5 37.1 18.1 1.5 79.1 55 VR 1 23.8 19.3 0.4 84.1 55 VR 3 37.1 22.5 1.1 87.9 55 VR 5 43.0 22.9 1.5 89.8 55 Vote-differentiated firms Mean Std. div. Min Max No. firms CR 1 20.4 12.1 2.93 38.6 14 CR 3 33.4 14.3 6.4 53.9 14 CR 5 39.3 14.5 9.4 57.5 14 VR 1 34.2 22.9 4.6 84.1 14 VR 3 54.6 24.1 12.1 87.9 14 VR 5 62.2 22.4 18.6 89.8 14 Firms with one-share-one-vote Mean Std. div. Min Max No. firms CR 1 20.3 16.7 0.4 62.2 41 CR 3 31.1 18.7 1.1 72.5 41 CR 5 36.4 19.3 1.5 79.1 41 VR 1 20.3 16.7 0.4 62.2 41 VR 3 31.1 18.7 1.1 72.5 41 VR 5 36.4 19.3 1.5 79.1 41
’
- 35 -
Norway All firms Mean Std. div. Min Max No. firms CR 1 28.6 16.6 7.2 68.9 40 CR 3 48.3 22.0 17.4 93.8 40 CR 5 56.0 21.4 22.7 95.1 40 VR 1 29.0 16.7 7.2 68.9 40 VR 3 48.9 22.5 17.4 93.8 40 VR 5 56.5 21.8 22.7 96.5 40 Vote-differentiated firms Mean Std. div. Min Max No. firms CR 1 30.4 10.7 15.3 40.0 4 CR 3 66.0 24.0 34.1 87.8 4 CR 5 74.7 22.6 44.8 93.8 4 VR 1 34.1 10.9 18.5 43.1 4 VR 3 72.0 22.4 42.2 91.3 4 VR 5 80.0 20.9 52.3 96.5 4 Firms with one-share-one-vote Mean Std. div. Min Max No. firms CR 1 28.4 17.3 7.2 68.9 36 CR 3 46.3 21.2 17.4 93.8 36 CR 5 53.9 20.5 22.7 95.1 36 VR 1 28.4 17.3 7.2 68.9 36 VR 3 46.3 21.2 17.4 93.8 36 VR 5 53.9 20.5 22.7 95.1 36
Sweden
All firms Mean Std. div. Min Max No. firms CR 1 22.9 14.9 4.2 82.4 110 CR 3 37.7 17.9 9.8 90.0 110 CR 5 44.9 18.2 13.4 93.8 110 VR 1 32.5 20.7 4.2 89.3 109 VR 3 49.2 22.3 10.2 93.7 109 VR 5 55.8 21.6 14.0 95.3 109 Vote-differentiated firms Mean Std. div. Min Max No. firms CR 1 24.1 14.3 5.2 60.4 70 CR 3 40.0 18.4 9.8 80.3 70 CR 5 47.4 18.6 13.4 86.6 70 VR 1 39.2 20.4 9.5 89.3 68 VR 3 58.3 20.3 18.4 93.7 68 VR 5 64.5 19.3 20.7 95.3 68 Firms with one-share-one-vote Mean Std. div. Min Max No. firms CR 1 20.7 16.0 4.2 82.4 40 CR 3 33.6 16.5 10.2 90.0 40 CR 5 40.7 17.0 14.0 93.8 40 VR 1 20.7 16.0 4.2 82.4 40 VR 3 33.6 16.5 10.2 90.0 40 VR 5 40.7 17.0 14.0 93.8 40